final entries
TRANSCRIPT
[1]
INTRODUCTION
The buying process is a combination of mental and physical activities that
ends with an actual purchase almost daily. Thus it is interesting to study the
connection within “what we buy” and “why we buy it”.
In this scenario, brands play a leading role in customer decision
making.
In present days, brands not only represent the name or the symbol of the
company that produce products (or provide services). Nowadays consumers are so
genuinely connected to brands that when they purchase any product (or utilize any
service), brands so often influence their final choice.
As the connection within brand and consumer behavior seems very
interesting and appealing, the purpose of this project is to create deeper
consideration of “what brand is”, as a concept, and “what brand does”, as a
factor, in buyers ‟ decision making process”.
The above study shows the consumers brand decision towards ADIDAS for
buying Sports Shoes. This is because of the trust, loyalty and brand equity created
by the firm among the consumer.
The Adidas Firm has formed an icon in the category of Sports Shoes and
among the Sports person as well as among the general public. The variety of
sports class shoes from the house of Adidas has generated a passion among the
sports person to prefer it and wear it.
Not only the brand plays important role in preferring Adidas shoes, the
comfort feel while wearing it and reliability provided by the firm tends to buy
Adidas shoes which is the important key factor of brand decision
[2]
INDUSTRY PROFILE
Indian leather industry is the core strength of the Indian footwear industry. It is the
engine of growth for the entire Indian leather industry and India is the second
largest global producer of footwear after China.
Reputed global brands like Florsheim, Nunn Bush, Stacy Adams, Gabor,
Clarks, Adidas, Nike, Reebok, Ecco, Deichmann, Elefanten, St Michaels, Hasley,
Salamander and Colehaan are manufactured under license in India. Besides, many
global retail chains seeking quality products at competitive prices are actively
sourcing footwear from India.
While leather shoes and uppers are produced in medium to large-scale
units, the sandals and chappals are produced in the household and cottage sector.
The industry is poised for adopting the modern and state-of-the-art technology to
suit the exacting international requirements and standards. India produces more of
gent’s footwear while the world’s major production is in ladies footwear. In the
case of chapels and sandals, use of non-leather material is prevalent in the
domestic market.
Leather footwear exported from India are dress shoes, casuals, moccasins,
sport shoes, horrachies, sandals, ballerinas, boots. Non-leather footwear exported
from India are Shoes, Sandals and Chappals made of rubber, plastic, P.V.C. and
other materials.
With changing lifestyles and increasing affluence, domestic demand for
footwear is projected to grow at a faster rate than has been seen. There are already
many new domestic brands of footwear and many foreign brands such as Nike,
Adidas, Puma, Reebok, Florsheim, Rockport, etc. have also been able to enter the
market.
[3]
The footwear sector has matured from the level of manual footwear
manufacturing methods to automated footwear manufacturing systems. Many
units are equipped with In-house Design Studios incorporating state-of-the-art
CAD systems having 3D Shoe Design packages that are intuitive and easy to use.
Many Indian footwear factories have also acquired the ISO 9000, ISO 14000 as
well as the SA 8000 certifications. Excellent facilities for Physical and Chemical
testing exist with the laboratories having tie-ups with leading international
agencies like SATRA, UK and PFI, Germany.
One of the major factors for success in niche international fashion markets
is the ability to cater them with the latest designs, and in accordance with the latest
trends. India, has gained international prominence in the area of Colours &
Leather Texture forecasting through its outstanding success in MODEUROP.
Design and Retail information is regularly made available to footwear
manufacturers to help them suitably address the season's requirement.
The Indian Footwear Industry is gearing up to leverage its strengths
towards maximizing benefits.
Strength of India in the footwear sector originates from its command on
reliable supply of resources in the form of raw hides and skins, quality finished
leather, large installed capacities for production of finished leather & footwear,
large human capital with expertise and technology base, skilled manpower and
relatively low cost labor, proven strength to produce footwear for global brand
leaders and acquired technology competence, particularly for mid and high priced
footwear segments. Resource strength of India in the form of materials and skilled
manpower is a comparative advantage for the country.
The export targets from 2007-08 to 2010-11 as tabulated below reflects the
fact that footwear sector is the most significant segment of the Leather Industry in
India.
[4]
India has emerged in recent years as a relatively sophisticated low to
medium cost supplier to world markets –The leather industry in India has been
targeted by the Central Government as an engine for economic growth.
Progressively, the Government has prodded and legislated a reluctant industry to
modernise. India was noted as a supplier of rawhides and skins semi processed
leather and some shoes.
In the 1970’s, the Government initially banned the export of raw hides and
skins, followed this by limiting, then stopping the export of semi processed leather
and encouraging local tanneries to manufacture finished leather themselves.
Despite protestations from the industrialists, this has resulted in a marked
improvement in the shoe manufacturing industry. India is now a major supplier of
leather footwear to world markets and has the potential to rival China in the future
(60% of Chinese exports are synthetic shoes).
India is often referred to as the sleeping giant in footwear terms. It has an
installed capacity of 1,800 million pairs, second only to China. The bulk of
production is in men’s leather shoes and leather uppers for both men and ladies. It
has over 100 fully mechanised, modern shoe making plants, as good as anywhere
in the world (including Europe). It makes for some upmarket brands including
Florsheim (US), Lloyd (Germany), Clarks (UK), Marks and Spencer (UK).
India has had mixed fortunes in its recent export performance. In 2000,
exports of shoes were US$ 651 million, in 2001 these increased to 663 million but
declined in 2002 to 623 million dollars (See Statistics). The main markets for
Indian leather shoes are UK and USA, which between them take about 55% of
total exports.
[5]
India has not yet reached its full potential in terms of a world supplier. This
is due mainly to local cow leather that although plentiful, has a maximum
thickness of 1.4
– 1.6mm, and the socio / political / infrastructure of the country. However,
India is an excellent supplier of leather uppers. Importation of uppers from India
does not infringe FTA with Europe or the USA. The potential is set to change
albeit slowly, but with a population rivalling China for size, there is no doubt the
tussle for world domination in footwear supply is between these two countries.
Few Interesting Facts:
- The Indian footwear retail market is expected to grow at a CAGR of over
20% for the period spanning from 2008 to 2011.
- Footwear is expected to comprise about 60% of the total leather exports
by 2011 from over 38% in 2006-07.
- Presently, the Indian footwear market is dominated by Men's footwear
market that accounts for nearly 58% of the total Indian footwear retail market.
- By products, the Indian footwear market is dominated by casual footwear
market that makes up for nearly two-third of the total footwear retail market.
- As footwear retailing in India remain focused on men's shoes, there exists
a plethora of opportunities in the exclusive ladies' and kids' footwear segment with
no organized retailing chain having a national presence in either of these
categories.
- The Indian footwear market scores over other footwear markets as it gives
benefits like low cost of production, abundant raw material, and has huge
consumption market.
[6]
- The footwear component industry also has enormous opportunity for
growth to cater to increasing production of footwear of various types, both for
export and domestic market.
In a Nutshell:
There are nearly 4000 units engaged in manufacturing footwear in India.
The industry is dominated by small scale units with the total production of 55%.
The total turnover of the footwear industry including leather and non-leather
footwear is estimated at Rs.8500-9500 crore (Euro 551.3-1723.1 Million)
including Rs.1200-1400 crore (Euro 217.6-253.9 Million) in the household
segment.
India's share in global leather footwear imports is around 1.4% Major
Competitors in the export market for leather footwear are China (14%), Spain
(6%) and Italy (21%).
The footwear industry exist both in the traditional and modern sector.
While the traditional sector is spread throughout the country with pockets of
concentration catering largely to the domestic market, the modern sector is largely
confined to select centers like Chennai, Ambur, Ranipet, Agra, Kanpur and Delhi
with most of their production for export.
Assembly line production is organized, and about 90% of the workforces in
the mechanized sector in South India consist of women. In fact, this sector has
opened up plenty of employment opportunities for women who have no previous
experience. They are trained to perform a particular function in the factory itself.
[7]
PRODUCTION PROCESS OF SPORTS SHOES
RAW MATERIALS OF THE SPORTS SHOES
Synthetic Materials:
Combinations of synthetic materials in a shoe allow for breathing room and
cushion the foot. Plastic materials such as Ethylene Vinyl Acetate (EVA), liquid
silicone or polyurethane foam give runners and athlete’s flexible stability in the
soles of exercise shoes. A nylon mesh material creates the upper and lining
structures of shoes. Rubber and polymer material designs can be made to look like
leather and can provide waterproof protection.
Cloth:
Cloth products such as canvas, satin and fleece effectively serve as products
to make house shoes, specialty occasion footwear and baby slippers. A fleece
lining traps body heat, keeping feet warm. Thin fabrics like cotton or satin
decorate shoes but do not typically provide enough protection from outdoor
elements when used alone. Canvas can function as a lining material or as an outer
material for the upper structure of shoes.
[8]
COMPANY PROFILE
The Adidas group at a glance:
A name that stands for competence in all sectors of sport around the globe.
The vision of company founder Adolf Dasseler has long become reality and his
corporate philosophy the guiding principle for successor generations.
The idea was as simple as it was brilliant. Adi Dasseler’s aim was to
provide every athlete with the best possible equipment. It all began in 1920, when
Adi Dasseler made his first shoes using the few materials available after the First
World War.
Today the Adidas product range extends from shoes, apparel and
accessories for basketball, soccer, fitness and training to adventure, trail and golf.
The Adidas name dates back to 1948, deriving from the first two syllables
of Adi dasseler’s first and last name. one year later, Adi Dasseler registered the
Three Stripes as a trademark. After a period spanning almost 70 years, the dasseler
family withdrew from the company in 1989, and the enterprise was transformed
into a corporation.
French-born Robert Louis-Dreyfus was Chairman of the Executive Board
from April 1993 to March 2001. It was he initiated Adidas flotation on the stock
market in November 1995. Since 2001, Herbert Hainer has been leading the
group.
Adidas Group:
In 1997, Adidas acquired the Salomon group, and the company’s name
changed to Adidas-Salomon AG. The Salomon group also included the
Taylor Made golf brand.

[9]
In October 2005, the Salomon business segment, including the related
subsidiaries and brands Salomon, Mavic, Bonfire, Arc’Teryx and Cliché’,
was sold to the Finnish Amer. Sports Corporation. The Company will
change its legal name to “Adidas AG” following shareholder approval at
the Annual General Meeting in May 2006.
On January 31, 2006, Adidas-Salomon AG acquired Reebok international
Ltd. The closing of the Reebok transaction marks a new chapter the history
of the Adidas group. By combining two of the most respected and well-
known brands in the worldwide sporting goods industry, the new Group
will benefit from a more in the mid-1930s Adi Dasseler was already
making 30 different shoes for eleven sports, and he had a workforce of
almost 100 employees. In less than two decades Adidas advanced to
become the world’s leading sports shoe manufacturer. After the turmoil of
the Second World War, Adi dasseler made a fresh start.
In 1947, with 47 workers, he began putting into practice the knowledge
gained from the pre-war period and also new ideas. Adi Dasseler made the
first post-war sports shoes using canvas and rubber from American fuel
tanks.
In 1948 he introduced Adidas as the company name, a combination of his
own first and last time. One year later he registered the-to this day-
unmistakable Three Stripes.
The breakthrough came for Adi Dasseler when Germany won the Soccer
World Cup in 1954. In the legendary Final against Hungary, the Germen
team wore boots with screw-in studs-by Adidas. Parallel to the rapid
developments in sport, Adi dasseler strove to specialize and optimize his
products. Adi dasseler was the first entrepreneur to use sports promotion in
order to make the public aware of his innovations. He started using well-
known athletes as advertising for his products. Many famous athletes such
as Jesse Owens, Mohammed Ali, Max Schmeling, Sepp Herberger and
[10]
Franz Beckenbauer counted themselves among the friends of the dasseler
Family.
Aggressive publicity became one of the cornerstones of his corporate
policy. From now on. Adi Dasseler came up with a product innovation for
every major event, documenting the superiority of Adidas footwear. In
constant contact with active athletes in a wide variety of disciplines, he
developed the optimal shoe for almost every sport. Together with his son
Horst, Adi Dasseler created an international company that was, and still is,
present at all the worlds sporting events.
From the mid-1960s, Adidas also started producing apparel for competition
and training. Ball production began in 1963, and ever since 1970 the
Official Match ball at all major soccer events has been an Adidas product.
Adi Dasseler died 1978, at the age of 78. Carrying on his heritage and
ideas, his name and his developments will continue to help athletes in their
efforts to push the limits of performance, on into the new millennium.
Following the death of the company founder, Adi Dasseler’s widow Kathe
and his son Horst took charge of running the company. Horst Dasseler the
opportunities offered by sports promotion. Under his guidance, Adidas
became a global leader in the sector of innovations in sports marketing. He
was also responsible for establishing the brand in France. Horst Dasseler
died unexpectedly in 1987, at the early age of 51.
In 1989, Adidas was transformed into a corporation. At the beginning of the
1990s, after a difficult transition period, Adidas returned to its roots and its
original.Producing top products in top quality again became the company’s
principle.
In 1991, Adidas launched Adidas EQUIPMENT, a line of performance-
oriented, functional footwear and apparel. With street ball in 1992, Adidas
started specifically addressing a younger target group.
[11]
In 1993, Robert Louis-Dreyfus took over management of the company. The
Frenchman initiated the comeback of the Three Stripes.
In 1995, the Adidas share was one of the most interesting new introductions
on the stock market.
In 1997, Adidas AG and the Salomon group combined to form adidas-
Salomon AG. Since 2001, Herbert Hainer has been leading the group.
In October 2005, the Salomon business segment, including the related
subsidiaries and brands Salomon, Mavic, Bonfire, Arc’Teryx and Cliché’,
was sold to the Finnish Amer Sports Corporation.
On January 31, 2006, Reebok international Ltd. Was acquired providing the
new adidas Group with a footprint of around €9.5 billion ($11.8 billion) in
the global athletic footwear, apparel and hardware markets.
[12]
KALYANI SQUARE PROFILE
Kalyani Associates (P) Ltd has rich heritage inherited from its parent
concern Rm.Appavu Chettiar Jewellery Shop, which was established in 1906. The
management team of Kalyani, namely Mr.L.Nanda Kumar and Mr.L.Murali
Krishnan are the fourth generation members.
The urge to establish a business of his own apart from his family business
made Mr.L.Nanda Kumar to start a business in the name of his mother Kalyani in
the year 1985. He was assisted by his brother Mr.L.Murali Krishnan. Under the
banner of “Kalyani Engineering company” they promoted products like Kirloskar ,
Comet, Enfield Pumpsets.
In a decade their product ranges kept on extended with Parry Genset,
Dyanmax Genset, Solar RES. Then the title of the firm was changed into “Kalyani
Power Products”, with association of Honda Power products. It gave the company
the first opportunity to market a multi-national brand.
The experience gained in dealing with petrol engines gave the courage to
handle two wheelers. High degree of passion to introduce the world leaders in two
wheelers to the Madurai market helped the company to win the confidence of
Honda Motorcycles Scooters India (P) Ltd. Honda Dealership started functioning
from 2001 as “Kalyani Motors”.
The attempt to expand and diversify was the perpetual dream of the
management, which decorated the arena of Kalyani with various reputed multi-
national brands like Prestige Smart Kitchen, Levi's, Planet Fashion, Maybell,
Giny & Jony, Jockey, Adidas, Nike, Reebok, Puma, Fastrack, Pizza Corner,
Baskin Robbins, Naturals and Elgi.
In 2004, all the firms of kalyani group were amalgamated as “Kalyani
Associates (P) Ltd”. With the vision of building a confident lifestyle – 360
degrees, the management is determined to keep on discover new business ventures
and beautify its business galaxy throughout its journey.
[13]
OBJECTIVES
To identify the profile of consumers who buy Adidas shoes.
To find the basic purposes of wearing Adidas shoes by respondents.
To identify the factors influencing brand decision in purchasing sports
shoes in general & Adidas brand in particular.
[14]
RESEARCH METHODOLOGY
RESEARCH DESIGN
A Research Design is simply the frame work or plan for a study used as a guide in
collecting and analysing of data .Descriptive research design was adopted for this study.
Descriptive research is used to
To describe the characteristics of certain groups
To estimate the proportion of people in a specified population who behave in a
certain way.
To make specific predictions.
SAMPLING DESIGN:
Sampling is the foundation of all Research. Sampling improves the accuracy and
validity of the result of the study. Sampling is the tool, and it helps to know the
characteristics of the population by examining only a small of it.
SAMPLING METHOD:
The Sampling method adopted for the study was Convenience sampling. In this
type of sampling, items for the sample are selected deliberately by the researcher. His
choice concerns the item remarks supreme.
SAMPLING SIZE:
The size of the study is 60.
[15]
METHOD OF DATA COLLECTION:
The important step in the project work is to obtain data. Both Primary and
Secondary data were collected for this study
PRIMARY DATA:
The researcher collected the primary data from the customers by using
schedules. Schedules contain a set of questions printed in a definite order. Schedules are
being filled in by the researcher himself. In some cases schedules may be handed over to
respondents and researcher may help in recording their answer to various questions in the
said Schedule.
SECONDARY DATA:
Books
Company Records
Web-sites
TOOLS FOR ANALYSIS:
The researcher has used the tools of data representation and SPSS package for the
study.
[16]
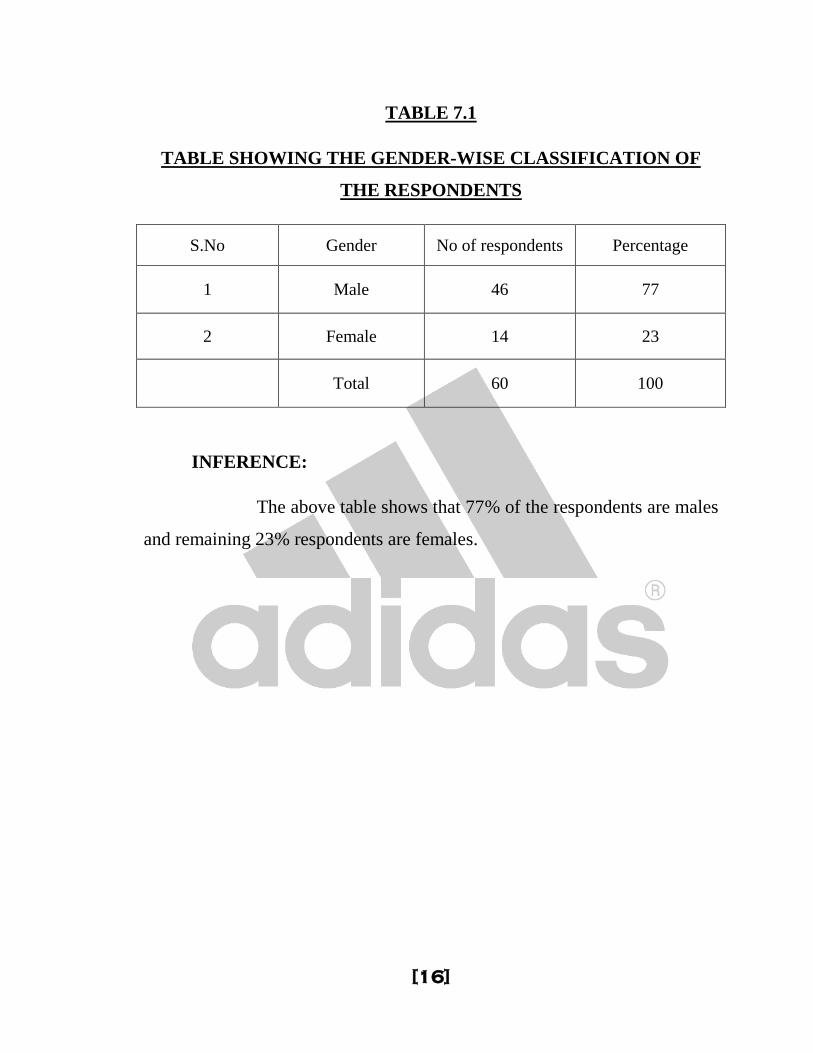
TABLE 7.1
TABLE SHOWING THE GENDER-WISE CLASSIFICATION OF
THE RESPONDENTS
S.No Gender No of respondents Percentage
1 Male 46 77
2 Female 14 23
Total 60 100
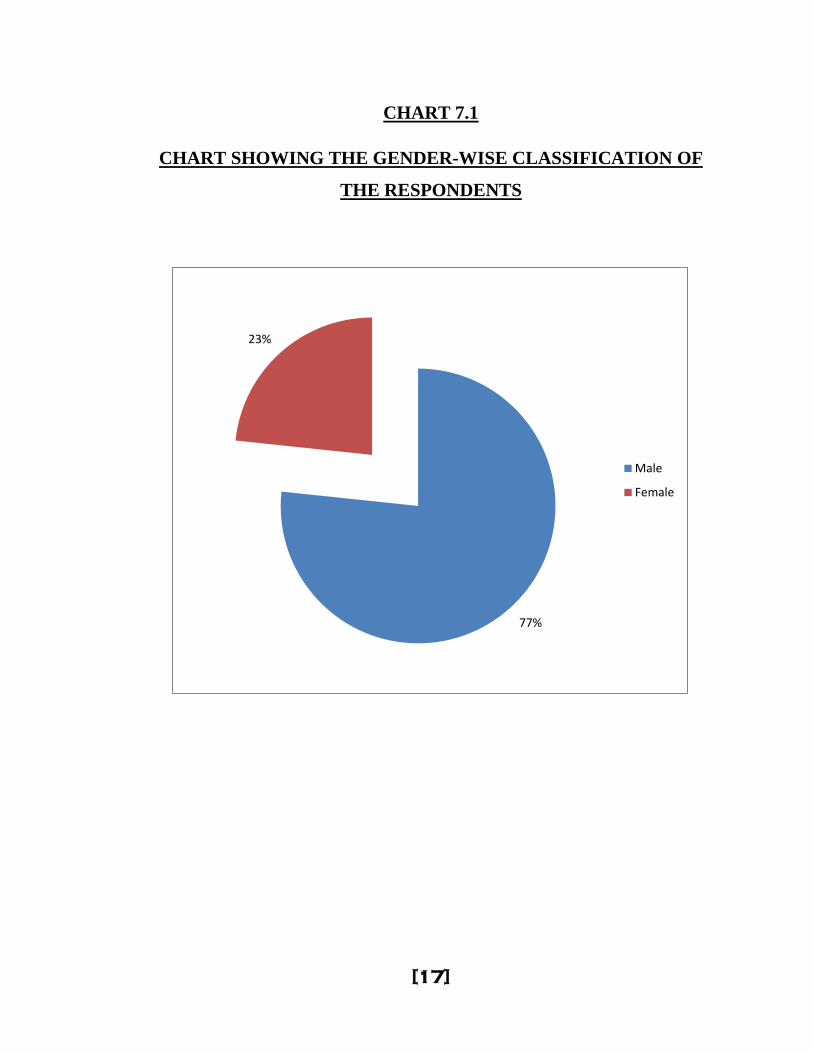
INFERENCE:
The above table shows that 77% of the respondents are males
and remaining 23% respondents are females.
[17]
CHART 7.1
CHART SHOWING THE GENDER-WISE CLASSIFICATION OF
THE RESPONDENTS
77%
23%
Male
Female
[18]
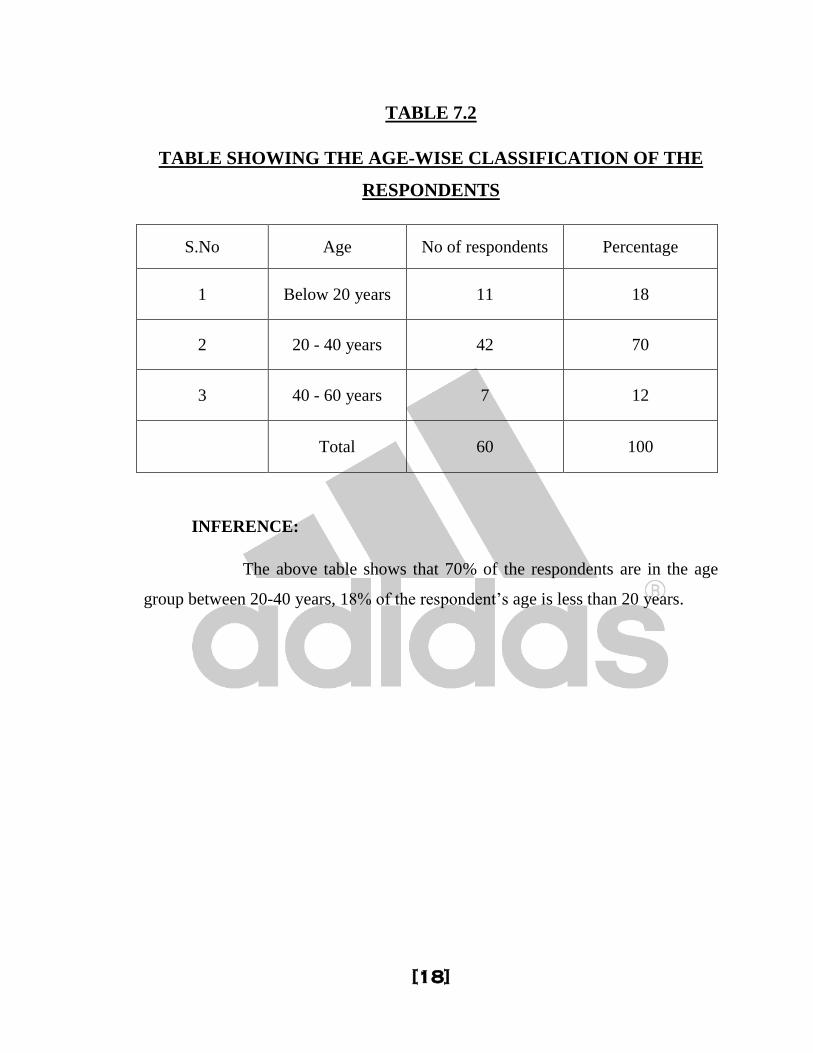
TABLE 7.2
TABLE SHOWING THE AGE-WISE CLASSIFICATION OF THE
RESPONDENTS
S.No Age No of respondents Percentage
1 Below 20 years 11 18
2 20 - 40 years 42 70
3 40 - 60 years 7 12
Total 60 100
INFERENCE:
The above table shows that 70% of the respondents are in the age
group between 20-40 years, 18% of the respondent’s age is less than 20 years.
[19]
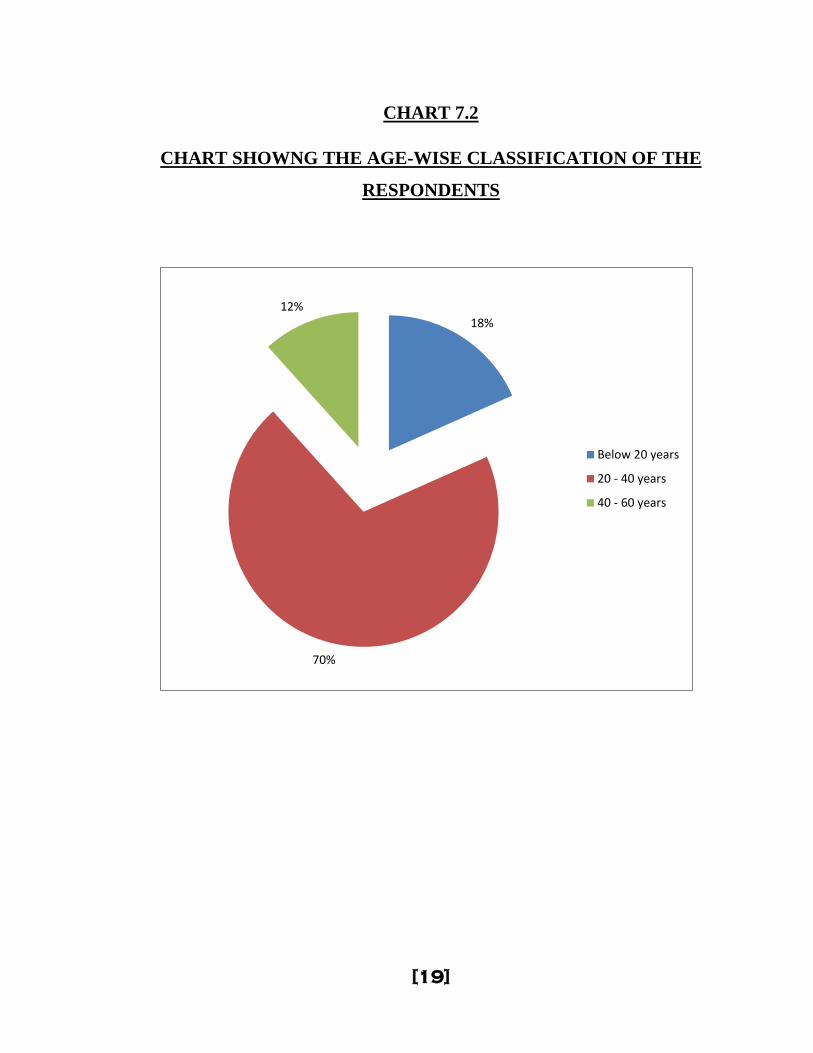
CHART 7.2
CHART SHOWNG THE AGE-WISE CLASSIFICATION OF THE
RESPONDENTS
18%
70%
12%
Below 20 years
20 - 40 years
40 - 60 years
[20]
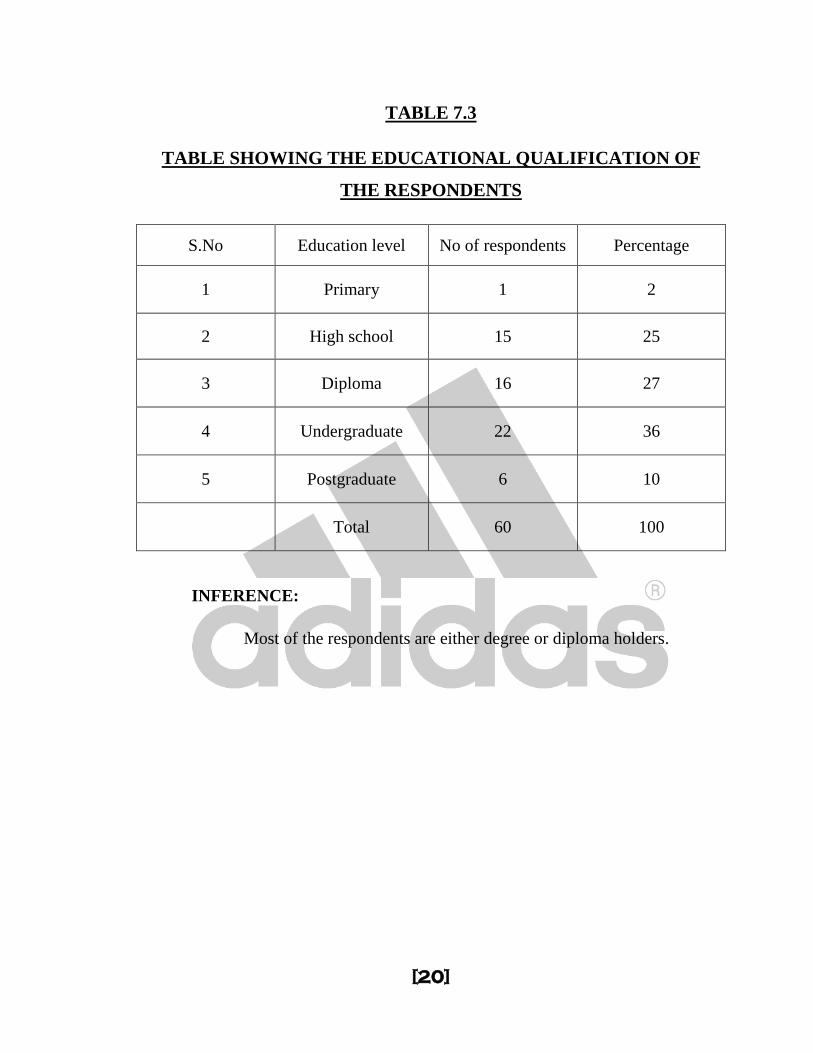
TABLE 7.3
TABLE SHOWING THE EDUCATIONAL QUALIFICATION OF
THE RESPONDENTS
S.No Education level No of respondents Percentage
1 Primary 1 2
2 High school 15 25
3 Diploma 16 27
4 Undergraduate 22 36
5 Postgraduate 6 10
Total 60 100
INFERENCE:
Most of the respondents are either degree or diploma holders.
[21]
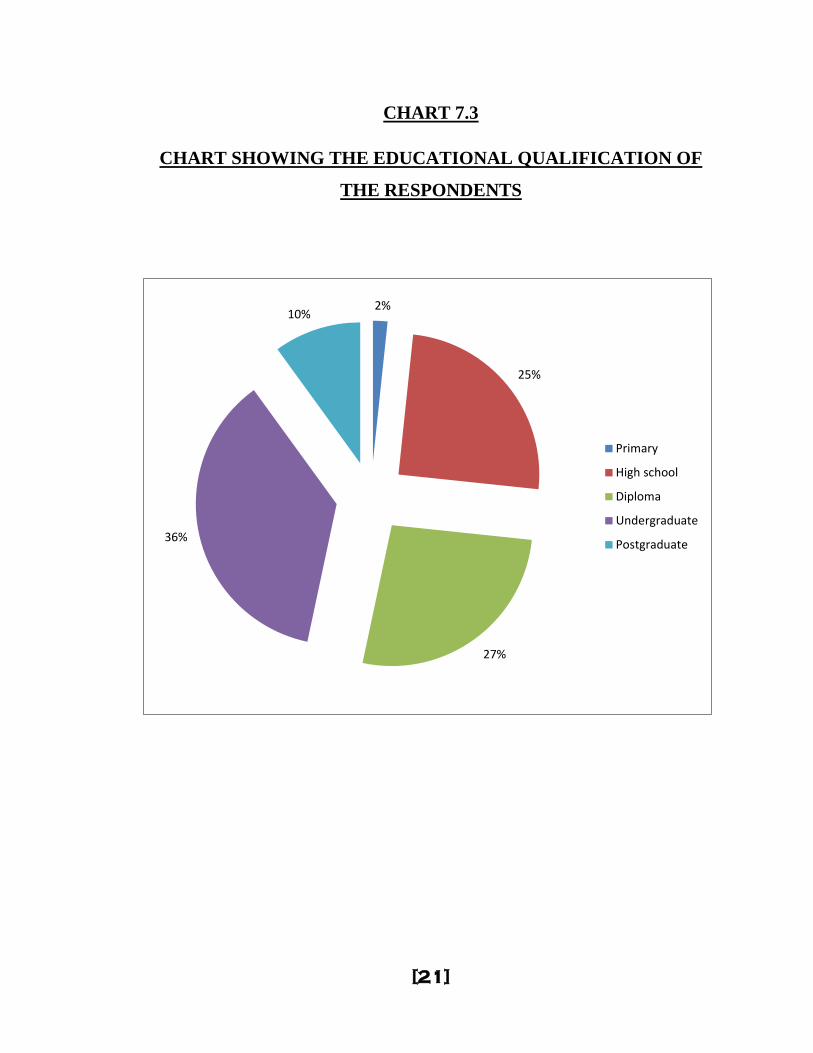
CHART 7.3
CHART SHOWING THE EDUCATIONAL QUALIFICATION OF
THE RESPONDENTS
2%
25%
27%
36%
10%
Primary
High school
Diploma
Undergraduate
Postgraduate
[22]
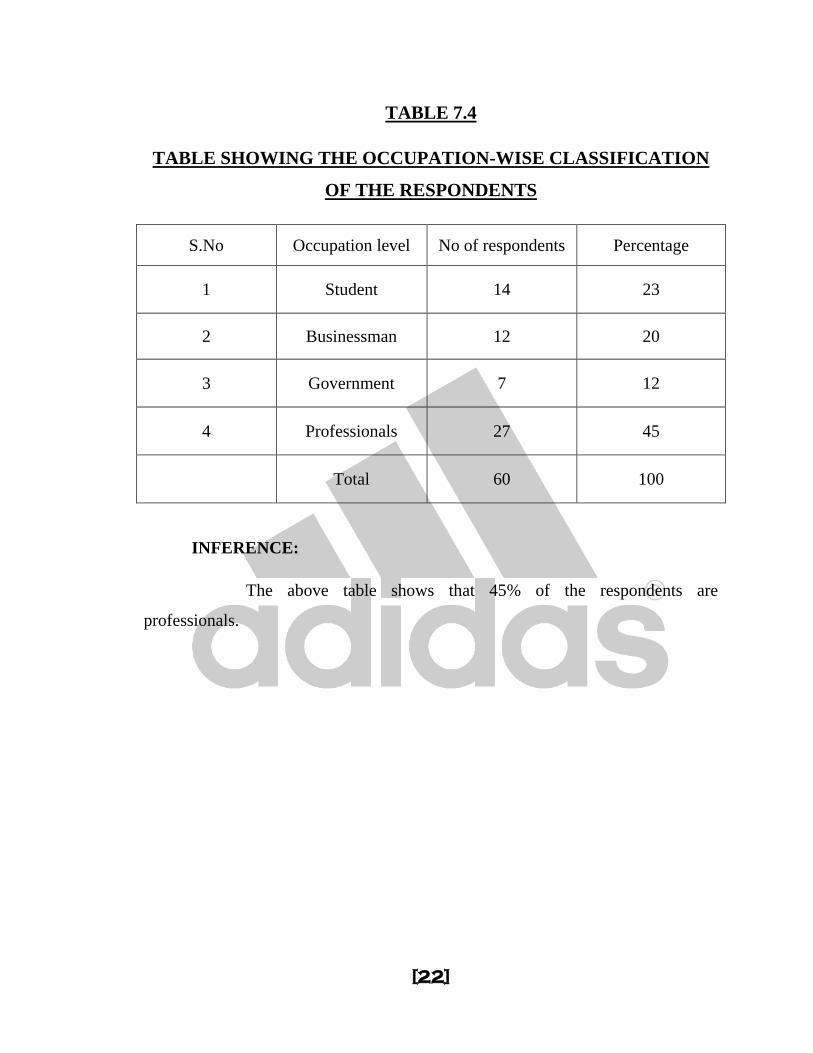
TABLE 7.4
TABLE SHOWING THE OCCUPATION-WISE CLASSIFICATION
OF THE RESPONDENTS
S.No Occupation level No of respondents Percentage
1 Student 14 23
2 Businessman 12 20
3 Government 7 12
4 Professionals 27 45
Total 60 100
INFERENCE:
The above table shows that 45% of the respondents are
professionals.
[23]
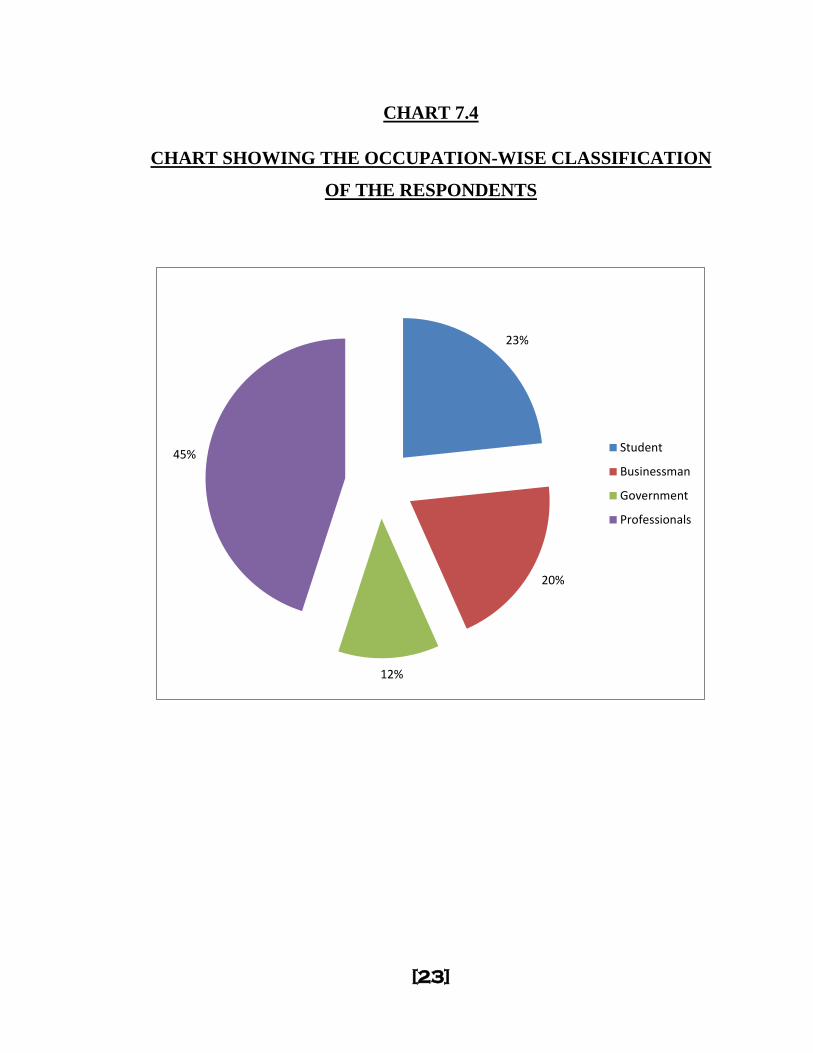
CHART 7.4
CHART SHOWING THE OCCUPATION-WISE CLASSIFICATION
OF THE RESPONDENTS
23%
20%
12%
45% Student
Businessman
Government
Professionals
[24]
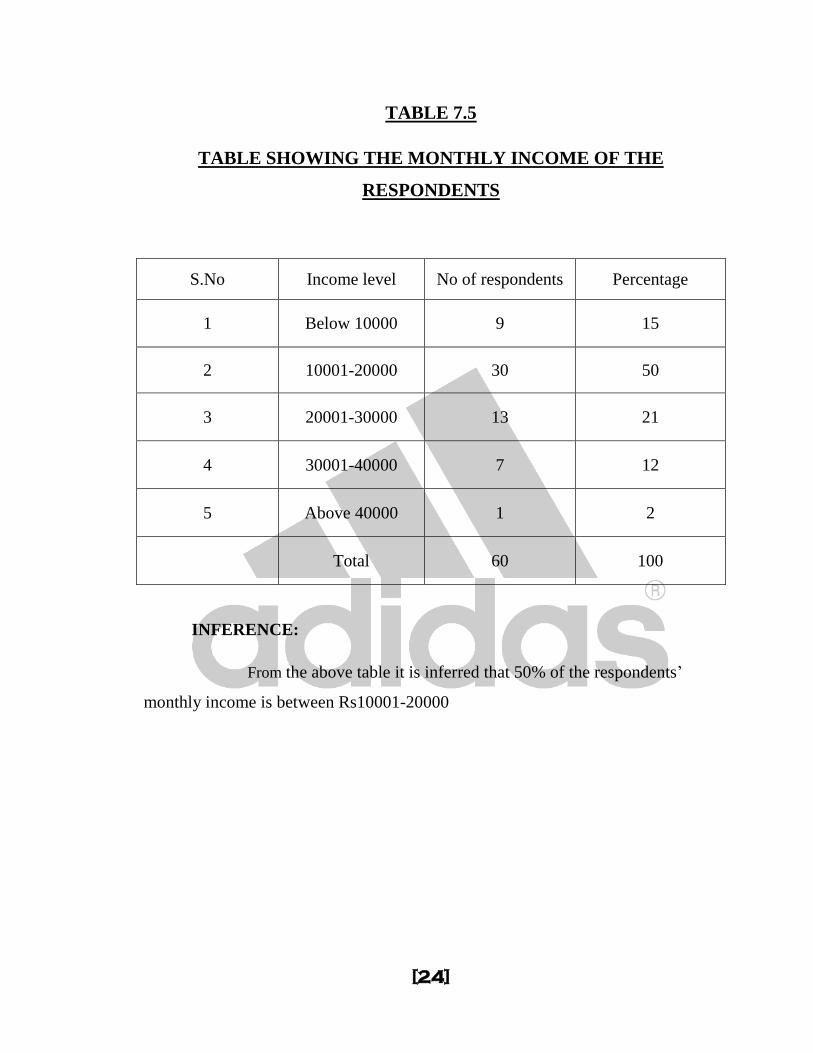
TABLE 7.5
TABLE SHOWING THE MONTHLY INCOME OF THE
RESPONDENTS
S.No Income level No of respondents Percentage
1 Below 10000 9 15
2 10001-20000 30 50
3 20001-30000 13 21
4 30001-40000 7 12
5 Above 40000 1 2
Total 60 100
INFERENCE:
From the above table it is inferred that 50% of the respondents’
monthly income is between Rs10001-20000
[25]
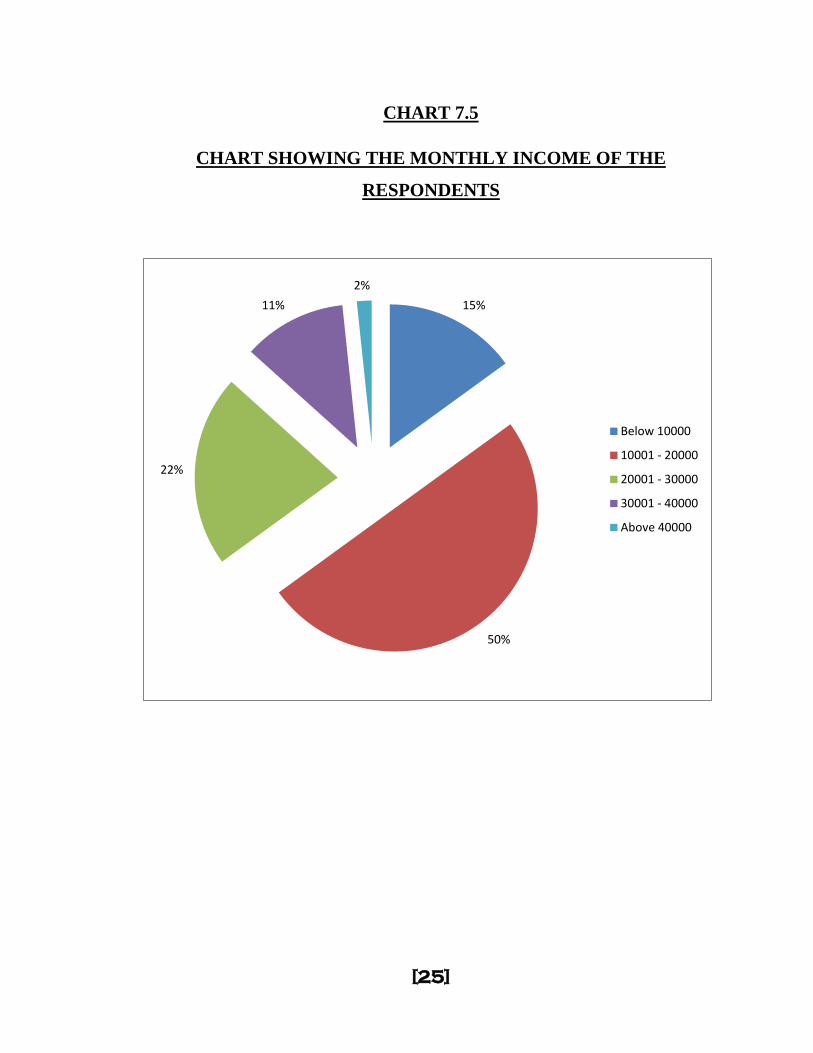
CHART 7.5
CHART SHOWING THE MONTHLY INCOME OF THE
RESPONDENTS
15%
50%
22%
11%
2%
Below 10000
10001 - 20000
20001 - 30000
30001 - 40000
Above 40000
[26]
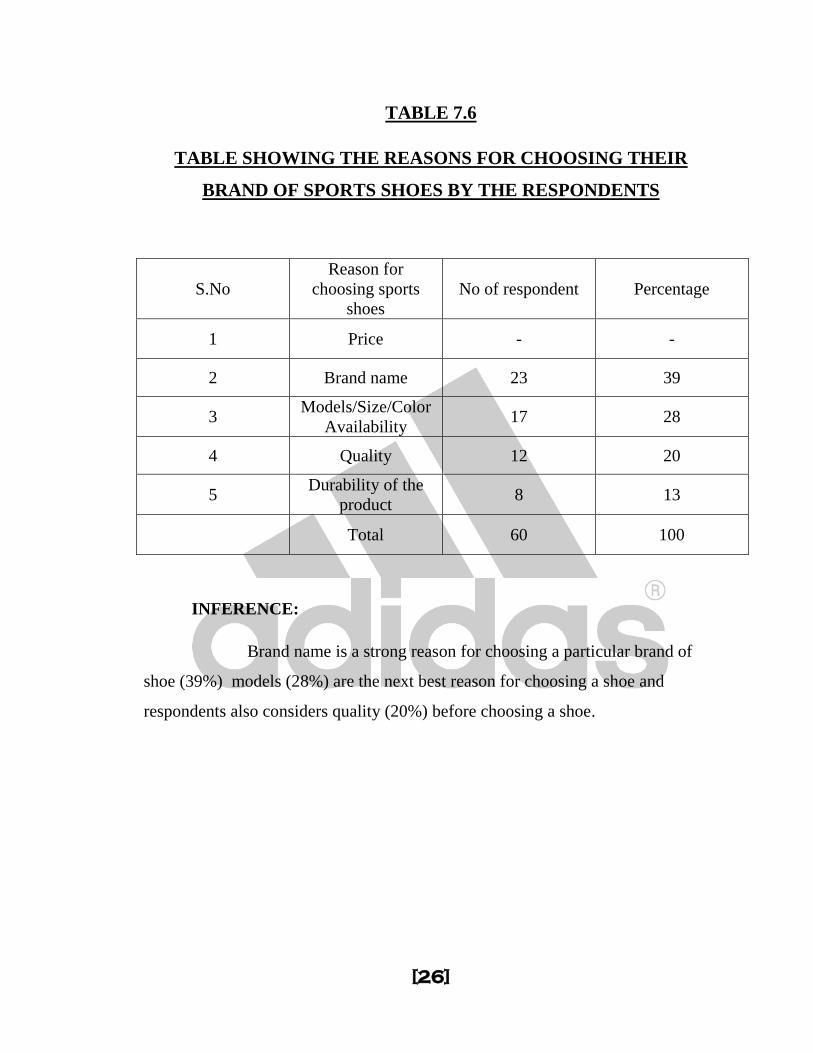
TABLE 7.6
TABLE SHOWING THE REASONS FOR CHOOSING THEIR
BRAND OF SPORTS SHOES BY THE RESPONDENTS
S.No
Reason for
choosing sports
shoes
No of respondent Percentage
1 Price - -
2 Brand name 23 39
3 Models/Size/Color
Availability 17 28
4 Quality 12 20
5 Durability of the
product 8 13
Total 60 100
INFERENCE:
Brand name is a strong reason for choosing a particular brand of
shoe (39%) models (28%) are the next best reason for choosing a shoe and
respondents also considers quality (20%) before choosing a shoe.
[27]
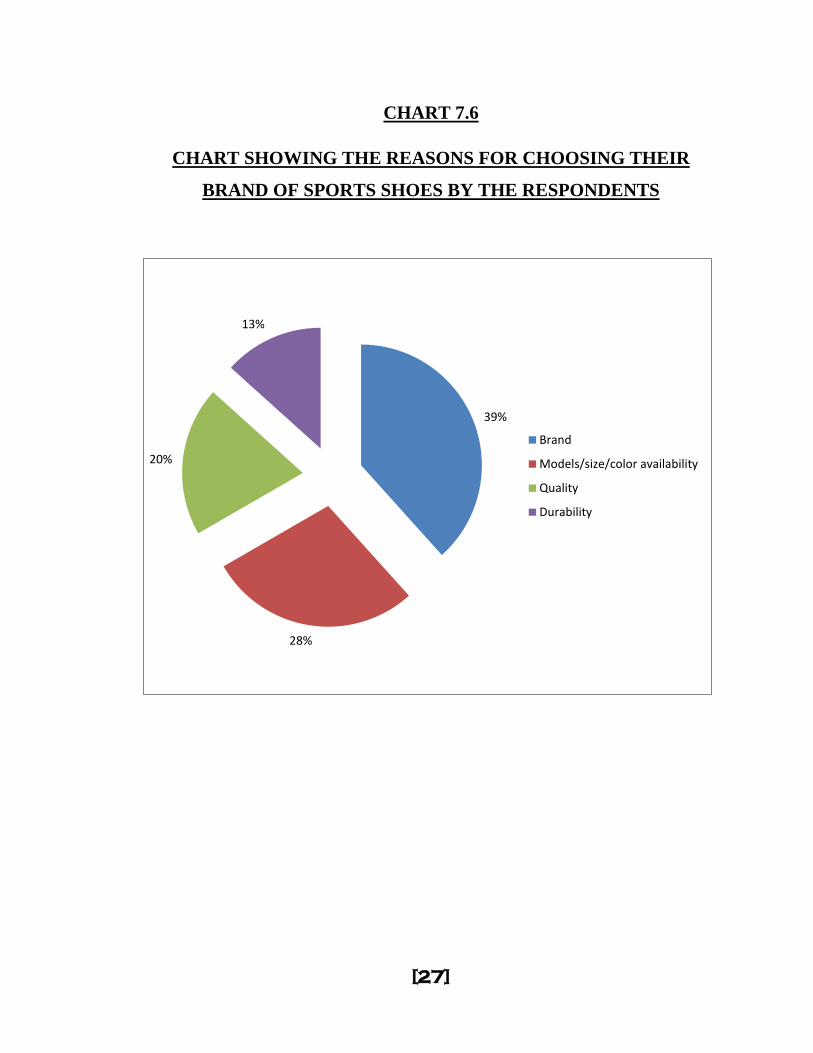
CHART 7.6
CHART SHOWING THE REASONS FOR CHOOSING THEIR
BRAND OF SPORTS SHOES BY THE RESPONDENTS
39%
28%
20%
13%
Brand
Models/size/color availability
Quality
Durability
[28]
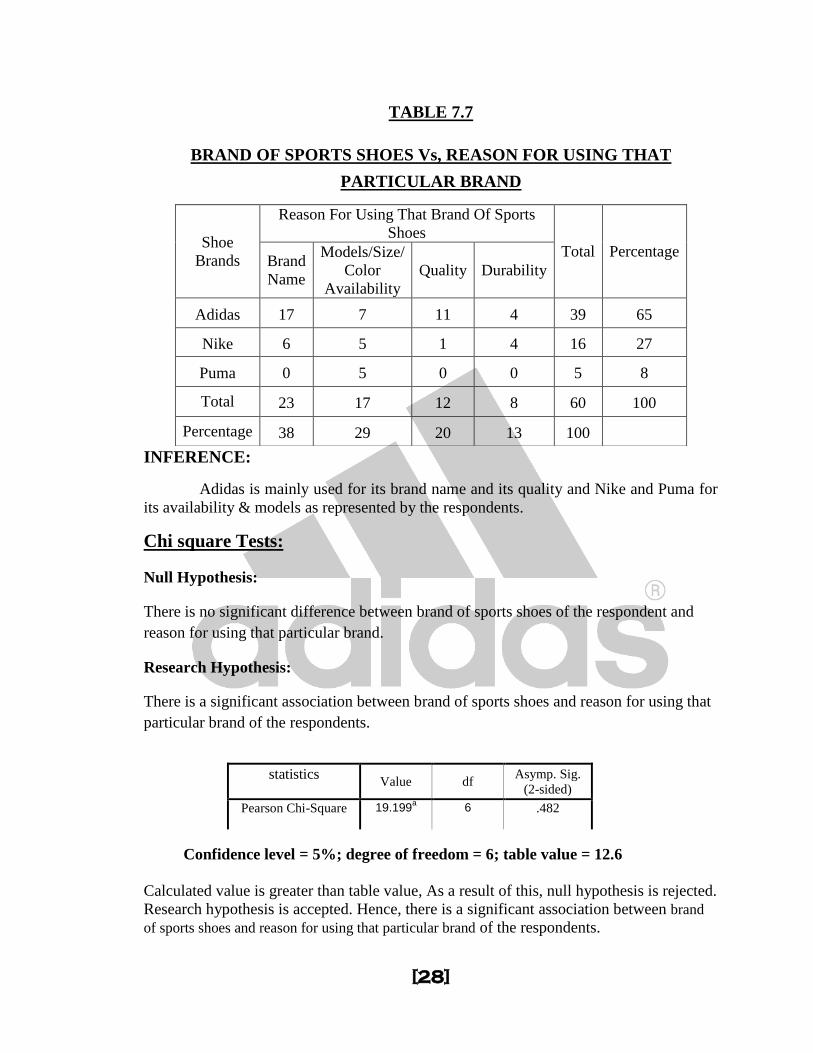
TABLE 7.7
BRAND OF SPORTS SHOES Vs, REASON FOR USING THAT
PARTICULAR BRAND
INFERENCE:
Adidas is mainly used for its brand name and its quality and Nike and Puma for
its availability & models as represented by the respondents.
Chi square Tests:
Null Hypothesis:
There is no significant difference between brand of sports shoes of the respondent and
reason for using that particular brand.
Research Hypothesis:
There is a significant association between brand of sports shoes and reason for using that
particular brand of the respondents.
statistics
Value df Asymp. Sig.
(2-sided)
Pearson Chi-Square 19.199a 6 .482
Confidence level = 5%; degree of freedom = 6; table value = 12.6
Calculated value is greater than table value, As a result of this, null hypothesis is rejected.
Research hypothesis is accepted. Hence, there is a significant association between brand
of sports shoes and reason for using that particular brand of the respondents.
Shoe
Brands
Reason For Using That Brand Of Sports
Shoes
Total Percentage Brand
Name
Models/Size/
Color
Availability
Quality Durability
Adidas 17 7 11 4 39 65
Nike 6 5 1 4 16 27
Puma 0 5 0 0 5 8
Total 23 17 12 8 60 100
Percentage 38 29 20 13 100

[29]
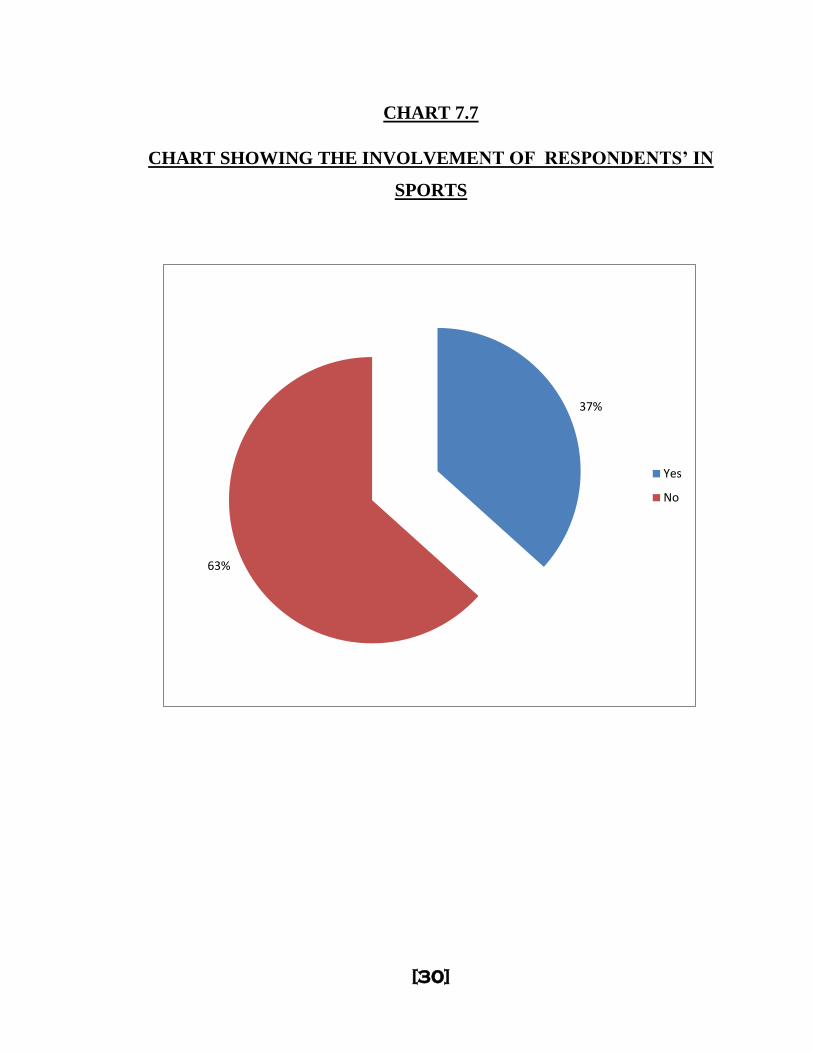
TABLE 7.8
TABLE SHOWING THE INVOLVEMENT OF RESPONDENTS’
IN SPORTS
INFERENCE:
Out of 60 people who are surveyed, only 37% are sports persons
and the remaining are not involved in sports.
S.No Involved in sports No of respondents Percentage
1 Yes 22 37
2 No 38 63
Total 60 100
[30]
CHART 7.7
CHART SHOWING THE INVOLVEMENT OF RESPONDENTS’ IN
SPORTS
37%
63%
Yes
No
[31]
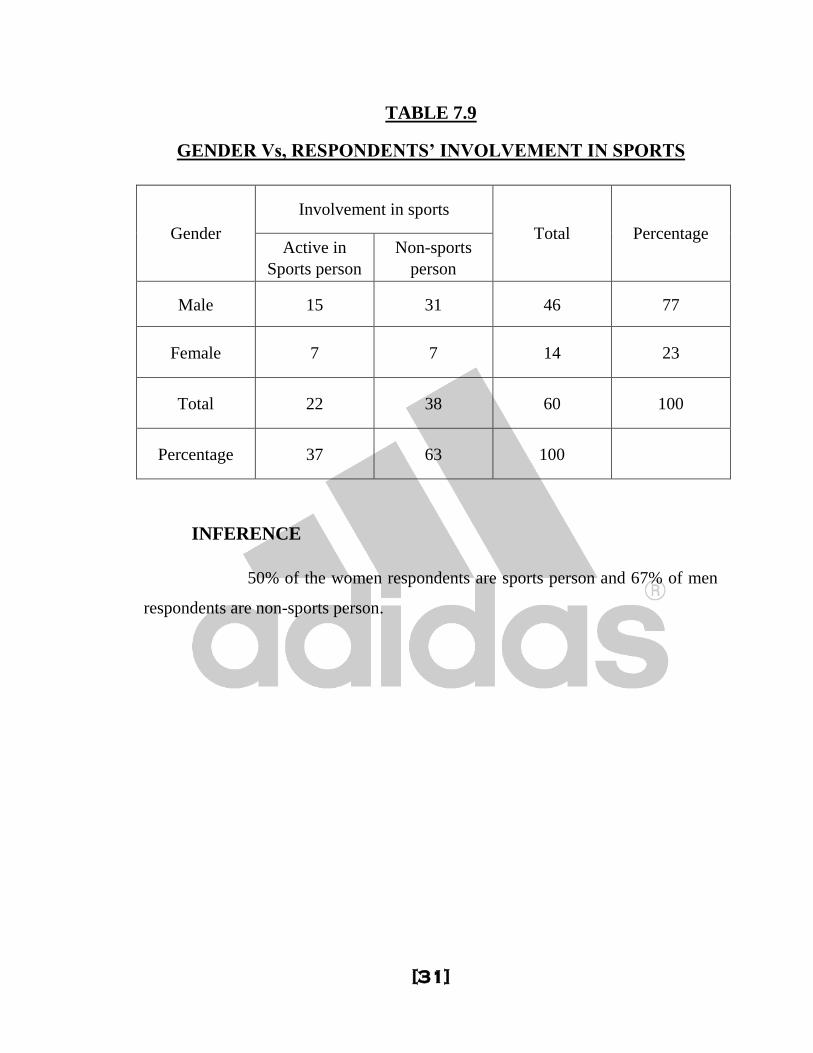
TABLE 7.9
GENDER Vs, RESPONDENTS’ INVOLVEMENT IN SPORTS
Gender
Involvement in sports
Total Percentage Active in
Sports person
Non-sports
person
Male 15 31 46 77
Female 7 7 14 23
Total 22 38 60 100
Percentage 37 63 100
INFERENCE
50% of the women respondents are sports person and 67% of men
respondents are non-sports person.
[32]
TABLE 7.10
OCCUPATION Vs, RESPONDENTS WHO ARE INVOLVED IN
SPORTS
INFERENCE:
Students are very active in sports when compared to other
professionals, government employees & businessmen.
Occupation
Involved in Sports
Total Percentage Active in
Sports
Non-sports
person
Student 11 3 14 23
Businessmen 3 9 12 20
Government
Employees 1 6 7 12
Professionals 7 20 27 45
Total 22 38 60 100
Percentage 37 63 100
[33]
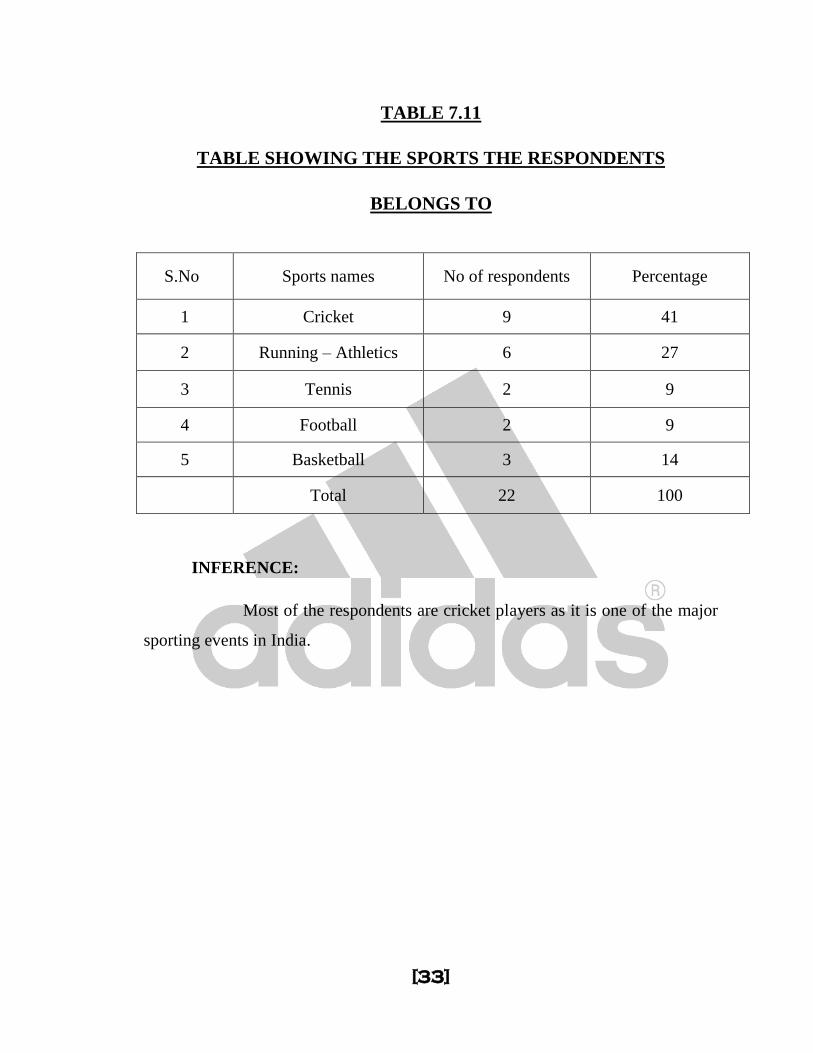
TABLE 7.11
TABLE SHOWING THE SPORTS THE RESPONDENTS
BELONGS TO
INFERENCE:
Most of the respondents are cricket players as it is one of the major
sporting events in India.
S.No Sports names No of respondents Percentage
1 Cricket 9 41
2 Running – Athletics 6 27
3 Tennis 2 9
4 Football 2 9
5 Basketball 3 14
Total 22 100
[34]
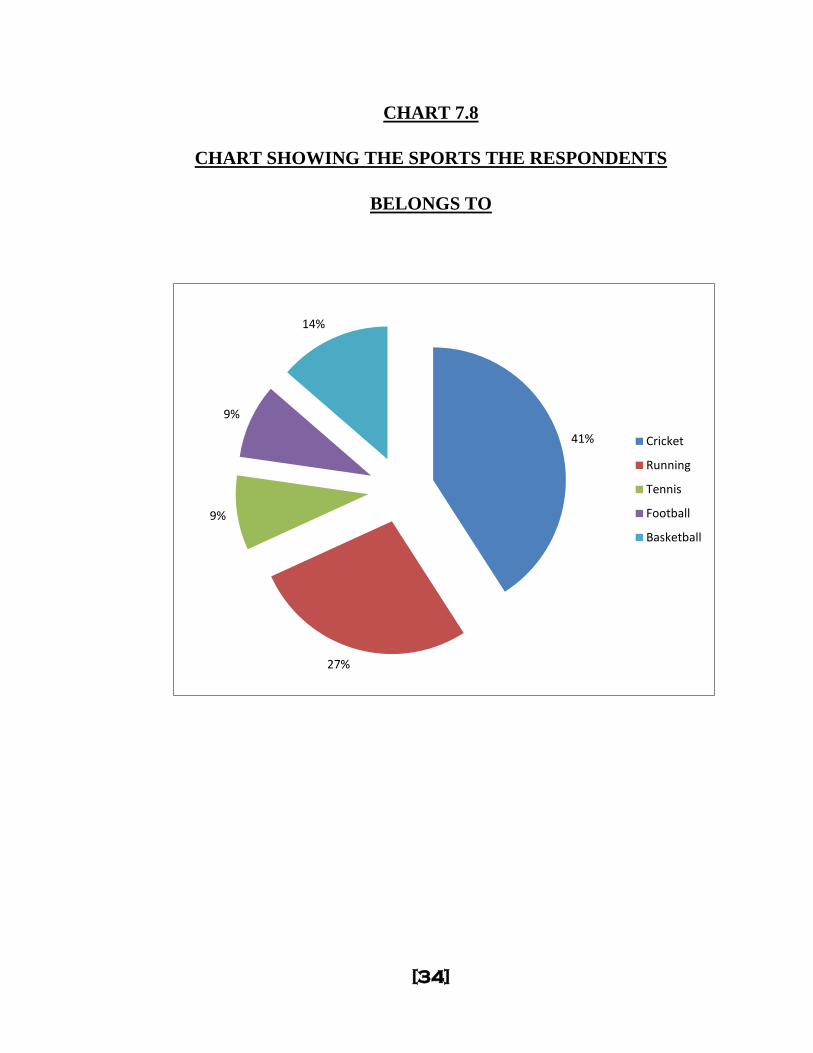
CHART 7.8
CHART SHOWING THE SPORTS THE RESPONDENTS
BELONGS TO
41%
27%
9%
9%
14%
Cricket
Running
Tennis
Football
Basketball
[35]
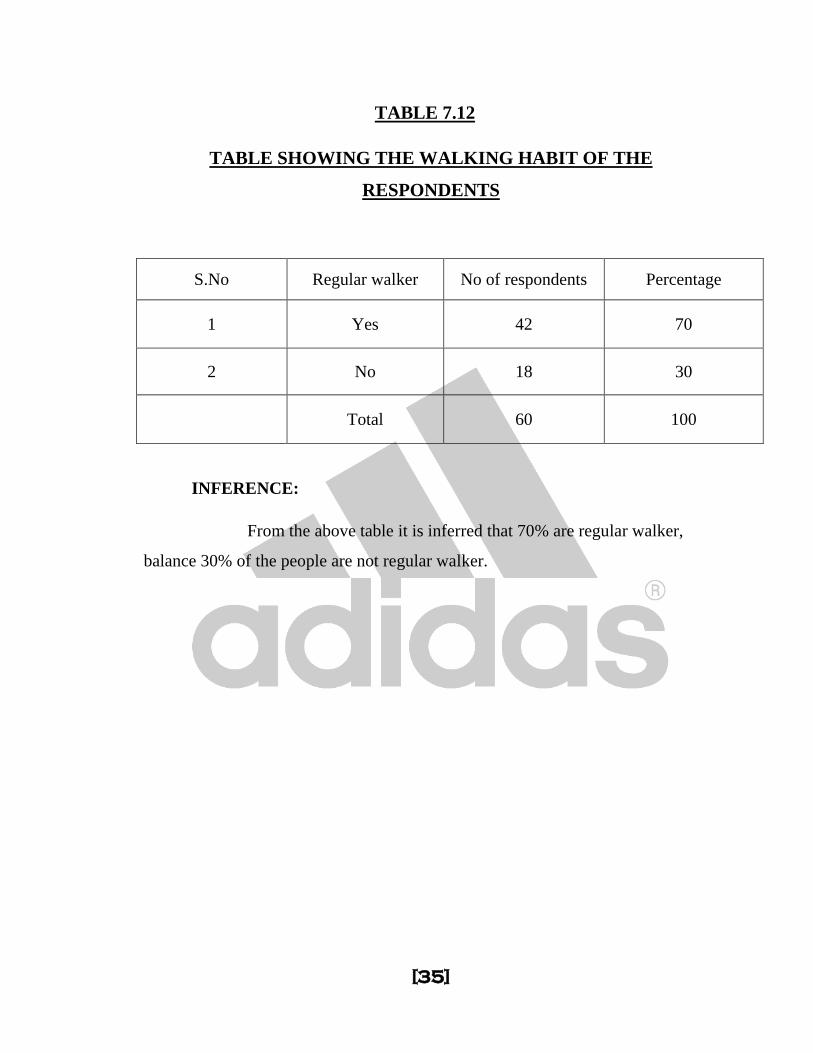
TABLE 7.12
TABLE SHOWING THE WALKING HABIT OF THE
RESPONDENTS
S.No Regular walker No of respondents Percentage
1 Yes 42 70
2 No 18 30
Total 60 100
INFERENCE:
From the above table it is inferred that 70% are regular walker,
balance 30% of the people are not regular walker.
[36]
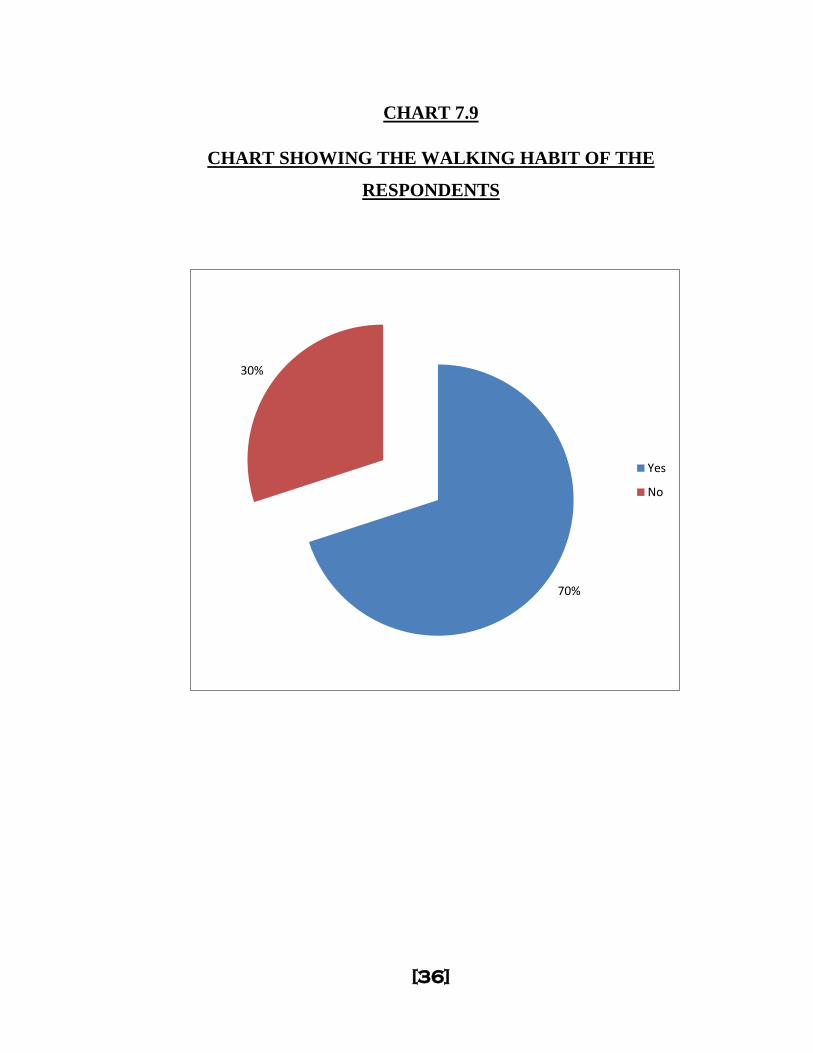
CHART 7.9
CHART SHOWING THE WALKING HABIT OF THE
RESPONDENTS
70%
30%
Yes
No
[37]
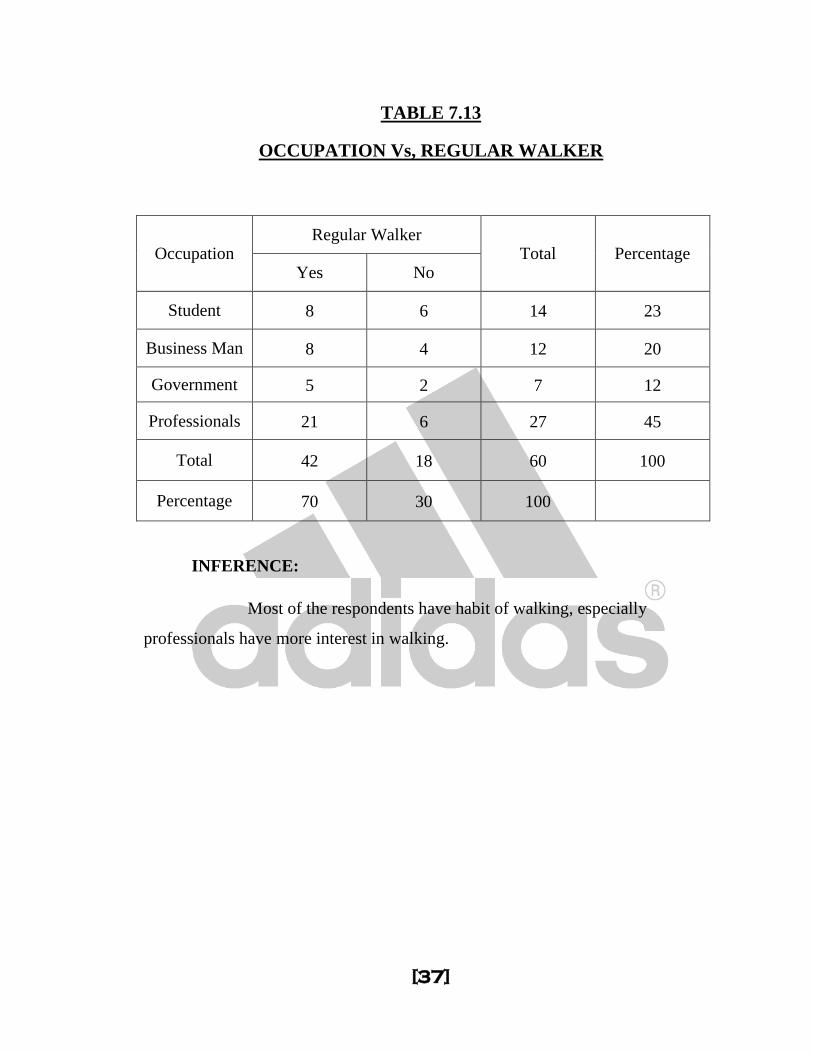
TABLE 7.13
OCCUPATION Vs, REGULAR WALKER
Occupation Regular Walker
Total Percentage Yes No
Student 8 6 14 23
Business Man 8 4 12 20
Government 5 2 7 12
Professionals 21 6 27 45
Total 42 18 60 100
Percentage 70 30 100
INFERENCE:
Most of the respondents have habit of walking, especially
professionals have more interest in walking.
[38]
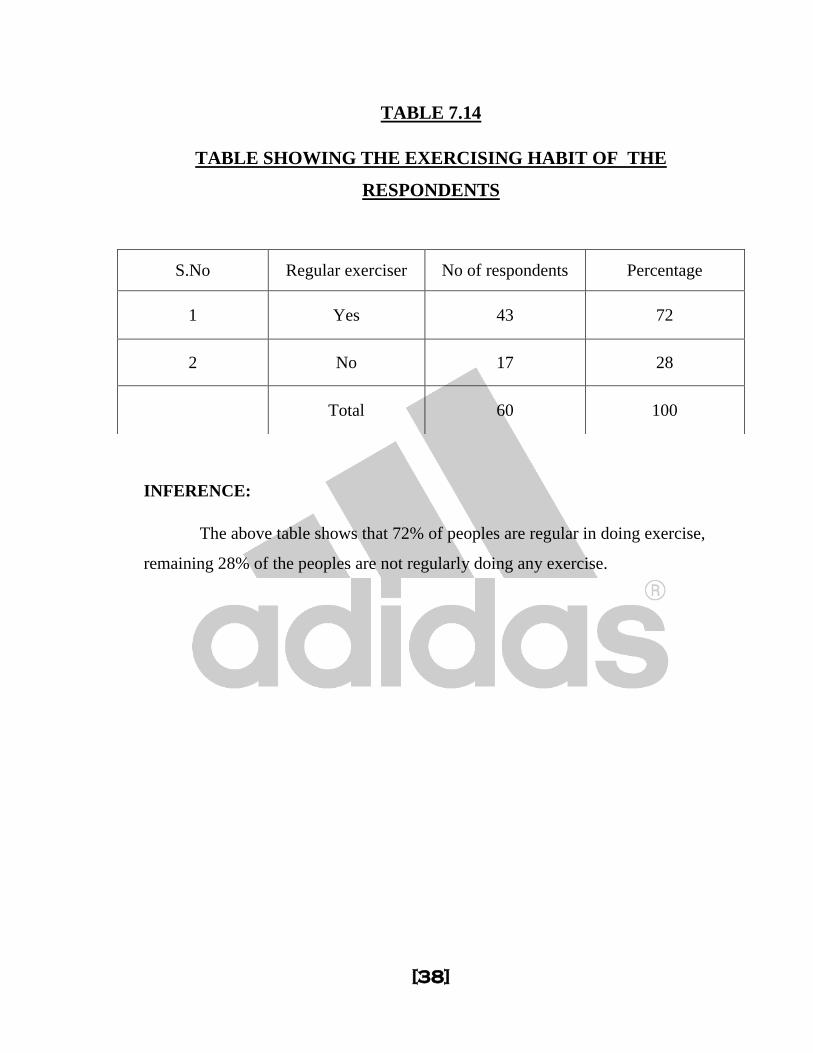
TABLE 7.14
TABLE SHOWING THE EXERCISING HABIT OF THE
RESPONDENTS
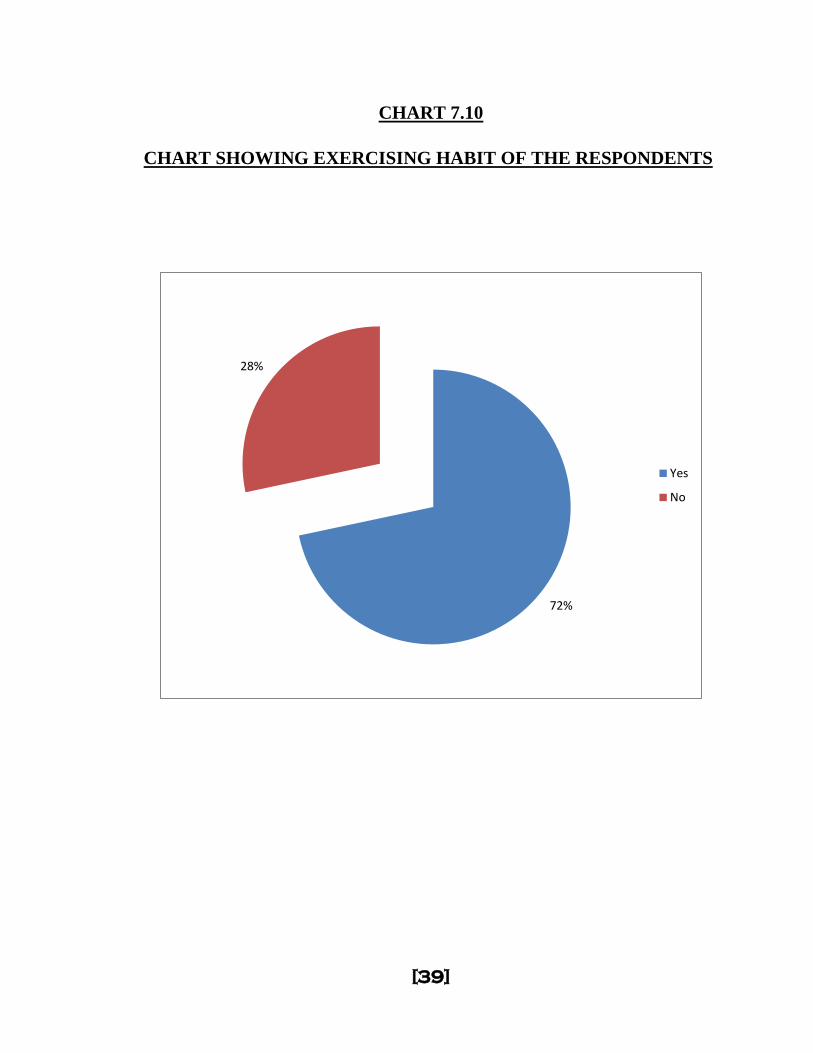
INFERENCE:
The above table shows that 72% of peoples are regular in doing exercise,
remaining 28% of the peoples are not regularly doing any exercise.
S.No Regular exerciser No of respondents Percentage
1 Yes 43 72
2 No 17 28
Total 60 100
[39]
CHART 7.10
CHART SHOWING EXERCISING HABIT OF THE RESPONDENTS
72%
28%
Yes
No
[40]
TABLE 7.15
AGE Vs, EXERCISING HABIT OF THE RESPONDENTS
INFERENCE:
As age increases the respondents do have interest in exercising
regularly. And it is predominant among elderly persons.
Age wise
Exercising Habits
Total Percentage Active
exerciser
Passive
exerciser
less than 20
years 7 4 11 18
20 - 40 years 32 10 42 70
40 - 60 years 4 3 7 12
Total 43 17 60 100
Percentage 72 28 100
[41]
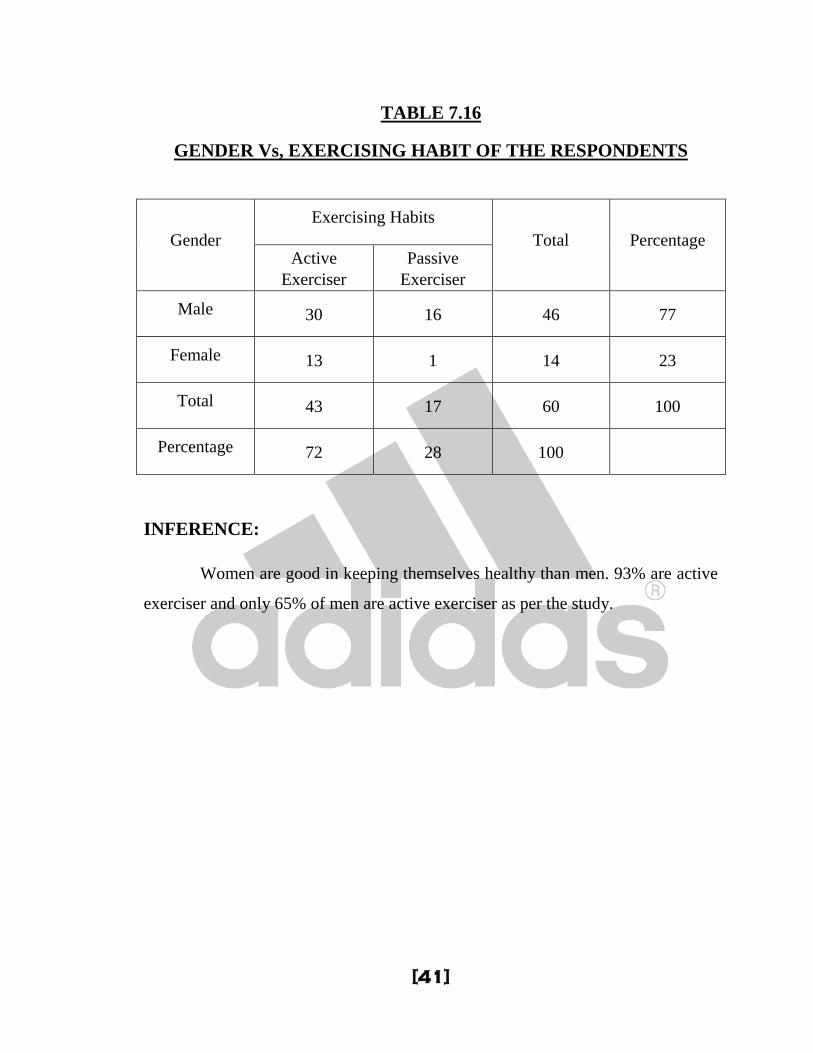
TABLE 7.16
GENDER Vs, EXERCISING HABIT OF THE RESPONDENTS
Gender
Exercising Habits
Total Percentage Active
Exerciser
Passive
Exerciser
Male 30 16 46 77
Female 13 1 14 23
Total 43 17 60 100
Percentage 72 28 100
INFERENCE:
Women are good in keeping themselves healthy than men. 93% are active
exerciser and only 65% of men are active exerciser as per the study.
[42]
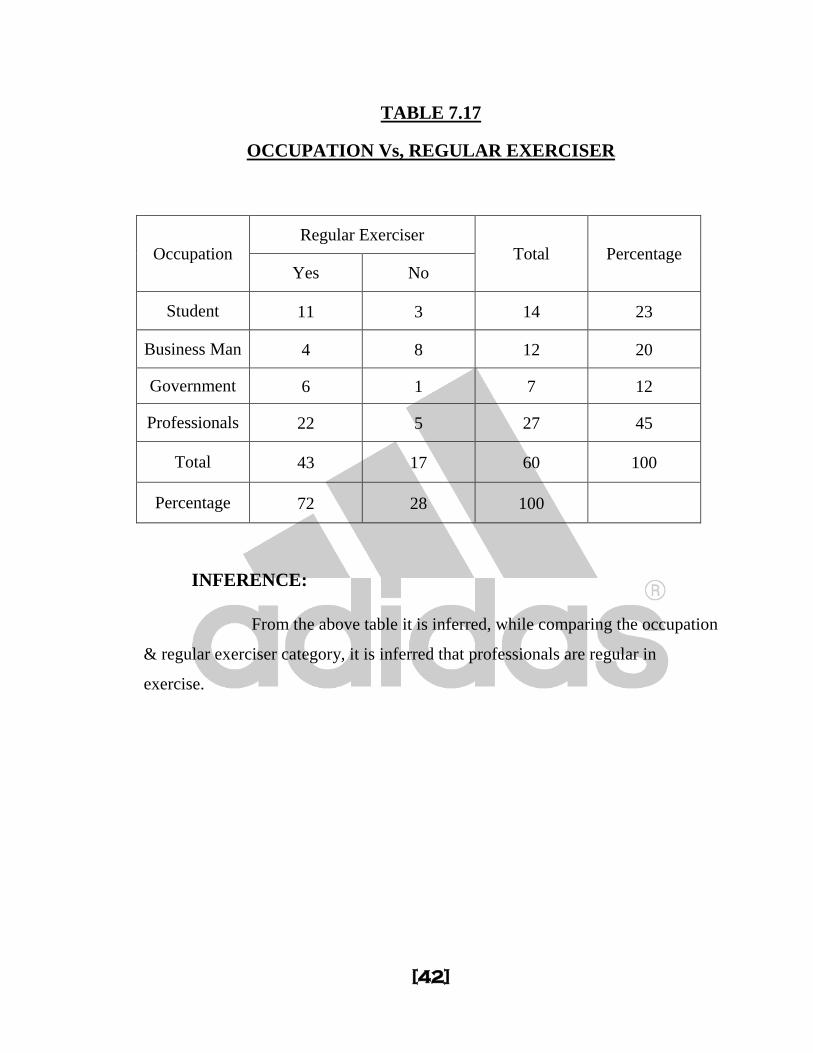
TABLE 7.17
OCCUPATION Vs, REGULAR EXERCISER
Occupation Regular Exerciser
Total Percentage Yes No
Student 11 3 14 23
Business Man 4 8 12 20
Government 6 1 7 12
Professionals 22 5 27 45
Total 43 17 60 100
Percentage 72 28 100
INFERENCE:
From the above table it is inferred, while comparing the occupation
& regular exerciser category, it is inferred that professionals are regular in
exercise.
[43]
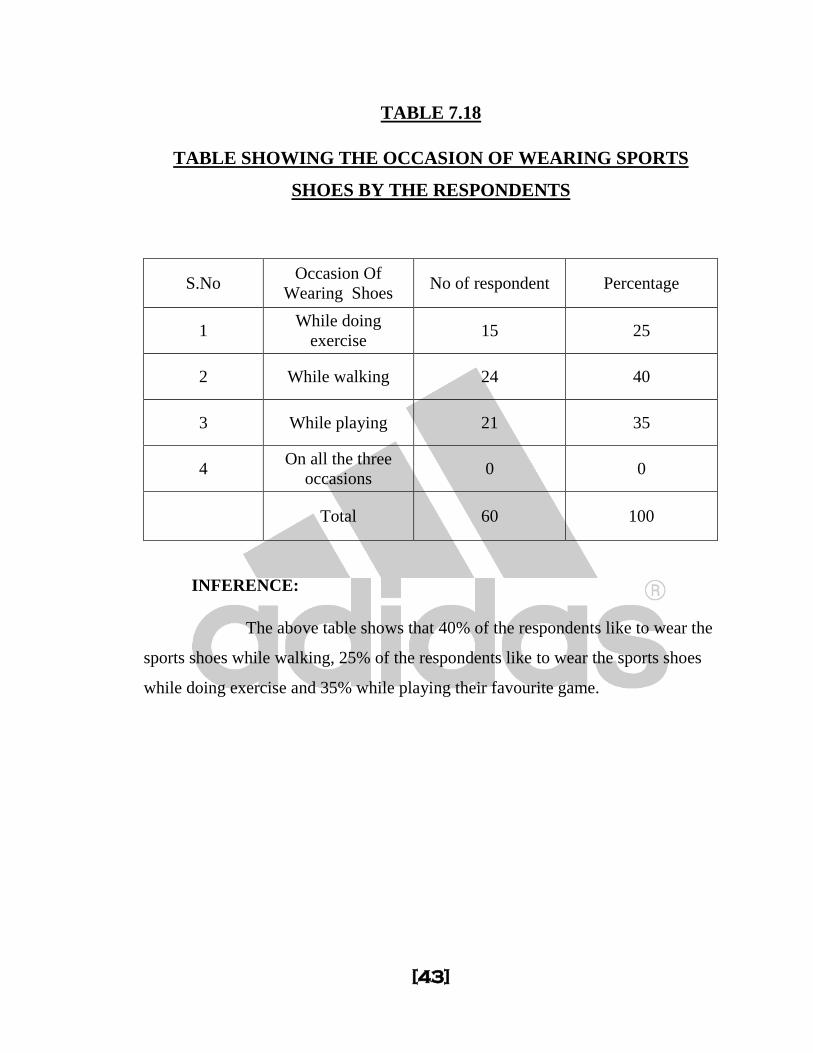
TABLE 7.18
TABLE SHOWING THE OCCASION OF WEARING SPORTS
SHOES BY THE RESPONDENTS
S.No Occasion Of
Wearing Shoes No of respondent Percentage
1 While doing
exercise 15 25
2 While walking 24 40
3 While playing 21 35
4 On all the three
occasions 0 0
Total 60 100
INFERENCE:
The above table shows that 40% of the respondents like to wear the
sports shoes while walking, 25% of the respondents like to wear the sports shoes
while doing exercise and 35% while playing their favourite game.
[44]
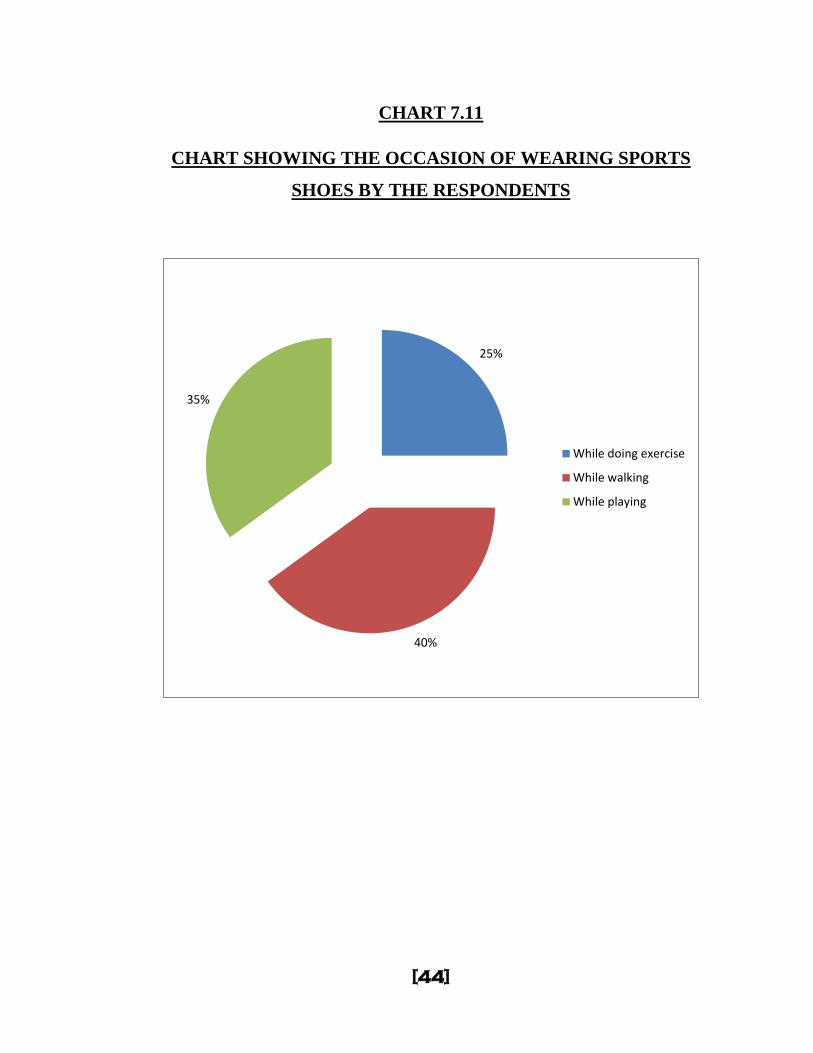
CHART 7.11
CHART SHOWING THE OCCASION OF WEARING SPORTS
SHOES BY THE RESPONDENTS
25%
40%
35%
While doing exercise
While walking
While playing

[45]
TABLE 7.19
AGE Vs, OCCASION OF WEARING SPORTS SHOES
Age wise
Occasion of Wearing Sports Shoes
Total Percentage While
doing
exercise
While
walking
While
playing
Below 20
years 1 2 8 11 18
20 - 40
years 13 16 13 42 70
40 - 60
years 1 6 0 7 12
Total 15 24 21 60 100
Percentage 25 40 35 100
INFERENCE:
Below 20 years of age, use shoes only for playing.20-40 years use
shoes while playing, walking, doing exercising. Above 60 years use only walking
and doing exercising.
[46]
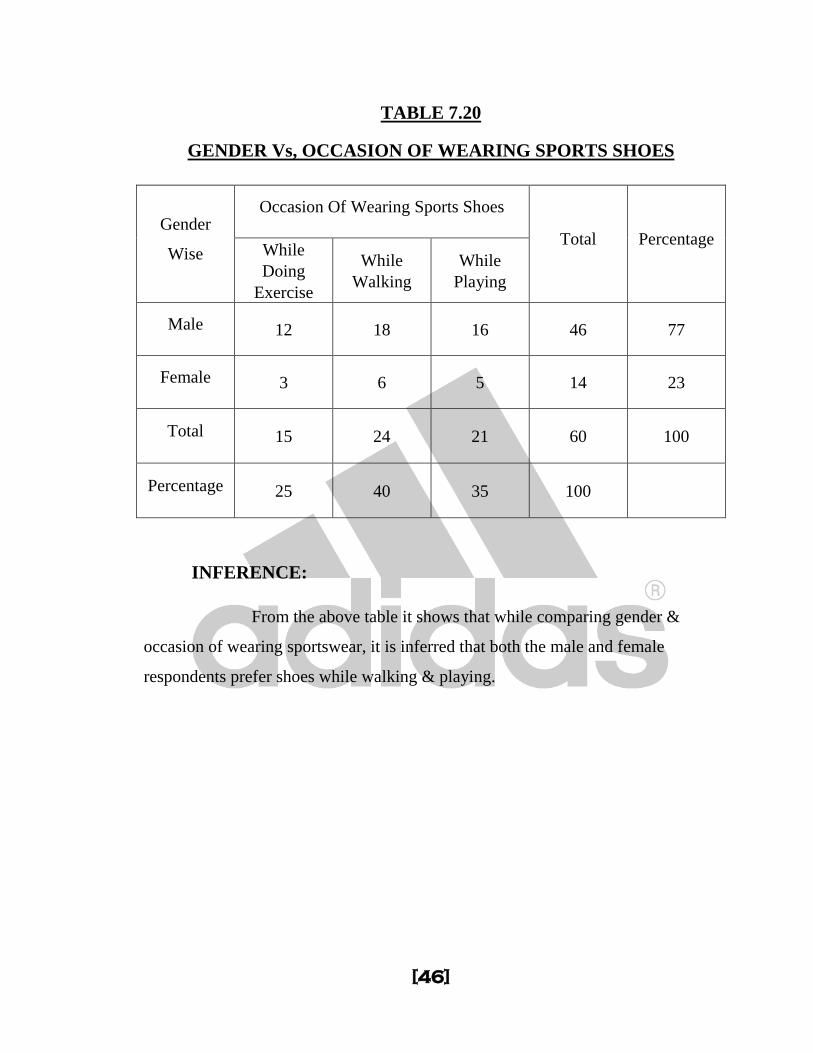
TABLE 7.20
GENDER Vs, OCCASION OF WEARING SPORTS SHOES
Gender
Wise
Occasion Of Wearing Sports Shoes
Total Percentage While
Doing
Exercise
While
Walking
While
Playing
Male 12 18 16 46 77
Female 3 6 5 14 23
Total 15 24 21 60 100
Percentage 25 40 35 100
INFERENCE:
From the above table it shows that while comparing gender &
occasion of wearing sportswear, it is inferred that both the male and female
respondents prefer shoes while walking & playing.
[47]
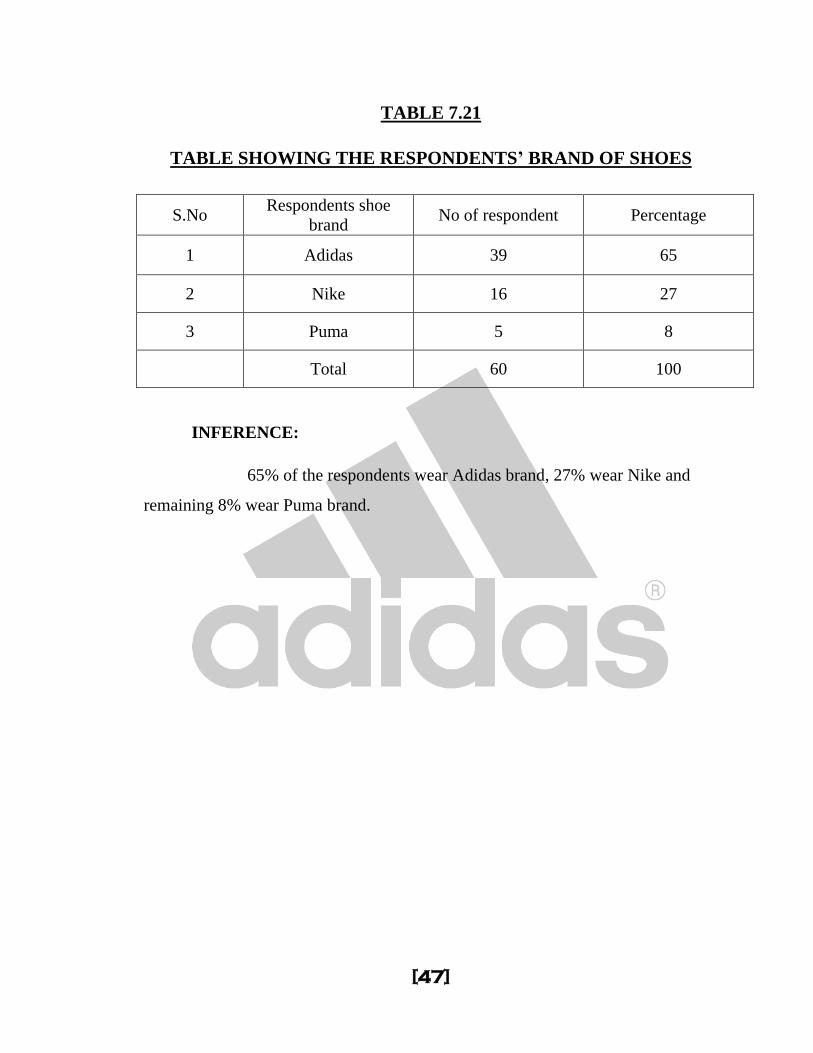
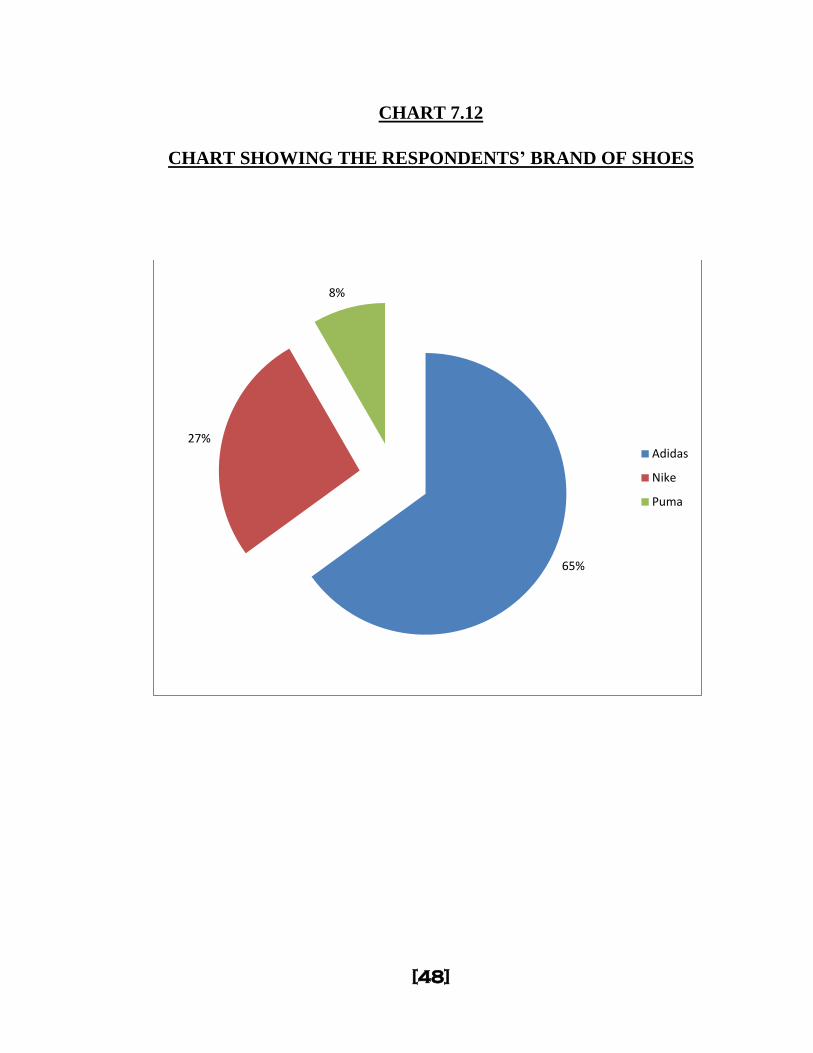
TABLE 7.21
TABLE SHOWING THE RESPONDENTS’ BRAND OF SHOES
INFERENCE:
65% of the respondents wear Adidas brand, 27% wear Nike and
remaining 8% wear Puma brand.
S.No Respondents shoe
brand No of respondent Percentage
1 Adidas 39 65
2 Nike 16 27
3 Puma 5 8
Total 60 100
[48]
CHART 7.12
CHART SHOWING THE RESPONDENTS’ BRAND OF SHOES
65%
27%
8%
Adidas
Nike
Puma
[49]
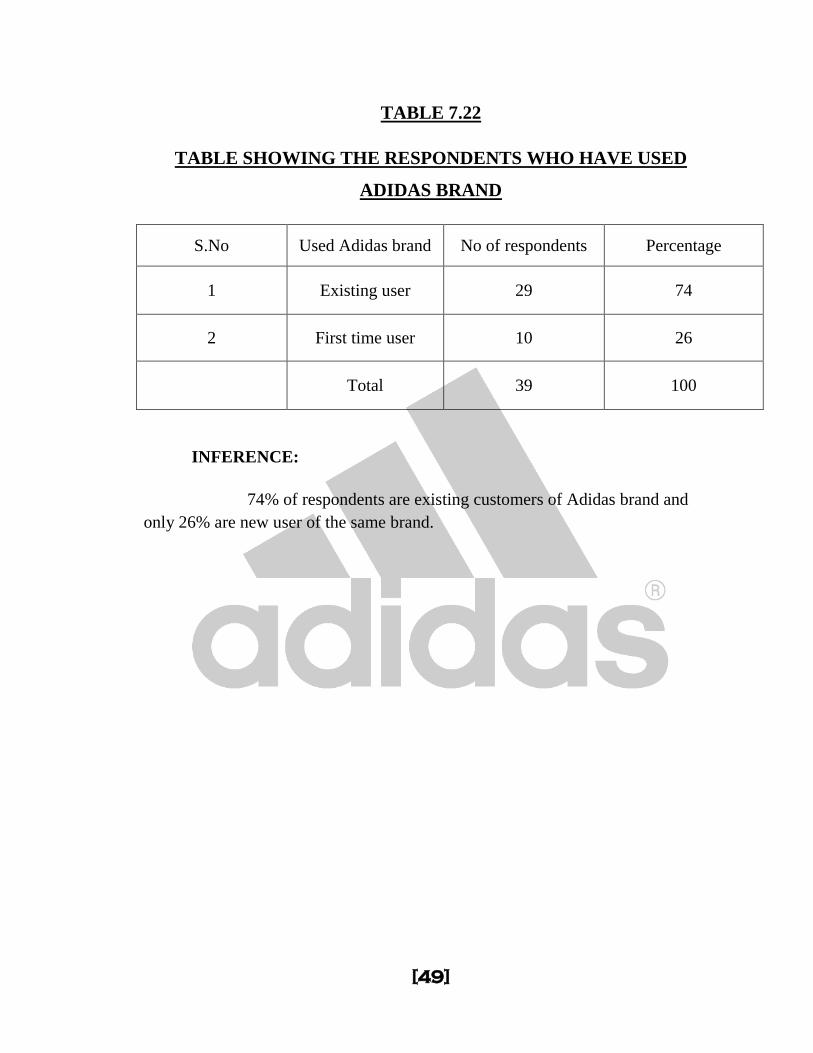
TABLE 7.22
TABLE SHOWING THE RESPONDENTS WHO HAVE USED
ADIDAS BRAND
S.No Used Adidas brand No of respondents Percentage
1 Existing user 29 74
2 First time user 10 26
Total 39 100
INFERENCE:
74% of respondents are existing customers of Adidas brand and
only 26% are new user of the same brand.
[50]
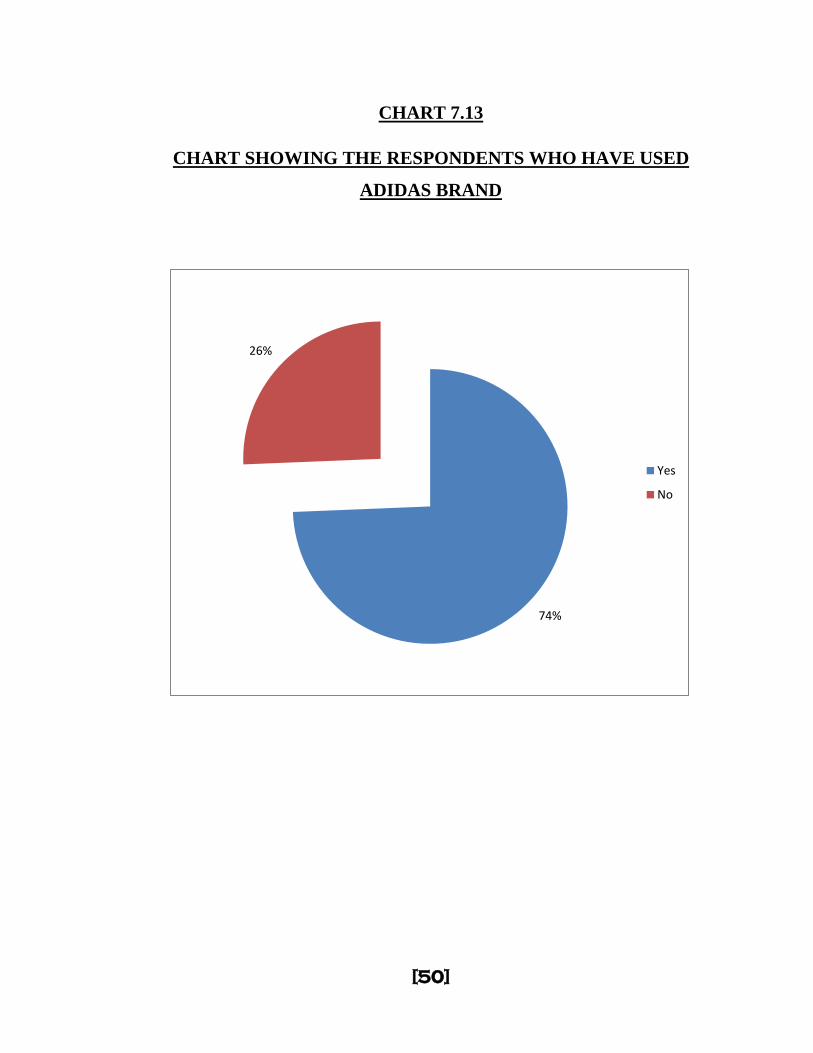
CHART 7.13
CHART SHOWING THE RESPONDENTS WHO HAVE USED
ADIDAS BRAND
74%
26%
Yes
No
[51]
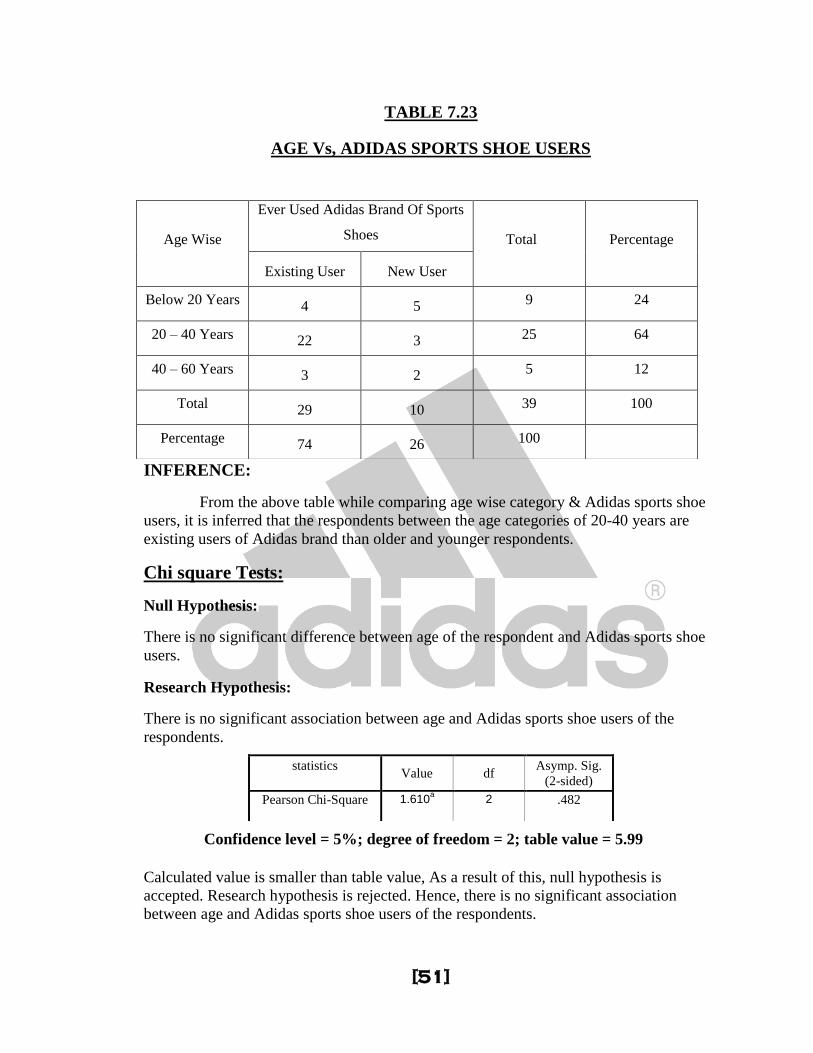
TABLE 7.23
AGE Vs, ADIDAS SPORTS SHOE USERS
INFERENCE:
From the above table while comparing age wise category & Adidas sports shoe
users, it is inferred that the respondents between the age categories of 20-40 years are
existing users of Adidas brand than older and younger respondents.
Chi square Tests:
Null Hypothesis:
There is no significant difference between age of the respondent and Adidas sports shoe
users.
Research Hypothesis:
There is no significant association between age and Adidas sports shoe users of the
respondents.
Confidence level = 5%; degree of freedom = 2; table value = 5.99
Calculated value is smaller than table value, As a result of this, null hypothesis is
accepted. Research hypothesis is rejected. Hence, there is no significant association
between age and Adidas sports shoe users of the respondents.
Age Wise
Ever Used Adidas Brand Of Sports
Shoes Total Percentage
Existing User New User
Below 20 Years 4 5 9 24
20 – 40 Years 22 3 25 64
40 – 60 Years 3 2 5 12
Total 29 10 39 100
Percentage 74 26 100
statistics
Value df
Asymp. Sig.
(2-sided)
Pearson Chi-Square 1.610a 2 .482
[52]
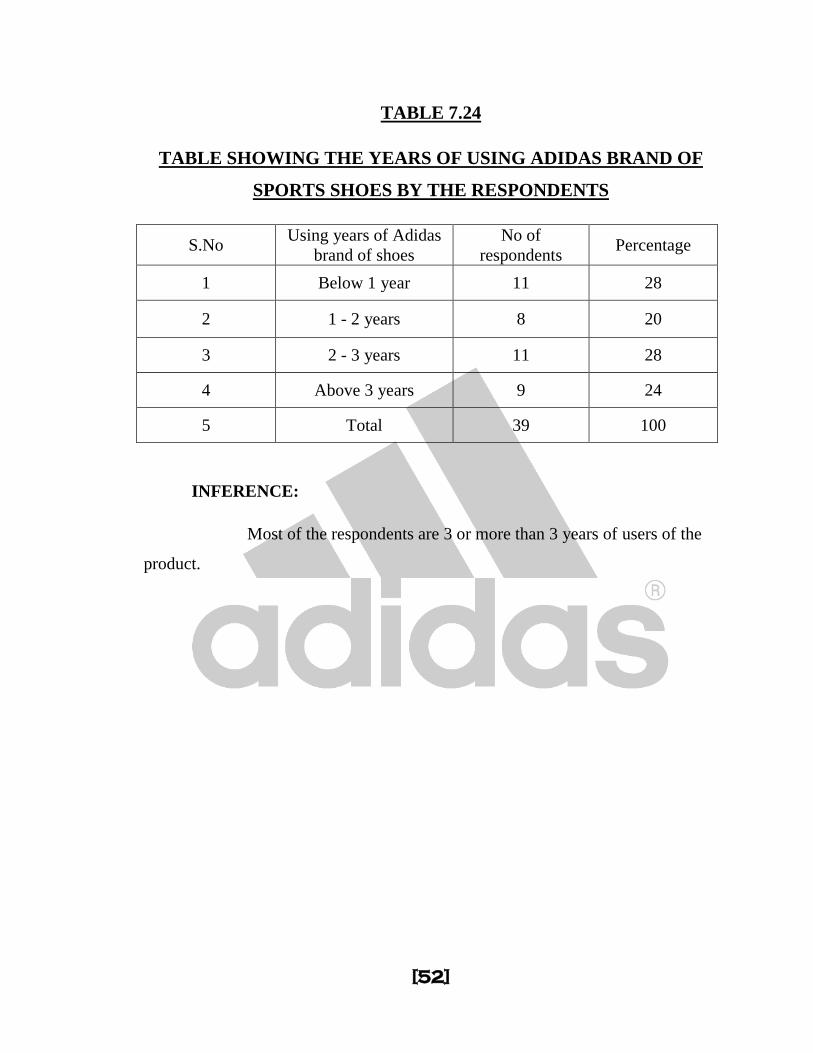
TABLE 7.24
TABLE SHOWING THE YEARS OF USING ADIDAS BRAND OF
SPORTS SHOES BY THE RESPONDENTS
S.No Using years of Adidas
brand of shoes
No of
respondents Percentage
1 Below 1 year 11 28
2 1 - 2 years 8 20
3 2 - 3 years 11 28
4 Above 3 years 9 24
5 Total 39 100
INFERENCE:
Most of the respondents are 3 or more than 3 years of users of the
product.
[53]
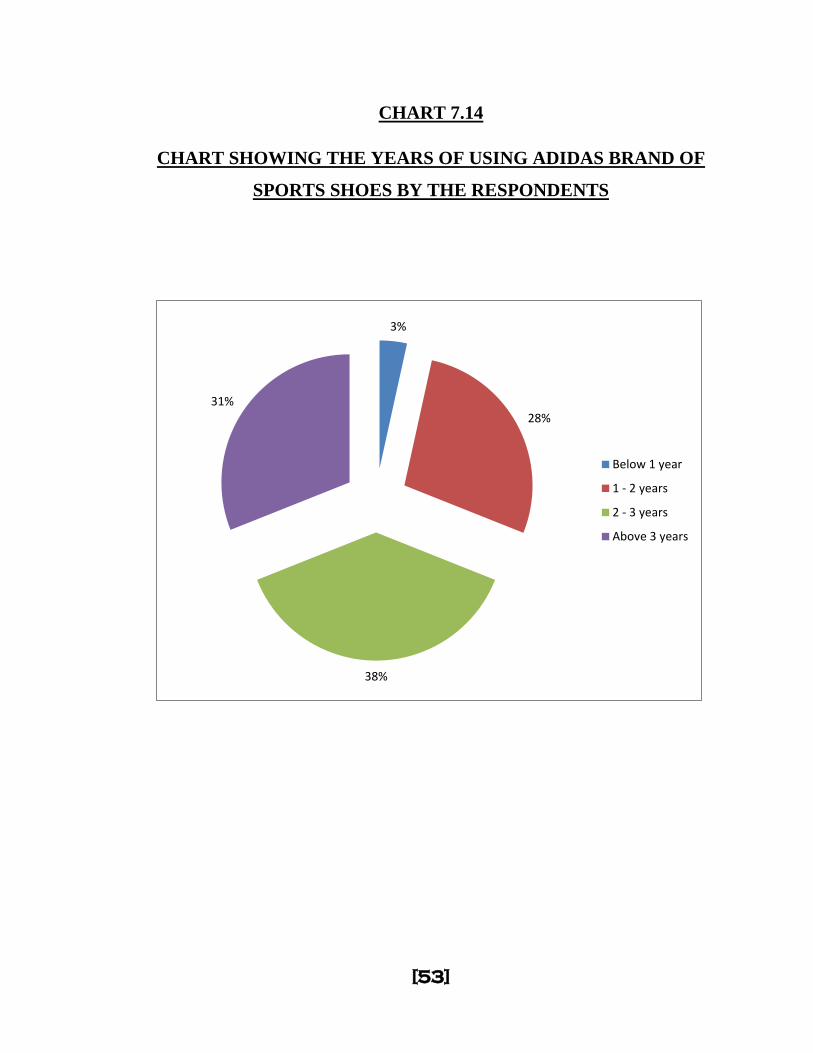
CHART 7.14
CHART SHOWING THE YEARS OF USING ADIDAS BRAND OF
SPORTS SHOES BY THE RESPONDENTS
3%
28%
38%
31%
Below 1 year
1 - 2 years
2 - 3 years
Above 3 years
[54]
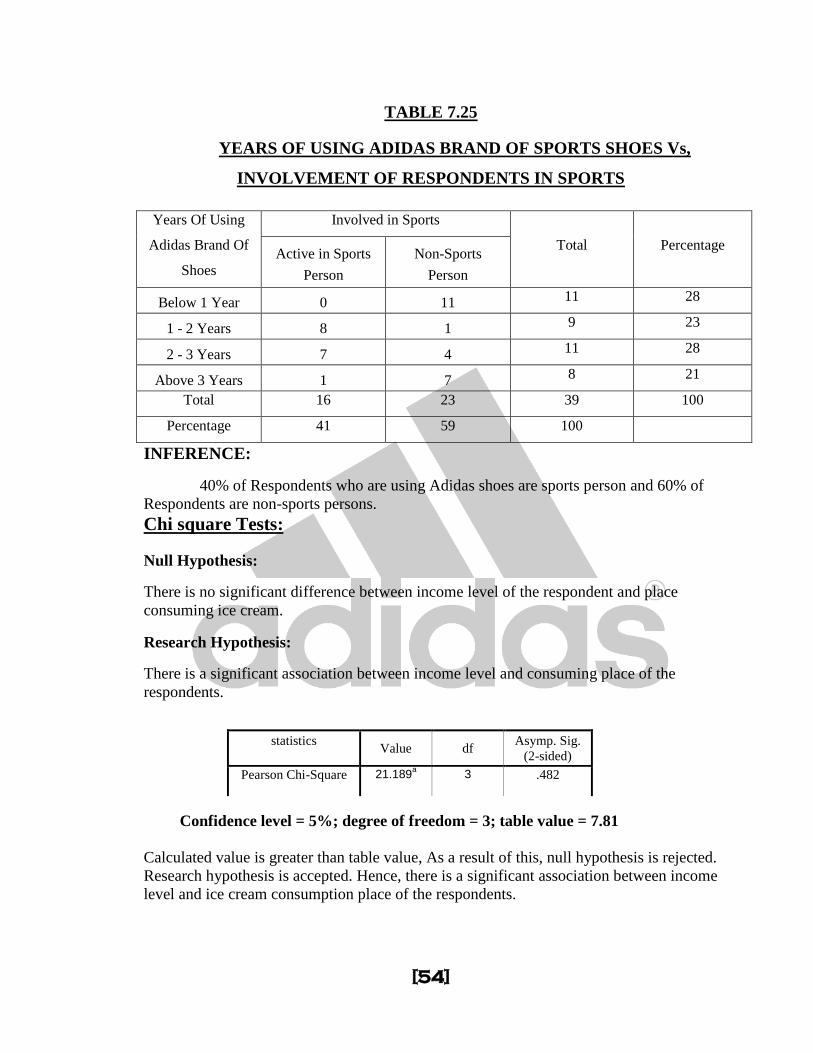
TABLE 7.25
YEARS OF USING ADIDAS BRAND OF SPORTS SHOES Vs,
INVOLVEMENT OF RESPONDENTS IN SPORTS
Years Of Using
Adidas Brand Of
Shoes
Involved in Sports
Total Percentage Active in Sports
Person
Non-Sports
Person
Below 1 Year 0 11 11 28
1 - 2 Years 8 1 9 23
2 - 3 Years 7 4 11 28
Above 3 Years 1 7 8 21
Total 16 23 39 100
Percentage 41 59 100
INFERENCE:
40% of Respondents who are using Adidas shoes are sports person and 60% of
Respondents are non-sports persons.
Chi square Tests:
Null Hypothesis:
There is no significant difference between income level of the respondent and place
consuming ice cream.
Research Hypothesis:
There is a significant association between income level and consuming place of the
respondents.
statistics
Value df
Asymp. Sig.
(2-sided)
Pearson Chi-Square 21.189a 3 .482
Confidence level = 5%; degree of freedom = 3; table value = 7.81
Calculated value is greater than table value, As a result of this, null hypothesis is rejected.
Research hypothesis is accepted. Hence, there is a significant association between income
level and ice cream consumption place of the respondents.
[55]
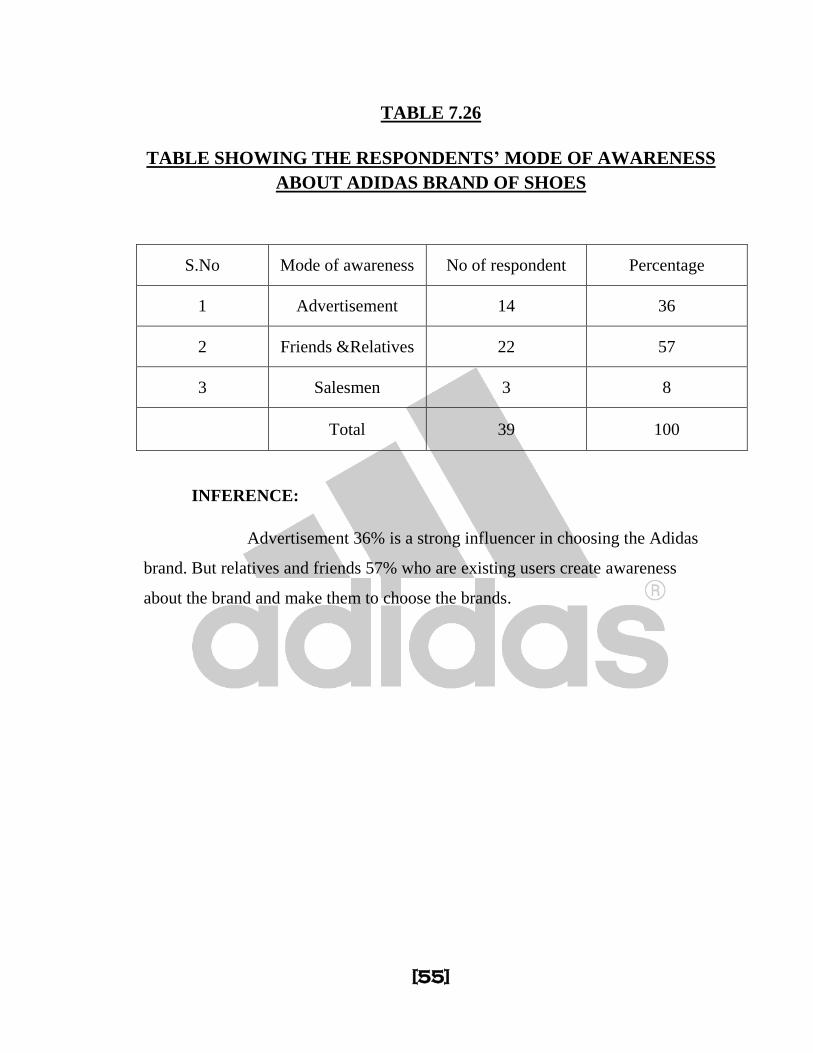
TABLE 7.26
TABLE SHOWING THE RESPONDENTS’ MODE OF AWARENESS
ABOUT ADIDAS BRAND OF SHOES
INFERENCE:
Advertisement 36% is a strong influencer in choosing the Adidas
brand. But relatives and friends 57% who are existing users create awareness
about the brand and make them to choose the brands.
S.No Mode of awareness No of respondent Percentage
1 Advertisement 14 36
2 Friends &Relatives 22 57
3 Salesmen 3 8
Total 39 100
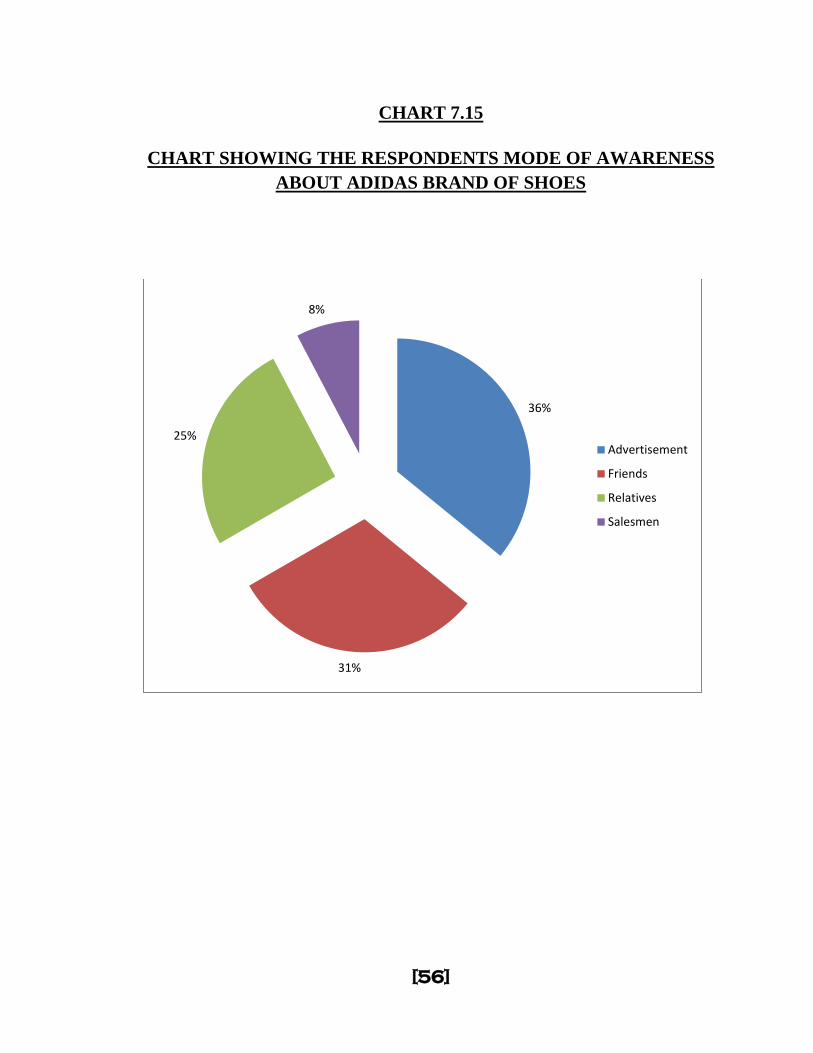
[56]
CHART 7.15
CHART SHOWING THE RESPONDENTS MODE OF AWARENESS
ABOUT ADIDAS BRAND OF SHOES
36%
31%
25%
8%
Advertisement
Friends
Relatives
Salesmen
[57]
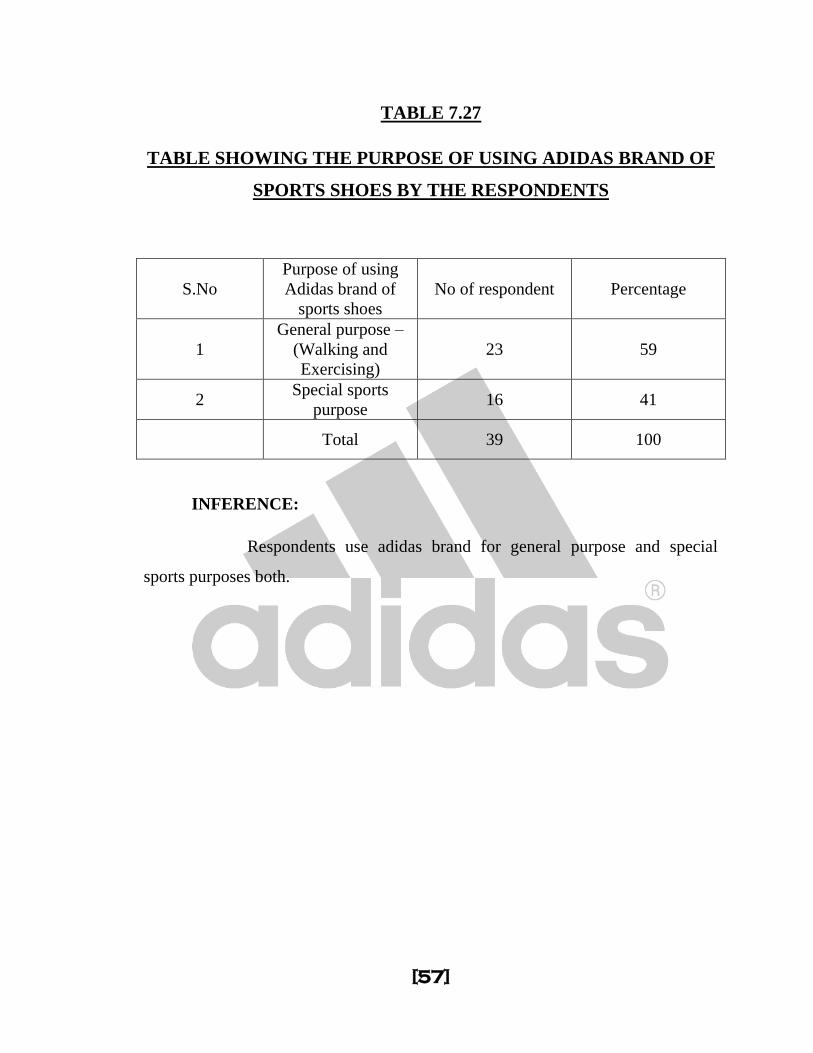
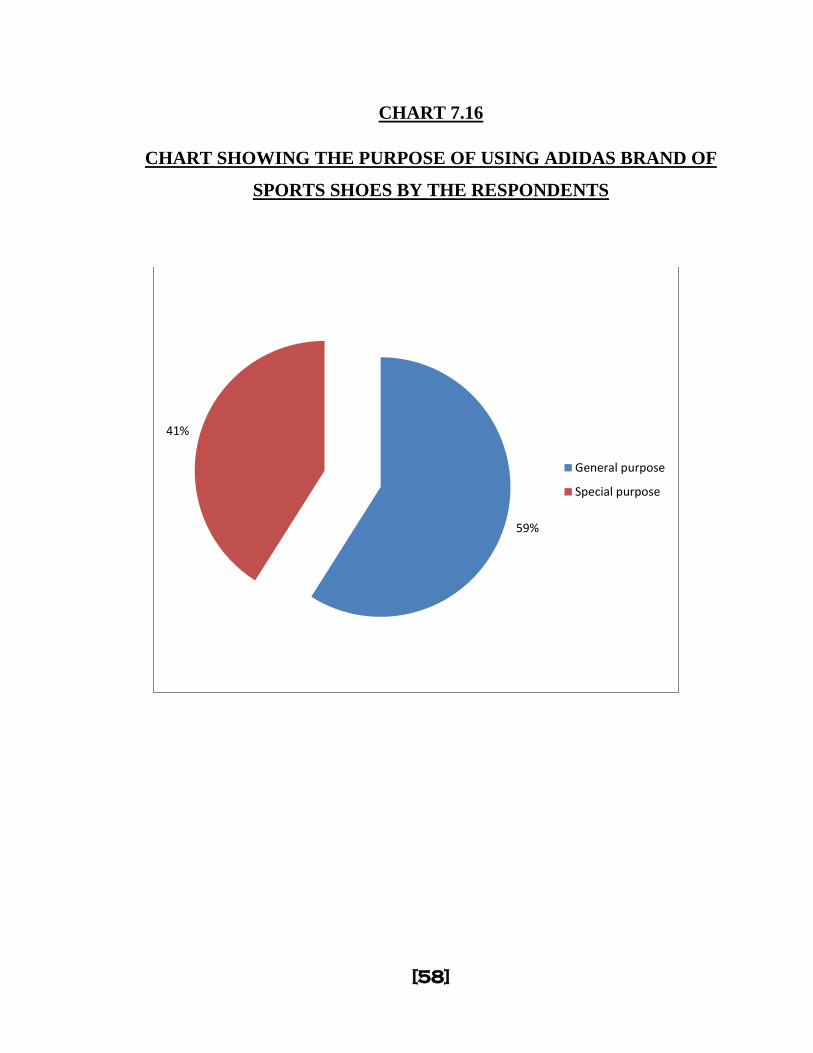
TABLE 7.27
TABLE SHOWING THE PURPOSE OF USING ADIDAS BRAND OF
SPORTS SHOES BY THE RESPONDENTS
S.No
Purpose of using
Adidas brand of
sports shoes
No of respondent Percentage
1
General purpose –
(Walking and
Exercising)
23 59
2 Special sports
purpose 16 41
Total 39 100
INFERENCE:
Respondents use adidas brand for general purpose and special
sports purposes both.
[58]
CHART 7.16
CHART SHOWING THE PURPOSE OF USING ADIDAS BRAND OF
SPORTS SHOES BY THE RESPONDENTS
59%
41%
General purpose
Special purpose
[59]
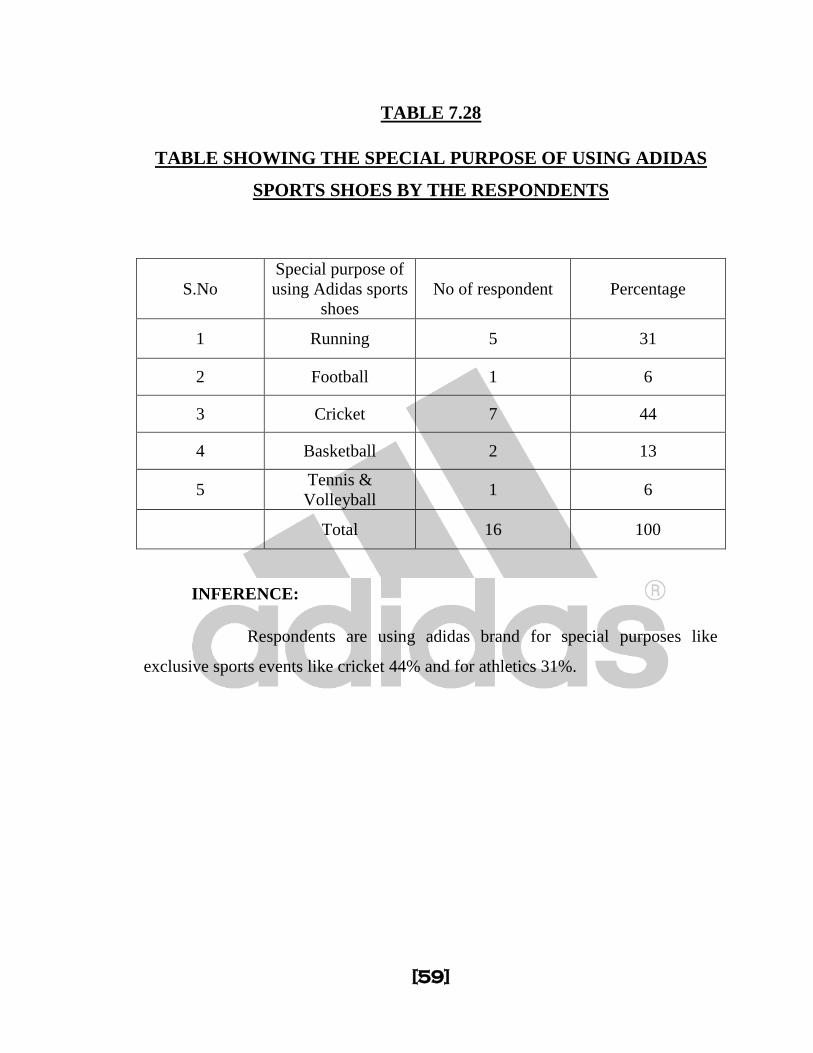
TABLE 7.28
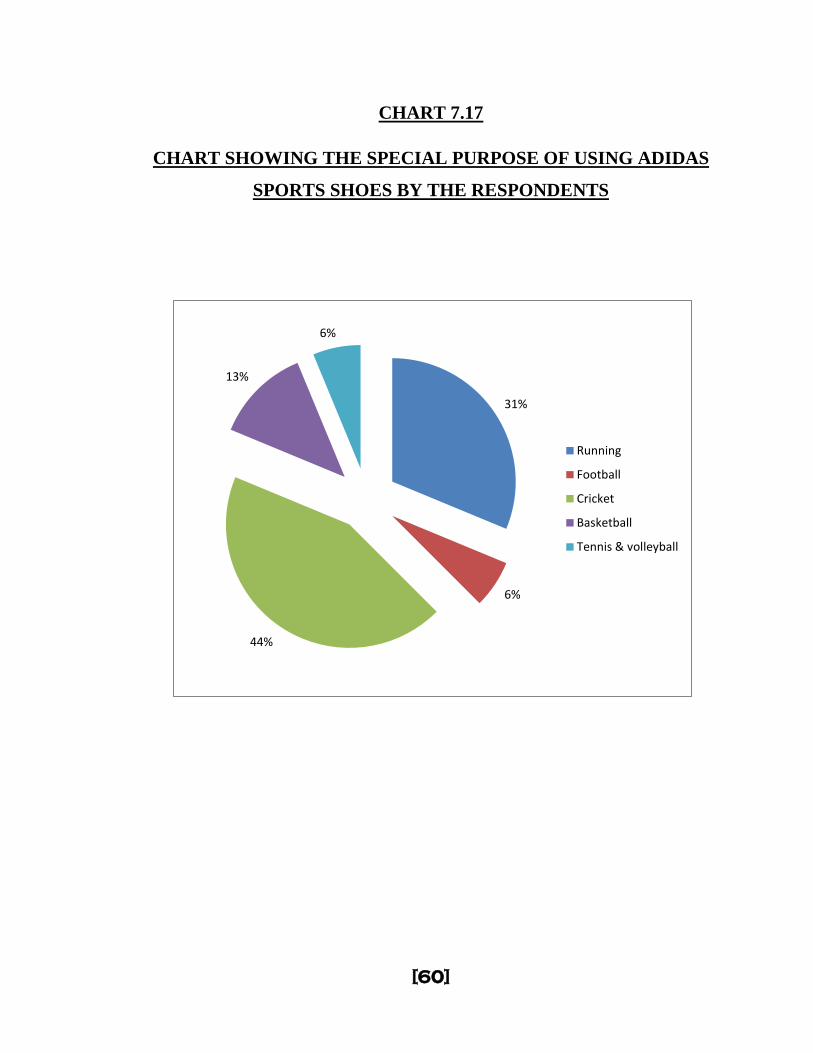
TABLE SHOWING THE SPECIAL PURPOSE OF USING ADIDAS
SPORTS SHOES BY THE RESPONDENTS
S.No
Special purpose of
using Adidas sports
shoes
No of respondent Percentage
1 Running 5 31
2 Football 1 6
3 Cricket 7 44
4 Basketball 2 13
5 Tennis &
Volleyball 1 6
Total 16 100
INFERENCE:
Respondents are using adidas brand for special purposes like
exclusive sports events like cricket 44% and for athletics 31%.
[60]
CHART 7.17
CHART SHOWING THE SPECIAL PURPOSE OF USING ADIDAS
SPORTS SHOES BY THE RESPONDENTS
31%
6%
44%
13%
6%
Running
Football
Cricket
Basketball
Tennis & volleyball
[61]
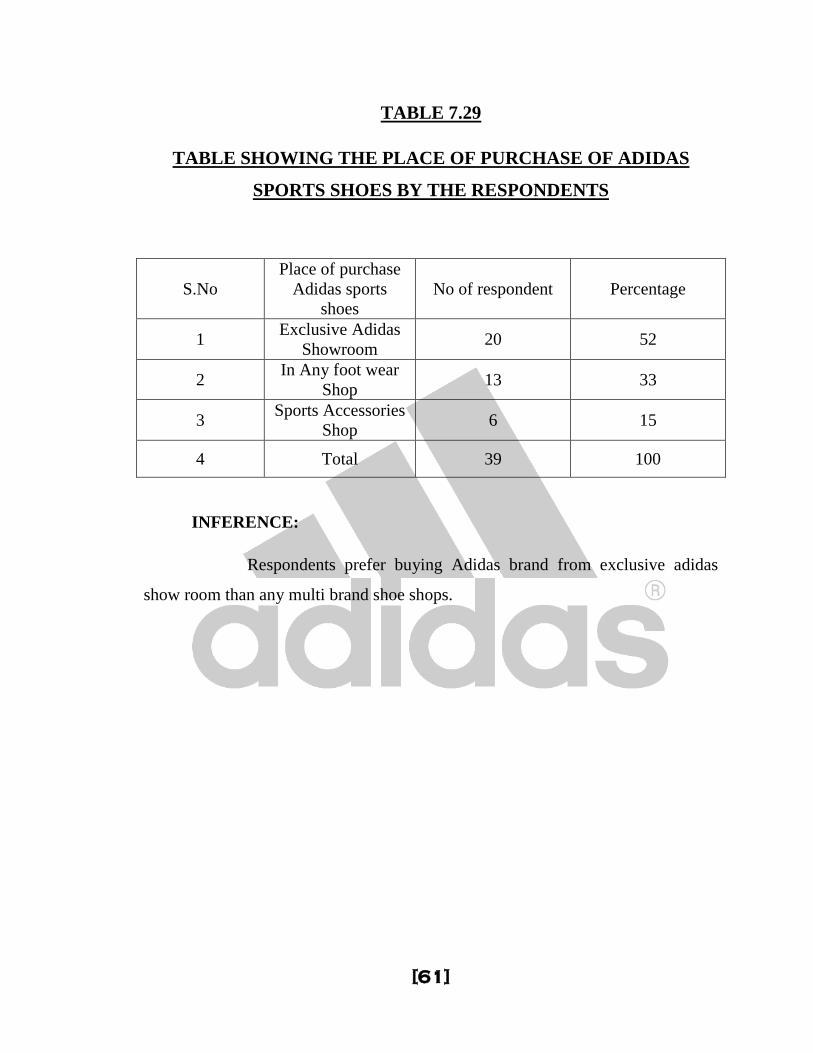
TABLE 7.29
TABLE SHOWING THE PLACE OF PURCHASE OF ADIDAS
SPORTS SHOES BY THE RESPONDENTS
S.No
Place of purchase
Adidas sports
shoes
No of respondent Percentage
1 Exclusive Adidas
Showroom 20 52
2 In Any foot wear
Shop 13 33
3 Sports Accessories
Shop 6 15
4 Total 39 100
INFERENCE:
Respondents prefer buying Adidas brand from exclusive adidas
show room than any multi brand shoe shops.
[62]
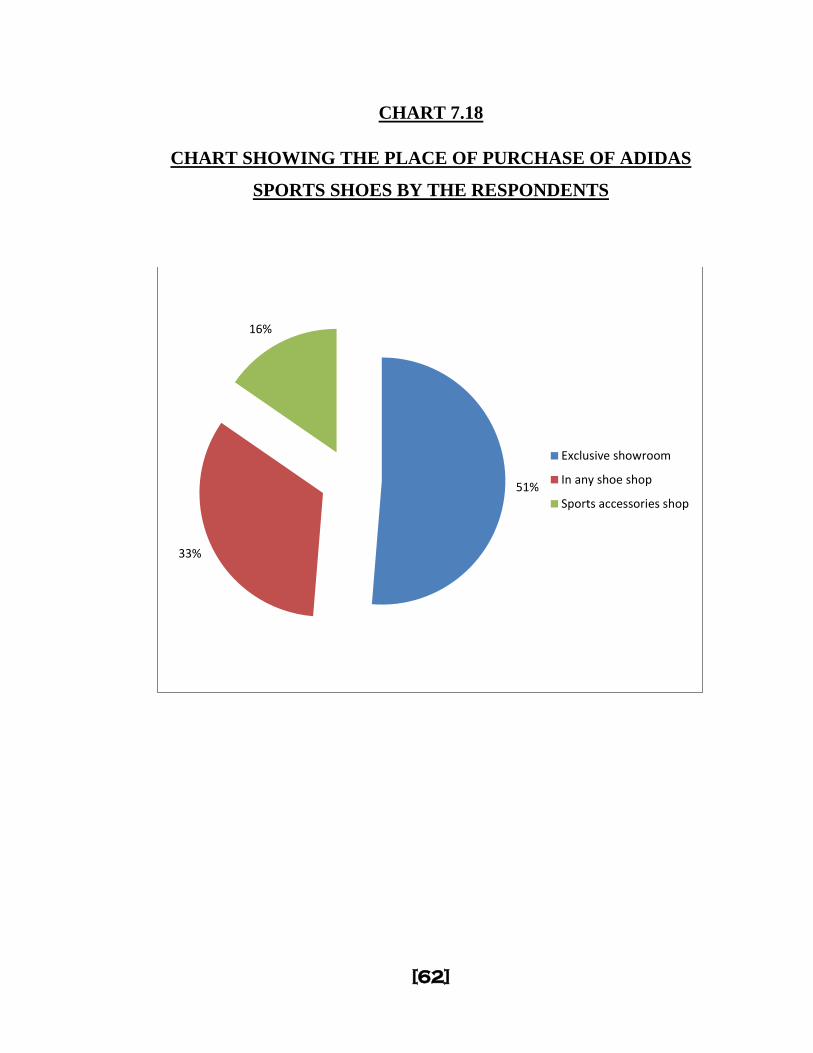
CHART 7.18
CHART SHOWING THE PLACE OF PURCHASE OF ADIDAS
SPORTS SHOES BY THE RESPONDENTS
51%
33%
16%
Exclusive showroom
In any shoe shop
Sports accessories shop
[63]
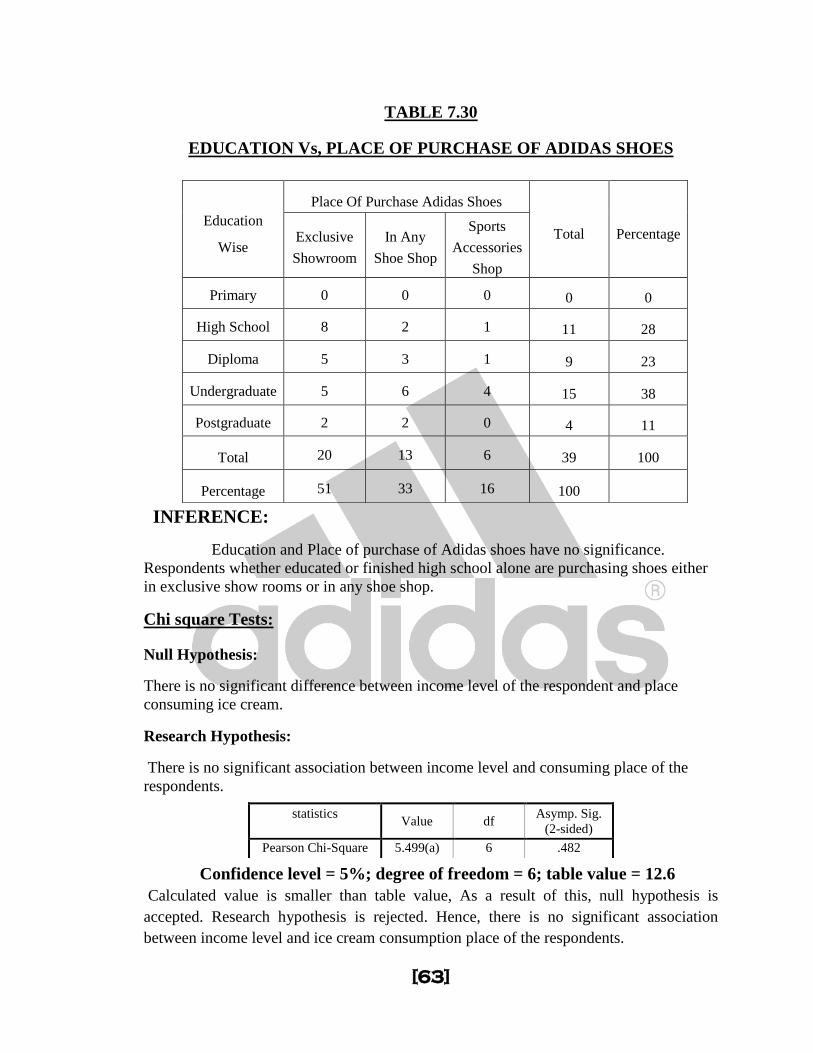
TABLE 7.30
EDUCATION Vs, PLACE OF PURCHASE OF ADIDAS SHOES
INFERENCE:
Education and Place of purchase of Adidas shoes have no significance.
Respondents whether educated or finished high school alone are purchasing shoes either
in exclusive show rooms or in any shoe shop.
Chi square Tests:
Null Hypothesis:
There is no significant difference between income level of the respondent and place
consuming ice cream.
Research Hypothesis:
There is no significant association between income level and consuming place of the
respondents.
Confidence level = 5%; degree of freedom = 6; table value = 12.6
Calculated value is smaller than table value, As a result of this, null hypothesis is
accepted. Research hypothesis is rejected. Hence, there is no significant association
between income level and ice cream consumption place of the respondents.
Education
Wise
Place Of Purchase Adidas Shoes
Total Percentage Exclusive
Showroom
In Any
Shoe Shop
Sports
Accessories
Shop
Primary 0 0 0 0 0
High School 8 2 1 11 28
Diploma 5 3 1 9 23
Undergraduate 5 6 4 15 38
Postgraduate 2 2 0 4 11
Total 20 13 6 39 100
Percentage 51 33 16 100
statistics
Value df
Asymp. Sig.
(2-sided)
Pearson Chi-Square 5.499(a) 6 .482
[64]
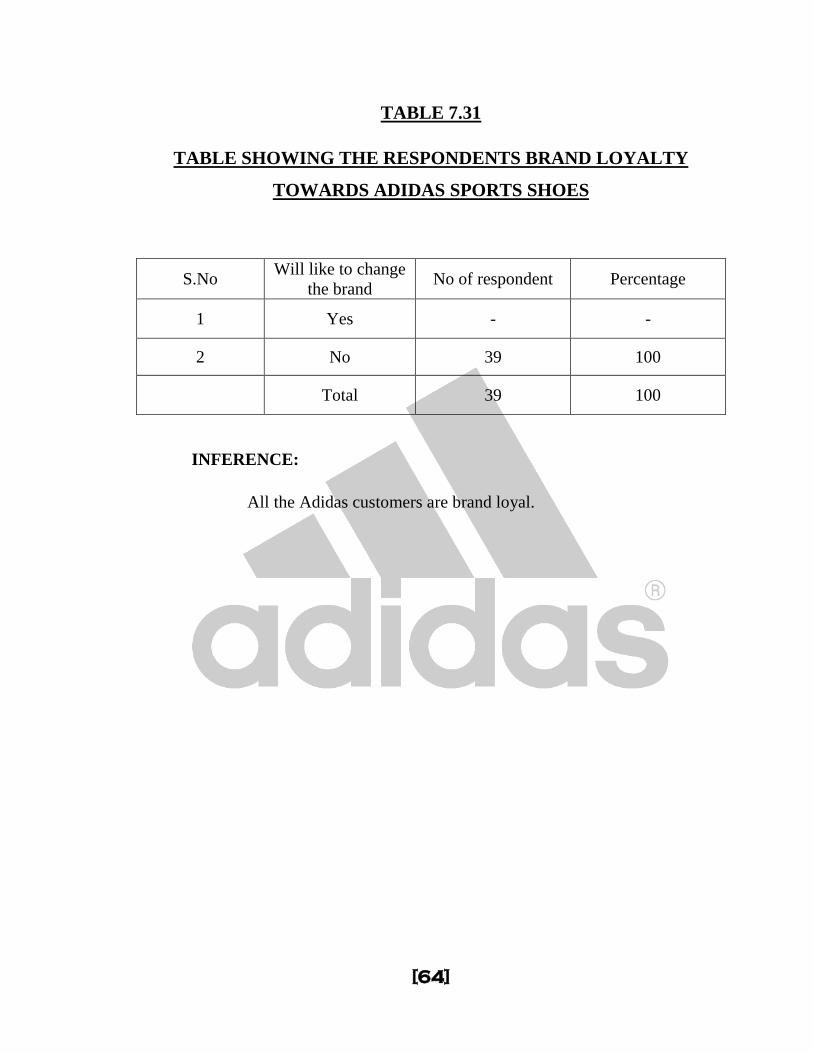
TABLE 7.31
TABLE SHOWING THE RESPONDENTS BRAND LOYALTY
TOWARDS ADIDAS SPORTS SHOES
S.No Will like to change
the brand No of respondent Percentage
1 Yes - -
2 No 39 100
Total 39 100
INFERENCE:
All the Adidas customers are brand loyal.
[65]
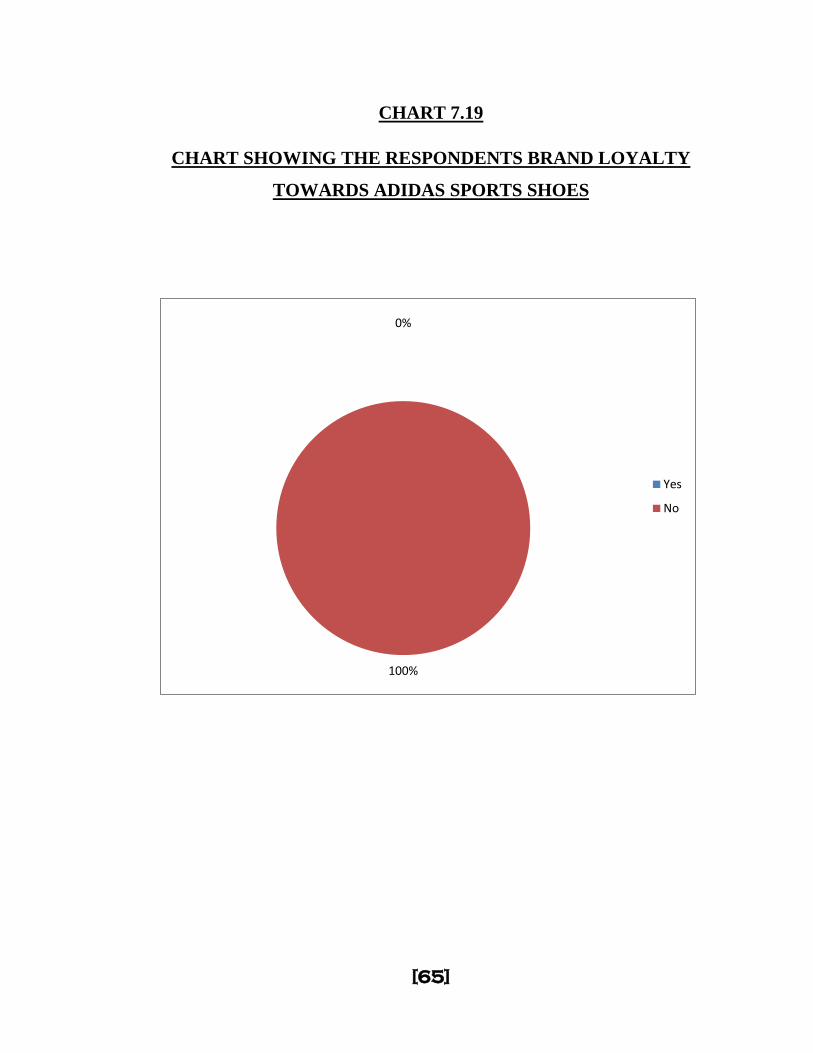
CHART 7.19
CHART SHOWING THE RESPONDENTS BRAND LOYALTY
TOWARDS ADIDAS SPORTS SHOES
0%
100%
Yes
No
[66]
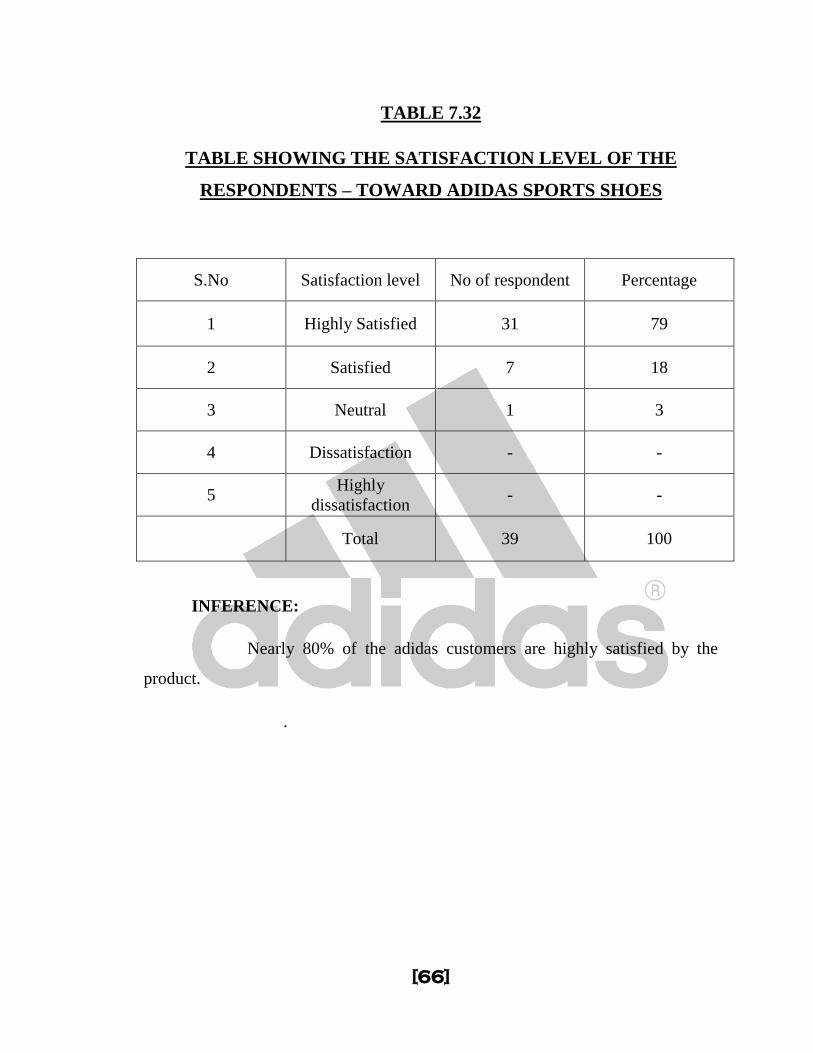
TABLE 7.32
TABLE SHOWING THE SATISFACTION LEVEL OF THE
RESPONDENTS – TOWARD ADIDAS SPORTS SHOES
S.No Satisfaction level No of respondent Percentage
1 Highly Satisfied 31 79
2 Satisfied 7 18
3 Neutral 1 3
4 Dissatisfaction - -
5 Highly
dissatisfaction - -
Total 39 100
INFERENCE:
Nearly 80% of the adidas customers are highly satisfied by the
product.
.
[67]
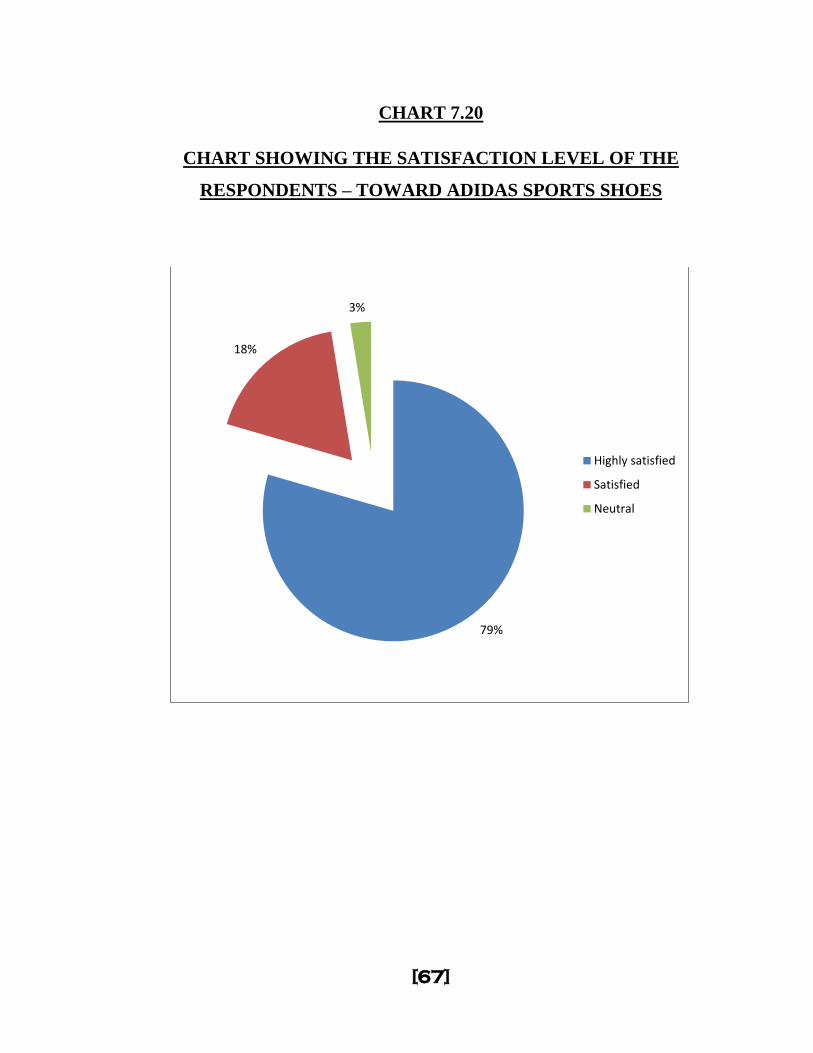
CHART 7.20
CHART SHOWING THE SATISFACTION LEVEL OF THE
RESPONDENTS – TOWARD ADIDAS SPORTS SHOES
79%
18%
3%
Highly satisfied
Satisfied
Neutral
[68]
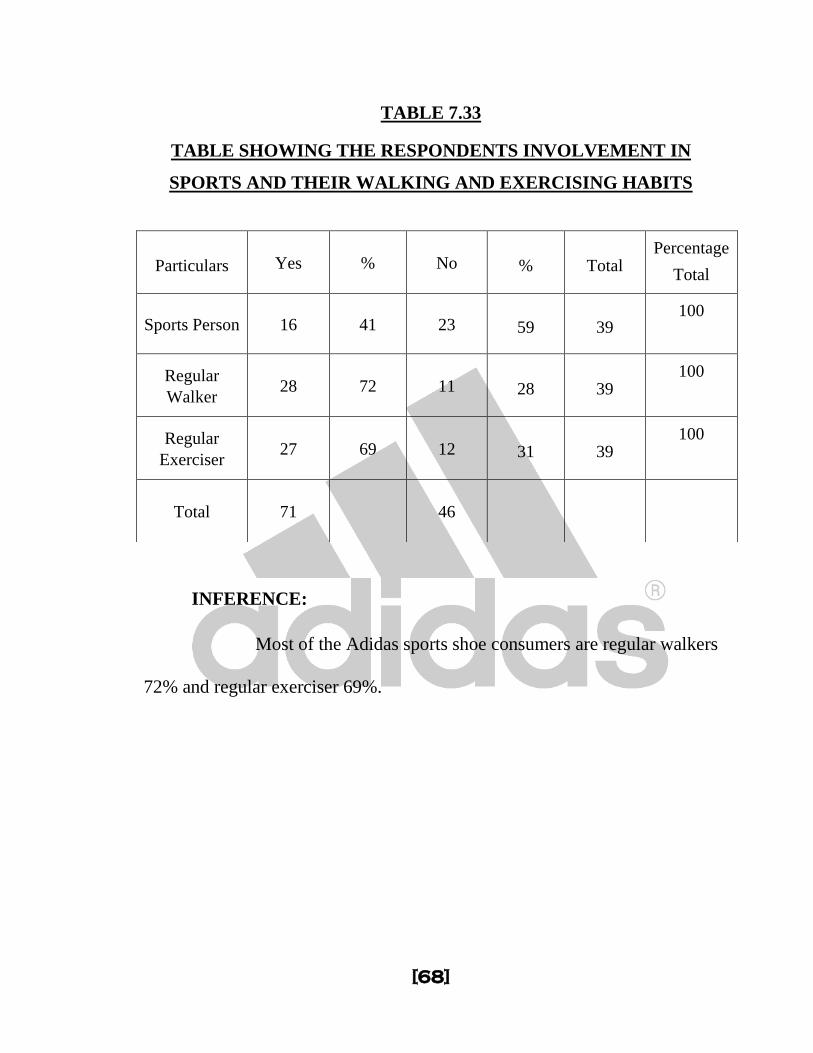
TABLE 7.33
TABLE SHOWING THE RESPONDENTS INVOLVEMENT IN
SPORTS AND THEIR WALKING AND EXERCISING HABITS
INFERENCE:
Most of the Adidas sports shoe consumers are regular walkers
72% and regular exerciser 69%.
Particulars Yes % No % Total Percentage
Total
Sports Person 16 41 23 59 39 100
Regular
Walker 28 72 11 28 39
100
Regular
Exerciser 27 69 12 31 39
100
Total 71 46
[69]
FINDINGS
Brand name is a strong reason for choosing a particular brand of shoe.
Adidas is mainly used for its brand name and its quality.
Out of 60 people who are surveyed, only 37% are sports persons.
50% of the women respondents are sports person
Students are very active in sports when compared to other professionals,
government employees & businessmen.
Most of the respondents are cricket players as it is one of the major sporting
events in India.
Most of the respondents inferred that they are regular walker.
Most of the respondents have habit of walking, especially professionals
have more interest in walking.
Most of the respondents are regular in doing exercise.
As age increases the respondents do have interest in exercising regularly.
Most of the women respondents are in active exerciser.
While comparing the occupation & regular category, it is inferred that
professionals are regular in exercise.
Most of the respondents like to wear the sports shoes while walking.
Below 20 years of age respondents are use shoes only for playing, 20-40
years of age respondents are using shoes while playing, walking, doing
exercising. Above 60 years of age respondents are using shoes only
walking and doing exercising.
While comparing gender & occasion of wearing sportswear, it is inferred
that both the male and female respondents preferring shoes while walking
& playing.
65% of the respondents wear Adidas brand, 27% wear Nike and remaining
8% wear Puma brand.
Most of respondents are existing customers of Adidas brand.
[70]
While comparing age wise category & Adidas sports shoe users, it is
inferred that the respondents between the age categories of 20-40 years are
existing users of Adidas brand than older and younger respondents.
Most of the respondents are 3 or more than 3 years of users of the product.
40% of respondents who are using Adidas shoes are sports person and 60%
of Respondents are non-sports persons.
Most of the respondents are influenced by the advertisement for choosing
the Adidas brand.
Respondents use adidas brand for general purpose and special sports
purposes both.
Most of the respondents are using adidas brand for special purposes like
exclusive sports events like cricket.
Most of the respondents are prefer buying Adidas brand from exclusive
adidas show room than any multi brand shoe shops.
Education and Place of purchase of Adidas shoes have no significance.
Respondents whether educated or finished high school alone are purchasing
shoes either in exclusive show rooms or in any shoe shop.
All the Adidas customers are brand loyal.
Most of the adidas customers are highly satisfied by the product.
Most of the Adidas sports shoe consumers are regular walkers and regular
exerciser.
[71]
SUGGESTIONS
The Adidas group can arrange for product demonstration selected places like,
walkers club, sports stadium, sports academy, sports department or physical
education department in educational institutions to promote the product to
exclusive category of users.
Adidas can sponsor major sporting events in the city to create more awareness
about the product and also to penetrate the market.
If Adidas wants to reach a family, first awareness should be created among the
women folk of the family. Women, who love to do exercise, walk and play can
be reached through women’s club as present day healthy living is a concept
which is fast catching up.
Children can be reached through catchy Advertisement, Contest, etc sponsored
by Adidas.
[72]
CONCLUSION
Sports energize individuals. Sports accessories are one of the markets
which are yet too explored. Sports wears, accessories. Shoes are all becoming
necessary products for human being nowadays. As many people are nowadays
adopting or like to adopt healthy lifestyle by playing, dancing and exercising.
Adidas being a MNC can further penetrate the market and can gain more. Their
products being high in quality and durability can help India in achieving its dream
of medals in all major sporting events and India being one of the highly populated
countries, the company can merchandise its wares in all sectors and can have
sizeable profit through sales.
[73]
BIBLIOGRAPHY
Reference Book:
1) Kothari C.R.
Research Methodology
2) Philip Kotlar.
Marketing Management
Website used:
1) www.in.adidas group.com
2) www.in.kalyani square.com
3) www.adidas.org
[74]
A STUDY ON FACTORS INFLUENCING BRAND DECISION OF
SPORTS SHOES WITH SPECIAL REFERENCE TO ADIDAS
SPORTS SHOES OF KALYANI SQUARE
QUESTIONNAIRES
Tick ( ) your choice
1. Name: ___________________________
2. Gender
a) Male ( ) b) Female ( )
3. Age
a) Less than 20 years ( ) b) 20 – 40 years ( )
c) 40 – 60 years ( ) d) More than 60 years ( )
4. Education level
a) Primary ( ) b) High School ( )
c) Diploma ( ) d) Undergraduate ( ) e) Postgraduate ( )
5. Occupation
a) Student ( ) b) Business man ( )
c) Government ( ) d) Professional ( ) e) others, specify______________
6. Income level per Month
a) Below 10000 ( ) b) 10001- 20000 ( )
c) 20001- 30000 ( ) d) 30001- 40000 ( ) e) above 40000 ( )
[75]
7. Reason for using your brand of shoes?
a) Price ( ) b) Brand ( ) c) Models/Size/Color Availability ( )
d) Quality ( ) e) Durability ( ) f) others specify__________________
8. Are you a Sports Person?
a) Yes ( ) b) No ( )
8. A) If yes, which sports you belong to _________________
9. Are you a regular walker?
a) Yes ( ) b) No ( )
10. Are you interested in regular exercising?
a) Yes ( ) b) No ( )
11. I will wear shoes
a) While doing exercise ( ) b) While walking ( ) c) While playing ( )
e) Others, specify __________________
12. Which brand of shoes you are using now?
a) Adidas ( ) b) Nike ( )
c) Puma ( ) d) others, specify _____________________
13. Have you ever used ADIDAS brand?
a) Yes ( ) b) No ( )
13. A) If yes, how many years you are using ADIDAS sports shoes?
a) Below 1 year ( ) b) 1 – 2 years ( )
c) 2 – 3 years ( ) d) above 3 years ( )
[76]
14. How you came to know about ADIDAS brand?
a) Advertisement ( ) b) Friends ( ) c) Relatives ( )
d) Salesmen ( ) e) others, specify __________________
15. Purpose of using ADIDAS sports shoes?
a) General purpose ( ) b) Special purpose ( )
15. B) Mention your special purpose of using ADIDAS sports shoes?
a) Running ( ) b) Football ( ) c) Cricket ( )
d) Basketball ( ) e) Tennis & Volleyball ( ) f) Athletic ( )
16. Where will you purchase ADIDAS shoes?
a) Exclusive showroom ( ) b) In any shoe shop ( )
c) Sports accessories shop ( ) e) others, specify___________________
17. Do you have any idea to switch over to another brand?
a) Yes ( ) b) No ( )
17. A) If yes, which brand specify___________________
18. State your overall satisfaction level toward ADIDAS sports shoes?
a) Highly satisfied ( ) b) Satisfied ( ) c) Neutral ( )
d) Dissatisfied ( ) e) Highly dissatisfied ( )