final 2016 delisting document - epa.gov · 13. bailey’s brook & tribs (ri0007035r-01) ......
TRANSCRIPT
Page 1 of 85
FINAL March 2018
Final 2016 Delisting Document Waterbody Impairments Removed from the Impaired Waters Lists
State of Rhode Island
Department of Environmental Management
Office of Water Resources
March 2018
Page 2 of 85
FINAL March 2018
Table of Contents 1. Clear River (RI0001002R-05D) .............................................................................................. 5
Benthic-Macroinvertebrate Bioassessments ............................................................................ 5
2. Nooseneck River & Tribs (RI0006012R-05) .......................................................................... 7
Enterococcus ........................................................................................................................... 7
3. Boyd Brook (RI0006013R-01) ................................................................................................ 8
Enterococcus ........................................................................................................................... 8
4. Pawtuxet River South Branch (RI0006014R-04B) ............................................................... 11
Enterococcus ......................................................................................................................... 11
5. Cedar Swamp Brook & Tribs (RI0006018R-01) .................................................................. 14
Total Iron ............................................................................................................................... 14
6. Tiogue Lake (RI0006014L-02) ............................................................................................. 18
Mercury in Fish Tissue .......................................................................................................... 18
7. Great Salt Pond, Trim’s Pond and Harbor Pond (RI0010046E-01C) ................................... 19
Fecal coliform ........................................................................................................................ 19
8. Moswansicut Stream (RI0006015R-16) ................................................................................ 22
Escherichia coli (E. coli) ....................................................................................................... 22
9. Greenwich Cove (RI0007025E-05A) .................................................................................... 23
Fecal coliform ........................................................................................................................ 23
10. Woonasquatucket River (RI0002007R-10C) ........................................................................ 28
Benthic-Macroinvertebrate Bioassessments .......................................................................... 28
11. Woonasquatucket River (RI0002007R-10D) ........................................................................ 30
Benthic-Macroinvertebrate Bioassessments .......................................................................... 30
12. Dundery Brook & Tribs (RI0010048R-02C*) ...................................................................... 31
Benthic-Macroinvertebrate Bioassessments .......................................................................... 31
13. Bailey’s Brook & Tribs (RI0007035R-01) ........................................................................... 33
Benthic-Macroinvertebrate Bioassessments .......................................................................... 33
14. Pawcatuck River & Tribs (RI0008039R-18D) ...................................................................... 36
Benthic-Macroinvertebrate Bioassessments .......................................................................... 36
15. Maidford River (RI0007035R-02B)* .................................................................................... 38
Benthic-Macroinvertebrate Bioassessments .......................................................................... 38
Page 3 of 85
FINAL March 2018
METALS DELISTINGS .............................................................................................................. 42
16. Branch River (RI0001002R-01B) ............................................................................. 42
Dissolved Copper (Cu) .............................................................................................. 42
17. Chipuxet River and Tribs (RI0008039R-06B) .......................................................... 46
Dissolved Cadmium (Cd) .......................................................................................... 46
Dissolved Copper (Cu) .............................................................................................. 47
18. Ashaway River & Tribs (RI0008039R-02A) ............................................................ 49
Dissolved Cadmium (Cd) .......................................................................................... 49
19. Pawcatuck River & Tribs (RI0008039R-18E) .......................................................... 50
Total Iron (Fe) ........................................................................................................... 50
20. Perry Healy Brook & Tribs (RI0008039R-19) .......................................................... 53
Dissolved Copper (Cu) .............................................................................................. 53
21. Queens Fort Brook & Tribs (RI0008039R-31B) ...................................................... 54
Dissolved Lead (Pb) .................................................................................................. 54
22. Canonchet Brook & Tribs (RI0008040R-04A) ......................................................... 55
Dissolved Copper (Cu) .............................................................................................. 55
23. Coney Brook & Tribs (RI0008040R-05) .................................................................. 57
Dissolved Copper (Cu) .............................................................................................. 57
24. Wood River & Tribs (RI0008040R-16D) ................................................................. 59
Benthic-Macroinvertebrate Bioassessments & Ambient Bioassays-Chronic Aquatic
Toxicity ..................................................................................................................... 59
25. Canob Brook (RI0008040R-23) ................................................................................ 60
Total Iron (Fe) ........................................................................................................... 60
26. Pawtuxet River Main Stem (RI0006017R-03) .......................................................... 62
Dissolved Cadmium (Cd) .......................................................................................... 62
IMPROPER BIOASSESSMENT IMPAIRMENT LISTINGS .................................................... 67
27. Saugatucket Pond (RI0010045L-01) ......................................................................... 68
28. Valley Falls Pond (RI0001003L-02) ......................................................................... 68
29. Branch River (RI0001002R-01B) ............................................................................. 69
30. Ten Mile River & Tribs (RI0004009R-01B) ............................................................ 69
31. Runnins River & Tribs (RI0007021R-01) ................................................................. 69
32. Blackstone River (RI0001003R-01A) ....................................................................... 70
33. Blackstone River (RI0001003R-01B) ....................................................................... 70
34. Pawtuxet River Main Stem (RI0006017R-03) .......................................................... 71
Page 4 of 85
FINAL March 2018
MT. HOPE BAY TEMPERATURE DELISTING ....................................................................... 72
35. Mt. Hope Bay (RI0007032E-01A) ............................................................................ 72
36. Mt. Hope Bay (RI0007032E-01B) ............................................................................ 72
37. Mt. Hope Bay (RI0007032E-01C) ............................................................................ 72
38. Mt. Hope Bay (RI0007032E-01D) ............................................................................ 72
Page 5 of 85
FINAL March 2018
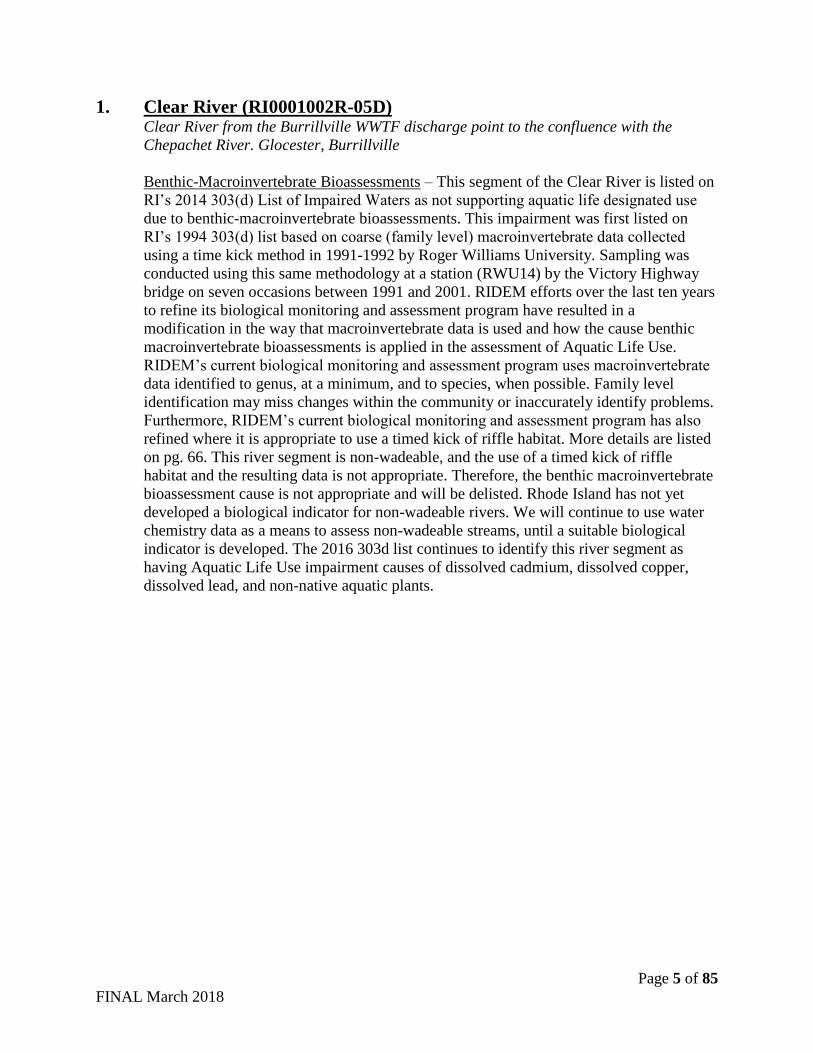
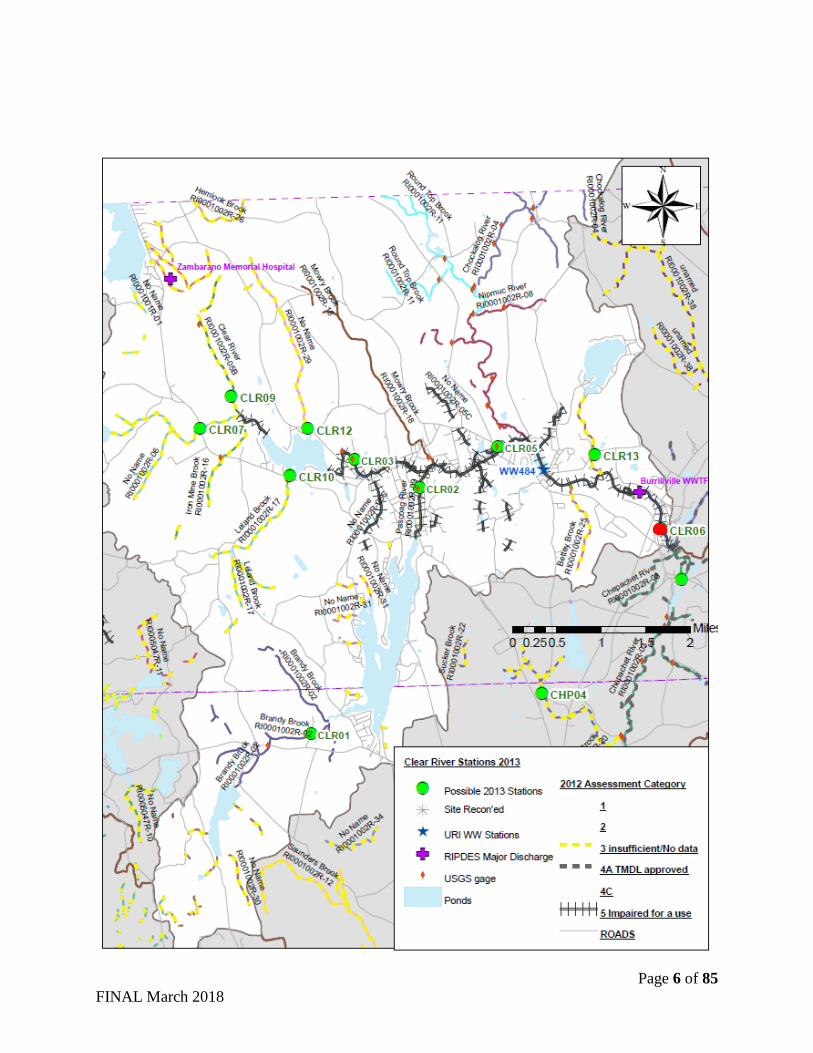
1. Clear River (RI0001002R-05D) Clear River from the Burrillville WWTF discharge point to the confluence with the
Chepachet River. Glocester, Burrillville
Benthic-Macroinvertebrate Bioassessments – This segment of the Clear River is listed on
RI’s 2014 303(d) List of Impaired Waters as not supporting aquatic life designated use
due to benthic-macroinvertebrate bioassessments. This impairment was first listed on
RI’s 1994 303(d) list based on coarse (family level) macroinvertebrate data collected
using a time kick method in 1991-1992 by Roger Williams University. Sampling was
conducted using this same methodology at a station (RWU14) by the Victory Highway
bridge on seven occasions between 1991 and 2001. RIDEM efforts over the last ten years
to refine its biological monitoring and assessment program have resulted in a
modification in the way that macroinvertebrate data is used and how the cause benthic
macroinvertebrate bioassessments is applied in the assessment of Aquatic Life Use.
RIDEM’s current biological monitoring and assessment program uses macroinvertebrate
data identified to genus, at a minimum, and to species, when possible. Family level
identification may miss changes within the community or inaccurately identify problems.
Furthermore, RIDEM’s current biological monitoring and assessment program has also
refined where it is appropriate to use a timed kick of riffle habitat. More details are listed
on pg. 66. This river segment is non-wadeable, and the use of a timed kick of riffle
habitat and the resulting data is not appropriate. Therefore, the benthic macroinvertebrate
bioassessment cause is not appropriate and will be delisted. Rhode Island has not yet
developed a biological indicator for non-wadeable rivers. We will continue to use water
chemistry data as a means to assess non-wadeable streams, until a suitable biological
indicator is developed. The 2016 303d list continues to identify this river segment as
having Aquatic Life Use impairment causes of dissolved cadmium, dissolved copper,
dissolved lead, and non-native aquatic plants.
Page 6 of 85
FINAL March 2018
Page 7 of 85
FINAL March 2018
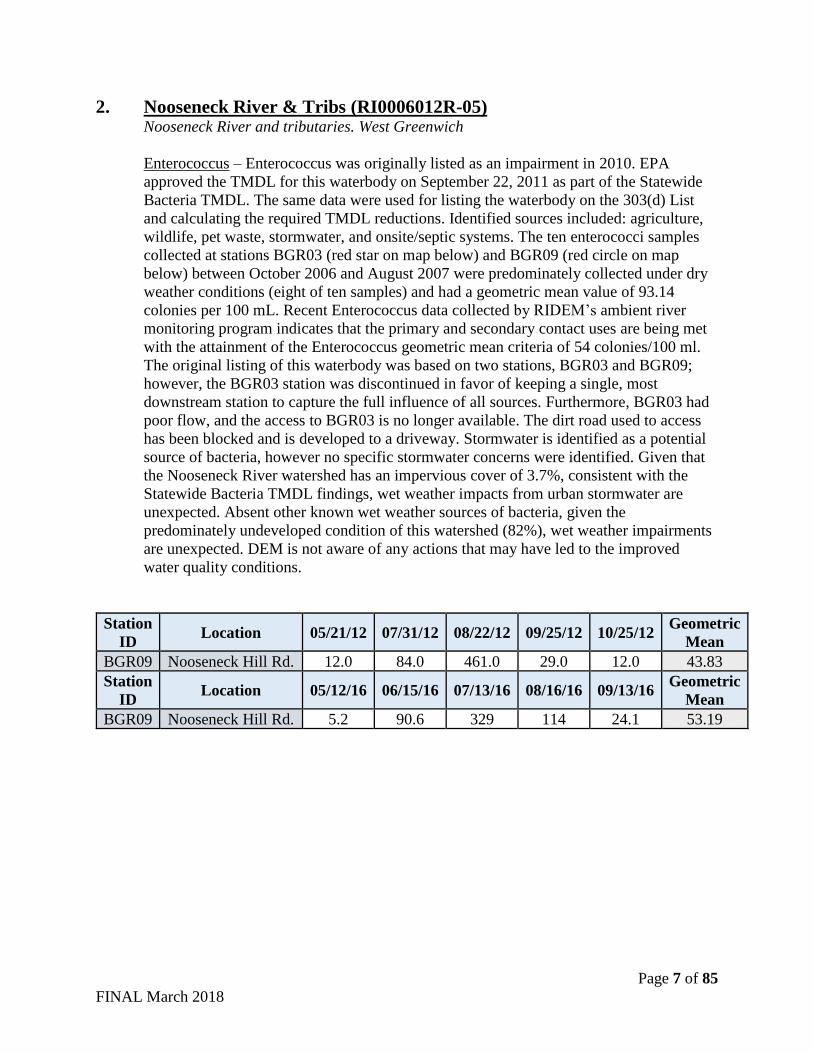
2. Nooseneck River & Tribs (RI0006012R-05) Nooseneck River and tributaries. West Greenwich
Enterococcus – Enterococcus was originally listed as an impairment in 2010. EPA
approved the TMDL for this waterbody on September 22, 2011 as part of the Statewide
Bacteria TMDL. The same data were used for listing the waterbody on the 303(d) List
and calculating the required TMDL reductions. Identified sources included: agriculture,
wildlife, pet waste, stormwater, and onsite/septic systems. The ten enterococci samples
collected at stations BGR03 (red star on map below) and BGR09 (red circle on map
below) between October 2006 and August 2007 were predominately collected under dry
weather conditions (eight of ten samples) and had a geometric mean value of 93.14
colonies per 100 mL. Recent Enterococcus data collected by RIDEM’s ambient river
monitoring program indicates that the primary and secondary contact uses are being met
with the attainment of the Enterococcus geometric mean criteria of 54 colonies/100 ml.
The original listing of this waterbody was based on two stations, BGR03 and BGR09;
however, the BGR03 station was discontinued in favor of keeping a single, most
downstream station to capture the full influence of all sources. Furthermore, BGR03 had
poor flow, and the access to BGR03 is no longer available. The dirt road used to access
has been blocked and is developed to a driveway. Stormwater is identified as a potential
source of bacteria, however no specific stormwater concerns were identified. Given that
the Nooseneck River watershed has an impervious cover of 3.7%, consistent with the
Statewide Bacteria TMDL findings, wet weather impacts from urban stormwater are
unexpected. Absent other known wet weather sources of bacteria, given the
predominately undeveloped condition of this watershed (82%), wet weather impairments
are unexpected. DEM is not aware of any actions that may have led to the improved
water quality conditions.
Station
ID Location 05/21/12 07/31/12 08/22/12 09/25/12 10/25/12
Geometric
Mean
BGR09 Nooseneck Hill Rd. 12.0 84.0 461.0 29.0 12.0 43.83
Station
ID Location 05/12/16 06/15/16 07/13/16 08/16/16 09/13/16
Geometric
Mean
BGR09 Nooseneck Hill Rd. 5.2 90.6 329 114 24.1 53.19
Page 8 of 85
FINAL March 2018
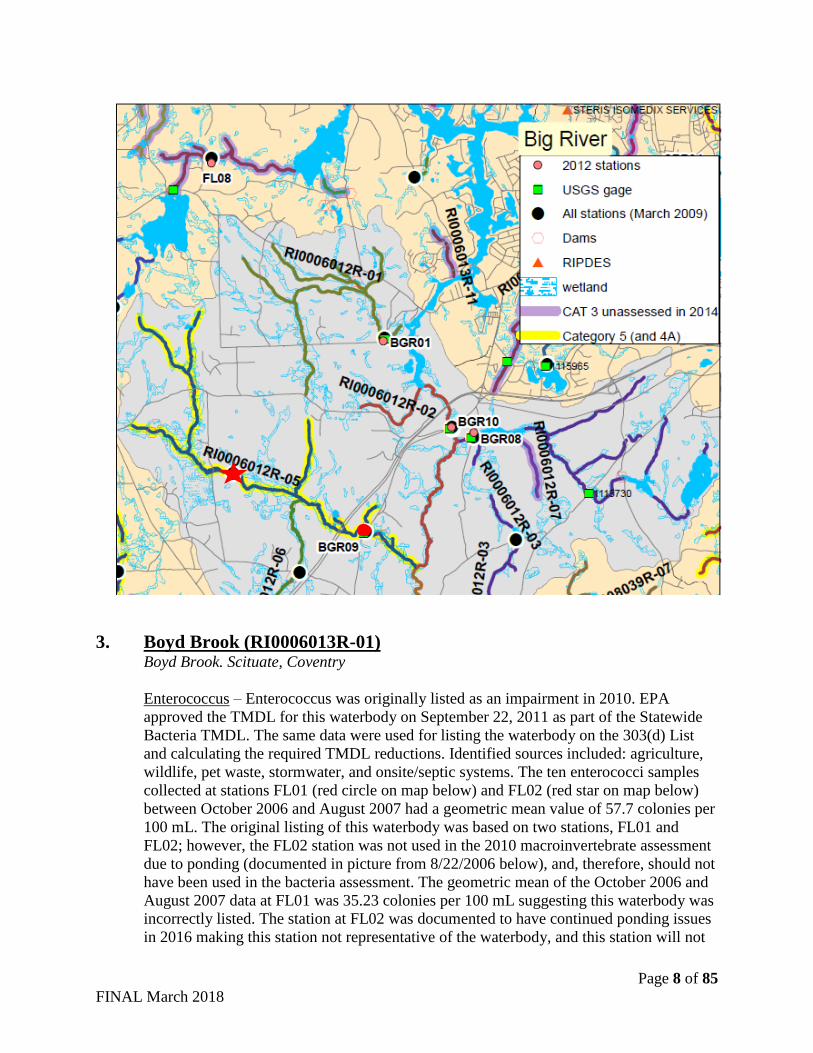
3. Boyd Brook (RI0006013R-01) Boyd Brook. Scituate, Coventry
Enterococcus – Enterococcus was originally listed as an impairment in 2010. EPA
approved the TMDL for this waterbody on September 22, 2011 as part of the Statewide
Bacteria TMDL. The same data were used for listing the waterbody on the 303(d) List
and calculating the required TMDL reductions. Identified sources included: agriculture,
wildlife, pet waste, stormwater, and onsite/septic systems. The ten enterococci samples
collected at stations FL01 (red circle on map below) and FL02 (red star on map below)
between October 2006 and August 2007 had a geometric mean value of 57.7 colonies per
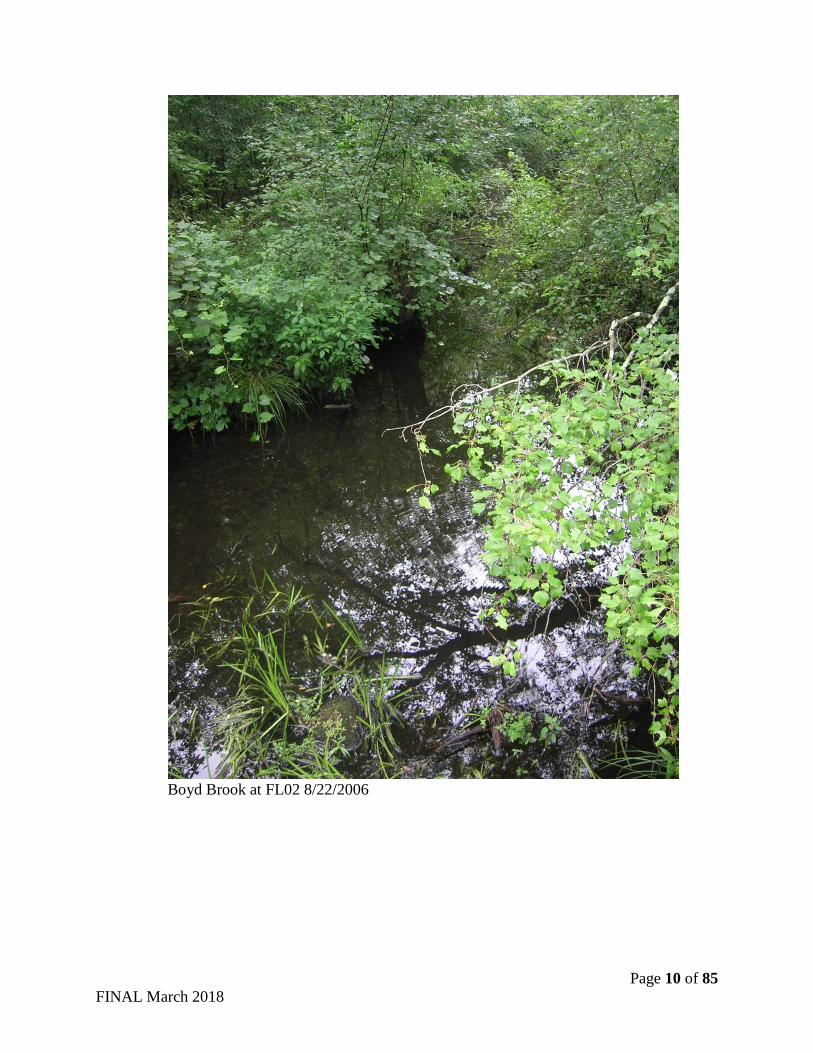
100 mL. The original listing of this waterbody was based on two stations, FL01 and
FL02; however, the FL02 station was not used in the 2010 macroinvertebrate assessment
due to ponding (documented in picture from 8/22/2006 below), and, therefore, should not
have been used in the bacteria assessment. The geometric mean of the October 2006 and
August 2007 data at FL01 was 35.23 colonies per 100 mL suggesting this waterbody was
incorrectly listed. The station at FL02 was documented to have continued ponding issues
in 2016 making this station not representative of the waterbody, and this station will not
Page 9 of 85
FINAL March 2018
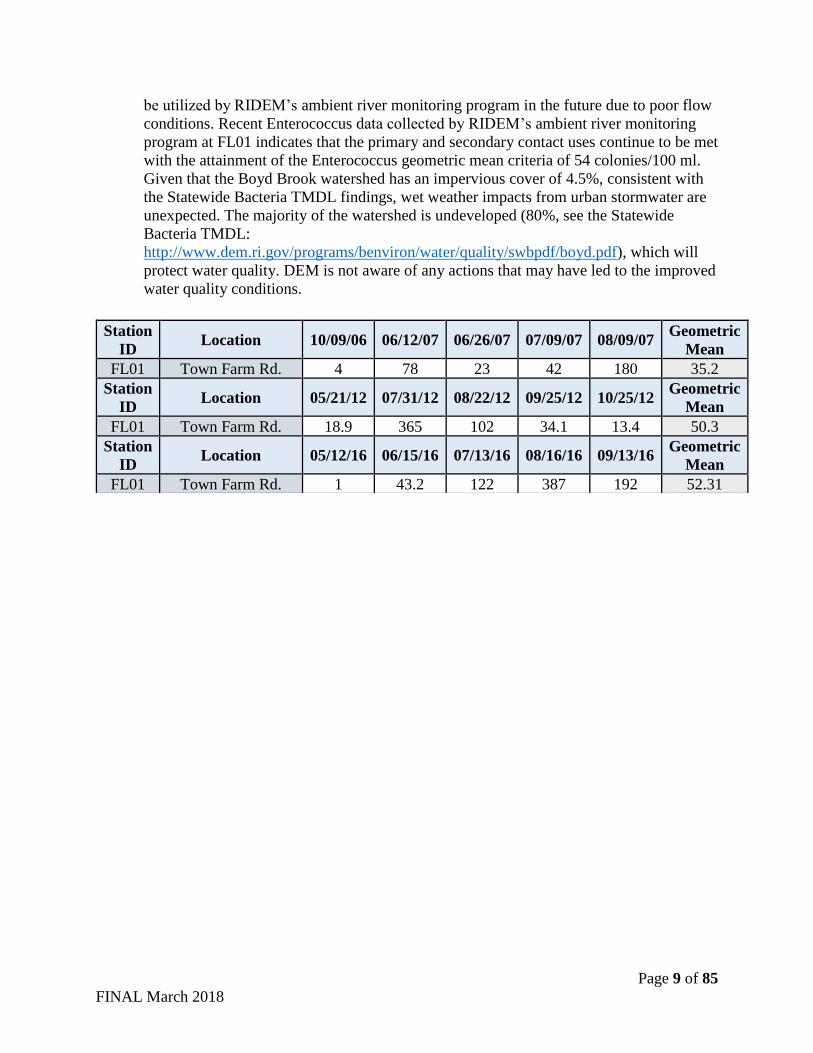
be utilized by RIDEM’s ambient river monitoring program in the future due to poor flow
conditions. Recent Enterococcus data collected by RIDEM’s ambient river monitoring
program at FL01 indicates that the primary and secondary contact uses continue to be met
with the attainment of the Enterococcus geometric mean criteria of 54 colonies/100 ml.
Given that the Boyd Brook watershed has an impervious cover of 4.5%, consistent with
the Statewide Bacteria TMDL findings, wet weather impacts from urban stormwater are
unexpected. The majority of the watershed is undeveloped (80%, see the Statewide
Bacteria TMDL:
http://www.dem.ri.gov/programs/benviron/water/quality/swbpdf/boyd.pdf), which will
protect water quality. DEM is not aware of any actions that may have led to the improved
water quality conditions.
Station
ID Location 10/09/06 06/12/07 06/26/07 07/09/07 08/09/07
Geometric
Mean
FL01 Town Farm Rd. 4 78 23 42 180 35.2
Station
ID Location 05/21/12 07/31/12 08/22/12 09/25/12 10/25/12
Geometric
Mean
FL01 Town Farm Rd. 18.9 365 102 34.1 13.4 50.3
Station
ID Location 05/12/16 06/15/16 07/13/16 08/16/16 09/13/16
Geometric
Mean
FL01 Town Farm Rd. 1 43.2 122 387 192 52.31
Page 10 of 85
FINAL March 2018
Boyd Brook at FL02 8/22/2006
Page 11 of 85
FINAL March 2018
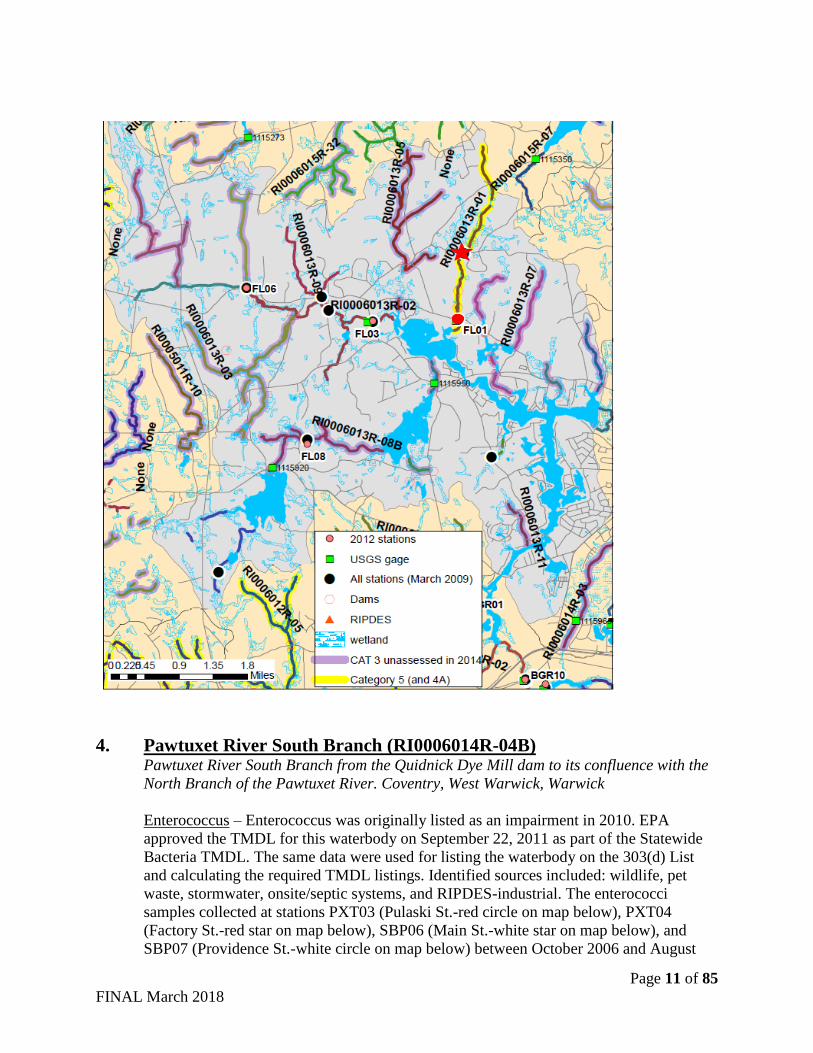
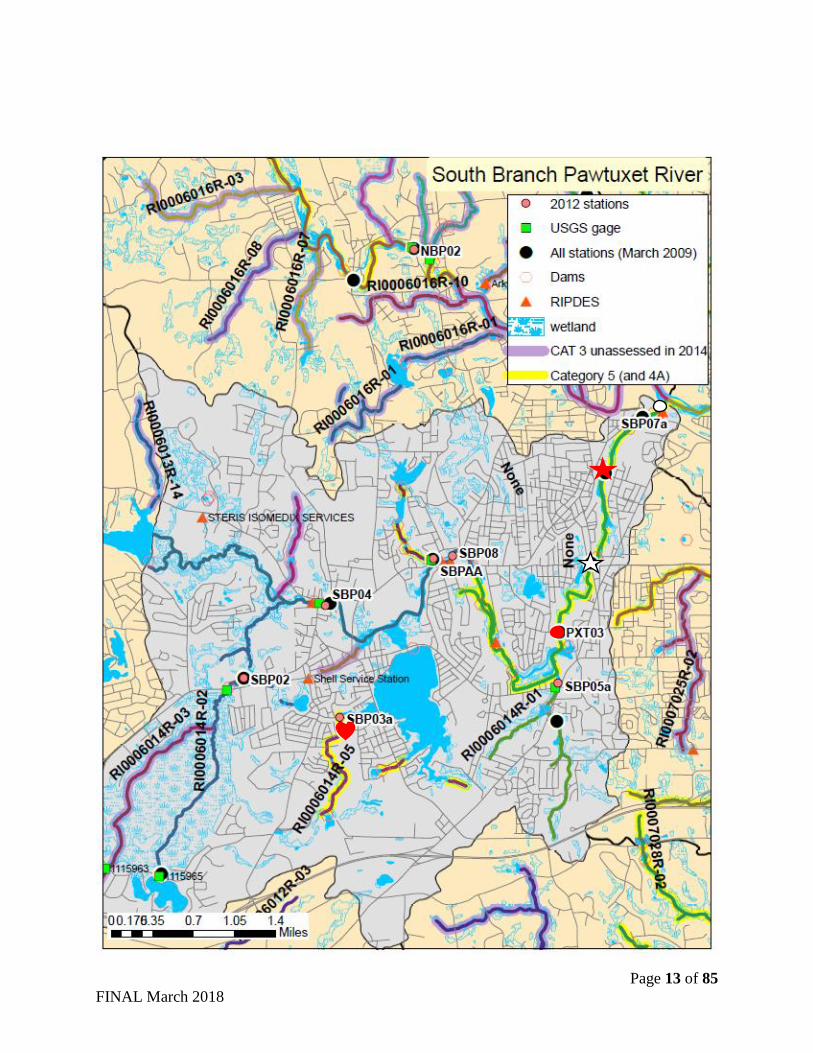
4. Pawtuxet River South Branch (RI0006014R-04B) Pawtuxet River South Branch from the Quidnick Dye Mill dam to its confluence with the
North Branch of the Pawtuxet River. Coventry, West Warwick, Warwick
Enterococcus – Enterococcus was originally listed as an impairment in 2010. EPA
approved the TMDL for this waterbody on September 22, 2011 as part of the Statewide
Bacteria TMDL. The same data were used for listing the waterbody on the 303(d) List
and calculating the required TMDL listings. Identified sources included: wildlife, pet
waste, stormwater, onsite/septic systems, and RIPDES-industrial. The enterococci
samples collected at stations PXT03 (Pulaski St.-red circle on map below), PXT04
(Factory St.-red star on map below), SBP06 (Main St.-white star on map below), and
SBP07 (Providence St.-white circle on map below) between October 2006 and August
Page 12 of 85
FINAL March 2018
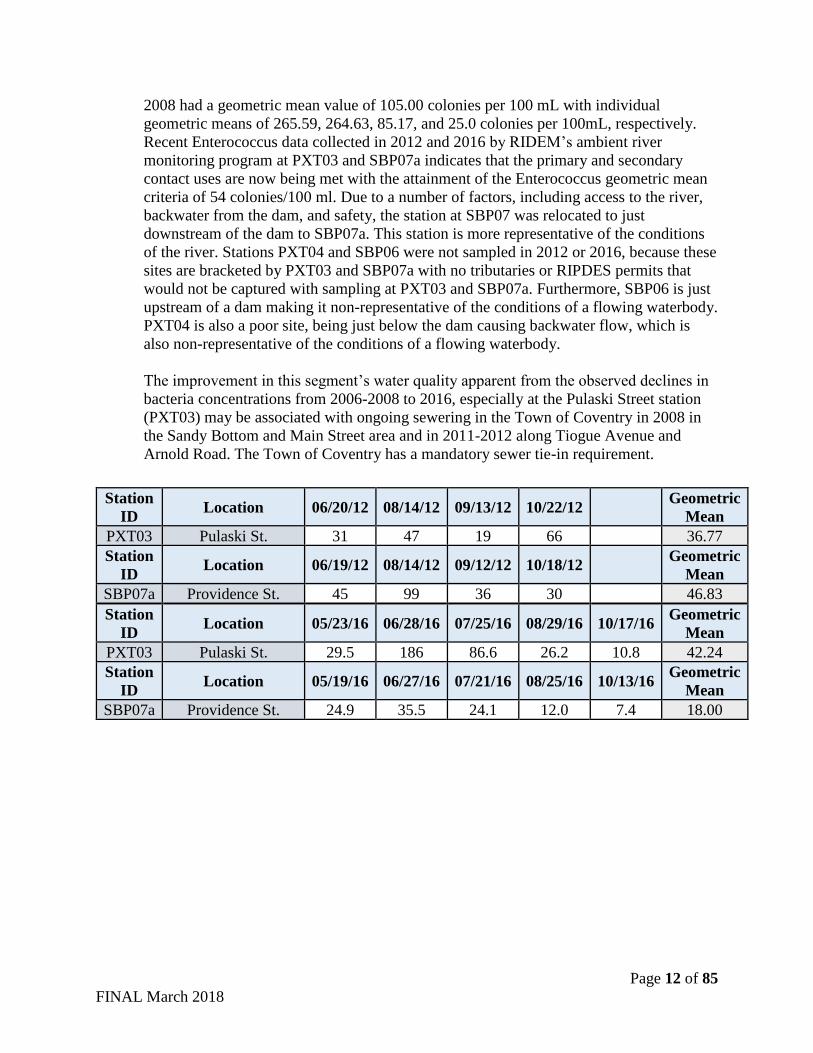
2008 had a geometric mean value of 105.00 colonies per 100 mL with individual
geometric means of 265.59, 264.63, 85.17, and 25.0 colonies per 100mL, respectively.
Recent Enterococcus data collected in 2012 and 2016 by RIDEM’s ambient river
monitoring program at PXT03 and SBP07a indicates that the primary and secondary
contact uses are now being met with the attainment of the Enterococcus geometric mean
criteria of 54 colonies/100 ml. Due to a number of factors, including access to the river,
backwater from the dam, and safety, the station at SBP07 was relocated to just
downstream of the dam to SBP07a. This station is more representative of the conditions
of the river. Stations PXT04 and SBP06 were not sampled in 2012 or 2016, because these
sites are bracketed by PXT03 and SBP07a with no tributaries or RIPDES permits that
would not be captured with sampling at PXT03 and SBP07a. Furthermore, SBP06 is just
upstream of a dam making it non-representative of the conditions of a flowing waterbody.
PXT04 is also a poor site, being just below the dam causing backwater flow, which is
also non-representative of the conditions of a flowing waterbody.
The improvement in this segment’s water quality apparent from the observed declines in
bacteria concentrations from 2006-2008 to 2016, especially at the Pulaski Street station
(PXT03) may be associated with ongoing sewering in the Town of Coventry in 2008 in
the Sandy Bottom and Main Street area and in 2011-2012 along Tiogue Avenue and
Arnold Road. The Town of Coventry has a mandatory sewer tie-in requirement.
Station
ID Location 06/20/12 08/14/12 09/13/12 10/22/12
Geometric
Mean
PXT03 Pulaski St. 31 47 19 66 36.77
Station
ID Location 06/19/12 08/14/12 09/12/12 10/18/12
Geometric
Mean
SBP07a Providence St. 45 99 36 30 46.83
Station
ID Location 05/23/16 06/28/16 07/25/16 08/29/16 10/17/16
Geometric
Mean
PXT03 Pulaski St. 29.5 186 86.6 26.2 10.8 42.24
Station
ID Location 05/19/16 06/27/16 07/21/16 08/25/16 10/13/16
Geometric
Mean
SBP07a Providence St. 24.9 35.5 24.1 12.0 7.4 18.00
Page 13 of 85
FINAL March 2018
Page 14 of 85
FINAL March 2018
5. Cedar Swamp Brook & Tribs (RI0006018R-01) Cedar Swamp Brook and tributaries. Johnston
Total Iron – Total iron was originally listed as an impairment in 2000. This waterbody
does not have a completed TMDL; however, a site remediation project is being carried
out in accordance with RIDEM Office of Waste Management oversight. Samples are
collected quarterly by a contractor to the Rhode Island Resource Recovery Corporation
for the Central Landfill, which were the basis of the impairment in 2000. Recent data
collected by the contractor indicates that the water quality standard of 1000µg/L is being
met.
This stream flows next to the Central Landfill in Johnston, RI, the largest sanitary landfill
in the State. Cedar Swamp Brook is the main surface flow from the area of the landfill
feeding Upper and Lower Simmonsville Reservoirs. By January 1982, initial sampling of
wells near Cedar Swamp Brook showed contamination along the southern border of the
Central Landfill. Following the indication of well contamination, sampling of Cedar
Swamp Brook surface water was recommended. This early sampling of Cedar Swamp
Brook found lower concentrations of contaminants than the wells; however, the highest
contaminants were iron and ammonia, both indicative of refuse leachate. In the Record of
Decision (ROD) September 2002, it was noted that the groundwater contours indicated
that Cedar Swamp Brook acts as a discharge/drainage area for groundwater coming from
the Central Landfill and from the north flank of Lawton Hill. Furthermore, to a lesser
degree than groundwater, Cedar Swamp Brook can also be affected by runoff and
uncontrolled dust and litter from the Central Landfill.
The Central Landfill has been the subject of many remediation actions taken by both
RIDEM and the U.S. Environmental Protection Agency, under various state and federal
laws, beginning in 1979. The Central Landfill has also gone through several phases of
construction and expansion and closure of operations, with the Phase 6 landfill currently
being constructed. During the construction of both Phases 4 and 5, Cedar Swamp Brook
was relocated and restored (initially during the construction of Phase 4 and again during
the construction of Phase 5). As part of Phase 4, the southern/downstream reach of Cedar
Swamp Brook was initially relocated beginning in the summer of 2002 and open for flow
in May 2003. During Phase 5 construction, which began in 2004, Cedar Swamp Brook
was again relocated and the path of the previously relocated Cedar Swamp Brook was
filled with stone to create an underdrain that discharged to Sedimentation Pond 2;
however, RIDEM, through the RIPDES permit program, determined that the discharge
from this underdrain must be captured and treated to remove ammonia and iron. The
RIPDES permit, issued in 2007, included water quality-based limits for iron that were
developed to ensure that water quality criteria are met and that Cedar Swamp Brook is
not impaired. The system to capture and treat ammonia and iron began construction in
2013 and, as of 2017, the treatment system has been meeting its iron limits.
A combination of the permanent relocation of the stream and the installation of the
treatment system, along with other operational improvements at Central Landfill (e.g.
improved erosion controls) have led to the improvement of water quality in Cedar
Page 15 of 85
FINAL March 2018
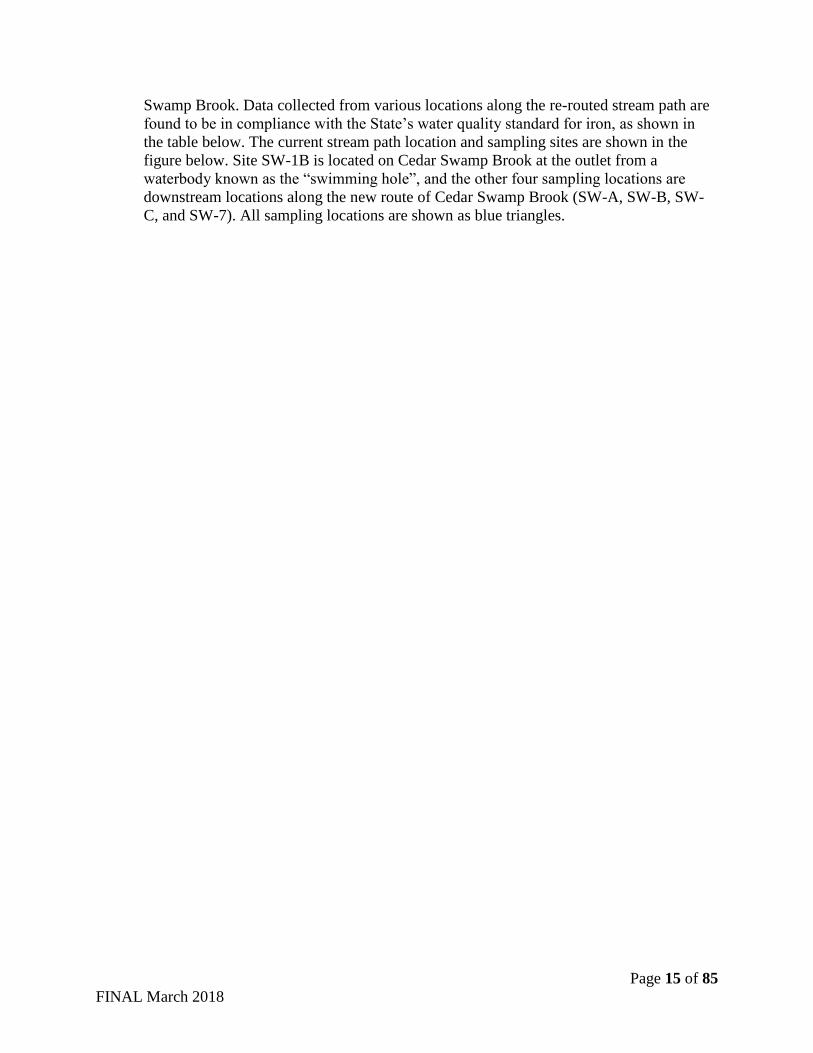
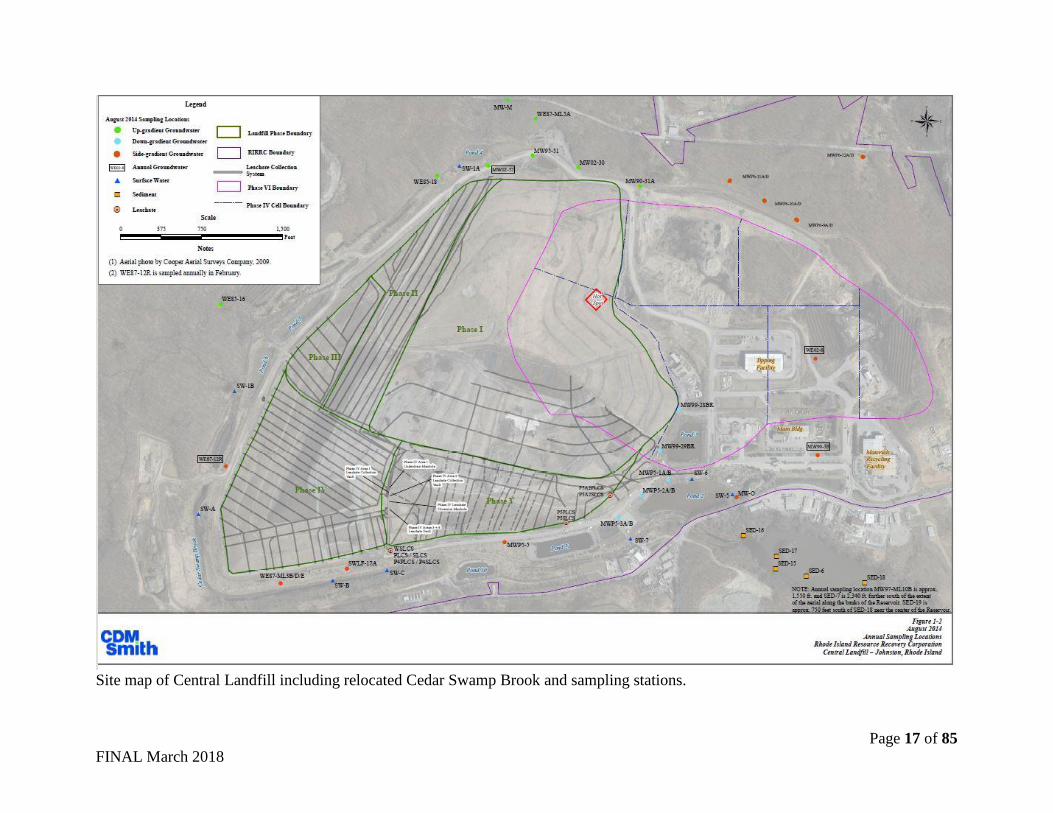
Swamp Brook. Data collected from various locations along the re-routed stream path are
found to be in compliance with the State’s water quality standard for iron, as shown in
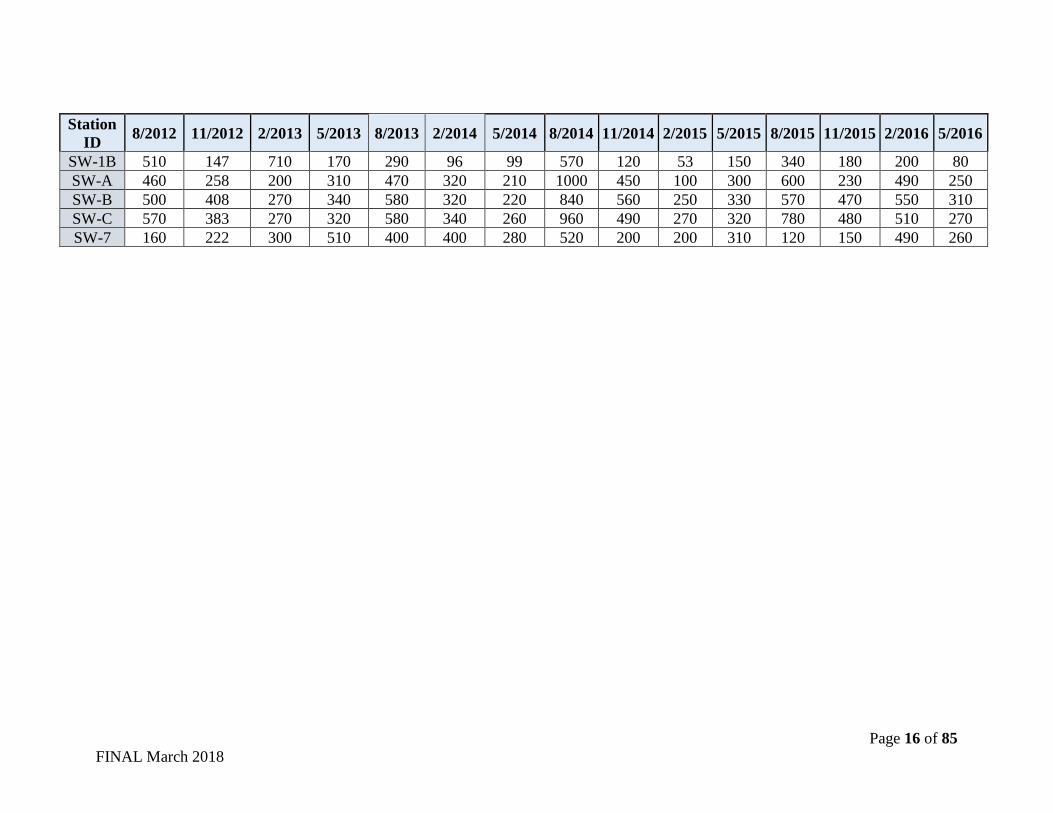
the table below. The current stream path location and sampling sites are shown in the
figure below. Site SW-1B is located on Cedar Swamp Brook at the outlet from a
waterbody known as the “swimming hole”, and the other four sampling locations are
downstream locations along the new route of Cedar Swamp Brook (SW-A, SW-B, SW-
C, and SW-7). All sampling locations are shown as blue triangles.
Page 16 of 85
FINAL March 2018
Station
ID 8/2012 11/2012 2/2013 5/2013 8/2013 2/2014 5/2014 8/2014 11/2014 2/2015 5/2015 8/2015 11/2015 2/2016 5/2016
SW-1B 510 147 710 170 290 96 99 570 120 53 150 340 180 200 80
SW-A 460 258 200 310 470 320 210 1000 450 100 300 600 230 490 250
SW-B 500 408 270 340 580 320 220 840 560 250 330 570 470 550 310
SW-C 570 383 270 320 580 340 260 960 490 270 320 780 480 510 270
SW-7 160 222 300 510 400 400 280 520 200 200 310 120 150 490 260
Page 17 of 85
FINAL March 2018
Site map of Central Landfill including relocated Cedar Swamp Brook and sampling stations.
Page 18 of 85
FINAL March 2018
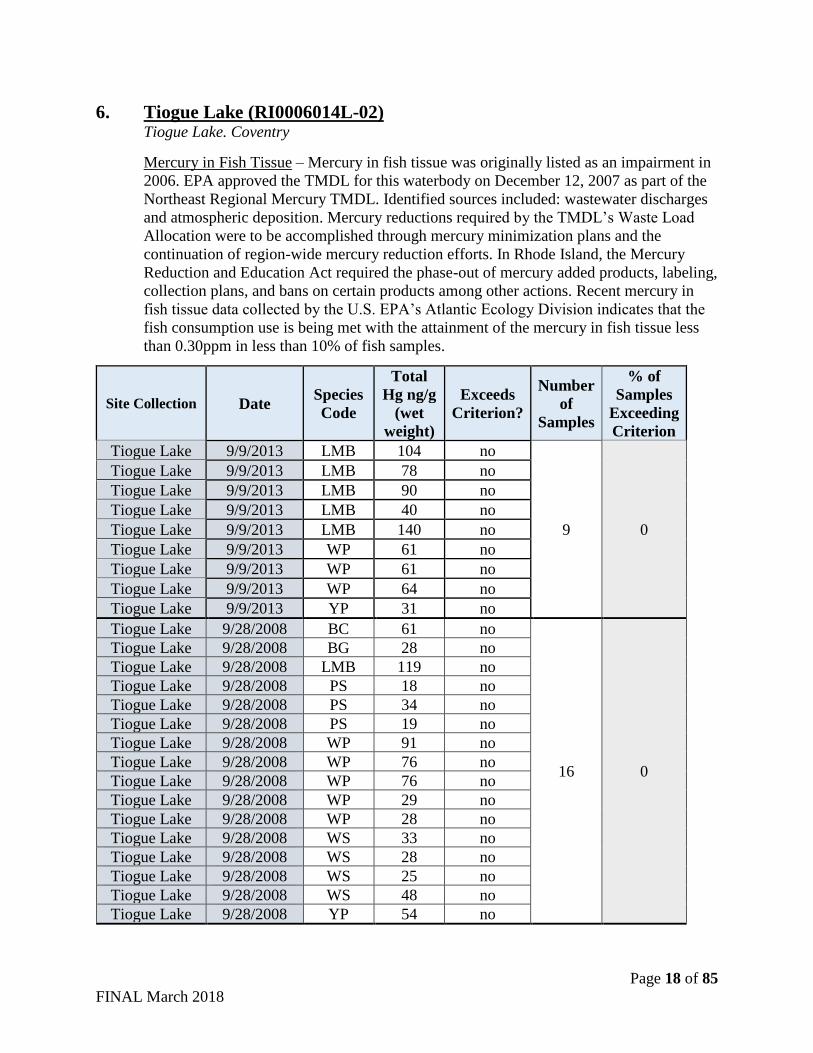
6. Tiogue Lake (RI0006014L-02) Tiogue Lake. Coventry
Mercury in Fish Tissue – Mercury in fish tissue was originally listed as an impairment in
2006. EPA approved the TMDL for this waterbody on December 12, 2007 as part of the
Northeast Regional Mercury TMDL. Identified sources included: wastewater discharges
and atmospheric deposition. Mercury reductions required by the TMDL’s Waste Load
Allocation were to be accomplished through mercury minimization plans and the
continuation of region-wide mercury reduction efforts. In Rhode Island, the Mercury
Reduction and Education Act required the phase-out of mercury added products, labeling,
collection plans, and bans on certain products among other actions. Recent mercury in
fish tissue data collected by the U.S. EPA’s Atlantic Ecology Division indicates that the
fish consumption use is being met with the attainment of the mercury in fish tissue less
than 0.30ppm in less than 10% of fish samples.
Site Collection Date Species
Code
Total
Hg ng/g
(wet
weight)
Exceeds
Criterion?
Number
of
Samples
% of
Samples
Exceeding
Criterion
Tiogue Lake 9/9/2013 LMB 104 no
9 0
Tiogue Lake 9/9/2013 LMB 78 no
Tiogue Lake 9/9/2013 LMB 90 no
Tiogue Lake 9/9/2013 LMB 40 no
Tiogue Lake 9/9/2013 LMB 140 no
Tiogue Lake 9/9/2013 WP 61 no
Tiogue Lake 9/9/2013 WP 61 no
Tiogue Lake 9/9/2013 WP 64 no
Tiogue Lake 9/9/2013 YP 31 no
Tiogue Lake 9/28/2008 BC 61 no
16 0
Tiogue Lake 9/28/2008 BG 28 no
Tiogue Lake 9/28/2008 LMB 119 no
Tiogue Lake 9/28/2008 PS 18 no
Tiogue Lake 9/28/2008 PS 34 no
Tiogue Lake 9/28/2008 PS 19 no
Tiogue Lake 9/28/2008 WP 91 no
Tiogue Lake 9/28/2008 WP 76 no
Tiogue Lake 9/28/2008 WP 76 no
Tiogue Lake 9/28/2008 WP 29 no
Tiogue Lake 9/28/2008 WP 28 no
Tiogue Lake 9/28/2008 WS 33 no
Tiogue Lake 9/28/2008 WS 28 no
Tiogue Lake 9/28/2008 WS 25 no
Tiogue Lake 9/28/2008 WS 48 no
Tiogue Lake 9/28/2008 YP 54 no
Page 19 of 85
FINAL March 2018
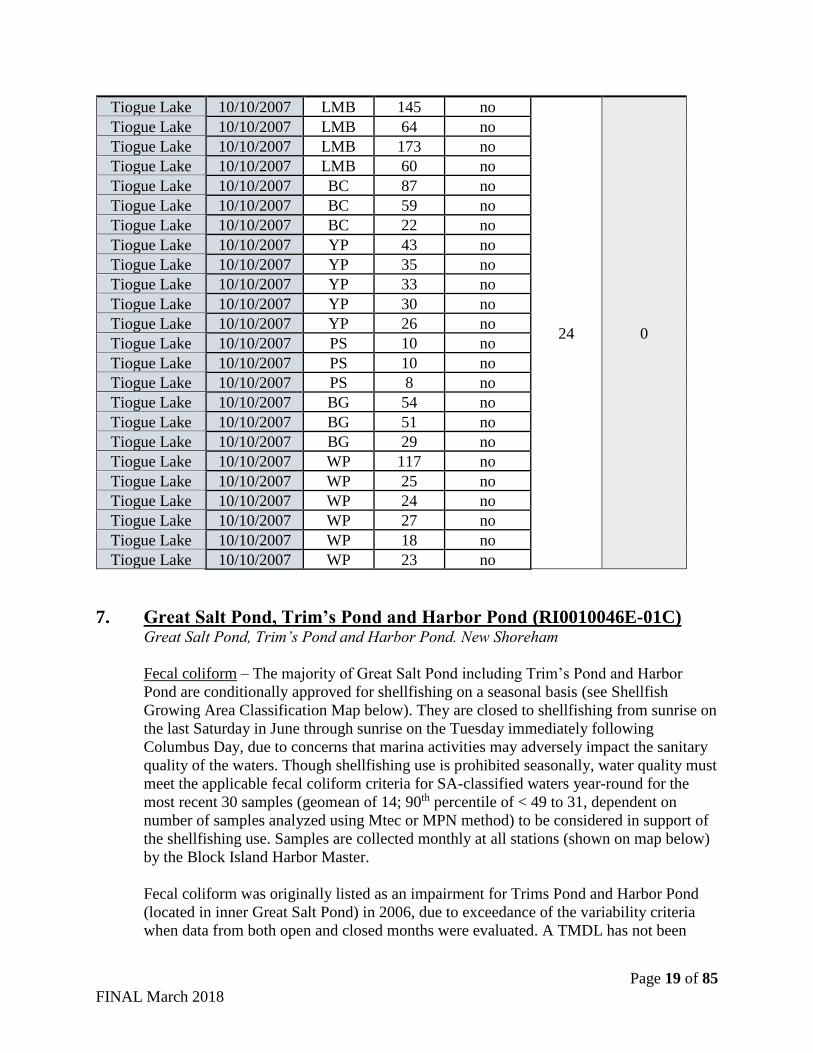
Tiogue Lake 10/10/2007 LMB 145 no
24 0
Tiogue Lake 10/10/2007 LMB 64 no
Tiogue Lake 10/10/2007 LMB 173 no
Tiogue Lake 10/10/2007 LMB 60 no
Tiogue Lake 10/10/2007 BC 87 no
Tiogue Lake 10/10/2007 BC 59 no
Tiogue Lake 10/10/2007 BC 22 no
Tiogue Lake 10/10/2007 YP 43 no
Tiogue Lake 10/10/2007 YP 35 no
Tiogue Lake 10/10/2007 YP 33 no
Tiogue Lake 10/10/2007 YP 30 no
Tiogue Lake 10/10/2007 YP 26 no
Tiogue Lake 10/10/2007 PS 10 no
Tiogue Lake 10/10/2007 PS 10 no
Tiogue Lake 10/10/2007 PS 8 no
Tiogue Lake 10/10/2007 BG 54 no
Tiogue Lake 10/10/2007 BG 51 no
Tiogue Lake 10/10/2007 BG 29 no
Tiogue Lake 10/10/2007 WP 117 no
Tiogue Lake 10/10/2007 WP 25 no
Tiogue Lake 10/10/2007 WP 24 no
Tiogue Lake 10/10/2007 WP 27 no
Tiogue Lake 10/10/2007 WP 18 no
Tiogue Lake 10/10/2007 WP 23 no
7. Great Salt Pond, Trim’s Pond and Harbor Pond (RI0010046E-01C) Great Salt Pond, Trim’s Pond and Harbor Pond. New Shoreham
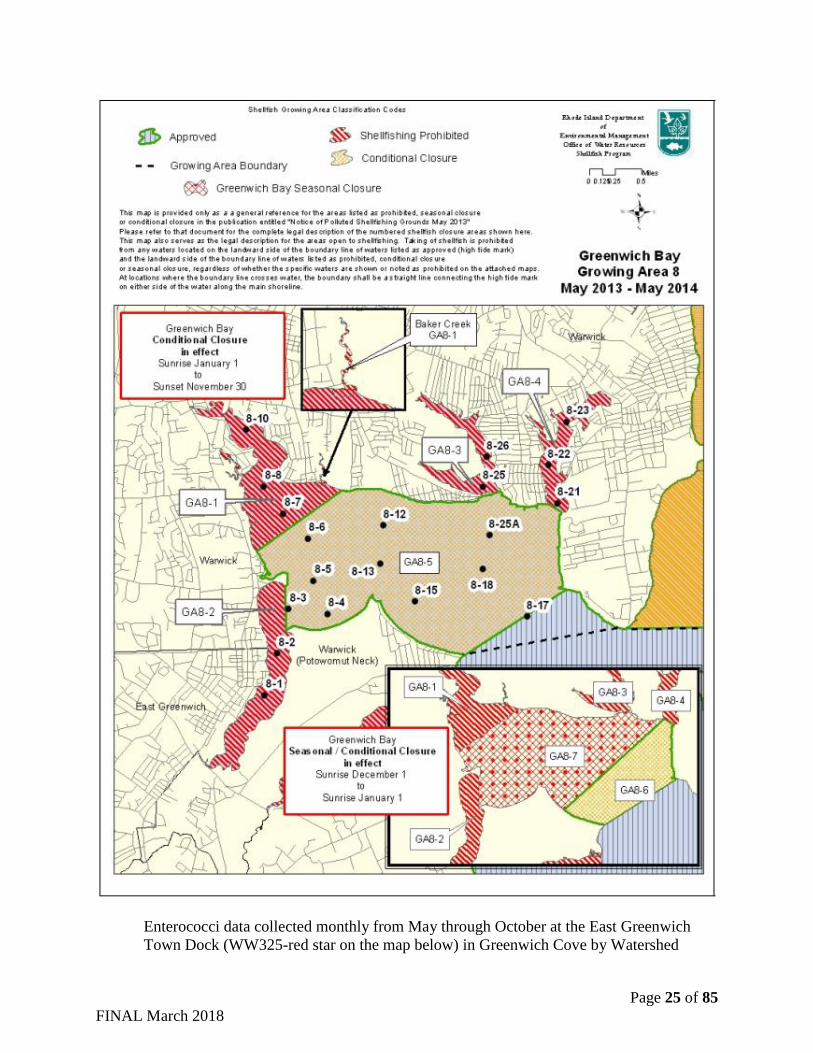
Fecal coliform – The majority of Great Salt Pond including Trim’s Pond and Harbor
Pond are conditionally approved for shellfishing on a seasonal basis (see Shellfish
Growing Area Classification Map below). They are closed to shellfishing from sunrise on
the last Saturday in June through sunrise on the Tuesday immediately following
Columbus Day, due to concerns that marina activities may adversely impact the sanitary
quality of the waters. Though shellfishing use is prohibited seasonally, water quality must
meet the applicable fecal coliform criteria for SA-classified waters year-round for the
most recent 30 samples (geomean of 14; 90th percentile of < 49 to 31, dependent on
number of samples analyzed using Mtec or MPN method) to be considered in support of
the shellfishing use. Samples are collected monthly at all stations (shown on map below)
by the Block Island Harbor Master.
Fecal coliform was originally listed as an impairment for Trims Pond and Harbor Pond
(located in inner Great Salt Pond) in 2006, due to exceedance of the variability criteria
when data from both open and closed months were evaluated. A TMDL has not been
Page 20 of 85
FINAL March 2018
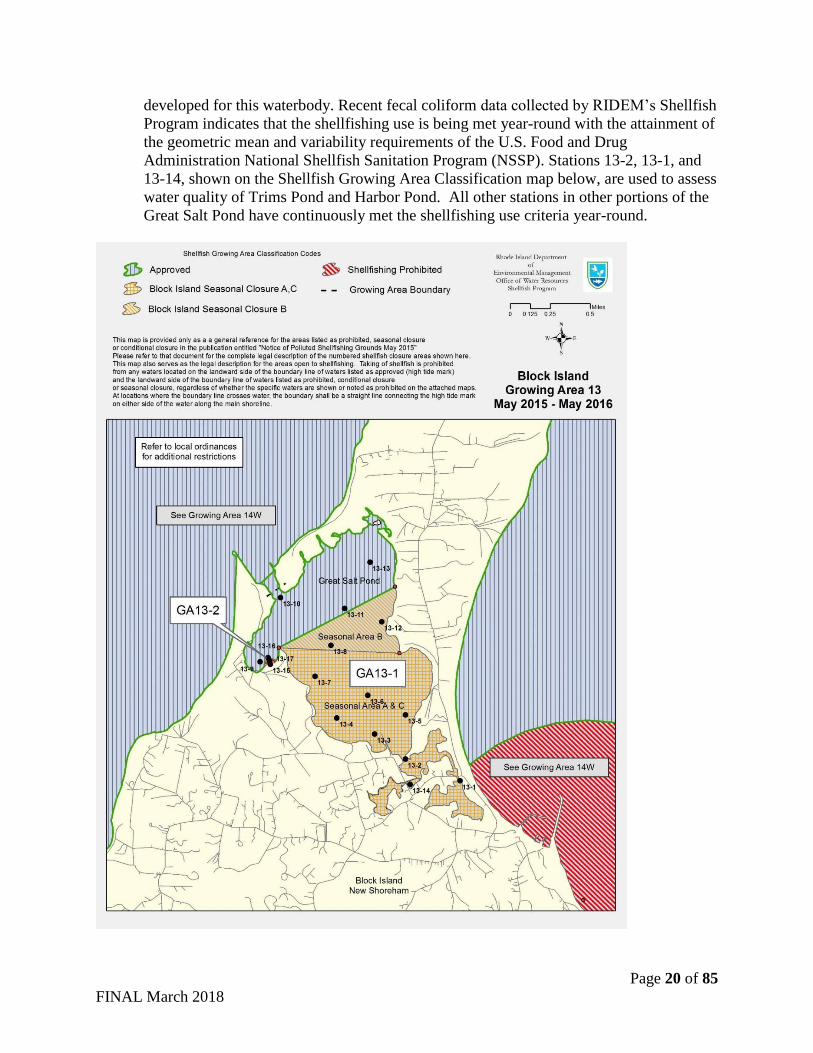
developed for this waterbody. Recent fecal coliform data collected by RIDEM’s Shellfish
Program indicates that the shellfishing use is being met year-round with the attainment of
the geometric mean and variability requirements of the U.S. Food and Drug
Administration National Shellfish Sanitation Program (NSSP). Stations 13-2, 13-1, and
13-14, shown on the Shellfish Growing Area Classification map below, are used to assess
water quality of Trims Pond and Harbor Pond. All other stations in other portions of the
Great Salt Pond have continuously met the shellfishing use criteria year-round.
Page 21 of 85
FINAL March 2018
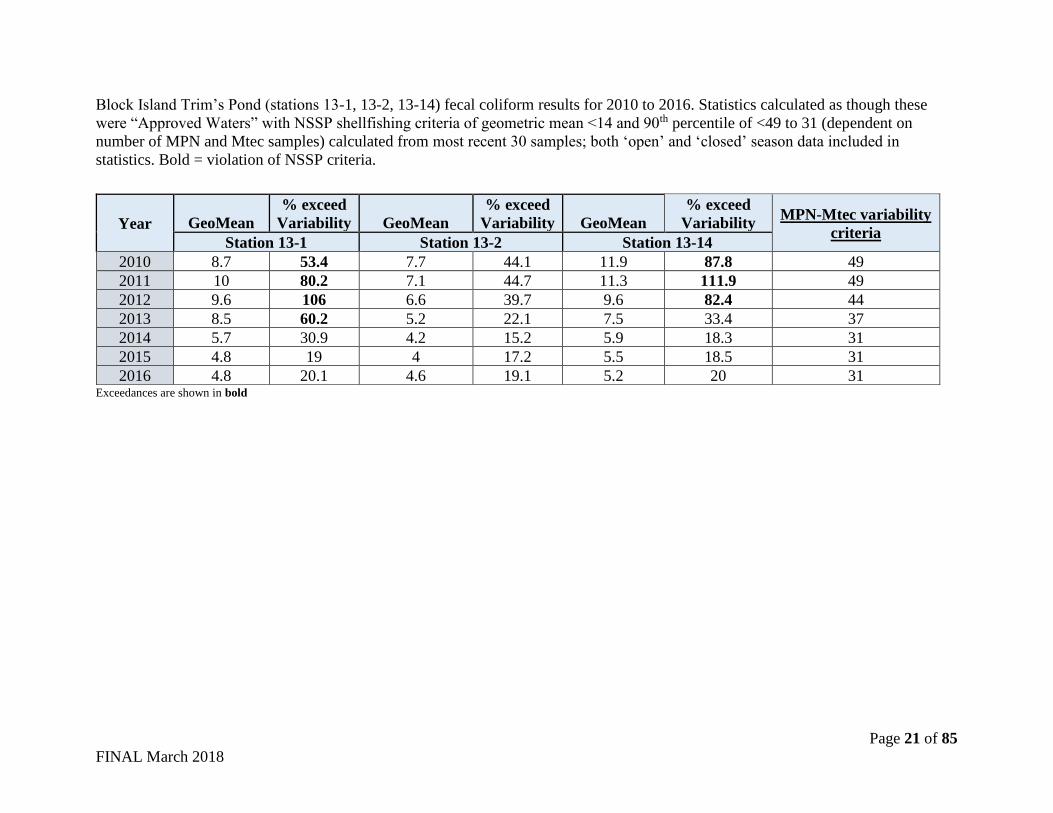
Block Island Trim’s Pond (stations 13-1, 13-2, 13-14) fecal coliform results for 2010 to 2016. Statistics calculated as though these
were “Approved Waters” with NSSP shellfishing criteria of geometric mean <14 and 90th percentile of <49 to 31 (dependent on
number of MPN and Mtec samples) calculated from most recent 30 samples; both ‘open’ and ‘closed’ season data included in
statistics. Bold = violation of NSSP criteria.
Exceedances are shown in bold
Year GeoMean
% exceed
Variability GeoMean
% exceed
Variability GeoMean
% exceed
Variability MPN-Mtec variability
criteria Station 13-1 Station 13-2 Station 13-14
2010 8.7 53.4 7.7 44.1 11.9 87.8 49
2011 10 80.2 7.1 44.7 11.3 111.9 49
2012 9.6 106 6.6 39.7 9.6 82.4 44
2013 8.5 60.2 5.2 22.1 7.5 33.4 37
2014 5.7 30.9 4.2 15.2 5.9 18.3 31
2015 4.8 19 4 17.2 5.5 18.5 31
2016 4.8 20.1 4.6 19.1 5.2 20 31
Page 22 of 85
FINAL March 2018
8. Moswansicut Stream (RI0006015R-16) Moswansicut Stream. Scituate
Escherichia coli (E. coli) – Moswansicut Stream was first listed as impaired for E. coli on
the 2000 303(d) List. Rhode Island has not adopted water quality criteria for E. coli, but
the USEPA’s E. coli criteria of 126 col/100ml can be used to assess E. coli data in cases
where there are no fecal coliform or enterococci data available. EPA approved the TMDL
for this waterbody on September 22, 2011 as part of the Statewide Bacteria TMDL.
The 2000 303(d) listing and the TMDL used monthly E. coli data collected by the
Providence Water Supply Board. The TMDL included calculated annual geometric
means from 2003 to 2009 with a partial year geometric mean calculated for 2010. Annual
geometric means ranged from 64 to 199 colonies/100 mL (col/100 mL). Land use within
the watershed is predominately undeveloped (57%), commercial, residential, and
transportation land uses make up 41% with the remaining percentage attributed to
agricultural uses (2%). Identified sources included: developed area stormwater,
onsite/septic systems, and animal waste from waterfowl, wildlife, and domestic animals.
Given that the Moswansicut watershed has an impervious cover of 20.4%, consistent with
the Statewide Bacteria TMDL findings, it is expected that urbanized stormwater may
have contributed to the impairment. Homes in the watershed use onsite wastewater
disposal systems (OWTS) and the area is regulated under the Stormwater Phase II
program.
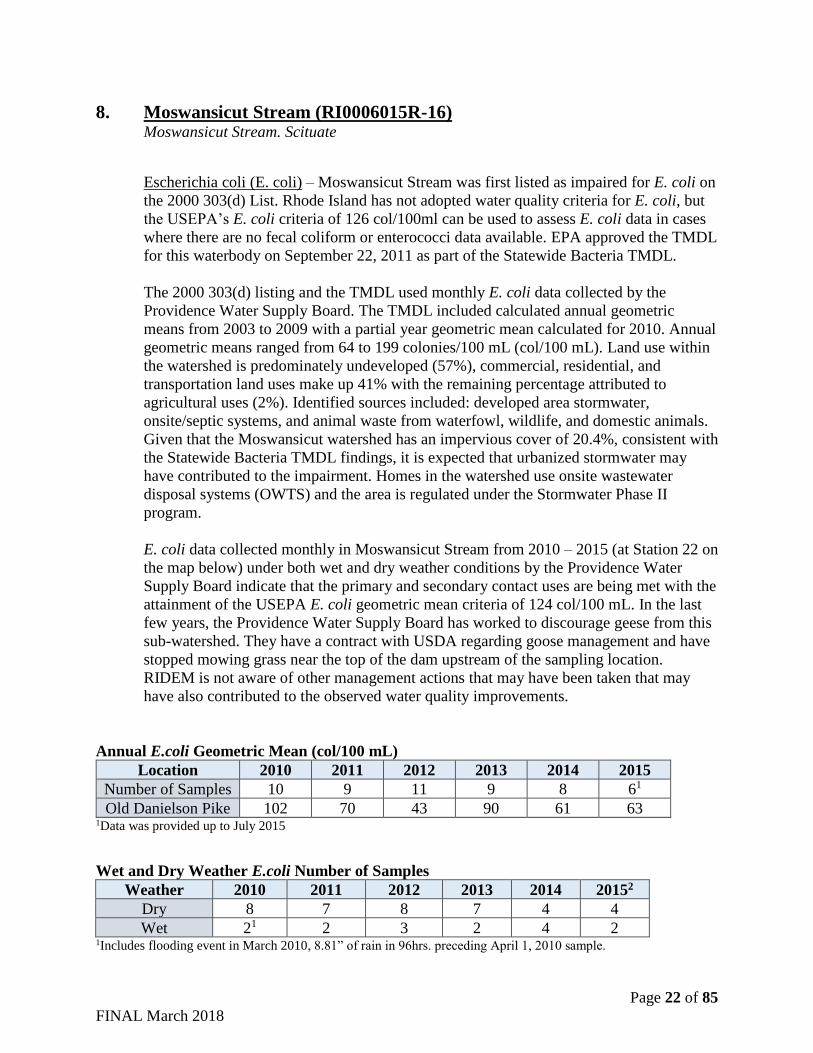
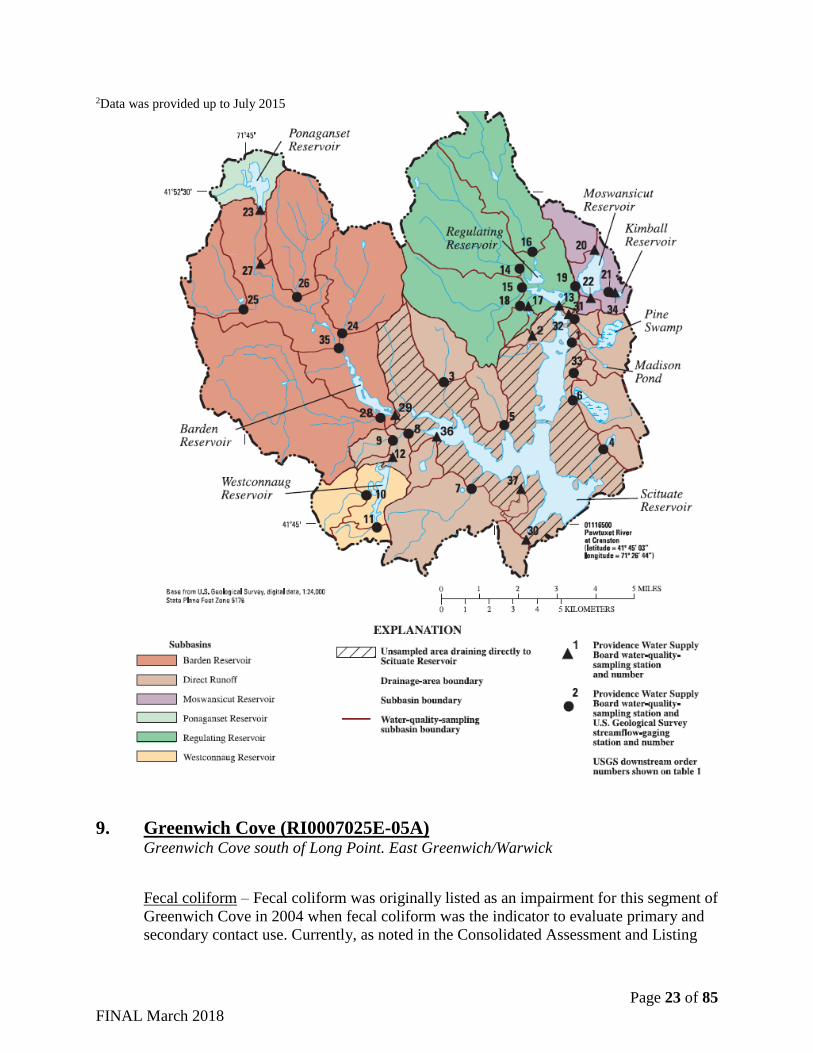
E. coli data collected monthly in Moswansicut Stream from 2010 – 2015 (at Station 22 on
the map below) under both wet and dry weather conditions by the Providence Water
Supply Board indicate that the primary and secondary contact uses are being met with the
attainment of the USEPA E. coli geometric mean criteria of 124 col/100 mL. In the last
few years, the Providence Water Supply Board has worked to discourage geese from this
sub-watershed. They have a contract with USDA regarding goose management and have
stopped mowing grass near the top of the dam upstream of the sampling location.
RIDEM is not aware of other management actions that may have been taken that may
have also contributed to the observed water quality improvements.
Annual E.coli Geometric Mean (col/100 mL)
Location 2010 2011 2012 2013 2014 2015
Number of Samples 10 9 11 9 8 61
Old Danielson Pike 102 70 43 90 61 63 1Data was provided up to July 2015
Wet and Dry Weather E.coli Number of Samples
Weather 2010 2011 2012 2013 2014 20152
Dry 8 7 8 7 4 4
Wet 21 2 3 2 4 2 1Includes flooding event in March 2010, 8.81” of rain in 96hrs. preceding April 1, 2010 sample.
Page 23 of 85
FINAL March 2018
2Data was provided up to July 2015
9. Greenwich Cove (RI0007025E-05A) Greenwich Cove south of Long Point. East Greenwich/Warwick
Fecal coliform – Fecal coliform was originally listed as an impairment for this segment of
Greenwich Cove in 2004 when fecal coliform was the indicator to evaluate primary and
secondary contact use. Currently, as noted in the Consolidated Assessment and Listing
Page 24 of 85
FINAL March 2018
Methodology (CALM), enterococci are the primary bacteria indicator for assessing
recreational/swimming use attainment. During the transition to the enterococci indicator,
the water quality standards have maintained fecal coliform criteria for use in evaluating
recreational/swimming use when adequate enterococci data are not available.
EPA approved the RIDEM’s Bacteria TMDL for Greenwich Cove on February 16, 2006
as part of the Greenwich Bay watershed Bacteria TMDL. Though Greenwich Cove itself
is not approved for shellfishing, Greenwich Bay is an important shellfish harvesting
resource for the State of Rhode Island. The Bay and its coves are known to experience
elevated bacteria levels under wet weather conditions and as a result, the Bay is
conditionally approved for shellfish harvesting. It is closed under wet weather conditions
defined as within seven days of 0.5 inches of rain. The approved 2006 TMDL calculated
wet and dry weather statistics on the data with Greenwich Cove having both wet and dry
weather violations.
Currently, RIDEM Shellfish Program collects year-round monthly fecal coliform samples
when Greenwich Bay is open to shellfish harvesting (i.e. dry weather conditions), while
Watershed Watch volunteers collect seasonal (May through October) monthly
enterococci samples. The Watershed Watch sampling dates are determined at the
beginning of each sampling season, which means that either wet or dry weather
conditions could be captured. RIDEM evaluated both RIDEM Shellfishing and
Watershed Watch datasets as part of this assessment to ensure compliance with all
relevant criteria. However, since ample enterococci data are available and the Watershed
Watch dataset contains samples collected under both wet and dry weather conditions,
RIDEM’s recreational use assessment is predominately based on the enterococci data.
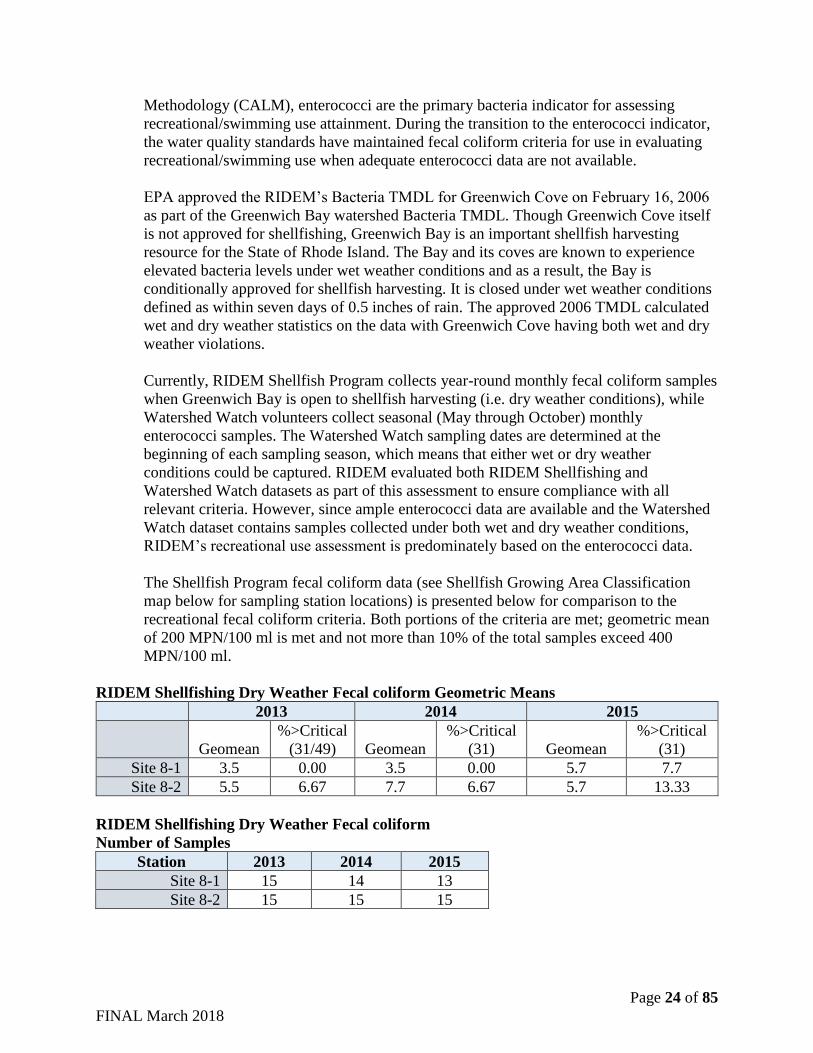
The Shellfish Program fecal coliform data (see Shellfish Growing Area Classification
map below for sampling station locations) is presented below for comparison to the
recreational fecal coliform criteria. Both portions of the criteria are met; geometric mean
of 200 MPN/100 ml is met and not more than 10% of the total samples exceed 400
MPN/100 ml.
RIDEM Shellfishing Dry Weather Fecal coliform Geometric Means
2013 2014 2015
Geomean
%>Critical
(31/49) Geomean
%>Critical
(31) Geomean
%>Critical
(31)
Site 8-1 3.5 0.00 3.5 0.00 5.7 7.7
Site 8-2 5.5 6.67 7.7 6.67 5.7 13.33
RIDEM Shellfishing Dry Weather Fecal coliform
Number of Samples
Station 2013 2014 2015
Site 8-1 15 14 13
Site 8-2 15 15 15
Page 25 of 85
FINAL March 2018
Enterococci data collected monthly from May through October at the East Greenwich
Town Dock (WW325-red star on the map below) in Greenwich Cove by Watershed
Page 26 of 85
FINAL March 2018
Watch volunteers from 2012 – 2016 indicate that the primary and secondary contact uses
are being met with the attainment of the enterococci geometric mean criterion of 35
colonies/100 ml. (NOTE: the other station WW324 in Greenwich Cove Segment 5A on
the map is not an active site.)
Combined Wet and Dry Weather Enterococci Geometric Means (2012-2016)
2012 2013 2014 2015 2016
Number of Samples 6 6 6 6 6
WW325 – EG Town Dock 27.9 13.6 22.2 14.2 9.9
RIDEM also calculated separate wet weather and dry weather geometric means for the
most recent Watershed Watch collected data (2012-2016). For each sampling date,
RIDEM used the same criteria that was used for the 2006 TMDL to categorize wet versus
dry weather samples. RIDEM determined whether the adjacent shellfish grounds were
open or closed due to rainfall received (i.e. seven day closure following a 0.5 inch or
greater rain event in twenty-four hours). RIDEM also included the nearest rainfall for the
closed dates. At least seventeen of the last thirty samples collected were collected when
the Greenwich Bay shellfish grounds were closed and experiencing wet weather
conditions. Thirteen samples were collected under dry weather conditions. Two samples
were collected when the timing of the rainfall, sampling, opening/closing of shellfish
grounds are not known for certain. Best professional judgement in both these cases would
indicate that the Shellfish Grounds were closed and that these samples were collected
under wet weather conditions. It should be noted that the inclusion of these two samples
with the wet weather samples had a less than 0.5 MPN/100 mL effect on the geometric
mean.
Wet and Dry Weather Enterococci Geometric Means (2012-2016)
Station WET DRY
Number of Samples 19 11
WW325 – EG Town Dock 17.7 14.3
Page 27 of 85
FINAL March 2018
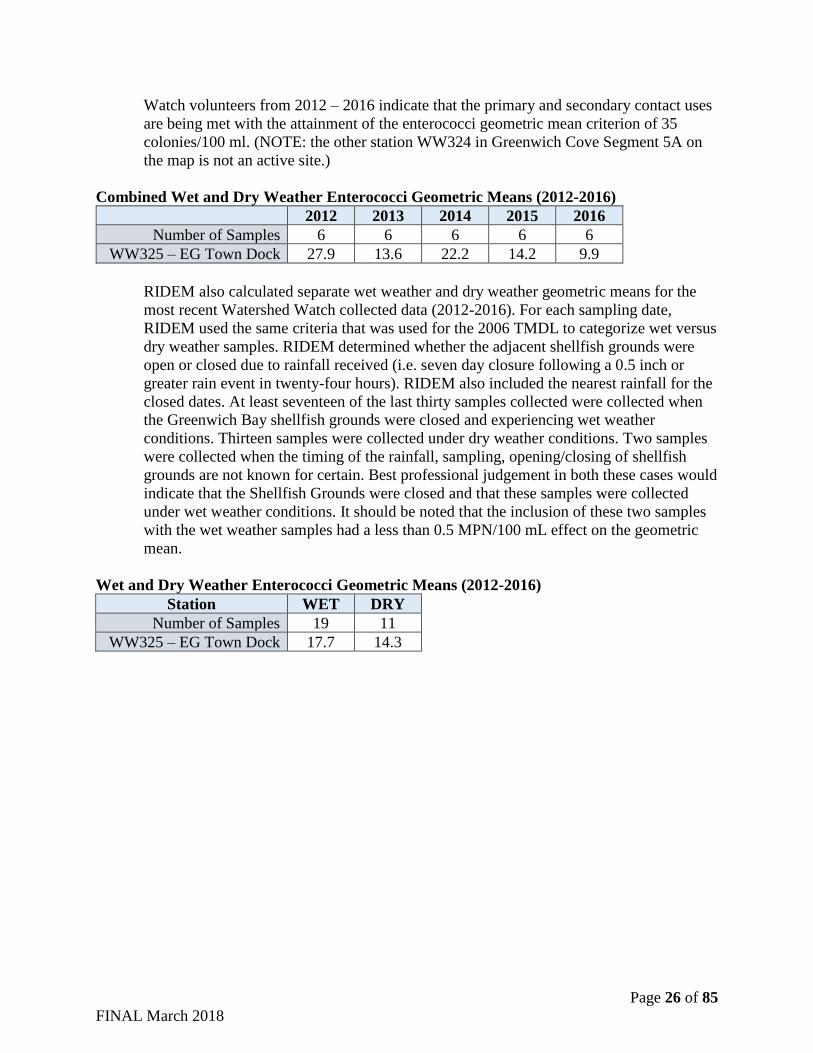
Improvements in water quality conditions in Greenwich Cove can be attributed to several
actions in the watershed. In 2012, the Town of East Greenwich installed 23 infiltrating
catch basins in its Hill and Harbor District, which is located within the Greenwich Cove
watershed. Funding was provided by the EPA Section 319 program and from the Rhode
Island Bay and Watershed Restoration Fund. Infiltrating catch basins reduce the amount
of stormwater entering the stormwater drainage system by allowing the first flush of
stormwater to infiltrate into the surrounding soils, rather than continuing into the
municipal stormwater system. The Town of East Greenwich annually cleans catch basins
throughout town, while frequently sweeping Main Street. Also, in 2012, East Greenwich
replaced a sewer main along Water Street, which runs along Greenwich Cove. While
there was no evidence that the sewer main was exfiltrating sewage, it was known to be
impacted by infiltration.
In accordance with US Food and Drug Administration requirements, the RIDEM
Shellfish Program conducts periodic shoreline surveys in this area. The last
comprehensive shoreline survey, conducted in 2005, identified two storm drains with
elevated bacteria levels discharging into this segment of Greenwich Cove. Following the
2005 survey, the DEM Office of Compliance and Inspection conducted an illicit
discharge detection study into the two storm drain networks. The actions conducted to
identify bacteria sources to the storm drain networks included sampling the upgradient
catch basins and manholes multiple times. Also, many onsite wastewater treatment
Page 28 of 85
FINAL March 2018
systems (OWTS) were inspected, and East Greenwich and Warwick each hired
contractors to video their storm drain networks.
Several failing OWTS systems were found in the drainage areas to these outfalls. At a
one marina, a cesspool was removed when it was able to connect to the Warwick sewer
line in 2011 with funding assistance from the Bay and Watershed Restoration Fund. The
marina had to pump its cesspool 3-4 times per week while waiting for permission to
connect to the sewer line which required constructing under an active railway. A senior
living facility located on Division Street in Warwick also connected to an adjacent sewer
line after the Office of Compliance and Inspection found its onsite wastewater treatment
system to be failing. Other remediation efforts included connecting a mill property close
to the water to the adjacent sewer line and correcting a grey water direct discharge to the
storm drain.
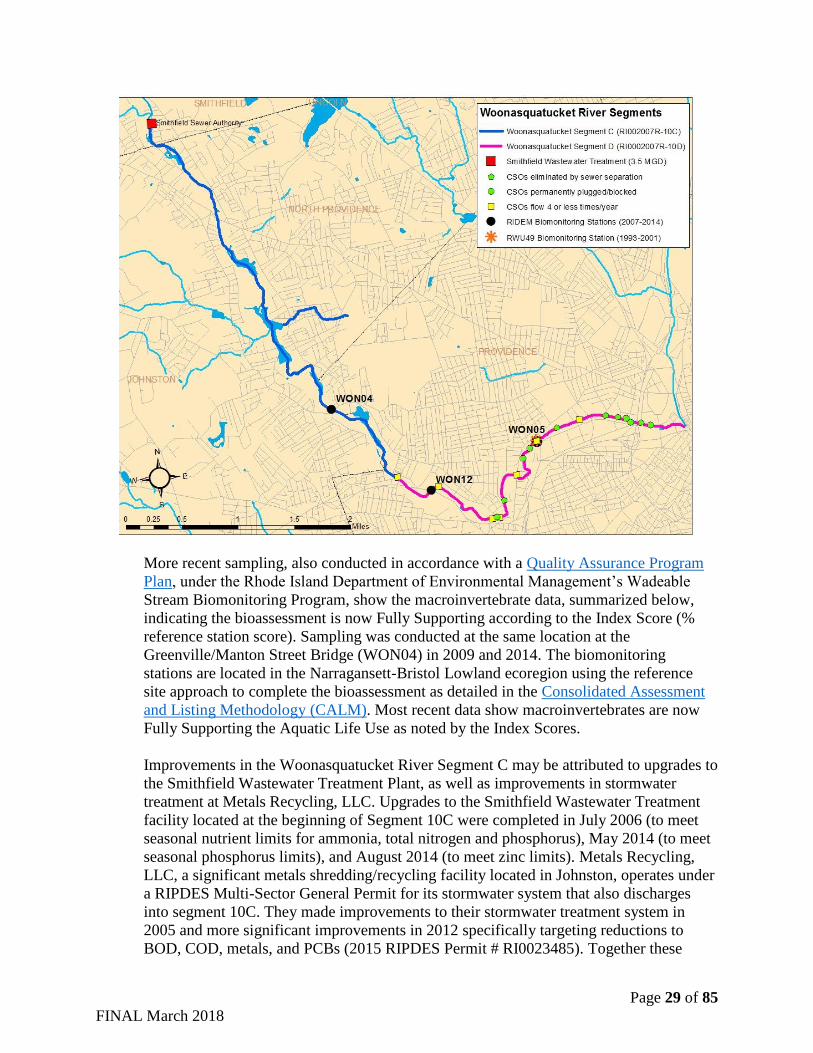
10. Woonasquatucket River (RI0002007R-10C) Woonasquatucket River and tributaries from Smithfield WWTF discharge point at
Esmond Mill Drive to the CSO outfall at Glenbridge Avenue in Providence. Smithfield,
North Providence, Providence, Johnston
Benthic-Macroinvertebrate Bioassessments – This segment of the Woonasquatucket
River is listed on RI’s 2014 303(d) List of Impaired Waters as not supporting aquatic life
use due to benthic-macroinvertebrate bioassessments. This impairment was first listed on
RI’s 2010 303(d) list based on macroinvertebrate data, summarized below, collected in
2007 & 2008 in accordance with a Quality Assurance Program Plan, under the Rhode
Island Department of Environmental Management’s Wadeable Stream Biomonitoring
Program. Sampling was conducted at a station (WON04) by the Greenville/Manton Street
Bridge in Providence. This waterbody segment runs from Esmond Mill Drive, Smithfield
to the CSO outfall at Glenbridge Avenue in Providence, and the station is in the
downstream region of the segment (see map below).
Page 29 of 85
FINAL March 2018
More recent sampling, also conducted in accordance with a Quality Assurance Program
Plan, under the Rhode Island Department of Environmental Management’s Wadeable
Stream Biomonitoring Program, show the macroinvertebrate data, summarized below,
indicating the bioassessment is now Fully Supporting according to the Index Score (%
reference station score). Sampling was conducted at the same location at the
Greenville/Manton Street Bridge (WON04) in 2009 and 2014. The biomonitoring
stations are located in the Narragansett-Bristol Lowland ecoregion using the reference
site approach to complete the bioassessment as detailed in the Consolidated Assessment
and Listing Methodology (CALM). Most recent data show macroinvertebrates are now
Fully Supporting the Aquatic Life Use as noted by the Index Scores.
Improvements in the Woonasquatucket River Segment C may be attributed to upgrades to
the Smithfield Wastewater Treatment Plant, as well as improvements in stormwater
treatment at Metals Recycling, LLC. Upgrades to the Smithfield Wastewater Treatment
facility located at the beginning of Segment 10C were completed in July 2006 (to meet
seasonal nutrient limits for ammonia, total nitrogen and phosphorus), May 2014 (to meet
seasonal phosphorus limits), and August 2014 (to meet zinc limits). Metals Recycling,
LLC, a significant metals shredding/recycling facility located in Johnston, operates under
a RIPDES Multi-Sector General Permit for its stormwater system that also discharges
into segment 10C. They made improvements to their stormwater treatment system in
2005 and more significant improvements in 2012 specifically targeting reductions to
BOD, COD, metals, and PCBs (2015 RIPDES Permit # RI0023485). Together these
Page 30 of 85
FINAL March 2018
upgrades have helped improve water quality in the Woonasquatucket River over time and
likely have contributed to the observed improvements in the river’s macroinvertebrate
communities.
11. Woonasquatucket River (RI0002007R-10D) Woonasquatucket River from the CSO outfall at Glenbridge Avenue to the confluence
with the Moshassuck River. Providence
Benthic-Macroinvertebrate Bioassessments – This segment of the Woonasquatucket
River is listed on RI’s 2014 303(d) List of Impaired Waters as not supporting aquatic life
designated use due to benthic-macroinvertebrate bioassessments. This impairment was
first listed on RI’s 1994 303(d) list based on coarse (family level) macroinvertebrate data,
summarized below, collected in 1991 by Roger Williams University. Sampling was
conducted at a station (RWU49) by the Eagle Street Bridge in Providence on seven
occasions 1991 – 2001 (see above map-Same station as WON05).
More recent sampling, conducted in accordance with a Quality Assurance Program Plan,
under the Rhode Island Department of Environmental Management’s Wadeable Stream
Biomonitoring Program, show more detailed macroinvertebrate data (to species when
possible), summarized below, indicating the bioassessment is now Fully Supporting
according to the Index Score (% reference station score). Sampling was conducted at the
same location at the Eagle Street Bridge (WON05) in 2007, 2008, and 2014, as well as at
another location (WON12) on that river segment, (approximately 1.8 miles upstream
from WON05 at Merino Park) in 2014. The biomonitoring stations are located in the
Narragansett-Bristol Lowland ecoregion using the reference site approach to complete the
bioassessment as detailed in the Consolidated Assessment and Listing Methodology
(CALM). Most recent data show macroinvertebrates are now Fully Supporting the
Aquatic Life Use as noted by the Index Scores.
Completion of water pollution abatement projects in the Woonasquatucket Watershed
have contributed to improved water quality of the river and to the observed
improvements in Segment 10D’s macroinvertebrate communities. This segment of the
Woonasquatucket River benefits from improved water quality conditions in the upstream
segment resulting from upgrades at the Smithfield Wastewater Treatment Plant and
Metals Recycling, LLC. Stormwater Treatment Facility that discharge upstream in
Segment C of the river (as detailed above). More directly, water quality in this reach of
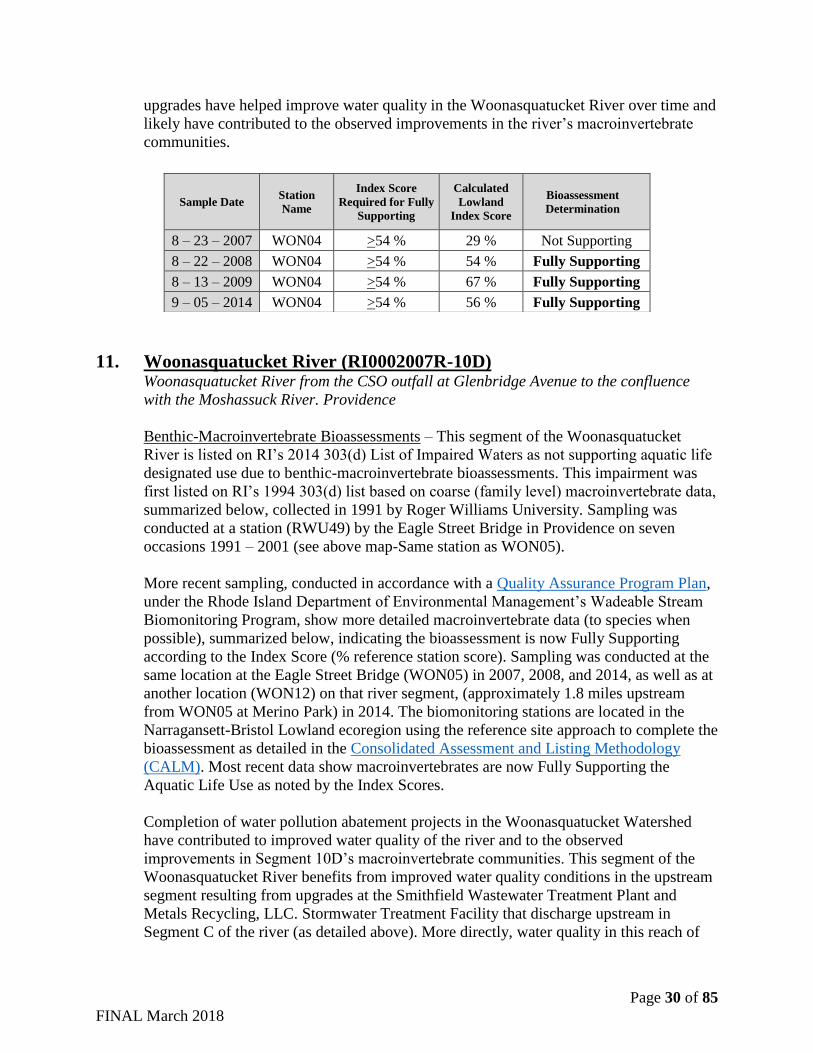
Sample Date Station
Name
Index Score
Required for Fully
Supporting
Calculated
Lowland
Index Score
Bioassessment
Determination
8 – 23 – 2007 WON04 >54 % 29 % Not Supporting
8 – 22 – 2008 WON04 >54 % 54 % Fully Supporting
8 – 13 – 2009 WON04 >54 % 67 % Fully Supporting
9 – 05 – 2014 WON04 >54 % 56 % Fully Supporting
Page 31 of 85
FINAL March 2018
the river will benefit from the Narragansett Bay Commission’s (NBC) combined sewer
overflow (CSO) abatement project. In June 2001, NBC embarked on construction of a
three-phase Combined Sewer Overflow (CSO) abatement program, targeted to limit CSO
overflows from up to a three-month storm (1.64 inches of rain in six hours) to 4 or less
times per year. Phase I, completed in 2008, included a deep rock tunnel that captures
combined stormwater and sewage overflows within the city of Providence (1.1 billion
gallons annually) and transports the flow for treatment to the NBC's Field's Point
Wastewater Treatment Facility. Phase II facilities, constructed 2011-2015, consists of, in
part, an interceptor located along the Woonasquatucket River to convey combined
stormwater and sewage flows to the Main Spine Tunnel constructed as part of Phase I.
Additionally, in Phase II, a sewer separation project has helped reduce the discharge from
14 combined sewer overflows in the Woonasquatucket River (7 permanently blocked, 7
now only discharge in higher rainfall events 4 or less times per year). One of the CSOs is
upstream of sampling station WON12 and 11 of the 14 CSOs are upstream of the
WON05 sampling station). These projects will further support protection of water quality
for healthy macroinvertebrate communities.
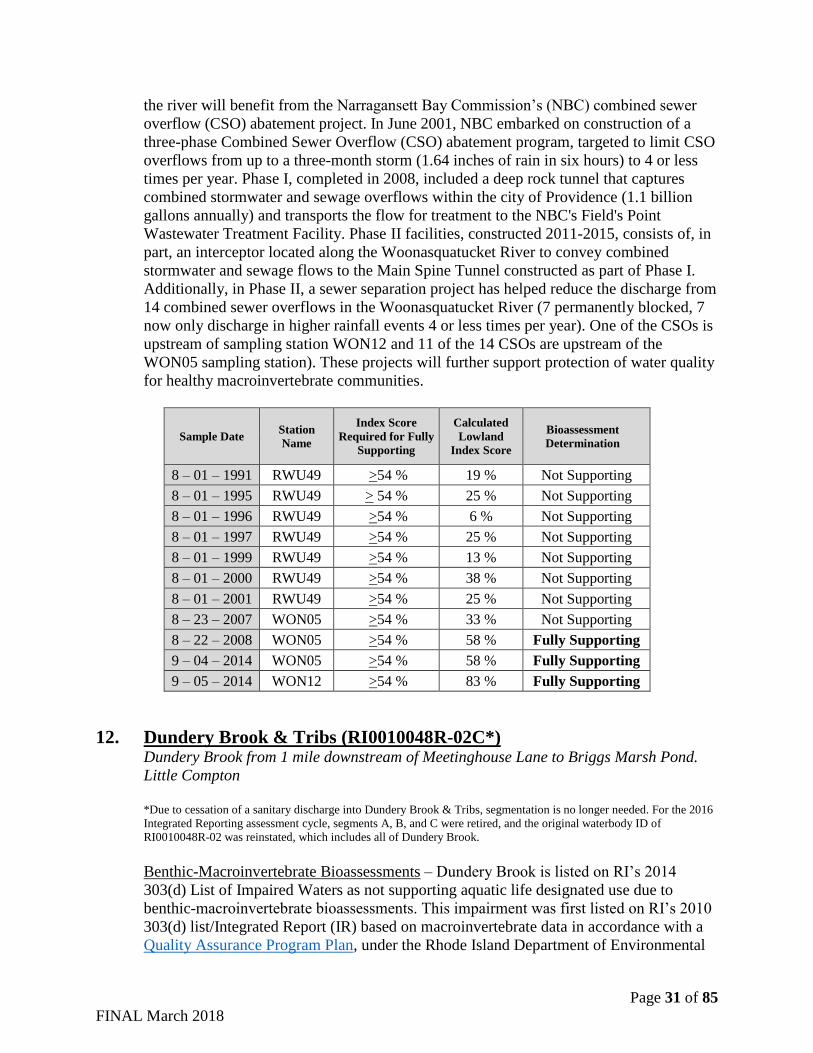
Sample Date Station
Name
Index Score
Required for Fully
Supporting
Calculated
Lowland
Index Score
Bioassessment
Determination
8 – 01 – 1991 RWU49 >54 % 19 % Not Supporting
8 – 01 – 1995 RWU49 > 54 % 25 % Not Supporting
8 – 01 – 1996 RWU49 >54 % 6 % Not Supporting
8 – 01 – 1997 RWU49 >54 % 25 % Not Supporting
8 – 01 – 1999 RWU49 >54 % 13 % Not Supporting
8 – 01 – 2000 RWU49 >54 % 38 % Not Supporting
8 – 01 – 2001 RWU49 >54 % 25 % Not Supporting
8 – 23 – 2007 WON05 >54 % 33 % Not Supporting
8 – 22 – 2008 WON05 >54 % 58 % Fully Supporting
9 – 04 – 2014 WON05 >54 % 58 % Fully Supporting
9 – 05 – 2014 WON12 >54 % 83 % Fully Supporting
12. Dundery Brook & Tribs (RI0010048R-02C*) Dundery Brook from 1 mile downstream of Meetinghouse Lane to Briggs Marsh Pond.
Little Compton
*Due to cessation of a sanitary discharge into Dundery Brook & Tribs, segmentation is no longer needed. For the 2016
Integrated Reporting assessment cycle, segments A, B, and C were retired, and the original waterbody ID of
RI0010048R-02 was reinstated, which includes all of Dundery Brook.
Benthic-Macroinvertebrate Bioassessments – Dundery Brook is listed on RI’s 2014
303(d) List of Impaired Waters as not supporting aquatic life designated use due to
benthic-macroinvertebrate bioassessments. This impairment was first listed on RI’s 2010
303(d) list/Integrated Report (IR) based on macroinvertebrate data in accordance with a
Quality Assurance Program Plan, under the Rhode Island Department of Environmental
Page 32 of 85
FINAL March 2018
Management’s Wadeable Stream Biomonitoring Program. Sampling was conducted at a
station (ESS14-red star on the map below) on Swamp Road in 2002, 2003 and 2004.
RIDEM efforts over the last ten years to refine its biological monitoring and assessment
program have resulted in a modification in the way that macroinvertebrate data is used
and how the cause benthic macroinvertebrate bioassessments is applied in the assessment
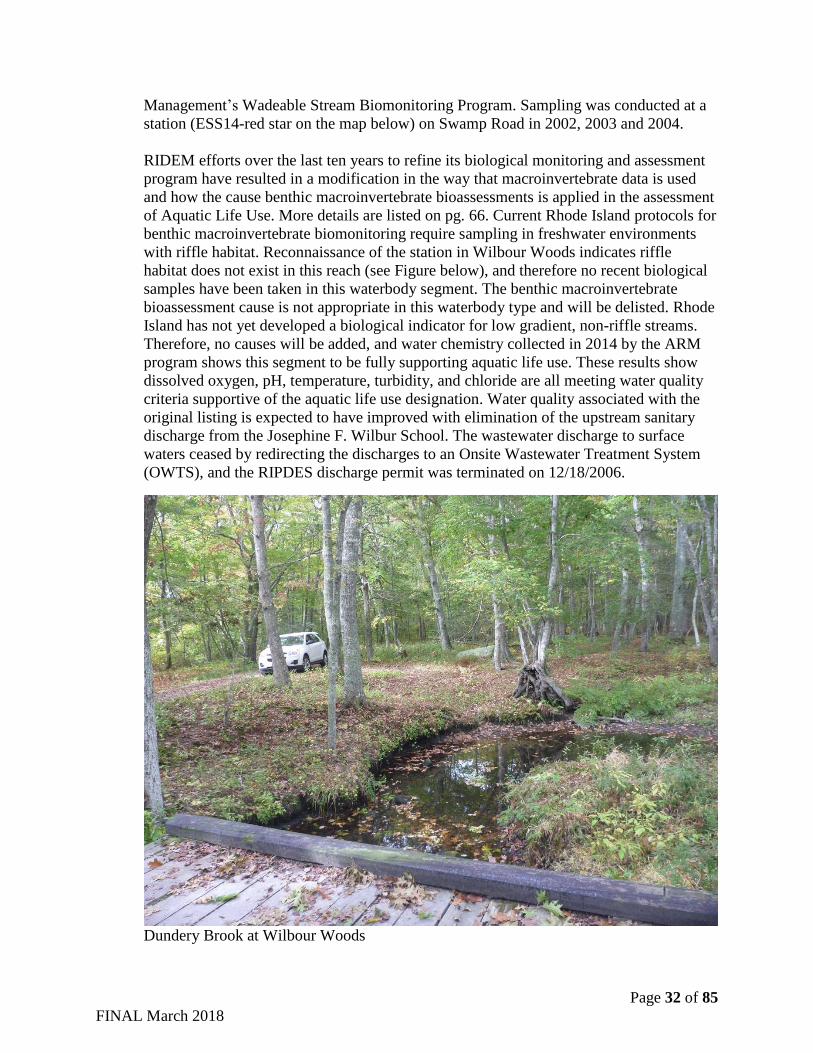
of Aquatic Life Use. More details are listed on pg. 66. Current Rhode Island protocols for
benthic macroinvertebrate biomonitoring require sampling in freshwater environments
with riffle habitat. Reconnaissance of the station in Wilbour Woods indicates riffle
habitat does not exist in this reach (see Figure below), and therefore no recent biological
samples have been taken in this waterbody segment. The benthic macroinvertebrate
bioassessment cause is not appropriate in this waterbody type and will be delisted. Rhode
Island has not yet developed a biological indicator for low gradient, non-riffle streams.
Therefore, no causes will be added, and water chemistry collected in 2014 by the ARM
program shows this segment to be fully supporting aquatic life use. These results show
dissolved oxygen, pH, temperature, turbidity, and chloride are all meeting water quality
criteria supportive of the aquatic life use designation. Water quality associated with the
original listing is expected to have improved with elimination of the upstream sanitary
discharge from the Josephine F. Wilbur School. The wastewater discharge to surface
waters ceased by redirecting the discharges to an Onsite Wastewater Treatment System
(OWTS), and the RIPDES discharge permit was terminated on 12/18/2006.
Dundery Brook at Wilbour Woods
Page 33 of 85
FINAL March 2018
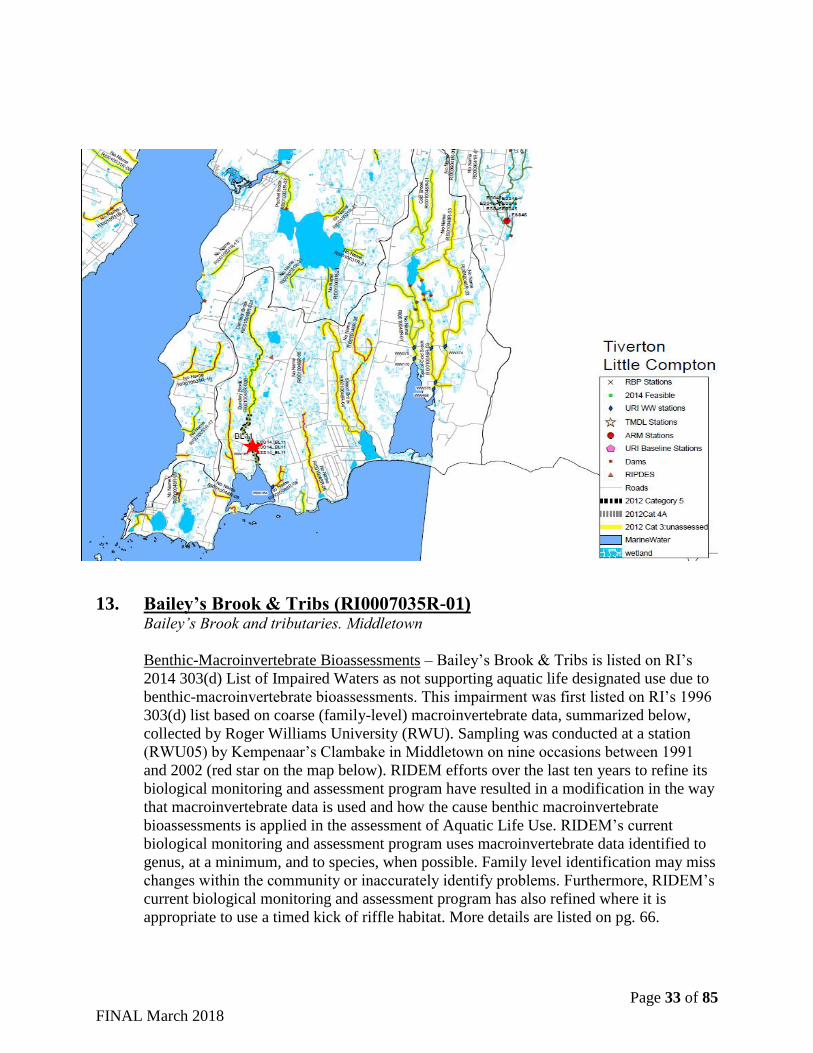
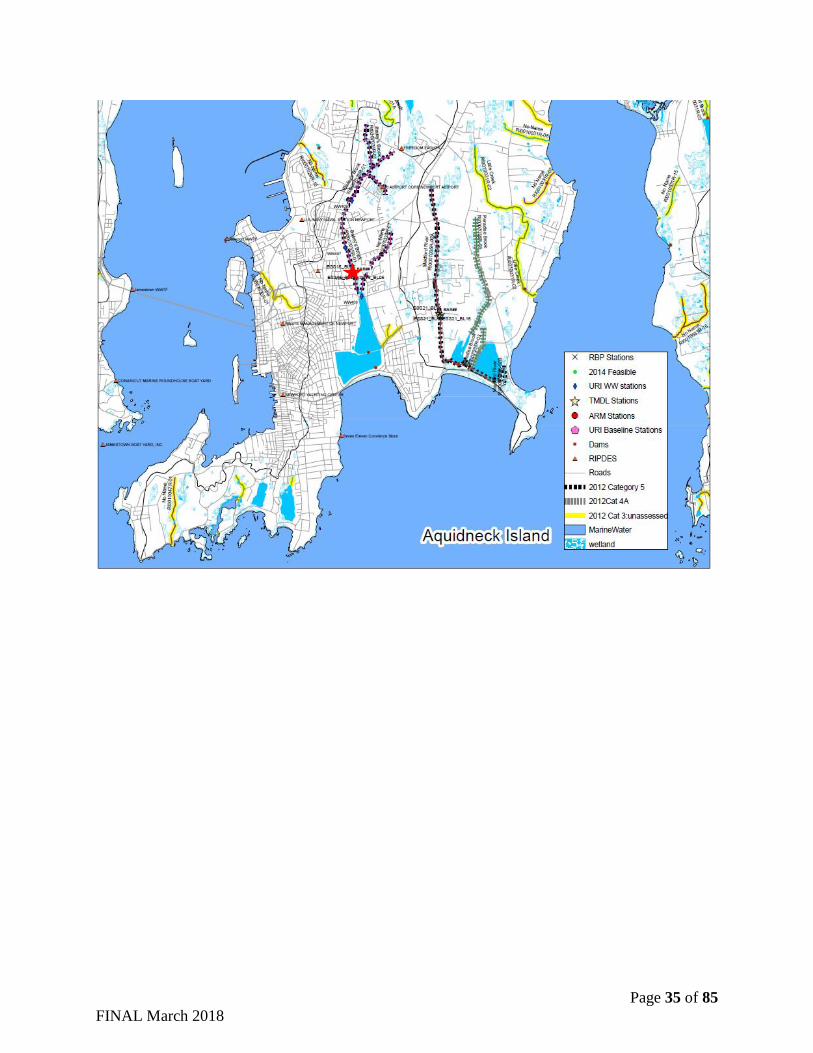
13. Bailey’s Brook & Tribs (RI0007035R-01) Bailey’s Brook and tributaries. Middletown
Benthic-Macroinvertebrate Bioassessments – Bailey’s Brook & Tribs is listed on RI’s
2014 303(d) List of Impaired Waters as not supporting aquatic life designated use due to
benthic-macroinvertebrate bioassessments. This impairment was first listed on RI’s 1996
303(d) list based on coarse (family-level) macroinvertebrate data, summarized below,
collected by Roger Williams University (RWU). Sampling was conducted at a station
(RWU05) by Kempenaar’s Clambake in Middletown on nine occasions between 1991
and 2002 (red star on the map below). RIDEM efforts over the last ten years to refine its
biological monitoring and assessment program have resulted in a modification in the way
that macroinvertebrate data is used and how the cause benthic macroinvertebrate
bioassessments is applied in the assessment of Aquatic Life Use. RIDEM’s current
biological monitoring and assessment program uses macroinvertebrate data identified to
genus, at a minimum, and to species, when possible. Family level identification may miss
changes within the community or inaccurately identify problems. Furthermore, RIDEM’s
current biological monitoring and assessment program has also refined where it is
appropriate to use a timed kick of riffle habitat. More details are listed on pg. 66.
Page 34 of 85
FINAL March 2018
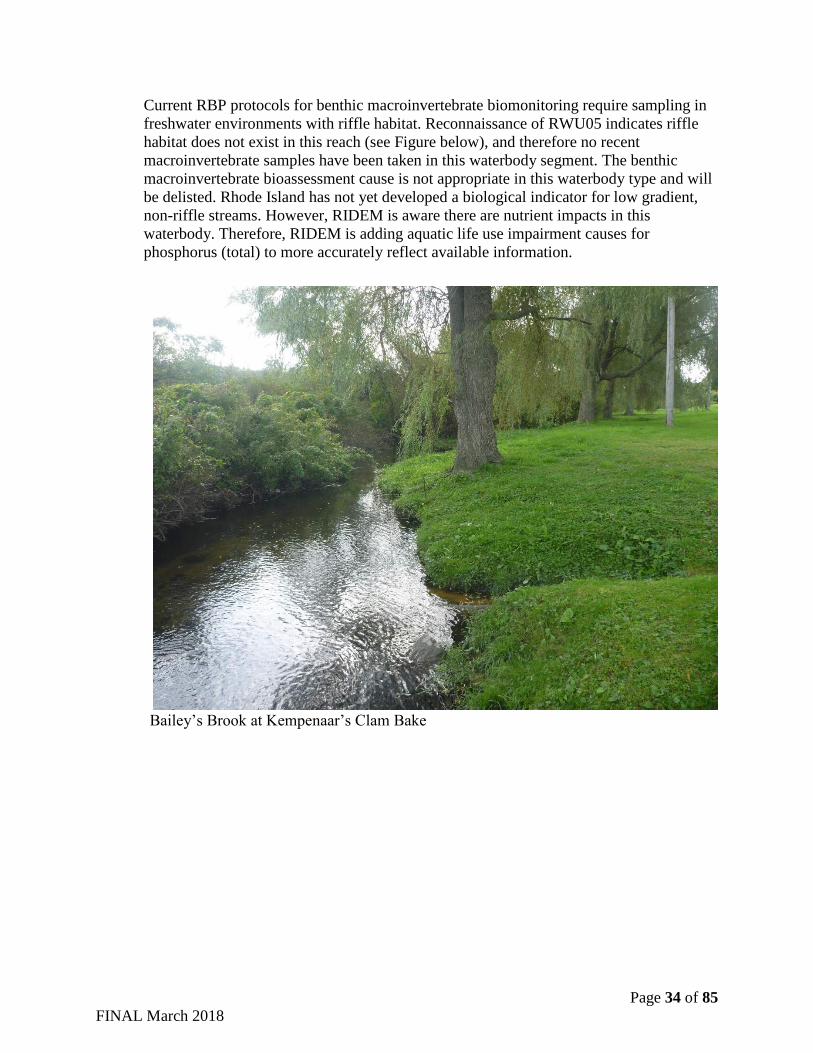
Current RBP protocols for benthic macroinvertebrate biomonitoring require sampling in
freshwater environments with riffle habitat. Reconnaissance of RWU05 indicates riffle
habitat does not exist in this reach (see Figure below), and therefore no recent
macroinvertebrate samples have been taken in this waterbody segment. The benthic
macroinvertebrate bioassessment cause is not appropriate in this waterbody type and will
be delisted. Rhode Island has not yet developed a biological indicator for low gradient,
non-riffle streams. However, RIDEM is aware there are nutrient impacts in this
waterbody. Therefore, RIDEM is adding aquatic life use impairment causes for
phosphorus (total) to more accurately reflect available information.
Bailey’s Brook at Kempenaar’s Clam Bake
Page 35 of 85
FINAL March 2018
Page 36 of 85
FINAL March 2018
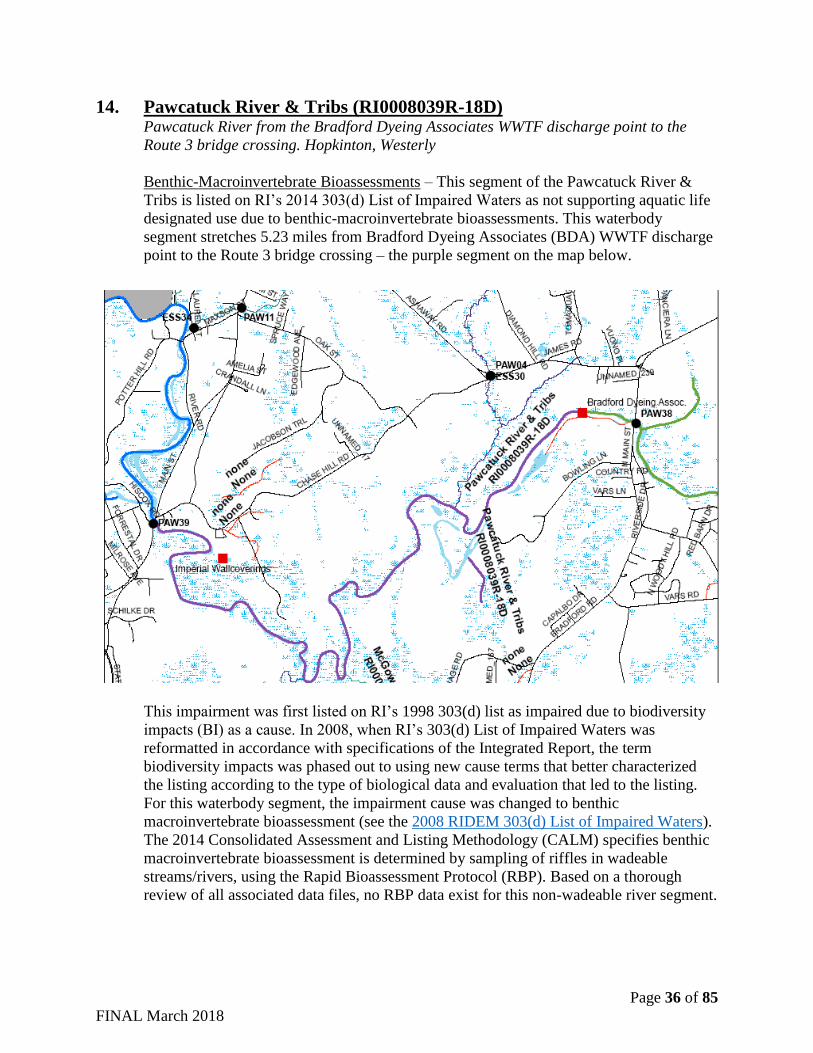
14. Pawcatuck River & Tribs (RI0008039R-18D) Pawcatuck River from the Bradford Dyeing Associates WWTF discharge point to the
Route 3 bridge crossing. Hopkinton, Westerly
Benthic-Macroinvertebrate Bioassessments – This segment of the Pawcatuck River &
Tribs is listed on RI’s 2014 303(d) List of Impaired Waters as not supporting aquatic life
designated use due to benthic-macroinvertebrate bioassessments. This waterbody
segment stretches 5.23 miles from Bradford Dyeing Associates (BDA) WWTF discharge
point to the Route 3 bridge crossing – the purple segment on the map below.
This impairment was first listed on RI’s 1998 303(d) list as impaired due to biodiversity
impacts (BI) as a cause. In 2008, when RI’s 303(d) List of Impaired Waters was
reformatted in accordance with specifications of the Integrated Report, the term
biodiversity impacts was phased out to using new cause terms that better characterized
the listing according to the type of biological data and evaluation that led to the listing.
For this waterbody segment, the impairment cause was changed to benthic
macroinvertebrate bioassessment (see the 2008 RIDEM 303(d) List of Impaired Waters).
The 2014 Consolidated Assessment and Listing Methodology (CALM) specifies benthic
macroinvertebrate bioassessment is determined by sampling of riffles in wadeable
streams/rivers, using the Rapid Bioassessment Protocol (RBP). Based on a thorough
review of all associated data files, no RBP data exist for this non-wadeable river segment.
Page 37 of 85
FINAL March 2018
The 1998 listing was based on a 1997 visual observation, by RIDEM OWR staff, of
excessive amounts of sulfur-fixing bacteria that were observed in the river just upstream
of BDA’s discharge. At the time, it was suspected this was a result of BDA’s use of
sulfuric acid in an unlined pH neutralization lagoon. Since then, DEM RIPDES
Permitting Program required BDA to modify its neutralization process so they no longer
used the lagoon and instead use an indoor computerized system to maintain pH (OWR
Inter-office Memo “Changes to Bradford Dyeing Association’s Whole Effluent Toxicity
(WET) Limits” dated May 24, 2005). Subsequent visual inspection of the shoreline by
boat in 2011 by RIDEM OWR staff along the entire length of the segment to document
conditions found no visual evidence of a white substance or sulfur-fixing bacteria. In
2015, the Bradford Dyeing Association Facility ceased discharge of effluent, and no
future discharges are anticipated.
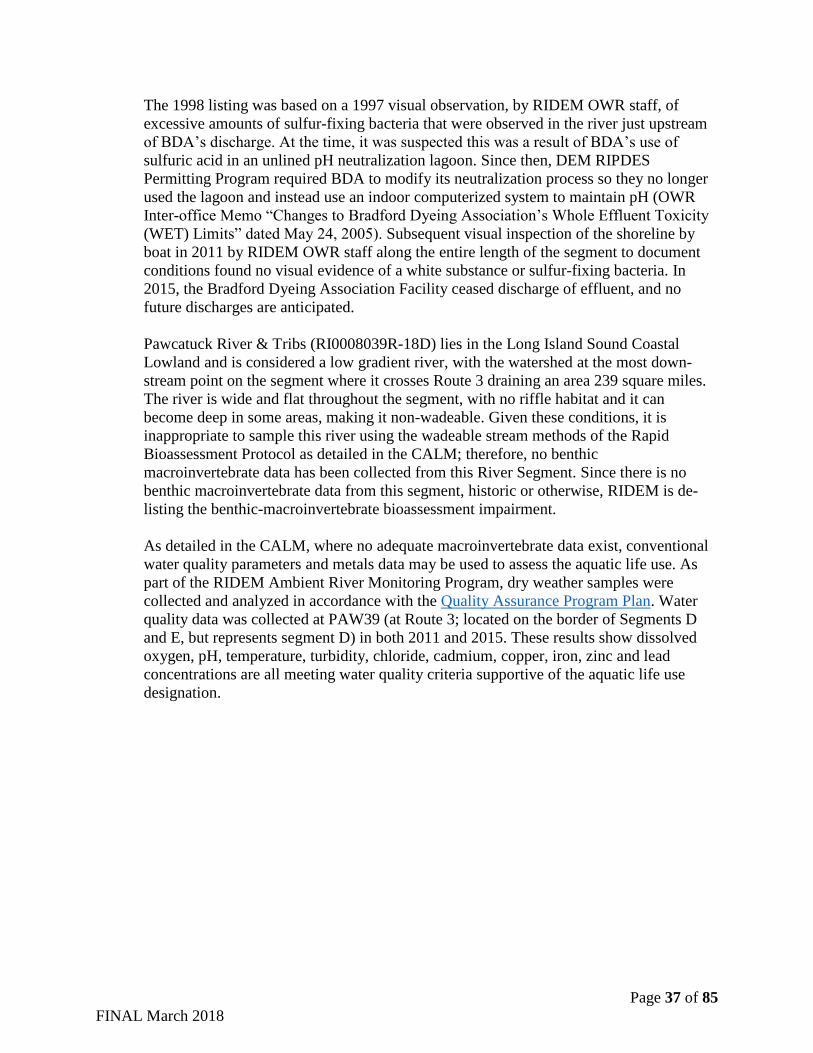
Pawcatuck River & Tribs (RI0008039R-18D) lies in the Long Island Sound Coastal
Lowland and is considered a low gradient river, with the watershed at the most down-
stream point on the segment where it crosses Route 3 draining an area 239 square miles.
The river is wide and flat throughout the segment, with no riffle habitat and it can
become deep in some areas, making it non-wadeable. Given these conditions, it is
inappropriate to sample this river using the wadeable stream methods of the Rapid
Bioassessment Protocol as detailed in the CALM; therefore, no benthic
macroinvertebrate data has been collected from this River Segment. Since there is no
benthic macroinvertebrate data from this segment, historic or otherwise, RIDEM is de-
listing the benthic-macroinvertebrate bioassessment impairment.
As detailed in the CALM, where no adequate macroinvertebrate data exist, conventional
water quality parameters and metals data may be used to assess the aquatic life use. As
part of the RIDEM Ambient River Monitoring Program, dry weather samples were
collected and analyzed in accordance with the Quality Assurance Program Plan. Water
quality data was collected at PAW39 (at Route 3; located on the border of Segments D
and E, but represents segment D) in both 2011 and 2015. These results show dissolved
oxygen, pH, temperature, turbidity, chloride, cadmium, copper, iron, zinc and lead
concentrations are all meeting water quality criteria supportive of the aquatic life use
designation.
Page 38 of 85
FINAL March 2018
15. Maidford River (RI0007035R-02B)* Maidford River from the water supply diversion near Paradise Ct. to Hanging Rock Rd.,
Middletown.
*Segmentation of the Maidford River has changed several times over the past two decades in response to
available information. With this 2016 Integrated Reporting assessment cycle, the Maidford River segments
have been updated to more accurately reflect salinity and other conditions on Maidford River. Segment 2A
is now defined as extending from the headwaters to the diversion structure of the Newport Water Division
(NWD) on Paradise Avenue, and Segment 2B is defined as extending from the NWD diversion structure to
Hanging Rock Road. A new waterbody ID, classified as salt water based on salinity readings has been
added for the lower reach from Hanging Rock Road to Third Beach (RI0007035E-01).
Benthic-Macroinvertebrate Bioassessments – Maidford River (Segment 2B) is listed on
RI’s 2014 303(d) List of Impaired Waters as not supporting aquatic life designated use
due to benthic-macroinvertebrate bioassessments. This impairment was first listed on
RI’s 1996 303(d) List due to biodiversity impacts when Maidford River was assessed as
one waterbody identification number (RI0007035R-02). The 1996 impairment on
Maidford River (RI0007035R-02) was based on coarse (family level) macroinvertebrate
data collected by Roger Williams University in 1991 & 1992 at a station (RWU27 aka
ESS21) located on Prospect Avenue in Middletown (in what is now Maidford River
Segment 2A). RIDEM efforts over the last ten years to refine its biological monitoring
and assessment program have resulted in a modification in the way that
macroinvertebrate data is used and how the cause benthic macroinvertebrate
bioassessments is applied in the assessment of Aquatic Life Use. RIDEM’s current
biological monitoring and assessment program uses macroinvertebrate data identified to
genus, at a minimum, and to species, when possible. Family level identification may miss
changes within the community or inaccurately identify problems. Furthermore, RIDEM’s
current biological monitoring and assessment program has also refined where it is
appropriate to use a timed kick of riffle habitat. More details are listed on pg. 66.
Maidford River was split into two segments for the 2000 State of the State’s Water
Report due to water quality samples collected (July and August 2000) near Third Beach
showing the lower reach’s recreation/swimming use was impaired for pathogens (shown
in the first map below). All impairments from the once unified Maidford River
assessment unit, including the biodiversity impairment from station RWU27/ESS21,
were applied to the new segments. The benthic macroinvertebrate impairment
documented at Station RWU27/ESS 21 at Paradise Avenue should not be applied
downstream to either the newly defined segment 2B due to this reach’s watershed/stream
characteristics or the newly created salt water segment RI0007035E-01, as further
described below.
Current RBP protocols for benthic macroinvertebrate biomonitoring require sampling in
freshwater environments with riffle habitat. Reconnaissance of several locations along
the newly defined Segment 2B (from the Newport Water Supply diversion to Hanging
Rock Road) of the Maidford River by RIDEM in 2013 show this riffle habitat does not
exist in this reach, and therefore no recent biological samples have been taken in this
waterbody segment. The benthic macroinvertebrate bioassessment cause is not
Page 39 of 85
FINAL March 2018
appropriate in this waterbody type and will be delisted. Rhode Island has not yet
developed a biological indicator for low gradient, non-riffle streams.
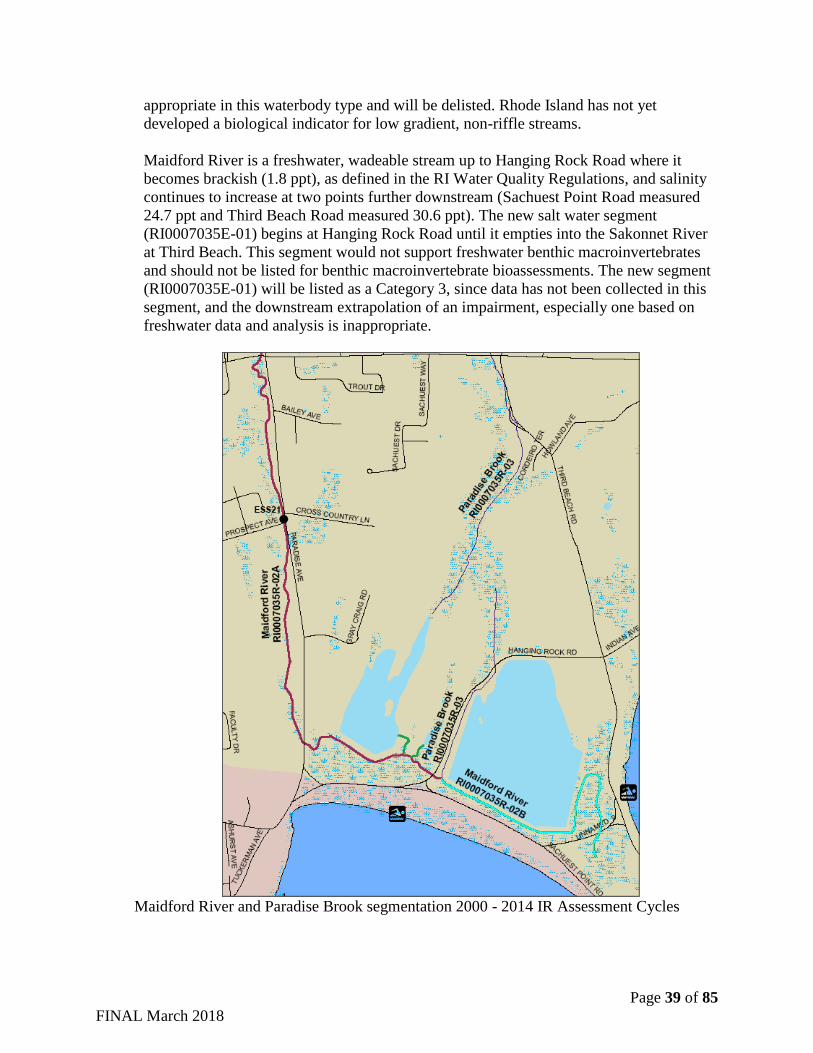
Maidford River is a freshwater, wadeable stream up to Hanging Rock Road where it
becomes brackish (1.8 ppt), as defined in the RI Water Quality Regulations, and salinity
continues to increase at two points further downstream (Sachuest Point Road measured
24.7 ppt and Third Beach Road measured 30.6 ppt). The new salt water segment
(RI0007035E-01) begins at Hanging Rock Road until it empties into the Sakonnet River
at Third Beach. This segment would not support freshwater benthic macroinvertebrates
and should not be listed for benthic macroinvertebrate bioassessments. The new segment
(RI0007035E-01) will be listed as a Category 3, since data has not been collected in this
segment, and the downstream extrapolation of an impairment, especially one based on
freshwater data and analysis is inappropriate.
Maidford River and Paradise Brook segmentation 2000 - 2014 IR Assessment Cycles
Page 40 of 85
FINAL March 2018
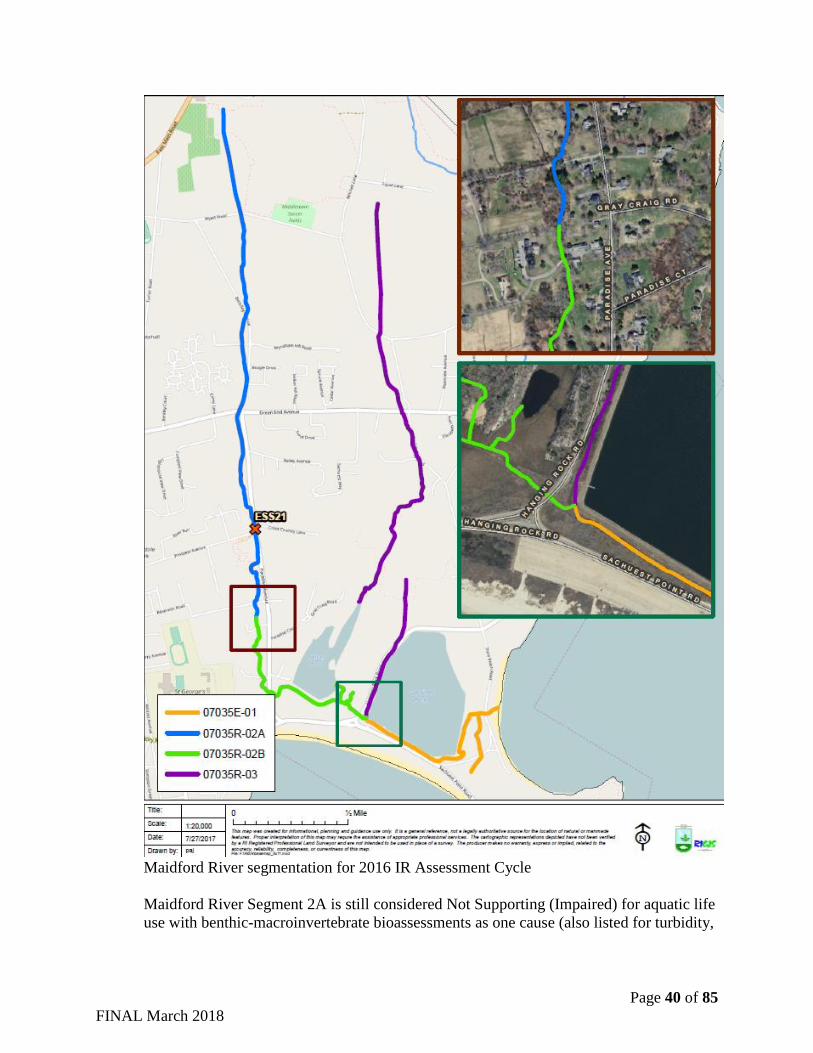
Maidford River segmentation for 2016 IR Assessment Cycle
Maidford River Segment 2A is still considered Not Supporting (Impaired) for aquatic life
use with benthic-macroinvertebrate bioassessments as one cause (also listed for turbidity,
Page 41 of 85
FINAL March 2018
lead, and total phosphorus as aquatic life impairment causes) based on the samples for the
original impairment listing at ESS21.
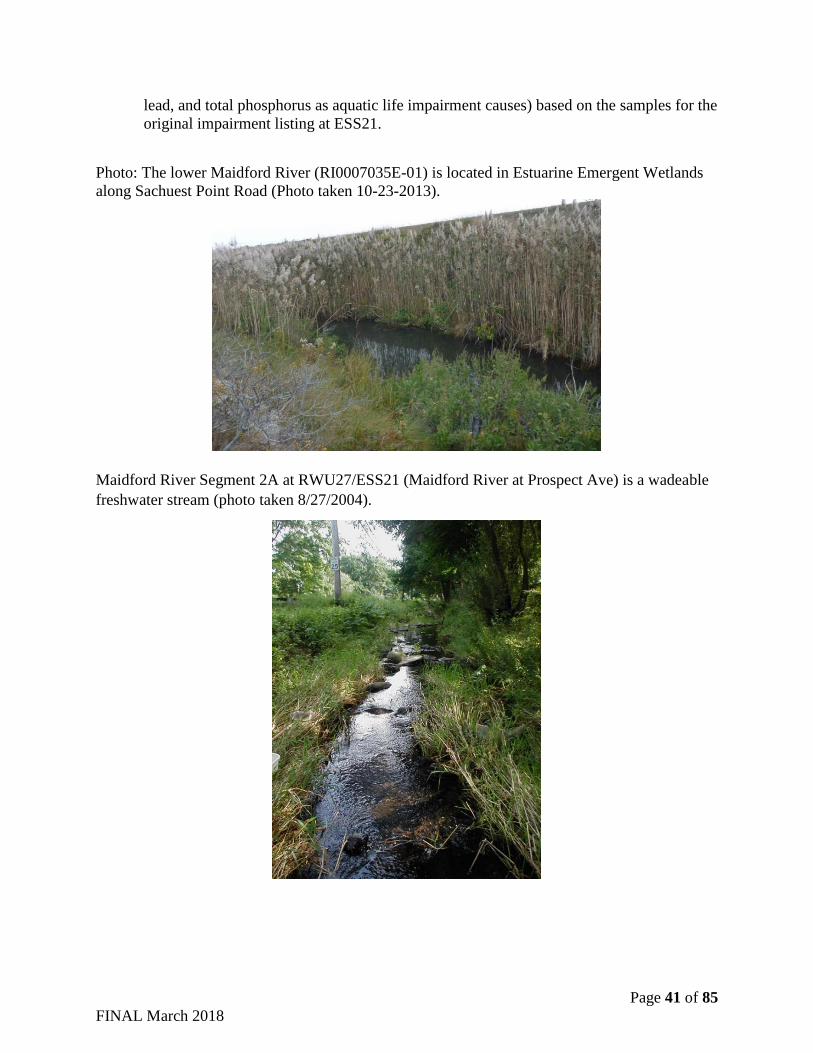
Photo: The lower Maidford River (RI0007035E-01) is located in Estuarine Emergent Wetlands
along Sachuest Point Road (Photo taken 10-23-2013).
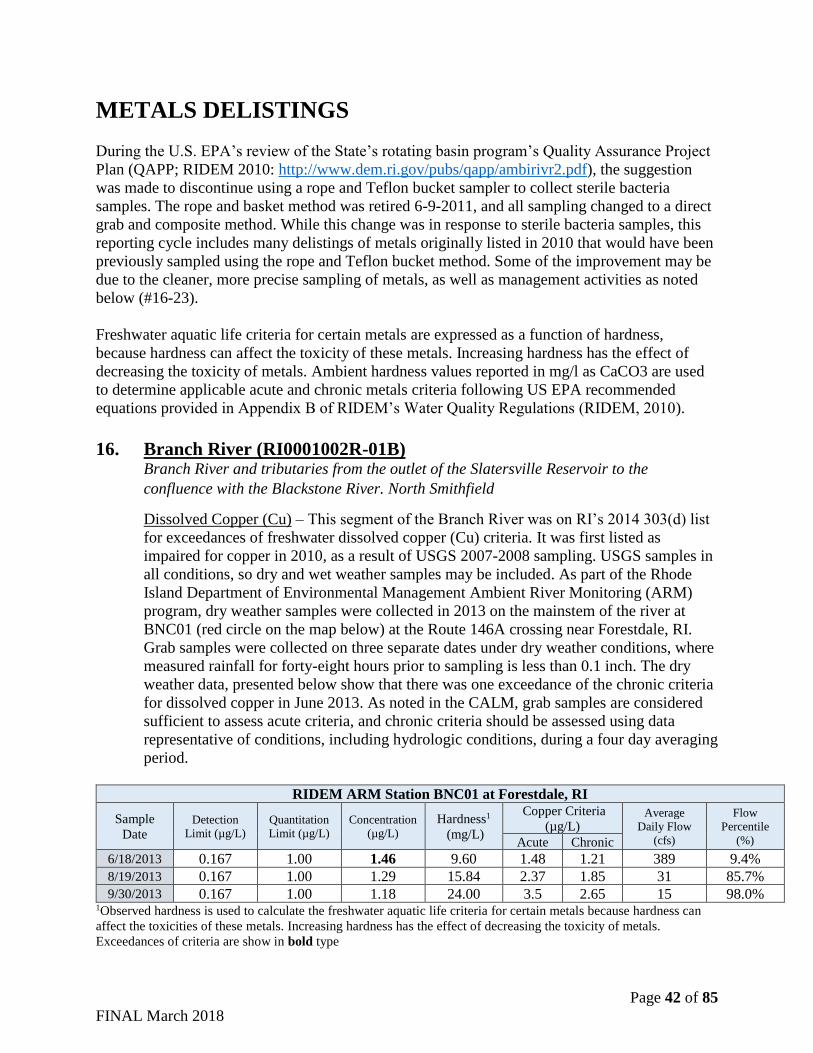
Maidford River Segment 2A at RWU27/ESS21 (Maidford River at Prospect Ave) is a wadeable
freshwater stream (photo taken 8/27/2004).
Page 42 of 85
FINAL March 2018
METALS DELISTINGS
During the U.S. EPA’s review of the State’s rotating basin program’s Quality Assurance Project
Plan (QAPP; RIDEM 2010: http://www.dem.ri.gov/pubs/qapp/ambirivr2.pdf), the suggestion
was made to discontinue using a rope and Teflon bucket sampler to collect sterile bacteria
samples. The rope and basket method was retired 6-9-2011, and all sampling changed to a direct
grab and composite method. While this change was in response to sterile bacteria samples, this
reporting cycle includes many delistings of metals originally listed in 2010 that would have been
previously sampled using the rope and Teflon bucket method. Some of the improvement may be
due to the cleaner, more precise sampling of metals, as well as management activities as noted
below (#16-23).
Freshwater aquatic life criteria for certain metals are expressed as a function of hardness,
because hardness can affect the toxicity of these metals. Increasing hardness has the effect of
decreasing the toxicity of metals. Ambient hardness values reported in mg/l as CaCO3 are used
to determine applicable acute and chronic metals criteria following US EPA recommended
equations provided in Appendix B of RIDEM’s Water Quality Regulations (RIDEM, 2010).
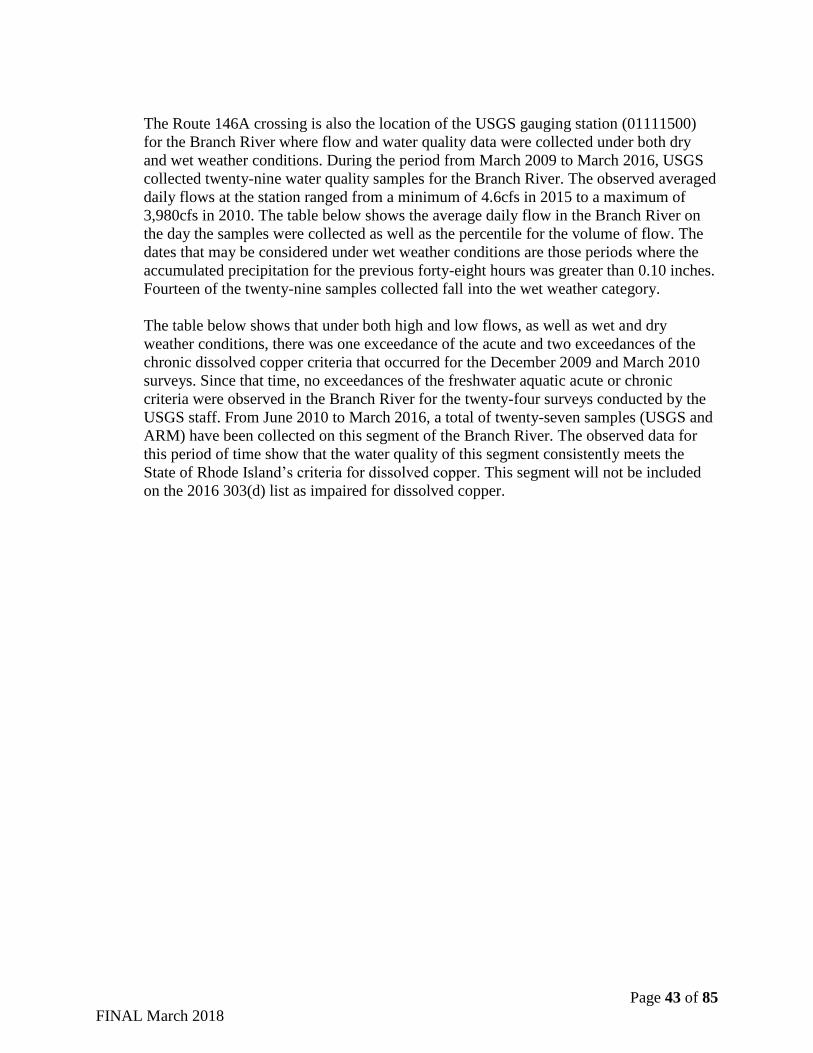
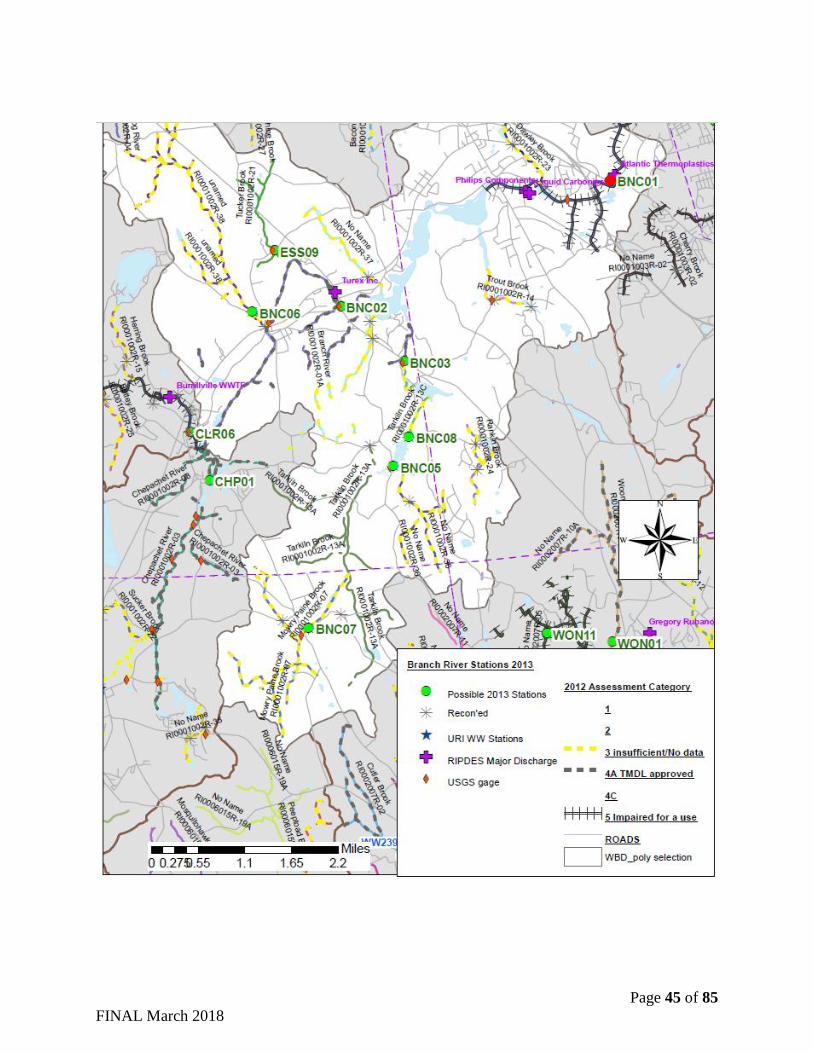
16. Branch River (RI0001002R-01B) Branch River and tributaries from the outlet of the Slatersville Reservoir to the
confluence with the Blackstone River. North Smithfield
Dissolved Copper (Cu) – This segment of the Branch River was on RI’s 2014 303(d) list
for exceedances of freshwater dissolved copper (Cu) criteria. It was first listed as
impaired for copper in 2010, as a result of USGS 2007-2008 sampling. USGS samples in
all conditions, so dry and wet weather samples may be included. As part of the Rhode
Island Department of Environmental Management Ambient River Monitoring (ARM)
program, dry weather samples were collected in 2013 on the mainstem of the river at
BNC01 (red circle on the map below) at the Route 146A crossing near Forestdale, RI.
Grab samples were collected on three separate dates under dry weather conditions, where
measured rainfall for forty-eight hours prior to sampling is less than 0.1 inch. The dry
weather data, presented below show that there was one exceedance of the chronic criteria
for dissolved copper in June 2013. As noted in the CALM, grab samples are considered
sufficient to assess acute criteria, and chronic criteria should be assessed using data
representative of conditions, including hydrologic conditions, during a four day averaging
period.
RIDEM ARM Station BNC01 at Forestdale, RI
Sample
Date Detection
Limit (µg/L) Quantitation
Limit (µg/L) Concentration
(µg/L) Hardness1
(mg/L)
Copper Criteria
(µg/L) Average
Daily Flow
(cfs)
Flow
Percentile
(%) Acute Chronic 6/18/2013 0.167 1.00 1.46 9.60 1.48 1.21 389 9.4%
8/19/2013 0.167 1.00 1.29 15.84 2.37 1.85 31 85.7% 9/30/2013 0.167 1.00 1.18 24.00 3.5 2.65 15 98.0%
1Observed hardness is used to calculate the freshwater aquatic life criteria for certain metals because hardness can
affect the toxicities of these metals. Increasing hardness has the effect of decreasing the toxicity of metals.
Exceedances of criteria are show in bold type
Page 43 of 85
FINAL March 2018
The Route 146A crossing is also the location of the USGS gauging station (01111500)
for the Branch River where flow and water quality data were collected under both dry
and wet weather conditions. During the period from March 2009 to March 2016, USGS
collected twenty-nine water quality samples for the Branch River. The observed averaged
daily flows at the station ranged from a minimum of 4.6cfs in 2015 to a maximum of
3,980cfs in 2010. The table below shows the average daily flow in the Branch River on
the day the samples were collected as well as the percentile for the volume of flow. The
dates that may be considered under wet weather conditions are those periods where the
accumulated precipitation for the previous forty-eight hours was greater than 0.10 inches.
Fourteen of the twenty-nine samples collected fall into the wet weather category.
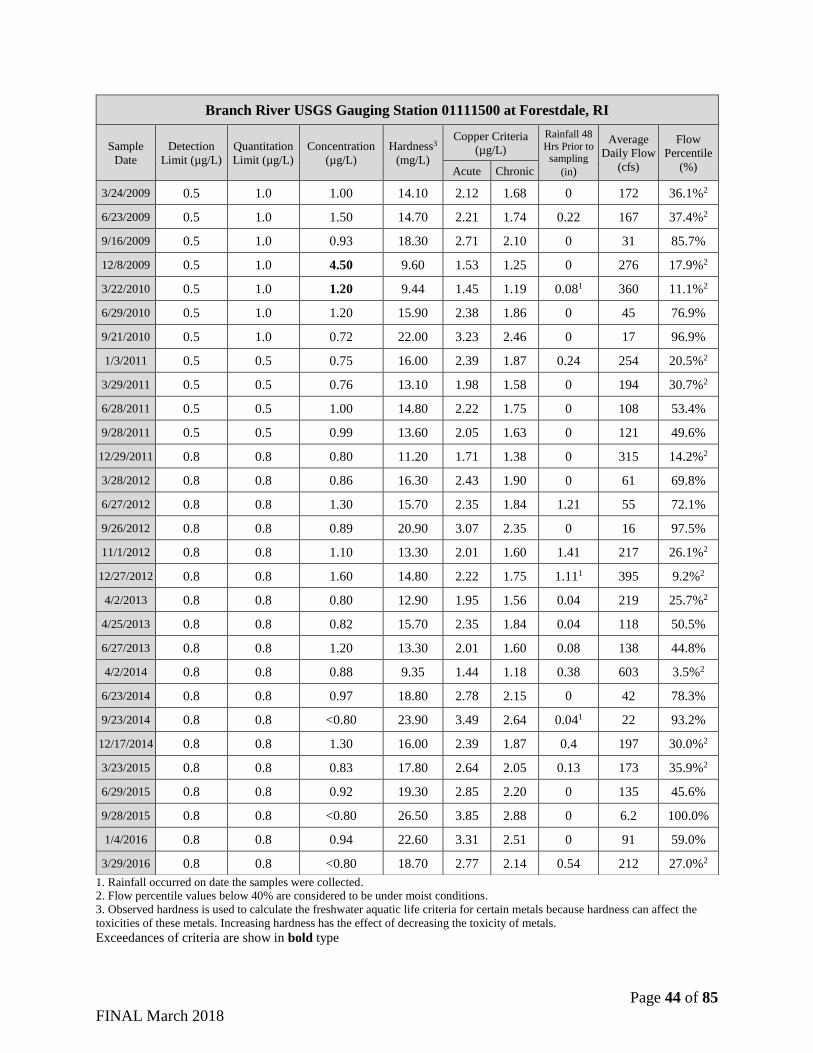
The table below shows that under both high and low flows, as well as wet and dry
weather conditions, there was one exceedance of the acute and two exceedances of the
chronic dissolved copper criteria that occurred for the December 2009 and March 2010
surveys. Since that time, no exceedances of the freshwater aquatic acute or chronic
criteria were observed in the Branch River for the twenty-four surveys conducted by the
USGS staff. From June 2010 to March 2016, a total of twenty-seven samples (USGS and
ARM) have been collected on this segment of the Branch River. The observed data for
this period of time show that the water quality of this segment consistently meets the
State of Rhode Island’s criteria for dissolved copper. This segment will not be included
on the 2016 303(d) list as impaired for dissolved copper.
Page 44 of 85
FINAL March 2018
1. Rainfall occurred on date the samples were collected. 2. Flow percentile values below 40% are considered to be under moist conditions. 3. Observed hardness is used to calculate the freshwater aquatic life criteria for certain metals because hardness can affect the
toxicities of these metals. Increasing hardness has the effect of decreasing the toxicity of metals. Exceedances of criteria are show in bold type
Branch River USGS Gauging Station 01111500 at Forestdale, RI
Sample
Date
Detection
Limit (µg/L)
Quantitation
Limit (µg/L)
Concentration
(µg/L)
Hardness3
(mg/L)
Copper Criteria
(µg/L)
Rainfall 48
Hrs Prior to sampling
(in)
Average
Daily Flow
(cfs)
Flow
Percentile
(%) Acute Chronic
3/24/2009 0.5 1.0 1.00 14.10 2.12 1.68 0 172 36.1%2
6/23/2009 0.5 1.0 1.50 14.70 2.21 1.74 0.22 167 37.4%2
9/16/2009 0.5 1.0 0.93 18.30 2.71 2.10 0 31 85.7%
12/8/2009 0.5 1.0 4.50 9.60 1.53 1.25 0 276 17.9%2
3/22/2010 0.5 1.0 1.20 9.44 1.45 1.19 0.081 360 11.1%2
6/29/2010 0.5 1.0 1.20 15.90 2.38 1.86 0 45 76.9%
9/21/2010 0.5 1.0 0.72 22.00 3.23 2.46 0 17 96.9%
1/3/2011 0.5 0.5 0.75 16.00 2.39 1.87 0.24 254 20.5%2
3/29/2011 0.5 0.5 0.76 13.10 1.98 1.58 0 194 30.7%2
6/28/2011 0.5 0.5 1.00 14.80 2.22 1.75 0 108 53.4%
9/28/2011 0.5 0.5 0.99 13.60 2.05 1.63 0 121 49.6%
12/29/2011 0.8 0.8 0.80 11.20 1.71 1.38 0 315 14.2%2
3/28/2012 0.8 0.8 0.86 16.30 2.43 1.90 0 61 69.8%
6/27/2012 0.8 0.8 1.30 15.70 2.35 1.84 1.21 55 72.1%
9/26/2012 0.8 0.8 0.89 20.90 3.07 2.35 0 16 97.5%
11/1/2012 0.8 0.8 1.10 13.30 2.01 1.60 1.41 217 26.1%2
12/27/2012 0.8 0.8 1.60 14.80 2.22 1.75 1.111 395 9.2%2
4/2/2013 0.8 0.8 0.80 12.90 1.95 1.56 0.04 219 25.7%2
4/25/2013 0.8 0.8 0.82 15.70 2.35 1.84 0.04 118 50.5%
6/27/2013 0.8 0.8 1.20 13.30 2.01 1.60 0.08 138 44.8%
4/2/2014 0.8 0.8 0.88 9.35 1.44 1.18 0.38 603 3.5%2
6/23/2014 0.8 0.8 0.97 18.80 2.78 2.15 0 42 78.3%
9/23/2014 0.8 0.8 <0.80 23.90 3.49 2.64 0.041 22 93.2%
12/17/2014 0.8 0.8 1.30 16.00 2.39 1.87 0.4 197 30.0%2
3/23/2015 0.8 0.8 0.83 17.80 2.64 2.05 0.13 173 35.9%2
6/29/2015 0.8 0.8 0.92 19.30 2.85 2.20 0 135 45.6%
9/28/2015 0.8 0.8 <0.80 26.50 3.85 2.88 0 6.2 100.0%
1/4/2016 0.8 0.8 0.94 22.60 3.31 2.51 0 91 59.0%
3/29/2016 0.8 0.8 <0.80 18.70 2.77 2.14 0.54 212 27.0%2
Page 45 of 85
FINAL March 2018
Page 46 of 85
FINAL March 2018
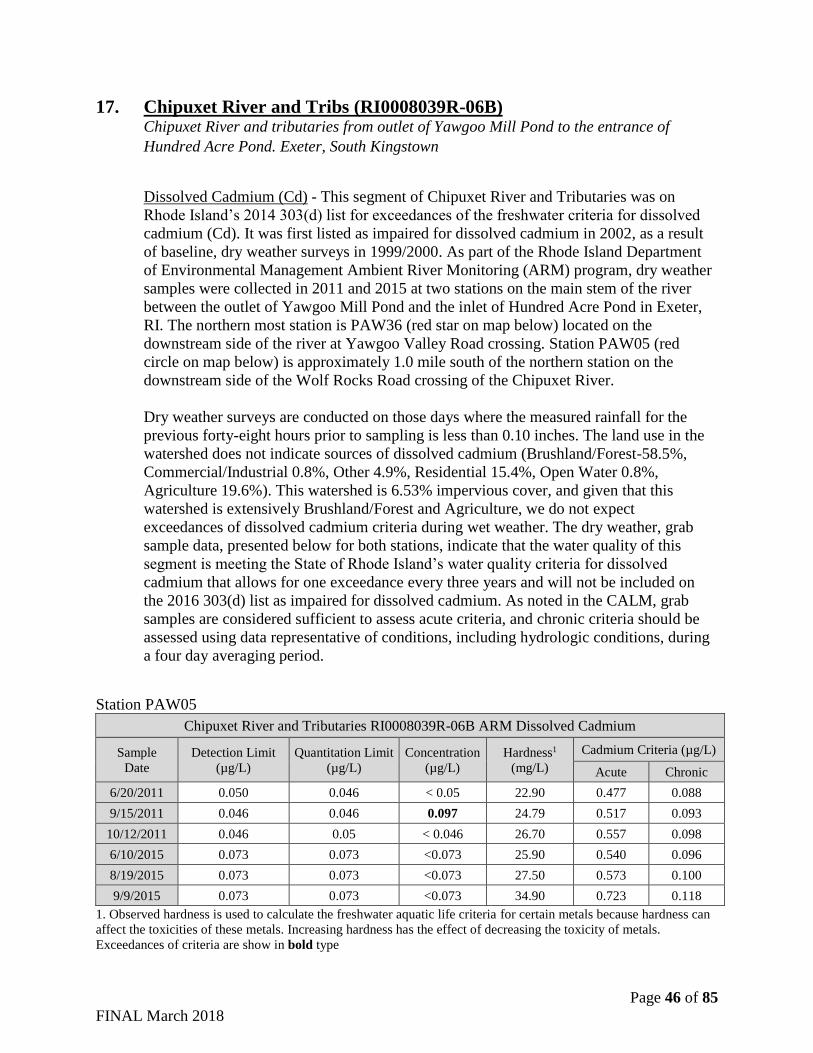
17. Chipuxet River and Tribs (RI0008039R-06B) Chipuxet River and tributaries from outlet of Yawgoo Mill Pond to the entrance of
Hundred Acre Pond. Exeter, South Kingstown
Dissolved Cadmium (Cd) - This segment of Chipuxet River and Tributaries was on
Rhode Island’s 2014 303(d) list for exceedances of the freshwater criteria for dissolved
cadmium (Cd). It was first listed as impaired for dissolved cadmium in 2002, as a result
of baseline, dry weather surveys in 1999/2000. As part of the Rhode Island Department
of Environmental Management Ambient River Monitoring (ARM) program, dry weather
samples were collected in 2011 and 2015 at two stations on the main stem of the river
between the outlet of Yawgoo Mill Pond and the inlet of Hundred Acre Pond in Exeter,
RI. The northern most station is PAW36 (red star on map below) located on the
downstream side of the river at Yawgoo Valley Road crossing. Station PAW05 (red
circle on map below) is approximately 1.0 mile south of the northern station on the
downstream side of the Wolf Rocks Road crossing of the Chipuxet River.
Dry weather surveys are conducted on those days where the measured rainfall for the
previous forty-eight hours prior to sampling is less than 0.10 inches. The land use in the
watershed does not indicate sources of dissolved cadmium (Brushland/Forest-58.5%,
Commercial/Industrial 0.8%, Other 4.9%, Residential 15.4%, Open Water 0.8%,
Agriculture 19.6%). This watershed is 6.53% impervious cover, and given that this
watershed is extensively Brushland/Forest and Agriculture, we do not expect
exceedances of dissolved cadmium criteria during wet weather. The dry weather, grab
sample data, presented below for both stations, indicate that the water quality of this
segment is meeting the State of Rhode Island’s water quality criteria for dissolved
cadmium that allows for one exceedance every three years and will not be included on
the 2016 303(d) list as impaired for dissolved cadmium. As noted in the CALM, grab
samples are considered sufficient to assess acute criteria, and chronic criteria should be
assessed using data representative of conditions, including hydrologic conditions, during
a four day averaging period.
Station PAW05
Chipuxet River and Tributaries RI0008039R-06B ARM Dissolved Cadmium
Sample
Date
Detection Limit
(µg/L)
Quantitation Limit
(µg/L)
Concentration
(µg/L)
Hardness1
(mg/L)
Cadmium Criteria (µg/L)
Acute Chronic
6/20/2011 0.050 0.046 < 0.05 22.90 0.477 0.088
9/15/2011 0.046 0.046 0.097 24.79 0.517 0.093
10/12/2011 0.046 0.05 < 0.046 26.70 0.557 0.098
6/10/2015 0.073 0.073 <0.073 25.90 0.540 0.096
8/19/2015 0.073 0.073 <0.073 27.50 0.573 0.100
9/9/2015 0.073 0.073 <0.073 34.90 0.723 0.118
1. Observed hardness is used to calculate the freshwater aquatic life criteria for certain metals because hardness can
affect the toxicities of these metals. Increasing hardness has the effect of decreasing the toxicity of metals.
Exceedances of criteria are show in bold type
Page 47 of 85
FINAL March 2018
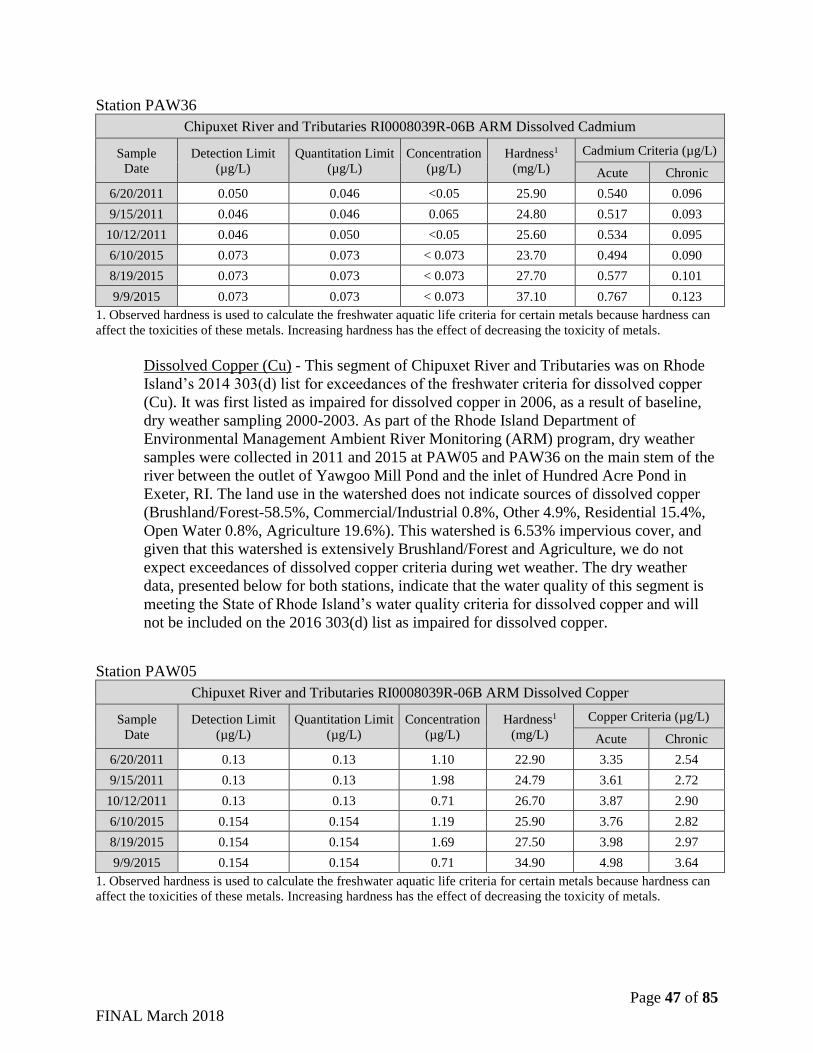
Station PAW36
Chipuxet River and Tributaries RI0008039R-06B ARM Dissolved Cadmium
Sample
Date
Detection Limit
(µg/L)
Quantitation Limit
(µg/L)
Concentration
(µg/L)
Hardness1
(mg/L)
Cadmium Criteria (µg/L)
Acute Chronic
6/20/2011 0.050 0.046 <0.05 25.90 0.540 0.096
9/15/2011 0.046 0.046 0.065 24.80 0.517 0.093
10/12/2011 0.046 0.050 <0.05 25.60 0.534 0.095
6/10/2015 0.073 0.073 < 0.073 23.70 0.494 0.090
8/19/2015 0.073 0.073 < 0.073 27.70 0.577 0.101
9/9/2015 0.073 0.073 < 0.073 37.10 0.767 0.123
1. Observed hardness is used to calculate the freshwater aquatic life criteria for certain metals because hardness can
affect the toxicities of these metals. Increasing hardness has the effect of decreasing the toxicity of metals.
Dissolved Copper (Cu) - This segment of Chipuxet River and Tributaries was on Rhode
Island’s 2014 303(d) list for exceedances of the freshwater criteria for dissolved copper
(Cu). It was first listed as impaired for dissolved copper in 2006, as a result of baseline,
dry weather sampling 2000-2003. As part of the Rhode Island Department of
Environmental Management Ambient River Monitoring (ARM) program, dry weather
samples were collected in 2011 and 2015 at PAW05 and PAW36 on the main stem of the
river between the outlet of Yawgoo Mill Pond and the inlet of Hundred Acre Pond in
Exeter, RI. The land use in the watershed does not indicate sources of dissolved copper
(Brushland/Forest-58.5%, Commercial/Industrial 0.8%, Other 4.9%, Residential 15.4%,
Open Water 0.8%, Agriculture 19.6%). This watershed is 6.53% impervious cover, and
given that this watershed is extensively Brushland/Forest and Agriculture, we do not
expect exceedances of dissolved copper criteria during wet weather. The dry weather
data, presented below for both stations, indicate that the water quality of this segment is
meeting the State of Rhode Island’s water quality criteria for dissolved copper and will
not be included on the 2016 303(d) list as impaired for dissolved copper.
Station PAW05
Chipuxet River and Tributaries RI0008039R-06B ARM Dissolved Copper
Sample
Date
Detection Limit
(µg/L)
Quantitation Limit
(µg/L)
Concentration
(µg/L)
Hardness1
(mg/L)
Copper Criteria (µg/L)
Acute Chronic
6/20/2011 0.13 0.13 1.10 22.90 3.35 2.54
9/15/2011 0.13 0.13 1.98 24.79 3.61 2.72
10/12/2011 0.13 0.13 0.71 26.70 3.87 2.90
6/10/2015 0.154 0.154 1.19 25.90 3.76 2.82
8/19/2015 0.154 0.154 1.69 27.50 3.98 2.97
9/9/2015 0.154 0.154 0.71 34.90 4.98 3.64
1. Observed hardness is used to calculate the freshwater aquatic life criteria for certain metals because hardness can
affect the toxicities of these metals. Increasing hardness has the effect of decreasing the toxicity of metals.
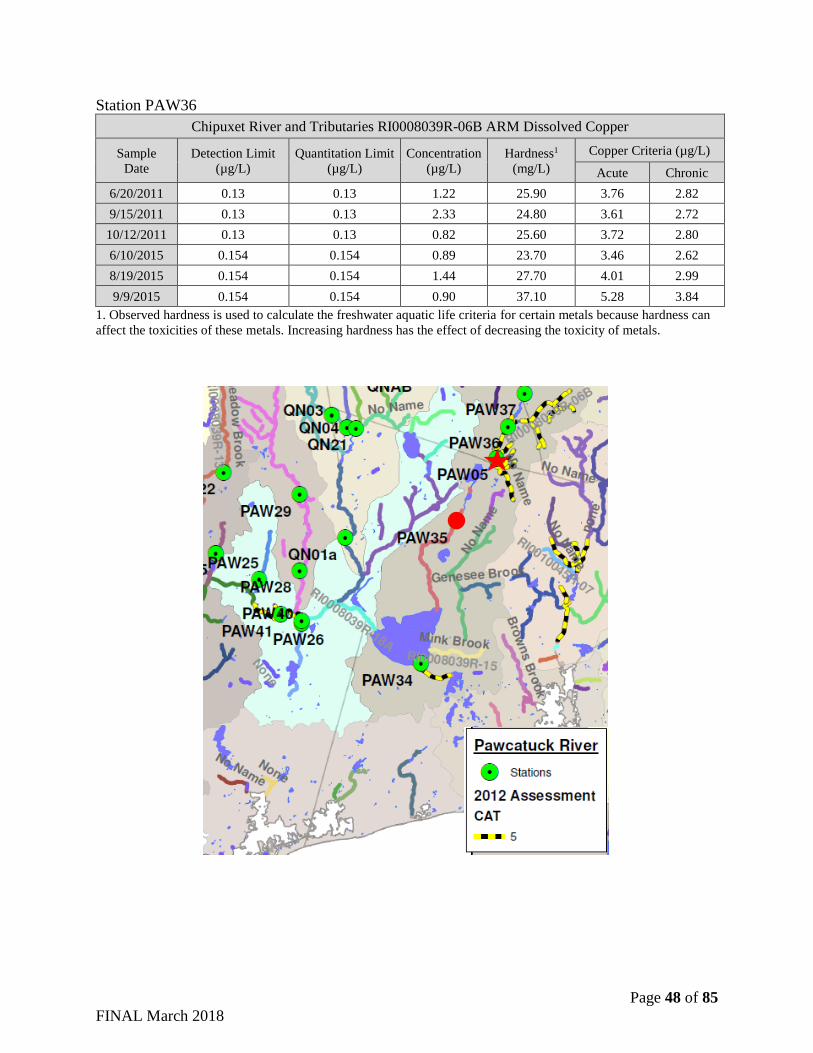
Page 48 of 85
FINAL March 2018
Station PAW36
Chipuxet River and Tributaries RI0008039R-06B ARM Dissolved Copper
Sample
Date
Detection Limit
(µg/L)
Quantitation Limit
(µg/L)
Concentration
(µg/L)
Hardness1
(mg/L)
Copper Criteria (µg/L)
Acute Chronic
6/20/2011 0.13 0.13 1.22 25.90 3.76 2.82
9/15/2011 0.13 0.13 2.33 24.80 3.61 2.72
10/12/2011 0.13 0.13 0.82 25.60 3.72 2.80
6/10/2015 0.154 0.154 0.89 23.70 3.46 2.62
8/19/2015 0.154 0.154 1.44 27.70 4.01 2.99
9/9/2015 0.154 0.154 0.90 37.10 5.28 3.84
1. Observed hardness is used to calculate the freshwater aquatic life criteria for certain metals because hardness can
affect the toxicities of these metals. Increasing hardness has the effect of decreasing the toxicity of metals.
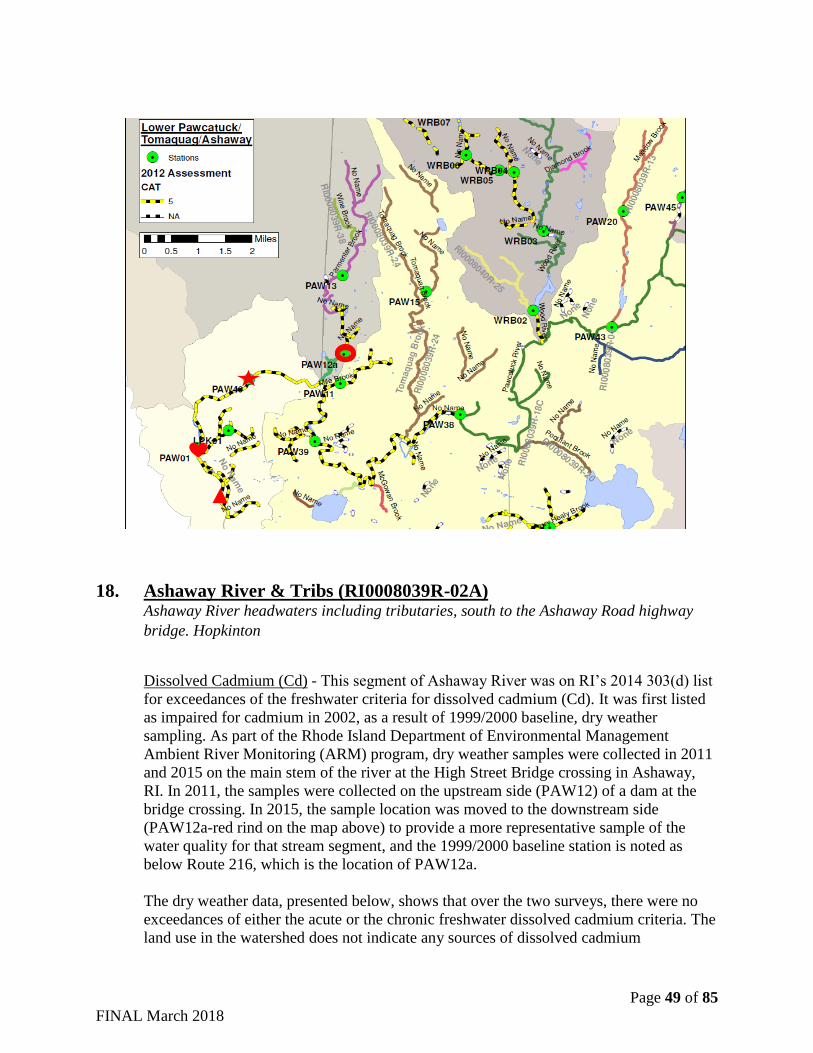
Page 49 of 85
FINAL March 2018
18. Ashaway River & Tribs (RI0008039R-02A) Ashaway River headwaters including tributaries, south to the Ashaway Road highway
bridge. Hopkinton
Dissolved Cadmium (Cd) - This segment of Ashaway River was on RI’s 2014 303(d) list
for exceedances of the freshwater criteria for dissolved cadmium (Cd). It was first listed
as impaired for cadmium in 2002, as a result of 1999/2000 baseline, dry weather
sampling. As part of the Rhode Island Department of Environmental Management
Ambient River Monitoring (ARM) program, dry weather samples were collected in 2011
and 2015 on the main stem of the river at the High Street Bridge crossing in Ashaway,
RI. In 2011, the samples were collected on the upstream side (PAW12) of a dam at the
bridge crossing. In 2015, the sample location was moved to the downstream side
(PAW12a-red rind on the map above) to provide a more representative sample of the
water quality for that stream segment, and the 1999/2000 baseline station is noted as
below Route 216, which is the location of PAW12a.
The dry weather data, presented below, shows that over the two surveys, there were no
exceedances of either the acute or the chronic freshwater dissolved cadmium criteria. The
land use in the watershed does not indicate any sources of dissolved cadmium
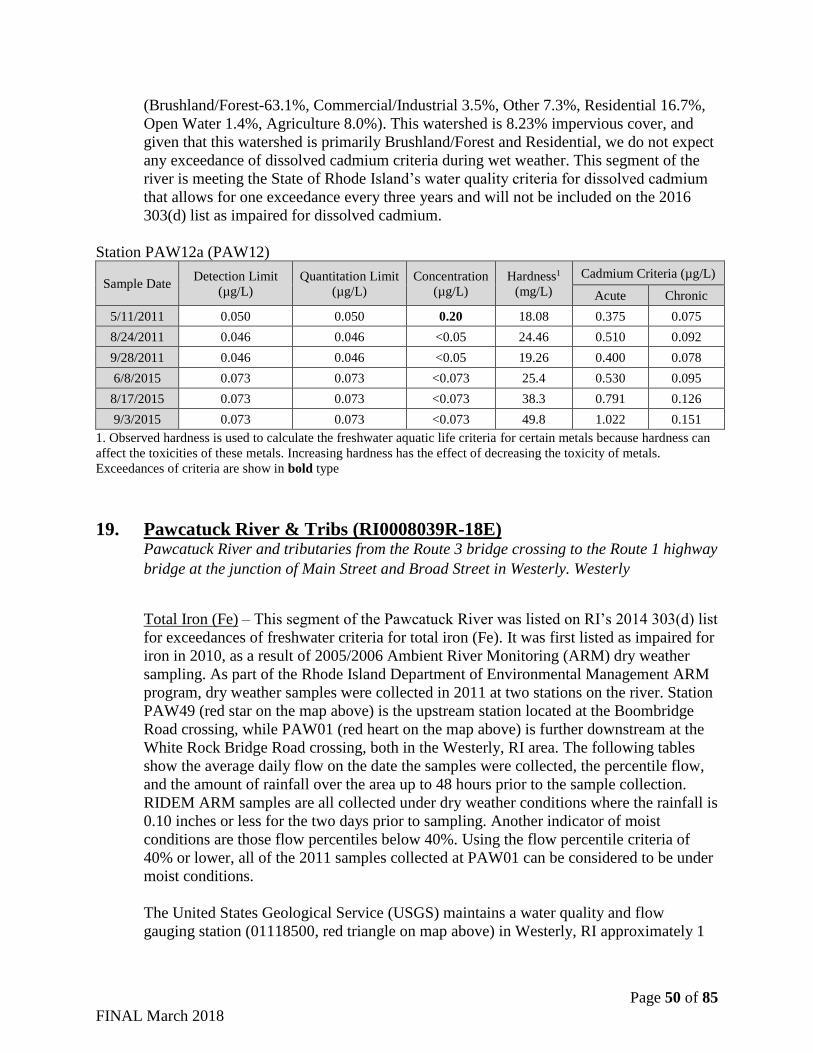
Page 50 of 85
FINAL March 2018
(Brushland/Forest-63.1%, Commercial/Industrial 3.5%, Other 7.3%, Residential 16.7%,
Open Water 1.4%, Agriculture 8.0%). This watershed is 8.23% impervious cover, and
given that this watershed is primarily Brushland/Forest and Residential, we do not expect
any exceedance of dissolved cadmium criteria during wet weather. This segment of the
river is meeting the State of Rhode Island’s water quality criteria for dissolved cadmium
that allows for one exceedance every three years and will not be included on the 2016
303(d) list as impaired for dissolved cadmium.
Station PAW12a (PAW12)
Sample Date Detection Limit
(µg/L)
Quantitation Limit
(µg/L)
Concentration
(µg/L)
Hardness1
(mg/L)
Cadmium Criteria (µg/L)
Acute Chronic
5/11/2011 0.050 0.050 0.20 18.08 0.375 0.075
8/24/2011 0.046 0.046 <0.05 24.46 0.510 0.092
9/28/2011 0.046 0.046 <0.05 19.26 0.400 0.078
6/8/2015 0.073 0.073 <0.073 25.4 0.530 0.095
8/17/2015 0.073 0.073 <0.073 38.3 0.791 0.126
9/3/2015 0.073 0.073 <0.073 49.8 1.022 0.151
1. Observed hardness is used to calculate the freshwater aquatic life criteria for certain metals because hardness can
affect the toxicities of these metals. Increasing hardness has the effect of decreasing the toxicity of metals.
Exceedances of criteria are show in bold type
19. Pawcatuck River & Tribs (RI0008039R-18E) Pawcatuck River and tributaries from the Route 3 bridge crossing to the Route 1 highway
bridge at the junction of Main Street and Broad Street in Westerly. Westerly
Total Iron (Fe) – This segment of the Pawcatuck River was listed on RI’s 2014 303(d) list
for exceedances of freshwater criteria for total iron (Fe). It was first listed as impaired for
iron in 2010, as a result of 2005/2006 Ambient River Monitoring (ARM) dry weather
sampling. As part of the Rhode Island Department of Environmental Management ARM
program, dry weather samples were collected in 2011 at two stations on the river. Station
PAW49 (red star on the map above) is the upstream station located at the Boombridge
Road crossing, while PAW01 (red heart on the map above) is further downstream at the
White Rock Bridge Road crossing, both in the Westerly, RI area. The following tables
show the average daily flow on the date the samples were collected, the percentile flow,
and the amount of rainfall over the area up to 48 hours prior to the sample collection.
RIDEM ARM samples are all collected under dry weather conditions where the rainfall is
0.10 inches or less for the two days prior to sampling. Another indicator of moist
conditions are those flow percentiles below 40%. Using the flow percentile criteria of
40% or lower, all of the 2011 samples collected at PAW01 can be considered to be under
moist conditions.
The United States Geological Service (USGS) maintains a water quality and flow
gauging station (01118500, red triangle on map above) in Westerly, RI approximately 1
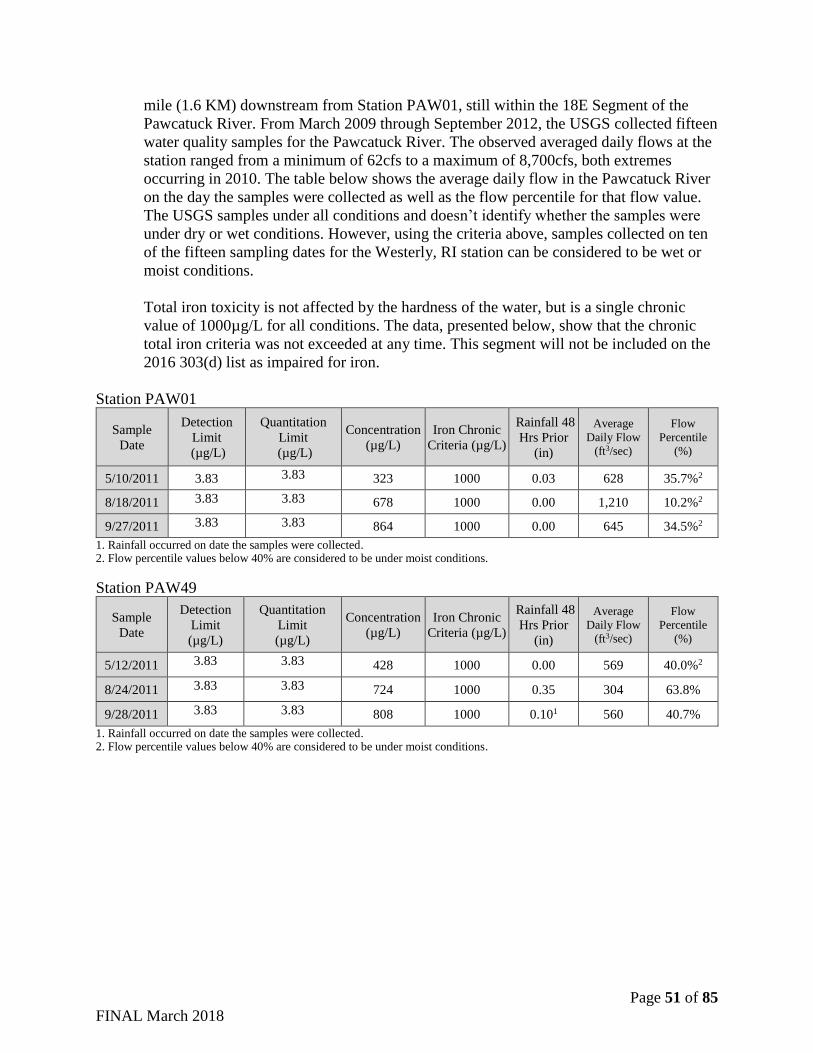
Page 51 of 85
FINAL March 2018
mile (1.6 KM) downstream from Station PAW01, still within the 18E Segment of the
Pawcatuck River. From March 2009 through September 2012, the USGS collected fifteen
water quality samples for the Pawcatuck River. The observed averaged daily flows at the
station ranged from a minimum of 62cfs to a maximum of 8,700cfs, both extremes
occurring in 2010. The table below shows the average daily flow in the Pawcatuck River
on the day the samples were collected as well as the flow percentile for that flow value.
The USGS samples under all conditions and doesn’t identify whether the samples were
under dry or wet conditions. However, using the criteria above, samples collected on ten
of the fifteen sampling dates for the Westerly, RI station can be considered to be wet or
moist conditions.
Total iron toxicity is not affected by the hardness of the water, but is a single chronic
value of 1000µg/L for all conditions. The data, presented below, show that the chronic
total iron criteria was not exceeded at any time. This segment will not be included on the
2016 303(d) list as impaired for iron.
Station PAW01
Sample
Date
Detection
Limit
(µg/L)
Quantitation
Limit
(µg/L)
Concentration
(µg/L)
Iron Chronic
Criteria (µg/L)
Rainfall 48
Hrs Prior
(in)
Average
Daily Flow
(ft3/sec)
Flow
Percentile
(%)
5/10/2011 3.83 3.83 323 1000 0.03 628 35.7%2
8/18/2011 3.83 3.83 678 1000 0.00 1,210 10.2%2
9/27/2011 3.83 3.83 864 1000 0.00 645 34.5%2
1. Rainfall occurred on date the samples were collected. 2. Flow percentile values below 40% are considered to be under moist conditions. Station PAW49
Sample
Date
Detection
Limit
(µg/L)
Quantitation
Limit
(µg/L)
Concentration
(µg/L)
Iron Chronic
Criteria (µg/L)
Rainfall 48
Hrs Prior
(in)
Average
Daily Flow
(ft3/sec)
Flow
Percentile
(%)
5/12/2011 3.83 3.83 428 1000 0.00 569 40.0%2
8/24/2011 3.83 3.83 724 1000 0.35 304 63.8%
9/28/2011 3.83 3.83 808 1000 0.101 560 40.7%
1. Rainfall occurred on date the samples were collected. 2. Flow percentile values below 40% are considered to be under moist conditions.
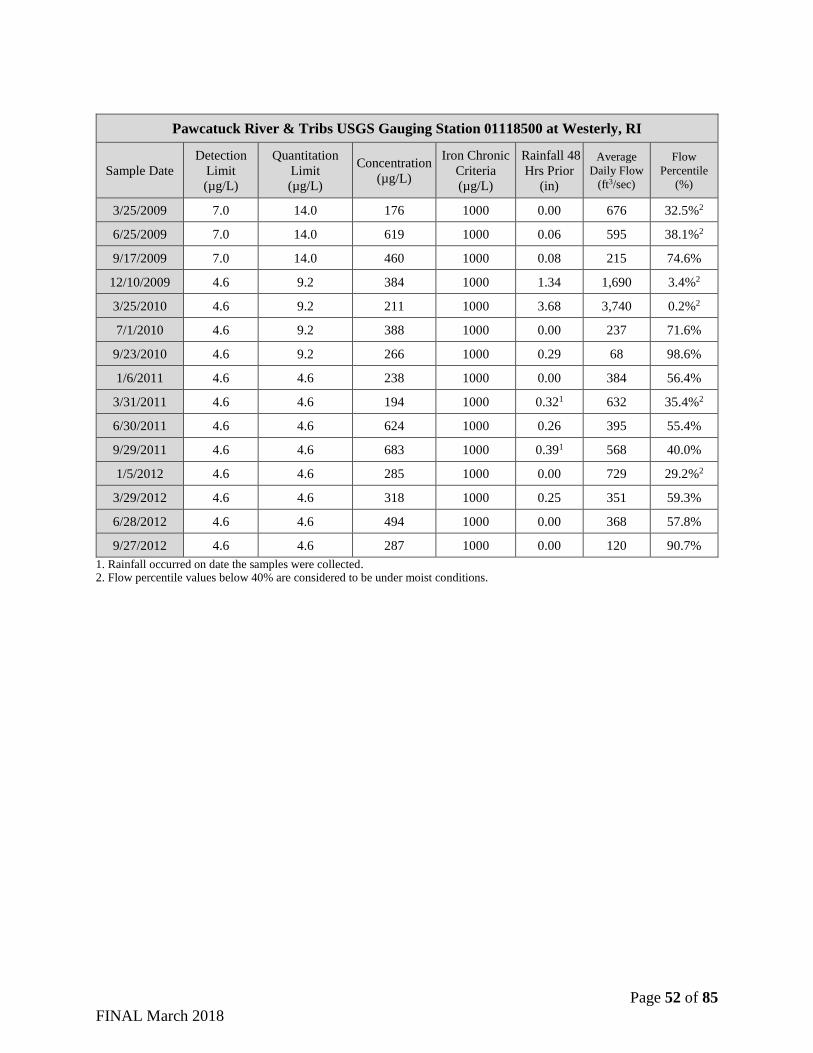
Page 52 of 85
FINAL March 2018
Pawcatuck River & Tribs USGS Gauging Station 01118500 at Westerly, RI
Sample Date
Detection
Limit
(µg/L)
Quantitation
Limit
(µg/L)
Concentration
(µg/L)
Iron Chronic
Criteria
(µg/L)
Rainfall 48
Hrs Prior
(in)
Average
Daily Flow
(ft3/sec)
Flow
Percentile
(%)
3/25/2009 7.0 14.0 176 1000 0.00 676 32.5%2
6/25/2009 7.0 14.0 619 1000 0.06 595 38.1%2
9/17/2009 7.0 14.0 460 1000 0.08 215 74.6%
12/10/2009 4.6 9.2 384 1000 1.34 1,690 3.4%2
3/25/2010 4.6 9.2 211 1000 3.68 3,740 0.2%2
7/1/2010 4.6 9.2 388 1000 0.00 237 71.6%
9/23/2010 4.6 9.2 266 1000 0.29 68 98.6%
1/6/2011 4.6 4.6 238 1000 0.00 384 56.4%
3/31/2011 4.6 4.6 194 1000 0.321 632 35.4%2
6/30/2011 4.6 4.6 624 1000 0.26 395 55.4%
9/29/2011 4.6 4.6 683 1000 0.391 568 40.0%
1/5/2012 4.6 4.6 285 1000 0.00 729 29.2%2
3/29/2012 4.6 4.6 318 1000 0.25 351 59.3%
6/28/2012 4.6 4.6 494 1000 0.00 368 57.8%
9/27/2012 4.6 4.6 287 1000 0.00 120 90.7%
1. Rainfall occurred on date the samples were collected. 2. Flow percentile values below 40% are considered to be under moist conditions.
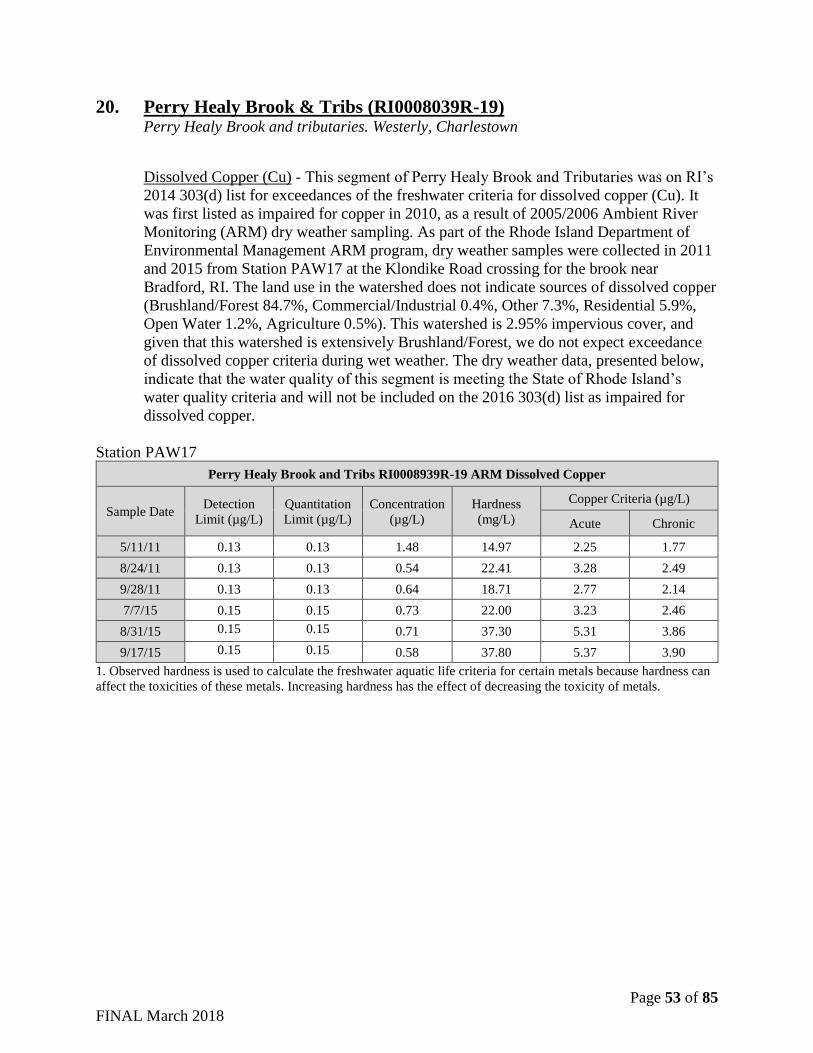
Page 53 of 85
FINAL March 2018
20. Perry Healy Brook & Tribs (RI0008039R-19) Perry Healy Brook and tributaries. Westerly, Charlestown
Dissolved Copper (Cu) - This segment of Perry Healy Brook and Tributaries was on RI’s
2014 303(d) list for exceedances of the freshwater criteria for dissolved copper (Cu). It
was first listed as impaired for copper in 2010, as a result of 2005/2006 Ambient River
Monitoring (ARM) dry weather sampling. As part of the Rhode Island Department of
Environmental Management ARM program, dry weather samples were collected in 2011
and 2015 from Station PAW17 at the Klondike Road crossing for the brook near
Bradford, RI. The land use in the watershed does not indicate sources of dissolved copper
(Brushland/Forest 84.7%, Commercial/Industrial 0.4%, Other 7.3%, Residential 5.9%,
Open Water 1.2%, Agriculture 0.5%). This watershed is 2.95% impervious cover, and
given that this watershed is extensively Brushland/Forest, we do not expect exceedance
of dissolved copper criteria during wet weather. The dry weather data, presented below,
indicate that the water quality of this segment is meeting the State of Rhode Island’s
water quality criteria and will not be included on the 2016 303(d) list as impaired for
dissolved copper.
Station PAW17
Perry Healy Brook and Tribs RI0008939R-19 ARM Dissolved Copper
Sample Date Detection
Limit (µg/L)
Quantitation
Limit (µg/L)
Concentration
(µg/L)
Hardness
(mg/L)
Copper Criteria (µg/L)
Acute Chronic
5/11/11 0.13 0.13 1.48 14.97 2.25 1.77
8/24/11 0.13 0.13 0.54 22.41 3.28 2.49
9/28/11 0.13 0.13 0.64 18.71 2.77 2.14
7/7/15 0.15 0.15 0.73 22.00 3.23 2.46
8/31/15 0.15 0.15 0.71 37.30 5.31 3.86
9/17/15 0.15 0.15 0.58 37.80 5.37 3.90
1. Observed hardness is used to calculate the freshwater aquatic life criteria for certain metals because hardness can
affect the toxicities of these metals. Increasing hardness has the effect of decreasing the toxicity of metals.
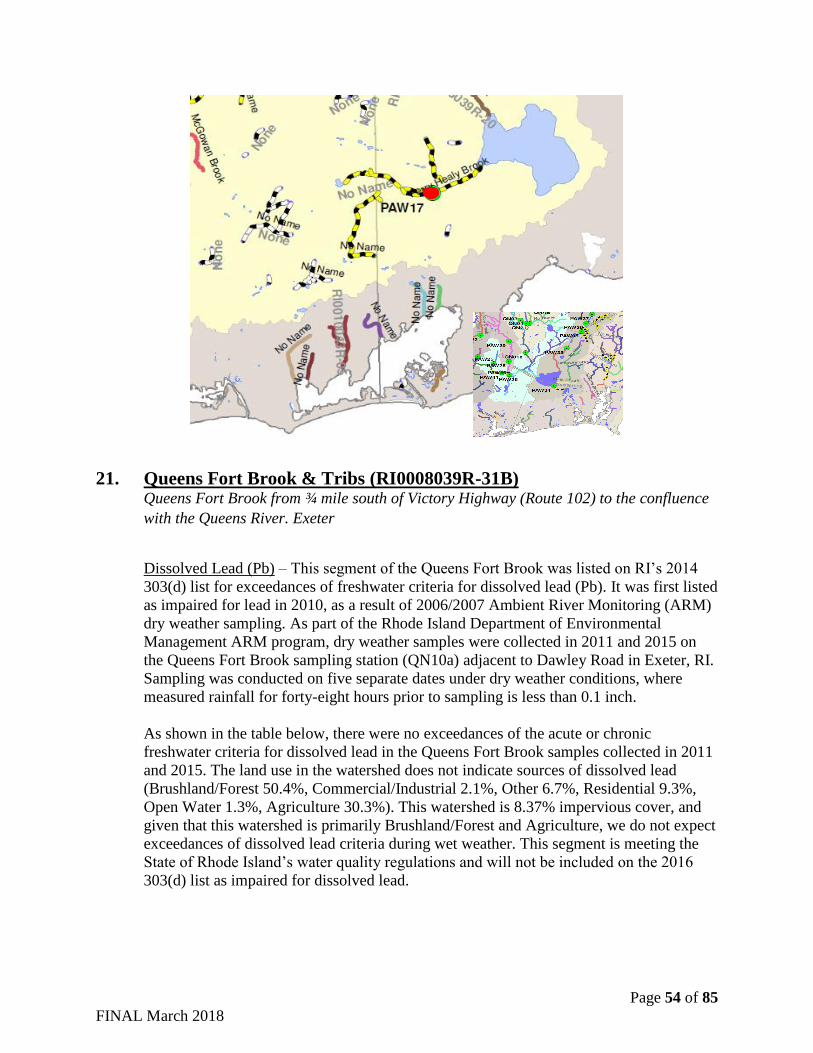
Page 54 of 85
FINAL March 2018
21. Queens Fort Brook & Tribs (RI0008039R-31B) Queens Fort Brook from ¾ mile south of Victory Highway (Route 102) to the confluence
with the Queens River. Exeter
Dissolved Lead (Pb) – This segment of the Queens Fort Brook was listed on RI’s 2014
303(d) list for exceedances of freshwater criteria for dissolved lead (Pb). It was first listed
as impaired for lead in 2010, as a result of 2006/2007 Ambient River Monitoring (ARM)
dry weather sampling. As part of the Rhode Island Department of Environmental
Management ARM program, dry weather samples were collected in 2011 and 2015 on
the Queens Fort Brook sampling station (QN10a) adjacent to Dawley Road in Exeter, RI.
Sampling was conducted on five separate dates under dry weather conditions, where
measured rainfall for forty-eight hours prior to sampling is less than 0.1 inch.
As shown in the table below, there were no exceedances of the acute or chronic
freshwater criteria for dissolved lead in the Queens Fort Brook samples collected in 2011
and 2015. The land use in the watershed does not indicate sources of dissolved lead
(Brushland/Forest 50.4%, Commercial/Industrial 2.1%, Other 6.7%, Residential 9.3%,
Open Water 1.3%, Agriculture 30.3%). This watershed is 8.37% impervious cover, and
given that this watershed is primarily Brushland/Forest and Agriculture, we do not expect
exceedances of dissolved lead criteria during wet weather. This segment is meeting the
State of Rhode Island’s water quality regulations and will not be included on the 2016
303(d) list as impaired for dissolved lead.
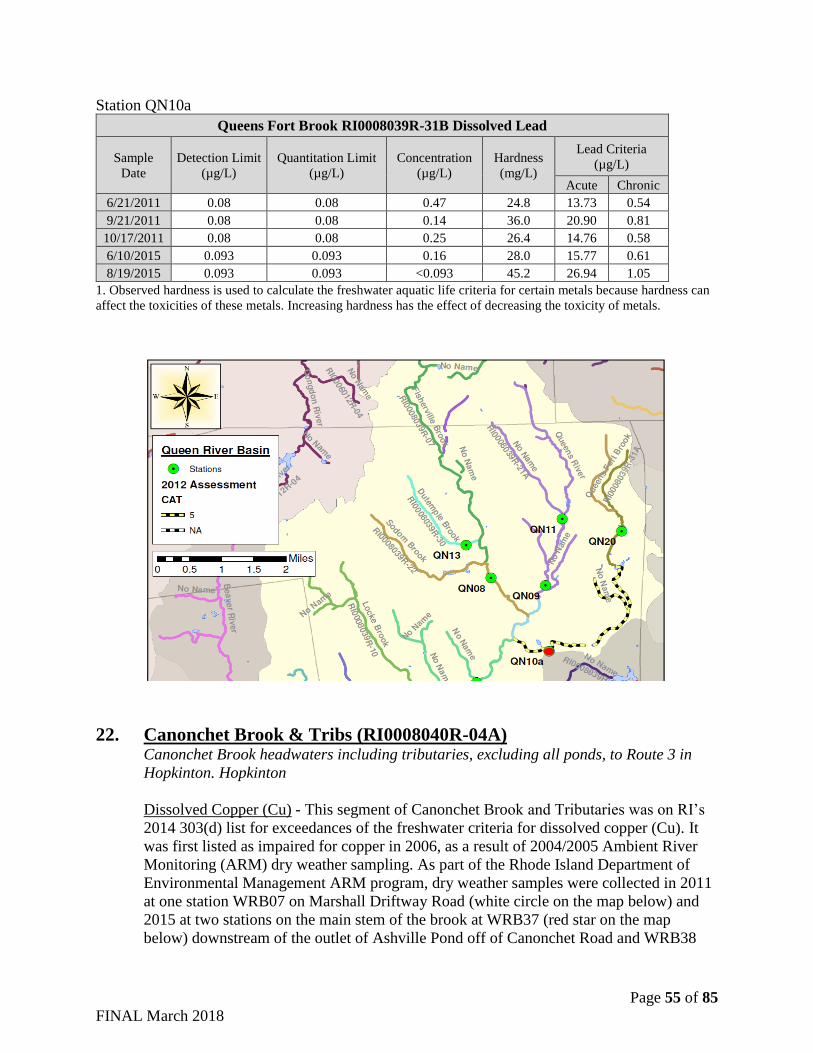
Page 55 of 85
FINAL March 2018
Station QN10a
Queens Fort Brook RI0008039R-31B Dissolved Lead
Sample
Date
Detection Limit
(µg/L)
Quantitation Limit
(µg/L)
Concentration
(µg/L)
Hardness
(mg/L)
Lead Criteria
(µg/L)
Acute Chronic
6/21/2011 0.08 0.08 0.47 24.8 13.73 0.54
9/21/2011 0.08 0.08 0.14 36.0 20.90 0.81
10/17/2011 0.08 0.08 0.25 26.4 14.76 0.58
6/10/2015 0.093 0.093 0.16 28.0 15.77 0.61
8/19/2015 0.093 0.093 <0.093 45.2 26.94 1.05
1. Observed hardness is used to calculate the freshwater aquatic life criteria for certain metals because hardness can
affect the toxicities of these metals. Increasing hardness has the effect of decreasing the toxicity of metals.
22. Canonchet Brook & Tribs (RI0008040R-04A) Canonchet Brook headwaters including tributaries, excluding all ponds, to Route 3 in
Hopkinton. Hopkinton
Dissolved Copper (Cu) - This segment of Canonchet Brook and Tributaries was on RI’s
2014 303(d) list for exceedances of the freshwater criteria for dissolved copper (Cu). It
was first listed as impaired for copper in 2006, as a result of 2004/2005 Ambient River
Monitoring (ARM) dry weather sampling. As part of the Rhode Island Department of
Environmental Management ARM program, dry weather samples were collected in 2011
at one station WRB07 on Marshall Driftway Road (white circle on the map below) and
2015 at two stations on the main stem of the brook at WRB37 (red star on the map
below) downstream of the outlet of Ashville Pond off of Canonchet Road and WRB38
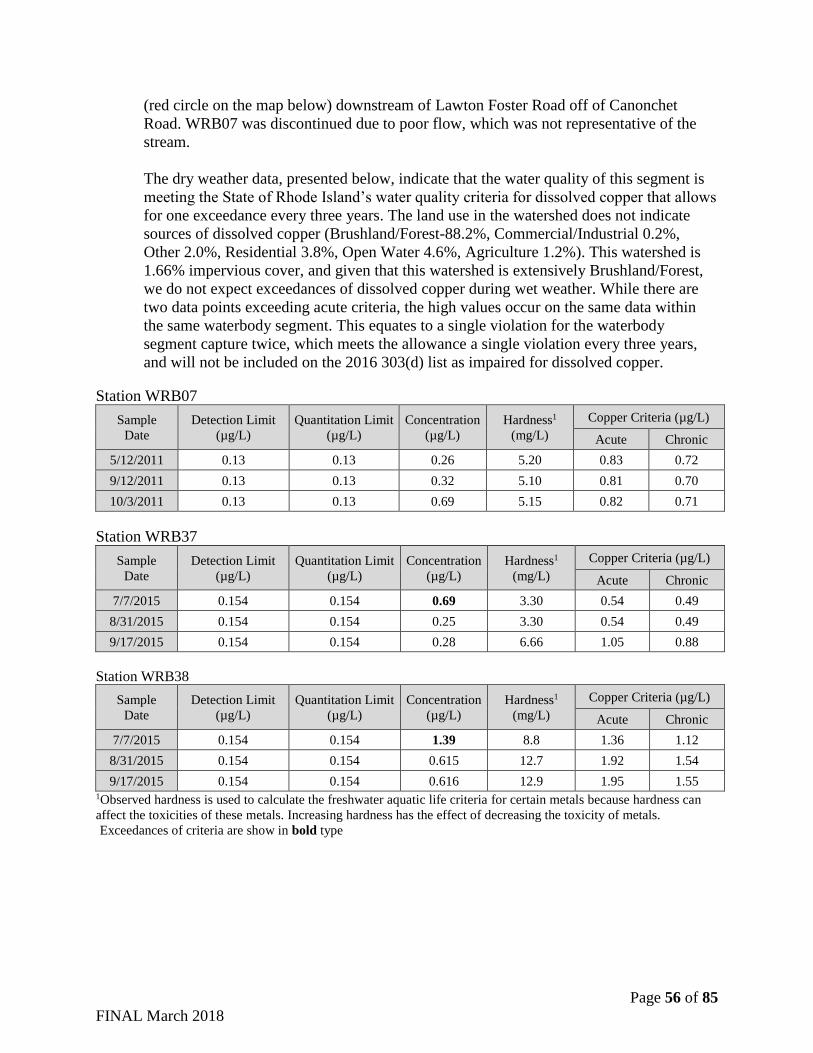
Page 56 of 85
FINAL March 2018
(red circle on the map below) downstream of Lawton Foster Road off of Canonchet
Road. WRB07 was discontinued due to poor flow, which was not representative of the
stream.
The dry weather data, presented below, indicate that the water quality of this segment is
meeting the State of Rhode Island’s water quality criteria for dissolved copper that allows
for one exceedance every three years. The land use in the watershed does not indicate
sources of dissolved copper (Brushland/Forest-88.2%, Commercial/Industrial 0.2%,
Other 2.0%, Residential 3.8%, Open Water 4.6%, Agriculture 1.2%). This watershed is
1.66% impervious cover, and given that this watershed is extensively Brushland/Forest,
we do not expect exceedances of dissolved copper during wet weather. While there are
two data points exceeding acute criteria, the high values occur on the same data within
the same waterbody segment. This equates to a single violation for the waterbody
segment capture twice, which meets the allowance a single violation every three years,
and will not be included on the 2016 303(d) list as impaired for dissolved copper.
Station WRB07
Sample
Date
Detection Limit
(µg/L)
Quantitation Limit
(µg/L)
Concentration
(µg/L)
Hardness1
(mg/L)
Copper Criteria (µg/L)
Acute Chronic
5/12/2011 0.13 0.13 0.26 5.20 0.83 0.72
9/12/2011 0.13 0.13 0.32 5.10 0.81 0.70
10/3/2011 0.13 0.13 0.69 5.15 0.82 0.71
Station WRB37
Sample
Date
Detection Limit
(µg/L)
Quantitation Limit
(µg/L)
Concentration
(µg/L)
Hardness1
(mg/L)
Copper Criteria (µg/L)
Acute Chronic
7/7/2015 0.154 0.154 0.69 3.30 0.54 0.49
8/31/2015 0.154 0.154 0.25 3.30 0.54 0.49
9/17/2015 0.154 0.154 0.28 6.66 1.05 0.88
Station WRB38
Sample
Date
Detection Limit
(µg/L)
Quantitation Limit
(µg/L)
Concentration
(µg/L)
Hardness1
(mg/L)
Copper Criteria (µg/L)
Acute Chronic
7/7/2015 0.154 0.154 1.39 8.8 1.36 1.12
8/31/2015 0.154 0.154 0.615 12.7 1.92 1.54
9/17/2015 0.154 0.154 0.616 12.9 1.95 1.55 1Observed hardness is used to calculate the freshwater aquatic life criteria for certain metals because hardness can
affect the toxicities of these metals. Increasing hardness has the effect of decreasing the toxicity of metals.
Exceedances of criteria are show in bold type
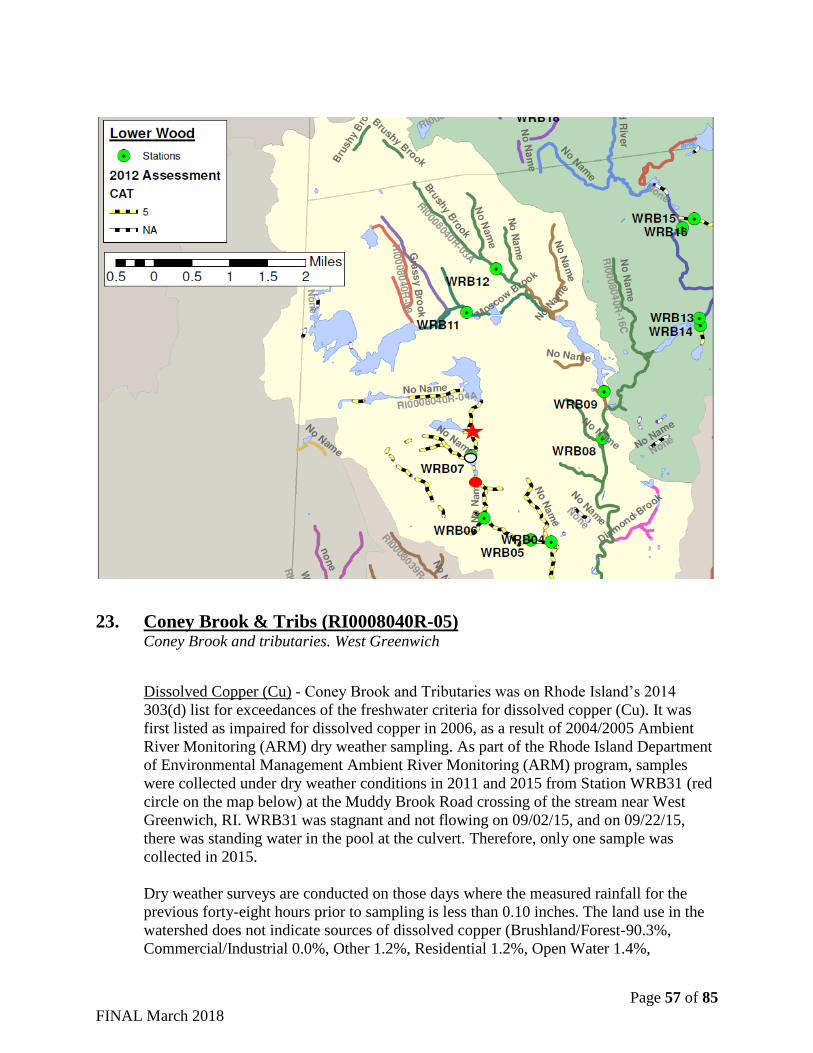
Page 57 of 85
FINAL March 2018
23. Coney Brook & Tribs (RI0008040R-05) Coney Brook and tributaries. West Greenwich
Dissolved Copper (Cu) - Coney Brook and Tributaries was on Rhode Island’s 2014
303(d) list for exceedances of the freshwater criteria for dissolved copper (Cu). It was
first listed as impaired for dissolved copper in 2006, as a result of 2004/2005 Ambient
River Monitoring (ARM) dry weather sampling. As part of the Rhode Island Department
of Environmental Management Ambient River Monitoring (ARM) program, samples
were collected under dry weather conditions in 2011 and 2015 from Station WRB31 (red
circle on the map below) at the Muddy Brook Road crossing of the stream near West
Greenwich, RI. WRB31 was stagnant and not flowing on 09/02/15, and on 09/22/15,
there was standing water in the pool at the culvert. Therefore, only one sample was
collected in 2015.
Dry weather surveys are conducted on those days where the measured rainfall for the
previous forty-eight hours prior to sampling is less than 0.10 inches. The land use in the
watershed does not indicate sources of dissolved copper (Brushland/Forest-90.3%,
Commercial/Industrial 0.0%, Other 1.2%, Residential 1.2%, Open Water 1.4%,
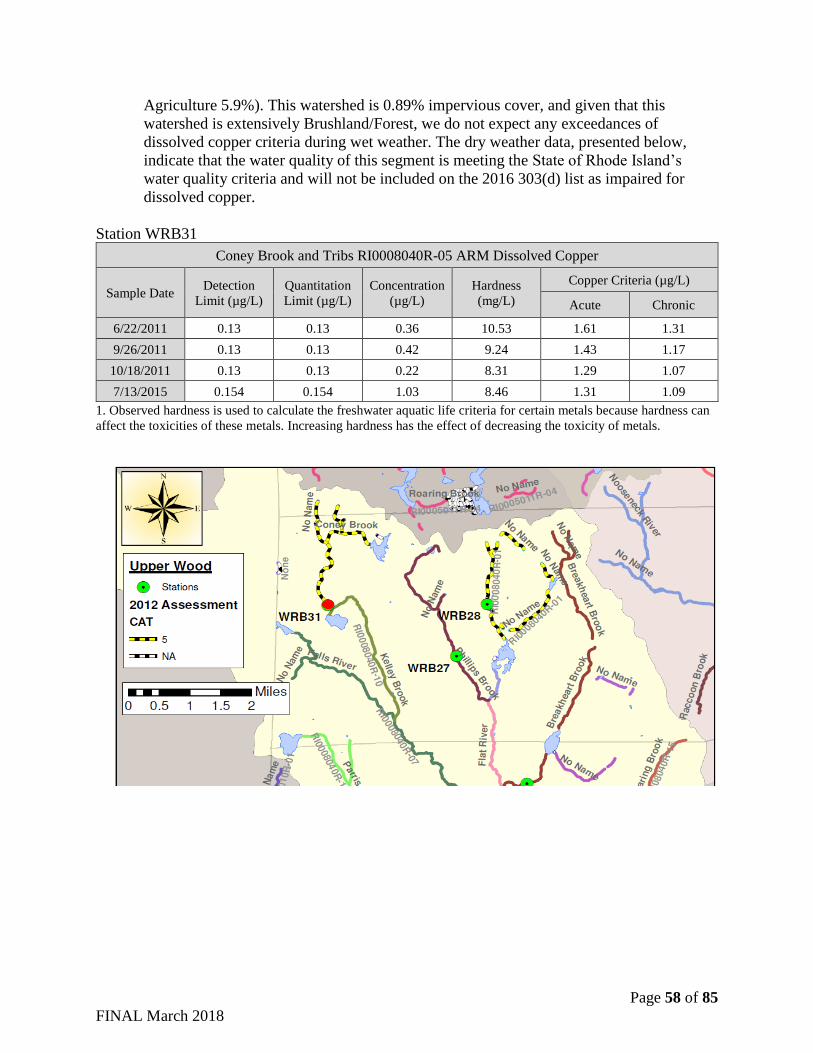
Page 58 of 85
FINAL March 2018
Agriculture 5.9%). This watershed is 0.89% impervious cover, and given that this
watershed is extensively Brushland/Forest, we do not expect any exceedances of
dissolved copper criteria during wet weather. The dry weather data, presented below,
indicate that the water quality of this segment is meeting the State of Rhode Island’s
water quality criteria and will not be included on the 2016 303(d) list as impaired for
dissolved copper.
Station WRB31
Coney Brook and Tribs RI0008040R-05 ARM Dissolved Copper
Sample Date Detection
Limit (µg/L)
Quantitation
Limit (µg/L)
Concentration
(µg/L)
Hardness
(mg/L)
Copper Criteria (µg/L)
Acute Chronic
6/22/2011 0.13 0.13 0.36 10.53 1.61 1.31
9/26/2011 0.13 0.13 0.42 9.24 1.43 1.17
10/18/2011 0.13 0.13 0.22 8.31 1.29 1.07
7/13/2015 0.154 0.154 1.03 8.46 1.31 1.09
1. Observed hardness is used to calculate the freshwater aquatic life criteria for certain metals because hardness can
affect the toxicities of these metals. Increasing hardness has the effect of decreasing the toxicity of metals.
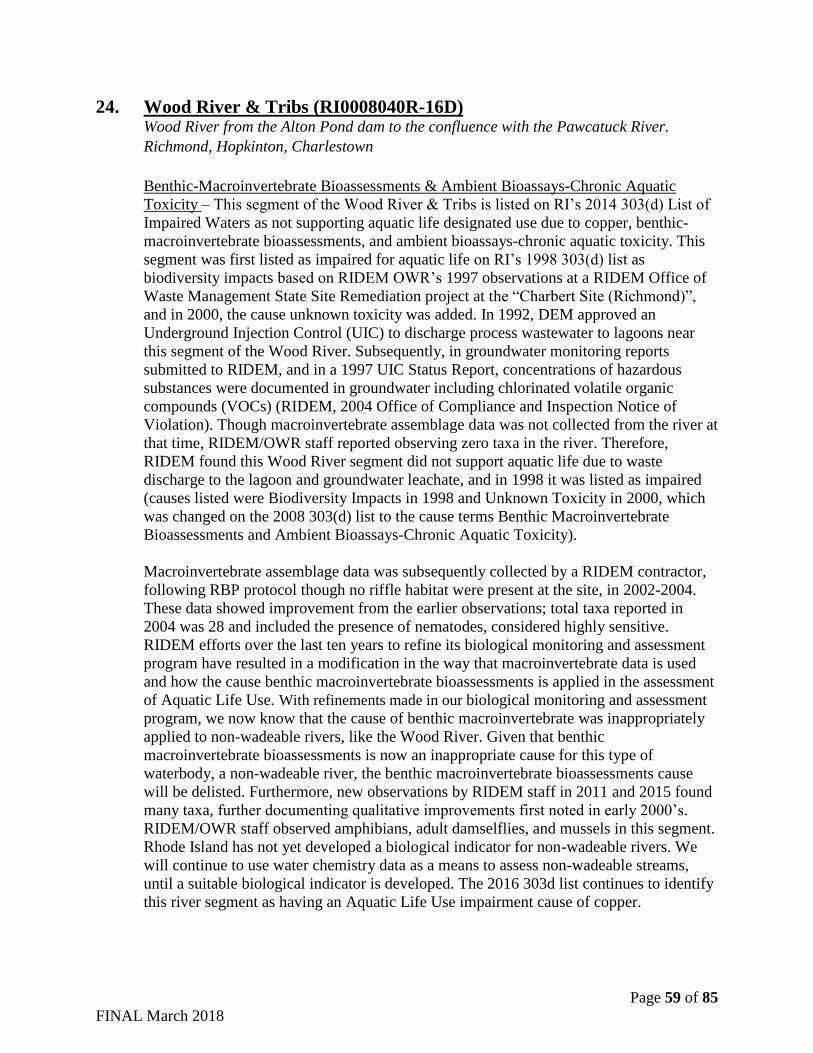
Page 59 of 85
FINAL March 2018
24. Wood River & Tribs (RI0008040R-16D) Wood River from the Alton Pond dam to the confluence with the Pawcatuck River.
Richmond, Hopkinton, Charlestown
Benthic-Macroinvertebrate Bioassessments & Ambient Bioassays-Chronic Aquatic
Toxicity – This segment of the Wood River & Tribs is listed on RI’s 2014 303(d) List of
Impaired Waters as not supporting aquatic life designated use due to copper, benthic-
macroinvertebrate bioassessments, and ambient bioassays-chronic aquatic toxicity. This
segment was first listed as impaired for aquatic life on RI’s 1998 303(d) list as
biodiversity impacts based on RIDEM OWR’s 1997 observations at a RIDEM Office of
Waste Management State Site Remediation project at the “Charbert Site (Richmond)”,
and in 2000, the cause unknown toxicity was added. In 1992, DEM approved an
Underground Injection Control (UIC) to discharge process wastewater to lagoons near
this segment of the Wood River. Subsequently, in groundwater monitoring reports
submitted to RIDEM, and in a 1997 UIC Status Report, concentrations of hazardous
substances were documented in groundwater including chlorinated volatile organic
compounds (VOCs) (RIDEM, 2004 Office of Compliance and Inspection Notice of
Violation). Though macroinvertebrate assemblage data was not collected from the river at
that time, RIDEM/OWR staff reported observing zero taxa in the river. Therefore,
RIDEM found this Wood River segment did not support aquatic life due to waste
discharge to the lagoon and groundwater leachate, and in 1998 it was listed as impaired
(causes listed were Biodiversity Impacts in 1998 and Unknown Toxicity in 2000, which
was changed on the 2008 303(d) list to the cause terms Benthic Macroinvertebrate
Bioassessments and Ambient Bioassays-Chronic Aquatic Toxicity).
Macroinvertebrate assemblage data was subsequently collected by a RIDEM contractor,
following RBP protocol though no riffle habitat were present at the site, in 2002-2004.
These data showed improvement from the earlier observations; total taxa reported in
2004 was 28 and included the presence of nematodes, considered highly sensitive.
RIDEM efforts over the last ten years to refine its biological monitoring and assessment
program have resulted in a modification in the way that macroinvertebrate data is used
and how the cause benthic macroinvertebrate bioassessments is applied in the assessment
of Aquatic Life Use. With refinements made in our biological monitoring and assessment
program, we now know that the cause of benthic macroinvertebrate was inappropriately
applied to non-wadeable rivers, like the Wood River. Given that benthic
macroinvertebrate bioassessments is now an inappropriate cause for this type of
waterbody, a non-wadeable river, the benthic macroinvertebrate bioassessments cause
will be delisted. Furthermore, new observations by RIDEM staff in 2011 and 2015 found
many taxa, further documenting qualitative improvements first noted in early 2000’s.
RIDEM/OWR staff observed amphibians, adult damselflies, and mussels in this segment.
Rhode Island has not yet developed a biological indicator for non-wadeable rivers. We
will continue to use water chemistry data as a means to assess non-wadeable streams,
until a suitable biological indicator is developed. The 2016 303d list continues to identify
this river segment as having an Aquatic Life Use impairment cause of copper.
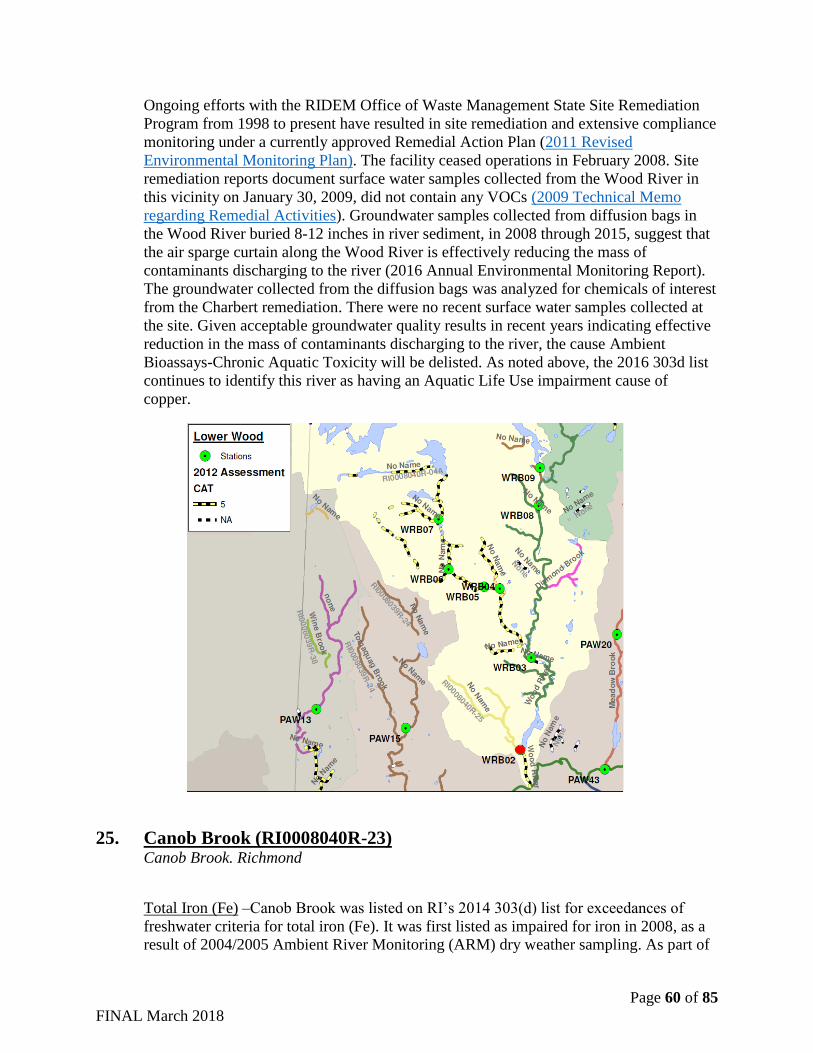
Page 60 of 85
FINAL March 2018
Ongoing efforts with the RIDEM Office of Waste Management State Site Remediation
Program from 1998 to present have resulted in site remediation and extensive compliance
monitoring under a currently approved Remedial Action Plan (2011 Revised
Environmental Monitoring Plan). The facility ceased operations in February 2008. Site
remediation reports document surface water samples collected from the Wood River in
this vicinity on January 30, 2009, did not contain any VOCs (2009 Technical Memo
regarding Remedial Activities). Groundwater samples collected from diffusion bags in
the Wood River buried 8-12 inches in river sediment, in 2008 through 2015, suggest that
the air sparge curtain along the Wood River is effectively reducing the mass of
contaminants discharging to the river (2016 Annual Environmental Monitoring Report).
The groundwater collected from the diffusion bags was analyzed for chemicals of interest
from the Charbert remediation. There were no recent surface water samples collected at
the site. Given acceptable groundwater quality results in recent years indicating effective
reduction in the mass of contaminants discharging to the river, the cause Ambient
Bioassays-Chronic Aquatic Toxicity will be delisted. As noted above, the 2016 303d list
continues to identify this river as having an Aquatic Life Use impairment cause of
copper.
25. Canob Brook (RI0008040R-23) Canob Brook. Richmond
Total Iron (Fe) –Canob Brook was listed on RI’s 2014 303(d) list for exceedances of
freshwater criteria for total iron (Fe). It was first listed as impaired for iron in 2008, as a
result of 2004/2005 Ambient River Monitoring (ARM) dry weather sampling. As part of
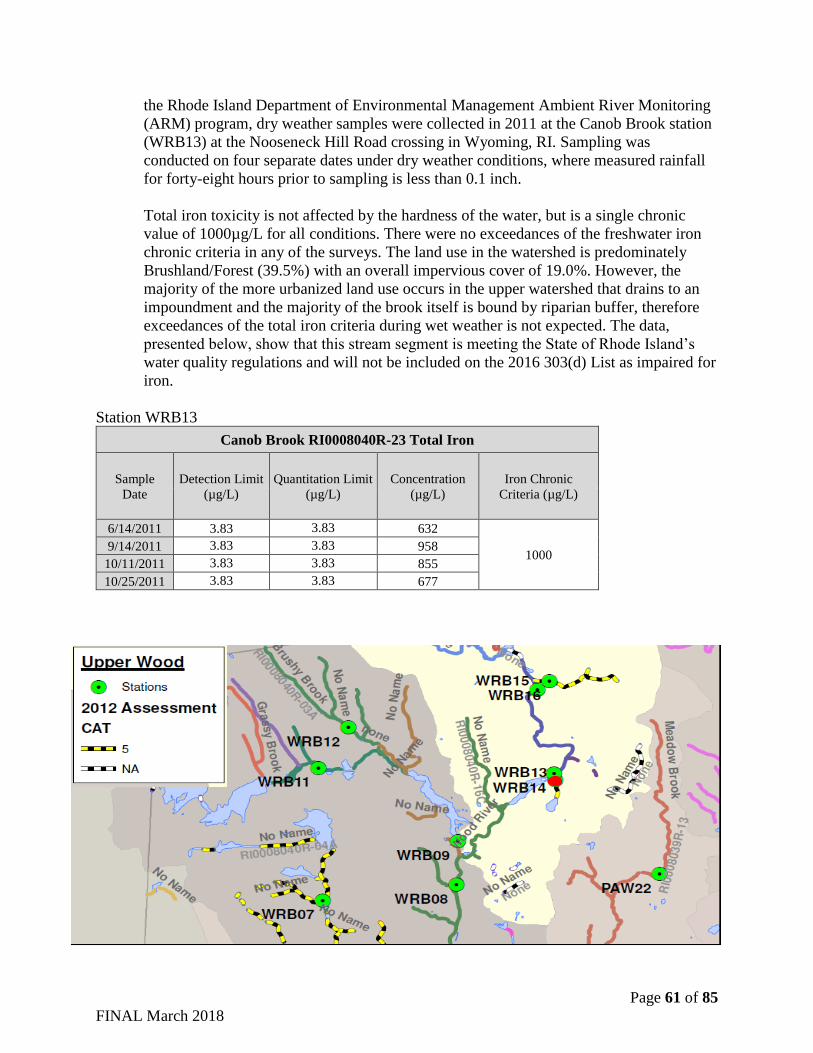
Page 61 of 85
FINAL March 2018
the Rhode Island Department of Environmental Management Ambient River Monitoring
(ARM) program, dry weather samples were collected in 2011 at the Canob Brook station
(WRB13) at the Nooseneck Hill Road crossing in Wyoming, RI. Sampling was
conducted on four separate dates under dry weather conditions, where measured rainfall
for forty-eight hours prior to sampling is less than 0.1 inch.
Total iron toxicity is not affected by the hardness of the water, but is a single chronic
value of 1000µg/L for all conditions. There were no exceedances of the freshwater iron
chronic criteria in any of the surveys. The land use in the watershed is predominately
Brushland/Forest (39.5%) with an overall impervious cover of 19.0%. However, the
majority of the more urbanized land use occurs in the upper watershed that drains to an
impoundment and the majority of the brook itself is bound by riparian buffer, therefore
exceedances of the total iron criteria during wet weather is not expected. The data,
presented below, show that this stream segment is meeting the State of Rhode Island’s
water quality regulations and will not be included on the 2016 303(d) List as impaired for
iron.
Station WRB13
Canob Brook RI0008040R-23 Total Iron
Sample
Date
Detection Limit
(µg/L)
Quantitation Limit
(µg/L)
Concentration
(µg/L)
Iron Chronic
Criteria (µg/L)
6/14/2011 3.83 3.83 632
1000 9/14/2011 3.83 3.83 958
10/11/2011 3.83 3.83 855
10/25/2011 3.83 3.83 677
Page 62 of 85
FINAL March 2018
26. Pawtuxet River Main Stem (RI0006017R-03) Pawtuxet River from the confluence of the North and South Branches at Riverpoint to the
Pawtuxet Cove Dam at Pawtuxet. West Warwick, Warwick, Cranston
Dissolved Cadmium (Cd) – This segment of the Pawtuxet River was on RI’s 2014 303(d)
list for exceedances of freshwater dissolved cadmium (Cd) criteria. It was first listed as
impaired for cadmium in 2006, based on 1997-2002 USGS data. USGS collects the
samples on a set schedule under both dry and wet weather conditions. In 2012 and 2016,
as part of the Rhode Island Department of Environmental Management Ambient River
Monitoring (ARM) program, dry weather samples were collected at six stations along the
mainstem of the river. Sampling was conducted on three separate dates under dry weather
conditions, where measured rainfall for forty-eight hours prior to sampling is less than
0.1 inch. Additionally, the US Geological Survey (USGS) maintains two stations within
this segment of the Pawtuxet River. One site measures the flows in the river and is
located upstream of the Cranston Waste Water Treatment Facility and the water quality
station is at the Warwick Avenue (RT1A) crossing of the Pawtuxet River. The USGS
collected twenty-eight water quality samples on the Pawtuxet River from March 2009
through March 2016. As noted, USGS collects the samples on a set schedule under both
dry and wet weather conditions, and the analysis includes hardness so that the freshwater
criteria can be calculated for trace metals. The figure below shows the location of these
stations.
The acute criteria was calculated using the Water Effect Ratio for the river. Section
131.11(b)(1)(ii) of the Federal water quality standards regulation provides States with the
opportunity to adopt water quality criteria that are modified to reflect local environmental
conditions. Following the procedures outlined in RIDEM's "Site Specific Aquatic Life
Water Quality Criteria Development Policy", as amended, and EPA's "Interim Guidance
on Determination and Use of Water- Effect Ratios for Metals", (February 1994, EPA-
823-B-94-001), acute Water Effect Ratios (WERs) were developed for 5 metals:
cadmium, copper, lead, silver and zinc for portions of the Pawtuxet River. The criteria
derived from these WERs apply to the segments of the Pawtuxet River classified as B1
and apply to the Pawtuxet River main stem segment. The WER procedure provides for
the use of a WER that is intended to take into account relevant differences between the
toxicities of the chemical in laboratory dilution water and in site water. These WERs are
then used to derive acute site specific criteria. For cadmium, there are no national acute to
chronic ratios. Therefore, only acute criteria can be evaluated using the WER for total
cadmium concentrations (RIDEM ARM 2012 and 2016 data), and chronic criteria were
calculated for dissolved cadmium concentrations (USGS 2009-2016 data) using the
equation in the Rhode Island Water Quality Regulations (Table 2).
Mean daily streamflow for the 2012 surveys ranged from 149cfs in June to 183cfs for the
October survey. All of the flows are considered to be under dry conditions when checked
against the flow duration curve for the Pawtuxet River at the Cranston, RI USGS site,
ranging between 65 to 75 flow percentiles. The data, presented below, show that the
water quality is meeting the dissolved cadmium standard which allows for one
Page 63 of 85
FINAL March 2018
exceedance in three years. These flows are considered relatively low in the context of
observed averaged daily flows at the USGS station ranging from a minimum of 33 cfs in
2016 to a maximum of 14,000cfs in 2010.
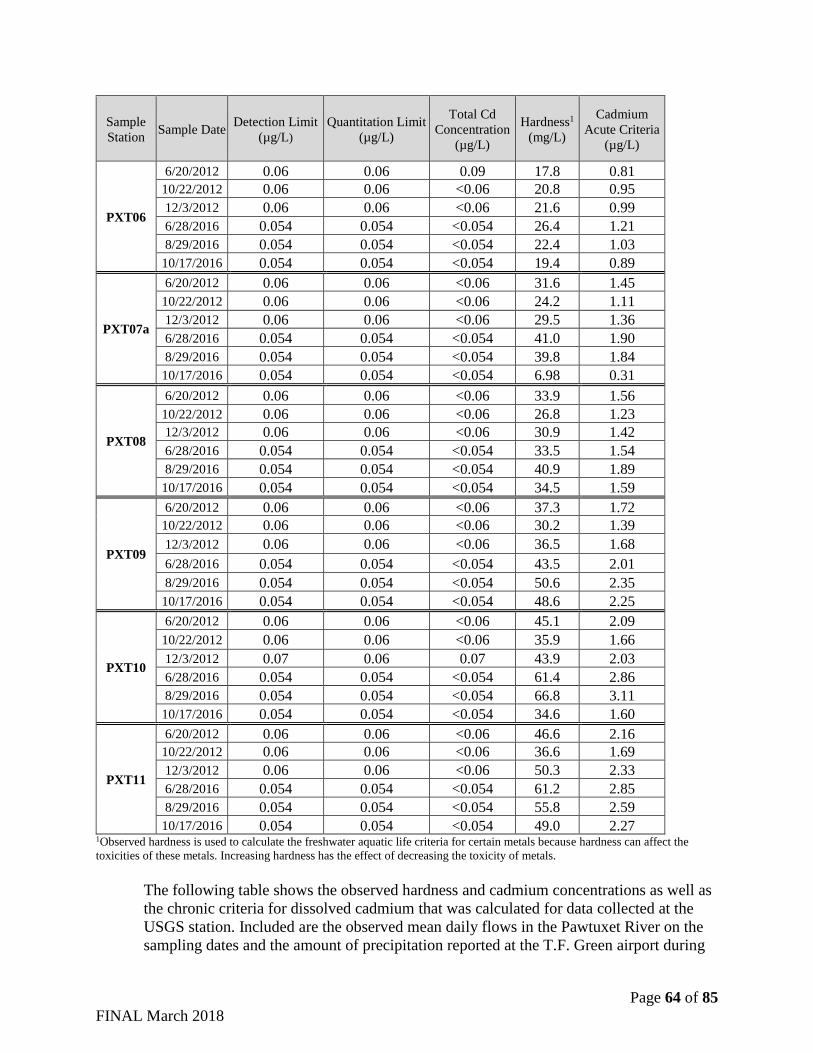
Page 64 of 85
FINAL March 2018
Sample
Station Sample Date
Detection Limit
(µg/L)
Quantitation Limit
(µg/L)
Total Cd
Concentration
(µg/L)
Hardness1
(mg/L)
Cadmium
Acute Criteria
(µg/L)
PXT06
6/20/2012 0.06 0.06 0.09 17.8 0.81
10/22/2012 0.06 0.06 <0.06 20.8 0.95
12/3/2012 0.06 0.06 <0.06 21.6 0.99
6/28/2016 0.054 0.054 <0.054 26.4 1.21
8/29/2016 0.054 0.054 <0.054 22.4 1.03
10/17/2016 0.054 0.054 <0.054 19.4 0.89
PXT07a
6/20/2012 0.06 0.06 <0.06 31.6 1.45
10/22/2012 0.06 0.06 <0.06 24.2 1.11
12/3/2012 0.06 0.06 <0.06 29.5 1.36
6/28/2016 0.054 0.054 <0.054 41.0 1.90
8/29/2016 0.054 0.054 <0.054 39.8 1.84
10/17/2016 0.054 0.054 <0.054 6.98 0.31
PXT08
6/20/2012 0.06 0.06 <0.06 33.9 1.56
10/22/2012 0.06 0.06 <0.06 26.8 1.23
12/3/2012 0.06 0.06 <0.06 30.9 1.42
6/28/2016 0.054 0.054 <0.054 33.5 1.54
8/29/2016 0.054 0.054 <0.054 40.9 1.89
10/17/2016 0.054 0.054 <0.054 34.5 1.59
PXT09
6/20/2012 0.06 0.06 <0.06 37.3 1.72
10/22/2012 0.06 0.06 <0.06 30.2 1.39
12/3/2012 0.06 0.06 <0.06 36.5 1.68
6/28/2016 0.054 0.054 <0.054 43.5 2.01
8/29/2016 0.054 0.054 <0.054 50.6 2.35
10/17/2016 0.054 0.054 <0.054 48.6 2.25
PXT10
6/20/2012 0.06 0.06 <0.06 45.1 2.09
10/22/2012 0.06 0.06 <0.06 35.9 1.66
12/3/2012 0.07 0.06 0.07 43.9 2.03
6/28/2016 0.054 0.054 <0.054 61.4 2.86
8/29/2016 0.054 0.054 <0.054 66.8 3.11
10/17/2016 0.054 0.054 <0.054 34.6 1.60
PXT11
6/20/2012 0.06 0.06 <0.06 46.6 2.16
10/22/2012 0.06 0.06 <0.06 36.6 1.69
12/3/2012 0.06 0.06 <0.06 50.3 2.33
6/28/2016 0.054 0.054 <0.054 61.2 2.85
8/29/2016 0.054 0.054 <0.054 55.8 2.59
10/17/2016 0.054 0.054 <0.054 49.0 2.27 1Observed hardness is used to calculate the freshwater aquatic life criteria for certain metals because hardness can affect the
toxicities of these metals. Increasing hardness has the effect of decreasing the toxicity of metals.
The following table shows the observed hardness and cadmium concentrations as well as
the chronic criteria for dissolved cadmium that was calculated for data collected at the
USGS station. Included are the observed mean daily flows in the Pawtuxet River on the
sampling dates and the amount of precipitation reported at the T.F. Green airport during
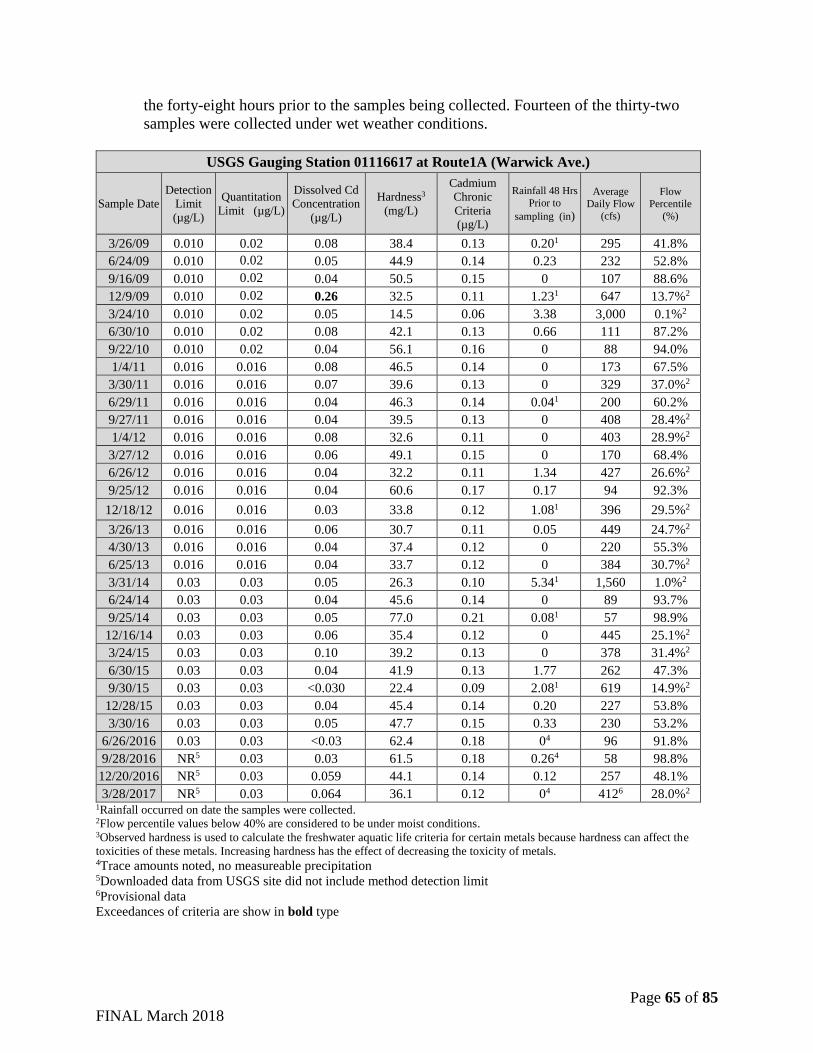
Page 65 of 85
FINAL March 2018
the forty-eight hours prior to the samples being collected. Fourteen of the thirty-two
samples were collected under wet weather conditions.
USGS Gauging Station 01116617 at Route1A (Warwick Ave.)
Sample Date
Detection
Limit
(µg/L)
Quantitation
Limit (µg/L)
Dissolved Cd
Concentration
(µg/L)
Hardness3
(mg/L)
Cadmium
Chronic
Criteria
(µg/L)
Rainfall 48 Hrs
Prior to
sampling (in)
Average
Daily Flow
(cfs)
Flow
Percentile
(%)
3/26/09 0.010 0.02 0.08 38.4 0.13 0.201 295 41.8%
6/24/09 0.010 0.02 0.05 44.9 0.14 0.23 232 52.8%
9/16/09 0.010 0.02 0.04 50.5 0.15 0 107 88.6%
12/9/09 0.010 0.02 0.26 32.5 0.11 1.231 647 13.7%2
3/24/10 0.010 0.02 0.05 14.5 0.06 3.38 3,000 0.1%2
6/30/10 0.010 0.02 0.08 42.1 0.13 0.66 111 87.2%
9/22/10 0.010 0.02 0.04 56.1 0.16 0 88 94.0%
1/4/11 0.016 0.016 0.08 46.5 0.14 0 173 67.5%
3/30/11 0.016 0.016 0.07 39.6 0.13 0 329 37.0%2
6/29/11 0.016 0.016 0.04 46.3 0.14 0.041 200 60.2%
9/27/11 0.016 0.016 0.04 39.5 0.13 0 408 28.4%2
1/4/12 0.016 0.016 0.08 32.6 0.11 0 403 28.9%2
3/27/12 0.016 0.016 0.06 49.1 0.15 0 170 68.4%
6/26/12 0.016 0.016 0.04 32.2 0.11 1.34 427 26.6%2
9/25/12 0.016 0.016 0.04 60.6 0.17 0.17 94 92.3%
12/18/12 0.016 0.016 0.03 33.8 0.12 1.081 396 29.5%2
3/26/13 0.016 0.016 0.06 30.7 0.11 0.05 449 24.7%2
4/30/13 0.016 0.016 0.04 37.4 0.12 0 220 55.3%
6/25/13 0.016 0.016 0.04 33.7 0.12 0 384 30.7%2
3/31/14 0.03 0.03 0.05 26.3 0.10 5.341 1,560 1.0%2
6/24/14 0.03 0.03 0.04 45.6 0.14 0 89 93.7%
9/25/14 0.03 0.03 0.05 77.0 0.21 0.081 57 98.9%
12/16/14 0.03 0.03 0.06 35.4 0.12 0 445 25.1%2
3/24/15 0.03 0.03 0.10 39.2 0.13 0 378 31.4%2
6/30/15 0.03 0.03 0.04 41.9 0.13 1.77 262 47.3%
9/30/15 0.03 0.03 <0.030 22.4 0.09 2.081 619 14.9%2
12/28/15 0.03 0.03 0.04 45.4 0.14 0.20 227 53.8%
3/30/16 0.03 0.03 0.05 47.7 0.15 0.33 230 53.2%
6/26/2016 0.03 0.03 <0.03 62.4 0.18 04 96 91.8%
9/28/2016 NR5 0.03 0.03 61.5 0.18 0.264 58 98.8%
12/20/2016 NR5 0.03 0.059 44.1 0.14 0.12 257 48.1%
3/28/2017 NR5 0.03 0.064 36.1 0.12 04 4126 28.0%2 1Rainfall occurred on date the samples were collected. 2Flow percentile values below 40% are considered to be under moist conditions. 3Observed hardness is used to calculate the freshwater aquatic life criteria for certain metals because hardness can affect the
toxicities of these metals. Increasing hardness has the effect of decreasing the toxicity of metals. 4Trace amounts noted, no measureable precipitation 5Downloaded data from USGS site did not include method detection limit 6Provisional data
Exceedances of criteria are show in bold type
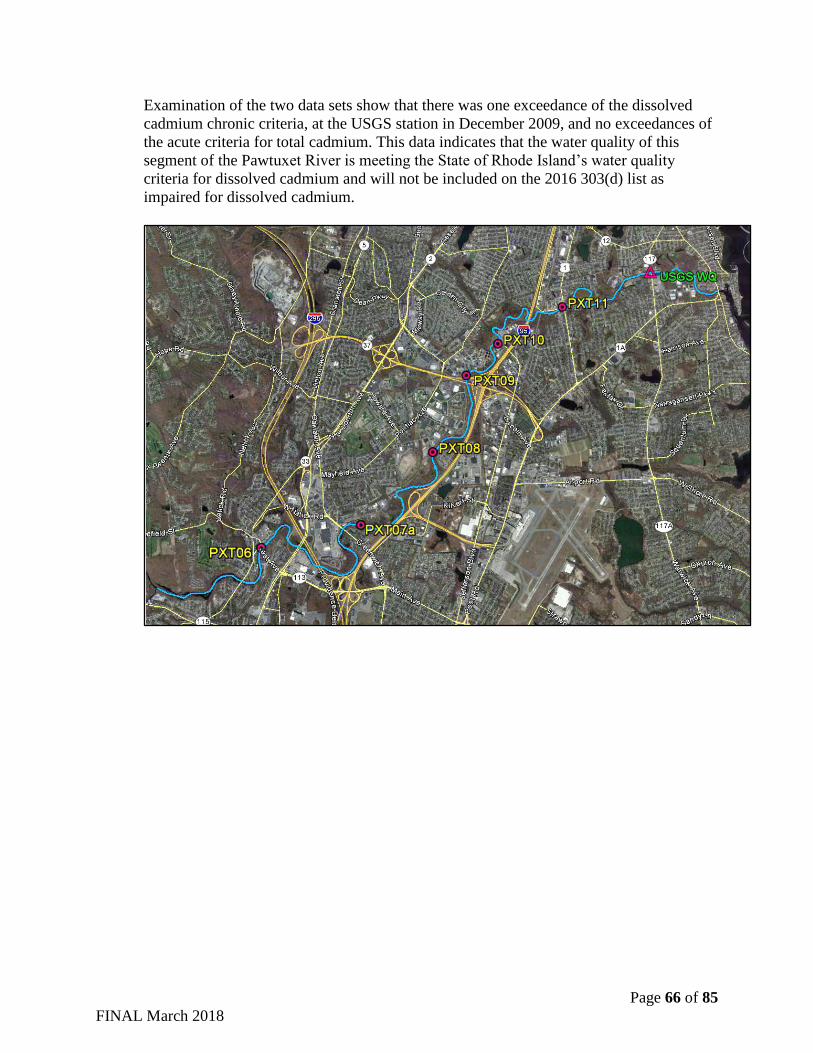
Page 66 of 85
FINAL March 2018
Examination of the two data sets show that there was one exceedance of the dissolved
cadmium chronic criteria, at the USGS station in December 2009, and no exceedances of
the acute criteria for total cadmium. This data indicates that the water quality of this
segment of the Pawtuxet River is meeting the State of Rhode Island’s water quality
criteria for dissolved cadmium and will not be included on the 2016 303(d) list as
impaired for dissolved cadmium.
Page 67 of 85
FINAL March 2018
IMPROPER BIOASSESSMENT IMPAIRMENT
LISTINGS
RIDEM efforts to refine its biological monitoring and assessment program have resulted in a
modification to the way that the causes aquatic macroinvertebrate and benthic macroinvertebrate
bioassessments are applied in the assessment of Aquatic Life Use. Historically, the terms were
used when data or field observations indicated any kind of biological impairment. Beginning in 2010,
the State began to recognize that continuing to use the causes in this manner was not appropriate, nor
reflective of on-going efforts to develop a stronger biological monitoring and assessment program.
With refinements made in our biological monitoring and assessment program over the past ten
years or so, we now know that these causes were inappropriately applied to streams in the state’s
Lowland ecoregions, lakes, and non-wadeable rivers.
RIDEM’s development of a stronger biological monitoring and assessment program has highlighted
the need to move from using a Reference Site Approach to a Reference Condition Approach, where
possible. Historically, RIDEM used a Reference Site Approach statewide to evaluate
macroinvertebrate communities in RI rivers and streams in conducting Aquatic Life Use support
decisions, when macroinvertebrate data was available. Under the Reference Site Approach,
biological conditions in rivers and streams were measured against conditions observed at a reference
station. Because healthy biological communities may vary, instead of using one reference station, the
Reference Condition Approach is developed using multiple stations to account for natural
differences. Further details on the Reference Condition Approach to biological assessments are in the
2014 CALM.
Data limitations restrict applicability of the new Reference Condition Approach to only the
Coastal Plains and Hills ecoregion of the state (generally the interior, non-coastal areas of RI).
Within the state’s two Lowland ecoregions (Long Island Sound and Narragansett/Bristol), core sites
with minimal disturbance have not been identified in sufficient numbers to support index
development in these areas of the state. Furthermore, because streams in the state’s Lowland
ecoregions are more typically characterized by non-riffle low gradient systems, it is not appropriate
to apply the new approach, which was developed using riffle habitat data, to these lowland streams.
Similarly, due to significant differences in stream order, size of contributing watershed, and other
physiographic features, the developed approach and wadeable, riffle metrics are also not applicable
to the state’s larger non-wadeable rivers. Furthermore, this approach has not been applied in lakes or
ponds.
In some instances, noted earlier in the document (Clear River RI0001002R-05D, Wood River
RI0008040R-16D, Bailey’s Brook & Tribs RI0007035R-01, Maidford River RI0007035R-02B,
and Dundery Brook & Tribs RI0010048R-02C), the timed kick of riffle habitat method was
historically misapplied in non-wadeable and low gradient areas. These segments are proposed for
delisting the cause benthic macroinvertebrates bioassessments in this cycle in other sections of
this document.
The 2014 CALM, used in this 2016 assessment cycle, reflects the work to date to develop a stronger
biological monitoring and assessment program, and specifically notes how benthic macroinvertebrate
data should be applied. The outcome of this process is the determination that it is only appropriate to
Page 68 of 85
FINAL March 2018
apply the benthic macroinvertebrate bioassessment cause to waterbodies that contain perennial
wadeable riffle habitat.
Lakes, non-wadeable rivers, and rivers not containing riffle habitat listed for either aquatic
macroinvertebrate or benthic macroinvertebrate bioassessments as a cause of Aquatic Life Use
impairment are proposed for de-listing (#27-. Many of the original listings, dating to 1990’s and
early 2000’s, the cause biodiversity impacts was used for various biological impairments, which
were later converted to benthic macroinvertebrate bioassessments or aquatic macroinvertebrate
bioassessments. With the refinements in the State’s biological monitoring program detailed in
this section, the use of these cause terms is inappropriate and not reflective of the nature of
aquatic life use impairment. Almost all the waterbodies continue to be impaired for aquatic life
use, most often for nutrients and/or metals.
Work towards developing appropriate sampling protocol and index development for Lowland sites
and non-wadeable large rivers are important future tasks that ideally can be pursued on a regional
basis with neighboring states. In the interim, the State uses water chemistry as the primary means to
assess the aquatic life use of these waterbodies. The 2014 CALM, used for this 2016 assessment
cycle, further details the process to assess Aquatic Life Use in non-wadeable, large rivers using
water chemistry data. In lakes, the Aquatic Life Use is not specifically defined but would also be
assessed with conventional water chemistry data as the core indicator.
27. Saugatucket Pond (RI0010045L-01) Saugatucket Pond. South Kingstown
This waterbody was originally listed in 1998 for biodiversity impacts and noxious aquatic
plants native in 2000. These impairments were changed to benthic-macroinvertebrate
bioassessments. As detailed above, Rhode Island’s field sampling protocols for benthic
macroinvertebrate biomonitoring require sampling in freshwater environments with riffle
habitat, and the Reference Condition Approach in assessments is only applicable in
perennial, wadeable riffle habitat of streams in the Coastal Plains and Hills ecoregion.
Given that this is now an inappropriate cause for this type of waterbody, a lake, the
benthic-macroinvertebrate bioassessments cause will be delisted. The 2016 303d list
continues to identify this pond as having an Aquatic Life Use impairment cause of
phosphorus (total). Water quality associated with the original impairment is expected to
have improved with work completed at the upstream Superfund site at Rose Hill Landfill.
28. Valley Falls Pond (RI0001003L-02) Valley Falls Pond. Cumberland
This waterbody was originally listed in 1998 for biodiversity impacts. This impairment
was changed to benthic-macroinvertebrate bioassessments. As detailed above, Rhode
Island’s field sampling protocols for benthic macroinvertebrate biomonitoring require
sampling in freshwater environments with riffle habitat, and the Reference Condition
Approach in assessments is only applicable in perennial, wadeable riffle habitat of
streams in the Coastal Plains and Hills ecoregion. Given that this is now an inappropriate
Page 69 of 85
FINAL March 2018
cause for this type of waterbody, a lake, the benthic-macroinvertebrate bioassessments
cause will be delisted. The 2016 303d list continues to identify this pond as having
Aquatic Life Use impairment causes of phosphorus (total), lead, and dissolved oxygen.
Furthermore, due to a recent survey (8/9/2017) of Valley Falls Pond, a substantial
population of invasive water chestnut was discovered. The cause Aquatic Invasive
Species will be added to the Aquatic Life Use impairment in this cycle as well.
29. Branch River (RI0001002R-01B) Branch River and tributaries from the outlet of the Slatersville Reservoir to the
confluence with the Blackstone River. North Smithfield
This waterbody was originally listed in 1998 for biodiversity impacts. The cause was
changed to aquatic macroinvertebrates bioassessments. As detailed above, Rhode Island’s
field sampling protocols for benthic macroinvertebrate biomonitoring require sampling in
freshwater environments with riffle habitat, and the Reference Condition Approach in
assessments is only applicable in perennial, wadeable riffle habitat of streams in the
Coastal Plains and Hills ecoregion. Given that this is now an inappropriate cause for this
type of waterbody, a non-wadeable river, the aquatic macroinvertebrate bioassessments
cause will be delisted. The 2016 303d list continues to identify this river segment as
having Aquatic Life Use impairment cause of dissolved lead (Note: Copper is being
delisted in this assessment cycle).
30. Ten Mile River & Tribs (RI0004009R-01B) Ten Mile River and tributaries downstream of Turner Reservoir South to the Omega
Pond inlet. East Providence
This waterbody was originally listed in 1998 for biodiversity impacts. This impairment
was changed to benthic-macroinvertebrate bioassessments. As detailed above, Rhode
Island’s field sampling protocols for benthic macroinvertebrate biomonitoring require
sampling in freshwater environments with riffle habitat, and the Reference Condition
Approach in assessments is only applicable in perennial, wadeable riffle habitat of
streams in the Coastal Plains and Hills ecoregion. Given that this is now an inappropriate
cause for this type of waterbody, a non-wadeable river, the benthic-macroinvertebrate
bioassessments cause will be delisted. The 2016 303d list continues to identify this river
segment as having Aquatic Life Use impairment causes of aluminum and cadmium.
Water quality associated with the original impairment is expected to have improved with
work completed at the upstream WWTF improvements.
31. Runnins River & Tribs (RI0007021R-01) Runnins River from the MA-RI border to the Mobil Dam in East Providence. Providence,
East Providence
This waterbody was originally listed in 1998 for biodiversity impacts. This impairment
was changed to benthic-macroinvertebrate bioassessments. As detailed above, Rhode
Island’s field sampling protocols for benthic macroinvertebrate biomonitoring require
sampling in freshwater environments with riffle habitat, and the Reference Condition
Page 70 of 85
FINAL March 2018
Approach in assessments is only applicable in perennial, wadeable riffle habitat of
streams in the Coastal Plains and Hills ecoregion. This river segment is a wadeable
segment, but it does not contain riffle habitat for RBP macroinvertebrate field methods.
Given that this is now an inappropriate cause for this type of waterbody, non-riffle
habitat, the benthic-macroinvertebrate bioassessments cause will be delisted. The 2016
303d list continues to identify this river segment as having Aquatic Life Use impairment
causes of lead and dissolved oxygen.
32. Blackstone River (RI0001003R-01A) Blackstone River from the MA-RI border to the CSO outfall located River and Samoset
Streets in Central Falls. Woonsocket, North Smithfield, Cumberland, Lincoln and Central
Falls.
This waterbody was originally listed in 1996 for biodiversity impacts. This impairment
was changed to benthic-macroinvertebrate bioassessments. As detailed above, Rhode
Island’s field sampling protocols for benthic macroinvertebrate biomonitoring require
sampling in freshwater environments with riffle habitat, and the Reference Condition
Approach in assessments is only applicable in perennial, wadeable riffle habitat of
streams in the Coastal Plains and Hills ecoregion. Given that this is now an inappropriate
cause for this type of waterbody, a non-wadeable river, the benthic-macroinvertebrate
bioassessments cause will be delisted. The 2016 303d list continues to identify this river
segment as having Aquatic Life Use impairment causes of cadmium, lead, dissolved
oxygen, phosphorus (total), iron, aquatic invasive species, and milfoil. Water quality
associated with the original impairment is expected to have improved with work
completed at the upstream WWTF improvements.
33. Blackstone River (RI0001003R-01B) Blackstone River from the CSO outfall located at River and Samoset Streets in Central
Falls to the Slater Mill Dam. Central Falls, Pawtucket.
This waterbody was originally listed in 1996 for biodiversity impacts. This impairment
was changed to benthic-macroinvertebrate bioassessments. As detailed above, Rhode
Island’s field sampling protocols for benthic macroinvertebrate biomonitoring require
sampling in freshwater environments with riffle habitat, and the Reference Condition
Approach in assessments is only applicable in perennial, wadeable riffle habitat of
streams in the Coastal Plains and Hills ecoregion. Given that this is now an inappropriate
cause for this type of waterbody, a non-wadeable river, the benthic-macroinvertebrate
bioassessments cause will be delisted. The 2016 303d list continues to identify this river
segment as having Aquatic Life Use impairment causes of dissolved oxygen, phosphorus
(total), and iron. Water quality associated with the original impairment is expected to
have improved with work completed at the upstream WWTF improvements.
Page 71 of 85
FINAL March 2018
34. Pawtuxet River Main Stem (RI0006017R-03) Pawtuxet River from the confluence of the North and South Branches at Riverpoint to the
Pawtuxet Cove Dam at Pawtuxet. West Warwick, Warwick, Cranston
This waterbody was originally listed in 1994 for biodiversity impacts. This impairment
was changed to benthic-macroinvertebrate bioassessments. As detailed above, Rhode
Island’s field sampling protocols for benthic macroinvertebrate biomonitoring require
sampling in freshwater environments with riffle habitat, and the Reference Condition
Approach in assessments is only applicable in perennial, wadeable riffle habitat of
streams in the Coastal Plains and Hills ecoregion. Given that this is now an inappropriate
cause for this type of waterbody, a non-wadeable river, the benthic-macroinvertebrate
bioassessments cause will be delisted. The 2016 303d list continues to identify this river
segment as having Aquatic Life Use impairment causes of phosphorus (total) and aquatic
invasive species. Water quality associated with the original impairment is expected to
have improved with work completed at the upstream WWTF improvements.
Page 72 of 85
FINAL March 2018
MT. HOPE BAY TEMPERATURE DELISTING
35. Mt. Hope Bay (RI0007032E-01A) Mt. Hope Bay south and west of the MA/RI border, and east of a line from Touisset Point
to the channel marker buoy R “4” and south and east of a line from buoy R “4” to the
southernmost landward end of Bristol Point and south of a line from Bristol Point to the
Hog Island shoal light, to the southwestern extremity of Arnold Point in Portsmouth
where a RIDEM range marker has been established; and west of a line from the end of
Gardiner’s Neck Road, Swansea to buoy N”2”, through buoy R4 to Common Fence
Point, Portsmouth excluding the waters defined in RI0007032E-01E below. Warren,
Portsmouth*
* Note: This is the description from the Water Quality Regulations (RIDEM 2009). RI0007032E-01E is not described
below in this document. See: http://www.dem.ri.gov/pubs/regs/regs/water/h20q09a.pdf for RI0007032E-01E
description.
36. Mt. Hope Bay (RI0007032E-01B) Mt. Hope Bay waters north and west of a line from the southernmost landward end of
Bristol Point to buoy R “4” and west of a line from buoy R “4” to the DEM range
marker on Touisset Point, and south of the Bristol Narrows. Bristol, Warren
37. Mt. Hope Bay (RI0007032E-01C) Mt. Hope Bay waters south of a line from Borden’s Wharf, Tiverton, to buoy R “4” and
west of a line from buoy R “4” to Brayton Point, Somerset, MA., and east of a line from
the end of Gardiner’s Neck Road in Swansea to buoy N “2”, through buoy R4 to
Common Fence Point, Portsmouth, and north of a line from Portsmouth to Tiverton at
the railroad bridge at “The Hummocks” on the northeast point of Portsmouth.
Portsmouth
38. Mt. Hope Bay (RI0007032E-01D) Mt. Hope Bay waters south and west of the MA-RI border and north of a line from
Borden’s Wharf, Tiverton to buoy R “4” and east of a line from buoy R “4” to Brayton
Point in Somerset, MA. Bristol, Portsmouth and Tiverton.
Introduction
The four assessment units in the RI portion of Mt. Hope Bay (RI0007032E-01A, RI0007032E-
01B, RI0007032E-01C, RI0007032E-01D) were originally listed as impaired aquatic life use
with temperature, water as a cause in 2000. The cause of this impairment was found to be
Brayton Point Station’s thermal discharge. Located on the shores of Mt. Hope Bay in Somerset
Massachusetts, Brayton Point Station, owned and operated by Dominion Energy, at one point
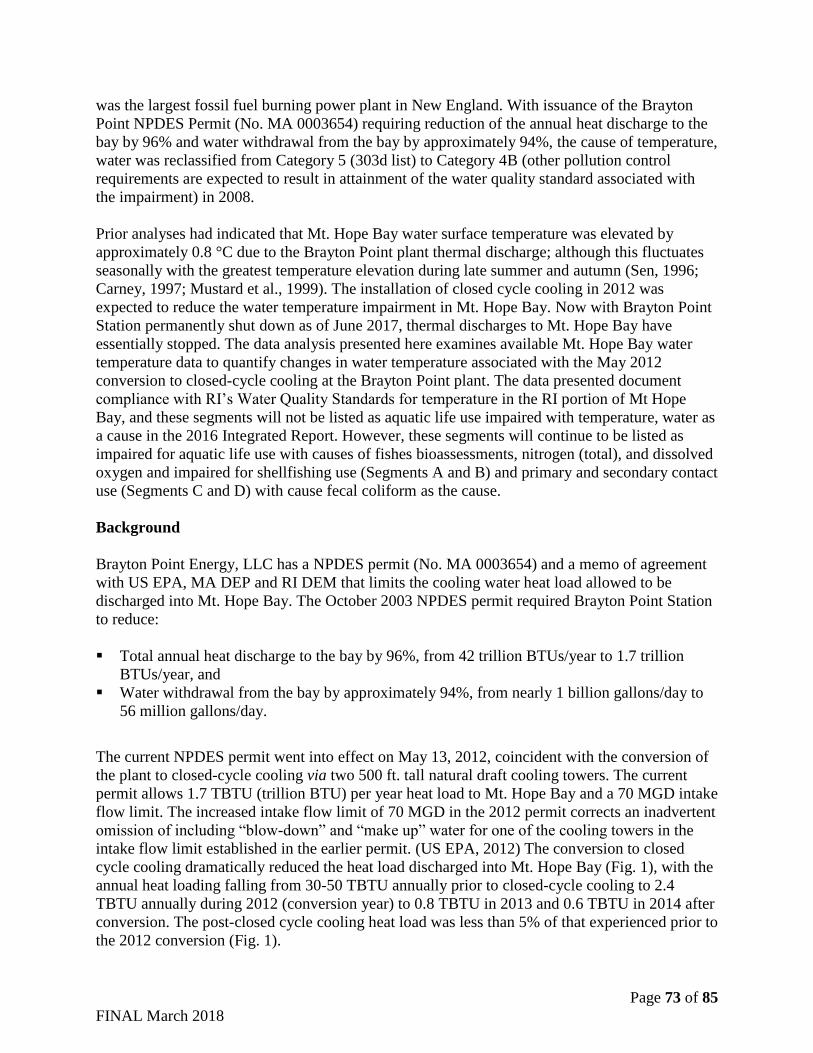
Page 73 of 85
FINAL March 2018
was the largest fossil fuel burning power plant in New England. With issuance of the Brayton
Point NPDES Permit (No. MA 0003654) requiring reduction of the annual heat discharge to the
bay by 96% and water withdrawal from the bay by approximately 94%, the cause of temperature,
water was reclassified from Category 5 (303d list) to Category 4B (other pollution control
requirements are expected to result in attainment of the water quality standard associated with
the impairment) in 2008.
Prior analyses had indicated that Mt. Hope Bay water surface temperature was elevated by
approximately 0.8 °C due to the Brayton Point plant thermal discharge; although this fluctuates
seasonally with the greatest temperature elevation during late summer and autumn (Sen, 1996;
Carney, 1997; Mustard et al., 1999). The installation of closed cycle cooling in 2012 was
expected to reduce the water temperature impairment in Mt. Hope Bay. Now with Brayton Point
Station permanently shut down as of June 2017, thermal discharges to Mt. Hope Bay have
essentially stopped. The data analysis presented here examines available Mt. Hope Bay water
temperature data to quantify changes in water temperature associated with the May 2012
conversion to closed-cycle cooling at the Brayton Point plant. The data presented document
compliance with RI’s Water Quality Standards for temperature in the RI portion of Mt Hope
Bay, and these segments will not be listed as aquatic life use impaired with temperature, water as
a cause in the 2016 Integrated Report. However, these segments will continue to be listed as
impaired for aquatic life use with causes of fishes bioassessments, nitrogen (total), and dissolved
oxygen and impaired for shellfishing use (Segments A and B) and primary and secondary contact
use (Segments C and D) with cause fecal coliform as the cause.
Background
Brayton Point Energy, LLC has a NPDES permit (No. MA 0003654) and a memo of agreement
with US EPA, MA DEP and RI DEM that limits the cooling water heat load allowed to be
discharged into Mt. Hope Bay. The October 2003 NPDES permit required Brayton Point Station
to reduce:
▪ Total annual heat discharge to the bay by 96%, from 42 trillion BTUs/year to 1.7 trillion
BTUs/year, and
▪ Water withdrawal from the bay by approximately 94%, from nearly 1 billion gallons/day to
56 million gallons/day.
The current NPDES permit went into effect on May 13, 2012, coincident with the conversion of
the plant to closed-cycle cooling via two 500 ft. tall natural draft cooling towers. The current
permit allows 1.7 TBTU (trillion BTU) per year heat load to Mt. Hope Bay and a 70 MGD intake
flow limit. The increased intake flow limit of 70 MGD in the 2012 permit corrects an inadvertent
omission of including “blow-down” and “make up” water for one of the cooling towers in the
intake flow limit established in the earlier permit. (US EPA, 2012) The conversion to closed
cycle cooling dramatically reduced the heat load discharged into Mt. Hope Bay (Fig. 1), with the
annual heat loading falling from 30-50 TBTU annually prior to closed-cycle cooling to 2.4
TBTU annually during 2012 (conversion year) to 0.8 TBTU in 2013 and 0.6 TBTU in 2014 after
conversion. The post-closed cycle cooling heat load was less than 5% of that experienced prior to
the 2012 conversion (Fig. 1).
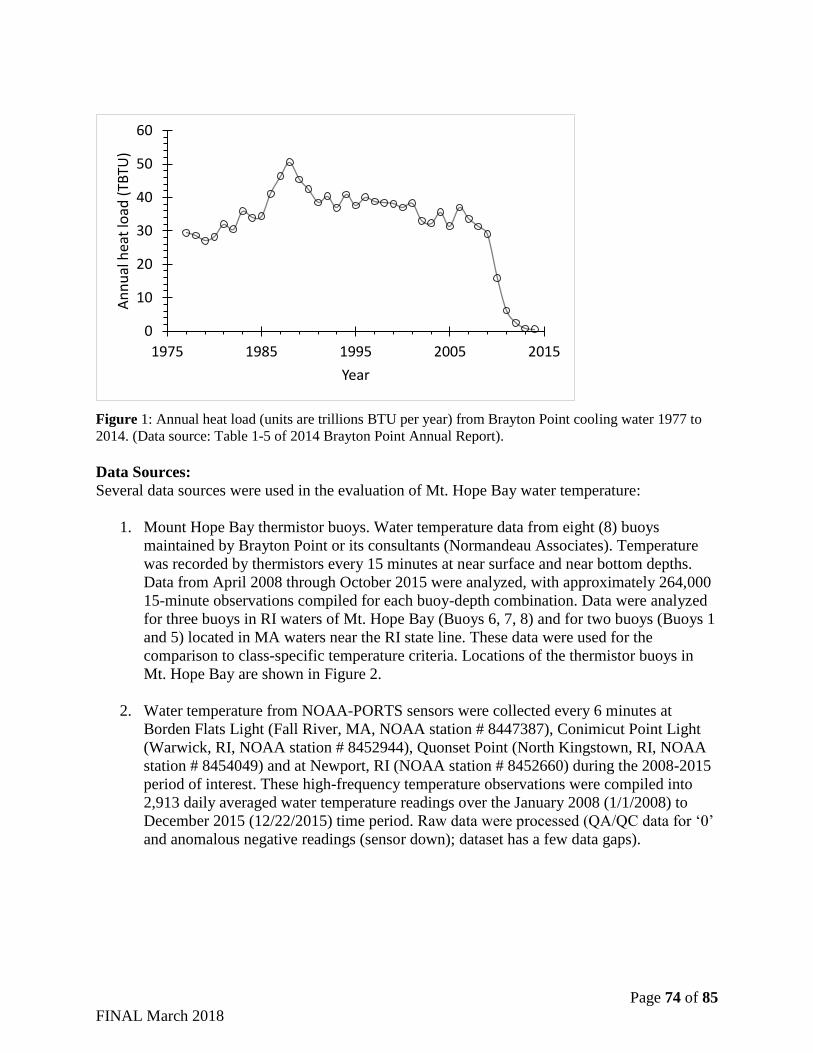
Page 74 of 85
FINAL March 2018
Figure 1: Annual heat load (units are trillions BTU per year) from Brayton Point cooling water 1977 to
2014. (Data source: Table 1-5 of 2014 Brayton Point Annual Report).
Data Sources:
Several data sources were used in the evaluation of Mt. Hope Bay water temperature:
1. Mount Hope Bay thermistor buoys. Water temperature data from eight (8) buoys
maintained by Brayton Point or its consultants (Normandeau Associates). Temperature
was recorded by thermistors every 15 minutes at near surface and near bottom depths.
Data from April 2008 through October 2015 were analyzed, with approximately 264,000
15-minute observations compiled for each buoy-depth combination. Data were analyzed
for three buoys in RI waters of Mt. Hope Bay (Buoys 6, 7, 8) and for two buoys (Buoys 1
and 5) located in MA waters near the RI state line. These data were used for the
comparison to class-specific temperature criteria. Locations of the thermistor buoys in
Mt. Hope Bay are shown in Figure 2.
2. Water temperature from NOAA-PORTS sensors were collected every 6 minutes at
Borden Flats Light (Fall River, MA, NOAA station # 8447387), Conimicut Point Light
(Warwick, RI, NOAA station # 8452944), Quonset Point (North Kingstown, RI, NOAA
station # 8454049) and at Newport, RI (NOAA station # 8452660) during the 2008-2015
period of interest. These high-frequency temperature observations were compiled into
2,913 daily averaged water temperature readings over the January 2008 (1/1/2008) to
December 2015 (12/22/2015) time period. Raw data were processed (QA/QC data for ‘0’
and anomalous negative readings (sensor down); dataset has a few data gaps).
0
10
20
30
40
50
60
1975 1985 1995 2005 2015
An
nu
al h
eat
load
(TB
TU)
Year
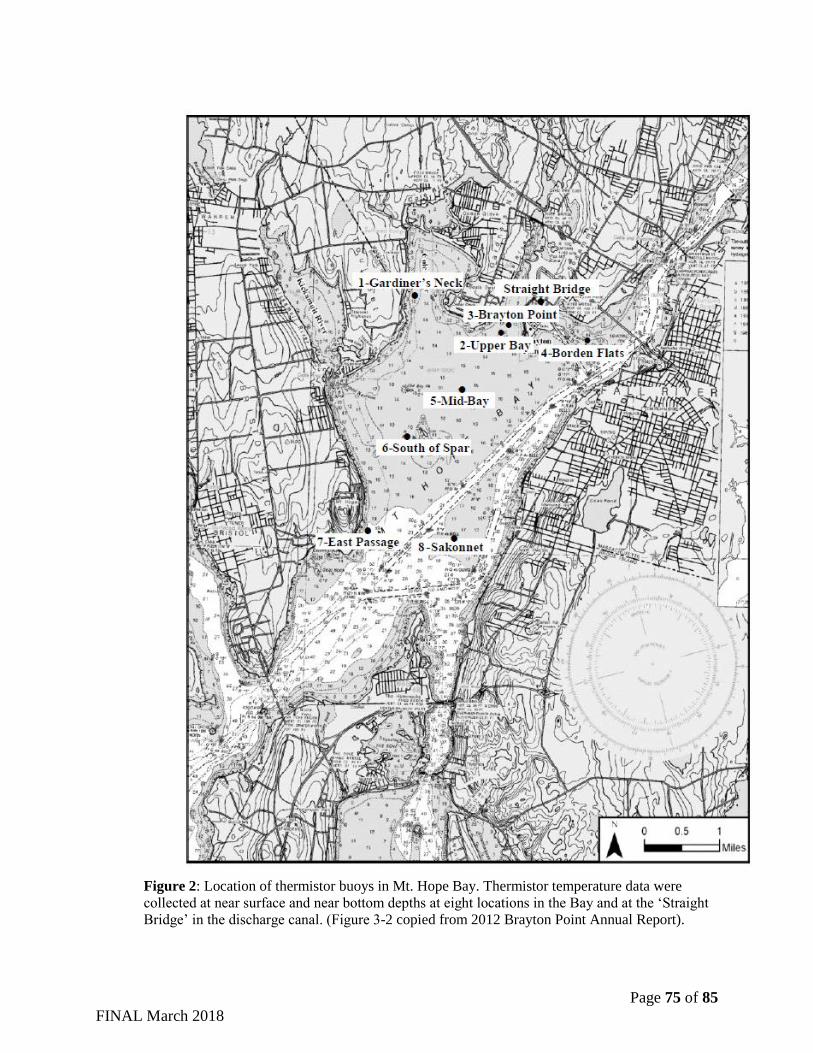
Page 75 of 85
FINAL March 2018
Figure 2: Location of thermistor buoys in Mt. Hope Bay. Thermistor temperature data were
collected at near surface and near bottom depths at eight locations in the Bay and at the ‘Straight
Bridge’ in the discharge canal. (Figure 3-2 copied from 2012 Brayton Point Annual Report).
Page 76 of 85
FINAL March 2018
Comparison to RI Class-Specific Criterion for Temperature
Four assessment units (water body ID RI0007032E-01A, RI0007032E-01B, RI0007032E-01C,
RI0007032E-01D) of the RI portion of Mt. Hope Bay are listed as impaired aquatic life use due
to temperature, water. Two specific water temperature criteria are listed for RI marine waters:
1. activities shall not cause water temperature to exceed 83°F (28.3°C) and;
2. activities shall not cause the temperature to rise greater than 1.6°F (0.9°C) above
normal during June 16th through September and greater than 4°F (2.2°C) above
normal from October until June 16th (State of RI Water Quality Regulations, July
2006, amended December 2010; Table 2.8 D (3); page 16).
The fifteen-minute (instantaneous) thermistor buoy temperature readings collected by Brayton
Point Energy, LLC and its contractors were used to evaluate changes in the frequency of water
temperature violations of these criteria. The high frequency instantaneous temperature
observations were compiled for approximately 3.5 years prior-to (April 2008 to September 2011)
and approximately 3.5 years after (June 2012 to December 2015) the conversion to closed-cycle
cooling. These temperature observations were analyzed for the frequency of exceeding the 83°F
maximum water temperature criteria. Additionally, the water temperature data collected from
NOAA –Ports Sensors at four locations in Narragansett Bay were evaluated for comparison with
the Mt Hope Bay temperature data to assess change in temperature from “normal”.
83°F Maximum Water Temperature Criterion
The frequency of 83°F threshold exceedance was relatively uncommon prior to the conversion to
closed cycle cooling, with a maximum of 0.22% of observations (254 exceedances out of
117,754 observations) exceeding the threshold at the surface of the Gardiner’s Neck station
(Buoy 1S, in MA waters). Following the conversion to closed cycle conversion, the frequency of
exceeding 83 °F declined significantly at multiple locations (Table 1). Frequency of 83 °F
declined significantly at Buoys 1S and 1B (Gardiner’s Neck, surface and bottom depths, in MA
waters), Buoy 5S ((Mid-Bay, north of Spar Island, in MA waters) and at Buoy 8S (Sakonnet, RI
waters). At the other buoys (i.e., 6S, 7S, 5B, 6B, 7B, 8B), there was no statistically significant
change in 83 °F frequency because the frequency was near 0% both before- and after- the
conversion to closed cycle cooling (Table 1). With the exception of Buoy 1S, there were less
than four (out of ~111,000 to 120,000) post-closed cycle cooling instantaneous readings of 83 °F
or greater (Table 1). While Buoy 1S had a statistically significant post-closed cycle cooling
decline in frequency of 83 °F exceedance, there were still 126 (of 119,627) instantaneous
temperature readings of greater than 83 °F during the post- closed cycle cooling period. Most
(120 of 126) of the temperature exceedances at Buoy 1S occurred during July 2013 heat waves.
Two heat waves (three consecutive days or more with maximum temperature of 90 °F or greater)
occurred during July 2013 (July 6 to 8 and July 18 to 21) during which air temperature at
Taunton Municipal Airport reached 97 °F. During these heatwaves, most 83 °F temperature
exceedances at Buoy 1S (Gardiner’s Neck) occurred during ebb tides. The shallow location of
Buoy 1S at the mouth of the Cole River is subject to ebb tide tidal flow from the shallow ‘Ocean
Grove’ area draining up-Bay of the buoy. No other 83 °F exceedances were recorded at Buoy 1S
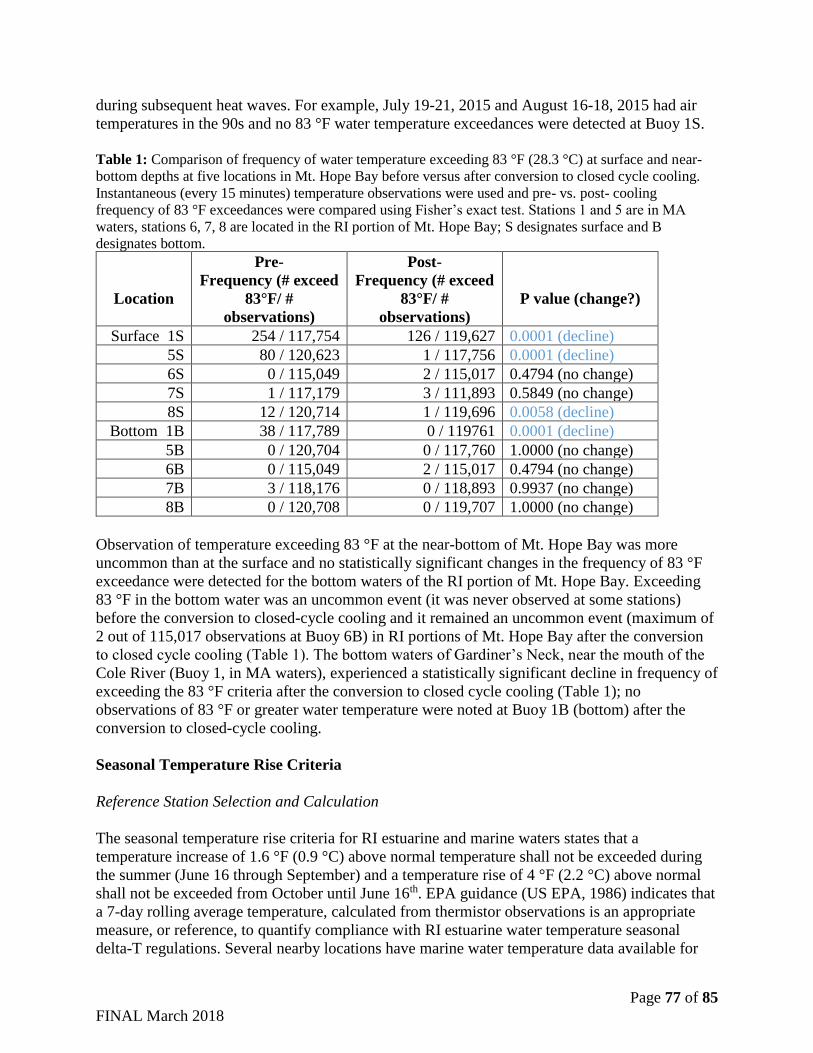
Page 77 of 85
FINAL March 2018
during subsequent heat waves. For example, July 19-21, 2015 and August 16-18, 2015 had air
temperatures in the 90s and no 83 °F water temperature exceedances were detected at Buoy 1S.
Table 1: Comparison of frequency of water temperature exceeding 83 °F (28.3 °C) at surface and near-
bottom depths at five locations in Mt. Hope Bay before versus after conversion to closed cycle cooling.
Instantaneous (every 15 minutes) temperature observations were used and pre- vs. post- cooling
frequency of 83 °F exceedances were compared using Fisher’s exact test. Stations 1 and 5 are in MA
waters, stations 6, 7, 8 are located in the RI portion of Mt. Hope Bay; S designates surface and B
designates bottom.
Location
Pre-
Frequency (# exceed
83°F/ #
observations)
Post-
Frequency (# exceed
83°F/ #
observations)
P value (change?)
Surface 1S 254 / 117,754 126 / 119,627 0.0001 (decline)
5S 80 / 120,623 1 / 117,756 0.0001 (decline)
6S 0 / 115,049 2 / 115,017 0.4794 (no change)
7S 1 / 117,179 3 / 111,893 0.5849 (no change)
8S 12 / 120,714 1 / 119,696 0.0058 (decline)
Bottom 1B 38 / 117,789 0 / 119761 0.0001 (decline)
5B 0 / 120,704 0 / 117,760 1.0000 (no change)
6B 0 / 115,049 2 / 115,017 0.4794 (no change)
7B 3 / 118,176 0 / 118,893 0.9937 (no change)
8B 0 / 120,708 0 / 119,707 1.0000 (no change)
Observation of temperature exceeding 83 °F at the near-bottom of Mt. Hope Bay was more
uncommon than at the surface and no statistically significant changes in the frequency of 83 °F
exceedance were detected for the bottom waters of the RI portion of Mt. Hope Bay. Exceeding
83 °F in the bottom water was an uncommon event (it was never observed at some stations)
before the conversion to closed-cycle cooling and it remained an uncommon event (maximum of
2 out of 115,017 observations at Buoy 6B) in RI portions of Mt. Hope Bay after the conversion
to closed cycle cooling (Table 1). The bottom waters of Gardiner’s Neck, near the mouth of the
Cole River (Buoy 1, in MA waters), experienced a statistically significant decline in frequency of
exceeding the 83 °F criteria after the conversion to closed cycle cooling (Table 1); no
observations of 83 °F or greater water temperature were noted at Buoy 1B (bottom) after the
conversion to closed-cycle cooling.
Seasonal Temperature Rise Criteria
Reference Station Selection and Calculation
The seasonal temperature rise criteria for RI estuarine and marine waters states that a
temperature increase of 1.6 °F (0.9 °C) above normal temperature shall not be exceeded during
the summer (June 16 through September) and a temperature rise of 4 °F (2.2 °C) above normal
shall not be exceeded from October until June 16th. EPA guidance (US EPA, 1986) indicates that
a 7-day rolling average temperature, calculated from thermistor observations is an appropriate
measure, or reference, to quantify compliance with RI estuarine water temperature seasonal
delta-T regulations. Several nearby locations have marine water temperature data available for
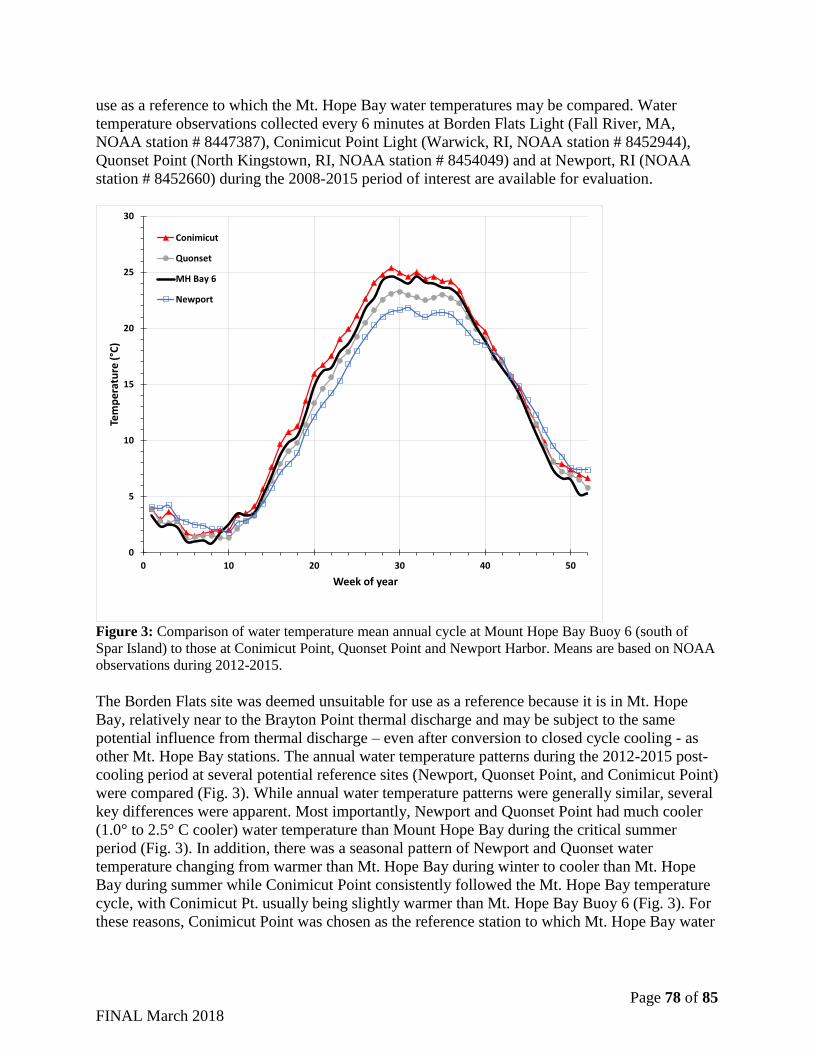
Page 78 of 85
FINAL March 2018
use as a reference to which the Mt. Hope Bay water temperatures may be compared. Water
temperature observations collected every 6 minutes at Borden Flats Light (Fall River, MA,
NOAA station # 8447387), Conimicut Point Light (Warwick, RI, NOAA station # 8452944),
Quonset Point (North Kingstown, RI, NOAA station # 8454049) and at Newport, RI (NOAA
station # 8452660) during the 2008-2015 period of interest are available for evaluation.
Figure 3: Comparison of water temperature mean annual cycle at Mount Hope Bay Buoy 6 (south of
Spar Island) to those at Conimicut Point, Quonset Point and Newport Harbor. Means are based on NOAA
observations during 2012-2015.
The Borden Flats site was deemed unsuitable for use as a reference because it is in Mt. Hope
Bay, relatively near to the Brayton Point thermal discharge and may be subject to the same
potential influence from thermal discharge – even after conversion to closed cycle cooling - as
other Mt. Hope Bay stations. The annual water temperature patterns during the 2012-2015 post-
cooling period at several potential reference sites (Newport, Quonset Point, and Conimicut Point)
were compared (Fig. 3). While annual water temperature patterns were generally similar, several
key differences were apparent. Most importantly, Newport and Quonset Point had much cooler
(1.0° to 2.5° C cooler) water temperature than Mount Hope Bay during the critical summer
period (Fig. 3). In addition, there was a seasonal pattern of Newport and Quonset water
temperature changing from warmer than Mt. Hope Bay during winter to cooler than Mt. Hope
Bay during summer while Conimicut Point consistently followed the Mt. Hope Bay temperature
cycle, with Conimicut Pt. usually being slightly warmer than Mt. Hope Bay Buoy 6 (Fig. 3). For
these reasons, Conimicut Point was chosen as the reference station to which Mt. Hope Bay water
0
5
10
15
20
25
30
0 10 20 30 40 50
Tem
pe
ratu
re (
°C)
Week of year
Conimicut
Quonset
MH Bay 6
Newport
Page 79 of 85
FINAL March 2018
temperature was compared for evaluation of changes in compliance with RI water temperature
seasonal rise (delta-T) criteria.
Water temperature at near-surface and near bottom sensors were compiled from the 15-minute
buoy observations at Buoy locations 1, 5, 6, 7 and 8 in Mt. Hope Bay and at the NOAA
Conimicut Pt. reference location (Warwick, RI, NOAA station # 8452944). Following EPA
‘Gold Book’ methodology (US EPA, 1986), the 7-day rolling average temperature was
calculated from the 15-minute thermistor observations and this was used as a reference to
calculate seasonally varying delta-T temperatures. The frequency of exceeding RI seasonal
temperature delta-T criteria for marine waters prior to-and after conversion of the Brayton Point
plant to closed cycle cooling was evaluated using 2X2 contingency tables (# days meet vs # days
exceed criteria by Pre- vs. Post-cooling periods) and Fisher’s exact test. Frequency of exceeding
the RI summer temperature delta-T criteria (June 16th through September; mean temperature
+0.9 °C) and winter temperature delta-T criteria (October through June 15th; mean temperature +
2.2 °C) were tested separately.
Frequency of Seasonal delta-T Exceedances
Summer seasonal delta-T exceedance frequency
Frequency of exceeding the summer seasonal temperature delta-T criteria (mean reference
temperature +0.9 °C; in effect 16 June through the last day of September) declined significantly
in the surface waters at all locations examined (Buoys 1, 5, 6, 7, 8) following the conversion to
closed cycle cooling (Fig. 4). Locations in RI waters of Mt. Hope Bay displayed statistically
significant declines in frequency of exceeding summer delta-T temperature criteria: Buoy 6S
(south of Spar Island) had a decline from 11.8% to 0.2% of days exceeding summer delta-T
criteria, Buoy 7S (near Mt. Hope) experienced a decline from 5.7% to 0%, and Buoy 8S
(approach to Sakonnet) experienced a decline from 8.1% to 0.5% of days exceeding the summer
seasonal delta-T criteria (Fig. 4, top).
Surface water at locations in MA waters of Mt. Hope Bay also experienced significant declines
in the frequency of violating the summer delta-T criteria (Fig. 4), but station 1S, located in the
shallow waters of upper Mt. Hope Bay (west of Gardiner’s Neck) still exceeded seasonal delta-T
criteria approximately 15% of the time following closed cycle cooling. The post-closed cycle
cooling summer delta-T exceedances at Gardiners Neck (Buoy 1) were primarily during July and
August 2015 heat waves. Heat waves (three consecutive days or more with maximum
temperature of 90 °F or greater) occurred during July 19-21, 2015 and August 16-18, 2015
during which air temperature at Taunton Municipal Airport reached 93-94 °F. As described in
the 83 °F criteria section, the shallow location of Buoy 1S at the mouth of the Cole River is
subject to ebb-tide tidal flow from the warmer (in summer) and shallow ‘Ocean Grove’ area
draining up-Bay of the 1S Buoy. Tidal currents tend to push surface water from the Brayton
Point area to the west during ebb tides (Swanson et al., 2006) such that discharge from the plant
may have also contributed to violation of surface water delta-T exceedance at Buoy 1S in the
Gardiner’s Neck area (MA waters) close to the power plant discharge during these heat waves.
No other violations of the summer delta-T criteria were observed at this location, including
during ebb tides.
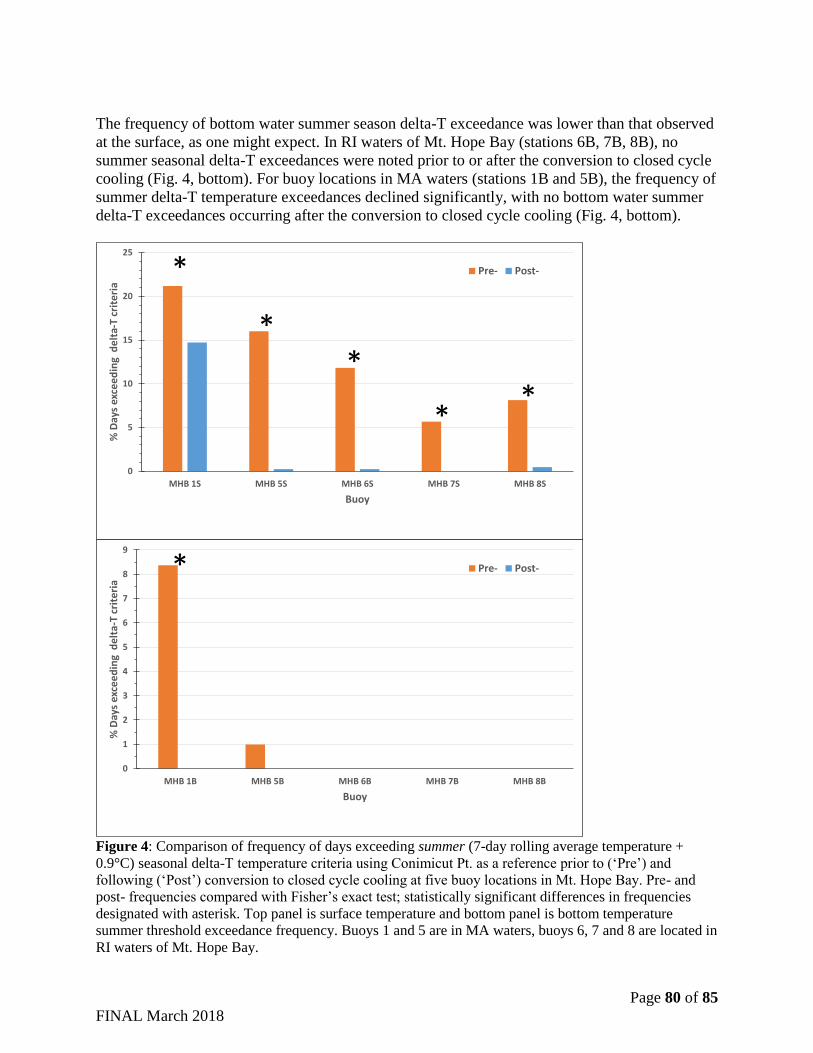
Page 80 of 85
FINAL March 2018
The frequency of bottom water summer season delta-T exceedance was lower than that observed
at the surface, as one might expect. In RI waters of Mt. Hope Bay (stations 6B, 7B, 8B), no
summer seasonal delta-T exceedances were noted prior to or after the conversion to closed cycle
cooling (Fig. 4, bottom). For buoy locations in MA waters (stations 1B and 5B), the frequency of
summer delta-T temperature exceedances declined significantly, with no bottom water summer
delta-T exceedances occurring after the conversion to closed cycle cooling (Fig. 4, bottom).
Figure 4: Comparison of frequency of days exceeding summer (7-day rolling average temperature +
0.9°C) seasonal delta-T temperature criteria using Conimicut Pt. as a reference prior to (‘Pre’) and
following (‘Post’) conversion to closed cycle cooling at five buoy locations in Mt. Hope Bay. Pre- and
post- frequencies compared with Fisher’s exact test; statistically significant differences in frequencies
designated with asterisk. Top panel is surface temperature and bottom panel is bottom temperature
summer threshold exceedance frequency. Buoys 1 and 5 are in MA waters, buoys 6, 7 and 8 are located in
RI waters of Mt. Hope Bay.
0
5
10
15
20
25
MHB 1S MHB 5S MHB 6S MHB 7S MHB 8S
% D
ays
exce
ed
ing
de
lta-
T cr
ite
ria
Buoy
Pre- Post-*
*
*
**
0
1
2
3
4
5
6
7
8
9
MHB 1B MHB 5B MHB 6B MHB 7B MHB 8B
% D
ays
exce
ed
ing
de
lta-
T cr
ite
ria
Buoy
Pre- Post-*
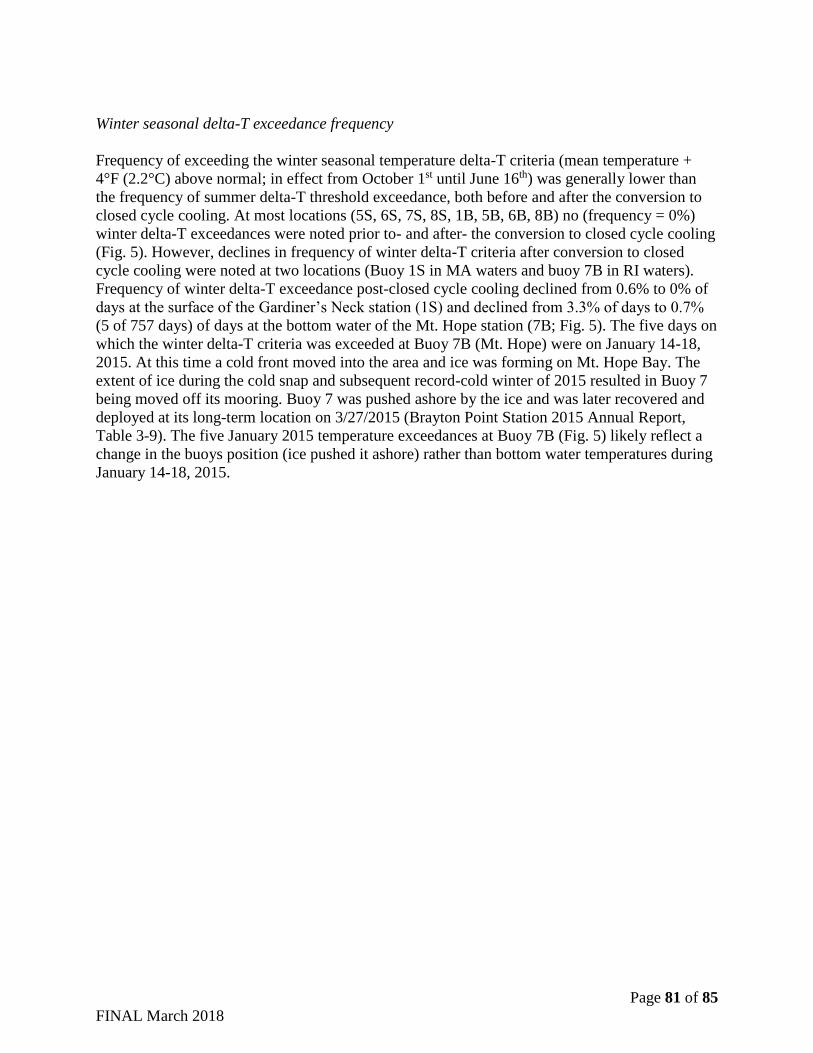
Page 81 of 85
FINAL March 2018
Winter seasonal delta-T exceedance frequency
Frequency of exceeding the winter seasonal temperature delta-T criteria (mean temperature +
4°F (2.2°C) above normal; in effect from October 1st until June 16th) was generally lower than
the frequency of summer delta-T threshold exceedance, both before and after the conversion to
closed cycle cooling. At most locations (5S, 6S, 7S, 8S, 1B, 5B, 6B, 8B) no (frequency = 0%)
winter delta-T exceedances were noted prior to- and after- the conversion to closed cycle cooling
(Fig. 5). However, declines in frequency of winter delta-T criteria after conversion to closed
cycle cooling were noted at two locations (Buoy 1S in MA waters and buoy 7B in RI waters).
Frequency of winter delta-T exceedance post-closed cycle cooling declined from 0.6% to 0% of
days at the surface of the Gardiner’s Neck station (1S) and declined from 3.3% of days to 0.7%
(5 of 757 days) of days at the bottom water of the Mt. Hope station (7B; Fig. 5). The five days on
which the winter delta-T criteria was exceeded at Buoy 7B (Mt. Hope) were on January 14-18,
2015. At this time a cold front moved into the area and ice was forming on Mt. Hope Bay. The
extent of ice during the cold snap and subsequent record-cold winter of 2015 resulted in Buoy 7
being moved off its mooring. Buoy 7 was pushed ashore by the ice and was later recovered and
deployed at its long-term location on 3/27/2015 (Brayton Point Station 2015 Annual Report,
Table 3-9). The five January 2015 temperature exceedances at Buoy 7B (Fig. 5) likely reflect a
change in the buoys position (ice pushed it ashore) rather than bottom water temperatures during
January 14-18, 2015.
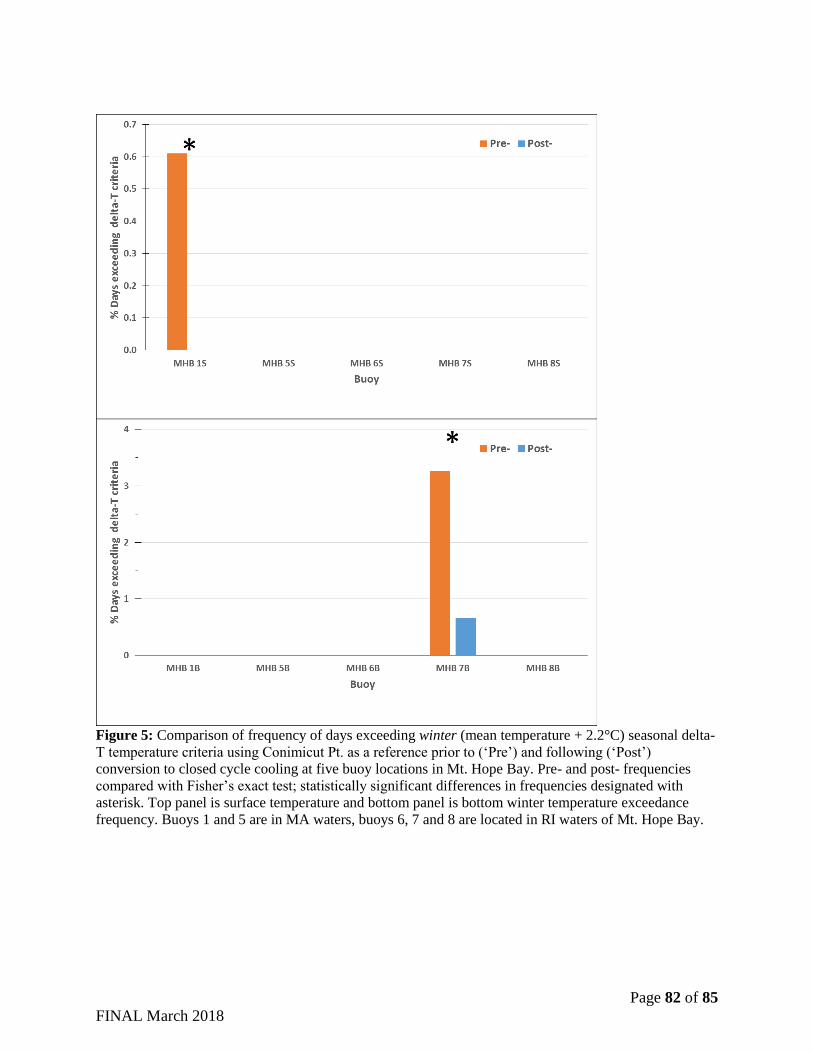
Page 82 of 85
FINAL March 2018
Figure 5: Comparison of frequency of days exceeding winter (mean temperature + 2.2°C) seasonal delta-
T temperature criteria using Conimicut Pt. as a reference prior to (‘Pre’) and following (‘Post’)
conversion to closed cycle cooling at five buoy locations in Mt. Hope Bay. Pre- and post- frequencies
compared with Fisher’s exact test; statistically significant differences in frequencies designated with
asterisk. Top panel is surface temperature and bottom panel is bottom winter temperature exceedance
frequency. Buoys 1 and 5 are in MA waters, buoys 6, 7 and 8 are located in RI waters of Mt. Hope Bay.
Page 83 of 85
FINAL March 2018
Summary and Conclusions
1. 83 °F Criterion: The frequency of exceeding the 83 °F maximum water temperature
criteria declined significantly in RI waters of Mt. Hope Bay after the conversion of
Brayton Point Power to closed-cycle cooling (Table 1). Declines in frequency of 83 °F
exceedance were greater at the surface than the bottom and stations in the northern
portion of Mt. Hope Bay had the greatest decline in 83 °F exceedance.
2. Seasonal delta-T criteria: Statistically significant declines in the frequency of exceeding
the summer seasonal delta-T criteria for RI marine waters occurred following the
conversion to closed cycle cooling (Fig. 3, Fig. 4).
a. During summer, the surface waters of the RI portion of Mt. Hope Bay (Buoys 6,
7, 8) experienced a decline from water temperature exceeding the summer delta-T
threshold ~6% to 12% of the time to only ~0% to 0.5% of the time after
conversion to closed cycle cooling (Fig. 4). Bottom waters of the RI portion of Mt
Hope Bay did not exceed summer delta- criteria either before (2008-2011) or after
(2012-2015) the conversion to closed cycle cooling.
b. During winter, the surface waters of RI portions of Mt. Hope Bay had no
exceedances of delta-T criteria before (2008-2011) or after (2012-2015) the
change to closed cycle cooling (Fig. 5). Prior to the conversion to closed-cycle
cooling, the bottom waters of Mt. Hope Bay had exceedance of winter delta-T
criteria only at Buoy 7B (bottom depth, East Passage, near Mt. Hope). After the
cooling conversion, there was a significant decline in frequency of winter delta-T
exceedance (from 3.3% of the time to 0.7% of the time) at Buoy 7B.
Collectively, the analyses presented above and analysis of Mt. Hope Bay water temperature
compared to regional water temperature patterns (RIDEM, 2017) converge on an overall decline
in the RI portions of Mt. Hope Bay surface water temperature of ~0.3 to 1.0°C (dependent on
analysis method). This temperature decline is similar to the 0.80°C (Mustard et al., 1999) to
1.24°C (Swanson, 2015) temperature elevation predicted to have been caused by operation of the
Brayton Point plant prior to the 2012 conversion to closed cycle cooling. RI portions of Mt.
Hope Bay (RI0007032E-01A, RI0007032E-01B, RI0007032E-01C, RI0007032E-01D) are
currently listed as impaired aquatic life use with temperature, water as a cause. We have
documented significant declines in the frequency of violation of two specific RI marine water
temperature criteria (83 °F maximum temperature criteria and seasonal delta-T criteria). After
the installation of closed cycle cooling, there was a significant decline in exceedance of the 83 °F
maximum temperature and there was a significant decline in frequency of summer and winter
seasonal delta-T violations.
These results indicate that Brayton Point Energy activities after the installation of closed cycle
cooling during 2008-2015 were:
1. Not causing Mt. Hope Bay water temperature to exceed 83°F (28.3°C) and;
2. The activities were not causing Mt. Hope Bay water temperature to rise greater than
1.6°F (0.9°C) above normal during June 16th through September and greater than 4°F
Page 84 of 85
FINAL March 2018
(2.2°C) above normal from October until June 16th (State of RI Water Quality
Regulations, July 2006, amended December 2010; Table 2.8 D (3); page 16).
The analyses presented here have documented a reduction in impact on water temperature in Mt.
Hope Bay and attainment of RI marine water temperature water quality criteria in the RI portion
of Mt. Hope Bay (WBIDs RI0007032E-01A, RI0007032E-01B, RI0007032E-01C, RI0007032E-
01D).
Page 85 of 85
FINAL March 2018
Literature Cited
Brayton Point Energy, LLC. 2012. Brayton Point Station Hydrographical and Biological
Monitoring Program, 2012 Annual Report
Brayton Point Energy, LLC. 2013. Brayton Point Station Hydrographical and Biological
Monitoring Program, 2013 Annual Report
Brayton Point Energy, LLC. 2014. Brayton Point Station Hydrographical and Biological
Monitoring Program, 2014 Annual Report
Brayton Point Energy, LLC. 2015. Brayton Point Station Hydrographical and Biological
Monitoring Program, 2015 Annual Report
Carney, MA. 1997, Surface temperatures in Narragansett Bay: Seasonal dynamics and
anthropogenic effects. Sc. B. Thesis, Brown University, Center for Environmental Studies,
Providence, RI. 27 pages.
Mustard, JF, Carney, MA and Sen, A. 1999. The use of satellite data to quantify thermal effluent
impacts. Estuarine Coastal Shelf Sciences 49: 509-524.
NOAA PORTS. Physical Oceanography Real-Time System. Temperature data downloaded
December, 2015. https://tidesandcurrents.noaa.gov/ports.html
NOAA NODC. National Ocean Data Center. Temperature data downloaded December, 2015.
https://www.nodc.noaa.gov/dsdt/cwtg/natl_tmap.html
RIDEM. 2010. MS4 Compliance Status Report for RI Statewide Bacteria TMDL. Rhode Island
Department of Environmental Management.
RI DEM. 2017. Mt. Hope Bay water temperature technical report. RI DEM, 235 Promenade Street,
Providence, RI 02908. 68 pages.
Sen, A. 1996. Characterization of Water Temperature in Mount Hope Bay in the Influence of
Thermal Discharge from the Brayton Point Power Plant. Sc.B. Thesis, Center for
Environmental Studies, Brown University.
State of RI Water Quality Regulations. July 2006, amended December 2010; Table 2.8 D (3); page
16.
Swanson, C., Kim, H-S, and Sankaranarayanan, S. 2006. Modeling of temperature distributions in
Mount Hope Bay due to thermal discharges from the Brayton Point Station. Northeastern
Naturalist 13 (SP4): 145-172.
United States Environmental Protection Agency (US EPA). 1986. Quality Criteria for Water
(Gold Book). EPA 440/5-86-001. Office of Water, Regulations and Standards. Washington,
D.C. http://www.epa.gov/waterscience/criteria/goldbook.pdf.
United States Environmental Protection Agency (US EPA). 2012. Fact Sheet on Draft NPDES
Permit Number MA0003654. 56 pages. Available at
https://www3.epa.gov/region1/npdes/permits/draft/2011/draftma0003654fs.pdf.