fig 11 - ksu facultyfac.ksu.edu.sa/sites/default/files/unit_3_at_rh_scehrometric_chart.pdf · the...
TRANSCRIPT
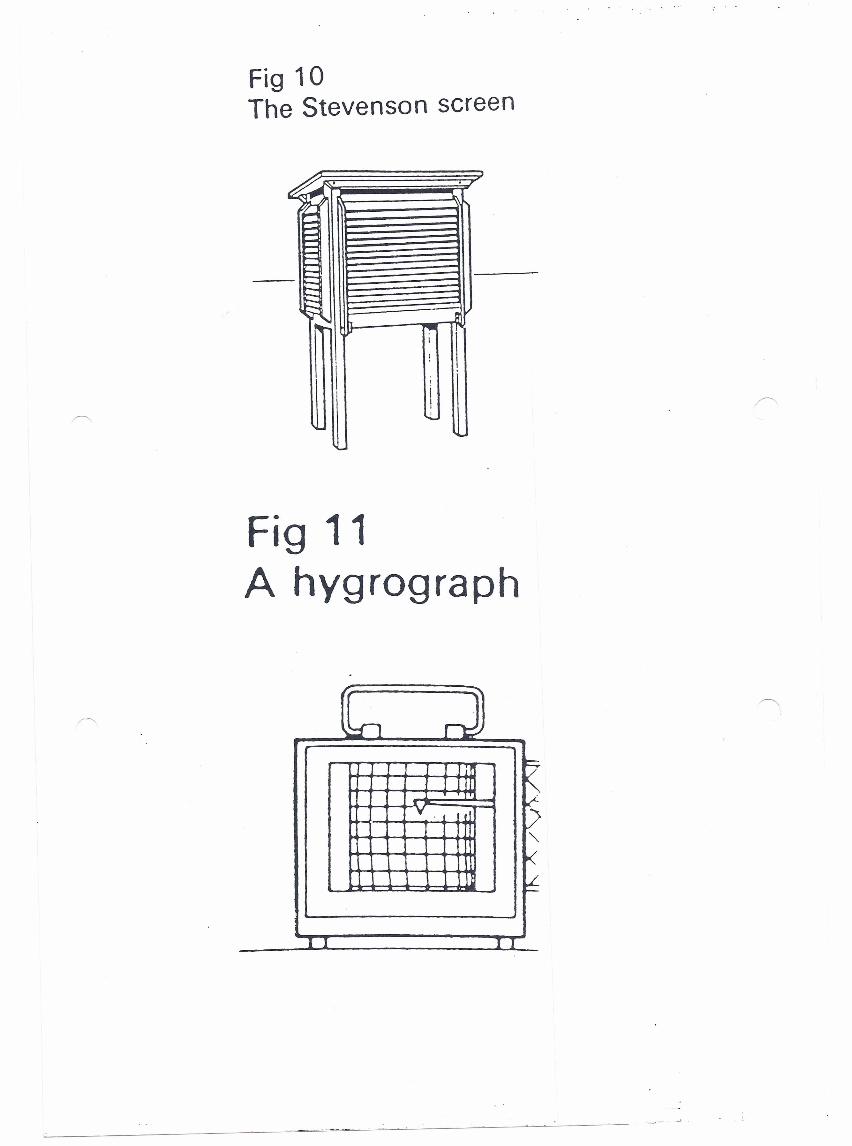
Fig 10The Stevenson screen
~ .••.•••~,?
~;:=;:=•....c:,.....~~;:::-..
-=•••• h -\
I
\\I
~
Fig 11A hygrograph
81 ~
t7rwn ~
)v. --,k~
I I 11
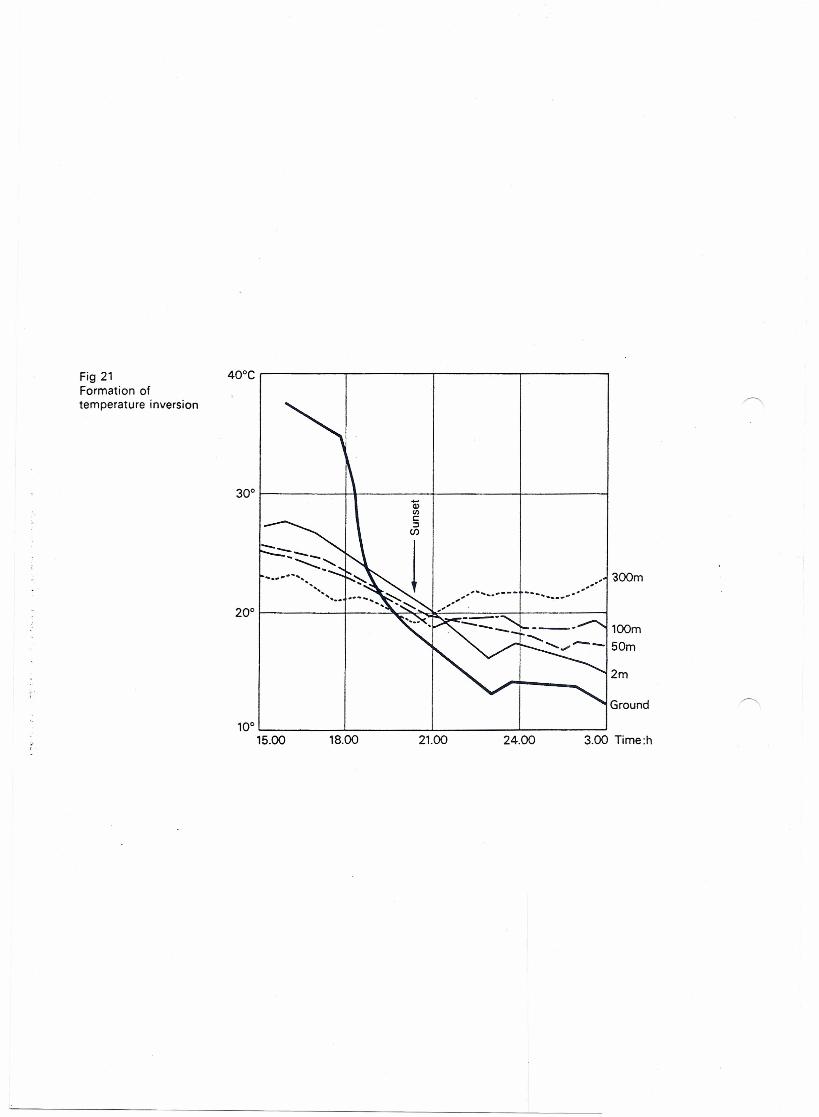
Fig 21 40°Cr-------.---------.-----~----~Formationoftemperatureinversion
'aOOm
300~--------_4~--------_4----------_+----------~
.'..'•...- .............•.••
100m50m
2m
100~ ~ ~ ~ ~
15.00 18.00 21.00 24.00 3.00 Time:h
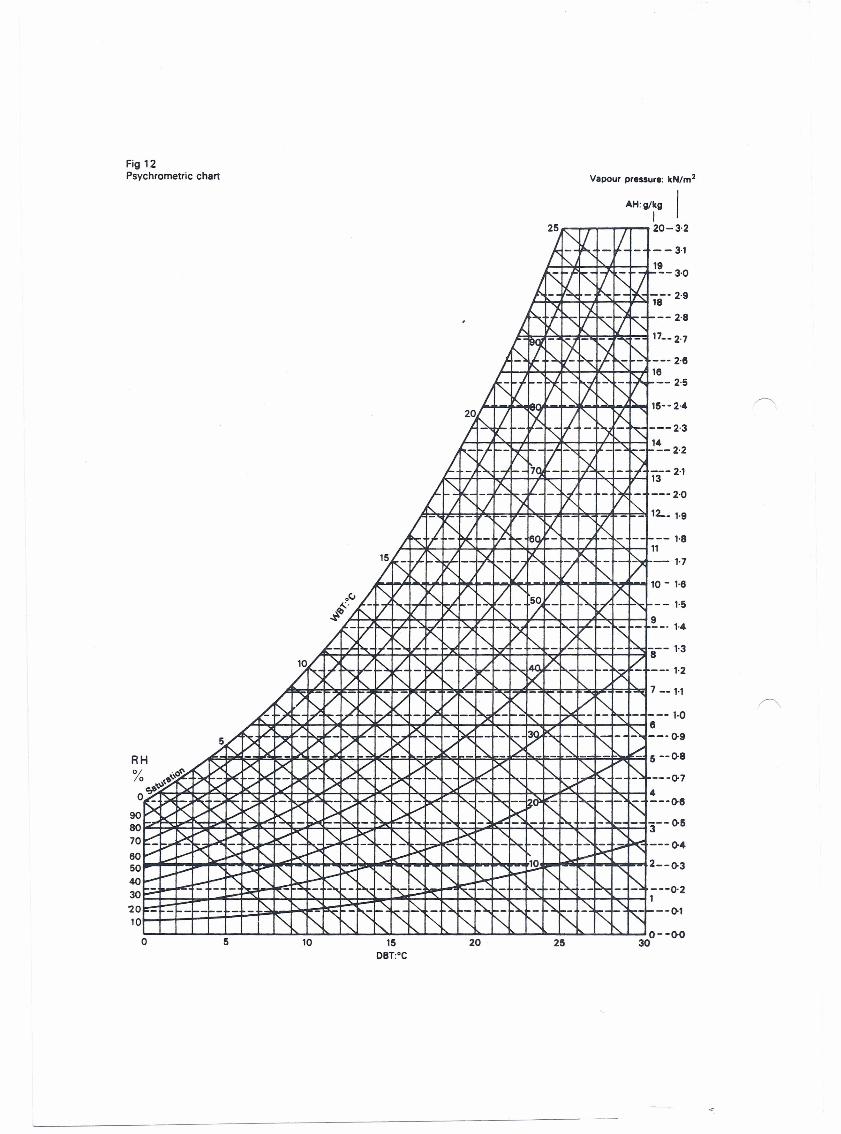
Fig 12Psychrometric chart Vapour pressure: kN/m2
AH:g/rg I0-3'2
25~~ I 2
)- _.---, 1
).~~:~ "'J~'j '/., "--. 1. J.. K <, f-. '" [7 <;
~r7~1f ~ ~1)" - '-[7 ~ - ;~t!-t/ -tj.~-t7'~J r-, f'-.~
1
20 2 ~ 11-"" KI~~- -r--:: - ~ - ~ ~~j--~"'-1 ~~-~--~t>-J - ,.. 7Qj N_
"'"7 A Ii""" 1) '-~--~-i)< - b< - - ~ - -/ LJ ~1j- - - R K - -/~V~~ -J~ 6~ -~~7' - K: --
IIIK~/~~ --~~v~~17~~- L7v L"'-V K 17 V" V" ~ 1
,,0. - -b<"'-~- - ri - -~~ --~~~~ If'-.. V "V r-, r-, 9
~-~~ ~ ~ ~~ ~ -I~ /~~~~ ~~ ~ L~- ~-S
10/), -r-, / "'~ _ ~ / I'A~~ •.._ ':::-~k:'_/~")f'-./~/ ~/~ K ~ 7
L~)~7~V~/~~f-5~v-~~~'~~~__- 1/'-. ",/" 6
7 V~LbV-~ ~ -~ •..-~-I~A~--~K-~-5/' » t= - ~ >< "V ~V -,
/~ ~ ~ ~ .L - - - ~ - - - - - ~ ~ 5
H ~/~ ~ ~ ~ ~V'" V ~~~ ~ ~V ~o .,\o~ r-:.. - k -k -~- [> -~ - ~ - ~ - - "'. - f';: -- r.x ,,--~9~V~ V v ~ ~ 4
~~R~R~~K~~~~vK~~v~~__~~k~K~_~ ~V D~ '-V~ !~vK ~ "'~~ " " ~ " 3~~~~~ -~~ -~ ...-~-~----~-V_~ ~~~ ~~f'-.~ ~~~" w ~~~~ 2
~~- ~~~~~~~~K ~'~ , ~ ~~~ ~ '~- .....:~ - - -~ - ~f--~--~;;;:.~ ~ ...;~ - ~ -~--~- -
-- -~ '-. 1- ~ -~-~0~~-~-~f--~-~~~~ ~~r-:- f--- -~ '" ~ '" ~ ~ ~ ~ ~ ~ 0
R'Yc
o90SO7060504030"2010
o 5 2010 15OBT:oC
25
--3'1
9--3,0
S-- 2·9
-- 2·8
7__ 2.7
-- 2·66-- 2-5
5-- 2·4
--2'34-- 2·2
3-- 2·1
--2,0
2.._ 1-9
-- l·B
- 1-7
0-1'6
-- 1·5
_. 1·4
-- 1·3
-- 1-2
-- 1·1
--1·0
--()'9--().S
---()'7
---()'8
-- ()'5
---0'2
-()'1
--(),O30
7KJ~trT~ ifL~=~~l=l~ (V\~t_ m:::-g: -.,L:/1'o; ~"f--:~~KI--I ~~~HIT;I£fl\ '1" . j'..\._' <~ --os..! --~KC \ D't--J~- .... fl· 1-~"'" --==-~ _.=" II \", 15;;::--I-I-'::J,- _':ts - -- ---,,£;,: X"=' +' ""; .,:C\:,' ~N~t "':::'c .02'.4 __ '_ s.::: 1-'; l i'\ _I x::.---:: \ ~- ,- 'i -4\-- .". \ ':;,7 ~~c-~~0;::- 3~':~{oE:c\;C~l' .A"':-:ii >'1'-' _,__. -';i~-", 1'& --0'=;tVCIf~_,.o_?6:-85R __ "x' - -- ;0, --. V " " . ._ ~ +-,:0;8. - --..- - - -i ;1':' 'j-' -'- ,YS'Jii~: \',..' - .C>. . ",~ ., "j~+_. :1.3"''>- "'-J' .0-- .. 17 -- .,.
so ~ .cJ,;. :"": ",. IN ,"""<" ,fJIk'" ",C' --~i(:" --.:..~j'f'
;
/,iP. >'-s' .. "li-f--f--I\f~';',!l .• \. +' c\,l--I: .~ __.".\ . ~' . 'I~", ",,' ~,~" .C_--... -~ .. C< • "cd_ \. __,-"Ki7T'''''''oW- ..C7 - ~-±".flm
.' ,,,J _ "'.. ~" ", H ,__~ ~ ='" - "..WN:C .tl'~·., '-,l'U -7 .,,,'f--OOy '" ~,," s; . . " ,,~--N' ., "~--'if /ti.--- ~ ..' " .==;:1.'-- :"io'. \ .•:." -:7~~ _" ·t-jl '.' .' -" -- =.::1k' 75~ ,> ~," ." ..K,i< ... "-kif:. h, . " . -.
#' 1""-'" 7 . .1\.2-- <7~" . r-, . •. <'-.l t!' _~ -,lL - \ --z· -,. L'I,'''' .--i *,,:....~ ~': '.....' ,i,~.020'" ! __7'''' "''', '" .. . .. 5 ;.,,'''1 ,,"" . ""°1-_" . ~ '" __. ...• .. .. _z
,,, ,,L ..r.."" ~ .••./: ... ~ )( . . f... ,,'. . ~ .. . " , " " - >--75#' 70''' .• , .. ",~.".' '7$ .. k'" , ..+>>c • ,,' --' ,,' :~:,~,~"., > ~~" .' .. " ~' <; .. , --_S"1tio18 u,, ,.p,,'- ,-.~~' . >""' .....•. ",,' .0% .h.: . Ice;; , ,,--5' ,. k .' . ~ "--.' be.,IL'·· ,c:, ' ""'Cc~ ~ --~~"'.\ :~:. '
-",. c~ ~. ..".\/.. _," - C ~ -." . ",., ". C "w.. w(.)~"">'~ >'I''''' ,__.•..... .,." .... '''k·.>J-~''"'·C"
'" t~ " __,,,-k'" -- -- 'C." ,.;-- s - ",b - -- CO,.>t" ,,,,,, '-' "",, __',,,~;o": . ".."'7'. ':-.•. < - .:. - ..... ., "1''',,"' -- :;;!e-,.o16~-70«,f,£"" _< ",_ R~c<c, '''0< .. '" c "", ... .. -- ,,', .."\:" v .;0. ... -"'. ·5 " ffi
'"'_",,,':, v"'k ."". '-.. . -- ."7 ~-. s· ~. " ". _.. <. -- ", ,.p. ~E 1""'- _ ~ _ ~s;/I:,ciS- .7 ~ __ s:~" . . ,,~, ~ ,,~ •• ' •. o: j W" " . " .' I- . • _ ,~"." -0 ~ "/ _1\'1;>,,--./ _.. '~. ~ A. , .. L.;..··. P _ .',~'- ••,,-Ii· c, _. -: :c." L Z!i'01~' t-
-,4iclilic' ;"~""-"-",~sc "-,i?" _"c;;~~"'"-< - "~fO:c-~"~;:'~s;: ~'- '; 1~t,::~~.. ,;ci-,o &.-"" ~flt ,,,-,'"" ".. '" .. . ... o,~ ~ ,'" --~. . 'tel-- . -~;z" o,
,;~"" "fi>~ '" ce<~~%~s;..~::;J~" s --~9-c,:;'" .",:~,,~~:;,,~=";j~~<~'7~~o~I_';1~'~/4'.>-.'" " . f:': ,/,,-:: s,"';;;:" ~ts~ . cc eJ'''' ~, 0.. - ". --,- •. .s ~",," ,;,'" -",,' ".:
__ \'!~">ii. '- . ~ i!1 .I>f t., :".' 'l<.~,C~"fu"-' . '/( ".. ~k:"'; --__' <, ' ".- ~I>--:':.-. "'." ~c :..: .. ~ ,_f--"
~
5 -dfs/ ~ -- --~ ~ -~tJ.i--·RS.:I/<",o-:,::::'<;;:b:l\ic"J''''''< ..•• ""y, ."'''~''\';'''~~.-' -- ". ~'",,~. '. ".- .--.-QI .".LN" . __", r-, ,- omfort-'-'''.d>· ... ,~~."'.-" ,,' ._-" ... -,._,,"- '1'010S"'- .A'C i'< ?~",~'<j l#,,'- --5/"' >;:zo~\>';,",,-,c -s; ~. /,e~ c c,.' '-x""k F '". c :=~. ". ;t"',st<~~ ~r:: \; .~ ~.,J\'i's -l\i""~'I''-. :'"V" IS: __~. <-"~ .~ ",. ,/ ....~ - h ----,. "F:= .c
c
~'i-"" _ ,_ / .. "''' _~ <, :;c " '- h. .. '~" [CO, ••• ;o~"" . " -' c, ., s,3 "..W
ClO
". '" b__ '", • ,,-, <a, ~i!~'''".K~}' -- ,,\ '" . J>( --'-·c· " " . ",,' .... 5'- ,,' " ,"{.: \ .... ~ -" -".'"i';;. I\:",-;J> _~: >1" ~ ~ . "'~ <;""C;::. • • ...,.' c~ ~ . r-, . .- " K --~ , 5~P<'- ,,: .\ ~.,-" \ Z' ~'"sl;;- ~ "J'r;L,:, soc> .as. . .~,,"'''<''''''',._ .c ~' k ".... r-, ,~-- . ~. s ••. <-- "'-" " .--.' ". ~" \c >crr,,>. ~S',S 0 -'s' .... -s; ", ,hl . _, ".. ",. <sr- . •• s'-" '"t"" >_.. .. s . .' .,~"'" ,,~'" 01< . ~ ~" ~ ;'C·C"" , ,"' \,-- ~ s~ "c. ..~ "'- - . R ~06~1--45~,s" .. '.' ,,-~" . .. . >o"'~ ..--'" .' . " .. ",." ., ..... -- . .... .<;0"'-' _ ~ . h ",c; ",,~," -- c.,: .. "." ~ ." :.s~" "~~ s'" ..' . - 'ctsJ .~
'''OJ' . ;:. ", __C::'<" 'i5,'l ",~".". : .>-:~',~.- . <, . -'."".,..,. '$ ,,,>~~.,'r· c' .. '~ "'-~ I-~40",,0:-1,:'''''' "c.., s __. "" :\I:'-C:.! -<sO '<"",:" 1\:1T' l!\ M 'r~"-.--. . ,.-:-."h. ': X -- .. .""" . ,,; ." _.":" ,, .. s .' .'04 --ssas ., as . ", ~,~s;Ff'"N " ' ~I" .. "Il;,i'l \ "-"...:;." . . .' -,,~ .. Be",' ".,.. " ,., -- ' . . ,,"0" " " ,'" ~"\K,, ~'if"'';'' ~'N'\cJ ~' ~.. . , ~ ~\- ' ~,," " . "'; - .:,t :'.'.c --.:c"
5 70 7 ~ "'. -"l\'" '" ,ode,'l ",", ...,.,,' N 'c", f'~'" I-" ,cc~ ",,0,1.1
c zo'"' ,"_"__> '" .",,,,,," ~.l . ~ . ~'I=KDRY B os, > Ml:'Lili""'''' ~.....~. io
ULB TEM"RA TURE •• 'F eo '00'" ¥1·kl§~·L~N'.ft'f!-- 0105 110 ,l~115 120
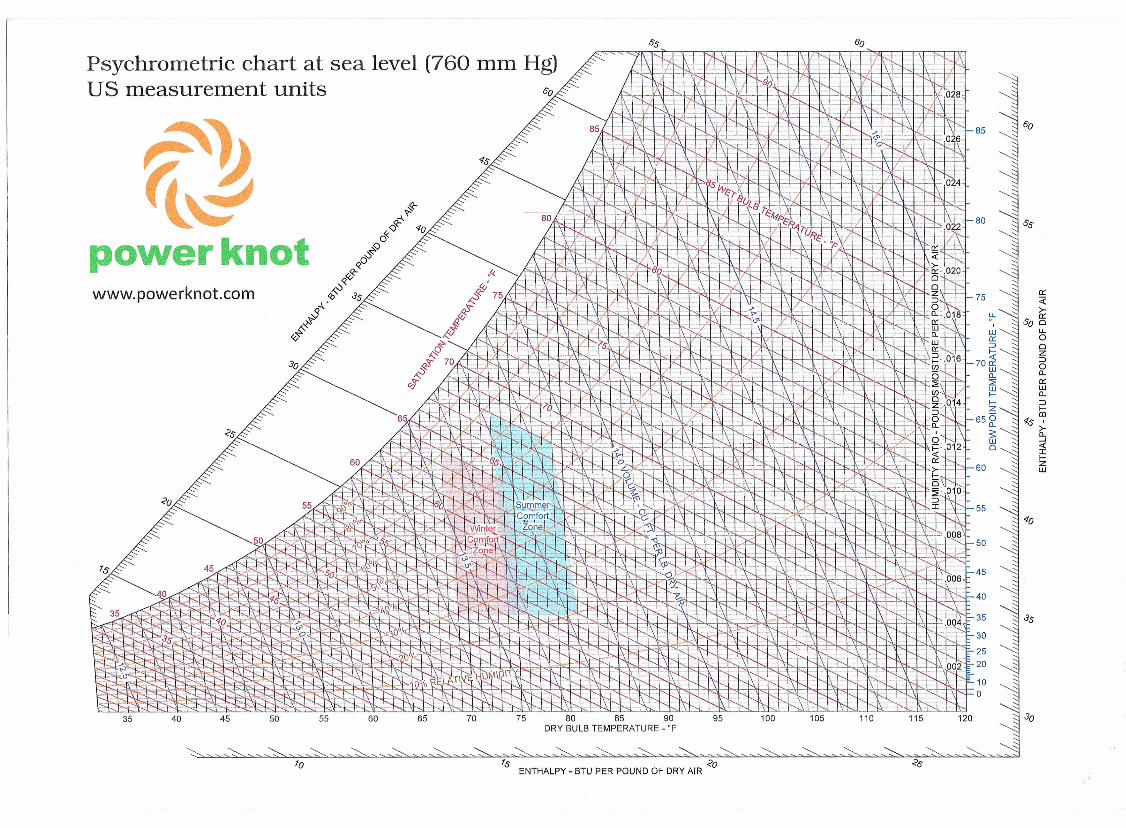
Psychrometric chart at sea level (760 mm Hg)US measurement units
~<c-i:-
!<Q <10~:,o
,0~Q.0
{v<C--0Q.
t§A' 3S
~(>,.~'?'
<v~
~1)'l~
power knotwww.powerknot.com
30
<S
<0
Ss 60
So
10
<IS
~ ~ENTHALPY - BTU PER POUND OF DRY AIR
<S
60
Ss
a::«~So CllLooz::>oa,a::wo,::>IIi
"Is >-Il.-'-cIt-ZW
<10
3S
30
~9~~
power knot
Power Knot LLC
501 Valley Way
Milpitas CA 95035
USA
About the Psychrometric ChartApplication Note 96-02001-04
+1-408-587-9333
www.powerknot.com
1 IntroductionThe psychrometric chart shows graphically the parameters relating to water moisture in air. This applica-tion note describes the purpose and use of the psychrometric chart as it affects the HVAC engineer or tech-mcian,
Air comprises approximately 78% nitrogen, 21% oxygen, and 1% other gasses. But air is never dry, evenin a desert. Two-thirds of the earth's surface is covered with water and this, along with other surface waterand rain, maintain low pressure water vapor to be suspended in the air making up part of the 1% of othergasses. The psychrometric chart indicates the properties of this water vapor through the following parame-ters, each of which is explained in more detail below:
• dry bulb temperature• wet bulb temperature (also known as saturation temperature)
• dew point temperature• relative humidity
• moisture content (also known as humidity ratio)• enthalpy (also known as total heat)• specific volume (the inverse of density)
The [mal page of this document has a psychrometric chart you can print.
Any psychrometric chart is valid at a certain pressure of air. The pressure of air is related to the heightabove (or below) sea level. The chart provided by Power Knot is valid at sea level (760 mm of Hg). Youmust make corrections for different altitudes.
If you know any two of the parameters above, you can find the other five values from the chart.
The study ofpsychrometrics and therefore the usefulness of the chart are important in the HVAC industrybecause:
• people feel comfortable over a narrow range of temperature and humidity• machines (especially electronic machines) operate over a specific range of temperature and humidity• to calculate the amount of heating or cooling required for a certain space requires knowledge of the
moisture content of the air
For an example on how the psychrometric chart is used in practice, please read Power Knot's applicationnote on measuring enthalpy to evaluate the efficiency of an air conditioning system.
Application Note 96-02001-04 Page 1 of 6
~9~~
power knot
About the Psychrometric Chart
2 Properties on the Chart
2.1 Dry bulb (DB) temperature
We measure the temperature of the air with a thermometer. Traditional thermometershave a bulb that contains a liquid that expands, and a tube indicating the tempera-ture on a scale. As the liquid expands, it rises up the scale. In the HVAC business,we use a thermocouple and electronic meter or an infrared thermometerbecause these are faster and more rugged. Whichever method is used, thismeasurement is called the dry bulb temperature because the end of thethermometer that is making the measurement has no moisture onit.
The temperature of the air is measured in OF in the USA and in °Ceverywhere else.
Sf) ~ I oor '1C"F 1(r'~
This temperature is shown as the horizontal axis of the chart.
2.2 Wet bulb (WB) temperature
The wet bulb temperature is measured by having the bulb of the thermometer moist.The moisture evaporates, lowering the temperature recorded by the thermometer.Less moisture in the air will result in a faster rate of evaporation and therefore acolder reading. In practice, we can use an electronic thermometer and wrap apaper tissue over the thermocouple. Make the paper tissue moist, but nottoo wet that water is dripping from it. Move air over the tissue (ormove the thermocouple through the air) so the water evaporates.
When the air sample is saturated with water (that is, it has 100%relative humidity), no water can evaporate from the moist tissue sothe WB temperature will read the same as the DB temperature.This temperature is therefore also referred to as the saturation temperature.
This temperature is indicated by diagonal lines on the chart.
2.3 Relative humidity (RH)
This is the ratio of the fraction of water vapor in the air to the fraction of saturatedmoist air at the same temperature and pressure. RH is dimensionless, and isusually expressed as a percentage. 100% RH indicates the air is saturated andcannot hold any more moisture. Preferred values of comfort for people arebetween 35% and 60%.
Lines of constant relative humidity are shown as exponential lineson the psychrometric chart. The line at 100% is referred to as thesaturation line. Relative humidity
Application Note 96-02001-04 Page 2 of6
~);ft~power knot
About the Psychrometric Chart
2.4 Dew point (DP) temperature
This is the temperature of the air at which a moist air sample reaches water vaporsaturation. It is equivalent to a wet bulb temperature at 100% relative humidity.At this combination of temperature and humidity, further removal of heatresults in water vapor condensing into liquid.
A practical view of the dew point is the temperature to which air mustbe cooled before condensation will begin. An example is when youtake a bottle of beer out of the refrigerator. Water condenseson the outside of the bottle only if the original temperature ofthe bottle was below the dew point. The instantaneous tem-perature of the water is the dew point temperature.
<lJ•...;:,
1-----~180°F+-'c.
/-------170"r: c:a.1...,-----160 F '2
~-------------I~~"F~- ----- '-f. v , <:
c
As a sample of air is cooled, its RH climbs until it reaches 100% RH (saturated air). This is the dew pointtemperature. At saturation, the dew point temperature equals the wet bulb temperature, which also equalsthe dry bulb temperature, and the RH is 100%.
This temperature is shown as horizontal lines on the chart.
2.5 Moisture content
This is also known as the humidity ratio and is usually designated as W. It isthe proportion of the mass of water vapor per unit mass of dry air. Humid-ity ratio is dimensionless, but in the US it is usually expressed aspounds of moisture per pound of dry air; elsewhere it may beexpressed as grams of water per kilogram of dry air or as apercentage.'
The moisture content is the vertical axis of the chart.
1-----10.022 ...,c
------10.0.8 ;Sc:
------10.014 ~
-------IO.O.(} ==...,V'
~---------10.006 'c___________ 1" )02:2:
2.6 Enthalpy (total heat)
Enthalpy (usually designated as h) is the total amount of heat energy ofthe moistair and therefore includes the amount of heat of the dry air and the water vaporin the air. In the approximation of ideal gases, lines of constant enthalpy areparallel to lines of constant WB temperature. Thus the enthalpy is indi-cated by diagonal lines on the chart.2
In the US, enthalpy is measured in BTU per pound of dry air;elsewhere it is measured in Joules per kilogram of air.
1. In the US, it may also be expressed as grains of water per pound of air where 7000 grains equa11 pound.
2. In practice there is a very slight difference between the lines of constant WE temperature and lines of constant enthalpy thatcan usually be ignored.
Application Note 96-02001-04 Page 3 of6
~9ft~power knot
About the Psychrometric Chart
2.7 Specific volume
This is the inverse of density. Specific volume is therefore the volume per unit massof the air sample. This is shown as diagonal lines on the chart.
In the US, this is measured by cubic feet per pound of dry air; elsewhere it ismeasured by cubic meters per kilogram of dry air.
2.8 Comfort zones
People feel comfortable within a small range of temperatures andhumidities. The ranges vary based on where you live and on the time ofyear. In the northern hemisphere, people typically wear more clothes in winterthan in summer. Therefore, rooms are maintained at cooler temperatures in winter than in summer.
37~C .,~'C'I---------------------------------------~~35'C +-----------------------;;'«--"34'C 1---------------------/33'c.l-1 --32'C - 40% relative humidity -------------r'-----,,-"'----;;.£-
o 3"C _, __ - 50% relative humidity -----------.,L'---7L---=-"'---Z W'C - 60% relative humidity --------r<--,r"'---::",..-"'------~ 2$'C l,----------------------".L 7~~----E 28~C +-I--------------~_s_~=-----227C~--------------~~~~------------~ 26'C ,---------------=:::<7""'--"0 25~C ,----------="''''7-'''-------------~ 24'Ct-~ -------:'=""rs.-~------------------,c, 23'C ~l-------:?':~:;7"'=----------------------
22'C +-i ----=.-<?.-s.,.L::--------------------2"Cl..---~"'=~"----------------------------20'C -c:.~=--------------------------19'C""'--------------------------------18'C -----,-----------------17'C';"'!-~--~---'
Specific volume
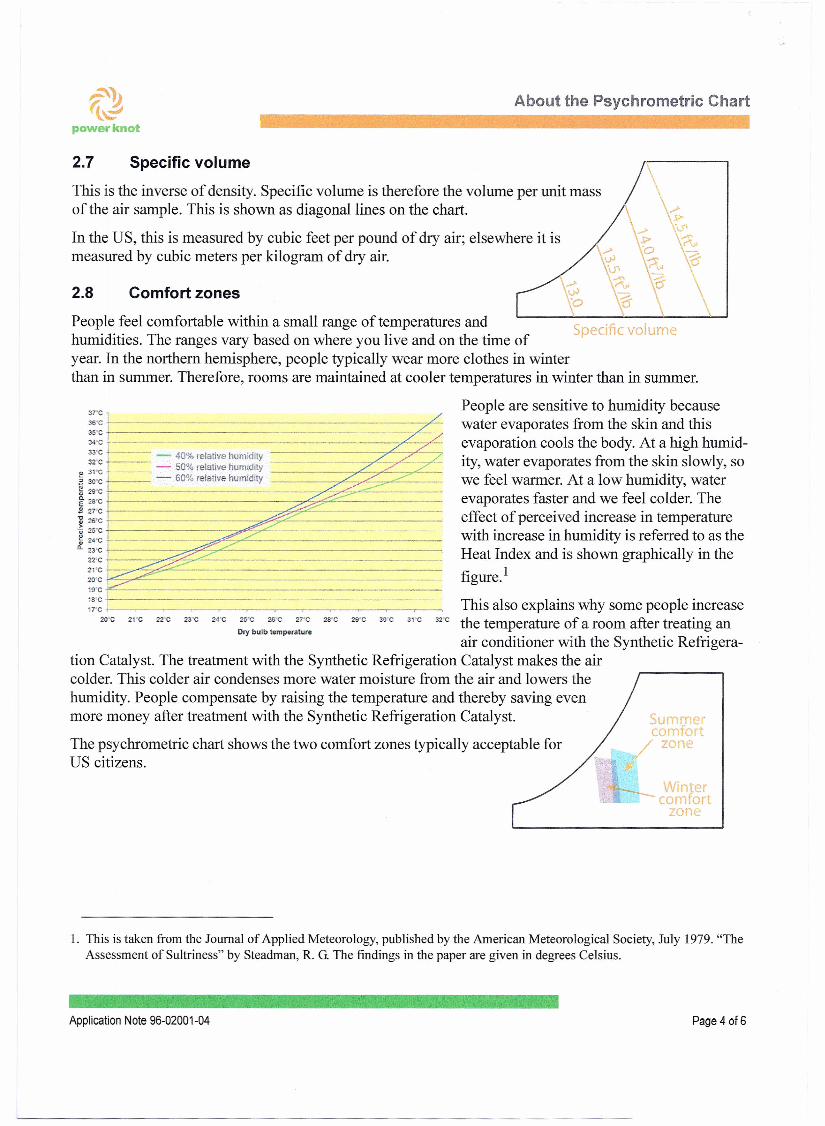
People are sensitive to humidity becausewater evaporates from the skin and thisevaporation cools the body. At a high humid-ity, water evaporates from the skin slowly, sowe feel warmer. At a low humidity, waterevaporates faster and we feel colder. Theeffect of perceived increase in temperaturewith increase in humidity is referred to as theHeat Index and is shown graphically in thefigure. 1
Summerco-nfer
/ zone
Wintercomfort
~o'l(
1. This is taken from the Journal of Applied Meteorology, published by the American Meteorological Society, July 1979. "TheAssessment of Sultriness" by Steadman, R. G. The fmdings in the paper are given in degrees Celsius.
This also explains why some people increase20 C 2"C zz-c 23'C 24'C 2S'C 26'C 27'C 2"C 29'C 3U'C 31'c 32'C the temperature of a room after treating an
Dry bulb temperature
air conditioner with the Synthetic Refrigera-tion Catalyst. The treatment with the Synthetic Refrigeration Catalyst makes the aircolder. This colder air condenses more water moisture from the air and lowers thehumidity. People compensate by raising the temperature and thereby saving evenmore money after treatment with the Synthetic Refrigeration Catalyst.
The psychrometric chart shows the two comfort zones typically acceptable forUS citizens.
Application Note 96-02001-04 Page 4 of6
~1I(l~
power knot
About the Psychrometric Chart
3 Plotting on the psychrometric chart
3.1 Sensible and latent heating and cooling
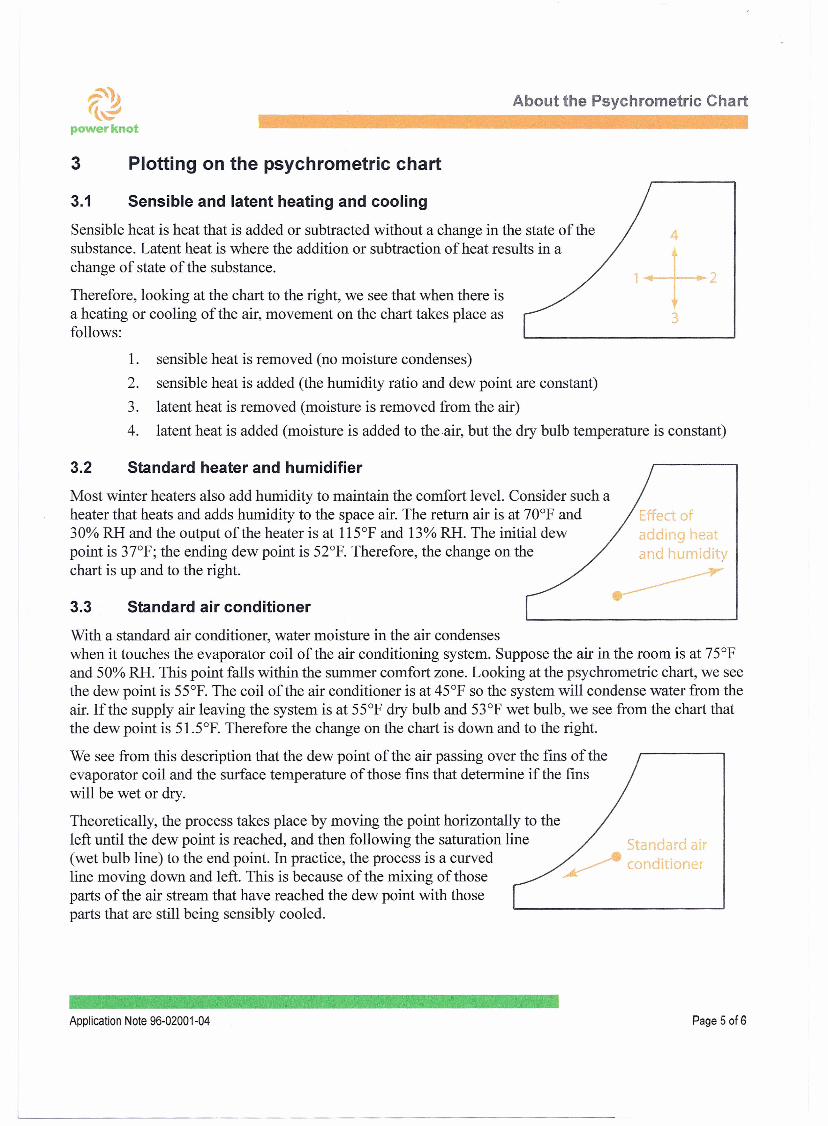
Sensible heat is heat that is added or subtracted without a change in the state of thesubstance. Latent heat is where the addition or subtraction of heat results in achange of state of the substance.
Therefore, looking at the chart to the right, we see that when there isa heating or cooling of the air, movement on the chart takes place asfollows:
4
1. sensible heat is removed (no moisture condenses)2. sensible heat is added (the humidity ratio and dew point are constant)3. latent heat is removed (moisture is removed from the air)4. latent heat is added (moisture is added to the air, but the dry bulb temperature is constant)
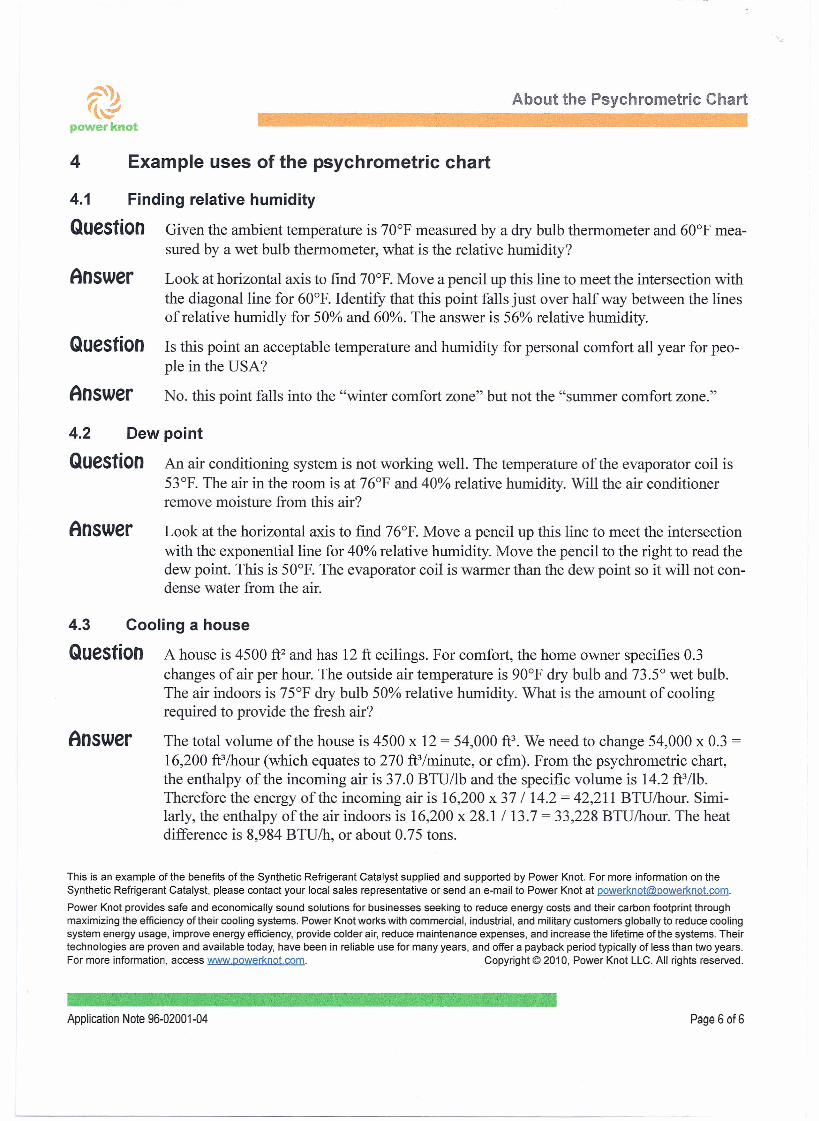
3.2 Standard heater and humidifier
Most winter heaters also add humidity to maintain the comfort level. Consider such aheater that heats and adds humidity to the space air. The return air is at 70°F and30% RH and the output of the heater is at 115°F and 13% RH. The initial dewpoint is 37°F; the ending dew point is 52°F. Therefore, the change on thechart is up and to the right.
Effect ofjdlng heat
and humidity
~3.3 Standard air conditioner
With a standard air conditioner, water moisture in the air condenseswhen it touches the evaporator coil of the air conditioning system. Suppose the air in the room is at 75°Fand 50% RH. This point falls within the summer comfort zone. Looking at the psychrometric chart, we seethe dew point is 55°F. The coil of the air conditioner is at 45°F so the system will condense water from theair. Ifthe supply air leaving the system is at 55°F dry bulb and 53°F wet bulb, we see from the chart thatthe dew point is 51.5°F. Therefore the change on the chart is down and to the right.
We see from this description that the dew point of the air passing over the fms of theevaporator coil and the surface temperature of those fins that determine if the finswill be wet or dry.
Theoretically, the process takes place by moving the point horizontally to theleft until the dew point is reached, and then following the saturation line(wet bulb line) to the end point. In practice, the process is a curvedline moving down and left. This is because of the mixing of thoseparts of the air stream that have reached the dew point with thoseparts that are still being sensibly cooled.
Application Note 96-02001-04 Page 50f6
~9ft~power knot
About the Psychrometric Chart
4 Example uses of the psychrometric chart
4.1
QuestionFinding relative humidity
Given the ambient temperature is 70°F measured by a dry bulb thermometer and 60°F mea-sured by a wet bulb thermometer, what is the relative humidity?
Answer Look at horizontal axis to fmd 70°F. Move a pencil up this line to meet the intersection withthe diagonal line for 60°F. Identify that this point falls just over half way between the linesof relative humidly for 50% and 60%. The answer is 56% relative humidity.
Question Is this point an acceptable temperature and humidity for personal comfort all year for peo-ple in the USA?
Answer No. this point falls into the "winter comfort zone" but not the "summer comfort zone."
4.2Question
Answer
4.3
Question
Answer
Dew point
An air conditioning system is not working well. The temperature of the evaporator coil is53°F. The air in the room is at 76°F and 40% relative humidity. Will the air conditionerremove moisture from this air?
Look at the horizontal axis to find 76°F. Move a pencil up this line to meet the intersectionwith the exponential line for 40% relative humidity. Move the pencil to the right to read thedew point. This is 50°F. The evaporator coil is warmer than the dew point so it will not con-dense water from the air.
Cooling a house
A house is 4500 ft2 and has 12 ft ceilings. For comfort, the home owner specifies 0.3changes of air per hour. The outside air temperature is 90°F dry bulb and 73.5° wet bulb.The air indoors is 75°F dry bulb 50% relative humidity. What is the amount of coolingrequired to provide the fresh air?
The total volume of the house is 4500 x 12 = 54,000 ft3. We need to change 54,000 x 0.3 =16,200 ft3/hour (which equates to 270 ft3/minute, or cfm). From the psychrometric chart,the enthalpy of the incoming air is 37.0 BTU/lb and the specific volume is 14.2 ft3/1b.Therefore the energy of the incoming air is 16,200 x 37 114.2 = 42,211 BTUlhour. Simi-larly, the enthalpy of the air indoors is 16,200 x 28.1 113.7 = 33,228 BTUlhour. The heatdifference is 8,984 BTUIh, or about 0.75 tons.
This is an example of the benefits of the Synthetic Refrigerant Catalyst supplied and supported by Power Knot. For more information on theSynthetic Refrigerant Catalyst, please contact your local sales representative or send an e-mail [email protected].
Power Knot provides safe and economically sound solutions for businesses seeking to reduce energy costs and their carbon footprint throughmaximizing the efficiency of their cooling systems. Power Knot works with commercial, industrial, and military customers globally to reduce coolingsystem energy usage, improve energy efficiency, provide colder air, reduce maintenance expenses, and increase the lifetime ofthe systems. Theirtechnologies are proven and available today, have been in reliable use for many years, and offer a payback period typically of less than two years.For more information, access www.powerknot.com. Copyright © 2010, Power Knot LLC. All rights reserved.
Page 6 of6Application Note 96-02001-04