fifteenth annual learning and teaching · pdf filefifteenth annual learning and teaching...
TRANSCRIPT

Networks Issue 18, February 2015 1
Fifteenth Annual Learning and Teaching Conference
July 1, 2014
ENGAGE — Sharing and Engaging Others in Good Practice to Enhance
Learning, Teaching and Assessment
Contents
Peer-Reviewed Papers on Conference Themes
The All Round Cyber Crime and Security Professional: Circular Teaching for the Professional and the Technical – Experiences from the Witness Box 3
Adrian Winckles and Andrew Moore
Achievement and Criminology Engagement (ACE) 11
Colleen Moore, Elle Roberts, Rosie Rawson and Dr Samantha Lundrigan
An Evaluation of Videos used to Support Clinical Skills Teaching for Pre-registration Student Nurses 19
Siân Shaw, Judie Knowles, Rachel May and Richard Shaw
Factors Influencing Student Attendance and Engagement 31
Samantha Daniels, Adeline Houghton, Kimberley Pilgrim, Mark Warnes and Dr Jaki Lilly
2 Networks Issue 18, February 2015
Anglia Ruskin Funded Learning and Teaching Project Reports, 2014
Pictures from the Conference 52
Evaluating the use of a Mid-semester Survey to gather Feedback from Students 55
Barbara Vohmann, Dr Julian Priddle, Pauline Start, Mark Tree and Debbie Philipson
‘It only feels real when it is real for you’: Setting up a Lived Experience Group for Developing Teaching in Mental Health and Long Term Health Conditions 65
Dr Fiona Ashworth, Dr Poul Rohleder and Dr Jane Aspell
Setting Competency Standards in Optometry for Ocular Disease Module 75
Dr Matilda Biba and Dr John Siderov
Guest Paper
Haven't a Clue: Guiding Undergraduates through a Literature Review 81
Dr Julie Teatheredge and Mark Miller
Networks Issue 18, February 2015 3
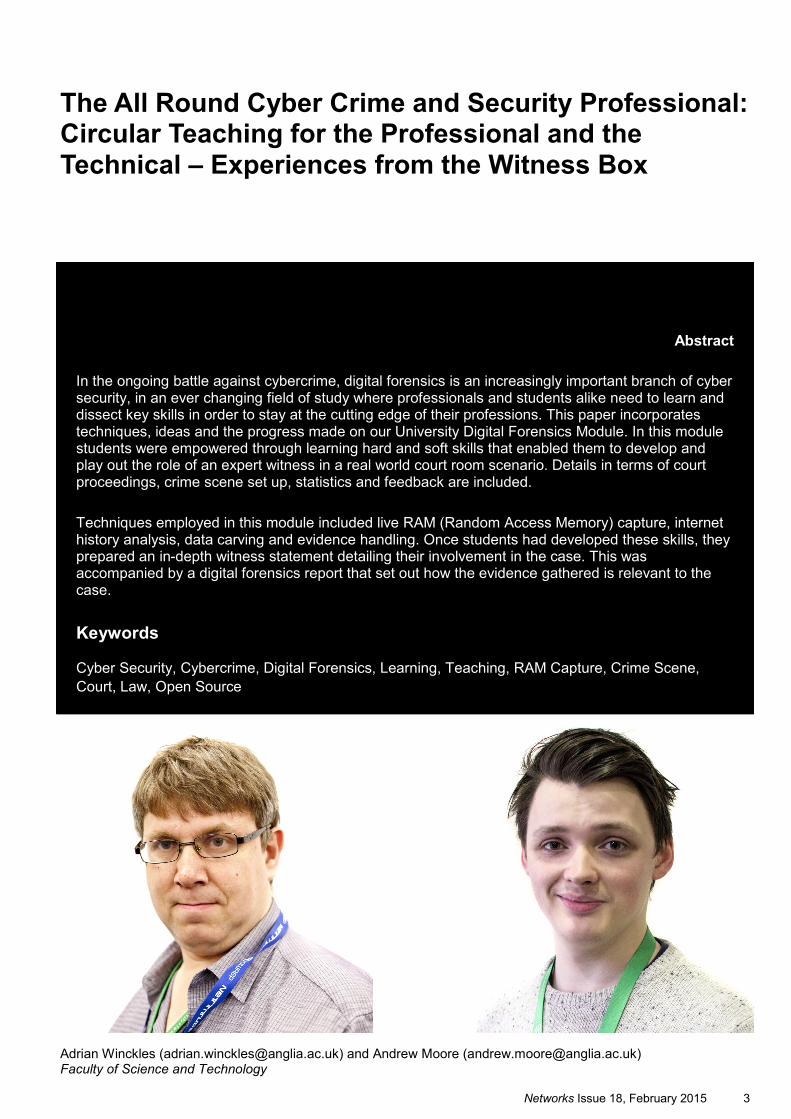
The All Round Cyber Crime and Security Professional: Circular Teaching for the Professional and the Technical – Experiences from the Witness Box
Adrian Winckles ([email protected]) and Andrew Moore ([email protected]) Faculty of Science and Technology
Abstract
In the ongoing battle against cybercrime, digital forensics is an increasingly important branch of cyber security, in an ever changing field of study where professionals and students alike need to learn and dissect key skills in order to stay at the cutting edge of their professions. This paper incorporates techniques, ideas and the progress made on our University Digital Forensics Module. In this module students were empowered through learning hard and soft skills that enabled them to develop and play out the role of an expert witness in a real world court room scenario. Details in terms of court proceedings, crime scene set up, statistics and feedback are included.
Techniques employed in this module included live RAM (Random Access Memory) capture, internet history analysis, data carving and evidence handling. Once students had developed these skills, they prepared an in-depth witness statement detailing their involvement in the case. This was accompanied by a digital forensics report that set out how the evidence gathered is relevant to the case.
Keywords
Cyber Security, Cybercrime, Digital Forensics, Learning, Teaching, RAM Capture, Crime Scene,
Court, Law, Open Source
4 Networks Issue 18, February 2015
Introduction
In these challenging times of increasing data and security breaches, our cyber security professionals require hard technical skills. To meet the rapidly increasing complexity of cyber conflict this must be combined with the softer but no less essential skills of forensically sound data recovery (Lessing & Von Solms, 2008), the ability to summarise the data in layman’s terms, and the ability to withstand the scrutiny that their findings will be subjected to in various legal contexts.
On our Security and Forensic courses we have developed a successful combination of these hard and soft skills. Forensic and IT Security students were provided with a relevant crime scene scenario including live memory capture and seizure of digital evidence. This involved both promoting discussion on contamination of evidence, such as the Association of Chief Police Officers (ACPO) / National Institute of Standards and Technology (NIST) digital evidence guidelines, and conventional evidence gathering (Reith et al., 2002) at the custom built crime scene.
In addition, students were prepared for forensic handling and analysing of the evidence with specific emphasis on report writing and summarisation skills. The ultimate goal was for the students to write an independent witness evidence report based on the forensic analysis of the evidence found. The final challenge for the students was a court appearance as an expert witness, where their expert witness report had to be justified and stand up to scrutiny under cross examination by both the prosecution and defence.
An authentic court room experience was achieved by using a combination of retired judges, retired magistrates, ex-police officers and current law students. Students reinforced the success of this approach by reflecting on the experience this module brings to a well-rounded cyber professional.
Objectives and Learning Outcomes
To provide a student with a comprehensive learning experience the following objectives needed to be met:
Authentic court room and crime scene simulations to provide a professional, real world feel
The use of professionals with real court room expertise
The use of forensically sound tools (open source and corporate) to ensure that forensic examination could be carried out and verified
The briefing of students on the Chain of Custody to enable them to demonstrate in court that evidence handling procedures have been followed
The briefing of students that they are trainee digital forensic experts and should only comment on evidence pertaining to their area of expertise
To ensure that during the court scenario the students are cross examined by a defence and prosecution who have a wide variety of experiences in law
To ensure compliance with University ethics and health and safely policies
To ensure that the module would be marked fairly and without bias
Curriculum and Learning
The curriculum was based on a combination of ACPO/NIST guidelines and higher level learning modules (Craiger et al., 2007). The module spanned 12 weeks during which students learnt the various methods and approaches to follow when it came to seizing and handling evidence from a potential crime scene. The module was split into two parts. During Weeks 1-6 students prepared for seizing evidence and acquiring it scientifically. Once the students had acquired and transported their evidence from the simulated crime scene, the remaining weeks gave them time to analyse the hardware and to find the evidence. Students then had to present the evidence in court in a professional format, clearly highlighting the scientific evidence but also presenting it in such a way that laymen, such as a jury, could grasp. The court scenario required them to submit an evidence report, a witness statement of evidence found and where they had found it.
Networks Issue 18, February 2015 5
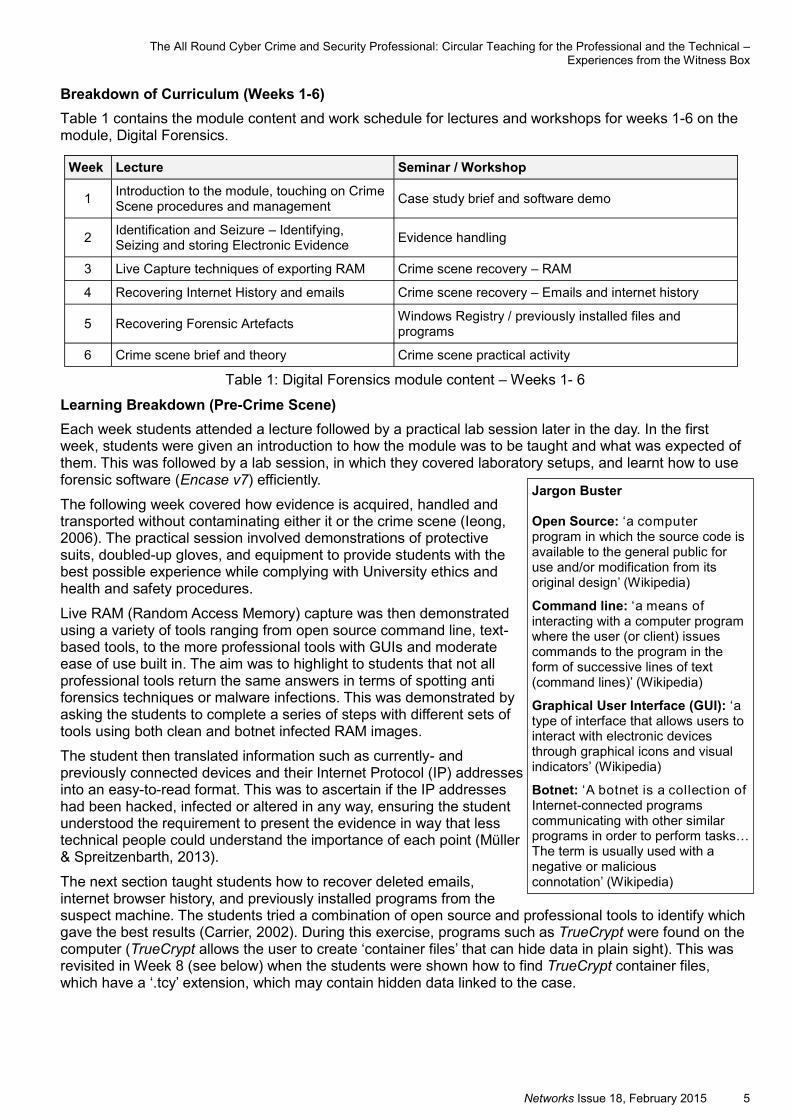
Breakdown of Curriculum (Weeks 1-6)
Table 1 contains the module content and work schedule for lectures and workshops for weeks 1-6 on the module, Digital Forensics.
Table 1: Digital Forensics module content – Weeks 1- 6
Learning Breakdown (Pre-Crime Scene)
Each week students attended a lecture followed by a practical lab session later in the day. In the first week, students were given an introduction to how the module was to be taught and what was expected of them. This was followed by a lab session, in which they covered laboratory setups, and learnt how to use forensic software (Encase v7) efficiently.
The following week covered how evidence is acquired, handled and transported without contaminating either it or the crime scene (Ieong, 2006). The practical session involved demonstrations of protective suits, doubled-up gloves, and equipment to provide students with the best possible experience while complying with University ethics and health and safety procedures.
Live RAM (Random Access Memory) capture was then demonstrated using a variety of tools ranging from open source command line, text-based tools, to the more professional tools with GUIs and moderate ease of use built in. The aim was to highlight to students that not all professional tools return the same answers in terms of spotting anti forensics techniques or malware infections. This was demonstrated by asking the students to complete a series of steps with different sets of tools using both clean and botnet infected RAM images.
The student then translated information such as currently- and previously connected devices and their Internet Protocol (IP) addresses into an easy-to-read format. This was to ascertain if the IP addresses had been hacked, infected or altered in any way, ensuring the student understood the requirement to present the evidence in way that less technical people could understand the importance of each point (Müller & Spreitzenbarth, 2013).
The next section taught students how to recover deleted emails, internet browser history, and previously installed programs from the suspect machine. The students tried a combination of open source and professional tools to identify which gave the best results (Carrier, 2002). During this exercise, programs such as TrueCrypt were found on the computer (TrueCrypt allows the user to create ‘container files’ that can hide data in plain sight). This was revisited in Week 8 (see below) when the students were shown how to find TrueCrypt container files, which have a ‘.tcy’ extension, which may contain hidden data linked to the case.
Week Lecture Seminar / Workshop
1 Introduction to the module, touching on Crime Scene procedures and management
Case study brief and software demo
2 Identification and Seizure – Identifying, Seizing and storing Electronic Evidence
Evidence handling
3 Live Capture techniques of exporting RAM Crime scene recovery – RAM
4 Recovering Internet History and emails Crime scene recovery – Emails and internet history
5 Recovering Forensic Artefacts Windows Registry / previously installed files and programs
6 Crime scene brief and theory Crime scene practical activity
The All Round Cyber Crime and Security Professional: Circular Teaching for the Professional and the Technical – Experiences from the Witness Box
Jargon Buster Open Source: ‘a computer program in which the source code is available to the general public for use and/or modification from its original design’ (Wikipedia)
Command line: ‘a means of interacting with a computer program where the user (or client) issues commands to the program in the form of successive lines of text (command lines)’ (Wikipedia)
Graphical User Interface (GUI): ‘a type of interface that allows users to interact with electronic devices through graphical icons and visual indicators’ (Wikipedia)
Botnet: ‘A botnet is a collection of Internet-connected programs communicating with other similar programs in order to perform tasks… The term is usually used with a negative or malicious connotation’ (Wikipedia)
6 Networks Issue 18, February 2015
Learning Breakdown (Crime Scene)
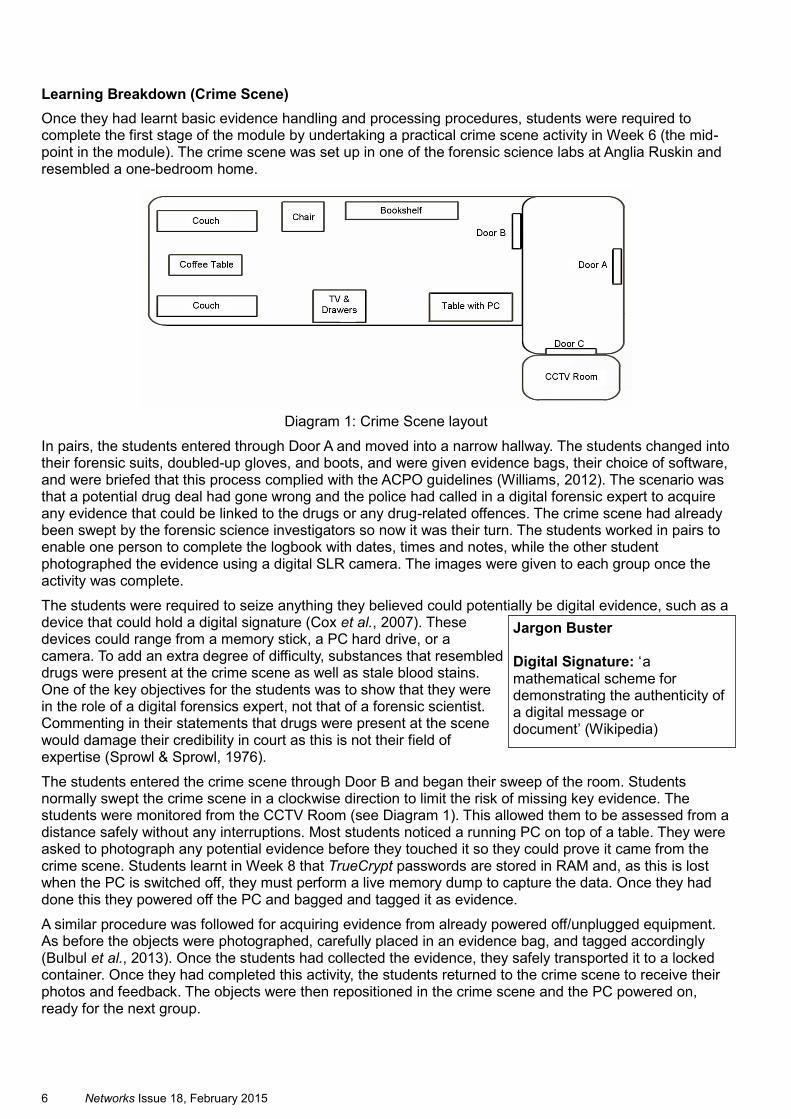
Once they had learnt basic evidence handling and processing procedures, students were required to complete the first stage of the module by undertaking a practical crime scene activity in Week 6 (the mid-point in the module). The crime scene was set up in one of the forensic science labs at Anglia Ruskin and resembled a one-bedroom home.
Diagram 1: Crime Scene layout
In pairs, the students entered through Door A and moved into a narrow hallway. The students changed into their forensic suits, doubled-up gloves, and boots, and were given evidence bags, their choice of software, and were briefed that this process complied with the ACPO guidelines (Williams, 2012). The scenario was that a potential drug deal had gone wrong and the police had called in a digital forensic expert to acquire any evidence that could be linked to the drugs or any drug-related offences. The crime scene had already been swept by the forensic science investigators so now it was their turn. The students worked in pairs to enable one person to complete the logbook with dates, times and notes, while the other student photographed the evidence using a digital SLR camera. The images were given to each group once the activity was complete.
The students were required to seize anything they believed could potentially be digital evidence, such as a device that could hold a digital signature (Cox et al., 2007). These devices could range from a memory stick, a PC hard drive, or a camera. To add an extra degree of difficulty, substances that resembled drugs were present at the crime scene as well as stale blood stains. One of the key objectives for the students was to show that they were in the role of a digital forensics expert, not that of a forensic scientist. Commenting in their statements that drugs were present at the scene would damage their credibility in court as this is not their field of expertise (Sprowl & Sprowl, 1976).
The students entered the crime scene through Door B and began their sweep of the room. Students normally swept the crime scene in a clockwise direction to limit the risk of missing key evidence. The students were monitored from the CCTV Room (see Diagram 1). This allowed them to be assessed from a distance safely without any interruptions. Most students noticed a running PC on top of a table. They were asked to photograph any potential evidence before they touched it so they could prove it came from the crime scene. Students learnt in Week 8 that TrueCrypt passwords are stored in RAM and, as this is lost when the PC is switched off, they must perform a live memory dump to capture the data. Once they had done this they powered off the PC and bagged and tagged it as evidence.
A similar procedure was followed for acquiring evidence from already powered off/unplugged equipment. As before the objects were photographed, carefully placed in an evidence bag, and tagged accordingly (Bulbul et al., 2013). Once the students had collected the evidence, they safely transported it to a locked container. Once they had completed this activity, the students returned to the crime scene to receive their photos and feedback. The objects were then repositioned in the crime scene and the PC powered on, ready for the next group.
Jargon Buster Digital Signature: ‘a mathematical scheme for demonstrating the authenticity of a digital message or document’ (Wikipedia)
Networks Issue 18, February 2015 7
Breakdown of Curriculum (Weeks 7-12)
Table 2 contains the student curriculum guidelines and work schedule for lectures and workshops for Weeks 7-12.
Table 2: Digital forensic student curriculum Weeks 7-12
Learning Breakdown (Court Room Preparation)
Having completed the crime scene activity the students spent the remaining weeks preparing for the court room scenario. Week 7 started with a tutorial on how to write an expert witness report. Students were given the template used by Cambridgeshire Constabulary and other law enforcement agencies (Bates, 2013). The students were also given a guest lecture on statement writing and court room etiquette by a lecturer from the Law department at Anglia Ruskin. Students also revised what they learnt in Week 1 as they were required to provide an Encase report with their witness statement to detail the breakdown of potential digital evidence found.
In Week 8 the students learnt how to the find TrueCrypt files using open source software. As noted above, TrueCrypt is encryption software that allows the user to hide their data in plain sight, cloaked as another file. Students were taught how to locate the hidden TrueCrypt file using software tools such as TC-Hunt and TC-Head. Once they had found the file, the student completed their RAM analysis to extract the container’s password from the running memory (Miao, 2010). The password was then used to open the suspect’s TrueCrypt file, thus enabling the student to present more robust evidence for the case in court. As described above, students had taken a memory dump of the RAM on the suspect’s PC. They were able to extract the TrueCrypt password from this and use it to open the encrypted file.
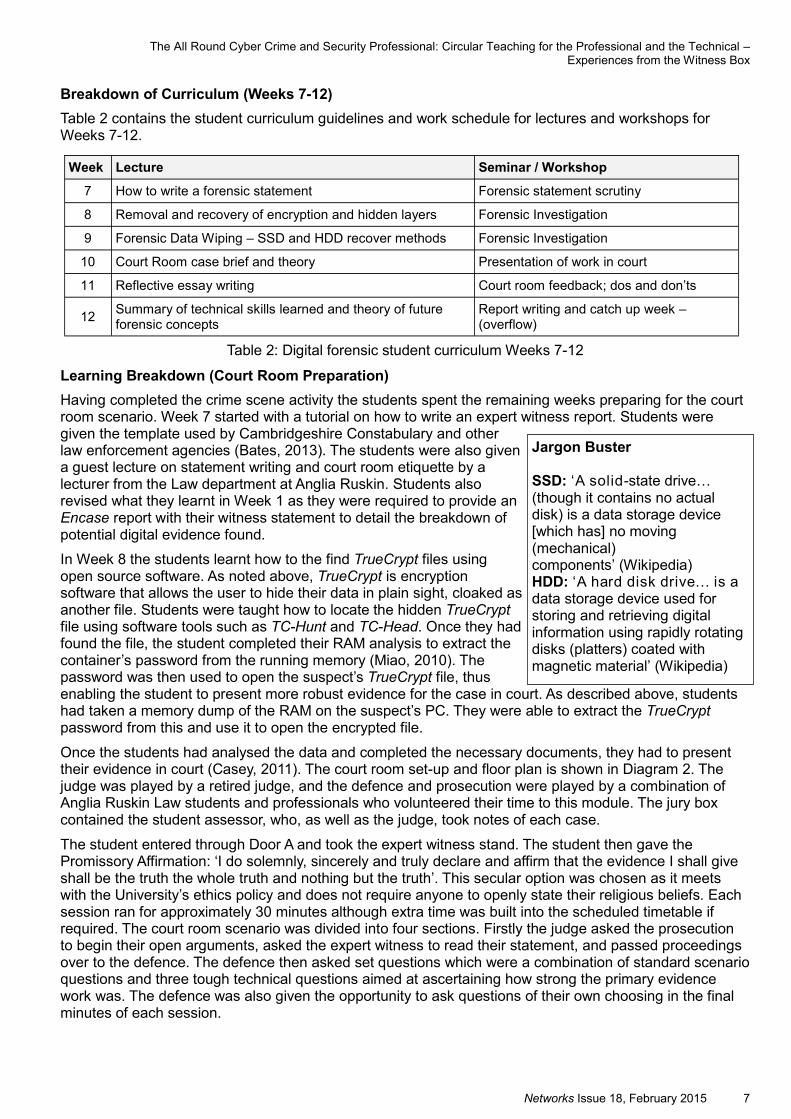
Once the students had analysed the data and completed the necessary documents, they had to present their evidence in court (Casey, 2011). The court room set-up and floor plan is shown in Diagram 2. The judge was played by a retired judge, and the defence and prosecution were played by a combination of Anglia Ruskin Law students and professionals who volunteered their time to this module. The jury box contained the student assessor, who, as well as the judge, took notes of each case.
The student entered through Door A and took the expert witness stand. The student then gave the Promissory Affirmation: ‘I do solemnly, sincerely and truly declare and affirm that the evidence I shall give shall be the truth the whole truth and nothing but the truth’. This secular option was chosen as it meets with the University’s ethics policy and does not require anyone to openly state their religious beliefs. Each session ran for approximately 30 minutes although extra time was built into the scheduled timetable if required. The court room scenario was divided into four sections. Firstly the judge asked the prosecution to begin their open arguments, asked the expert witness to read their statement, and passed proceedings over to the defence. The defence then asked set questions which were a combination of standard scenario questions and three tough technical questions aimed at ascertaining how strong the primary evidence work was. The defence was also given the opportunity to ask questions of their own choosing in the final minutes of each session.
Week Lecture Seminar / Workshop
7 How to write a forensic statement Forensic statement scrutiny
8 Removal and recovery of encryption and hidden layers Forensic Investigation
9 Forensic Data Wiping – SSD and HDD recover methods Forensic Investigation
10 Court Room case brief and theory Presentation of work in court
11 Reflective essay writing Court room feedback; dos and don’ts
12 Summary of technical skills learned and theory of future forensic concepts
Report writing and catch up week – (overflow)
The All Round Cyber Crime and Security Professional: Circular Teaching for the Professional and the Technical – Experiences from the Witness Box
Jargon Buster SSD: ‘A solid-state drive…(though it contains no actual disk) is a data storage device [which has] no moving (mechanical) components’ (Wikipedia) HDD: ‘A hard disk drive… is a data storage device used for storing and retrieving digital information using rapidly rotating disks (platters) coated with magnetic material’ (Wikipedia)
8 Networks Issue 18, February 2015
Diagram 2: Court Room layout
Once the defence had completed their cross examination, the prosecution was allowed to ask a few more questions. Finally the judge and assessor had the opportunity to ask the student questions, and, when all questioning was finished, the session closed.
Statistics and Feedback
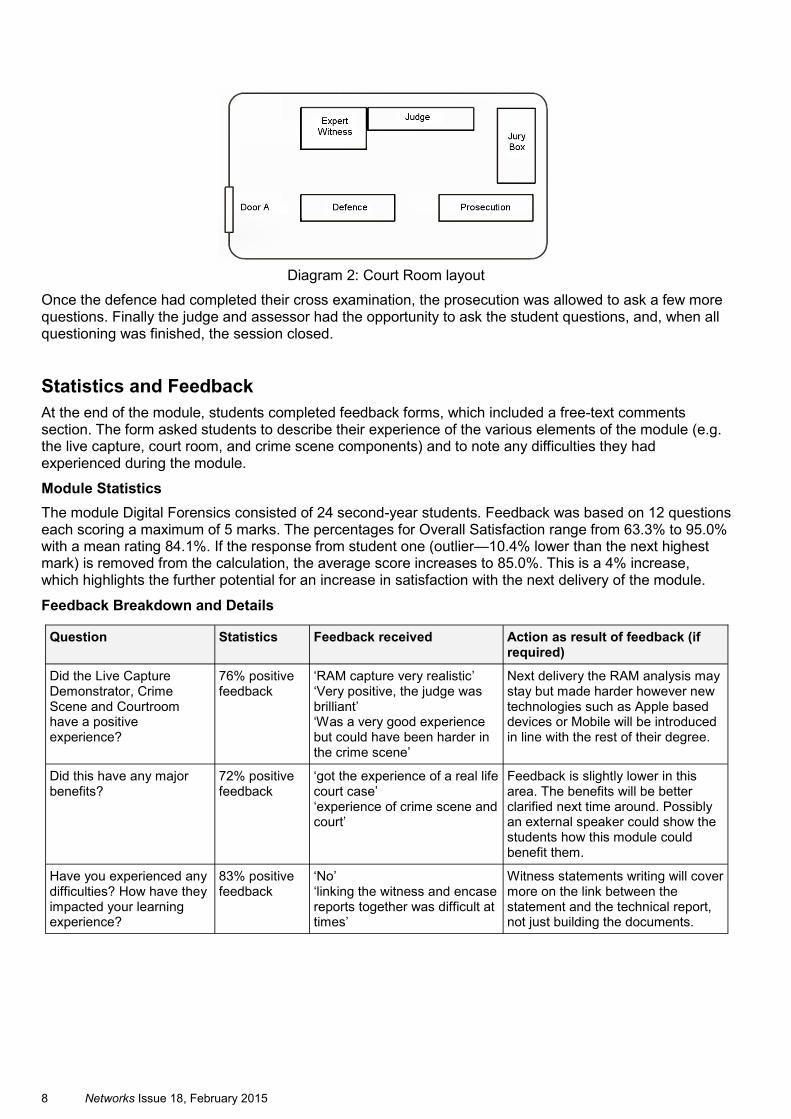
At the end of the module, students completed feedback forms, which included a free-text comments section. The form asked students to describe their experience of the various elements of the module (e.g. the live capture, court room, and crime scene components) and to note any difficulties they had experienced during the module.
Module Statistics
The module Digital Forensics consisted of 24 second-year students. Feedback was based on 12 questions each scoring a maximum of 5 marks. The percentages for Overall Satisfaction range from 63.3% to 95.0% with a mean rating 84.1%. If the response from student one (outlier—10.4% lower than the next highest mark) is removed from the calculation, the average score increases to 85.0%. This is a 4% increase, which highlights the further potential for an increase in satisfaction with the next delivery of the module.
Feedback Breakdown and Details
Question Statistics Feedback received Action as result of feedback (if required)
Did the Live Capture Demonstrator, Crime Scene and Courtroom have a positive experience?
76% positive feedback
‘RAM capture very realistic’ ‘Very positive, the judge was brilliant’ ‘Was a very good experience but could have been harder in the crime scene’
Next delivery the RAM analysis may stay but made harder however new technologies such as Apple based devices or Mobile will be introduced in line with the rest of their degree.
Did this have any major benefits?
72% positive feedback
‘got the experience of a real life court case’ ‘experience of crime scene and court’
Feedback is slightly lower in this area. The benefits will be better clarified next time around. Possibly an external speaker could show the students how this module could benefit them.
Have you experienced any difficulties? How have they impacted your learning experience?
83% positive feedback
‘No’ ‘linking the witness and encase reports together was difficult at times’
Witness statements writing will cover more on the link between the statement and the technical report, not just building the documents.
Networks Issue 18, February 2015 9
The All Round Cyber Crime and Security Professional: Circular Teaching for the Professional and the Technical – Experiences from the Witness Box
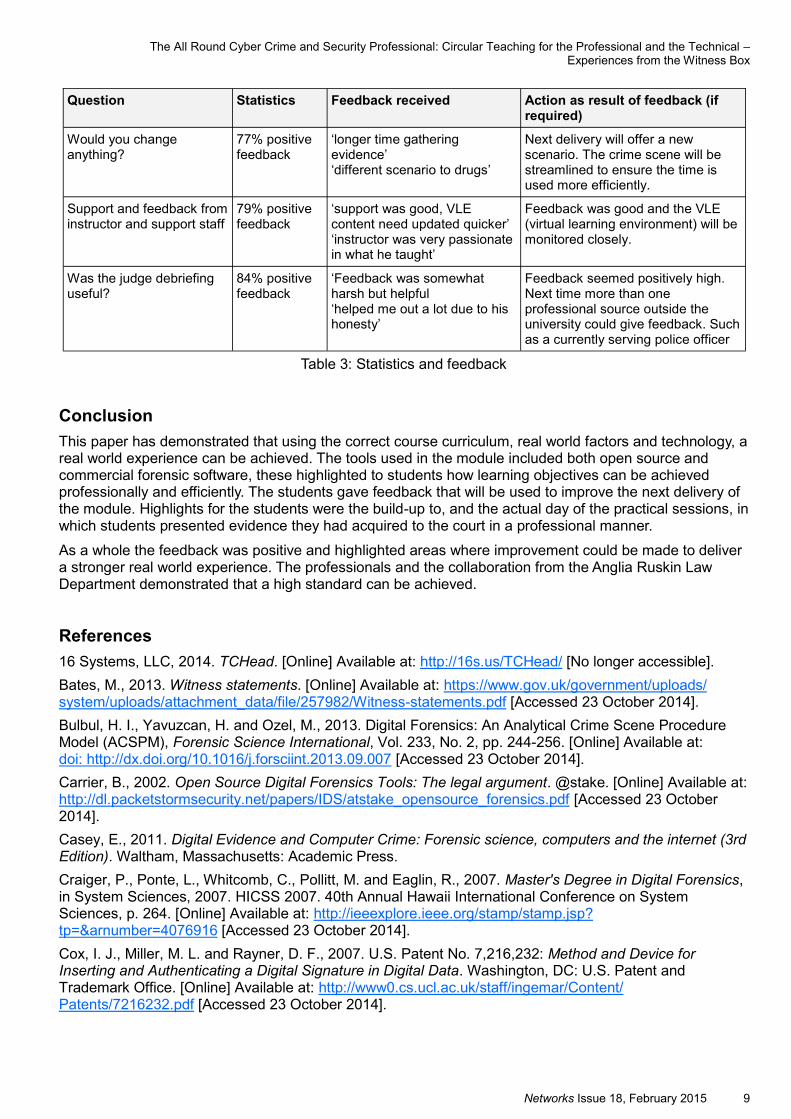
Table 3: Statistics and feedback
Conclusion
This paper has demonstrated that using the correct course curriculum, real world factors and technology, a real world experience can be achieved. The tools used in the module included both open source and commercial forensic software, these highlighted to students how learning objectives can be achieved professionally and efficiently. The students gave feedback that will be used to improve the next delivery of the module. Highlights for the students were the build-up to, and the actual day of the practical sessions, in which students presented evidence they had acquired to the court in a professional manner.
As a whole the feedback was positive and highlighted areas where improvement could be made to deliver a stronger real world experience. The professionals and the collaboration from the Anglia Ruskin Law Department demonstrated that a high standard can be achieved.
References
16 Systems, LLC, 2014. TCHead. [Online] Available at: http://16s.us/TCHead/ [No longer accessible].
Bates, M., 2013. Witness statements. [Online] Available at: https://www.gov.uk/government/uploads/system/uploads/attachment_data/file/257982/Witness-statements.pdf [Accessed 23 October 2014].
Bulbul, H. I., Yavuzcan, H. and Ozel, M., 2013. Digital Forensics: An Analytical Crime Scene Procedure Model (ACSPM), Forensic Science International, Vol. 233, No. 2, pp. 244-256. [Online] Available at: doi: http://dx.doi.org/10.1016/j.forsciint.2013.09.007 [Accessed 23 October 2014].
Carrier, B., 2002. Open Source Digital Forensics Tools: The legal argument. @stake. [Online] Available at: http://dl.packetstormsecurity.net/papers/IDS/atstake_opensource_forensics.pdf [Accessed 23 October 2014].
Casey, E., 2011. Digital Evidence and Computer Crime: Forensic science, computers and the internet (3rd Edition). Waltham, Massachusetts: Academic Press.
Craiger, P., Ponte, L., Whitcomb, C., Pollitt, M. and Eaglin, R., 2007. Master's Degree in Digital Forensics, in System Sciences, 2007. HICSS 2007. 40th Annual Hawaii International Conference on System Sciences, p. 264. [Online] Available at: http://ieeexplore.ieee.org/stamp/stamp.jsp?tp=&arnumber=4076916 [Accessed 23 October 2014].
Cox, I. J., Miller, M. L. and Rayner, D. F., 2007. U.S. Patent No. 7,216,232: Method and Device for Inserting and Authenticating a Digital Signature in Digital Data. Washington, DC: U.S. Patent and Trademark Office. [Online] Available at: http://www0.cs.ucl.ac.uk/staff/ingemar/Content/Patents/7216232.pdf [Accessed 23 October 2014].
Question Statistics Feedback received Action as result of feedback (if required)
Would you change anything?
77% positive feedback
‘longer time gathering evidence’ ‘different scenario to drugs’
Next delivery will offer a new scenario. The crime scene will be streamlined to ensure the time is used more efficiently.
Support and feedback from instructor and support staff
79% positive feedback
‘support was good, VLE content need updated quicker’ ‘instructor was very passionate in what he taught’
Feedback was good and the VLE (virtual learning environment) will be monitored closely.
Was the judge debriefing useful?
84% positive feedback
‘Feedback was somewhat harsh but helpful ‘helped me out a lot due to his honesty’
Feedback seemed positively high. Next time more than one professional source outside the university could give feedback. Such as a currently serving police officer
10 Networks Issue 18, February 2015
Encase v7, undated. EnCase Forensic v7. [Online] Available at: https://www.guidancesoftware.com/products/Pages/encase-forensic/overview.aspx [Accessed 23 October 2014].
Ieong, R. S., 2006. FORZA–Digital forensics investigation framework that incorporate legal issues. Digital Investigation, Vol. 3, pp. 29-36. [Online] Available at: http://www.dfrws.org/2006/proceedings/4-Ieong.pdf [Accessed 23 October 2014].
Lessing, M. and Von Solms, B., 2008. Live Forensic Acquisition as Alternative to Traditional Forensic Processes. Paper presented at IT Incident Management & IT Forensics (IMF 2008), Mannheim, Germany, 23 - 25 September 2008, pp. 1-9. [Online] Available at: http://researchspace.csir.co.za/dspace/bitstream/10204/3141/1/Lessing5_2008.pdf [Accessed 23 October 2014].
Miao, Q., 2010. Research and Analysis on Encryption Principle of TrueCrypt Software System, in 2010 2nd International Conference on Information Systems Engineering (ICISE), pp. 1409-1412. IEEE. [Online] Available at: http://ieeexplore.ieee.org/stamp/stamp.jsp?tp=&arnumber=5691392 [Accessed 23 October 2014].
Müller, T. and Spreitzenbarth, M., 2013. FROST: Forensic Recovery of Scrambled Telephones. Applied Cryptography and Network Security, Vol. 7954, pp. 373-388.
Reith, M., Carr, C. and Gunsch, G., 2002. An Examination of Digital Forensic Models, International Journal of Digital Evidence, Vol. 1, No. 3, pp. 1-12. [Online] Available at: http://digital4nzics.com/Student%20Library/An%20Examination%20of%20Digital%20Forensic%20Models.pdf [Accessed 23 October 2014].
Sprowl, J. A. and Sprowl, J. A., 1976. Evaluating the Credibility of Computer-Generated Evidence, Chicago-Kent Law Review, Vol. 52, No. 3, pp. 547-566. [Online] Available at: http://scholarship.kentlaw.iit.edu/cgi/viewcontent.cgi?article=2231&context=cklawreview [Accessed 23 October 2014].
Sutherland, I., Evans, J., Tryfonas, T. and Blyth, A., 2008. Acquiring volatile operating system data tools and techniques, ACM SIGOPS Operating Systems Review, Vol. 42, No. 3, pp. 65-7. [Online] Available at: http://dl.acm.org/citation.cfm?id=1368516 [Accessed 23 October 2014].
TC-Hunt, 2014. TC-Hunt 1.6, [Online] Available at: http://www.softpedia.com/get/System/File-Management/TCHunt.shtml [Accessed 23 October 2014].
TrueCrypt, undated. TrueCrypt. [Online] Available at: http://www.truecrypt.org/ [No longer accessible].
Williams, J., 2012. ACPO Good Practice Guide for Digital Evidence, [Online] Available at: http://www.acpo.police.uk/documents/crime/2011/201110-cba-digital-evidence-v5.pdf [Accessed 23 October 2014].
Networks Issue 18, February 2015 11
Achievement and Criminology Engagement (ACE)
Colleen Moore ([email protected]), Elle Roberts ([email protected]), Rosie Rawson ([email protected]) and Dr Samantha Lundrigan ([email protected]) Faculty of Arts, Law and Social Science
Abstract
Data relating to attendance, grades, module satisfaction, timetabling and UCAS entry points was collected from a cohort of BA (Hons) Criminology undergraduate students in order to measure and correlate achievement and engagement factors. Having examined those elements that have been noted as relevant, the study sought to examine which factors were most significant, with the view to enhancing and building upon established good practice in the classroom. The overall aim of the three-year project is to enhance students’ experience at university and thus provide a tested and useful range of features throughout the degree programme that will contribute towards their continued success. These preliminary findings set out the parameters that have been identified as rewarding and relevant, in order to build a continuing programme that will ensure maximum engagement and achievement.
Keywords
Learning; Attendance; Achievement; Engagement
12 Networks Issue 18, February 2015
Introduction
The Achievement and Criminology Engagement project (ACE) was funded through a Learning and Teaching Project award from Anglia Learning & Teaching. The grant covered the first twelve months of a three-year project, which is seeking to explore whether there is a relationship between ‘engagement’ factors, such as consistent class attendance, contribution to class discussion, participation in extra-curricular activities and engagement in personal tutor meetings, that might positively affect Criminology undergraduate students’ achievements and progression during their studies.
Previous research has highlighted significant correlations between class attendance and educational achievement outcomes in students. However, much of the research has been located in other countries, and based in science-related subjects. The aim of the present research is to investigate the relationship between engagement (as measured by attendance and participation in extra-curricular activities) and attainment for a cohort of first year undergraduates reading Criminology at Anglia Ruskin.
We collected and analysed, a range of ‘engagement’ indicators that are usually gathered in isolation: attendance at lectures and seminars, records of extra-curricular Criminology-related activities, and meetings with personal tutors and module leaders. This information was correlated with students’ entry (UCAS) points (where available), grades and attainment, gender, and progression development throughout their first year of study. Through matching correlations of engagement and attainment, it was hoped that we would be able to establish which particular, or combination of engagement factors are most beneficial to students and significantly contribute to their success as undergraduates.
Links between attendance and achievement
To date, research has provided evidence supporting the hypothesis of a relationship between engagement in the form of attendance and academic achievement. Subramaniam et al. (2013) looked at attendance in Melaka Manipal Medical College in India, and found that when compulsory, attendance increased from 75% to 90% and the percentage of students who attained 100% attendance increased from 4% to 11%. Moreover, they discovered that exam performance increased by 7% when mandatory attendance was introduced. Although attendance was compulsory in their research, it nonetheless provides evidence that as attendance increased, so did academic performance. In addition Dollinger et al. (2007) looked into individual differences, academic performance and class attendance, while attempting to identify the extent to which un-controllable and controllable variables predict academic performance. It is these variables that the ACE project is hoping to identify and develop during the course of the research.
Furthermore, both Halpern (2007) and Arulampalam et al. (2012) found there to be a strong correlation between attendance and high student performance. However, they also suggest that there may be a relationship between natural academic ability and student attainment. Clearly, those students who both attended and achieved well were also engaged in their own learning process, although how their engagement came about is less easy to understand. Both Halpern (2007) and Arulampalam et al. (2012) describe such students as ‘more naturally capable’, and ‘naturally more geared towards academic achievement’, but this in itself is unhelpful in a higher education setting, where academic learning involves reading, assimilating information and developing critical thinking skills. Few people are naturally academic! However, it may be that ‘lower-ability students’ have difficulty engaging, due to seeing less reward. It may be, therefore, that it is not the relationship between academic achievement and attendance that needs to be analysed but rather the relationships between achievement, attendance and existing evidence of achievement rewarded through formative assessment and learning. Halpern (2007) cautions that although the correlation between attendance and academic achievement is strong, it could be possible to predict it through other factors, such as entry qualifications, cultural background and work ethic – however, the ACE project has not been able so far, to identify such straightforward predictors.
If engagement and attendance is positively related to higher academic achievement, it is necessary to understand how to consistently promote such an experience in undergraduate students and ensure that students of all ability recognise the value of it. Stoner and Fincham (2012) investigated the role that class attendance plays in US academic achievement, and whether it is critical to learning. They suggest that circumstances surrounding attendance at university has changed, citing explanations such as student employment, access to information through technology and students’ diminished opinion of the value of
Networks Issue 18, February 2015 13
attending lectures in person. The methods that students incorporate into their learning styles may not seem to require attendance, when they can access study materials, lecture notes and videos online. Rather than ‘blaming’ the student for the recently imposed financial commitments that they have been burdened with, it may be that the traditional, passive lecture learning space has become out-dated, and newer, more innovative experiences should be provided. It has been suggested that the ‘flipped’ classroom can increase student-teacher classroom engagement and interaction (i.e. this instructional method involves the students watching a pre-recorded lecture prior to class and then the instructor using the scheduled class time to discuss the lecture, answer questions, and problem solve). Similarly Corbin et al. (2010) explore the possibility that courses may not be designed in such a way that all necessary tools for independent learning have been provided. Furthermore, Marvul’s (2012) research provided evidence that suggested students may need a positive reason for continued attendance as well as a supportive curriculum. Aligned with these previous findings, Fjortoft (2005) found motivators for class attendance to be class hand-outs not available elsewhere, faculty members presenting new information live in class and the opportunity to apply information to solving real problems. Feldman (2013) found that giving students a reason to arrive on time, especially for early lectures was effective. The material that was not placed online after the lecture was used in the students’ exams, and worth 10% of their grade – which rewarded students for their attendance. In addition, lectures achieved increased interest and discussion, as well as lower late arrivals.
The research discussed above provides evidence for the importance of investigation of these issues and the effects and recompressions they can have on educational achievement. Moreover, Landis and Reschly (2013) suggest student engagement to be an essential construct in understanding, predicting and preventing dropouts among ‘gifted’ students and recommended tracking engagement can indicate potential risk for undesired outcomes. These are all factors that the Criminology team is aiming to achieve.
The Current Study
The aim of the ACE Project was to investigate the relationship between student engagement and academic achievement. Specifically, we examined the relationship between three student engagement indicators and mean academic grade. We predicted that attendance would be positively associated with academic achievement.
We collated and analysed, a range of ‘engagement’ indicators that are gathered in isolation already about the students who come to Anglia Ruskin, such as attendance in lectures and seminars, records of extra-curricular Criminology-related activities, and meetings with personal tutors and module leaders. This information was correlated with students’ entry (UCAS) points (where available), grades and attainment, gender, and progression development throughout their first year of study. Through matching correlations of engagement and attainment, it was hoped that we would be able to establish which particular, or combination of engagement factors are most beneficial to students and significantly contribute to their success as undergraduates.
Method
Participants
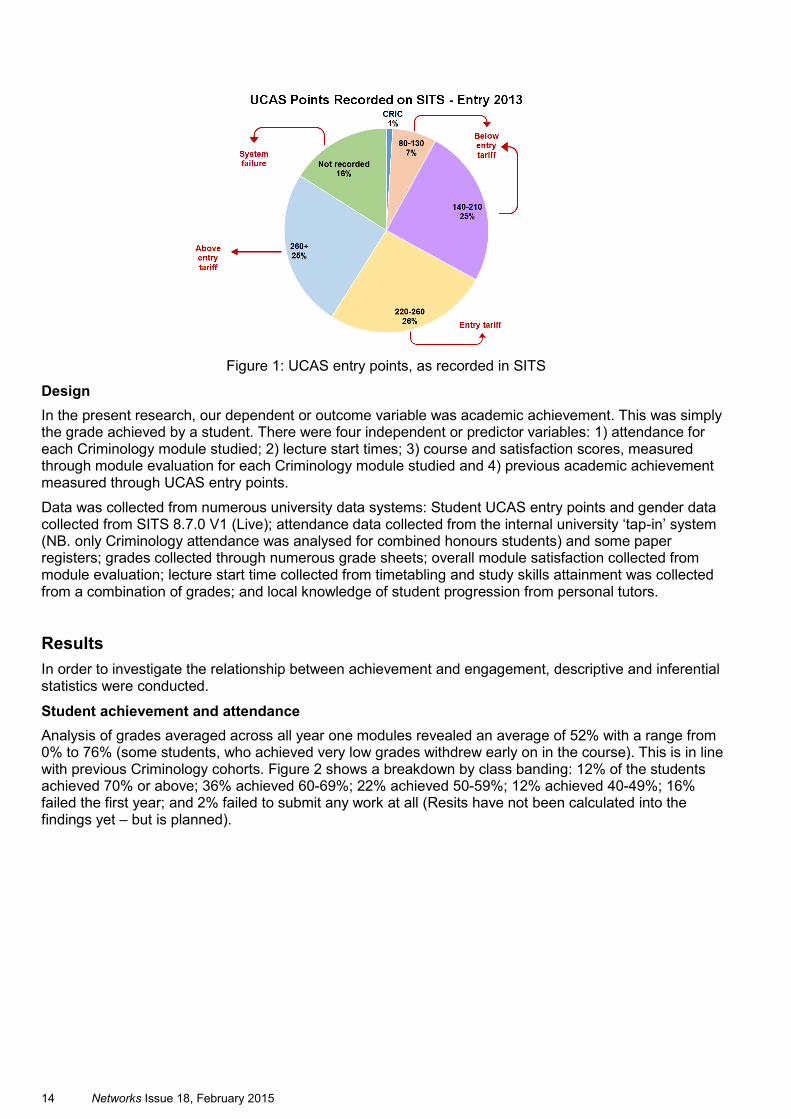
Criminology students at Anglia Ruskin vary widely in terms of their abilities and their approaches to learning, despite coming primarily from an A level background, with the majority of UCAS points ranging from 220 – 260 (see Figure 1). Data was collected from a range of records relating to 142 first year, 2013 entry undergraduate Anglia Ruskin Criminology students. 112 were female and 30 were male. Participants were at least 18 years of age. It was not possible to record all the ages of the students, due to inconsistent database records.
Achievement and Criminology Engagement (ACE)
14 Networks Issue 18, February 2015
Figure 1: UCAS entry points, as recorded in SITS
Design
In the present research, our dependent or outcome variable was academic achievement. This was simply the grade achieved by a student. There were four independent or predictor variables: 1) attendance for each Criminology module studied; 2) lecture start times; 3) course and satisfaction scores, measured through module evaluation for each Criminology module studied and 4) previous academic achievement measured through UCAS entry points.
Data was collected from numerous university data systems: Student UCAS entry points and gender data collected from SITS 8.7.0 V1 (Live); attendance data collected from the internal university ‘tap-in’ system (NB. only Criminology attendance was analysed for combined honours students) and some paper registers; grades collected through numerous grade sheets; overall module satisfaction collected from module evaluation; lecture start time collected from timetabling and study skills attainment was collected from a combination of grades; and local knowledge of student progression from personal tutors.
Results
In order to investigate the relationship between achievement and engagement, descriptive and inferential statistics were conducted.
Student achievement and attendance
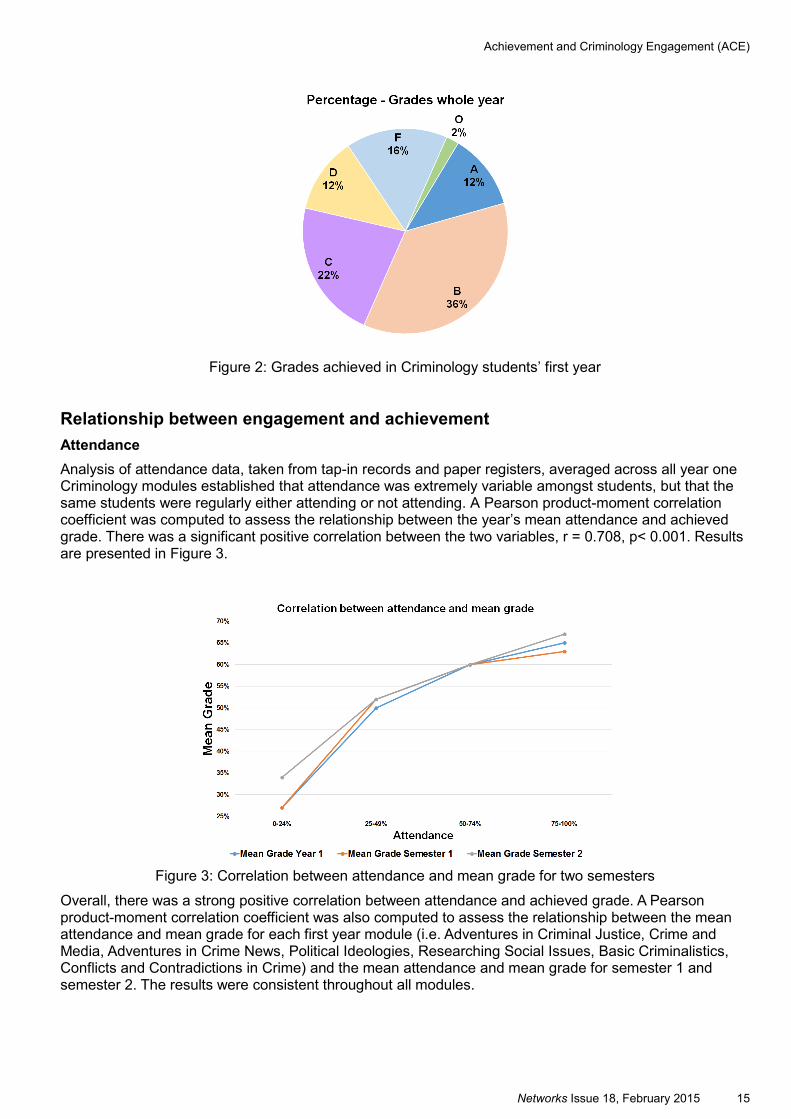
Analysis of grades averaged across all year one modules revealed an average of 52% with a range from 0% to 76% (some students, who achieved very low grades withdrew early on in the course). This is in line with previous Criminology cohorts. Figure 2 shows a breakdown by class banding: 12% of the students achieved 70% or above; 36% achieved 60-69%; 22% achieved 50-59%; 12% achieved 40-49%; 16% failed the first year; and 2% failed to submit any work at all (Resits have not been calculated into the findings yet – but is planned).
Networks Issue 18, February 2015 15
Figure 2: Grades achieved in Criminology students’ first year
Relationship between engagement and achievement
Attendance
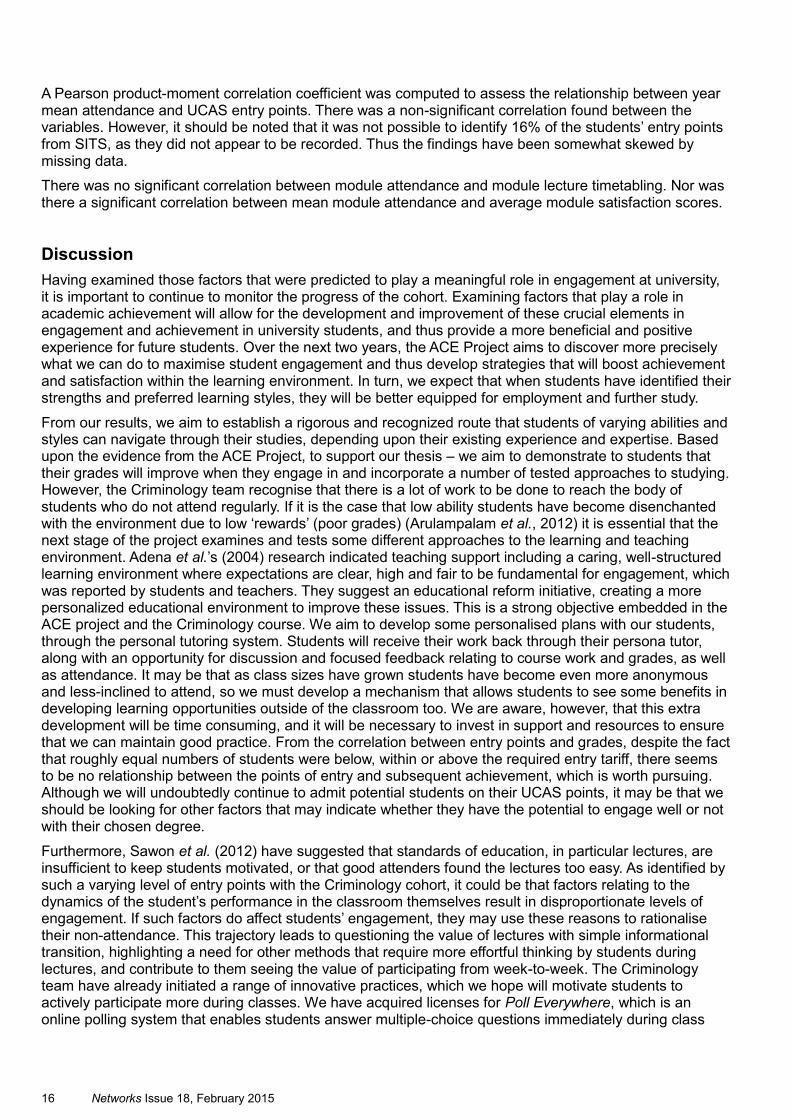
Analysis of attendance data, taken from tap-in records and paper registers, averaged across all year one Criminology modules established that attendance was extremely variable amongst students, but that the same students were regularly either attending or not attending. A Pearson product-moment correlation coefficient was computed to assess the relationship between the year’s mean attendance and achieved grade. There was a significant positive correlation between the two variables, r = 0.708, p< 0.001. Results are presented in Figure 3.
Figure 3: Correlation between attendance and mean grade for two semesters
Overall, there was a strong positive correlation between attendance and achieved grade. A Pearson product-moment correlation coefficient was also computed to assess the relationship between the mean attendance and mean grade for each first year module (i.e. Adventures in Criminal Justice, Crime and Media, Adventures in Crime News, Political Ideologies, Researching Social Issues, Basic Criminalistics, Conflicts and Contradictions in Crime) and the mean attendance and mean grade for semester 1 and semester 2. The results were consistent throughout all modules.
Achievement and Criminology Engagement (ACE)
16 Networks Issue 18, February 2015
A Pearson product-moment correlation coefficient was computed to assess the relationship between year mean attendance and UCAS entry points. There was a non-significant correlation found between the variables. However, it should be noted that it was not possible to identify 16% of the students’ entry points from SITS, as they did not appear to be recorded. Thus the findings have been somewhat skewed by missing data.
There was no significant correlation between module attendance and module lecture timetabling. Nor was there a significant correlation between mean module attendance and average module satisfaction scores.
Discussion
Having examined those factors that were predicted to play a meaningful role in engagement at university, it is important to continue to monitor the progress of the cohort. Examining factors that play a role in academic achievement will allow for the development and improvement of these crucial elements in engagement and achievement in university students, and thus provide a more beneficial and positive experience for future students. Over the next two years, the ACE Project aims to discover more precisely what we can do to maximise student engagement and thus develop strategies that will boost achievement and satisfaction within the learning environment. In turn, we expect that when students have identified their strengths and preferred learning styles, they will be better equipped for employment and further study.
From our results, we aim to establish a rigorous and recognized route that students of varying abilities and styles can navigate through their studies, depending upon their existing experience and expertise. Based upon the evidence from the ACE Project, to support our thesis – we aim to demonstrate to students that their grades will improve when they engage in and incorporate a number of tested approaches to studying. However, the Criminology team recognise that there is a lot of work to be done to reach the body of students who do not attend regularly. If it is the case that low ability students have become disenchanted with the environment due to low ‘rewards’ (poor grades) (Arulampalam et al., 2012) it is essential that the next stage of the project examines and tests some different approaches to the learning and teaching environment. Adena et al.’s (2004) research indicated teaching support including a caring, well-structured learning environment where expectations are clear, high and fair to be fundamental for engagement, which was reported by students and teachers. They suggest an educational reform initiative, creating a more personalized educational environment to improve these issues. This is a strong objective embedded in the ACE project and the Criminology course. We aim to develop some personalised plans with our students, through the personal tutoring system. Students will receive their work back through their persona tutor, along with an opportunity for discussion and focused feedback relating to course work and grades, as well as attendance. It may be that as class sizes have grown students have become even more anonymous and less-inclined to attend, so we must develop a mechanism that allows students to see some benefits in developing learning opportunities outside of the classroom too. We are aware, however, that this extra development will be time consuming, and it will be necessary to invest in support and resources to ensure that we can maintain good practice. From the correlation between entry points and grades, despite the fact that roughly equal numbers of students were below, within or above the required entry tariff, there seems to be no relationship between the points of entry and subsequent achievement, which is worth pursuing. Although we will undoubtedly continue to admit potential students on their UCAS points, it may be that we should be looking for other factors that may indicate whether they have the potential to engage well or not with their chosen degree.
Furthermore, Sawon et al. (2012) have suggested that standards of education, in particular lectures, are insufficient to keep students motivated, or that good attenders found the lectures too easy. As identified by such a varying level of entry points with the Criminology cohort, it could be that factors relating to the dynamics of the student’s performance in the classroom themselves result in disproportionate levels of engagement. If such factors do affect students’ engagement, they may use these reasons to rationalise their non-attendance. This trajectory leads to questioning the value of lectures with simple informational transition, highlighting a need for other methods that require more effortful thinking by students during lectures, and contribute to them seeing the value of participating from week-to-week. The Criminology team have already initiated a range of innovative practices, which we hope will motivate students to actively participate more during classes. We have acquired licenses for Poll Everywhere, which is an online polling system that enables students answer multiple-choice questions immediately during class
Networks Issue 18, February 2015 17
and see them live on-screen. This initiative is also assessed for ten weeks of the semester, and forms a small proportion of their overall grade. As discussed earlier, Feldman (2013) found that giving students a reason to arrive on time, especially for early lectures was effective and we are already seeing the rewards from this initiative. In addition, Poll Everywhere can be utilised to encourage students to ask questions in real time anonymously, and take part in surveys about information that is being conveyed through lectures. So far, the initiative has proven very popular, and although the system depends on the student owning a smart device, up to three quarters of the first and third years are now actively engaged in live class discussions each week, and can see how their suggestions and comments compare to their classmates. Furthermore, we have just begun to incorporate PeerWise into seminar activities. This programme allows students to formulate questions, relating to set reading before they come to the seminar (instead of the lecturer setting them), and other students can respond to their peers. Thus, during seminars, the discussions that take place are based upon the experiences and thoughts that students had, when preparing for the class, contributing to their own personal engagement. The student’s input on PeerWise will also be assessed and form a small part of their overall assessment.
Finally, we aim to initiate ‘ACE groups’ that will align students to a particular lecturer’s research interests. The aim is that these groups will also enable them to develop original and informed research questions for their major projects and final year of study at Anglia Ruskin. If students have been given the opportunity to develop strong research skills and align them with a member of staff, they may recognise the value of engagement, and experience the reward of expanding their own abilities and grades. However, this innovation will also require time, support and resources in order for them to develop consistently and usefully over the next two years.
Conclusion
Overall, the ACE project has demonstrated that there are some significant areas for improvement within the structure of the course. Despite achieving very high scores in the National Student Survey, we are committed to ensuring that our students are given every opportunity to maximise their potential, develop their skills and knowledge, as well as feel satisfied that their university experience was rewarding, useful and valuable. Fjortoft (2005) reported that motivators for non-attendance were that class was before or after a test, lecturers merely read out their notes and two or more hour breaks before or after class, concluding that teacher behaviour and test schedules impact class attendance. These findings are concurrent with the interim results from the ACE project. Although there were no significant correlations between timetabling, module evaluations and achievement, if we are serious about enhancing student engagement, we can motivate students to attend class through modifying class schedules, testing patterns, and our own teaching styles.
References
Arulampalam, W., Naylor, R. A. and Smith, J., 2012. Am I Missing Something? The effects of absence from class on student performance. Economics of Education Review, Vol. 1, No. 4, pp. 363–375. [Online] Available at: http://wrap.warwick.ac.uk/1396/ [Accessed 1 December 2014].
Corbin, L., Burns, K. and Chrzanowski, A., 2010. If You Teach it, Will they Come? Law students, class attendance and student engagement. Legal Education Review, Vol. 20, Nos. 1-2, pp. 13–44. [Online] Available at: http://www.ler.edu.au/Vol%2020%20PDFs/corbin.pdf [Accessed 1 December 2014].
Dollinger, S. J., Matyja, A. M. and Huber, J. L., 2008. Which factors best account for academic success: Those which college students can control or those they cannot? Journal of Research in Personality, Vol. 42, No. 4, pp. 872–885. [Online] Available at: http://www.sciencedirect.com/science/article/pii/S0092656607001274 [Accessed 1 December 2014].
Fjortoft, N., 2005. Students’ Motivations for Class Attendance. American Journal of Pharmaceutical Education, Vol. 69, No. 1, p.15. [Online] Available at: http://archive.ajpe.org/aj6901/aj690115/aj690115.pdf [Accessed 1 December 2014].
Achievement and Criminology Engagement (ACE)
18 Networks Issue 18, February 2015
Klem, A. M. and Connell, J. P., 2004. Linking Teacher Support to Student Engagement and Achievement. Journal of School Health, Vol. 74, No. 7, pp. 262–274. [Online] Available at: http://www.indiana.edu/~ceep/hssse/Klem.pdf [Accessed 1 December 2014].
Halpern, N., 2007. The impact of attendance and student characteristics on academic achievement: findings from an undergraduate business management module. Journal of Further and Higher Education, Vol. 31, No. 4, pp. 335-349. [Online] Available at: http://www.tandfonline.com/doi/abs/10.1080/03098770701626017#.VHw6kmMzPAQ [Accessed 1 December 2014].
Landis, R. N. and Reschly, A. L., 2013. Reexamining Gifted Underachievement and Dropout Through the Lens of Student Engagement, Journal for the Education of the Gifted, Vol. 36, No. 2, pp. 220-249. [Online] Available at: http://jeg.sagepub.com/content/36/2/220.abstract [Accessed 1 December 2014].
Marvul, J. N., 2011. If You Build It, They Will Come: A Successful Truancy Intervention Program in a Small High School. Urban Education, Vol. 47, No. 1, pp. 144-169. [Online] Available at: http://uex.sagepub.com/content/47/1/144.full.pdf [Accessed 1 December 2014].
Sawon, K., Pembroke, M. and Wille, P., 2012. An analysis of student characteristics and behaviour in relation to absence from lectures. Journal of Higher Education Policy and Management, Vol. 34, No. 6, pp. 575–586. [Online] Available at: http://www.tandfonline.com/doi/abs/10.1080/1360080X.2012.716004#.VHw7XmMzPAQ [Accessed 1 December 2014].
Stoner, S. C. and Fincham, J. E., 2012. Faculty role in classroom engagement and attendance. American Journal of Pharmaceutical Education, Vol. 76, No. 5, p. 75. [Online] Available at: http://www.ncbi.nlm.nih.gov/pmc/articles/PMC3386026/ [Accessed 1 December 2014].
Subramaniam, B., Hande, S. and Komattil, R., 2013. Attendance and achievement in medicine: investigating the impact of attendance policies on academic performance of medical students. Annals of Medical and Health Sciences Research, Vol. 3, No. 2, pp. 202–5. [Online] Available at: http://www.ncbi.nlm.nih.gov/pmc/articles/PMC3728863/ [Accessed 1 December 2014].
Networks Issue 18, February 2015 19
An Evaluation of Videos used to Support Clinical Skills Teaching for Pre-registration Student Nurses
Siân Shaw ([email protected]) and Judie Knowles ([email protected]) Faculty of Health, Social Care and Education Rachel May: Senior Clinical Nurse ([email protected]) Nursing Projects Office, Addenbrooke’s NHS Trust Richard Shaw: Senior Bioinformatics Scientist ([email protected]) Illumina
Abstract
The NMC suggest that to ensure high quality patient care it is essential that student nurses develop competence in a range of clinical skills (NMC, 2010a). The aim of this project was to determine whether nursing students perform the skills of infection prevention; hand washing; aseptic technique and vital signs measurement more competently in an Observed Structured Clinical Examination (OSCE), when traditional face-to-face teaching is enhanced with the availability of skills videos via an e-learning platform. The study employed a randomised controlled design. An intervention group were taught face-to-face in the clinical skills lab and had the teaching supplemented by access to clinical skills videos. The control group received the same classroom face-to-face teaching but did not have access to the videoed blended e-learning resources.
Student nurses of mixed gender and ages (n=229) were invited to volunteer to participate in the in-house study. Eighty-eight students consented and were evenly divided by random allocation to the intervention group (n=44) and to the control group (n=44). The mean score for all clinical skills was higher in the OSCEs in the intervention group who viewed the videos, this was not, however, statistically significant as the results were >.05.
Keywords
Nursing, Clinical Skills, Videos
20 Networks Issue 18, February 2015
Introduction
The Faculty of Health, Social Care and Education (FHSCE) at Anglia Ruskin University has in excess of 1,500 students registered on the Nursing and Midwifery Council approved (NMC, 2014a) undergraduate bachelor of science with honours degree (BSc (Hons)), in the field of adult nursing. Anglia Ruskin is one of the leading providers of nurse education in the United Kingdom with three campuses in the East of England at Cambridge, Chelmsford and Peterborough. Anglia Ruskin is the only Higher Education Institution awarded 'Outstanding' in the fit-for-practice category in the NMC review of nursing and midwifery course provision (NMC, 2013). The course has a substantial essential nursing skills element (NMC, 2010a), embedded in a modular structure and is taught to students alongside contemporary theory within the 50:50 (practice: theory) curriculum (NMC, 2010b). Healthcare educationalists at Anglia Ruskin seek innovative pedagogical strategies that can be used to enable the development of essential skills competence in students with diverse learning abilities (Government Equalities Office, 2010).
This paper reports on a study to explore the impact of blended learning using essential skill videos in addition to traditional face-to-face teaching methods. This educational initiative took place during the first trimester of the first year of the BSc (Hons) studies, and was therefore carried out prior to students’ first clinical placement learning experiences.
Background
The ‘traditional’ Anglia Ruskin face-to-face method for teaching essential clinical skills prior to practice placements involves an interactive demonstration of a skill by a lecturer to groups of around 25 students in a clinical skill laboratory, after which the students practice the skill under the supervision of the lecturer who offers corrective teaching to reinforce best practice. In clinical practice, for students’ placements, the NMC requires a normal maximum nurse registrant mentor to student ratio of 1:3 for safe student supervision (NMC, 2008). However, the NMC does not specify ratios of lecturers to supervise skills teaching or number of students in tutorial groups in their approved educational institutions. Anglia Ruskin aims for a skills laboratory maximum staff member to student ratio of 1:12 to teach the skills, thus requiring a minimum of two lecturers per skills session of 24 students. It can be challenging to resource two lecturers per skills session. Anglia Ruskin is committed to ensuring consistency of high quality in teaching clinical procedures and has recently employed specialist skills tutors on all campuses. All lecturers on the pre-registration nursing programmes are NMC nurse registrants, and the FHSCE has the highest number of Principle Teaching Fellows of any university faculty in the UK (HEA, 2014). This was achieved through Anglia Ruskin’s HEA-accredited in-house Anglia Professional Recognition Scheme (ARU, 2014).
At the end of the first module of the pre-registration nursing programme, in the first trimester of Year 1, the students undertake an OSCE as a formative assessment and learning experience prior to their placement in clinical practice. Historically, students tell Anglia Ruskin nurse educationalists that skills acquisition is challenging, and it is evident in the formative OSCEs that many of the students struggle to grasp some of the complexities of skills competency. Complex tasks include, for example, demonstrating the manual dexterity of a skill such as hand washing whilst answering knowledge-based questions on infection prevention; or communicating effectively with the person role-modelling as the service user (patient) whilst removing a soiled dressing. The learned ability to speak-and-do is highly important in competent nursing healthcare, where the domains of cognitive, psychomotor and affective ability must be employed simultaneously.
The Department of Health (2013) states that health professionals need to be ‘unfailing in rooting out poor care and unflinching in promoting what is excellent’ (2013: 10), and in addition, there is a need to ‘ensure that the fundamental standards of care that people have a right to expect are met consistently, whatever the settings’ (ibid.). The NHS Constitution (2013) also highlights the need to ensure that the NHS aspires to high standards of professionalism in the provision of safe, high quality care. In preparing nurses for their professional roles Anglia Ruskin has, therefore, a responsibility to prevent problems by ensuring that excellence is achieved in clinical skills teaching, learning and knowledge acquisition.
Networks Issue 18, February 2015 21
Aims of the project
The aim of this project was to develop and evaluate the effectiveness of a series of instructional videos for clinical skills for the first module in the pre-registration adult nursing programme. This module introduces a range of foundation clinical skills (18 three-hour sessions over nine days) to student nurses prior to their first allocation in a practice area.
Method
The production of videos was funded by a Learning and Teaching Project Award of £3000 from Anglia Learning and Teaching. To work within the constraints of a tight budget, third year students from the media department were paid, in the capacity of digital partners, to assist in the production of the videos. The students were recruited via Anglia Ruskin’s Student Employment Bureau and references obtained from their tutors. The production process was a partnership between lecturers at Anglia Ruskin and Senior Clinical Specialist Nurses at Addenbrooke’s NHS Trust, who provided expert clinical advice. This partnership ensured that the skills demonstrated in the videos adhere to current evidence-based best practice. Third year student nurses were recruited via the Employment Bureau to demonstrate the clinical skills in the videos. The academic staff identified the educational objectives for each video in line with the module learning outcomes. The design of the content was allocated to six teams – one for each video – which included an academic and specialist clinical nurse. A team of three media students worked with the academics to storyboard the content. Filming was undertaken in the clinical skills labs on our University campuses in Cambridge and Chelmsford. Once filming was complete, the footage was edited, and then reviewed by a team of lecturers. During this review meeting graphics, text and background music were inserted and final editing took place.
The clinical skills videos created were:
Aseptic technique
Basic life support
Measuring and recording blood pressure
Hand washing and Personal Protective Equipment (PPE)
Respiratory rate
Preparing a bed space for admission
Participants The study participants were recruited from the total population of first-year student nurses (n=229) undertaking the first module of the BSc (Hons) in Adult Nursing. Students were recruited from the Cambridge campus prior to a lecture which all students were required to attend. On the Chelmsford campus students were recruited prior to the commencement of one of their compulsory group tutorial sessions. A participant information sheet was distributed to all the students and they were asked to return a signed consent form via the internal post or their tutor to the researchers. The inclusion criterion was that the students were registered as part of the module 1 Registered Nurse Undergraduate Degree cohort. A total of 88 students (38.4%) volunteered to participate in the study.
Ethics Ethical approval was obtained from the Faculty Research Ethics Panel prior to recruitment. All ‘actors’ volunteered to participate and were fully informed that the videos would be used extensively for educational and research purposes and would be published widely, including on Anglia Ruskin’s My.Player, Vimeo, and for open access on the internet via iTunesU. All ‘actors’ consented to participate with this understanding.
An Evaluation of Videos used to Support Clinical Skills Teaching for Pre-registration Student Nurses
22 Networks Issue 18, February 2015
Design
The study employed a randomised controlled design. Each participant was allocated a sequential number which became their unique code. A computerised random number generator was used to assign participants to the intervention or control group using these codes. The unique code was used was used on all written data to ensure anonymity. Both the intervention and control groups were taught the skills in the ‘traditional’ manner of lecturer demonstration followed by a scheduled period of practice in the skills lab under supervision. In addition to the ‘traditional’ teaching the intervention group were provided access to six skills videos via a password protected Vimeo account. All students were instructed not to share their password with other students.
After the completion of data collection, all students, including the control group and non-participants, were provided with access to the videos. The entire cohort were therefore able to view the videos prior to their first placement in clinical practice to ensure that there was minimal, or no, implications for patient care.
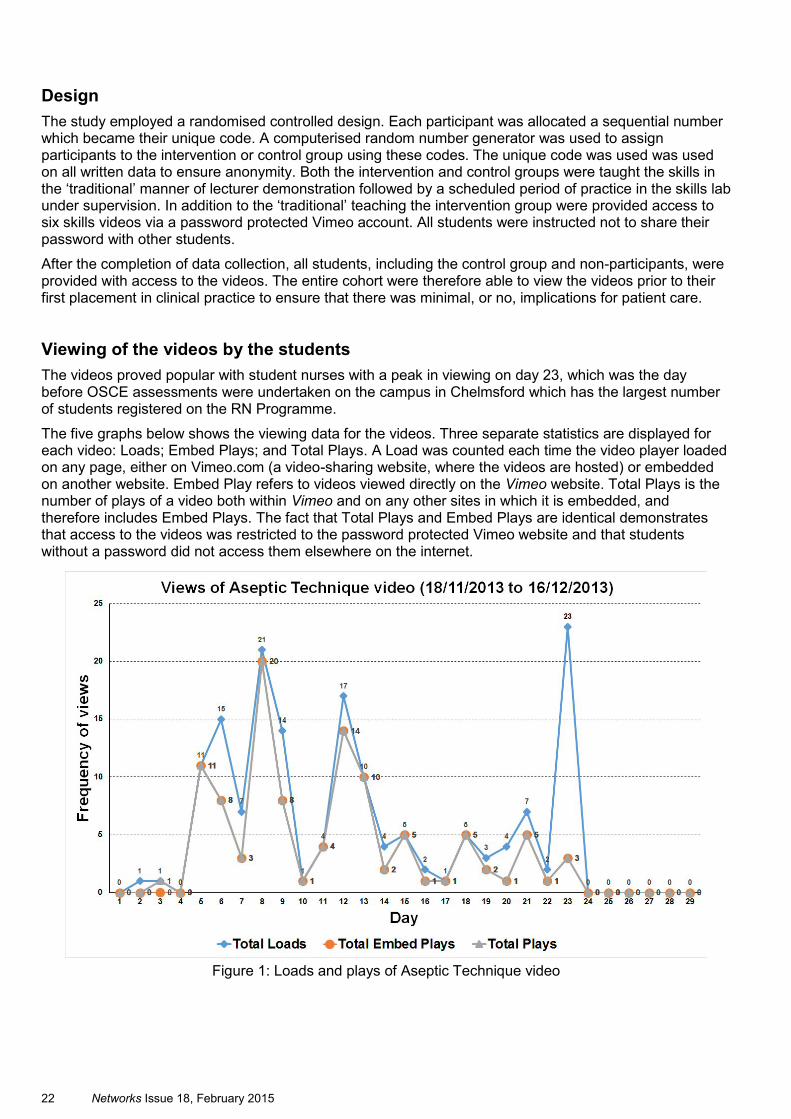
Viewing of the videos by the students
The videos proved popular with student nurses with a peak in viewing on day 23, which was the day before OSCE assessments were undertaken on the campus in Chelmsford which has the largest number of students registered on the RN Programme.
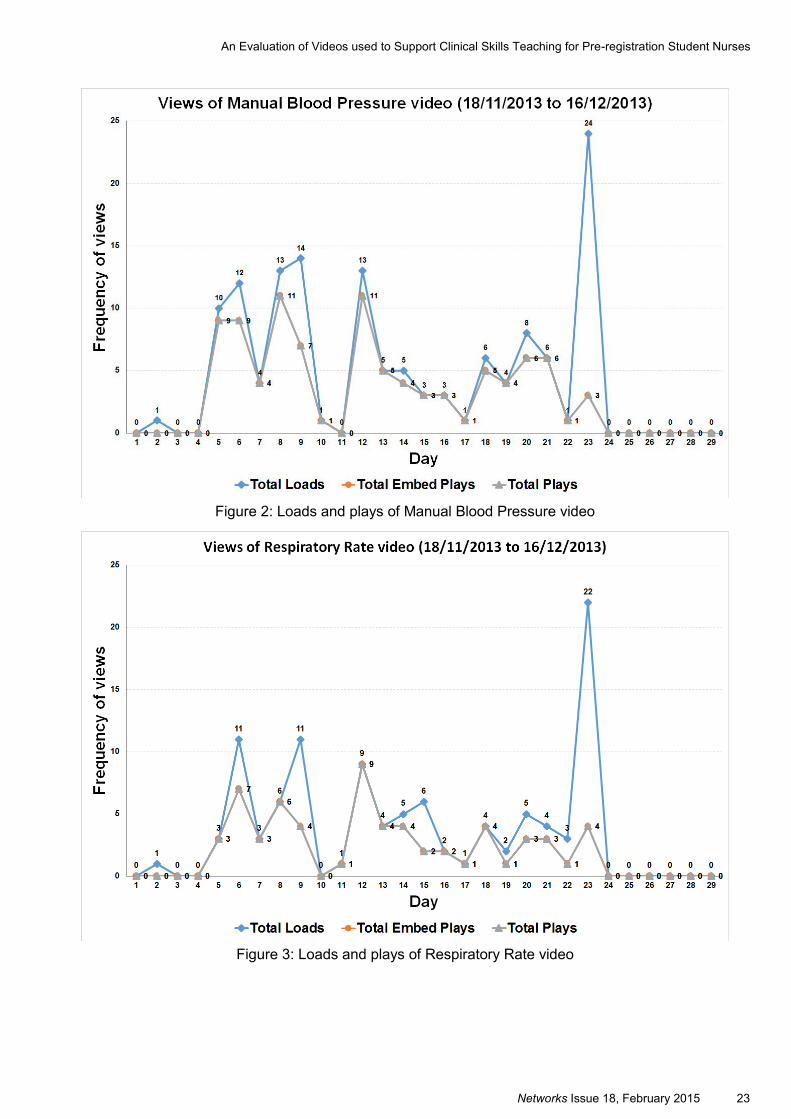
The five graphs below shows the viewing data for the videos. Three separate statistics are displayed for each video: Loads; Embed Plays; and Total Plays. A Load was counted each time the video player loaded on any page, either on Vimeo.com (a video-sharing website, where the videos are hosted) or embedded on another website. Embed Play refers to videos viewed directly on the Vimeo website. Total Plays is the number of plays of a video both within Vimeo and on any other sites in which it is embedded, and therefore includes Embed Plays. The fact that Total Plays and Embed Plays are identical demonstrates that access to the videos was restricted to the password protected Vimeo website and that students without a password did not access them elsewhere on the internet.
Figure 1: Loads and plays of Aseptic Technique video
Networks Issue 18, February 2015 23
Figure 2: Loads and plays of Manual Blood Pressure video
Figure 3: Loads and plays of Respiratory Rate video
An Evaluation of Videos used to Support Clinical Skills Teaching for Pre-registration Student Nurses
24 Networks Issue 18, February 2015
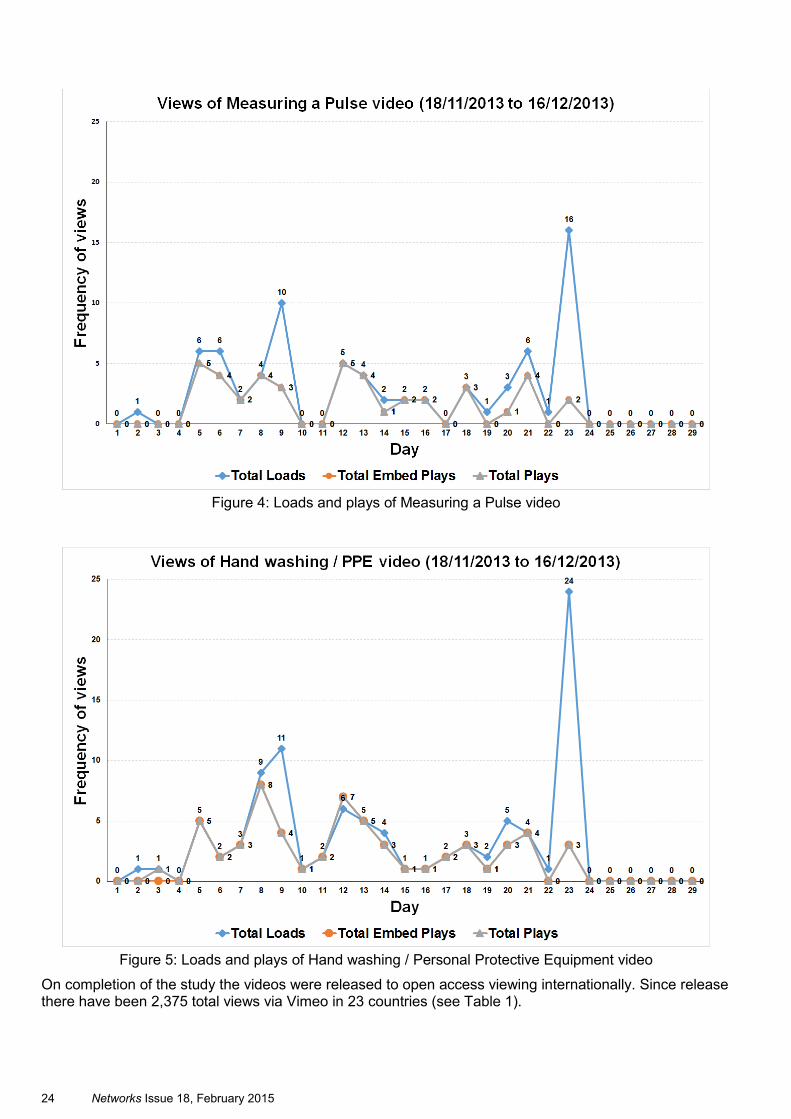
Figure 4: Loads and plays of Measuring a Pulse video
Figure 5: Loads and plays of Hand washing / Personal Protective Equipment video
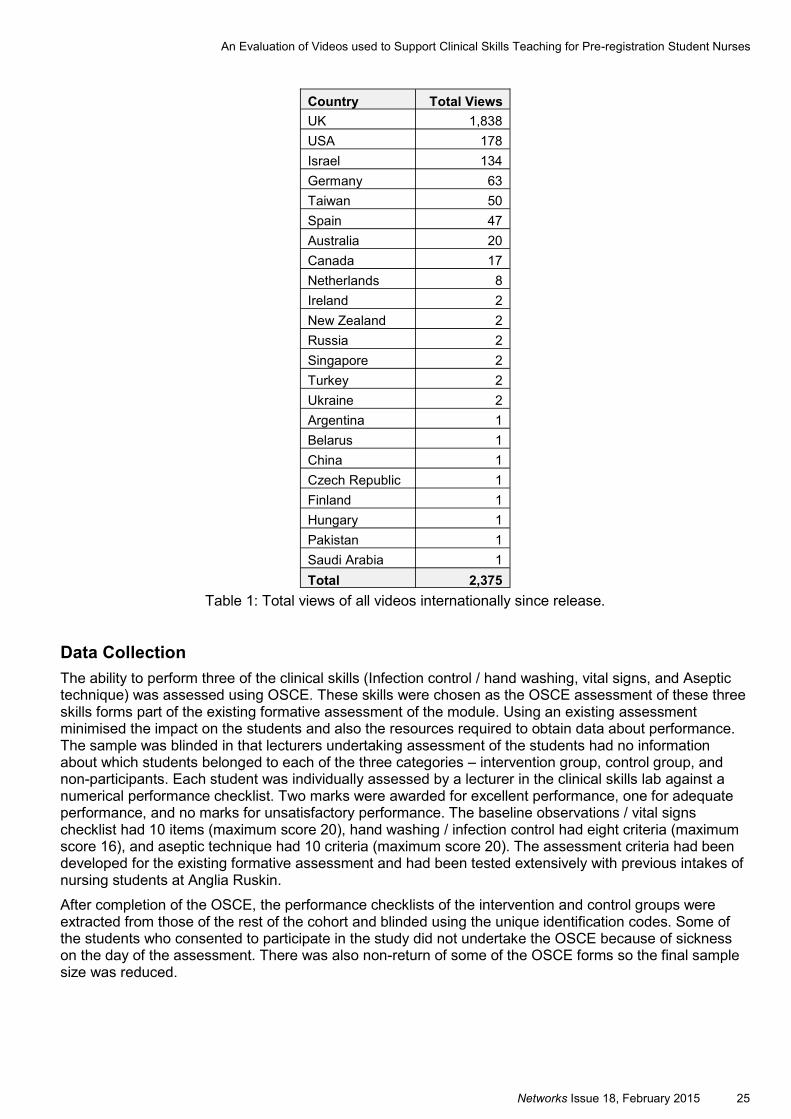
On completion of the study the videos were released to open access viewing internationally. Since release there have been 2,375 total views via Vimeo in 23 countries (see Table 1).
Networks Issue 18, February 2015 25
Table 1: Total views of all videos internationally since release.
Data Collection
The ability to perform three of the clinical skills (Infection control / hand washing, vital signs, and Aseptic technique) was assessed using OSCE. These skills were chosen as the OSCE assessment of these three skills forms part of the existing formative assessment of the module. Using an existing assessment minimised the impact on the students and also the resources required to obtain data about performance. The sample was blinded in that lecturers undertaking assessment of the students had no information about which students belonged to each of the three categories – intervention group, control group, and non-participants. Each student was individually assessed by a lecturer in the clinical skills lab against a numerical performance checklist. Two marks were awarded for excellent performance, one for adequate performance, and no marks for unsatisfactory performance. The baseline observations / vital signs checklist had 10 items (maximum score 20), hand washing / infection control had eight criteria (maximum score 16), and aseptic technique had 10 criteria (maximum score 20). The assessment criteria had been developed for the existing formative assessment and had been tested extensively with previous intakes of nursing students at Anglia Ruskin.
After completion of the OSCE, the performance checklists of the intervention and control groups were extracted from those of the rest of the cohort and blinded using the unique identification codes. Some of the students who consented to participate in the study did not undertake the OSCE because of sickness on the day of the assessment. There was also non-return of some of the OSCE forms so the final sample size was reduced.
Country Total Views
UK 1,838
USA 178
Israel 134
Germany 63
Taiwan 50
Spain 47
Australia 20
Canada 17
Netherlands 8
Ireland 2
New Zealand 2
Russia 2
Singapore 2
Turkey 2
Ukraine 2
Argentina 1
Belarus 1
China 1
Czech Republic 1
Finland 1
Hungary 1
Pakistan 1
Saudi Arabia 1
Total 2,375
An Evaluation of Videos used to Support Clinical Skills Teaching for Pre-registration Student Nurses
26 Networks Issue 18, February 2015
Data Analysis
The performance of the experimental group was compared to that of the control group using the standard existing formative assessment checklist and grading. A Two Independent Samples t-test was undertaken using SPSS to compare the means of a normally distributed interval dependent variable for the two independent groups. The null hypothesis was that viewing the videos would have no effect on the mean scores of the students in the OSCE assessment.
Results
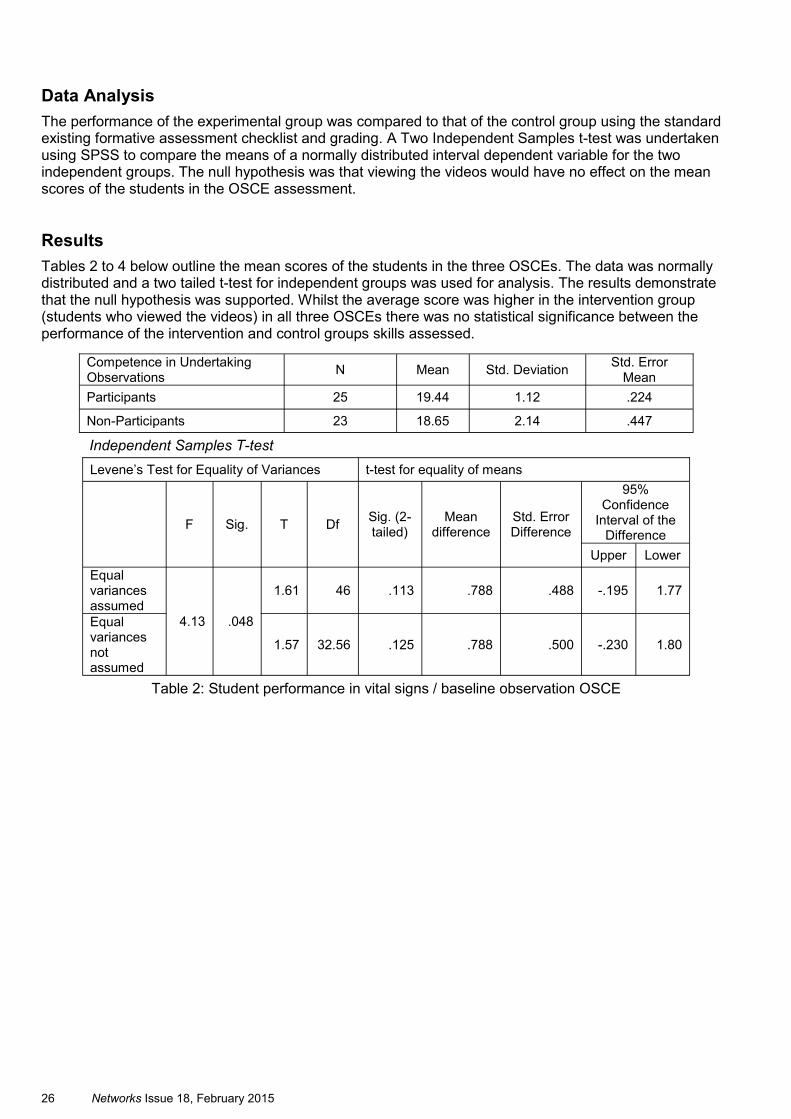
Tables 2 to 4 below outline the mean scores of the students in the three OSCEs. The data was normally distributed and a two tailed t-test for independent groups was used for analysis. The results demonstrate that the null hypothesis was supported. Whilst the average score was higher in the intervention group (students who viewed the videos) in all three OSCEs there was no statistical significance between the performance of the intervention and control groups skills assessed.
Independent Samples T-test
Table 2: Student performance in vital signs / baseline observation OSCE
Competence in Undertaking Observations
N Mean Std. Deviation Std. Error
Mean
Participants 25 19.44 1.12 .224
Non-Participants 23 18.65 2.14 .447
t-test for equality of means Levene’s Test for Equality of Variances
F Sig. T Df Sig. (2-tailed)
Mean difference
Std. Error Difference
95% Confidence
Interval of the Difference
Upper Lower
Equal variances assumed
4.13 .048
1.61 46 .113 .788 .488 -.195 1.77
Equal variances not assumed
1.57 32.56 .125 .788 .500 -.230 1.80
Networks Issue 18, February 2015 27
Independent Samples T-test
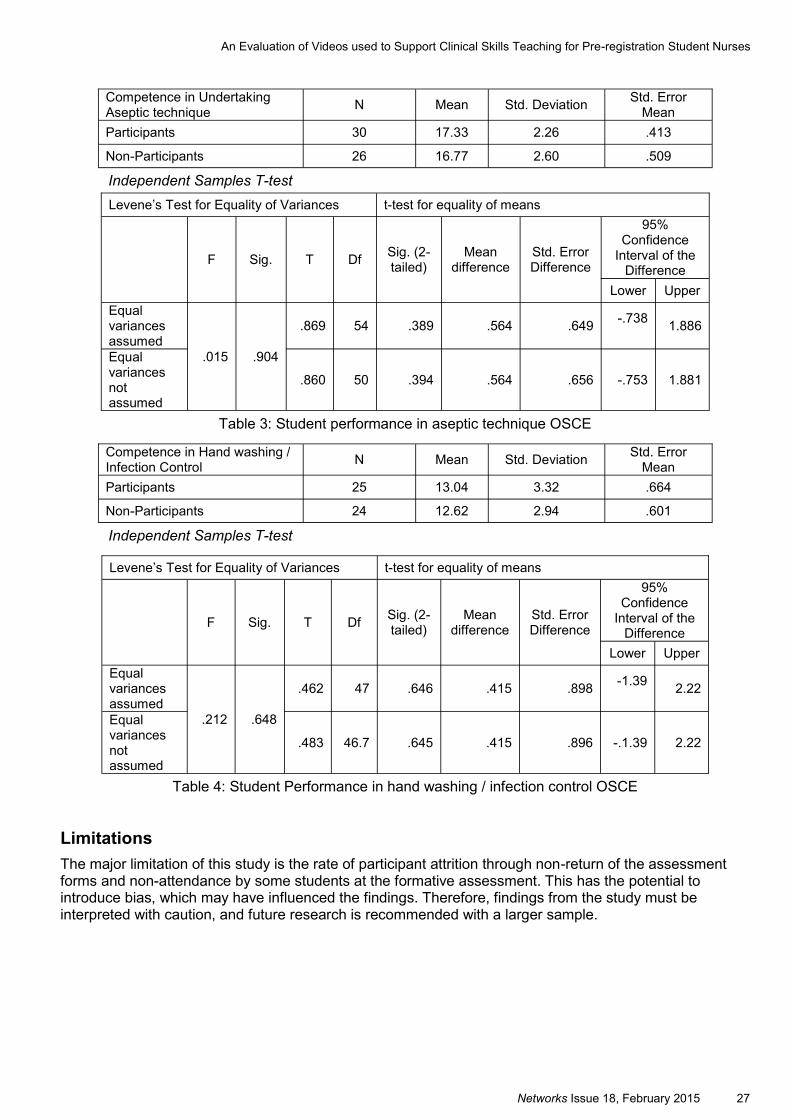
Table 3: Student performance in aseptic technique OSCE
Independent Samples T-test
Table 4: Student Performance in hand washing / infection control OSCE
Limitations
The major limitation of this study is the rate of participant attrition through non-return of the assessment forms and non-attendance by some students at the formative assessment. This has the potential to introduce bias, which may have influenced the findings. Therefore, findings from the study must be interpreted with caution, and future research is recommended with a larger sample.
Competence in Undertaking Aseptic technique
N Mean Std. Deviation Std. Error
Mean
Participants 30 17.33 2.26 .413
Non-Participants 26 16.77 2.60 .509
t-test for equality of means Levene’s Test for Equality of Variances
F Sig. T Df Sig. (2-tailed)
Mean difference
Std. Error Difference
95% Confidence
Interval of the Difference
Lower Upper
Equal variances assumed
.015 .904
.869 54 .389 .564 .649 -.738
1.886
Equal variances not assumed
.860 50 .394 .564 .656 -.753 1.881
Competence in Hand washing / Infection Control
N Mean Std. Deviation Std. Error
Mean
Participants 25 13.04 3.32 .664
Non-Participants 24 12.62 2.94 .601
t-test for equality of means Levene’s Test for Equality of Variances
F Sig. T Df Sig. (2-tailed)
Mean difference
Std. Error Difference
95% Confidence
Interval of the Difference
Lower Upper
Equal variances assumed
.212 .648
.462 47 .646 .415 .898 -1.39
2.22
Equal variances not assumed
.483 46.7 .645 .415 .896 -.1.39 2.22
An Evaluation of Videos used to Support Clinical Skills Teaching for Pre-registration Student Nurses
28 Networks Issue 18, February 2015
Conclusion
The use of videos was implemented to enhance the student learning experience of how clinical skills are taught. The videos ensured parity in how the skills should be performed thereby minimising procedural and methodological inconsistencies. This evaluation focussed on the impact on skill competence as measured in student performance in an OSCE. Further research is recommended in the students’ experience of viewing the videos and the impact on performance in clinical practice.
Acknowledgements
We wish to acknowledge:
The Learning and Teaching Project Award from Anglia Learning and Teaching at Anglia Ruskin University.
The media students who created the videos.
The student nurse who ‘acted’ in the videos.
The student nurses who participated in the research.
References
Anglia Ruskin University, 2014. Anglia Professional Recognition Scheme for Teaching and Supporting Learning. ARU: UK. [Online] Available from: http://vle.anglia.ac.uk/sites/LTA/APRS/Pages/Home3.aspx [Accessed on 20 Oct 2014].
Delamothe, T., 2013. Government's initial response to Mid Staffordshire report. British Medical Journal, [e-journal] Vol. 346, Issue 7903, p.7. [Online] Available at: http://www.bmj.com/content/346/bmj.f2209 [Accessed on 21 Oct 2014].
Department, of Health, 2012. The NHS Constitution: the NHS belongs to us all. [e-book] London: Department of Health. [Online] Available at: https://www.gov.uk/government/uploads/system/uploads/attachment_data/file/170656/NHS_Constitution.pdf [Accessed on 21 Oct 2014].
Francis, R., 2013. Report of the Mid-Staffordshire NHS Foundation Trust Public Inquiry. The Stationary Office, England. [Online] Available from: http://www.midstaffspublicinquiry.com/report [Accessed 24 June 2014].
Higher Education Academy (HEA), 2014. Professional Recognition. The Higher Education Academy: York, UK. [Online] Available from: http://www.heacademy.ac.uk/professional-recognition [Accessed 24 June 2014].
Government Equalities Office, 2010. Equality Act: Chapter 15. The Stationary Office: London. [Online] Available from: http://www.legislation.gov.uk/ukpga/2010/15/contents [Accessed 24 June 2014].
Nursing and Midwifery Council (NMC), 2008. Standards to support learning and assessment in practice. Nursing and Midwifery Council: London. [Online] Available from: http://www.nmc-uk.org/Documents/NMC-Publications/NMC-Standards-to-support-learning-assessment.pdf [Accessed 24 June 2014].
Nursing and Midwifery Council (NMC), 2010a. Essential skills clusters and guidance for their use (Annex 3). In Standards for pre-registration nursing education. Nursing and Midwifery Council: London. [Online] Available from: http://standards.nmc-uk.org/PublishedDocuments/Annexe%203%20-%20Essential%20skills%20cluster%20and%20guidance%2020100916.pdf [Accessed 24 June 2014].
Nursing and Midwifery Council (NMC), 2010b. Standards for pre-registration nursing education. Nursing and Midwifery Council: London. [Online] Available from: http://standards.nmc-uk.org/PublishedDocuments/Standards%20for%20pre-registration%20nursing%20education%2016082010.pdf [Accessed 24 June 2014].

Networks Issue 18, February 2015 29
Nursing and Midwifery Council (NMC), 2013. Quality assurance monitoring results 2012–2013. Nursing and Midwifery Council: London. [Online] Available from: http://www.nmc-uk.org/Documents/QualityAssurance/Monitoring_results_booklet_2012-2013.pdf [Accessed 24 June 2014].
Nursing and Midwifery Council (NMC), 2014a. NMC approved programme details. Nursing and Midwifery Council: London. [Online] Available from: http://www.nmc-uk.org/ApprovedProgrammeSearchResult?progid=1828 [Accessed 24 June 2014].
Nursing and Midwifery Council (NMC), 2014b. Registration with the NMC. Nursing and Midwifery Council: London. [Online] Available from: http://www.nmc-uk.org/Students/After-you-qualify/ [last accessed 24 June 2014].
An Evaluation of Videos used to Support Clinical Skills Teaching for Pre-registration Student Nurses

30 Networks Issue 18, February 2015
Networks Issue 18, February 2015 31
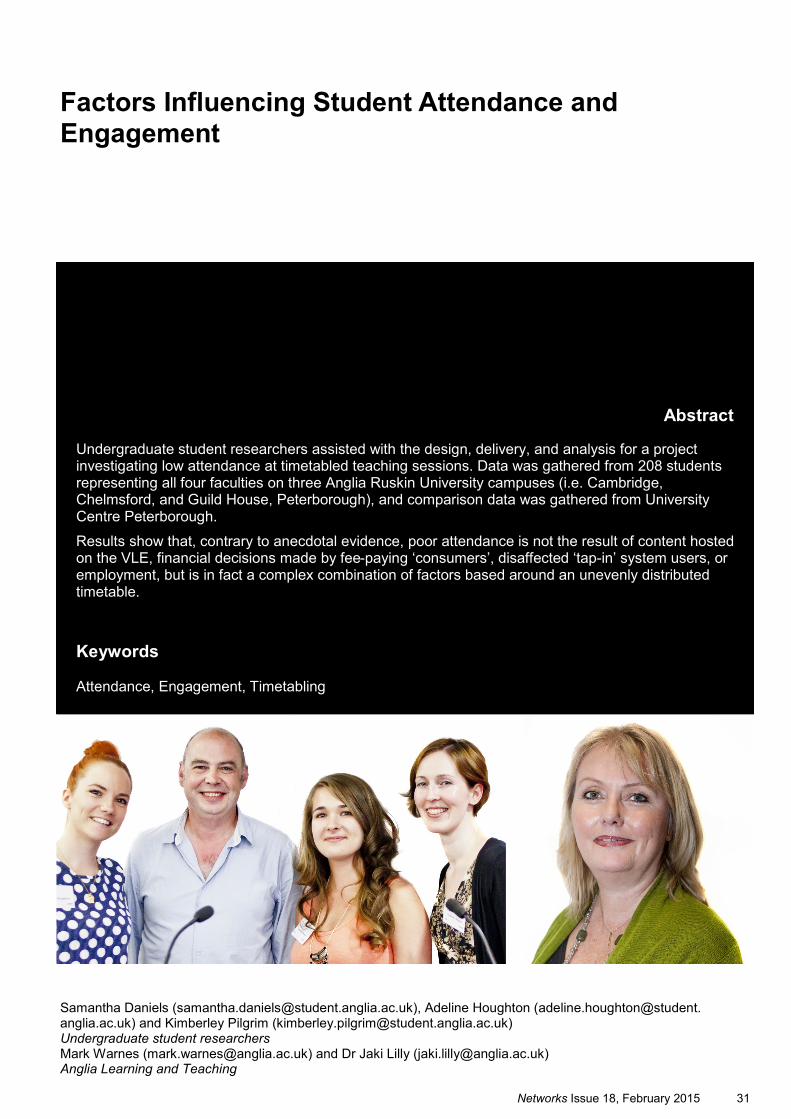
Factors Influencing Student Attendance and Engagement
Samantha Daniels ([email protected]), Adeline Houghton (adeline.houghton@student. anglia.ac.uk) and Kimberley Pilgrim ([email protected]) Undergraduate student researchers Mark Warnes ([email protected]) and Dr Jaki Lilly ([email protected]) Anglia Learning and Teaching
Abstract
Undergraduate student researchers assisted with the design, delivery, and analysis for a project investigating low attendance at timetabled teaching sessions. Data was gathered from 208 students representing all four faculties on three Anglia Ruskin University campuses (i.e. Cambridge, Chelmsford, and Guild House, Peterborough), and comparison data was gathered from University Centre Peterborough.
Results show that, contrary to anecdotal evidence, poor attendance is not the result of content hosted on the VLE, financial decisions made by fee-paying ‘consumers’, disaffected ‘tap-in’ system users, or employment, but is in fact a complex combination of factors based around an unevenly distributed timetable.
Keywords
Attendance, Engagement, Timetabling
32 Networks Issue 18, February 2015
Introduction
At numerous events held by Anglia Learning and Teaching in 2013-14 we were made aware of the perception that fewer students were attending taught sessions across all faculties. This drop in attendance coincided with several potential variables which might be expected to impact on student attendance including the introduction of the TAP system, higher student fees, and our greater emphasis on the use of the VLE. This research set out to establish whether these variables were affecting attendance, and also whether there were any other influences over which we might have some control.
With funding afforded by her University Teaching Fellowship, Dr Jaki Lilly decided to design a project which, she hoped, would facilitate honest feedback from students, by enlisting students as primary researchers. The project was also designed to offer the student researchers considerable experience in the research processes of research design, data collection and analysis, reporting and presenting with extensive support from Anglia Learning and Teaching.
During the course of the research we identified some differences in practice with regard to the management of student attendance, along with some inconsistencies in our messages to students about attendance. Some of the findings are concurrent with the extensive literature on student attendance and engagement but others provide some insight into the behaviour of our students, and what we might consider in order to improve attendance.
Current practice at Anglia Ruskin
A preliminary investigation was conducted into current practice regarding non-attendance at our University to avoid repeating any measures currently in place to identify reasons for non-attendance. This investigation revealed considerable variation between faculty approaches.
Attendance data is available via the Tap System and therefore can be used to contact students to determine the reasons for any non-attendance. One faculty has extensive and detailed records of contact attempts and follow-up action. Students are contacted three times and reasons for non-attendance are recorded from those students who respond. This has revealed that, in addition to issues relating to health and travel, students frequently attend a different seminar session to the one recorded on SITS:Vision, or have problems with lost or faulty ID cards.
Two other faculties keep similar records and make contact with students and keep records or responses, but these appear to be less focused and sophisticated than the process described above.
One faculty, however, only maintains summary records of absences at module level and makes no attempt to contact non-attenders. The reason given for this is that the lack of a clear policy on absenteeism, and the perceived reluctance of our University to consider absence as a disciplinary matter, means that intervention has no impact on student behaviour.
The Student Charter states the following:
Attendance
To make sure you get the most out of your course, we ask you to attend all timetabled lectures, seminars and other activities that are part of your course.
We will:
monitor your attendance at timetabled classes and contact you if you do not attend
start classes within two minutes of the scheduled time and teach for the full time of the class
reserve the right to refuse entry to students who are more than 10 minutes late for a class
stop timetabled sessions at 10 minutes to the hour so that you can arrive on time for your next class.
We will expect you to:
attend every session that is part of your course
Networks Issue 18, February 2015 33
prepare well and arrive on time for classes and stay for the whole of the teaching session. (Arriving late or leaving early is unprofessional, impolite and disrespectful to other students and members of staff)
not try to come into class if you are more than 10 minutes late
tap in and note that tapping in for others and tapping in, then leaving is not acceptable.
(2014: 9)
The first bullet point in the ‘We will’ section states clearly that our University will contact students who do not attend. Unlike the Student Charter, however, the ‘We will expect you to’ sections of the Student Charter for Distance Learning Students and the Student Charter for Research Students include the phrase, ‘report any unavoidable absences… as soon as possible’ (2014: 9).
The Rules, Regulations and Procedures for Students (17th Edition, July 2014) include the following entry:
1 Attending university
[…]
b You must attend all lectures and so on regularly and on time.
c If your behaviour, attendance or academic record is not satisfactory, we may take disciplinary action against you under our disciplinary procedure.
(2014: 7)
This treats unsatisfactory attendance as a disciplinary offence which can lead to expulsion.
The Academic Regulations (7th Edition, July 2014) include the following paragraphs:
(D) General Requirements for Students
3.37 To qualify for the conferment of an Anglia Ruskin award students must…
either
regularly attend those taught elements as may be prescribed in Student Handbooks and/or Module Guides (for modules delivered by standard delivery methods);
or
fulfil the learning requirements prescribed in Student Handbooks and/or Module Guides (for modules delivered by flexible and distributed learning including e-learning);
undertake and successfully complete in accordance with Section 6 of these Academic Regulations the assessment and, where applicable, re-assessment processes for the course for which they are registered and its associated modules;
satisfy the credit requirements of the course for which they are registered in terms of the volume and level of credit, as prescribed in the Academic Regulations;
have paid the appropriate tuition fees for their studies and met all their financial obligations to Anglia Ruskin University.
(2014: 41)
And,
(C) Student Responsibilities
5.6 Students have the following responsibilities:
to attend regularly those taught elements as may be prescribed in Student Handbooks and/or Module Guides published by the Faculty, unless sickness or other valid circumstances pertain;
(2014: 54)
Factors Influencing Student Attendance and Engagement
34 Networks Issue 18, February 2015
Thus, while the Student Charter instructs students to attend everything, both the Rules, Regulations and Procedures for Students and paragraph 5.6 of the Academic Regulations downgrade this requirement to ‘regular’ attendance, and paragraph 3.37 implies that attendance is optional providing students meet the learning outcomes, pass assignments, and pay their fees.
A review of attendance policies at other HEIs resulted in over 30 examples from the UK, the US, Canada, and Australia (see References: Websites). Apart from the University of Cambridge which ‘does not officially set rules on the hours of attendance’ (2013: online), the majority of institutions reviewed stated a minimum proportion of attendance with a range of penalties for absences without officially sanctioned reasons. The list of possible sanctions ranges from withholding marks and grades, to possible expulsion. The University of New South Wales, for example, states that, ‘If students attend less than eighty per cent of their possible classes they may be refused final assessment’ (2013: online). Similarly, the penalties stated by the Faculty of Arts and Social Sciences at the University of Sydney are:
Attendance below 80% of tutorials/seminars without written evidence of illness or misadventure may be penalised with loss of marks. Local conditions and penalties are publicised in unit of study outlines, or on the unit of study Blackboard site.
Attendance at less than 50% per cent of classes, regardless of the reasons for the absences, will automatically result in the student’s case being referred to a department examiners’ meeting. Non-attendance at 50% or more of classes without due cause is likely to result in a student receiving an Absent Fail grade for the unit of study (2013: online).
Attendance at most institutions reviewed is monitored, either manually or electronically, and students are contacted, generally via email, and action is escalated only in cases where students are unable or unwilling to provide a satisfactory explanation for their absence. The University of Bolton, for instance, advises that:
11. Sanctions in the event of non-attendance
Where a student’s attendance is unsatisfactory, one or more of the following actions may be taken.
This list is not exhaustive.
a. Seek an explanation from the student for their unsatisfactory attendance, discuss how their attendance must improve and recommend appropriate support.
b. Issue the student with a verbal or written warning about their attendance.
c. Require those students who fail to respond to warnings about their attendance to enter into a Formal Attendance Agreement…
d. Inform the student that Assessment Boards may take into account a student’s attendance in relation to progression and awards.
e. Advise the student that staff, when writing references, may take a student’s attendance into account.
f. Inform the student that a formal report on the student’s attendance may be made to the student’s sponsor including an employer and the Student Loan Company.
g. Inform an international student holding a Tier 4 visa that the University is required to notify the UKBA of withdrawal resulting from unsatisfactory attendance.
h. Inform an international student on a Tier 4 visa that attendance is taken into account when applying for a Confirmation of Acceptance of Studies (CAS)
i. Withdraw the student from their programme of study if they fail to respond to warnings or breach the terms of their Attendance Agreement.
(undated: online)
In the light of the approaches taken by other institutions, we may wish to consider the creation of consistent approach at an institutional level which includes:
Networks Issue 18, February 2015 35
a clear and unambiguous definition of the minimum acceptable level of attendance;
the introduction of a consistent approach to contacting absentees (when and how frequently); and
the introduction of a system of penalties to be administered by faculties on a student-specific basis depending on individual circumstances.
Aim of the project
A lack of systematic research into our students’ attendance has resulted in a number of speculations as to the cause of absence. Anecdotally, various explanations have been put forward by academic colleagues including:
the VLE is now so comprehensive that students feel that it is unnecessary to come to class;
the Tap system has de-personalised the relationship between students and lecturers so students do not feel a moral obligation to attend;
the prioritising of employment over study;
payment of fees resulting in students making financial decisions about attendance.
This project aimed to:
approach a wide variety of undergraduate students in order to gather qualitative, quantitative and demographic data from those who sometimes do not attend lectures;
engage students in actively reflecting on their experiences and motivations; with a view to participating in the improvement of service delivery and practice through policy change;
better understand the situations, experiences and motivations of students, in relation to attendance;
address anecdotal evidence from lecturers;
provide feedback via Anglia Learning and Teaching with recommendations for possible changes to increase student engagement and attendance.
Literature Review
A review of 140 journal articles spanning the period 1983 to 2012 revealed that educators have investigated the issue of student non-attendance at all levels of education (compulsory (Alexander, Entwisle, and Horsey, 1997), further (Longhurst, 1999), and higher education (Cleary-Holdforth, 2007)) and that this is a phenomenon that exists in a number of countries (including the UK (Bowen, Price, Lloyd and Thomas, 2005), the US (Westerman et al., 2011), Canada (Newman-Ford, Fitzgibbon, Lloyd and Thomas, 2008), Australia (Brew, Riley and Walta, 2009), Kuwait (Al-Shammari, 2012), Denmark (Bingley, Myrup Jensen and Walker, 2005), and so on), and disciplines (e.g. Medicine (Arcidiacono and Nicholson, 2005), Economics (Adair and Swinton, 2012), Computer Science (Barrington and Johnson, 2006), Engineering (Purcell, 2007)).
Many of these studies, however, focused on small or restricted samples, such as a group of students studying one subject, in one module, over the course of semester. In addition, many studies developed sophisticated statistical models and, while this information defines the nature and extent of the issue, statistics do not satisfactorily reveal the motivations for student behaviour. As Dolnicar (2005) points out, ‘[t]he procedure of averaging is likely to cover heterogeneity between individuals or like-minded groups of students thus not capturing the full picture’ (2005, p. 5).
In addition, many of the studies are constrained by narrow foci, such as a single faculty, a single subject, a single semester, a single module, and so on. This does not replicate the student experience at universities that operate a modular system under which a student, amongst other things, will:
Factors Influencing Student Attendance and Engagement
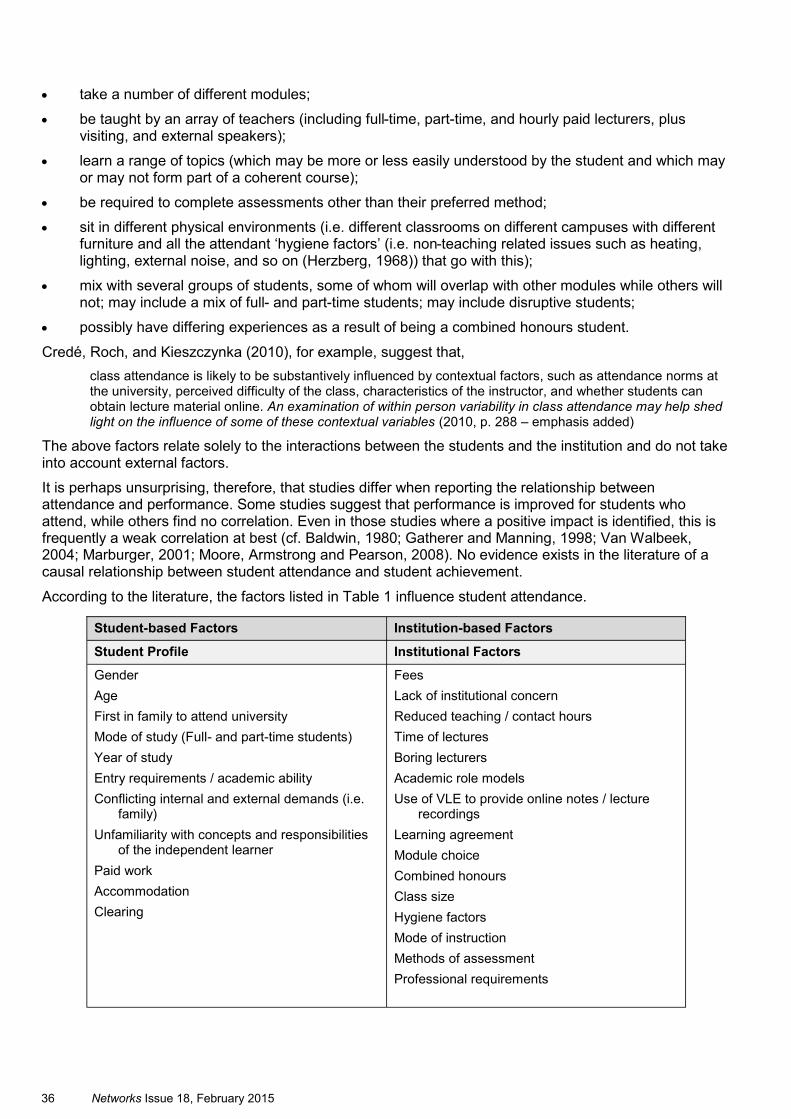
36 Networks Issue 18, February 2015
take a number of different modules;
be taught by an array of teachers (including full-time, part-time, and hourly paid lecturers, plus visiting, and external speakers);
learn a range of topics (which may be more or less easily understood by the student and which may or may not form part of a coherent course);
be required to complete assessments other than their preferred method;
sit in different physical environments (i.e. different classrooms on different campuses with different furniture and all the attendant ‘hygiene factors’ (i.e. non-teaching related issues such as heating, lighting, external noise, and so on (Herzberg, 1968)) that go with this);
mix with several groups of students, some of whom will overlap with other modules while others will not; may include a mix of full- and part-time students; may include disruptive students;
possibly have differing experiences as a result of being a combined honours student.
Credé, Roch, and Kieszczynka (2010), for example, suggest that,
class attendance is likely to be substantively influenced by contextual factors, such as attendance norms at the university, perceived difficulty of the class, characteristics of the instructor, and whether students can obtain lecture material online. An examination of within person variability in class attendance may help shed light on the influence of some of these contextual variables (2010, p. 288 – emphasis added)
The above factors relate solely to the interactions between the students and the institution and do not take into account external factors.
It is perhaps unsurprising, therefore, that studies differ when reporting the relationship between attendance and performance. Some studies suggest that performance is improved for students who attend, while others find no correlation. Even in those studies where a positive impact is identified, this is frequently a weak correlation at best (cf. Baldwin, 1980; Gatherer and Manning, 1998; Van Walbeek, 2004; Marburger, 2001; Moore, Armstrong and Pearson, 2008). No evidence exists in the literature of a causal relationship between student attendance and student achievement.
According to the literature, the factors listed in Table 1 influence student attendance.
Student-based Factors Institution-based Factors
Student Profile Institutional Factors
Gender
Age
First in family to attend university
Mode of study (Full- and part-time students)
Year of study
Entry requirements / academic ability
Conflicting internal and external demands (i.e. family)
Unfamiliarity with concepts and responsibilities of the independent learner
Paid work
Accommodation
Clearing
Fees
Lack of institutional concern
Reduced teaching / contact hours
Time of lectures
Boring lecturers
Academic role models
Use of VLE to provide online notes / lecture recordings
Learning agreement
Module choice
Combined honours
Class size
Hygiene factors
Mode of instruction
Methods of assessment
Professional requirements
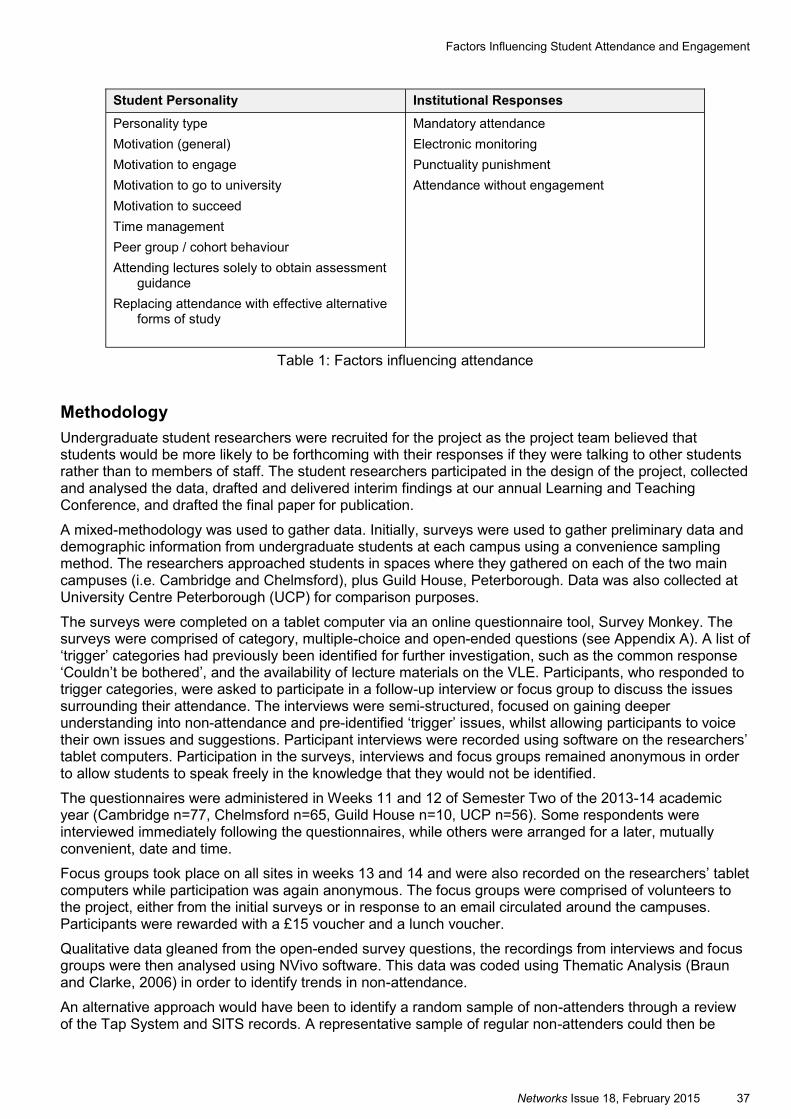
Networks Issue 18, February 2015 37
Table 1: Factors influencing attendance
Methodology
Undergraduate student researchers were recruited for the project as the project team believed that students would be more likely to be forthcoming with their responses if they were talking to other students rather than to members of staff. The student researchers participated in the design of the project, collected and analysed the data, drafted and delivered interim findings at our annual Learning and Teaching Conference, and drafted the final paper for publication.
A mixed-methodology was used to gather data. Initially, surveys were used to gather preliminary data and demographic information from undergraduate students at each campus using a convenience sampling method. The researchers approached students in spaces where they gathered on each of the two main campuses (i.e. Cambridge and Chelmsford), plus Guild House, Peterborough. Data was also collected at University Centre Peterborough (UCP) for comparison purposes.
The surveys were completed on a tablet computer via an online questionnaire tool, Survey Monkey. The surveys were comprised of category, multiple-choice and open-ended questions (see Appendix A). A list of ‘trigger’ categories had previously been identified for further investigation, such as the common response ‘Couldn’t be bothered’, and the availability of lecture materials on the VLE. Participants, who responded to trigger categories, were asked to participate in a follow-up interview or focus group to discuss the issues surrounding their attendance. The interviews were semi-structured, focused on gaining deeper understanding into non-attendance and pre-identified ‘trigger’ issues, whilst allowing participants to voice their own issues and suggestions. Participant interviews were recorded using software on the researchers’ tablet computers. Participation in the surveys, interviews and focus groups remained anonymous in order to allow students to speak freely in the knowledge that they would not be identified.
The questionnaires were administered in Weeks 11 and 12 of Semester Two of the 2013-14 academic year (Cambridge n=77, Chelmsford n=65, Guild House n=10, UCP n=56). Some respondents were interviewed immediately following the questionnaires, while others were arranged for a later, mutually convenient, date and time.
Focus groups took place on all sites in weeks 13 and 14 and were also recorded on the researchers’ tablet computers while participation was again anonymous. The focus groups were comprised of volunteers to the project, either from the initial surveys or in response to an email circulated around the campuses. Participants were rewarded with a £15 voucher and a lunch voucher.
Qualitative data gleaned from the open-ended survey questions, the recordings from interviews and focus groups were then analysed using NVivo software. This data was coded using Thematic Analysis (Braun and Clarke, 2006) in order to identify trends in non-attendance.
An alternative approach would have been to identify a random sample of non-attenders through a review of the Tap System and SITS records. A representative sample of regular non-attenders could then be
Student Personality Institutional Responses
Personality type
Motivation (general)
Motivation to engage
Motivation to go to university
Motivation to succeed
Time management
Peer group / cohort behaviour
Attending lectures solely to obtain assessment guidance
Replacing attendance with effective alternative forms of study
Mandatory attendance
Electronic monitoring
Punctuality punishment
Attendance without engagement
Factors Influencing Student Attendance and Engagement
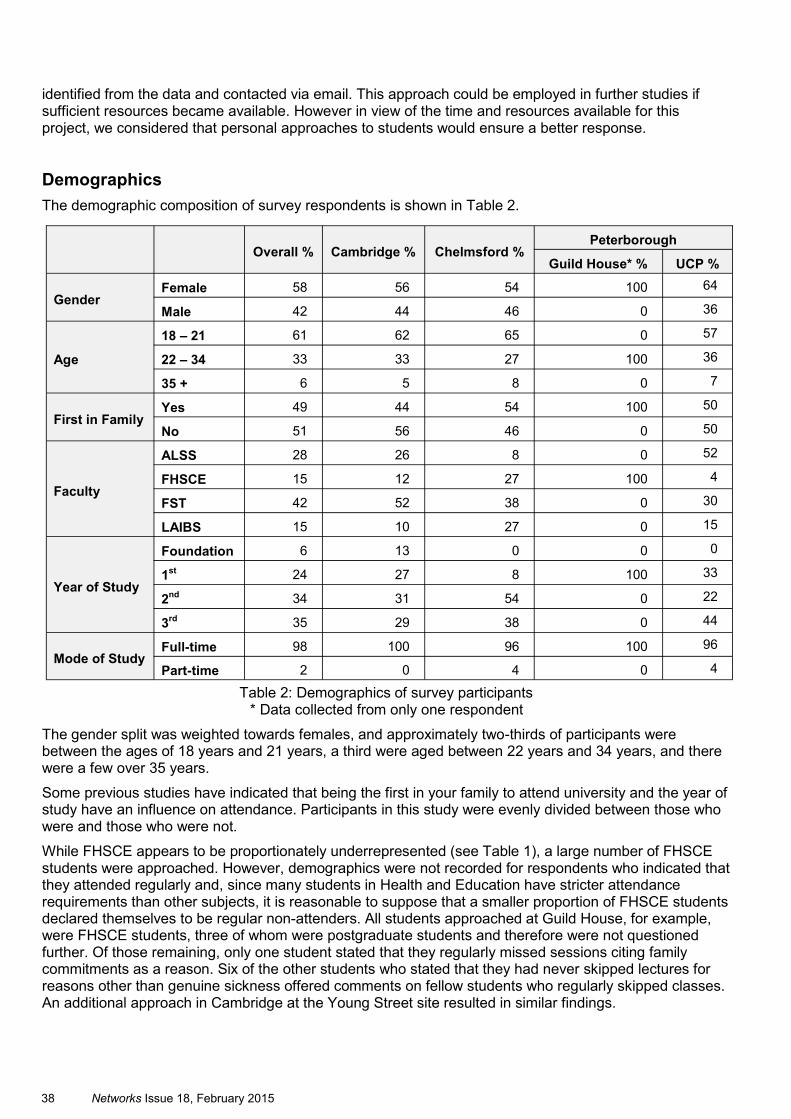
38 Networks Issue 18, February 2015
identified from the data and contacted via email. This approach could be employed in further studies if sufficient resources became available. However in view of the time and resources available for this project, we considered that personal approaches to students would ensure a better response.
Demographics
The demographic composition of survey respondents is shown in Table 2.
Table 2: Demographics of survey participants
* Data collected from only one respondent
The gender split was weighted towards females, and approximately two-thirds of participants were between the ages of 18 years and 21 years, a third were aged between 22 years and 34 years, and there were a few over 35 years.
Some previous studies have indicated that being the first in your family to attend university and the year of study have an influence on attendance. Participants in this study were evenly divided between those who were and those who were not.
While FHSCE appears to be proportionately underrepresented (see Table 1), a large number of FHSCE students were approached. However, demographics were not recorded for respondents who indicated that they attended regularly and, since many students in Health and Education have stricter attendance requirements than other subjects, it is reasonable to suppose that a smaller proportion of FHSCE students declared themselves to be regular non-attenders. All students approached at Guild House, for example, were FHSCE students, three of whom were postgraduate students and therefore were not questioned further. Of those remaining, only one student stated that they regularly missed sessions citing family commitments as a reason. Six of the other students who stated that they had never skipped lectures for reasons other than genuine sickness offered comments on fellow students who regularly skipped classes. An additional approach in Cambridge at the Young Street site resulted in similar findings.
Overall % Cambridge % Chelmsford % Peterborough
Guild House* % UCP %
Gender Female 58 56 54 100 64
Male 42 44 46 0 36
Age
18 – 21 61 62 65 0 57
22 – 34 33 33 27 100 36
35 + 6 5 8 0 7
First in Family Yes 49 44 54 100 50
No 51 56 46 0 50
Faculty
ALSS 28 26 8 0 52
FHSCE 15 12 27 100 4
FST 42 52 38 0 30
LAIBS 15 10 27 0 15
Year of Study
Foundation 6 13 0 0 0
1st
24 27 8 100 33
2nd 34 31 54 0 22
3rd
35 29 38 0 44
Mode of Study Full-time 98 100 96 100 96
Part-time 2 0 4 0 4
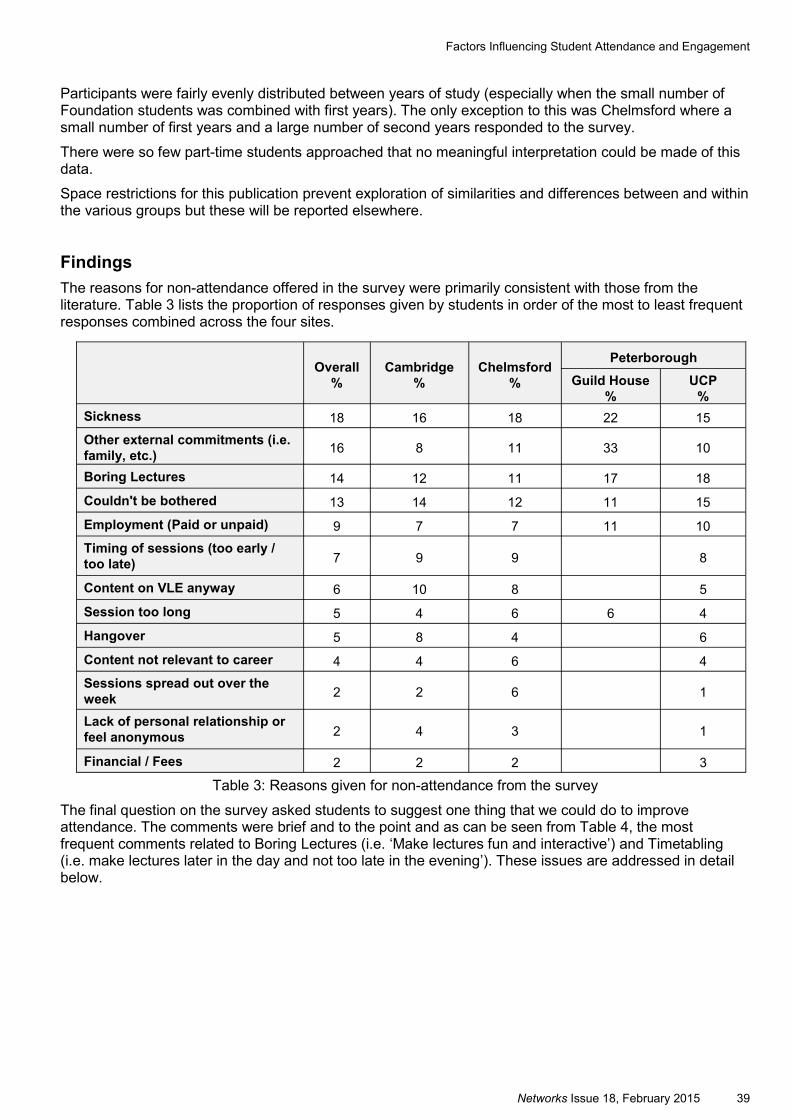
Networks Issue 18, February 2015 39
Participants were fairly evenly distributed between years of study (especially when the small number of Foundation students was combined with first years). The only exception to this was Chelmsford where a small number of first years and a large number of second years responded to the survey.
There were so few part-time students approached that no meaningful interpretation could be made of this data.
Space restrictions for this publication prevent exploration of similarities and differences between and within the various groups but these will be reported elsewhere.
Findings
The reasons for non-attendance offered in the survey were primarily consistent with those from the literature. Table 3 lists the proportion of responses given by students in order of the most to least frequent responses combined across the four sites.
Table 3: Reasons given for non-attendance from the survey
The final question on the survey asked students to suggest one thing that we could do to improve attendance. The comments were brief and to the point and as can be seen from Table 4, the most frequent comments related to Boring Lectures (i.e. ‘Make lectures fun and interactive’) and Timetabling (i.e. make lectures later in the day and not too late in the evening’). These issues are addressed in detail below.
Overall
%
Cambridge
%
Chelmsford
%
Peterborough
Guild House
%
UCP
%
Sickness 18 16 18 22 15
Other external commitments (i.e.
family, etc.) 16 8 11 33 10
Boring Lectures 14 12 11 17 18
Couldn't be bothered 13 14 12 11 15
Employment (Paid or unpaid) 9 7 7 11 10
Timing of sessions (too early /
too late) 7 9 9 8
Content on VLE anyway 6 10 8 5
Session too long 5 4 6 6 4
Hangover 5 8 4 6
Content not relevant to career 4 4 6 4
Sessions spread out over the
week 2 2 6 1
Lack of personal relationship or
feel anonymous 2 4 3 1
Financial / Fees 2 2 2 3
Factors Influencing Student Attendance and Engagement
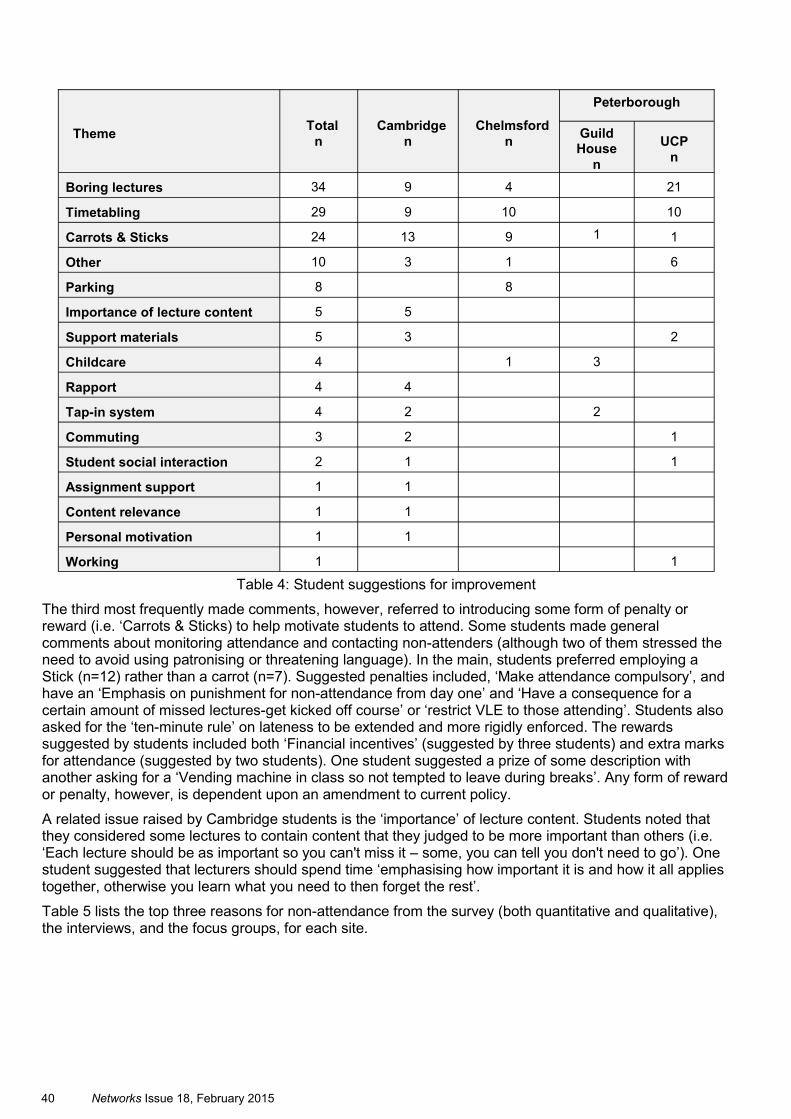
40 Networks Issue 18, February 2015
Table 4: Student suggestions for improvement
The third most frequently made comments, however, referred to introducing some form of penalty or reward (i.e. ‘Carrots & Sticks) to help motivate students to attend. Some students made general comments about monitoring attendance and contacting non-attenders (although two of them stressed the need to avoid using patronising or threatening language). In the main, students preferred employing a Stick (n=12) rather than a carrot (n=7). Suggested penalties included, ‘Make attendance compulsory’, and have an ‘Emphasis on punishment for non-attendance from day one’ and ‘Have a consequence for a certain amount of missed lectures-get kicked off course’ or ‘restrict VLE to those attending’. Students also asked for the ‘ten-minute rule’ on lateness to be extended and more rigidly enforced. The rewards suggested by students included both ‘Financial incentives’ (suggested by three students) and extra marks for attendance (suggested by two students). One student suggested a prize of some description with another asking for a ‘Vending machine in class so not tempted to leave during breaks’. Any form of reward or penalty, however, is dependent upon an amendment to current policy.
A related issue raised by Cambridge students is the ‘importance’ of lecture content. Students noted that they considered some lectures to contain content that they judged to be more important than others (i.e. ‘Each lecture should be as important so you can't miss it – some, you can tell you don't need to go’). One student suggested that lecturers should spend time ‘emphasising how important it is and how it all applies together, otherwise you learn what you need to then forget the rest’.
Table 5 lists the top three reasons for non-attendance from the survey (both quantitative and qualitative), the interviews, and the focus groups, for each site.
Theme Total
n
Cambridge
n
Peterborough
Chelmsford
n Guild House
n
UCP
n
Boring lectures 34 9 4 21
Timetabling 29 9 10 10
Carrots & Sticks 24 13 9 1 1
Other 10 3 1 6
Parking 8 8
Importance of lecture content 5 5
Support materials 5 3 2
Childcare 4 1 3
Rapport 4 4
Tap-in system 4 2 2
Commuting 3 2 1
Student social interaction 2 1 1
Assignment support 1 1
Content relevance 1 1
Personal motivation 1 1
Working 1 1
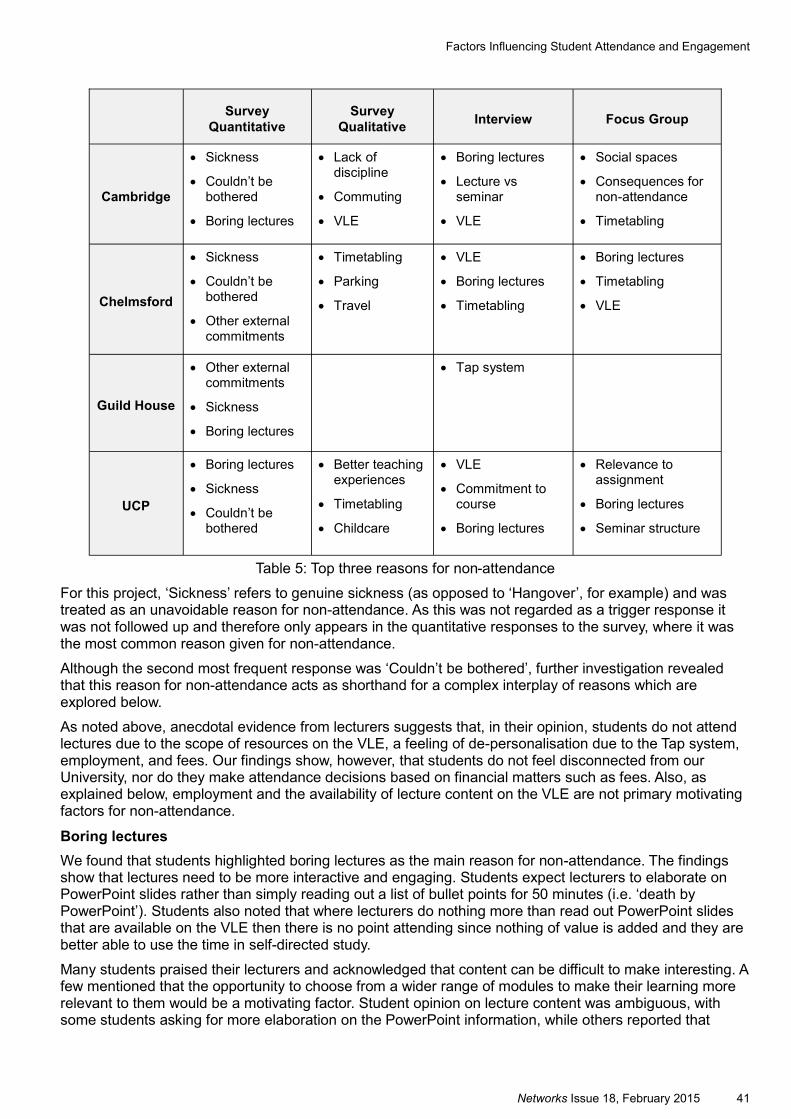
Networks Issue 18, February 2015 41
Table 5: Top three reasons for non-attendance
For this project, ‘Sickness’ refers to genuine sickness (as opposed to ‘Hangover’, for example) and was treated as an unavoidable reason for non-attendance. As this was not regarded as a trigger response it was not followed up and therefore only appears in the quantitative responses to the survey, where it was the most common reason given for non-attendance.
Although the second most frequent response was ‘Couldn’t be bothered’, further investigation revealed that this reason for non-attendance acts as shorthand for a complex interplay of reasons which are explored below.
As noted above, anecdotal evidence from lecturers suggests that, in their opinion, students do not attend lectures due to the scope of resources on the VLE, a feeling of de-personalisation due to the Tap system, employment, and fees. Our findings show, however, that students do not feel disconnected from our University, nor do they make attendance decisions based on financial matters such as fees. Also, as explained below, employment and the availability of lecture content on the VLE are not primary motivating factors for non-attendance.
Boring lectures
We found that students highlighted boring lectures as the main reason for non-attendance. The findings show that lectures need to be more interactive and engaging. Students expect lecturers to elaborate on PowerPoint slides rather than simply reading out a list of bullet points for 50 minutes (i.e. ‘death by PowerPoint’). Students also noted that where lecturers do nothing more than read out PowerPoint slides that are available on the VLE then there is no point attending since nothing of value is added and they are better able to use the time in self-directed study.
Many students praised their lecturers and acknowledged that content can be difficult to make interesting. A few mentioned that the opportunity to choose from a wider range of modules to make their learning more relevant to them would be a motivating factor. Student opinion on lecture content was ambiguous, with some students asking for more elaboration on the PowerPoint information, while others reported that
Survey
Quantitative
Survey
Qualitative Interview Focus Group
Cambridge
Sickness
Couldn’t be bothered
Boring lectures
Lack of discipline
Commuting
VLE
Boring lectures
Lecture vs seminar
VLE
Social spaces
Consequences for non-attendance
Timetabling
Chelmsford
Sickness
Couldn’t be bothered
Other external commitments
Timetabling
Parking
Travel
VLE
Boring lectures
Timetabling
Boring lectures
Timetabling
VLE
Guild House
Other external commitments
Sickness
Boring lectures
Tap system
UCP
Boring lectures
Sickness
Couldn’t be bothered
Better teaching experiences
Timetabling
Childcare
VLE
Commitment to course
Boring lectures
Relevance to assignment
Boring lectures
Seminar structure
Factors Influencing Student Attendance and Engagement
42 Networks Issue 18, February 2015
lecturers sometimes bring in too much additional content, going off track with information students see as ‘irrelevant’.
Often students reported not getting the full value of an hour lecture plus an hour seminar. Students felt that seminars should be properly structured and interactive, in order to practice applying the theory from the related lecture. Seminars were said to have generally low attendance, but were considered a better way of learning compared to lectures. They were found to offer the opportunity to interact and engage more easily with lecturers and fellow students.
Other related topics included:
Repeated information
Style of teaching
Relevance to course and/or assignments
Advantages of seminars (e.g. discussion of and contextualization of theory)
Employment
Students indicated that they try wherever possible to arrange work around timetabled teaching sessions and will work evenings and weekends as far as possible. However, while employment is not a primary factor for non-attendance, when faced with the choice between a full days’ pay or a one-hour lecture, students frequently have no alternative other than to work. This is particularly true where lecturers only read out hand-outs that are available on the VLE
In Cambridge some students work unsociable hours as the types of jobs available to them are often evening jobs such as working in bars, cinemas, or at the bowling alley, where shifts finish late. Students miss early morning lectures due to fatigue from working into the early hours.
Other external commitments
The factor ‘Other External commitments’ consists of commitments outside our University other than employment. External commitments highlighted by students included childcare, family commitments, and social engagements. This was an issue for students across all sites, and did not apply to specific faculties or subjects.
Childcare in particular was a commitment raised most often as contributing to non-attendance. Students with children need to be able to drop off and pick up their children from school or childcare and therefore find it difficult to attend sessions before 10am or after 4pm. Parents of both nursery- and school-aged children may require out of school or occasional childcare. Many students who had children of school age reported difficulties finding occasional Ofsted registered childcare during school holidays, when they do not coincide with university breaks. Childcare often needs to be booked in advance for set days and it is more expensive to arrange ad-hoc childcare. One student in Chelmsford, for example, explained that,
I need two to three hours maximum… my children are at school but have half-terms that we don’t have… I am unable to find Ofsted registered childcare that will do ten days a year.
A few students, however, reported that early lecture times put them off as they did not want to get up to attend an early lecture. Quite a number of students accepted that the responsibility for this was theirs, and that the ‘Couldn’t be bothered’ attitude was down to their own poor time management, sleeping patterns, and so on.
VLE
Availability of lecture content on the VLE does not directly affect student attendance. Students acknowledged that while it was helpful to be able to access the lecture notes on the VLE, they pointed out that there were other sources of obtaining lecture notes, either in the form of recordings or notes from friends, or direct from the lecturer. Students stated that the availability of lecture notes on the VLE made no difference to their decision whether to attend or not.
Students indicated that the VLE is not a sole or primary reason to skip sessions, but in fact acts as a safety net for those who are absent to ensure they are able to engage in the subject material.
Networks Issue 18, February 2015 43
Complexity
Many students expressed the view that a complex and interrelating set of factors influenced their attendance. Students’ decisions to attend taught sessions often involved the student weighing up the pros and cons of attending and comparing the value of attending against the cost. When students were presented with a choice between a one-hour lecture and a full day’s employment, for example, many chose employment.
Commuting and travel distance further added to the complex decision-making process. Some students felt that travel into university could be subsidised, through the provision of a mega-rider to get the bus or a discount on the Park and Ride service, or subsidised parking. Others felt that it was not worth making a long commute for a one-hour lecture, particularly when the lecturer did not expand on the notes available on the VLE.
This supports the view that there is a complex set of factors influencing a student’s decision whether to attend taught sessions, including employment, financial issues, travelling, and timetabling. This complex set of factors often led to a student feeling as though they could not be bothered to attend, resulting in the high occurrence of ‘Couldn’t be bothered’ responses in the survey.
Site-specific Factors
Cambridge
Social spaces
Students raised two issues relating to the provision of social spaces on the Cambridge campus. Firstly, a number of students noted a lack of provision of social spaces other than cafeterias making it difficult to meet new people.
Other students felt that, despite being subsidised, prices at the refectory remain expensive compared with local off-campus venues. Students noted that if they left the campus at lunch time they might choose not to return for afternoon lectures.
Employment
Employment was highlighted as an important factor affecting attendance which may be related to the high cost of living in Cambridge. As noted above, some students referred to working unsociable hours which affected their attendance the following morning.
Other students commented that shift-patterns often coincide with their scheduled lectures affecting their attendance, either the student prioritises a full shift’s wage over a one-hour scheduled lecture, or they feel forced to work in fear of losing their job if their employer demands that they attend their shift.
Chelmsford
Childcare
Childcare was a primary concern for students in Chelmsford, which may be related to the predominance of female students in Nursing and Education.
Travel
The attendance of participants in Chelmsford was more prominently affected by travel and parking issues when compared to the other sites. Students frequently reported restrictions on parking availability and the cost of parking as reasons for their absence.
Throughout the interviews and the focus group, students also discussed commuting, highlighting several issues, particularly problems with public transport (including Park-and-Ride), and driving in rush hour traffic.
However, these issues with parking and commuting were often linked to timetabling where, as noted elsewhere, students deemed it not worth travelling into campus for a one-hour lecture in the middle of the day.
Factors Influencing Student Attendance and Engagement
44 Networks Issue 18, February 2015
Peterborough
Childcare
As with Chelmsford, childcare was the most popular suggestion from students when it came to improving attendance, especially when combined with its availability on campus. It was noted that Guild House has no on-site childcare available at all, and the majority of students approached there cited this as something that could be offered to improve attendance.
Combined with UCP, childcare issues appeared to be more prominent in Peterborough than other campuses as a reason for non-attendance. This could be attributed to the large number of local students with young families.
Seminars
UCP students reported that felt that seminar attendance would improve if they were properly structured and lasted for the full duration of the timetabled session. While the Anglia Ruskin Student Charter, states that scheduled sessions will take place for the full duration of the class, some students complained that many sessions finished early.
While many comments from UCP students reflected the wider opinions of Anglia Ruskin students that lectures can sometimes be boring, they viewed seminars as being more interactive and engaging, allowing them to apply the theory learned in lectures and enhancing their learning experience.
The Tap System
Comments from Guild House students on the Tap System concerned a perceived penalisation of those students with genuine reasons for absence / lateness. Some students reported that if they are more than ten minutes late, they are automatically marked as absent for the entire session and have to make this time up. Therefore, if a student is running late for a genuine reason, the knowledge that they will be required to make this time up may deter them from coming in at all.
Students also pointed out that after being present for a couple of hours, they can leave early and not have to make the time up. It was suggested that a system which showed accumulated minutes, similar to flexible working systems, would be an improvement (i.e. tapping in and tapping out). UCP does not use the Tap System.
Key Factors Impacting on Student Attendance
Three key areas of concern that affect all sites were highlighted by students: Boring Lectures; Timetabling; and Childcare. In addition, provision of social spaces was a topic of concern for students in Cambridge, and parking caused problems for students in Chelmsford (although the extent to which these issues are experienced could be reduced by changes to timetabling).
Boring Lectures
Teaching styles were found to greatly influence student’s motivation to attend sessions. Therefore, we still have work to do in ensuring that all teaching staff use a more up to date, engaging and interactive style of delivery rather than simply reading out PowerPoint content that is available on the VLE. More interactive lecture styles that bring in student discussion to clarify points could increase attendance and motivation.
Lectures and seminars should be adequately planned and carried out in order to fill the allotted time on the timetable. In the case of seminars, students feel that a more structured session which allows the opportunity to apply the theory, clarification of the subject matter and active learning would improve attendance.
Timetabling
Timetabling is an issue that intersects with employment, childcare, and commuting in to university, and was the reason behind many of the ‘Couldn’t be bothered’ responses. Investigating the possibility of more accessible timetabling – such as consolidating sessions to full days – would make it easier for parents to attend, and for working students to arrange employment. This would also address the issues raised by those students who cited long commutes for short teaching sessions as being a problem.
Networks Issue 18, February 2015 45
Childcare
Childcare arrangements were of considerable concern to many respondents due to a variety of reasons. Whilst it is not possible for us to solve this issue by providing care facilities ourselves, an adjustment to timetabling may also aid this issue, as discussed above.
Social Spaces (Cambridge)
Students report that the lack of diversity on provision of social spaces and the cost of on-campus food and drink forces students off campus and they are then less likely to return for later sessions. Therefore, improving social areas and facilities could encourage students to stay on campus and aid the meeting of new people.
Parking (Chelmsford)
Parking is a significant issue for students on the Chelmsford campus and onsite parking has been suggested as an improvement which will aid attendance. Once again, this is not something we can provide, but perhaps we could investigate offering subsidised Park-and-Ride fares for students. Again, parking is a more prominent issue when combined with other factors such as timetabling.
Conclusion
Previous research on student attendance was mainly focused on single subjects and used statistical modelling to analyse student behaviour which suggested single cause explanations for non-attendance. This research attempted to delve deeper into, and understand the complexity of student non-attendance. Anecdotal evidence associating non-attendance with VLE content, employment, fees and the Tap system is not supported by the student voice. It is clear that students’ decisions for non-attendance are based on a complex set of inter-relating factors. Nevertheless, complexity notwithstanding, the most frequently cited reason for non-attendance is boring lectures, and fractured distribution of timetabled sessions is the underlying cause of non-attendance for many students.
Examination of various policy documents has revealed that Anglia Ruskin’s policy on attendance is unclear and there is disparity between faculties in the monitoring of student attendance. Clarification of expectations on students and the possible repercussions of non-attendance may also go some way to motivating students to attend.
References Adair, K. and Swinton, O. H., 2012, Lab Attendance and Academic Performance. International Scholarly Research Network, Vol. 2012. [Online] Available at: http://www.hindawi.com/journals/isrn/2012/364176/ [Accessed 23 June 2014].
Alexander, K. L., Entwisle, D. R. and Horsey, C. S., 1997. From first grade forward: Early foundations of high school dropout. Sociology of Education, Vol. 70, pp. 87-107. [Online] Available at: http://www.jstor.org/stable/2673158 [Accessed 23 June 2014].
Al-Shammari, Z., 2012. Benefits of Using Tested Attendance System to Enhance Student Attendance and Achievement in Higher Education. Journal of Advanced Social Research, Vol. 2, No.3, pp. 120-125. [Online] Available at: http://www.sign-ific-ance.co.uk/index.php/JASR/article/view/92 [Accessed 23 June 2014].
Anglia Ruskin University, 2014. Academic Regulations (7th Edition). [Online] Available at: http://web.anglia.ac.uk/anet/academic/public/academic_regs.pdf [Accessed on 9 October 2014].
Anglia Ruskin University, 2014. Rules, Regulations and Procedures for Students (17th Edition). [Online] Available at: http://web.anglia.ac.uk/anet/staff/sec_clerk/Documents/Student_Procedures/MASTERCOPY%20Rules%20and%20Regs%2017th%20Edition%20AUGUST%202014.pdf [Accessed 9 October 2014].
Anglia Ruskin University, 2014. Student Charter for Distance Learning Students. [Online] Available at: http://www.anglia.ac.uk/medianew/pdf/distance-learning-student-charter.pdf [Accessed 9 October 2014].
Factors Influencing Student Attendance and Engagement
46 Networks Issue 18, February 2015
Anglia Ruskin University, 2014. Student Charter for Research Students. [Online] Available at: http://www.anglia.ac.uk/medianew/pdf/research-student-charter.pdf [Accessed on 9 October 2014].
Anglia Ruskin University, 2014. Student Charter. [Online] Available at: http://www.anglia.ac.uk/medianew/pdf/student-charter.pdf [Accessed 9 October 2014].
Arcidiacono, P. and Nicholson, S., 2005. Peer Effects in Medical School. Journal of Public Economics, Vol. 89, pp. 327-350. [Online] Available at: http://www.nber.org/papers/w9025 [Accessed 23 June 2014].
Baldwin, B. A., 1980. On positioning the quiz: An empirical analysis. The Accounting Review, Vol. 55, No. 4, pp. 664–671.
Barrington, K. L. and Johnson, D., 2006. The Relationship between Lab Attendance and Academic Performance in a Computer Information Systems Course. Information Systems Education Journal, Vol. 4, No. 99, pp. 1-8. [Online] Available at: http://isedj.org/4/99/ [Accessed 23 June 2014].
Bingley, P., Myrup Jensen, V. and Walker, I., 2005. The Effects of School Resources on Participation in Post-Compulsory Education in Denmark, Aarhus University, mimeo. [Online] Available at: http://www.ifs.org.uk/publications/3407 [Accessed 23 June 2014].
Bowen, E., Price, T., Lloyd, S. and Thomas, S., 2005. Improving the quantity and quality of attendance data to enhance student retention. Journal of Further and Higher Education, Vol. 29, No. 4, pp. 375–385. [Online] Available at: http://www.tandfonline.com/doi/abs/10.1080/03098770500353714#.U6gjX5wVcm8 [Accessed 23 June 2014].
Braun, V. and Clarke, V., 2006. Using thematic analysis in psychology. Qualitative Research in Psychology, Vol. 3, No. 2, pp. 77-101 [Online] Available at: http://eprints.uwe.ac.uk/11735/2/thematic_analysis_revised....html#page=2&zoom=auto,-202,79 [Accessed 5 August 2014].
Brew, C., Riley, P. and Walta, C., 2009. Education Students and Their Teachers: Comparing Views on Participative Assessment. Assessment and Evaluation in Higher Education, Vol. 34, No. 6, pp. 641–657. [Online] Available at: http://www.tandfonline.com/doi/abs/10.1080/02602930802468567#.U6gjipwVcm8 [Accessed 23 June 2014].
Cleary-Holdforth, J., 2007. Student non-attendance in higher education: A phenomenon of student apathy or poor pedagogy? Level 3, Issue 5, [Online] Available at: http://level3.dit.ie/html/issue5/cleary-holdforth/cleary-holdforth_1.html [Accessed 3 December 2013].
Credé, M., Roch, S. G. and Kieszczynka, U. M., 2010. Class Attendance in College: A Meta-Analytic Review of the Relationship of Class Attendance With Grades and Student Characteristics. Review of Educational Research, Vol. 80, No. 2, pp. 272–295. [Online] Available at: http://rer.sagepub.com/content/80/2/272 [Accessed 23 June 2014].
Dolnicar, S., 2005. Should We Still Lecture or Just Post Examination Questions on the Web?: the nature of the shift towards pragmatism in undergraduate lecture attendance. Quality in Higher Education, Vol. 11, No. 2, pp. 103-115. [Online] Available at: http://ro.uow.edu.au/commpapers/299/ [Accessed 23 June 2014].
Gatherer, D. and Manning, C. R., 1998. Correlation of examination performance with lecture attendance: A comparative study of first year biological sciences undergraduates. Biochemical Education, Vol. 26, No. 2, pp. 121–131.
Herzberg, F., 1968. One More Time: How Do You Motivate Employees? Harvard Business Review, Vol. 46, No. 1, pp. 53–62.
Longhurst, R. J., 1999. Why aren’t they here? Student absenteeism in a further education college. Journal of Further and Higher Education, Vol. 23, No. 1, pp. 61–80. [Online] Available at: http://www.tandfonline.com/doi/abs/10.1080/0309877990230106#.U6gkC5wVcm8 [Accessed 23 June 2014].
Marburger, D. R., 2001. Absenteeism and undergraduate exam performance. Journal of Economic Education, Spring 99–109.
Networks Issue 18, February 2015 47
Moore, S., Armstrong, C. and Pearson, J., 2008. Lecture absenteeism among students in higher education: a valuable route to understanding student motivation. Journal of Higher Education Policy & Management, Vol. 30, No. 1, pp. 15-24. [Online] Available at: http://www.tandfonline.com/doi/abs/10.1080/13600800701457848#.U6gkMZwVcm8 [Accessed 23 June 2014].
Newman-Ford, L., Fitzgibbon, K., Lloyd, S. and Thomas, S., 2008. A large-scale investigation into the relationship between attendance and attainment: a study using an innovative, electronic attendance monitoring system. Studies in Higher Education, Vol. 33, No. 6, pp. 699-717. [Online] Available at: http://www.tandfonline.com/doi/abs/10.1080/03075070802457066#.U6gkWZwVcm8 [Accessed 23 June 2014].
Purcell, P., 2007. Engineering Student Attendance at Lectures: Effect on Examination Performance, Paper presented at International Conference on Engineering Education – ICEE 2007. [Online] Available at: http://www.ineer.org/events/icee2007/papers/107.pdf [Accessed 23 June 2014].
University of Bolton, Undated. Student Attendance Policy. [Online] Available at: http://www.bolton.ac.uk/Students/PoliciesProceduresRegulations/AllStudents/Documents/StudentAttendancePolicy.pdf [Accessed 23 June 2014].
University of Cambridge, 2013. Hours of Attendance and Holidays. [Online] Available at: http://www.admin.cam.ac.uk/students/studentregistry/current/graduate/policy/statutes/terms/#attendance [Accessed 2 December 2013].
University of New South Wales, 2013. Attendance and absence. [Online] Available at: https://my.unsw.edu.au/student/atoz/AttendanceAbsence.html [Accessed 2 December 2013].
University of Sydney, 2013. Attendance. [Online] Available at: http://sydney.edu.au/arts/current_students/attendance01.shtml [Accessed 2 December 2013].
Van Walbeek, C., 2004. Does lecture attendance matter? Some observations from a first year economics course at the University of Cape Town. South African Journal of Economics, Vol. 72, No. 4, pp. 861–883.
Westerman, J. W., Perez-Batres, L., Coffey, B. S. and Pouder, R. W., 2011. The Relationship Between Undergraduate Attendance and Performance Revisited: Alignment of Student and Instructor Goals. Decision Sciences Journal of Innovative Education, Vol. 9, No. 1, pp. 49-67. [Online] Available at: http://onlinelibrary.wiley.com/doi/10.1111/j.1540-4609.2010.00294.x/abstract [Accessed 23 June 2014].
Websites – University Attendance Policies
Aberystwyth University, 2013. Essential Information about Seminars and Attendance: Attendance at Level One Seminars and the Seminar Rota. [Online] Available at: http://www.aber.ac.uk/en/law-criminology/informationforcurrentstudents/partiundergraduates/seminarsandattendance/ [Accessed 29 November 2013].
Academy of Art University, 2007. Faculty Resources: Teaching Resources - Tip #7 Getting Students to Class: Improving Timely Attendance. [Online] Available at: http://faculty.academyart.edu/resource/tips/1254.html [Accessed 29 November 2013].
Aston University: Aston Business School, [undated]. Guideline procedure for dealing with cases of poor attendance. [Online] Available at: http://www1.aston.ac.uk/registry/for-staff/a-to-z-of-registry-services/attendance-monitoring-guidelines/ [Accessed 29 November 2013].
Bangor University, 2013. Monitoring of Student Attendance Policy Statement, [Online] Available at: http://www.bangor.ac.uk/ar/main/student-attendance.php.en?subid=0 [Accessed 29 November 2013].
City University London, [undated]. Attendance. [Online] Available at: http://www.city.ac.uk/student-administration/registration/attendance [Accessed 29 November 2013].
Indiana University – Purdue University Indianapolis (IUPUI), 2011. The Centre for Teaching & Learning: Tips for Improving Student Attendance. [Online] Available at: http://ctl.iupui.edu/Resources/Teaching-Strategies/Tips-for-Improving-Student-Attendance [Accessed 29 November 2013].
Factors Influencing Student Attendance and Engagement
48 Networks Issue 18, February 2015
Loughborough University, 2011. University Regulations: Regulation IX - Attendance Requirements and Failure to Attend. [Online] Available at: http://www.lboro.ac.uk/governance/regulations/9/current/ [Accessed 2 December 2013].
Middlesex University in London, [undated]. Attendance and withdrawal. [Online] Available at: http://unihub.mdx.ac.uk/study/attend/ [Accessed 29 November 2013].
Minnesota State University, Mankato, 2013. Class Attendance. [Online] Available at: http://www.mnsu.edu/cetl/teachingresources/articles/classattendance.html [Accessed 29 November 2013].
Sheffield Hallam University, [undated]. Attendance. [Online] Available at: https://students.shu.ac.uk/regulations/assessment/attendance.html [Accessed 29 November 2013].
Southampton Solent University, 2013. Student Attendance Statement. [Online] Available at: https://portal.solent.ac.uk/support/timetabling-and-rooming/attendance-monitoring/student-attendance-statement.aspx [Accessed 29 November 2013].
Swinburne College, 2013. Pathways Attendance and Academic Progress Policy: Attendance. [Online] Available at: http://www.swinburne.edu.au/college/current-students/policies/pathways-academic-progress-attendance.html [Accessed 29 November 2013].
University at Buffalo, 2013. Undergraduate Catalog 2013-14: Class Attendance. [Online] Available at: http://undergrad-catalog.buffalo.edu/policies/course/attendance.shtml [Accessed 2 December 2013].
University of Cambridge, 2013. Hours of Attendance and Holidays. [Online] Available at: http://www.admin.cam.ac.uk/students/studentregistry/current/graduate/policy/statutes/terms/#attendance [Accessed 2 December 2013].
University of Chicago Law School, [undated]. Class Attendance. [Online] Available at: http://www.law.uchicago.edu/students/handbook/academicmatters/attendance [Accessed 29 November 2013].
University of Derby, 2011. Attendance Monitoring. [Online] Available at: http://www.derby.ac.uk/attendance-monitoring [Accessed 29 November 2013] Links to Student Participation in Academic Regulations (3Rs) [Accessed 29 November 2013].
University of East Anglia, 2012. General Regulations for Students - 13. Attendance, Engagement and Progress. [Online] Available at: http://www.uea.ac.uk/calendar/section3/regs(gen)/gen-regs-for-students/13-attendance,-engagement-and-progress [Accessed 29 November 2013].
University of Exeter, [undated]. What is LISA (LIsts of Student Attendance)? [Online] Available at: http://as.exeter.ac.uk/it/systems/lisa/ [Accessed 29 November 2013].
University of Leicester, [undated]. Quick Guide to Student Responsibilities: Attendance / Neglect of academic obligations. [Online] Available at: http://www2.le.ac.uk/offices/sas2/regulations/responsibilities [Accessed 2 December 2013].
University of Nebraska–Lincoln, 2013. Class Attendance Policy. [Online] Available at: http://www.unl.edu/facultysenate/class-attendance-policy [Accessed 29 November 2013].
University of New South Wales, 2013. Attendance and absence. [Online] Available at: https://my.unsw.edu.au/student/atoz/AttendanceAbsence.html [Accessed 2 December 2013].
University of Reading, [undated]. Student Pages: Monitoring Attendance. [Online] Available at: http://www.reading.ac.uk/internal/student/OnlineStudentHandbook/osh-attendance.aspx [Accessed on 2 December 2013].
University of South Wales, [undated]. Attendance. [Online] Available at: http://unilife.southwales.ac.uk/pages/3106-attendance [Accessed 2 December 2013].
University of Sussex, 2013. Student Life Centre: Attendance. [Online] Available at: http://www.sussex.ac.uk/studentlifecentre/academic/attendance [Accessed 2 December 2013].
University of Sydney, 2013. Attendance. [Online] Available at: http://sydney.edu.au/arts/current_students/attendance01.shtml [Accessed 2 December 2013].
Networks Issue 18, February 2015 49
University of Warwick (Department of Economics), 2008. Class attendance: the impact on students' performance. [Online] Available at: http://www2.warwick.ac.uk/fac/soc/economics/research/centres/eri/bulletin/2007-08-2/ans/ [Accessed 2 December 2013].
University of Wisconsin-Eau Claire, 2013. Class Attendance and Authorized Absence Policies. [Online] Available at: http://www.uwec.edu/DOS/policies/attendance.htm [Accessed 2 December 2013].
Factors Influencing Student Attendance and Engagement
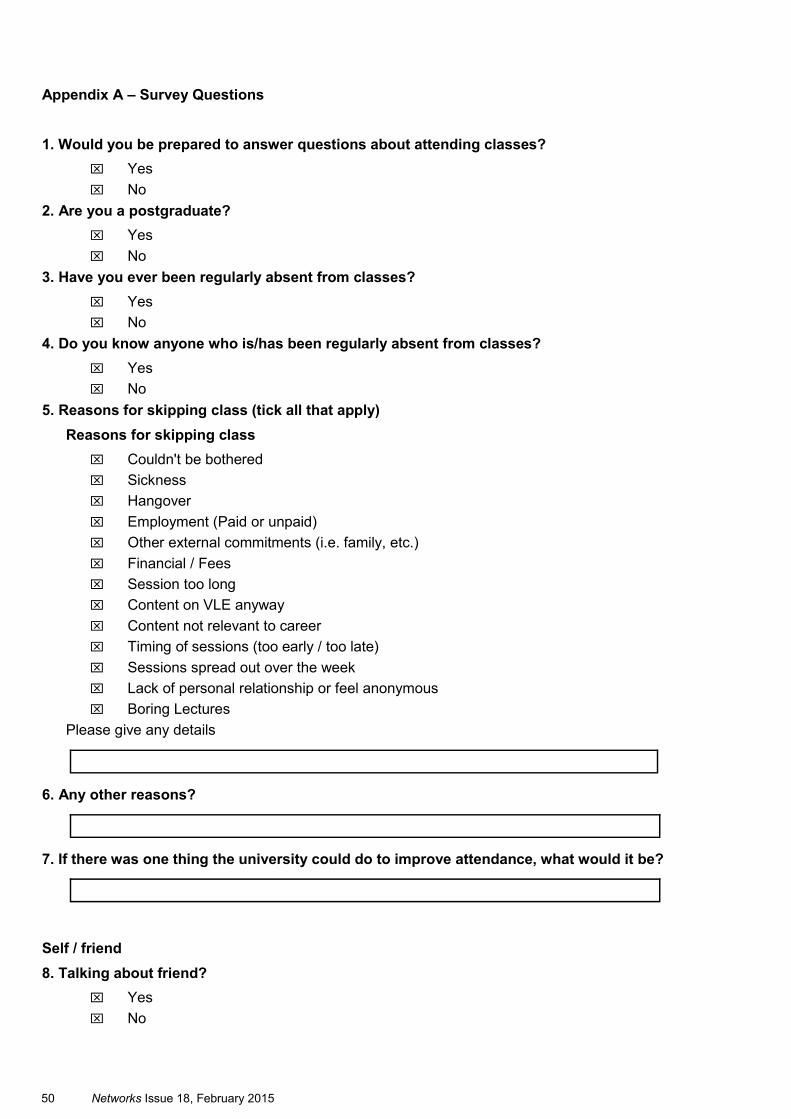
50 Networks Issue 18, February 2015
Appendix A – Survey Questions
1. Would you be prepared to answer questions about attending classes?
Yes
No
2. Are you a postgraduate?
Yes
No
3. Have you ever been regularly absent from classes?
Yes
No
4. Do you know anyone who is/has been regularly absent from classes?
Yes
No
5. Reasons for skipping class (tick all that apply)
Reasons for skipping class
Couldn't be bothered
Sickness
Hangover
Employment (Paid or unpaid)
Other external commitments (i.e. family, etc.)
Financial / Fees
Session too long
Content on VLE anyway
Content not relevant to career
Timing of sessions (too early / too late)
Sessions spread out over the week
Lack of personal relationship or feel anonymous
Boring Lectures
Please give any details
6. Any other reasons?
7. If there was one thing the university could do to improve attendance, what would it be?
Self / friend
8. Talking about friend?
Yes
No
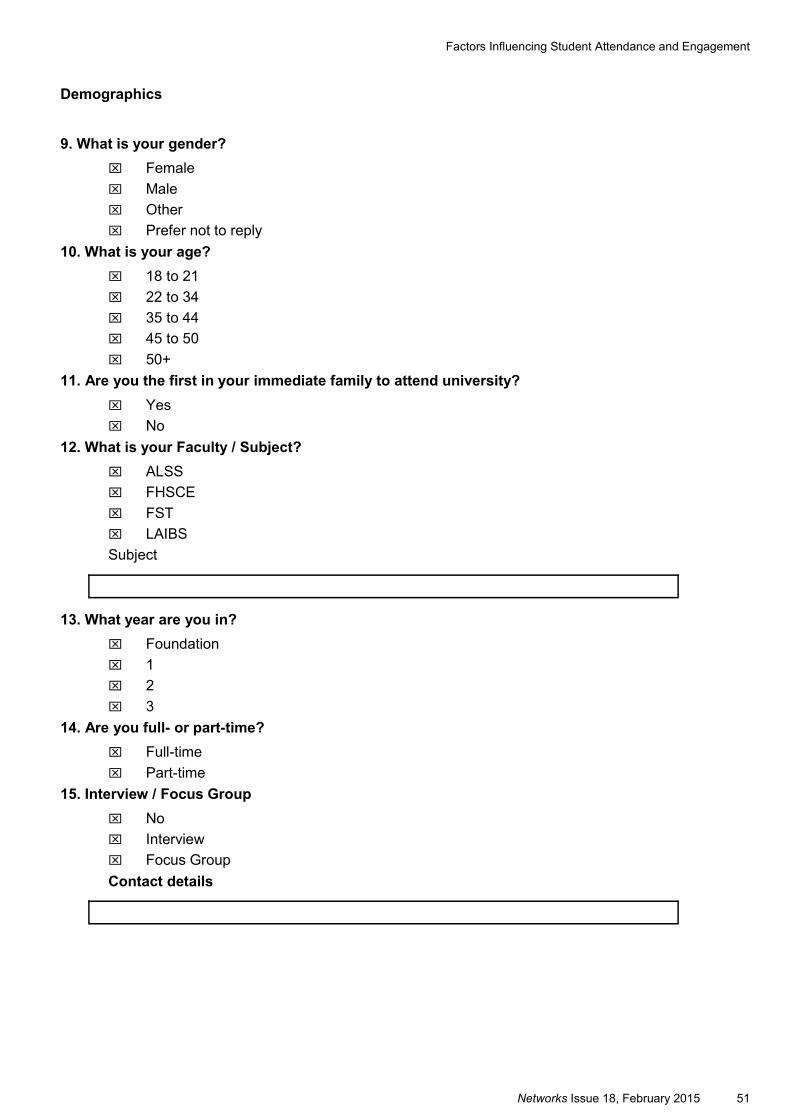
Networks Issue 18, February 2015 51
Demographics
9. What is your gender?
Female
Male
Other
Prefer not to reply
10. What is your age?
18 to 21
22 to 34
35 to 44
45 to 50
50+
11. Are you the first in your immediate family to attend university?
Yes
No
12. What is your Faculty / Subject?
ALSS
FHSCE
FST
LAIBS
Subject
13. What year are you in?
Foundation
1
2
3
14. Are you full- or part-time?
Full-time
Part-time
15. Interview / Focus Group
No
Interview
Focus Group
Contact details
Factors Influencing Student Attendance and Engagement
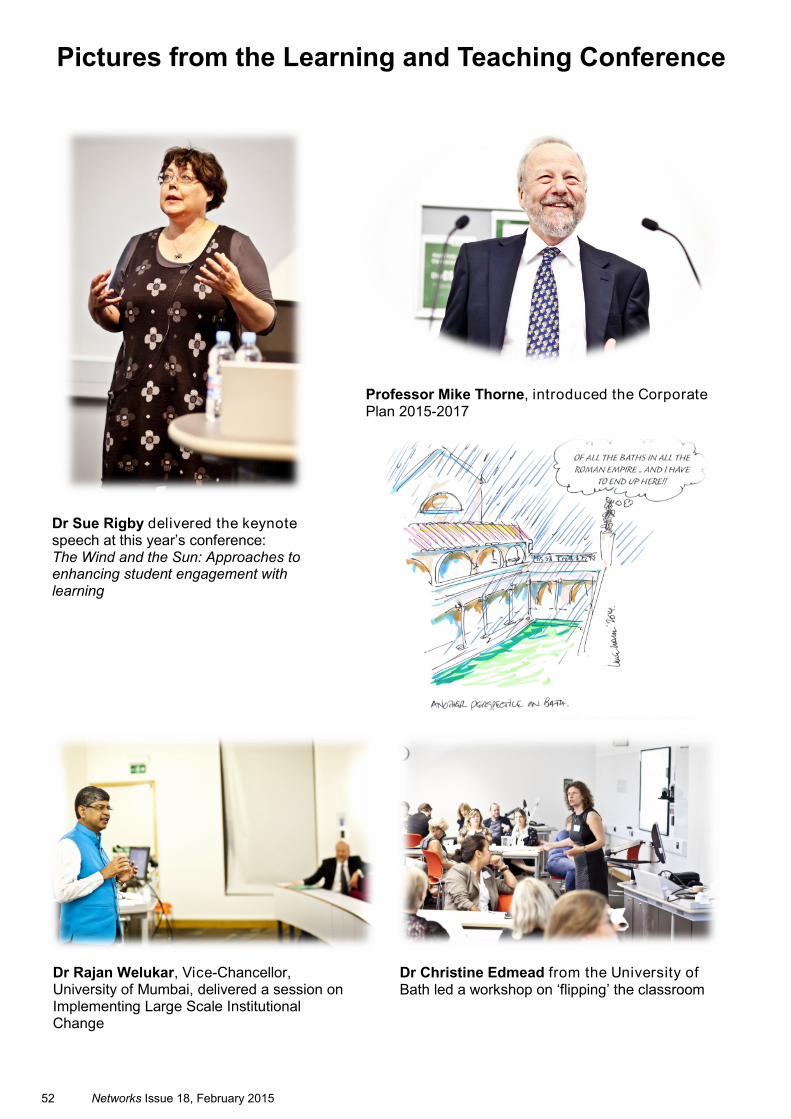
52 Networks Issue 18, February 2015
Professor Mike Thorne, introduced the Corporate Plan 2015-2017
Dr Sue Rigby delivered the keynote speech at this year’s conference: The Wind and the Sun: Approaches to enhancing student engagement with learning
Dr Rajan Welukar, Vice-Chancellor, University of Mumbai, delivered a session on Implementing Large Scale Institutional Change
Dr Christine Edmead from the University of Bath led a workshop on ‘flipping’ the classroom
Pictures from the Learning and Teaching Conference

Networks Issue 18, February 2015 53
University Teaching Fellows 2014 (left to right): Sian Shaw (left), Patricia Turnbull (right), and Andrew Smith (not pictured) with Dr Debbie Holley (National Teaching Fellow)
Vice Chancellor’s Awards Winners 2014 (Left to Right): The Criminology Team, Jill Smit, the Get IT Started Team, the Mobile App Team (Highly Commended), and Peter Barwick (kneeling)
Dr Phil Newton of Swansea University whose workshop explored how we can use assessment design to limit the influence of essay-writing services
Dr Mark J. P. Kerrigan delivering one of his
three conference sessions
Multiple devices in action during the keynote presentation

54 Networks Issue 18, February 2015
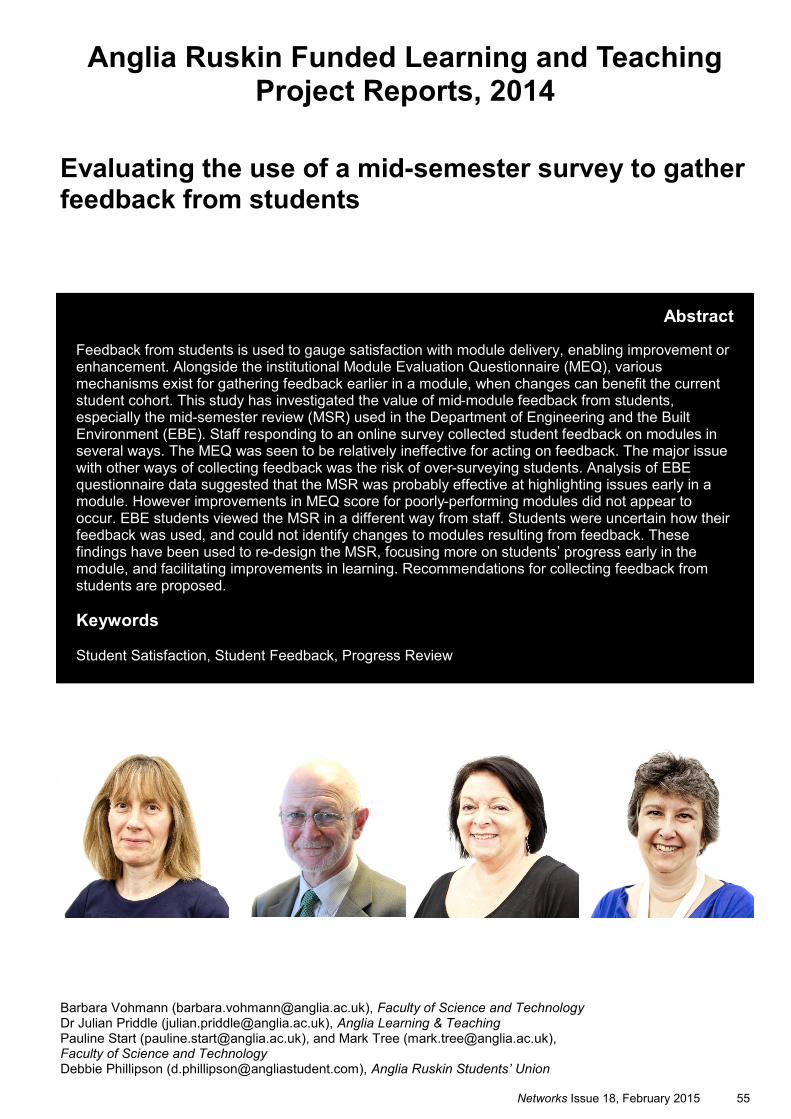
Networks Issue 18, February 2015 55
Evaluating the use of a mid-semester survey to gather feedback from students
Anglia Ruskin Funded Learning and Teaching Project Reports, 2014
Barbara Vohmann ([email protected]), Faculty of Science and Technology Dr Julian Priddle ([email protected]), Anglia Learning & Teaching Pauline Start ([email protected]), and Mark Tree ([email protected]), Faculty of Science and Technology Debbie Phillipson ([email protected]), Anglia Ruskin Students’ Union
Abstract
Feedback from students is used to gauge satisfaction with module delivery, enabling improvement or enhancement. Alongside the institutional Module Evaluation Questionnaire (MEQ), various mechanisms exist for gathering feedback earlier in a module, when changes can benefit the current student cohort. This study has investigated the value of mid-module feedback from students, especially the mid-semester review (MSR) used in the Department of Engineering and the Built Environment (EBE). Staff responding to an online survey collected student feedback on modules in several ways. The MEQ was seen to be relatively ineffective for acting on feedback. The major issue with other ways of collecting feedback was the risk of over-surveying students. Analysis of EBE questionnaire data suggested that the MSR was probably effective at highlighting issues early in a module. However improvements in MEQ score for poorly-performing modules did not appear to occur. EBE students viewed the MSR in a different way from staff. Students were uncertain how their feedback was used, and could not identify changes to modules resulting from feedback. These findings have been used to re-design the MSR, focusing more on students’ progress early in the module, and facilitating improvements in learning. Recommendations for collecting feedback from students are proposed.
Keywords
Student Satisfaction, Student Feedback, Progress Review
56 Networks Issue 18, February 2015
Background and Introduction
Student satisfaction is important for universities, not only as a way to ensure that current students are content with their university experience, and thus that the university is ‘doing things right’, but also as a major determinant of the university’s position in various public rankings that will influence the choices of future students (cf. Chen and Hoshower, 2003). Feedback is obtained from students through a range of methods (Ardalan et al., 2007; Alhija and Fresko, 2009), some of which are managed externally (such as the National Student Survey – NSS); some of which are managed institutionally (such as the Anglia Ruskin Student Experience Survey – SES) and some of which are more localised or informal.
Most public-facing satisfaction data relate to courses (Ashby et al., 2011), whilst student satisfaction with individual modules is assessed and disseminated within institutions. Anglia Ruskin uses a Module Evaluation Questionnaire (MEQ) which is administered for each separate delivery (occurrence) of a module, irrespective of level or location. The MEQ is provided to students towards the end of the semester (currently weeks 9-10 for paper-based forms), which allows students to express opinions on most if not all aspects of the module.
As well as providing feedback, students wish to feel that their views are acted upon, and that appropriate improvement or enhancement occurs as a result. Yet, in 2012, for example, only slightly over half of our students agreed with question 8.1 on the SES that, ‘The feedback I give about my experience of Anglia Ruskin is listened to seriously’.
As a tool for improvement or enhancement, the MEQ has both strengths and drawbacks. The major issue is timing, which needs to be a compromise between ensuring that students have experienced enough of the module to make a judgement on all main aspects (pointing to a late enrolment), and ensuring that student feedback can be acted upon (pointing to an early enrolment). The current MEQ process is based on late enrolment, with the consequence that student feedback is more likely to be acted upon for the subsequent delivery of the module rather than for current delivery, and institutional processes for enhancement at the module level reflect this.
Several individual staff, and some courses or departments, use other methods to collect feedback from students on their modules. These are intended to collect feedback that can be used more responsively, and thus improve the experience of the students providing the feedback. The current project examined the use of various tools for collecting feedback from students during modules, and in particular focused on the Mid-Semester Review (MSR), which has been administered for all modules and for several years by the Department of Engineering and the Built Environment (EBE) in the Faculty of Science and Technology (FST).
Existing Practice
Data on feedback tools were collected through discussion with key stakeholders such as Learning Technologists, faculty Directors of Learning and Teaching, and selected teaching staff, as well as through information published on e-mail lists such as the Association for Learning Technology. Findings indicate that feedback is collected across our University from students in a number of ways.
Institutional Surveys
Anglia Ruskin uses a range of surveys to collect feedback from students in a standardised way that can be compared longitudinally and from course to course:
Internal
National Student Survey (NSS)
Student Evaluation Survey (SES)
Module Evaluation Questionnaires (MEQs)
External
International Student Barometer and Student Barometer
Postgraduate Research Experience Survey
Networks Issue 18, February 2015 57
All surveys, irrespective of whether they are administered by our University or externally, can be vulnerable to bias. Douglas et al. (2015) question whether students have a uniform understanding of ‘value’ terms in the NSS, such as ‘prompt’ or ‘clear’. Chen and Hoshower (2003) note that student responses will vary depending on their motivation for completing a survey, whilst Douglas et al. (2009) point out the contrast between students’ satisfaction and their personal perception of importance in different survey areas.
In addition, student representatives (‘reps’) are elected for year-groups in courses and at faculty level. Course reps are typically involved in formal feedback fora, especially Course Management Meetings, where they represent the views of their fellow students. Minutes are taken at these meetings, and actions arise from issues raised by reps. Reps may also have more informal interactions with teaching staff, including discussions with senior management.
Personal consultation
All students have opportunities to express their views on their modules and courses to various members of staff (cf. Anglia Ruskin University, 2014), including:
The module leader or tutor
The course leader, course group leader or head of department
Their personal tutor
A student adviser
The way in which these views are acted on differs between contact points, and from course to course. In most cases, there is no formal mechanism to record feedback and resulting actions.
‘Tell us’ and ‘You said, we did’
Anglia Ruskin invites students to ‘Tell us’ their comments on a variety of topics, either through an online form or via e-mail. Responses to these issues are then fed back to students via our University website as ‘You said, we did’ pages, and in printed materials.
Non-institutional feedback mechanisms
Whilst the mechanisms described in the previous section are available to all students across all courses, most staff are proactive in seeking feedback from their students in other ways. These range from simple informal conversations to structured feedback tools. These include:
Direct dialogue with individual students
Dialogue in personal tutorials
Dialogue with reps
Asking questions of students during classroom sessions
Survey or questionnaire administered at a specific point in a module
‘Always open’ feedback tools, such as a suggestion box, online discussion or ‘stickies’ (online equivalent of ‘post it’ notes)
In-class online polling tools, such as Poll Everywhere
In-class questions
For class-taught modules, the use of questions in class allows for an immediate and responsive feedback from students. They may be used to explore understanding of specific topics, or more general aspects of the module or course.
Some students may be reluctant to express opinions in class, and in large classes it is easy for students to abstain. Those who are experiencing difficulties may be those least likely to express a view. This means that ‘show of hands’ polling in class may fail to provide representative data, and specifically may fail those students who need help.
Evaluating the use of a mid-semester survey to gather feedback from students
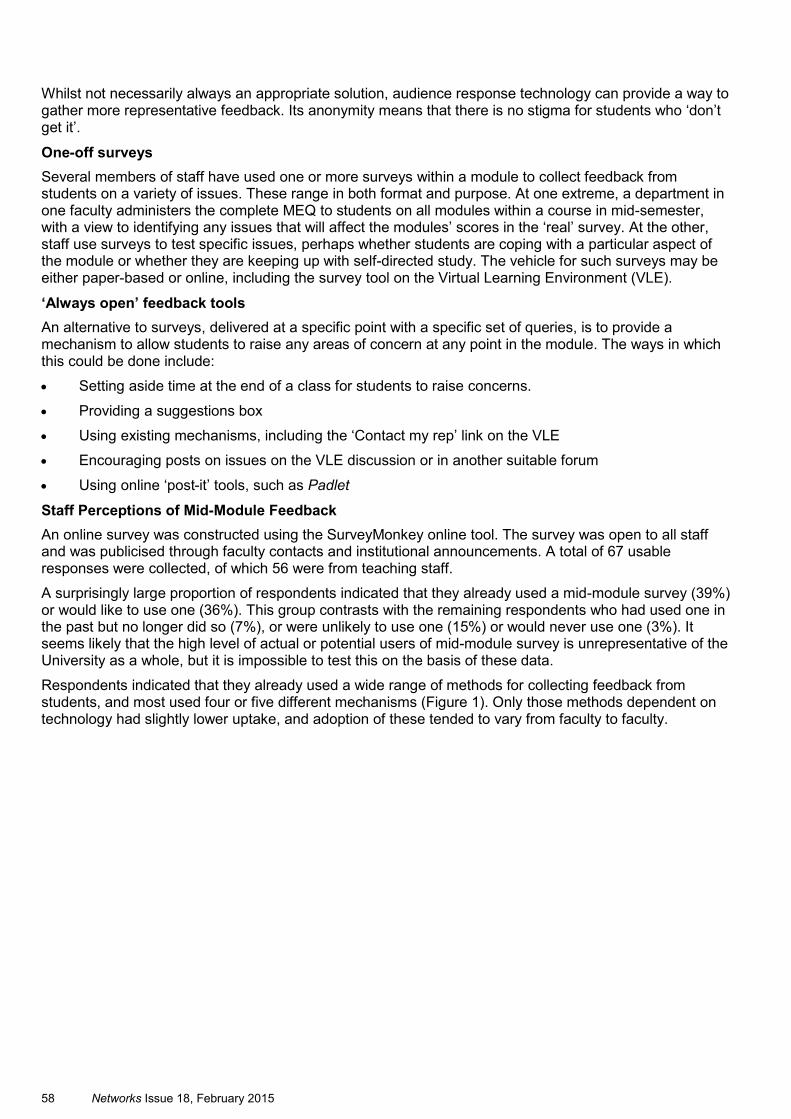
58 Networks Issue 18, February 2015
Whilst not necessarily always an appropriate solution, audience response technology can provide a way to gather more representative feedback. Its anonymity means that there is no stigma for students who ‘don’t get it’.
One-off surveys
Several members of staff have used one or more surveys within a module to collect feedback from students on a variety of issues. These range in both format and purpose. At one extreme, a department in one faculty administers the complete MEQ to students on all modules within a course in mid-semester, with a view to identifying any issues that will affect the modules’ scores in the ‘real’ survey. At the other, staff use surveys to test specific issues, perhaps whether students are coping with a particular aspect of the module or whether they are keeping up with self-directed study. The vehicle for such surveys may be either paper-based or online, including the survey tool on the Virtual Learning Environment (VLE).
‘Always open’ feedback tools
An alternative to surveys, delivered at a specific point with a specific set of queries, is to provide a mechanism to allow students to raise any areas of concern at any point in the module. The ways in which this could be done include:
Setting aside time at the end of a class for students to raise concerns.
Providing a suggestions box
Using existing mechanisms, including the ‘Contact my rep’ link on the VLE
Encouraging posts on issues on the VLE discussion or in another suitable forum
Using online ‘post-it’ tools, such as Padlet
Staff Perceptions of Mid-Module Feedback
An online survey was constructed using the SurveyMonkey online tool. The survey was open to all staff and was publicised through faculty contacts and institutional announcements. A total of 67 usable responses were collected, of which 56 were from teaching staff.
A surprisingly large proportion of respondents indicated that they already used a mid-module survey (39%) or would like to use one (36%). This group contrasts with the remaining respondents who had used one in the past but no longer did so (7%), or were unlikely to use one (15%) or would never use one (3%). It seems likely that the high level of actual or potential users of mid-module survey is unrepresentative of the University as a whole, but it is impossible to test this on the basis of these data.
Respondents indicated that they already used a wide range of methods for collecting feedback from students, and most used four or five different mechanisms (Figure 1). Only those methods dependent on technology had slightly lower uptake, and adoption of these tended to vary from faculty to faculty.
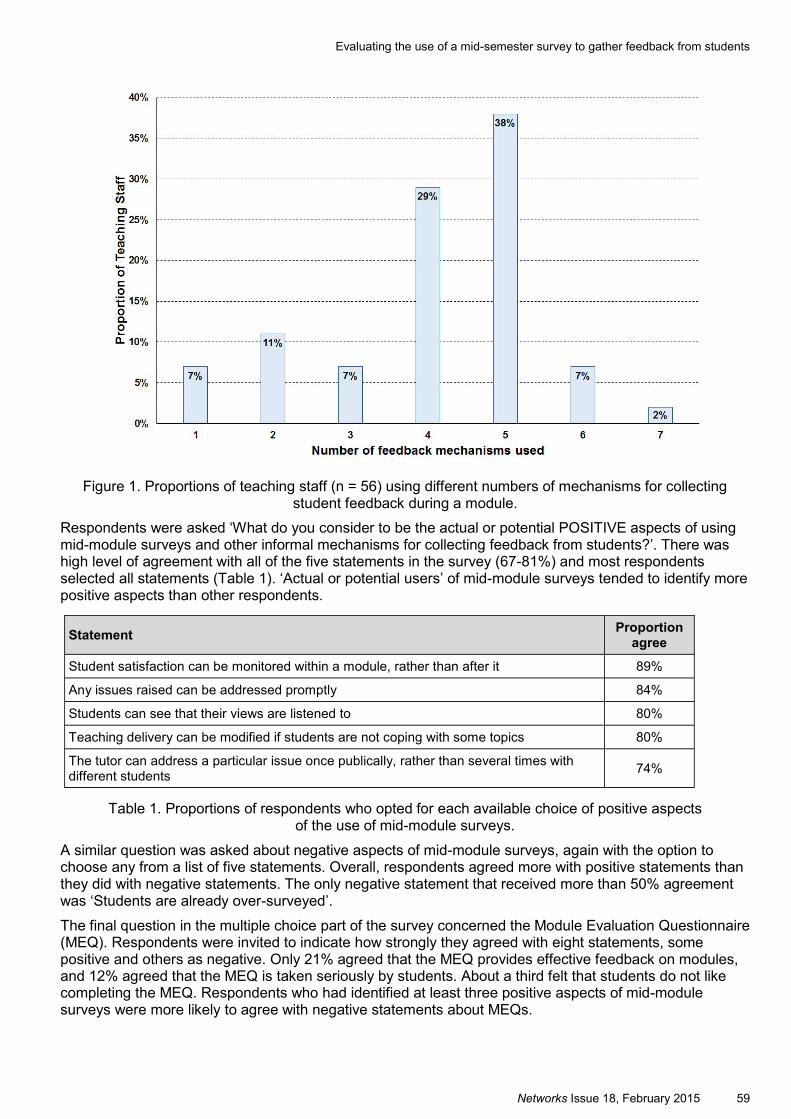
Networks Issue 18, February 2015 59
Figure 1. Proportions of teaching staff (n = 56) using different numbers of mechanisms for collecting student feedback during a module.
Respondents were asked ‘What do you consider to be the actual or potential POSITIVE aspects of using mid-module surveys and other informal mechanisms for collecting feedback from students?’. There was high level of agreement with all of the five statements in the survey (67-81%) and most respondents selected all statements (Table 1). ‘Actual or potential users’ of mid-module surveys tended to identify more positive aspects than other respondents.
Table 1. Proportions of respondents who opted for each available choice of positive aspects of the use of mid-module surveys.
A similar question was asked about negative aspects of mid-module surveys, again with the option to choose any from a list of five statements. Overall, respondents agreed more with positive statements than they did with negative statements. The only negative statement that received more than 50% agreement was ‘Students are already over-surveyed’.
The final question in the multiple choice part of the survey concerned the Module Evaluation Questionnaire (MEQ). Respondents were invited to indicate how strongly they agreed with eight statements, some positive and others as negative. Only 21% agreed that the MEQ provides effective feedback on modules, and 12% agreed that the MEQ is taken seriously by students. About a third felt that students do not like completing the MEQ. Respondents who had identified at least three positive aspects of mid-module surveys were more likely to agree with negative statements about MEQs.
Statement Proportion
agree
Student satisfaction can be monitored within a module, rather than after it 89%
Any issues raised can be addressed promptly 84%
Students can see that their views are listened to 80%
Teaching delivery can be modified if students are not coping with some topics 80%
The tutor can address a particular issue once publically, rather than several times with different students
74%
Evaluating the use of a mid-semester survey to gather feedback from students
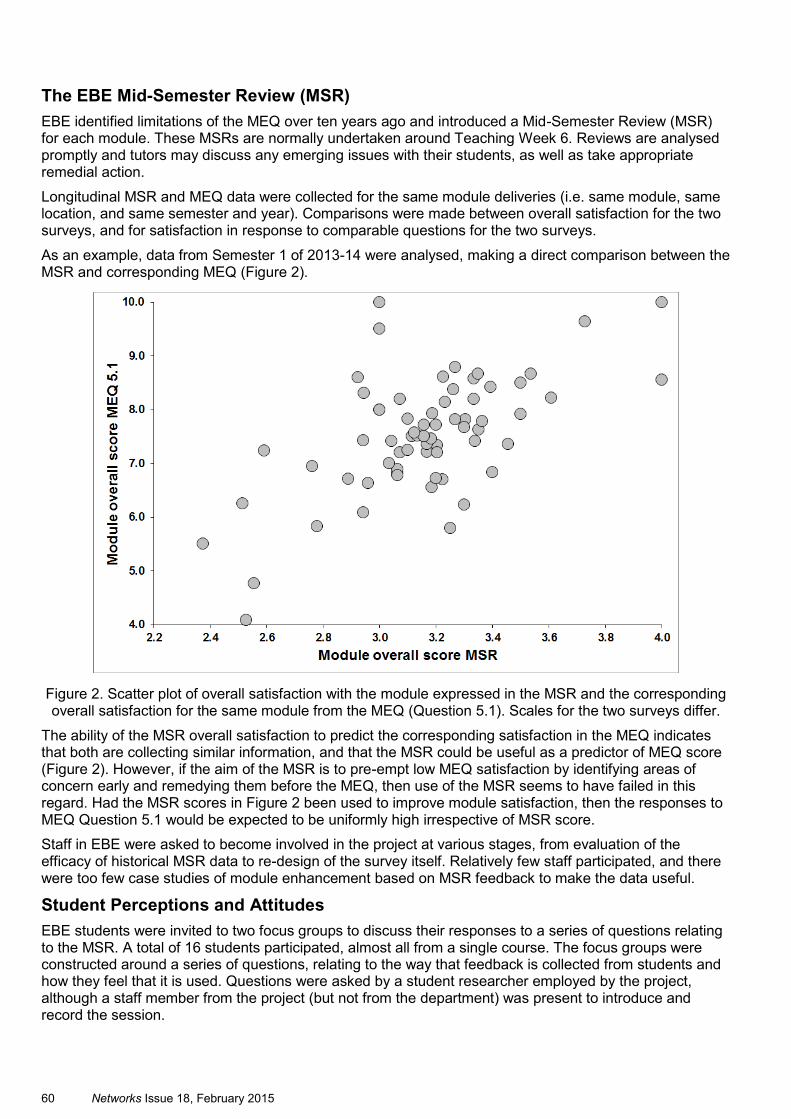
60 Networks Issue 18, February 2015
The EBE Mid-Semester Review (MSR)
EBE identified limitations of the MEQ over ten years ago and introduced a Mid-Semester Review (MSR) for each module. These MSRs are normally undertaken around Teaching Week 6. Reviews are analysed promptly and tutors may discuss any emerging issues with their students, as well as take appropriate remedial action.
Longitudinal MSR and MEQ data were collected for the same module deliveries (i.e. same module, same location, and same semester and year). Comparisons were made between overall satisfaction for the two surveys, and for satisfaction in response to comparable questions for the two surveys.
As an example, data from Semester 1 of 2013-14 were analysed, making a direct comparison between the MSR and corresponding MEQ (Figure 2).
Figure 2. Scatter plot of overall satisfaction with the module expressed in the MSR and the corresponding overall satisfaction for the same module from the MEQ (Question 5.1). Scales for the two surveys differ.
The ability of the MSR overall satisfaction to predict the corresponding satisfaction in the MEQ indicates that both are collecting similar information, and that the MSR could be useful as a predictor of MEQ score (Figure 2). However, if the aim of the MSR is to pre-empt low MEQ satisfaction by identifying areas of concern early and remedying them before the MEQ, then use of the MSR seems to have failed in this regard. Had the MSR scores in Figure 2 been used to improve module satisfaction, then the responses to MEQ Question 5.1 would be expected to be uniformly high irrespective of MSR score.
Staff in EBE were asked to become involved in the project at various stages, from evaluation of the efficacy of historical MSR data to re-design of the survey itself. Relatively few staff participated, and there were too few case studies of module enhancement based on MSR feedback to make the data useful.
Student Perceptions and Attitudes
EBE students were invited to two focus groups to discuss their responses to a series of questions relating to the MSR. A total of 16 students participated, almost all from a single course. The focus groups were constructed around a series of questions, relating to the way that feedback is collected from students and how they feel that it is used. Questions were asked by a student researcher employed by the project, although a staff member from the project (but not from the department) was present to introduce and record the session.
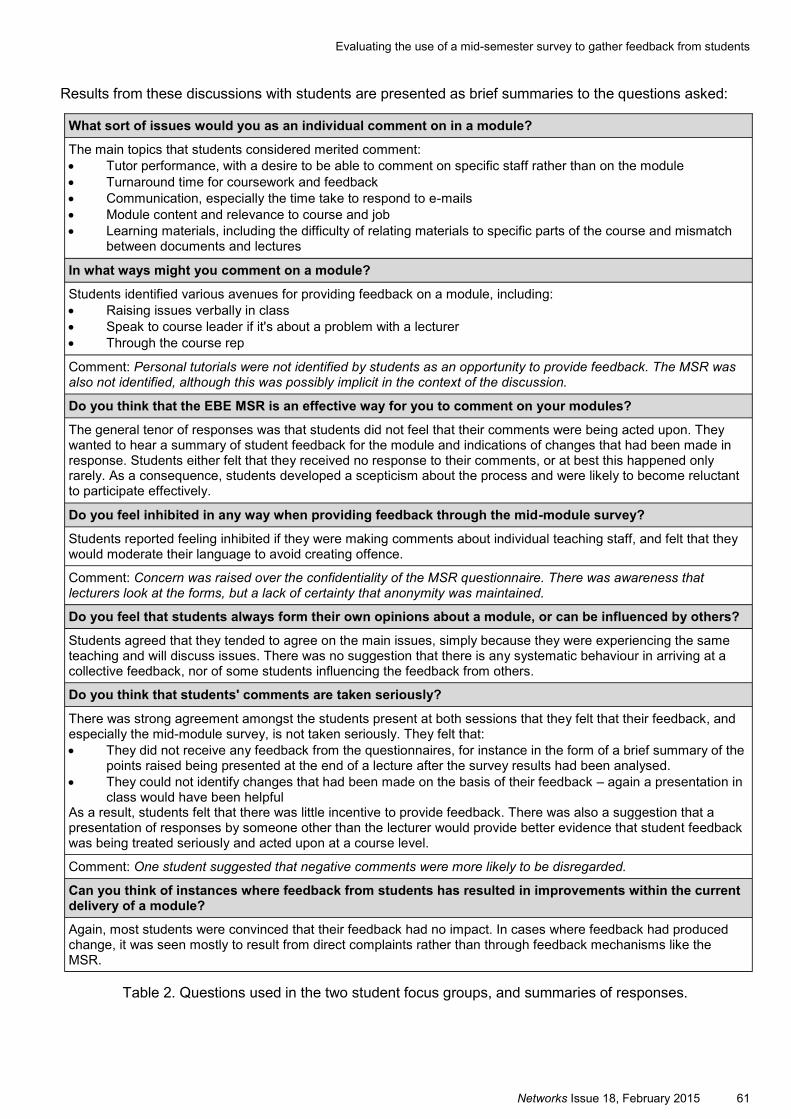
Networks Issue 18, February 2015 61
Results from these discussions with students are presented as brief summaries to the questions asked:
Table 2. Questions used in the two student focus groups, and summaries of responses.
What sort of issues would you as an individual comment on in a module?
The main topics that students considered merited comment:
Tutor performance, with a desire to be able to comment on specific staff rather than on the module
Turnaround time for coursework and feedback
Communication, especially the time take to respond to e-mails
Module content and relevance to course and job
Learning materials, including the difficulty of relating materials to specific parts of the course and mismatch between documents and lectures
In what ways might you comment on a module?
Students identified various avenues for providing feedback on a module, including:
Raising issues verbally in class
Speak to course leader if it's about a problem with a lecturer
Through the course rep
Comment: Personal tutorials were not identified by students as an opportunity to provide feedback. The MSR was also not identified, although this was possibly implicit in the context of the discussion.
Do you think that the EBE MSR is an effective way for you to comment on your modules?
The general tenor of responses was that students did not feel that their comments were being acted upon. They wanted to hear a summary of student feedback for the module and indications of changes that had been made in response. Students either felt that they received no response to their comments, or at best this happened only rarely. As a consequence, students developed a scepticism about the process and were likely to become reluctant to participate effectively.
Do you feel inhibited in any way when providing feedback through the mid-module survey?
Students reported feeling inhibited if they were making comments about individual teaching staff, and felt that they would moderate their language to avoid creating offence.
Comment: Concern was raised over the confidentiality of the MSR questionnaire. There was awareness that lecturers look at the forms, but a lack of certainty that anonymity was maintained.
Do you feel that students always form their own opinions about a module, or can be influenced by others?
Students agreed that they tended to agree on the main issues, simply because they were experiencing the same teaching and will discuss issues. There was no suggestion that there is any systematic behaviour in arriving at a collective feedback, nor of some students influencing the feedback from others.
Do you think that students' comments are taken seriously?
There was strong agreement amongst the students present at both sessions that they felt that their feedback, and especially the mid-module survey, is not taken seriously. They felt that:
They did not receive any feedback from the questionnaires, for instance in the form of a brief summary of the points raised being presented at the end of a lecture after the survey results had been analysed.
They could not identify changes that had been made on the basis of their feedback – again a presentation in class would have been helpful
As a result, students felt that there was little incentive to provide feedback. There was also a suggestion that a presentation of responses by someone other than the lecturer would provide better evidence that student feedback was being treated seriously and acted upon at a course level.
Comment: One student suggested that negative comments were more likely to be disregarded.
Can you think of instances where feedback from students has resulted in improvements within the current delivery of a module?
Again, most students were convinced that their feedback had no impact. In cases where feedback had produced change, it was seen mostly to result from direct complaints rather than through feedback mechanisms like the MSR.
Evaluating the use of a mid-semester survey to gather feedback from students
62 Networks Issue 18, February 2015
Re-design of the MSR
Feedback from staff and students and the analysis of historic data suggested that the MSR was not meeting the needs of the department. At a more fundamental level, the teaching staff involved in reviewing the MSR felt that it had ‘drifted’ from its initial function as a way to assess students’ progress and confidence, into a pre-emptive assessment of student satisfaction ahead of the MEQ. This raised issues about both the questions asked in the MSR and the timing.
A new MSR was designed to address these issues. This included questions about the module as a whole, including the information and teaching materials provided, and how students were coping and preparing for coursework and exams. The aim was to frame the MSR as a student progress review, and to emphasise the ‘Help us to help you’ message. The new MSR was developed as a paper-based questionnaire that could be scanned using optical character recognition software (EvaSys) which facilitates rapid processing of surveys and prompt release of data.
Reflections from Other Staff
At the end of the operational phase of this project, a workshop at Anglia Ruskin’s annual Learning and Teaching Conference provided an opportunity to reflect on the conclusions and to look forward. Participants were asked to work in groups on their responses to a series of questions:
Table 3. Responses from participants in the project workshop.
Conclusion and Recommendations
The results of this project indicate that that collecting feedback from students ahead of the Module Evaluation Questionnaire (MEQ) offers significant benefits, and is practised by several staff using several mechanisms. The most obvious benefit of collecting feedback early (for instance through the MSR) is that response can be made promptly. This may result in improved student satisfaction in the MEQ or NSS if issues can be resolved.
Mid-module feedback may fulfil different roles. Formal surveys, such as the MSR, can be used to test student satisfaction and as such may be used as predictors for the MEQ. In the case of the EBE MSR, this function was not that intended originally, although it emerged in part only because results were not acted upon. However, the only real predictor of the MEQ is an early administration of the same survey, as has been carried out in at least one department in our University.
For the MSR to be effective in enhancing a module, it needs to address student concerns and result in clear outcomes. This is borne out by information supplied by EBE students in focus groups. Students need to be able to recognise that their comments have been received and acted on, and confidentiality maintained. Without improvement students will be reluctant to provide meaningful feedback.
What would you as a student like to be asked in module evaluation?
Whether the student understood the Learning Outcomes of the module
Whether the student had, or knew where to go to get, enough support/help for the module
Whether the student would recommend the module to a friend / does the module meet your expectations?
Timely feedback
How do you think students should receive feedback from module evaluation?
Feedback could be shared in a variety of ways (Face-to-Face, weekly post-it message, and personal email)
How can we as a university bridge the gap between staff and student perspectives?
Enhanced communications – better use of VLE, social media, SMS, group discussions, meet course reps
Manage student expectations better and also encourage ownership of learning
Issues regarding student and staff perceptions and culture
Show that we hear the student voice – ‘You said, we did’
Students want to comment on teaching quality
Stop focusing on modules and think about courses
Confidentiality is an issue
Networks Issue 18, February 2015 63
The EBE MSR has been re-designed on the basis of this project, with the new version placing emphasis on issues that will determine students’ success later in the module rather than trying to predict the MEQ outcomes. The following guidance has also been developed.
Good practice
Co-ordinate mid-module feedback at Course- or Course Group level, and avoid employing a wide range of different collection methods
When collecting mid-module feedback using survey tools, ensure that questions cover aspects that are relevant to students at that point in the module, and that can be answered unequivocally (cf. Douglas et al., 2015)
Encourage students to provide constructive feedback that can be used effectively, and emphasise that comments that are simply negative without contextual information are ineffective in creating positive change
Students view mid-semester review as a method of evaluating modules, so use such feedback as an opportunity to revise module delivery in light of students’ views prior to module evaluation at the end of a module
Teaching staff need to advise students about changes being made following student feedback
Have a strategy for responding to students, including instances where feedback cannot be acted on
Make responses public, even if the issue is raised by a single student (unless there are issues of confidentiality)
Ensure that students understand the difference between the different types of survey and other forms of feedback, and how these will be responded to
Further details
The Faculty of Science and Technology Learning, Teaching and Assessment VLE site includes more details on many aspects of this project including:
Feedback mechanisms – a more extensive description of the methods
Staff Perceptions of Mid-Module Feedback – the full survey and data, plus the two reports arising from the online staff survey (analysis of responses to multiple-choice questions and summary of free-text comments)
Student Perceptions and Attitudes – full information from the focus groups
Please visit: http://vle.anglia.ac.uk/sites/FST/LTA/Content/Learning%20and%20Teaching%20Projects.aspx (password access off-campus).
Acknowledgements
The project was funded by a Learning and Teaching Project Award from Anglia Learning & Teaching. We are grateful to all participants in our research, both students and staff. Also thanks to those staff and students who gave their time to complete our online survey or participate in a focus group. Many thanks go to Lucy Matambo for providing us with valuable support and information at key points in this project and who facilitated the focus groups.
References
Alhija F. and Fresko, B., 2009. Student evaluation of instruction: What can be learned from students’ written comments? Studies in Educational Evaluation, 35(1). [Online] Available at: http://www.sciencedirect.com/science/article/pii/S0191491X09000066# [Accessed 29 September 2014].
Evaluating the use of a mid-semester survey to gather feedback from students
64 Networks Issue 18, February 2015
Anglia Ruskin University, 2014. Student Charter. [Online] Available at: http://ww2.anglia.ac.uk/medianew/pdf/student-charter.pdf [Accessed 9 February 2015]
Ardalan, A., Ardalan, R., Coppage, S. and Crouch, W., 2007. A comparison of student feedback obtained through paper-based and web-based surveys of faculty teaching. British Journal of Educational Technology, 38(6). [Online] Available at: http://onlinelibrary.wiley.com/doi/10.1111/j.1467-8535.2007.00694.x/pdf [Accessed 29 September 2014].
Ashby, A., Richardson, J. and Woodley, A., 2011. National student feedback surveys in distance education: an investigation at the UK Open University. Open Learning, 26(1). [Online] Available at: http://www.tandfonline.com/doi/pdf/10.1080/02680513.2011.538560 [Accessed 29 September 2014].
Chen, Y. and Hoshower, L., 2003. Student evaluation of teaching effectiveness: an assessment of student perception and motivation. Assessment and Evaluation in Higher Education, 28(1) 71-88. [Online] Available at http://www.ingentaconnect.com/content/routledg/caeh/2003/00000028/00000001/art00006?crawler=true [Accessed 24 February 2015].
Douglas, J.A., McClelland, R., Davies, J. and Sudbury, L., 2009. Using critical incident technique (CIT) to capture the voice of the student. The TQM Journal, 21(4), 305-318. [Online] Available at: http://dx.doi.org/10.1108/17542730910965038 [Accessed 9 February 2015]
Douglas, J.A., Douglas, A., McClelland, R.J. and Davies J., 2015. Understanding student satisfaction and dissatisfaction: an interpretive study in the UK higher education context. Studies in Higher Education, 40(2), 329-349 [Online] Available at: http://www.tandfonline.com/doi/abs/10.1080/03075079.2013.842217#.VNInnUu2HjU [Accessed 9 February 2015]
Online resources
Electric Paper Ltd., Undated. EvaSys Automation Software, [Online] Available at: http://www.evasys.co.uk/start.html [Accessed on 11.02.15].
Padlet, 2015. Padlet, [Online] Available at: https://padlet.com/ [Accessed on 11.02.15]
Poll Everywhere, Undated. Poll Everywhere, [Online] Available at: http://www.polleverywhere.com/ [Accessed on 11.02.15].
SurveyMonkey, 2015. SurveyMonkey, [Online] Available at: https://www.surveymonkey.com/ [Accessed on 11.02.15].
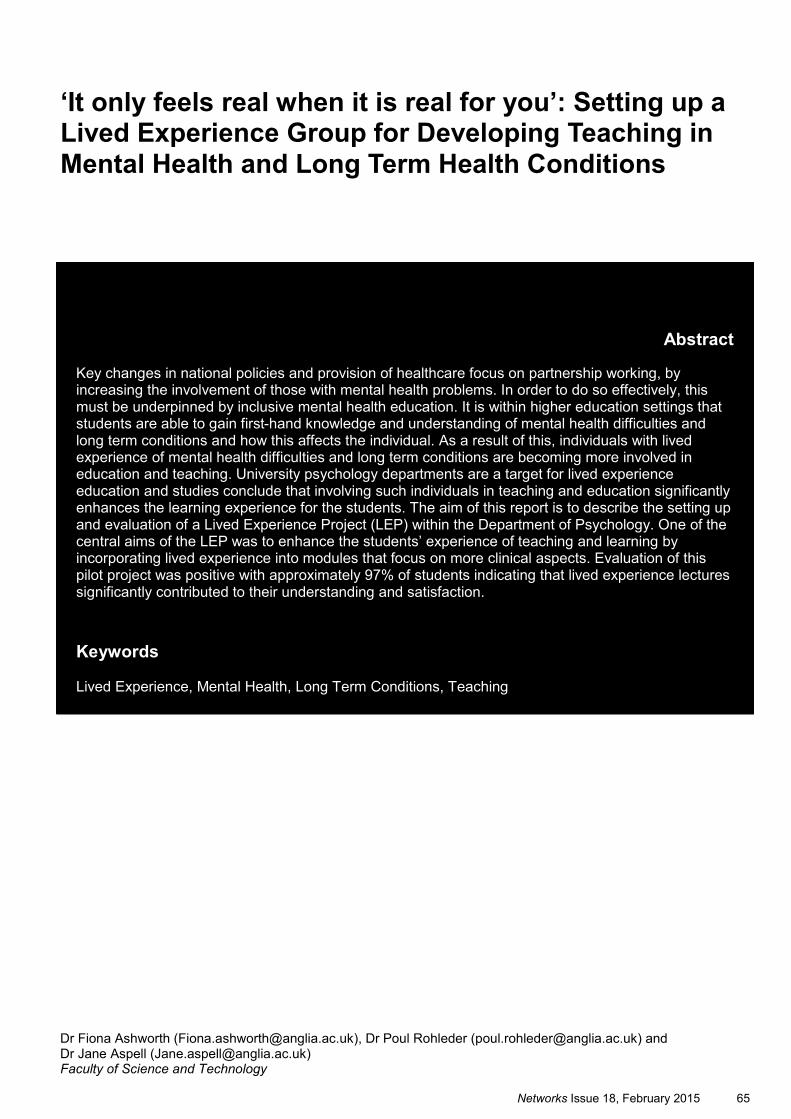
Networks Issue 18, February 2015 65
‘It only feels real when it is real for you’: Setting up a Lived Experience Group for Developing Teaching in Mental Health and Long Term Health Conditions
Abstract
Key changes in national policies and provision of healthcare focus on partnership working, by increasing the involvement of those with mental health problems. In order to do so effectively, this must be underpinned by inclusive mental health education. It is within higher education settings that students are able to gain first-hand knowledge and understanding of mental health difficulties and long term conditions and how this affects the individual. As a result of this, individuals with lived experience of mental health difficulties and long term conditions are becoming more involved in education and teaching. University psychology departments are a target for lived experience education and studies conclude that involving such individuals in teaching and education significantly enhances the learning experience for the students. The aim of this report is to describe the setting up and evaluation of a Lived Experience Project (LEP) within the Department of Psychology. One of the central aims of the LEP was to enhance the students’ experience of teaching and learning by incorporating lived experience into modules that focus on more clinical aspects. Evaluation of this pilot project was positive with approximately 97% of students indicating that lived experience lectures significantly contributed to their understanding and satisfaction.
Keywords
Lived Experience, Mental Health, Long Term Conditions, Teaching
Dr Fiona Ashworth ([email protected]), Dr Poul Rohleder ([email protected]) and Dr Jane Aspell ([email protected]) Faculty of Science and Technology
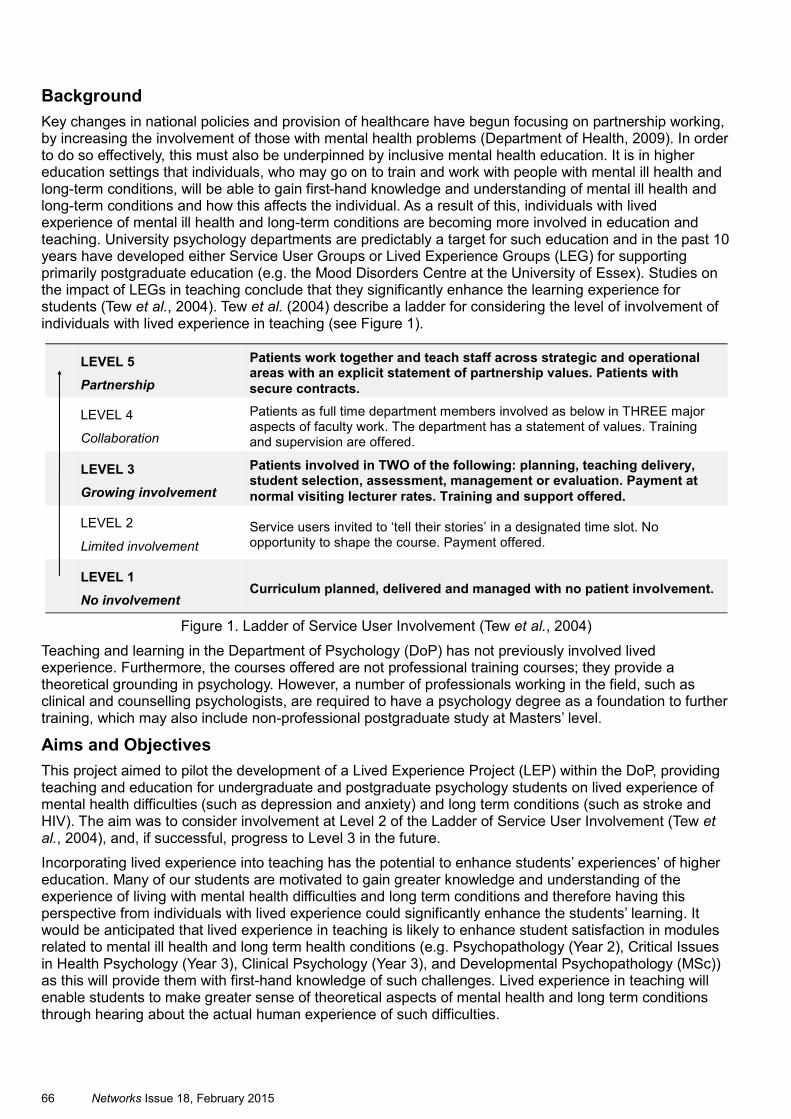
66 Networks Issue 18, February 2015
Background
Key changes in national policies and provision of healthcare have begun focusing on partnership working, by increasing the involvement of those with mental health problems (Department of Health, 2009). In order to do so effectively, this must also be underpinned by inclusive mental health education. It is in higher education settings that individuals, who may go on to train and work with people with mental ill health and long-term conditions, will be able to gain first-hand knowledge and understanding of mental ill health and long-term conditions and how this affects the individual. As a result of this, individuals with lived experience of mental ill health and long-term conditions are becoming more involved in education and teaching. University psychology departments are predictably a target for such education and in the past 10 years have developed either Service User Groups or Lived Experience Groups (LEG) for supporting primarily postgraduate education (e.g. the Mood Disorders Centre at the University of Essex). Studies on the impact of LEGs in teaching conclude that they significantly enhance the learning experience for students (Tew et al., 2004). Tew et al. (2004) describe a ladder for considering the level of involvement of individuals with lived experience in teaching (see Figure 1).
Figure 1. Ladder of Service User Involvement (Tew et al., 2004)
Teaching and learning in the Department of Psychology (DoP) has not previously involved lived experience. Furthermore, the courses offered are not professional training courses; they provide a theoretical grounding in psychology. However, a number of professionals working in the field, such as clinical and counselling psychologists, are required to have a psychology degree as a foundation to further training, which may also include non-professional postgraduate study at Masters’ level.
Aims and Objectives
This project aimed to pilot the development of a Lived Experience Project (LEP) within the DoP, providing teaching and education for undergraduate and postgraduate psychology students on lived experience of mental health difficulties (such as depression and anxiety) and long term conditions (such as stroke and HIV). The aim was to consider involvement at Level 2 of the Ladder of Service User Involvement (Tew et al., 2004), and, if successful, progress to Level 3 in the future.
Incorporating lived experience into teaching has the potential to enhance students’ experiences’ of higher education. Many of our students are motivated to gain greater knowledge and understanding of the experience of living with mental health difficulties and long term conditions and therefore having this perspective from individuals with lived experience could significantly enhance the students’ learning. It would be anticipated that lived experience in teaching is likely to enhance student satisfaction in modules related to mental ill health and long term health conditions (e.g. Psychopathology (Year 2), Critical Issues in Health Psychology (Year 3), Clinical Psychology (Year 3), and Developmental Psychopathology (MSc)) as this will provide them with first-hand knowledge of such challenges. Lived experience in teaching will enable students to make greater sense of theoretical aspects of mental health and long term conditions through hearing about the actual human experience of such difficulties.
LEVEL 5
Partnership
Patients work together and teach staff across strategic and operational areas with an explicit statement of partnership values. Patients with
secure contracts.
LEVEL 4
Collaboration
Patients as full time department members involved as below in THREE major aspects of faculty work. The department has a statement of values. Training and supervision are offered.
LEVEL 3
Growing involvement
Patients involved in TWO of the following: planning, teaching delivery, student selection, assessment, management or evaluation. Payment at
normal visiting lecturer rates. Training and support offered.
LEVEL 2
Limited involvement
Service users invited to ‘tell their stories’ in a designated time slot. No opportunity to shape the course. Payment offered.
LEVEL 1
No involvement Curriculum planned, delivered and managed with no patient involvement.
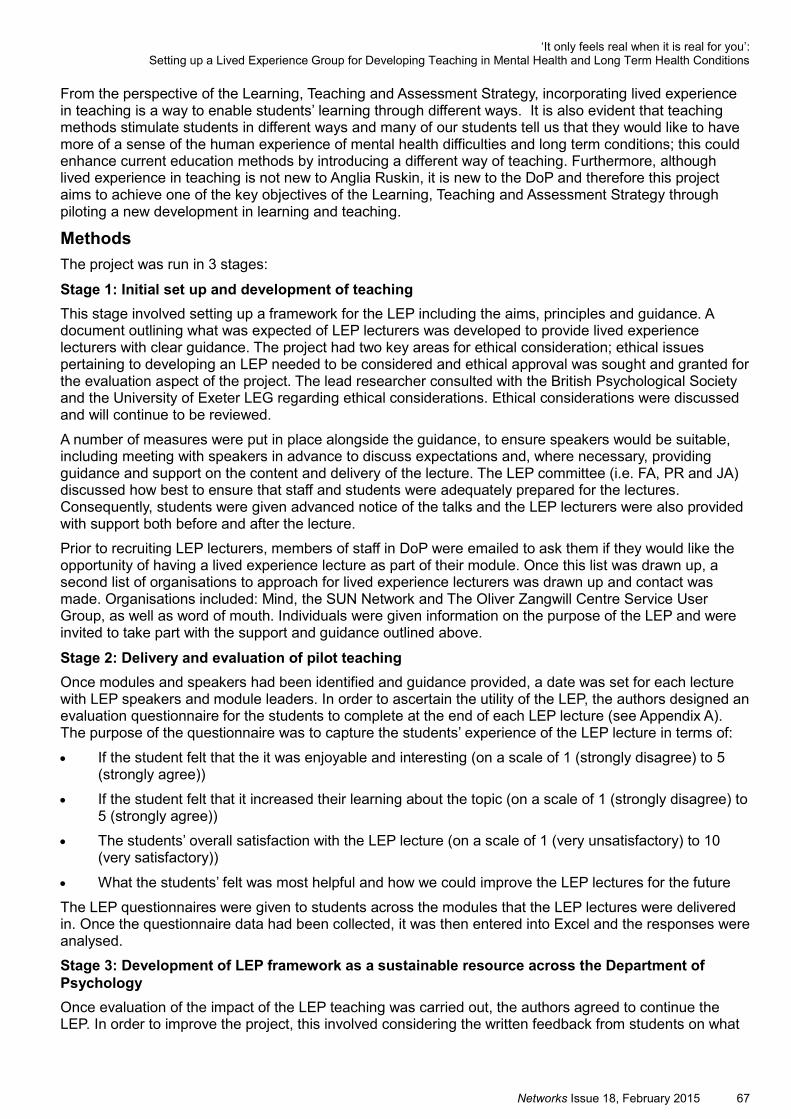
Networks Issue 18, February 2015 67
From the perspective of the Learning, Teaching and Assessment Strategy, incorporating lived experience in teaching is a way to enable students’ learning through different ways. It is also evident that teaching methods stimulate students in different ways and many of our students tell us that they would like to have more of a sense of the human experience of mental health difficulties and long term conditions; this could enhance current education methods by introducing a different way of teaching. Furthermore, although lived experience in teaching is not new to Anglia Ruskin, it is new to the DoP and therefore this project aims to achieve one of the key objectives of the Learning, Teaching and Assessment Strategy through piloting a new development in learning and teaching.
Methods
The project was run in 3 stages:
Stage 1: Initial set up and development of teaching
This stage involved setting up a framework for the LEP including the aims, principles and guidance. A document outlining what was expected of LEP lecturers was developed to provide lived experience lecturers with clear guidance. The project had two key areas for ethical consideration; ethical issues pertaining to developing an LEP needed to be considered and ethical approval was sought and granted for the evaluation aspect of the project. The lead researcher consulted with the British Psychological Society and the University of Exeter LEG regarding ethical considerations. Ethical considerations were discussed and will continue to be reviewed.
A number of measures were put in place alongside the guidance, to ensure speakers would be suitable, including meeting with speakers in advance to discuss expectations and, where necessary, providing guidance and support on the content and delivery of the lecture. The LEP committee (i.e. FA, PR and JA) discussed how best to ensure that staff and students were adequately prepared for the lectures. Consequently, students were given advanced notice of the talks and the LEP lecturers were also provided with support both before and after the lecture.
Prior to recruiting LEP lecturers, members of staff in DoP were emailed to ask them if they would like the opportunity of having a lived experience lecture as part of their module. Once this list was drawn up, a second list of organisations to approach for lived experience lecturers was drawn up and contact was made. Organisations included: Mind, the SUN Network and The Oliver Zangwill Centre Service User Group, as well as word of mouth. Individuals were given information on the purpose of the LEP and were invited to take part with the support and guidance outlined above.
Stage 2: Delivery and evaluation of pilot teaching
Once modules and speakers had been identified and guidance provided, a date was set for each lecture with LEP speakers and module leaders. In order to ascertain the utility of the LEP, the authors designed an evaluation questionnaire for the students to complete at the end of each LEP lecture (see Appendix A). The purpose of the questionnaire was to capture the students’ experience of the LEP lecture in terms of:
If the student felt that the it was enjoyable and interesting (on a scale of 1 (strongly disagree) to 5 (strongly agree))
If the student felt that it increased their learning about the topic (on a scale of 1 (strongly disagree) to 5 (strongly agree))
The students’ overall satisfaction with the LEP lecture (on a scale of 1 (very unsatisfactory) to 10 (very satisfactory))
What the students’ felt was most helpful and how we could improve the LEP lectures for the future
The LEP questionnaires were given to students across the modules that the LEP lectures were delivered in. Once the questionnaire data had been collected, it was then entered into Excel and the responses were analysed.
Stage 3: Development of LEP framework as a sustainable resource across the Department of
Psychology
Once evaluation of the impact of the LEP teaching was carried out, the authors agreed to continue the LEP. In order to improve the project, this involved considering the written feedback from students on what
‘It only feels real when it is real for you’: Setting up a Lived Experience Group for Developing Teaching in Mental Health and Long Term Health Conditions
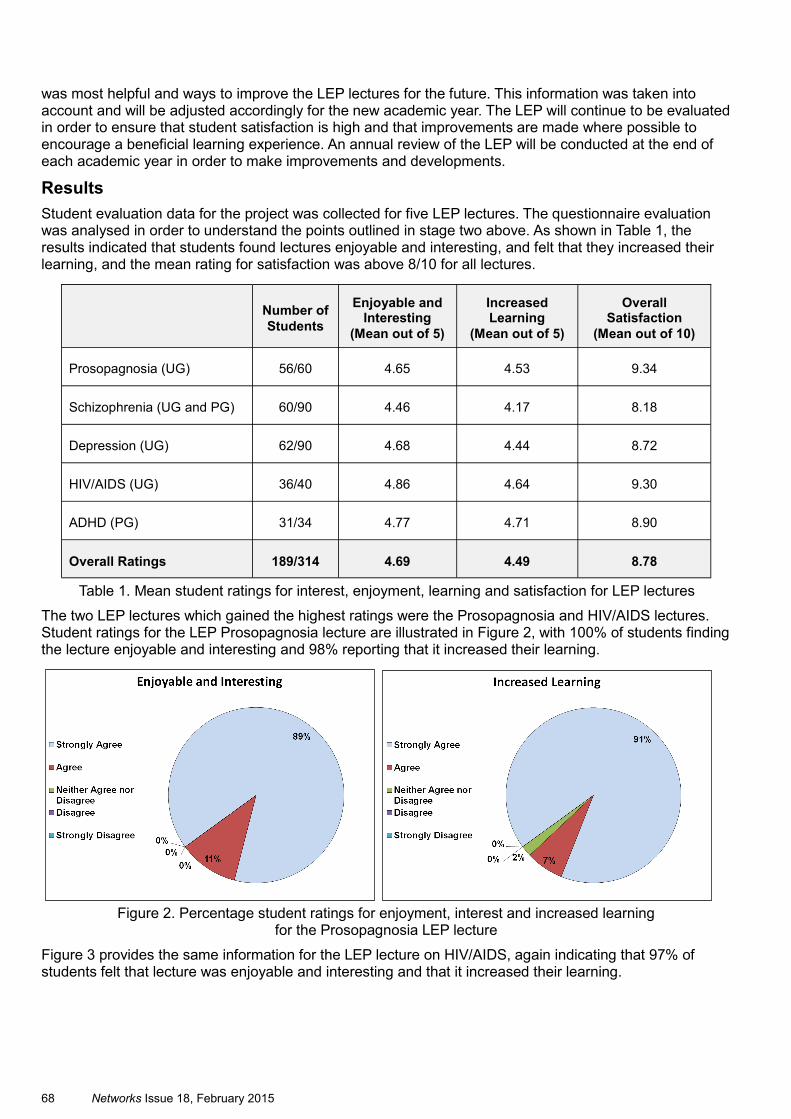
68 Networks Issue 18, February 2015
was most helpful and ways to improve the LEP lectures for the future. This information was taken into account and will be adjusted accordingly for the new academic year. The LEP will continue to be evaluated in order to ensure that student satisfaction is high and that improvements are made where possible to encourage a beneficial learning experience. An annual review of the LEP will be conducted at the end of each academic year in order to make improvements and developments.
Results
Student evaluation data for the project was collected for five LEP lectures. The questionnaire evaluation was analysed in order to understand the points outlined in stage two above. As shown in Table 1, the results indicated that students found lectures enjoyable and interesting, and felt that they increased their learning, and the mean rating for satisfaction was above 8/10 for all lectures.
Table 1. Mean student ratings for interest, enjoyment, learning and satisfaction for LEP lectures
The two LEP lectures which gained the highest ratings were the Prosopagnosia and HIV/AIDS lectures. Student ratings for the LEP Prosopagnosia lecture are illustrated in Figure 2, with 100% of students finding the lecture enjoyable and interesting and 98% reporting that it increased their learning.
Figure 2. Percentage student ratings for enjoyment, interest and increased learning
for the Prosopagnosia LEP lecture
Figure 3 provides the same information for the LEP lecture on HIV/AIDS, again indicating that 97% of students felt that lecture was enjoyable and interesting and that it increased their learning.
Number of
Students
Enjoyable and Interesting
(Mean out of 5)
Increased Learning
(Mean out of 5)
Overall Satisfaction
(Mean out of 10)
Prosopagnosia (UG) 56/60 4.65 4.53 9.34
Schizophrenia (UG and PG) 60/90 4.46 4.17 8.18
Depression (UG) 62/90 4.68 4.44 8.72
HIV/AIDS (UG) 36/40 4.86 4.64 9.30
ADHD (PG) 31/34 4.77 4.71 8.90
Overall Ratings 189/314 4.69 4.49 8.78
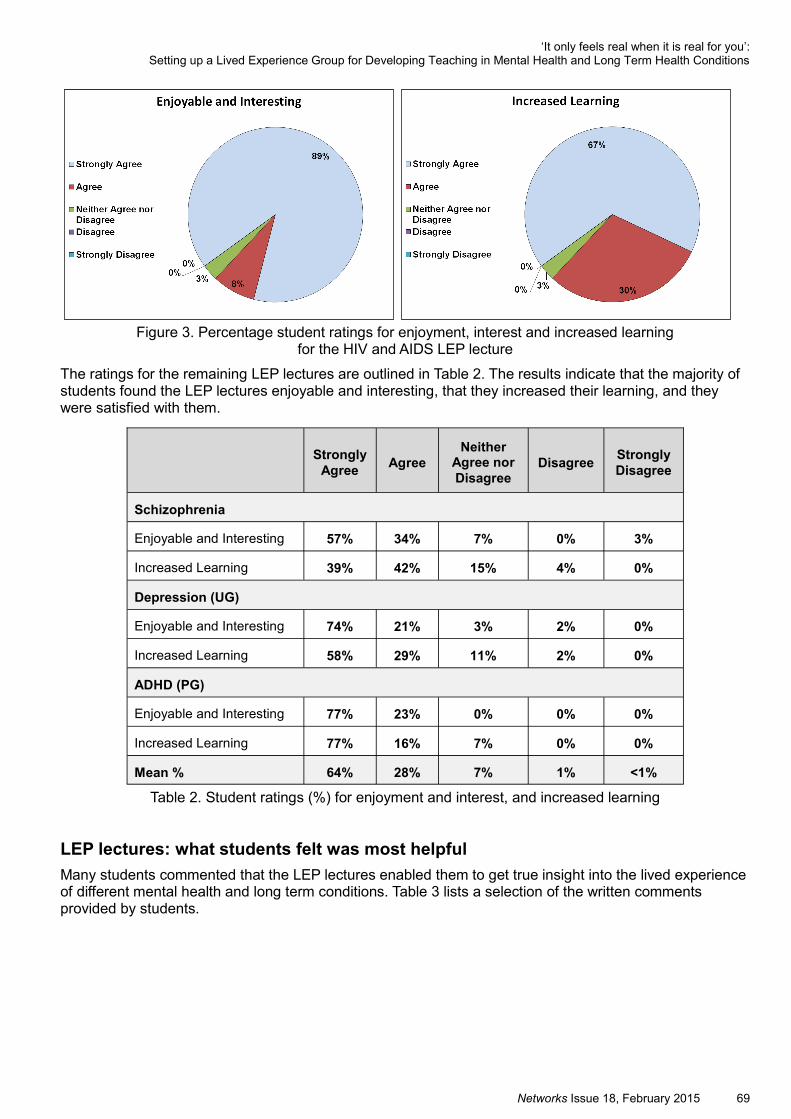
Networks Issue 18, February 2015 69
Figure 3. Percentage student ratings for enjoyment, interest and increased learning
for the HIV and AIDS LEP lecture
The ratings for the remaining LEP lectures are outlined in Table 2. The results indicate that the majority of students found the LEP lectures enjoyable and interesting, that they increased their learning, and they were satisfied with them.
Table 2. Student ratings (%) for enjoyment and interest, and increased learning
LEP lectures: what students felt was most helpful
Many students commented that the LEP lectures enabled them to get true insight into the lived experience of different mental health and long term conditions. Table 3 lists a selection of the written comments provided by students.
Strongly
Agree Agree
Neither Agree nor
Disagree
Disagree Strongly
Disagree
Schizophrenia
Enjoyable and Interesting 57% 34% 7% 0% 3%
Increased Learning 39% 42% 15% 4% 0%
Depression (UG)
Enjoyable and Interesting 74% 21% 3% 2% 0%
Increased Learning 58% 29% 11% 2% 0%
ADHD (PG)
Enjoyable and Interesting 77% 23% 0% 0% 0%
Increased Learning 77% 16% 7% 0% 0%
Mean % 64% 28% 7% 1% <1%
‘It only feels real when it is real for you’: Setting up a Lived Experience Group for Developing Teaching in Mental Health and Long Term Health Conditions
70 Networks Issue 18, February 2015
Table 3. Students’ written feedback on what was most helpful about the LEP lectures
LEP lectures: what the students felt could be improved
Consistently, most students requested to have more LEP lectures across their modules as they felt that this benefited their learning and more of these talks would further increase their learning and understanding. Some students requested more time for speakers and for questions (talks varied in terms of the time given from 20 minutes up to the full hour of the lecture). A small number of students felt that the use of visual aids (e.g. PowerPoint slides) would be useful (some speakers used PowerPoint, others used notes and one speaker read a speech from a sheet of paper). As students were only informed of the Prosopagnosia LEP talk on the day, a number of them requested to have information in advance so that they had time to think about the LEP lecture and prepare questions for the speaker. One student stated that they needed more information before the talk about Depression as they had a similar lived experience to the speaker and they found this difficult to hear and be reminded of.
Discussion and Conclusions
Overall the pilot of the LEP was deemed to be a success and as such will be integrated into the teaching in the DoP. Based on the feedback from students a number of improvements and adjustments will also be made including:
Provision of more detailed information to students in advance of the LEP lecture
Provision of a 50 minute lecture slot for LEP speakers
Optional attendance at LEP talks as in some case the lived experience may be sensitive and trigger emotional reactions for some students
To increase awareness of the LEP there will be a LEP website link on the main page of the DoP for students and the general public to visit. Furthermore, with the support of a Graphic Design student in the Anglia Ruskin Cambridge School of Art, we have created a leaflet (see Appendix B) which will be given out at open days for prospective students and at public engagement events as well as in conjunction with recruiting LEP members.
The LEP pilot aimed to provide lived experience at Level 2 of the Ladder of Service User Involvement (Tew et al., 2004). The authors conclude that the pilot was success at Level 2 but would like for the LEP to evolve and progress to Level 3 in the coming years. On top of integrating the LEP members more actively in the teaching and education process, other activities that the LEP will aim to do are:
1. Consultation on research. Provision of opinions on the experience of taking part in research, ideas on research, issues of ethics, and materials used in research.
2. Feedback. Providing formative feedback to postgraduate students. This is specific to our new MSc Foundations in Clinical Psychology course where LEP members will provide input to students through participating in experiential workshops on the counselling encounter.
3. Public Engagement. In the future we hope to develop workshops/seminars which are aimed at increasing awareness of mental health issues and long term conditions.
‘Gives a real life view on the theory that we learn so it makes it easier to be able to apply our knowledge to real events’ ‘It's better than just learning the theory behind something. It helps to remember. It has never been so quiet during a lecture before, everyone was listening to the lady talk, you could hear a pin drop’ ‘It gave more meaning to the illness, I felt like it became clearer.’ ‘Becomes a lot more ‘real’, not just slides with information from text books and studies. Gives a better insight into prosopagnosia’ ‘It brought the reality of the disorder to life. You suddenly realise how real it is. A very humbling experience.’
Networks Issue 18, February 2015 71
References
Department of Health, 2009. New Horizons: A shared Vision for Mental Health. London: Crown Publishers: London. [Online] Available at: http://webarchive.nationalarchives.gov.uk/20130107105354/http://www.dh.gov.uk/prod_consum_dh/groups/dh_digitalassets/@dh/@en/documents/digitalasset/dh_109708.pdf [Accessed 10 October 2014].
Mood Disorders Centre (MDC), (undated). Mood Disorders Centre. Colchester: University of Essex. [Online] Available at: http://www.exeter.ac.uk/mooddisorders/ [Accessed on 24 July 2014].
Tew, J., Gell, C. and Foster, S., 2004. Learning from Experience: Involving service users and carers in mental health education and training. Higher Education Academy / National Institute for Mental Health.
‘It only feels real when it is real for you’: Setting up a Lived Experience Group for Developing Teaching in Mental Health and Long Term Health Conditions
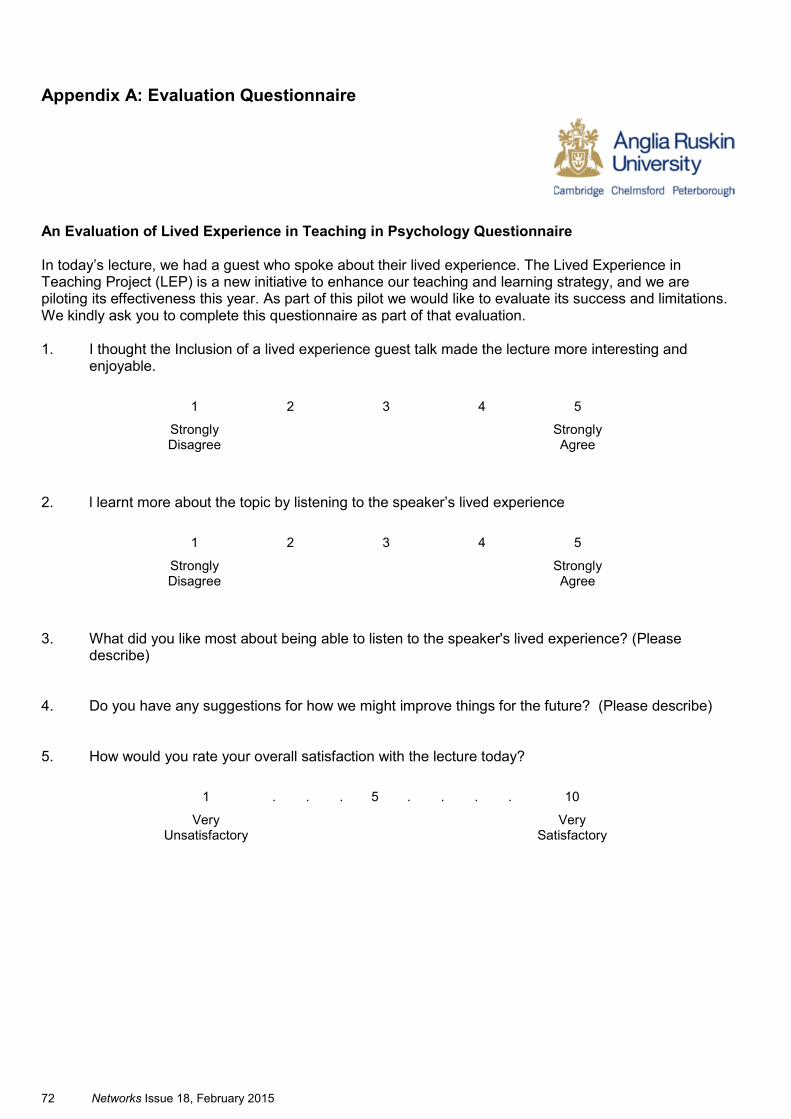
72 Networks Issue 18, February 2015
Appendix A: Evaluation Questionnaire An Evaluation of Lived Experience in Teaching in Psychology Questionnaire In today’s lecture, we had a guest who spoke about their lived experience. The Lived Experience in Teaching Project (LEP) is a new initiative to enhance our teaching and learning strategy, and we are piloting its effectiveness this year. As part of this pilot we would like to evaluate its success and limitations. We kindly ask you to complete this questionnaire as part of that evaluation. 1. I thought the Inclusion of a lived experience guest talk made the lecture more interesting and enjoyable.
2. l learnt more about the topic by listening to the speaker’s lived experience
3. What did you like most about being able to listen to the speaker's lived experience? (Please describe) 4. Do you have any suggestions for how we might improve things for the future? (Please describe) 5. How would you rate your overall satisfaction with the lecture today?
1 2 3 4 5
Strongly Disagree
Strongly Agree
1 2 3 4 5
Strongly Disagree
Strongly Agree
1 . . . 5 . . . . 10
Very Unsatisfactory
Very
Satisfactory
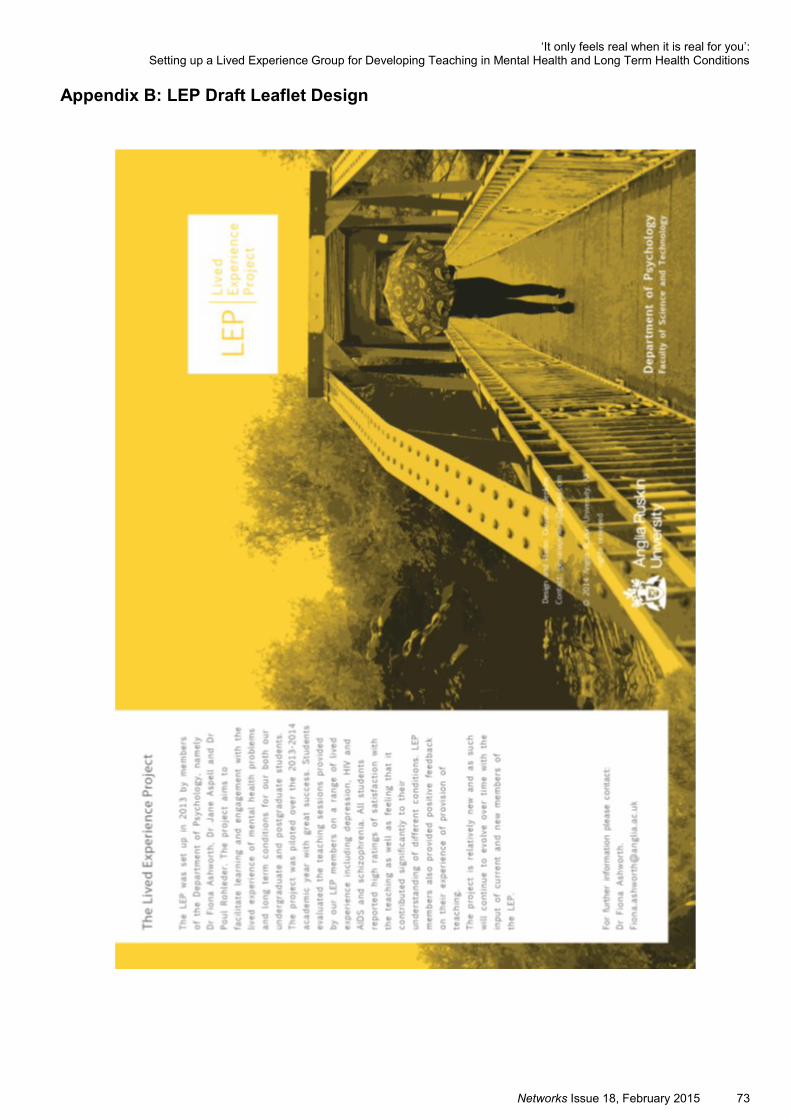
Networks Issue 18, February 2015 73
Appendix B: LEP Draft Leaflet Design
‘It only feels real when it is real for you’: Setting up a Lived Experience Group for Developing Teaching in Mental Health and Long Term Health Conditions

74 Networks Issue 18, February 2015

Networks Issue 18, February 2015 75
Setting Competency Standards in Optometry for Ocular Disease Module
Dr Matilda Biba ([email protected]) and Dr John Siderov ([email protected]) Faculty of Science and Technology
Abstract
The General Optical Council (GOC) regulates the profession of optometry in the United Kingdom. It is responsible for setting the standards of optometric education including the specific clinical competencies required for optometric practice. However, employing a fixed rate approach to determine academic achievement does not directly translate as being clinically competent. In this study, we introduced standard-setting procedures into a second year module within our BOptom (Hons) course, with the aim of designing a fairer, more robust and standardised method of assessment.
High quality, coloured still images, covering GOC core ocular disease requirements, were reviewed by a panel of subject matter experts. We used a modified Angoff method to determine cut-off scores for each image and create a new, twenty still-image assessment. The new assessment was presented to second year undergraduate students as a mock-assessment, the results of which were compared against an initial non-standardised mock assessment. Our results indicate that the modified Angoff standard-setting approach to assess ocular pathology knowledge, not only allowed for a more robust method of assessment, but improved the students’ overall performance.
Keywords
Setting Standards, Competency, Angoff Method
76 Networks Issue 18, February 2015
Introduction
Standard setting is a methodology used to derive performance levels in achievement assessments for education, certification and registration (Cizek, 2004). Performance levels are synonymous with competency standards (Kane, 1994; Cizek, 2004), which are classified as pre-defined, specialised criteria, quantified and defined by professional and/or educational bodies.
The optometric profession in the UK is regulated by one of twelve health and social care regulators, the General Optical Council (GOC). It first came into existence in 1958, through parliamentary legislation and has four primary functions, one of which is setting standards for optical education and training, performance and conduct. It provides institutional guidance and defines the knowledge and skills that optometrists must achieve and maintain to meet registration standards, which are referred to as ‘core competencies’ (GOC, 2014). In the ocular disease element, there are 15 defined core competency components, which must be assessed so that the trainee and/or student can demonstrate they meet the specified standard. However, the assessment formats by which competencies is demonstrated, are not pre-defined by the GOC and therefore, are individual to each educational and training institution.
Currently, our optometry students undertake an introductory ocular disease module, in the second semester of their second academic year. It is a 15-credit module, structured around weekly two-hour lectures with two assessment elements. The first assessment is a two-hour, closed book, written exam, which focuses on assessing the students’ knowledge on clinical decision-making, clinical investigation, differential diagnosis, and management. The second assessment is a one-hour slide assessment, which assesses the students’ ability to correctly recognise and identify a variety of ocular conditions in accordance with the competency guidelines. However, the traditional fixed rate approach to assess academic achievement does not inherently infer or translate to clinical competence. Thus, a pass mark of 40% may not represent the appropriate standard needed to achieve competency, highlighting a discrepancy in assessment methodology and interpretation. Introducing performance standard setting procedures in the assessment design removes this inconsistency and provides a more defensible route to assess and demonstrate clinical competency. The ultimate aim of this study was therefore to introduce standard-setting practices to design a balanced, fairer and more robust method of assessing disease recognition competency.
Method
Old Assessment Procedure (Non-Standard)
The traditional assessment design approach relied solely on the module leader to choose relevant coloured still images that reflected the core competency guidelines. Each chosen still image depicted a different ocular pathology. The assessment comprised of 20 still images, which were presented to the students (n = 49) on a computer display as a mock assessment (Mock 1). The task for the students was to recognise and document the clinical signs and to correctly identify the ocular condition. Answers were recorded on anonymous written booklets and graded by the module leader.
New Standard Setting Approach
Unlike the traditional single-person assessment design methodology, a systematic, documented, focus group approach to setting standards for the slide recognition assessment was adopted for the study (Mock 2). Referred to as the modified Angoff method, it is a widely used and accepted procedure, first described in 1971 (Cizek, 2004). It is a five-step process, commencing with the selection of an expert panel. Each expert panel member (n = 5) was first asked to take the test by identifying the ocular condition depicted in newly sourced coloured still images. Feedback about image quality and relevance to core competency was obtained and images were revised or removed accordingly. The remaining approved still images underwent a further evaluation process. Each expert rated each of the images by estimating the proportion of minimally qualified (just competent) clinicians out of 100 that would correctly identify the ocular pathology. Each expert was instructed to rate in increments of 5% and not to award lower than 20% or higher than 90%.The answers were recorded on a Test Image Rating form (see Table 1).
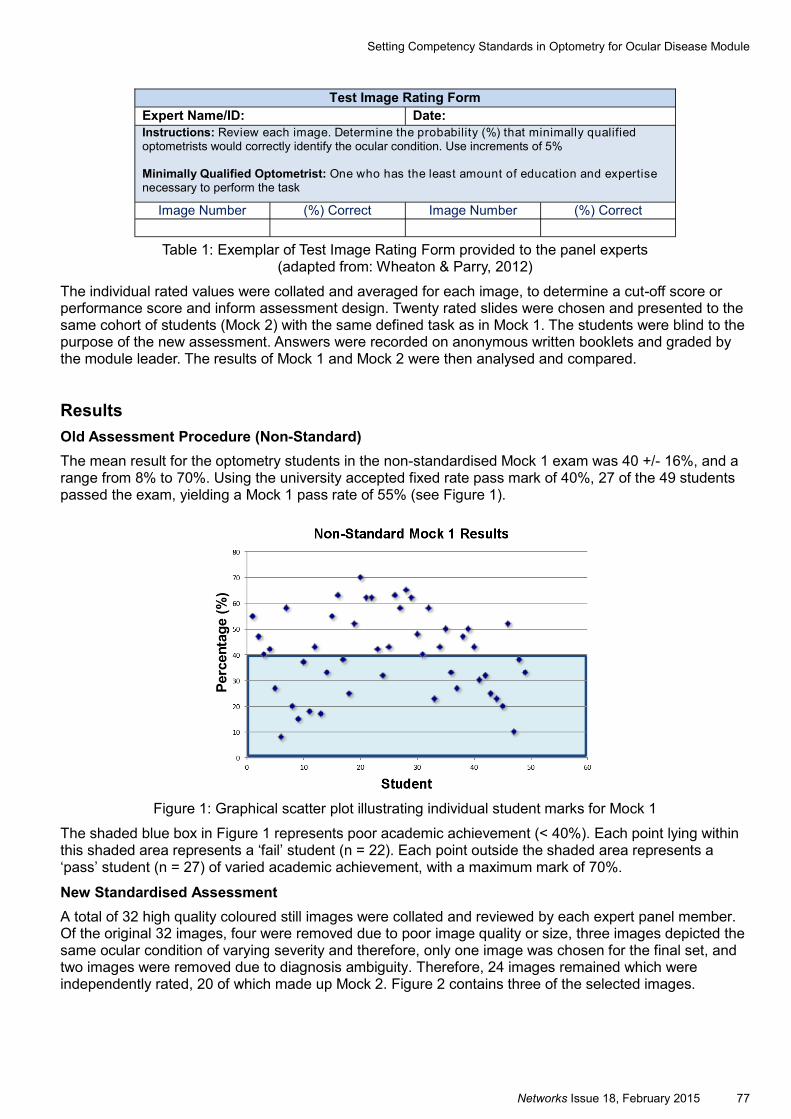
Networks Issue 18, February 2015 77
Table 1: Exemplar of Test Image Rating Form provided to the panel experts
(adapted from: Wheaton & Parry, 2012)
The individual rated values were collated and averaged for each image, to determine a cut-off score or performance score and inform assessment design. Twenty rated slides were chosen and presented to the same cohort of students (Mock 2) with the same defined task as in Mock 1. The students were blind to the purpose of the new assessment. Answers were recorded on anonymous written booklets and graded by the module leader. The results of Mock 1 and Mock 2 were then analysed and compared.
Results
Old Assessment Procedure (Non-Standard)
The mean result for the optometry students in the non-standardised Mock 1 exam was 40 +/- 16%, and a range from 8% to 70%. Using the university accepted fixed rate pass mark of 40%, 27 of the 49 students passed the exam, yielding a Mock 1 pass rate of 55% (see Figure 1).
Figure 1: Graphical scatter plot illustrating individual student marks for Mock 1
The shaded blue box in Figure 1 represents poor academic achievement (< 40%). Each point lying within this shaded area represents a ‘fail’ student (n = 22). Each point outside the shaded area represents a ‘pass’ student (n = 27) of varied academic achievement, with a maximum mark of 70%.
New Standardised Assessment
A total of 32 high quality coloured still images were collated and reviewed by each expert panel member. Of the original 32 images, four were removed due to poor image quality or size, three images depicted the same ocular condition of varying severity and therefore, only one image was chosen for the final set, and two images were removed due to diagnosis ambiguity. Therefore, 24 images remained which were independently rated, 20 of which made up Mock 2. Figure 2 contains three of the selected images.
Test Image Rating Form
Expert Name/ID: Date:
Instructions: Review each image. Determine the probability (%) that minimally qualified optometrists would correctly identify the ocular condition. Use increments of 5% Minimally Qualified Optometrist: One who has the least amount of education and expertise necessary to perform the task
Image Number (%) Correct Image Number (%) Correct
Setting Competency Standards in Optometry for Ocular Disease Module
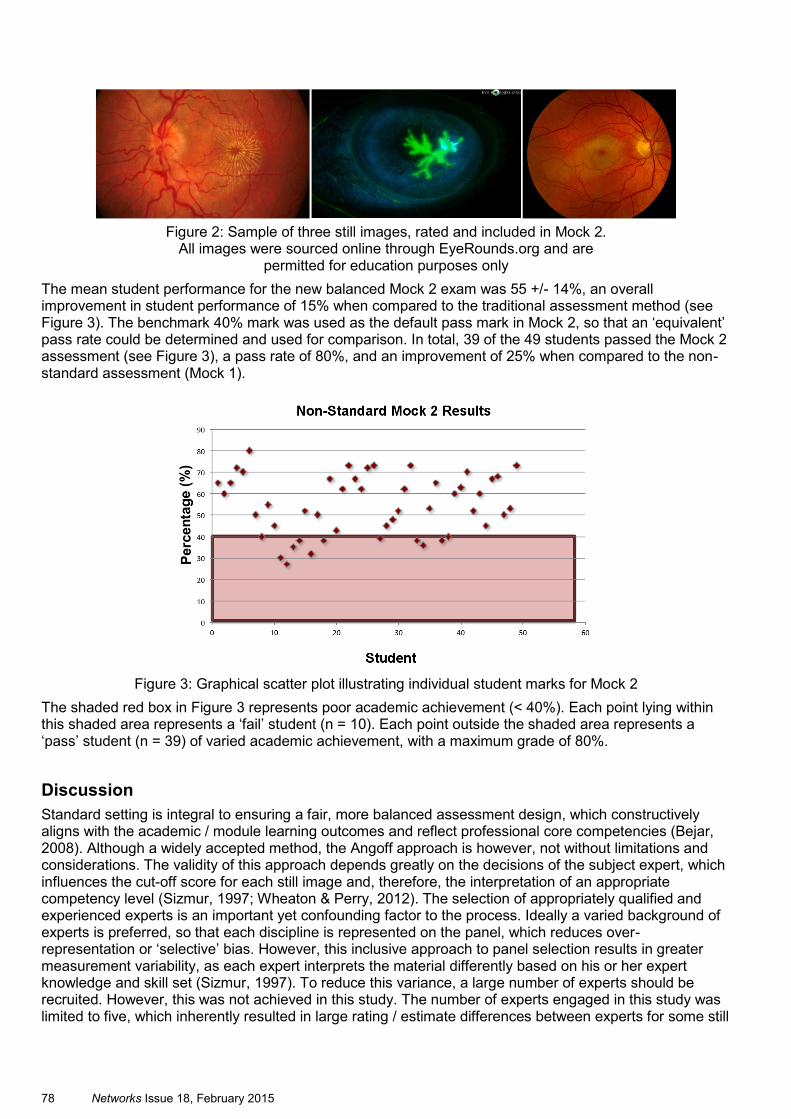
78 Networks Issue 18, February 2015
Figure 2: Sample of three still images, rated and included in Mock 2.
All images were sourced online through EyeRounds.org and are permitted for education purposes only
The mean student performance for the new balanced Mock 2 exam was 55 +/- 14%, an overall improvement in student performance of 15% when compared to the traditional assessment method (see Figure 3). The benchmark 40% mark was used as the default pass mark in Mock 2, so that an ‘equivalent’ pass rate could be determined and used for comparison. In total, 39 of the 49 students passed the Mock 2 assessment (see Figure 3), a pass rate of 80%, and an improvement of 25% when compared to the non-standard assessment (Mock 1).
Figure 3: Graphical scatter plot illustrating individual student marks for Mock 2
The shaded red box in Figure 3 represents poor academic achievement (< 40%). Each point lying within this shaded area represents a ‘fail’ student (n = 10). Each point outside the shaded area represents a ‘pass’ student (n = 39) of varied academic achievement, with a maximum grade of 80%.
Discussion
Standard setting is integral to ensuring a fair, more balanced assessment design, which constructively aligns with the academic / module learning outcomes and reflect professional core competencies (Bejar, 2008). Although a widely accepted method, the Angoff approach is however, not without limitations and considerations. The validity of this approach depends greatly on the decisions of the subject expert, which influences the cut-off score for each still image and, therefore, the interpretation of an appropriate competency level (Sizmur, 1997; Wheaton & Perry, 2012). The selection of appropriately qualified and experienced experts is an important yet confounding factor to the process. Ideally a varied background of experts is preferred, so that each discipline is represented on the panel, which reduces over-representation or ‘selective’ bias. However, this inclusive approach to panel selection results in greater measurement variability, as each expert interprets the material differently based on his or her expert knowledge and skill set (Sizmur, 1997). To reduce this variance, a large number of experts should be recruited. However, this was not achieved in this study. The number of experts engaged in this study was limited to five, which inherently resulted in large rating / estimate differences between experts for some still
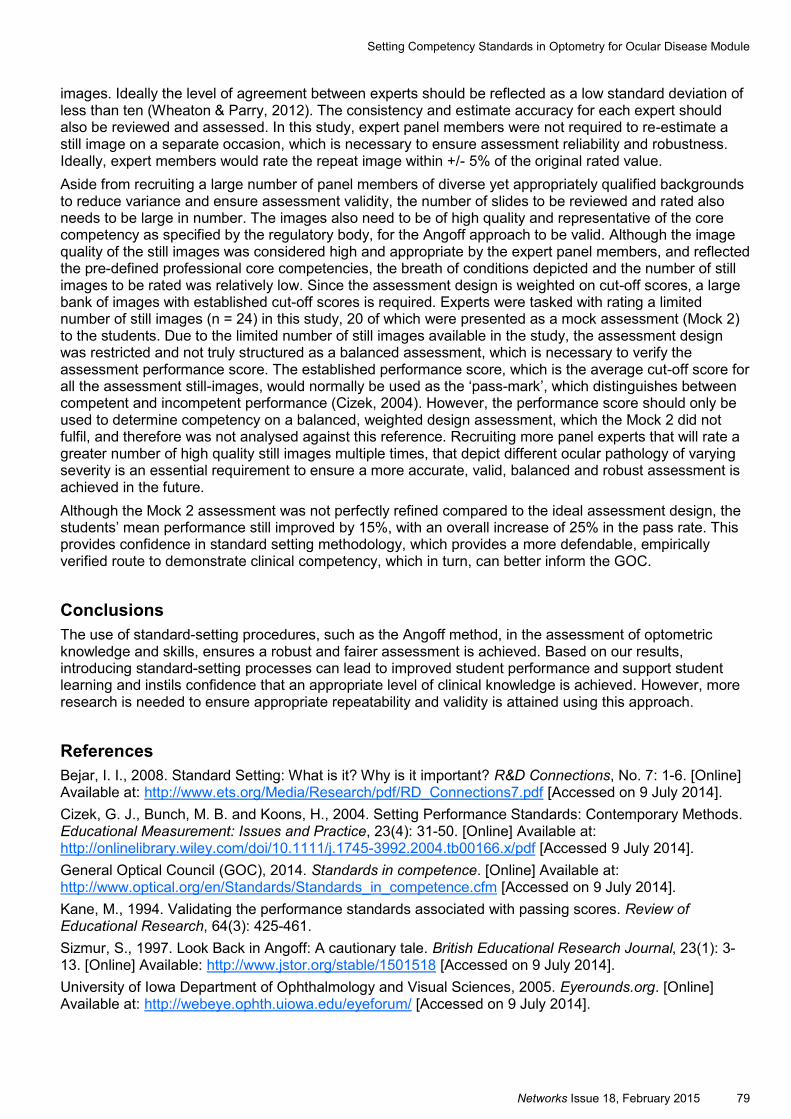
Networks Issue 18, February 2015 79
images. Ideally the level of agreement between experts should be reflected as a low standard deviation of less than ten (Wheaton & Parry, 2012). The consistency and estimate accuracy for each expert should also be reviewed and assessed. In this study, expert panel members were not required to re-estimate a still image on a separate occasion, which is necessary to ensure assessment reliability and robustness. Ideally, expert members would rate the repeat image within +/- 5% of the original rated value.
Aside from recruiting a large number of panel members of diverse yet appropriately qualified backgrounds to reduce variance and ensure assessment validity, the number of slides to be reviewed and rated also needs to be large in number. The images also need to be of high quality and representative of the core competency as specified by the regulatory body, for the Angoff approach to be valid. Although the image quality of the still images was considered high and appropriate by the expert panel members, and reflected the pre-defined professional core competencies, the breath of conditions depicted and the number of still images to be rated was relatively low. Since the assessment design is weighted on cut-off scores, a large bank of images with established cut-off scores is required. Experts were tasked with rating a limited number of still images (n = 24) in this study, 20 of which were presented as a mock assessment (Mock 2) to the students. Due to the limited number of still images available in the study, the assessment design was restricted and not truly structured as a balanced assessment, which is necessary to verify the assessment performance score. The established performance score, which is the average cut-off score for all the assessment still-images, would normally be used as the ‘pass-mark’, which distinguishes between competent and incompetent performance (Cizek, 2004). However, the performance score should only be used to determine competency on a balanced, weighted design assessment, which the Mock 2 did not fulfil, and therefore was not analysed against this reference. Recruiting more panel experts that will rate a greater number of high quality still images multiple times, that depict different ocular pathology of varying severity is an essential requirement to ensure a more accurate, valid, balanced and robust assessment is achieved in the future.
Although the Mock 2 assessment was not perfectly refined compared to the ideal assessment design, the students’ mean performance still improved by 15%, with an overall increase of 25% in the pass rate. This provides confidence in standard setting methodology, which provides a more defendable, empirically verified route to demonstrate clinical competency, which in turn, can better inform the GOC.
Conclusions
The use of standard-setting procedures, such as the Angoff method, in the assessment of optometric knowledge and skills, ensures a robust and fairer assessment is achieved. Based on our results, introducing standard-setting processes can lead to improved student performance and support student learning and instils confidence that an appropriate level of clinical knowledge is achieved. However, more research is needed to ensure appropriate repeatability and validity is attained using this approach.
References
Bejar, I. I., 2008. Standard Setting: What is it? Why is it important? R&D Connections, No. 7: 1-6. [Online] Available at: http://www.ets.org/Media/Research/pdf/RD_Connections7.pdf [Accessed on 9 July 2014].
Cizek, G. J., Bunch, M. B. and Koons, H., 2004. Setting Performance Standards: Contemporary Methods. Educational Measurement: Issues and Practice, 23(4): 31-50. [Online] Available at: http://onlinelibrary.wiley.com/doi/10.1111/j.1745-3992.2004.tb00166.x/pdf [Accessed 9 July 2014].
General Optical Council (GOC), 2014. Standards in competence. [Online] Available at: http://www.optical.org/en/Standards/Standards_in_competence.cfm [Accessed on 9 July 2014].
Kane, M., 1994. Validating the performance standards associated with passing scores. Review of Educational Research, 64(3): 425-461.
Sizmur, S., 1997. Look Back in Angoff: A cautionary tale. British Educational Research Journal, 23(1): 3-13. [Online] Available: http://www.jstor.org/stable/1501518 [Accessed on 9 July 2014].
University of Iowa Department of Ophthalmology and Visual Sciences, 2005. Eyerounds.org. [Online] Available at: http://webeye.ophth.uiowa.edu/eyeforum/ [Accessed on 9 July 2014].
Setting Competency Standards in Optometry for Ocular Disease Module
80 Networks Issue 18, February 2015
Wheaton, A. and Parry, J., 2012. Test Defensibility in the US Coast Guard - Using the Angoff Method to Set Cut Scores. Questionmark 2012 Users Conference, New Orleans, March 20-23, 2012. [Online] Available at: https://www.questionmark.com/us/seminars/Documents/webinar_angoff_handout_may_2012.pdf [Accessed on 9 July 2014].
Networks Issue 18, February 2015 81
Guest Paper
Haven't a Clue: Guiding Undergraduates through a Literature Review
Dr Julie Teatheredge ([email protected]) and Mark Miller ([email protected]) Faculty of Health, Social Care and Education
Abstract
This report describes development of the content section of an undergraduate major project VLE site developed to guide students through the process of a literature review. This interactive site was developed in the form of a Cluedo board to engage students in a novel and interesting way of working through materials while trying to discover the missing person, weapon and room. In the construction of the Haven’t a Clue site, the tutor team brought together a range of existing materials which previously had been difficult to find and not presented within an organisational structure.
The key consideration in this task was to decide, ‘What activity do we want to generate in the student?’ and ‘How do we motivate students to plan and implement their progress?’ To this end, the VLE site also contains a communication mechanism to allow the tutor team to send motivational tips to larger student groups at key stages of their project.
Following the introduction of this VLE site, both student achievement and satisfaction have measurably increased.
Keywords
VLE, Literature Review, Undergraduate Major Project
82 Networks Issue 18, February 2015
Introduction and Background
I am the module leader for the Undergraduate Major Project (UGMP) module for the Faculty of Health, Social Care and Education (FHSCE), which is comprised of around 250 staff and 1300 students. The UGMP in FHSCE is a 10,000 word literature review. This is the last module that students undertake before they complete the National Student Survey (NSS). When I took it over, the student evaluations indicated that they were generally dissatisfied with the teaching and learning, and that they felt there was not enough teaching time. In addition, there was both a high fail rate and poor pass marks which affected degree classification. I felt this could be affecting our University NSS scores.
These were some of the major issues I faced when I was asked to develop this into streamlined, quality controlled module, which would enhance student learning and produce student and staff satisfaction (Wankel and Blessinger, 2013). This module had been designed to be autonomous with minimal teaching time and supervision. The students complained of lack of support due to this autonomous learning, and I felt these issues needed to be addressed. I felt that the students needed ‘a stimulating learning environment’ (Anglia Ruskin, 2011, p.3). Consequently I decided to develop an online activity centre (Bach, Haynes and Smith, 2007), in the form of an interactive VLE site, to support students through the module.
Development
I arranged a meeting with the Director of Learning and Teaching, the Learning Technologist, and a teaching colleague to discuss the development of an interactive VLE site. The aim was to address the unmet needs of the students by moving from factual or literal learning to interpretive, analytic and inferential learning (Gau, 2012). The goal was to develop the content section of the existing VLE site to enable the students to complete their UGMP more effectively. The idea of a game was put forward as a teaching aid (Shanahan et al., 2006) and it was felt that a Cluedo board would be effective because each room could focus on the different elements of developing a literature review, while at the same time allowing students to have fun (Shanahan et al., 2006). This led to the development of the Haven’t a Clue VLE site.
I then led and managed the project. The Learning Technologist and I met on a regular basis to facilitate its development because I had the subject knowledge and he the technical knowledge. The aim was to develop a novel mode of learning, incorporating an engaging innovative environment. Thus the focus was to transform the UGMP into a student-centred learning environment (Gau, 2012) which has an evidence base, utilising materials which are ‘cognitively rich’ (Gau, 2012, p.8).
Furthermore, we believed that this teaching and learning development needed to incorporate all learning styles (Kolb, 1984) to ensure it was inclusive and met all students’ learning needs. As we are aware that not everyone will have played Cluedo, the concept and the game is explained during the classroom teaching (Shanahan et al., 2006), and the students are shown how to use the VLE site. Our goal was to develop a centre of excellence which involved the use of effective communication.
Extensive teaching and learning material was already available (Hinchcliff, 2009) for the UGMP. Some of this information was already available in the document section of the existing VLE site, including a podcast which I had produced, plus teaching materials in the form of exercises, power points and quizzes. The Learning Technologist and I then began a search for more materials at our University, which included an invitation to the librarians for their contribution. Materials and learning aids were found in a variety of locations including Student Services. Once the Learning Technologist had designed the board, which allowed students to play the actual game if they wished, he and I met to decide how the contents for each section of the board should be developed.
Biggs (2003) states that, ‘being active while learning is better than being inactive’ (2003, p 79). Dewey (1916) first introduced the concept of game playing as a methodology. Shanahan et al. (2006) study highlighted the effectiveness of game playing as a teaching aid, but cautioned that the game should not become more important than the learning, and the aim of the game should be to motivate the students. We kept these issues in mind, as each room on the board began its transformation into an area of engagement for the students to develop and master the skill of writing a literature review (Biggs, 2003).
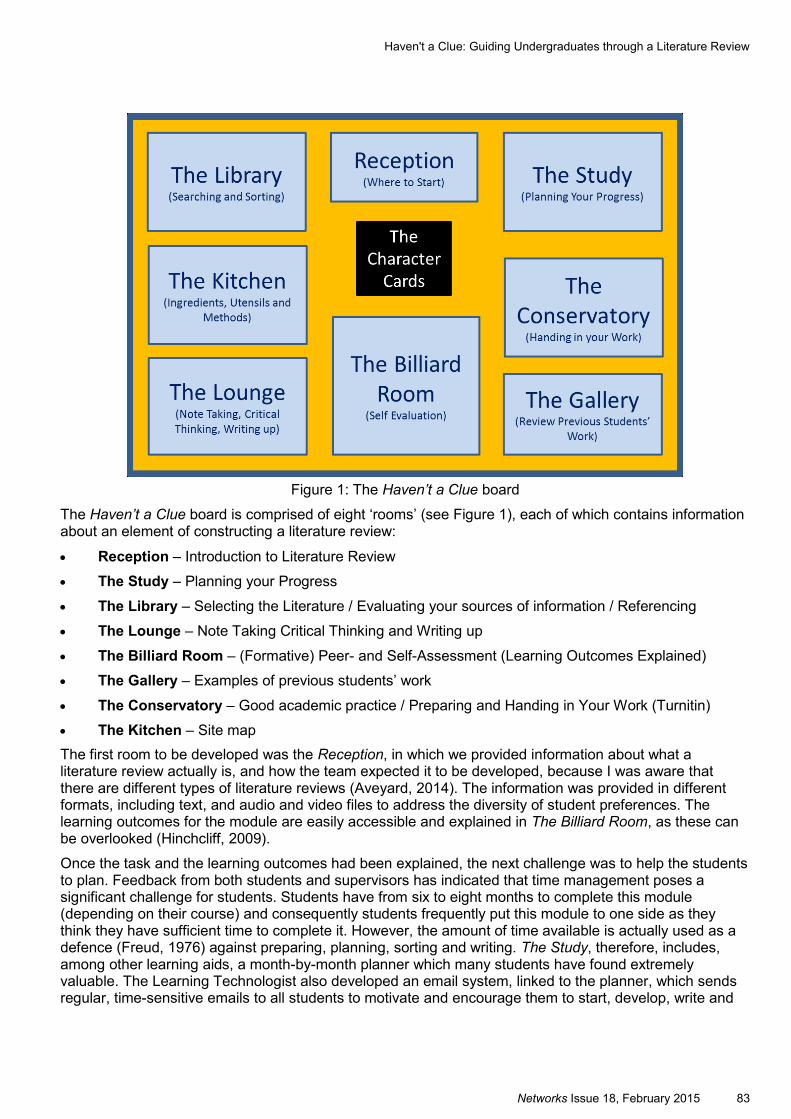
Networks Issue 18, February 2015 83
Figure 1: The Haven’t a Clue board
The Haven’t a Clue board is comprised of eight ‘rooms’ (see Figure 1), each of which contains information about an element of constructing a literature review:
Reception – Introduction to Literature Review
The Study – Planning your Progress
The Library – Selecting the Literature / Evaluating your sources of information / Referencing
The Lounge – Note Taking Critical Thinking and Writing up
The Billiard Room – (Formative) Peer- and Self-Assessment (Learning Outcomes Explained)
The Gallery – Examples of previous students’ work
The Conservatory – Good academic practice / Preparing and Handing in Your Work (Turnitin)
The Kitchen – Site map
The first room to be developed was the Reception, in which we provided information about what a literature review actually is, and how the team expected it to be developed, because I was aware that there are different types of literature reviews (Aveyard, 2014). The information was provided in different formats, including text, and audio and video files to address the diversity of student preferences. The learning outcomes for the module are easily accessible and explained in The Billiard Room, as these can be overlooked (Hinchcliff, 2009).
Once the task and the learning outcomes had been explained, the next challenge was to help the students to plan. Feedback from both students and supervisors has indicated that time management poses a significant challenge for students. Students have from six to eight months to complete this module (depending on their course) and consequently students frequently put this module to one side as they think they have sufficient time to complete it. However, the amount of time available is actually used as a defence (Freud, 1976) against preparing, planning, sorting and writing. The Study, therefore, includes, among other learning aids, a month-by-month planner which many students have found extremely valuable. The Learning Technologist also developed an email system, linked to the planner, which sends regular, time-sensitive emails to all students to motivate and encourage them to start, develop, write and
Haven't a Clue: Guiding Undergraduates through a Literature Review
84 Networks Issue 18, February 2015
polish their literature review, depending on their progress. Students can also review their progress via a planning survey.
These examples are just a brief overview of the depth of this development. Please visit the VLE site to explore further: https://vle.anglia.ac.uk/modules/2013/fhsceugmp/UGMP01/Content/Start.aspx
Evaluation
Staff feedback on the site has been overwhelmingly positive from the outset. One member of staff said that student feedback was that the site was ‘fantastic’, and that they had nominated it for an award. My department head reported how other members of staff had praised the site, and complemented the Haven’t a Clue board, especially its pedagogic underpinning.
Student feedback has been similarly positive. The students tell me it is excellent and that it helps to motivate them and encourages them to learn. One student, for example, sent an email declaring:
I have discovered Cluedo! I remember seeing this before but I thought it was a pop-up and didn't realise it was a part of the course. It is a really good idea packed with a lot of information. I like how you have related it to everyday objects / tasks such as making beans on toast.
Another student excitedly commented,
Julie!! I have done my first ever proper contents page, how cool is that?
However, it is The Gallery of previous students’ work and the examples of Ideas, Connections and Extensions (ICE) that the students tell me they value most. There was some discussions about UGMP examples and getting permission to put whole literature reviews in The Gallery. Kean (2012) suggests this can be an effective way of helping the students to understand the task, process and content expectations, however, each student is unique (Hinchcliff, 2009) and learning styles differ (Fleming and Mills, 1992). I was concerned that if a single literature review was placed in The Gallery it might overwhelm some students due to the style, and this could de-motivate some students and cause anxiety. Therefore, with each student’s permission, I uploaded sections from various parts of the reviews, an introduction, for example, or a search strategy, a historical component, a theme, a conclusion, and so forth. I then either criticised or analysed the sections from a supervisor perspective and included my comments, as although these exemplars achieved high marks, none of them were perfect. Therefore the comments are meant to guide the students to aim higher (Anglia Ruskin, 2011). What I did next was to ICE one of the themes by highlighting in colour the ideas, connections and extensions, because many students could not understand how to build and develop the review. The student’s feedback about The Gallery has been highly positive with students commenting on how this has clarified the process for them. Staff have also complimented this section as ‘an excellent learning strategy’.
Another important aspect of the site is that all information the students could need is in one place. In my experience, based on the emails and phone calls I get before hand-in, it is the ‘little issues’ (e.g. assignment format, negotiating the hand-in process, and so forth) that generate the most anxiety (Killgallon, 2012) for students before hand-in, not the actual content, and the materials in Haven’t a Clue address all these little issues.
The development is ongoing which includes the regular emails to students. I have permission to put more exemplars in The Gallery and I am currently writing the supervisors’ notes. The Learning Technologist and I are also developing a questionnaire to send via SurveyMonkey, to evaluate the board more formally (Aveyard, 2014). Workshops will be facilitated for staff who are unfamiliar with the content section, to help them understand the process and, like me, to use it in supervisions with their students to explain formative feedback in a more visual manner.
The Haven’t a Clue board received a commendation at a validation event this year, which included externals. The results of the evaluations will aid further developments and we intend to produced and publish a full paper in due course. The VLE site was presented at the Anglia Ruskin Learning and Teaching Conference 2014, and we hope to present externally later this year.
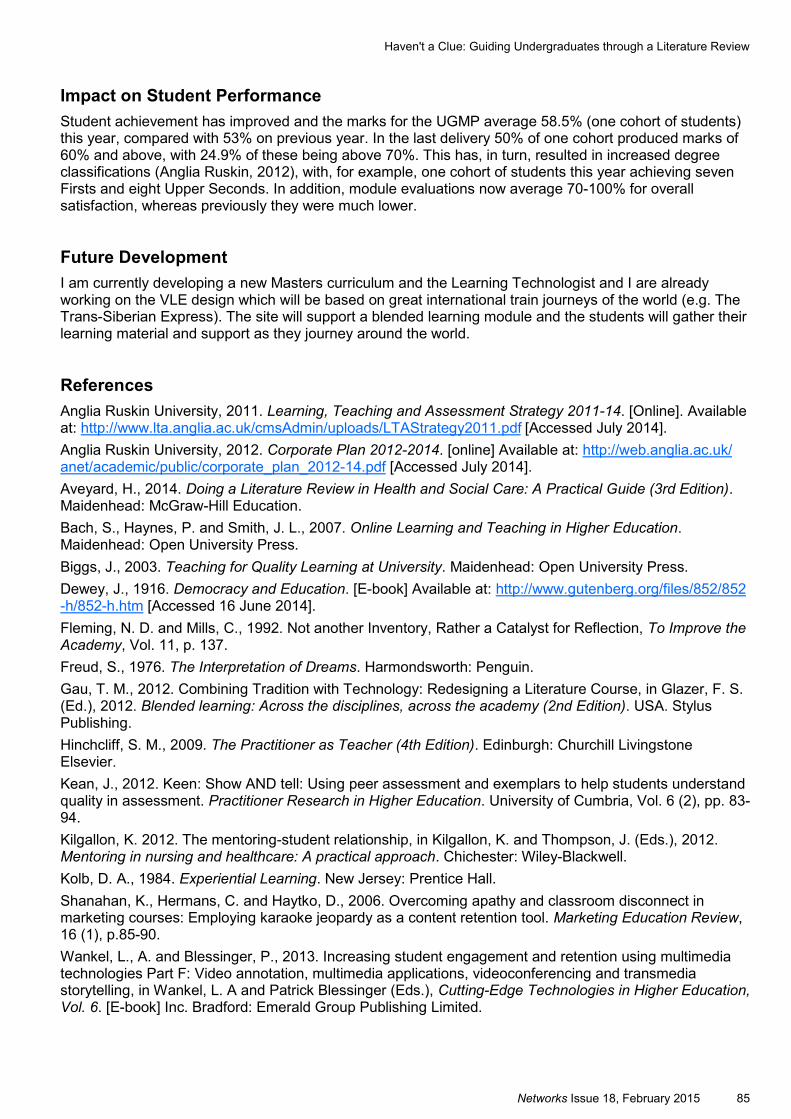
Networks Issue 18, February 2015 85
Impact on Student Performance
Student achievement has improved and the marks for the UGMP average 58.5% (one cohort of students) this year, compared with 53% on previous year. In the last delivery 50% of one cohort produced marks of 60% and above, with 24.9% of these being above 70%. This has, in turn, resulted in increased degree classifications (Anglia Ruskin, 2012), with, for example, one cohort of students this year achieving seven Firsts and eight Upper Seconds. In addition, module evaluations now average 70-100% for overall satisfaction, whereas previously they were much lower.
Future Development
I am currently developing a new Masters curriculum and the Learning Technologist and I are already working on the VLE design which will be based on great international train journeys of the world (e.g. The Trans-Siberian Express). The site will support a blended learning module and the students will gather their learning material and support as they journey around the world.
References
Anglia Ruskin University, 2011. Learning, Teaching and Assessment Strategy 2011-14. [Online]. Available at: http://www.lta.anglia.ac.uk/cmsAdmin/uploads/LTAStrategy2011.pdf [Accessed July 2014].
Anglia Ruskin University, 2012. Corporate Plan 2012-2014. [online] Available at: http://web.anglia.ac.uk/anet/academic/public/corporate_plan_2012-14.pdf [Accessed July 2014].
Aveyard, H., 2014. Doing a Literature Review in Health and Social Care: A Practical Guide (3rd Edition). Maidenhead: McGraw-Hill Education.
Bach, S., Haynes, P. and Smith, J. L., 2007. Online Learning and Teaching in Higher Education. Maidenhead: Open University Press.
Biggs, J., 2003. Teaching for Quality Learning at University. Maidenhead: Open University Press.
Dewey, J., 1916. Democracy and Education. [E-book] Available at: http://www.gutenberg.org/files/852/852-h/852-h.htm [Accessed 16 June 2014].
Fleming, N. D. and Mills, C., 1992. Not another Inventory, Rather a Catalyst for Reflection, To Improve the Academy, Vol. 11, p. 137.
Freud, S., 1976. The Interpretation of Dreams. Harmondsworth: Penguin.
Gau, T. M., 2012. Combining Tradition with Technology: Redesigning a Literature Course, in Glazer, F. S. (Ed.), 2012. Blended learning: Across the disciplines, across the academy (2nd Edition). USA. Stylus Publishing.
Hinchcliff, S. M., 2009. The Practitioner as Teacher (4th Edition). Edinburgh: Churchill Livingstone Elsevier.
Kean, J., 2012. Keen: Show AND tell: Using peer assessment and exemplars to help students understand quality in assessment. Practitioner Research in Higher Education. University of Cumbria, Vol. 6 (2), pp. 83-94.
Kilgallon, K. 2012. The mentoring-student relationship, in Kilgallon, K. and Thompson, J. (Eds.), 2012. Mentoring in nursing and healthcare: A practical approach. Chichester: Wiley-Blackwell.
Kolb, D. A., 1984. Experiential Learning. New Jersey: Prentice Hall.
Shanahan, K., Hermans, C. and Haytko, D., 2006. Overcoming apathy and classroom disconnect in marketing courses: Employing karaoke jeopardy as a content retention tool. Marketing Education Review, 16 (1), p.85-90.
Wankel, L., A. and Blessinger, P., 2013. Increasing student engagement and retention using multimedia technologies Part F: Video annotation, multimedia applications, videoconferencing and transmedia storytelling, in Wankel, L. A and Patrick Blessinger (Eds.), Cutting-Edge Technologies in Higher Education, Vol. 6. [E-book] Inc. Bradford: Emerald Group Publishing Limited.
Haven't a Clue: Guiding Undergraduates through a Literature Review