fifteen-year assessment of a permeable reactive barrier for treatment of chromate and...
TRANSCRIPT
Science of the Total Environment 468–469 (2014) 186–194
Contents lists available at ScienceDirect
Science of the Total Environment
j ourna l homepage: www.e lsev ie r .com/ locate /sc i totenv
Fifteen-year assessment of a permeable reactive barrier for treatment ofchromate and trichloroethylene in groundwater
Richard T. Wilkin a,⁎, Steven D. Acree a, Randall R. Ross a, Robert W. Puls b, Tony R. Lee a, Leilani L. Woods c
a United States Environmental Protection Agency, National Risk Management Research Laboratory, Ground Water and Ecosystems Restoration Division, 919 Kerr Research Drive, Ada, OK,74820, USAb Oklahoma Water Survey, University of Oklahoma, 301 David L. Boren Blvd., Norman, OK, 73019, USAc U.S. Coast Guard Base Elizabeth City, 1664 Weeksville Road, Bldg 981, Elizabeth City, NC, 27909, USA
H I G H L I G H T S
• We examine the fifteen-year performance record of a permeable reactive barrier.• The longest available performance record of a PRB for groundwater treatment.• Chromate concentrations have been reduced to below regulatory thresholds.• Trichloroethylene treatment has also been effective.• Groundwater in the PRB remains moderately alkaline and moderately reducing.
⁎ Corresponding author. Tel.: +1 580 436 8874.E-mail address: [email protected] (R.T. Wilkin).
0048-9697/$ – see front matter. Published by Elsevier B.Vhttp://dx.doi.org/10.1016/j.scitotenv.2013.08.056
a b s t r a c t
a r t i c l e i n f oArticle history:Received 12 June 2013Received in revised form 15 August 2013Accepted 17 August 2013Available online 7 September 2013
Editor: Eddy Y. Zeng
Keywords:Permeable reactive barrierGranular ironLong-term performanceChromiumTrichloroethyleneGroundwater remediation
The fifteen-year performance of a granular iron, permeable reactive barrier (PRB; Elizabeth City, North Carolina)is reviewedwith respect to contaminant treatment (hexavalent chromium and trichloroethylene) and hydraulicperformance. Due to in-situ treatment of the chromium source zone, reactive and hydraulic longevity of the PRBhas outlived the mobile chromate plume. Chromium concentrations exceeding 3 μg/L have not been detected inregions located hydraulically down-gradient of the PRB. Trichloroethylene treatment has also been effective, al-though non-constant influent concentrations of trichloroethylene have at times resulted in incomplete dechlori-nation. Daughter products: cis-1,2-dichloroethylene, vinyl chloride, ethene, and ethane have been observedwithin and down-gradient of the PRB at levels b10% of the influent trichloroethylene. Analysis of potentiometricsurfaces up-gradient and across the PRB suggests that the PRBmay currently represent a zone of reduced hydraulicconductivity; however, measurements of the in-situ hydraulic conductivity provide values in excess of 200 m/d insome intervals and indicate no discernible loss of bulk hydraulic conductivitywithin the PRB. The results presentedhere are particularly significant because they provide the longest available record of performance of a PRB. The lon-gevity of the Elizabeth City PRB is principally the result of favorable groundwater geochemistry and hydrologicproperties of the site.
Published by Elsevier B.V.
1. Introduction
Interest in site-specific evaluations of the permeable reactive barrier(PRB) technology continues to be high, particularly assessments re-lating to media longevity and hydraulic performance. Compared tothe large number of full-scale PRB applications around the worldconstructed to remediate groundwater contamination, few long-term data are available in the literature that provide detail on the re-active and hydraulic performance of PRBs (e.g., Warner et al., 2005;
.
Phillips et al., 2010). Higgins and Olson (2009) conducted life-cyclecomparisons of PRBs versus pump-and-treat systems for groundwaterremediation. Based on their analysis, environmental impacts fromPRBs are drivenmainly bymaterial production requirements and by en-ergy usage during construction, while for pump-and-treat systems,environmental impacts are driven by energy demands of operation.Higgins and Olson (2009) conclude that the minimum longevityneeded of granular iron PRBs to out-compete pump-and-treat sys-tems is 10 years. Consequently, key input factors for life-cycle analysisand cost/performance assessment are predictive tools that reasonablyestimate long-term PRB performance using site-specific parameterssuch as groundwater chemistry and hydrologic setting. Ideally pre-dictive tools are grounded in field-based observations (Hendersonand Demond, 2007) and are able to link model results together
187R.T. Wilkin et al. / Science of the Total Environment 468–469 (2014) 186–194
with data from lab-scale column experiments (Carniato et al.,2012).
Warner et al. (2005) reported on the hydraulic and chemical perfor-mance of the first commercial PRB constructed in the U.S. with granulariron metal after 10 years of operation. The PRB was installed to treatchlorinated hydrocarbon contamination in groundwater, primarilytrichloroethylene (TCE) and its daughter products, including cis-1,2-dichloroethylene (cis-DCE) and vinyl chloride (VC). Significantobservations at the 10-year point included: continued degradationof contaminants, strongly reducing conditions (EH near −500 mV),elevated pH (~11), depleted concentrations of divalent cations inthe core of the PRB compared to ambient groundwater outside ofthe PRB, and high aqueous concentrations of hydrogen, a reactionproduct of iron corrosion (Warner et al., 2005). Phillips et al.(2010) also provided a 10-year performance evaluation at Europe'soldest commercially-installed granular iron PRB located in NorthernIreland. Their data similarly show effective treatment of TCE as con-taminated groundwater flows through the PRB. Mineralogy studiesindicate the accumulation of calcium and iron carbonates, iron sul-fides, and iron hydroxides, particularly near the influent zone ofthe PRB.
Long-term performance studies of PRBs for inorganic contaminantsare sparse (e.g., Flury et al., 2009; Muchitsch et al., 2011). Fluryet al. (2009) recently documented the 4-year performance of subsur-face installations of iron shavings for chromate remediation in a rapidlyflowing groundwater regime. Our previous reports have documentedgeochemical and hydrologic behavior at the Elizabeth City PRB, installedat theU.S. Coast Guard facility near Elizabeth City, North Carolina for thetreatment of hexavalent chromium and TCE (e.g., Puls et al., 1999a;Wilkin et al., 2003, 2005). This paper provides an update on systemper-formance after 15 years of operation, with specific focus on: 1) contam-inant concentration profiles and trends up-gradient, within, and down-gradient of the PRB; and, 2) hydraulic assessments up-gradient andwithin the reactive medium.
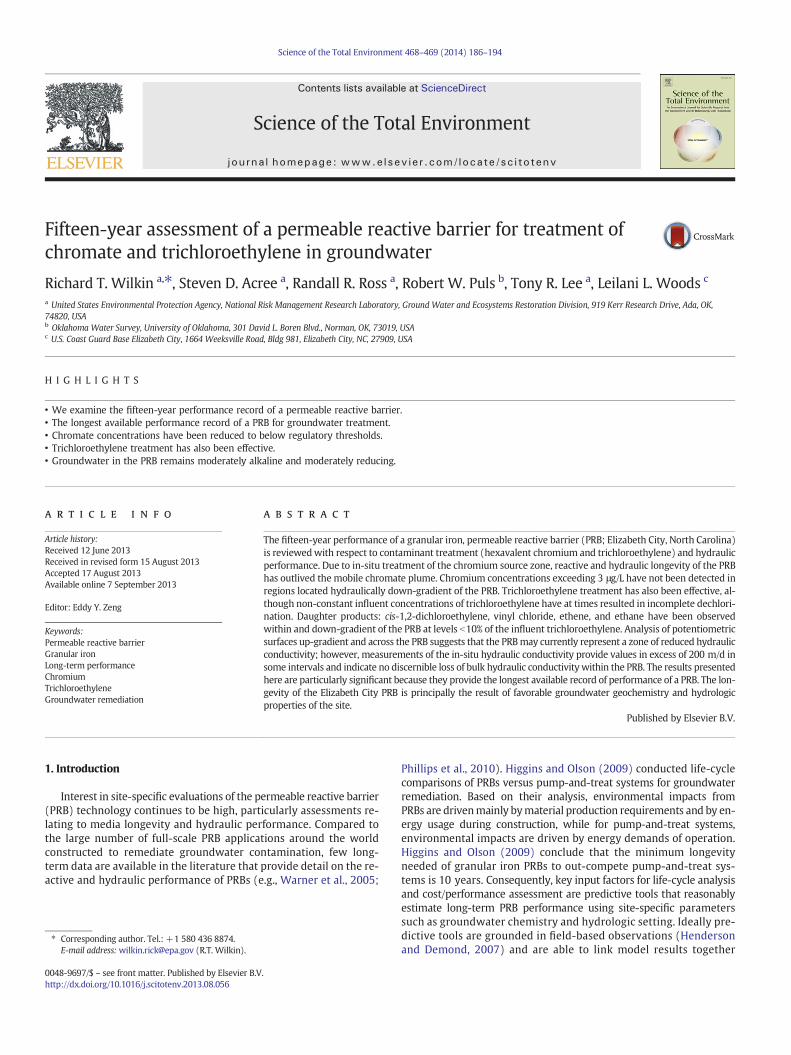
Fig. 1. a) Sitemap showing locations of the source (Plating Shop), PRB, outline of chromateplume, monitoring wells, and Transect 2 well cluster. Also shown are triangular zoneswhere potentiometric surfaces were evaluated. b) Cross-sectional diagram from z to z′showing Cr and TCE plumes and screened intervals of long-screen monitoring wells andshort-screen well clusters.
2. Materials and methods
2.1. Site background
The site is located 100 km south of Norfolk, Virginia on the southernbank of the Pasquotank River, about 5 km southeast of Elizabeth City,North Carolina. A metal plating shop operated for more than 30 yearsin Hangar 79, which is about 60 m south of the river (Fig. 1a). Followingits closure in 1984, soils beneath the shop were found to contain chro-mium concentrations up to 14,500 mg/kg. Subsequent investigation re-vealed a chromate plume extending from beneath the plating shop tothe river. At that time, the contaminant plume had high (N10 mg/L)concentrations of chromate, elevated sulfate (up to 150 mg/L), andminor amounts of volatile chlorinated organic compounds: TCE, cis-DCE,and VC.
In June of 1996, a 46 m long, 7.3 m deep, and 0.6 mwide permeablereactive barrier (continuouswall configuration) of zero-valent iron (Peer-less Metal Powders, Inc.) was installed approximately 30 m from thePasquotank River (Fig. 1a; Blowes et al., 1999). The reactive wall wasdesigned to remediate hexavalent chromium-contaminated groundwaterand portions of the larger overlapping plume of volatile chlorinatedorganic compounds. In 1999 a pilot-scale injection of sodium dithionitewas conducted to evaluate the response of the source-zone hexavalentchromium beneath Hangar 79 (Kahn and Puls, 2003). Based on the suc-cess of this test a full-scale treatment with sodium dithionite was car-ried out in 2001 (Malone et al., 2004). The objective of dithionitetreatment is to allow naturally occurring ferric iron-bearing mineralsin the aquifer matrix to reduce to a reactive ferrous iron state; ferrousiron drives the reduction of mobile hexavalent chromium to the insolu-ble trivalent state.
2.2. Site evaluation
Evaluation of the Elizabeth City PRB has consisted of detailedgroundwater sampling, hydrologic characterization, core collectionand solid-phase studies. In this paper we focus primarily on ground-water sampling results and contaminant profiles through time. A de-tailed monitoring network of over 130 subsurface sampling pointswas installed in November of 1996 to provide detailed informationon spatial and temporal changes in pore water geochemistry and hy-drology. A series of 2-inch compliance wells have been sampled on aquarterly, biannual, or annual basis (Fig. 1). In addition, three de-tailed transects consisting of multi-level monitoring wells havebeen sampled (6-inch screens attached to 1/4″ Teflon tubing), gener-ally on an annual basis. Here we focus on Transect 2 (ML21–ML25;Fig. 1), which was placed in a position to coincide with the core ofthe chromate plume.
2.3. Groundwater sampling and analysis
Details on groundwater sampling methodology and field analysiswere published previously in Paul et al. (2003); these methods havebeen used consistently for the project. Sample analysis was carried outin laboratories at the R.S. Kerr Environmental Research Center inAda, OK. Not surprisingly, over 15 years of research analytical
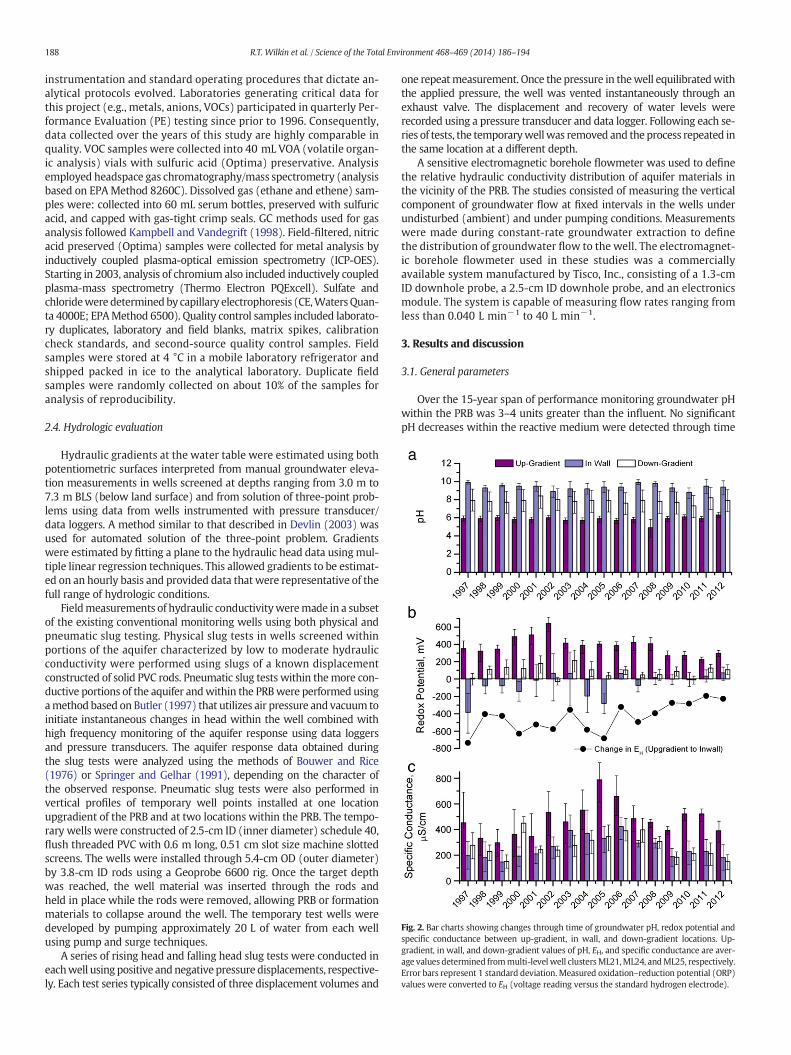
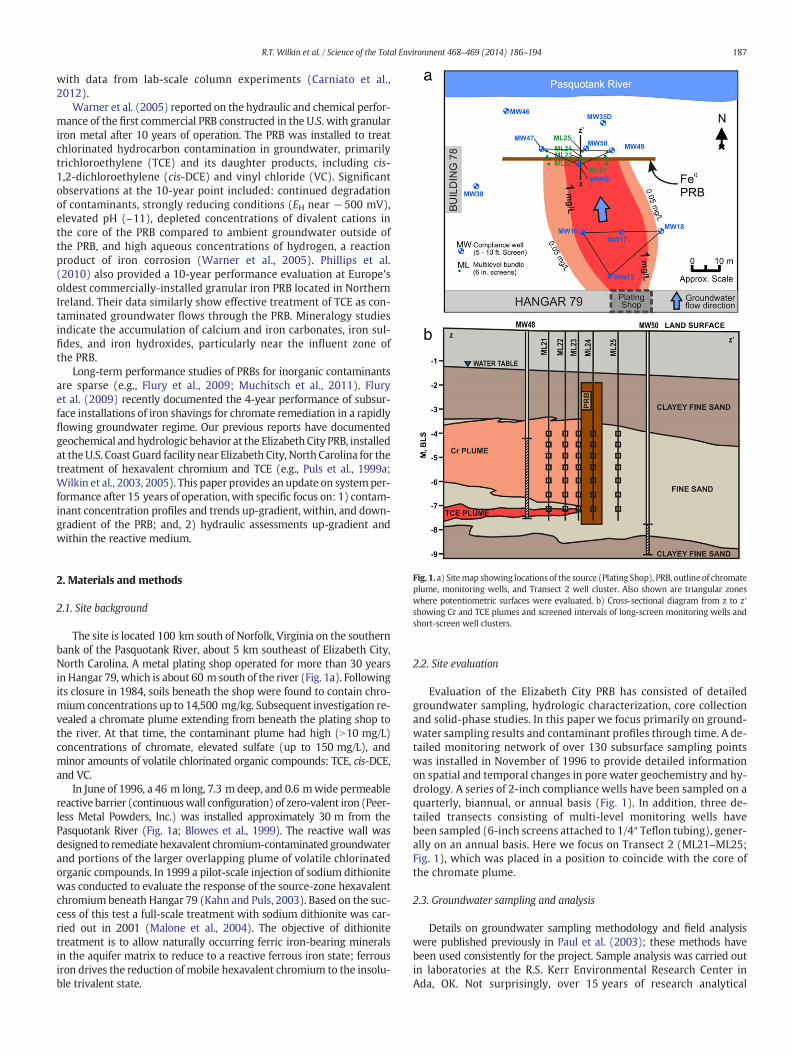
Fig. 2. Bar charts showing changes through time of groundwater pH, redox potential andspecific conductance between up-gradient, in wall, and down-gradient locations. Up-gradient, in wall, and down-gradient values of pH, EH, and specific conductance are aver-age values determined frommulti-level well clustersML21,ML24, andML25, respectively.Error bars represent 1 standard deviation. Measured oxidation–reduction potential (ORP)values were converted to EH (voltage reading versus the standard hydrogen electrode).
188 R.T. Wilkin et al. / Science of the Total Environment 468–469 (2014) 186–194
instrumentation and standard operating procedures that dictate an-alytical protocols evolved. Laboratories generating critical data forthis project (e.g., metals, anions, VOCs) participated in quarterly Per-formance Evaluation (PE) testing since prior to 1996. Consequently,data collected over the years of this study are highly comparable inquality. VOC samples were collected into 40 mL VOA (volatile organ-ic analysis) vials with sulfuric acid (Optima) preservative. Analysisemployed headspace gas chromatography/mass spectrometry (analysisbased on EPAMethod 8260C). Dissolved gas (ethane and ethene) sam-ples were: collected into 60 mL serum bottles, preserved with sulfuricacid, and capped with gas-tight crimp seals. GC methods used for gasanalysis followed Kampbell and Vandegrift (1998). Field-filtered, nitricacid preserved (Optima) samples were collected for metal analysis byinductively coupled plasma-optical emission spectrometry (ICP-OES).Starting in 2003, analysis of chromium also included inductively coupledplasma-mass spectrometry (Thermo Electron PQExcell). Sulfate andchloridewere determinedby capillary electrophoresis (CE,WatersQuan-ta 4000E; EPAMethod 6500). Quality control samples included laborato-ry duplicates, laboratory and field blanks, matrix spikes, calibrationcheck standards, and second-source quality control samples. Fieldsamples were stored at 4 °C in a mobile laboratory refrigerator andshipped packed in ice to the analytical laboratory. Duplicate fieldsamples were randomly collected on about 10% of the samples foranalysis of reproducibility.
2.4. Hydrologic evaluation
Hydraulic gradients at the water table were estimated using bothpotentiometric surfaces interpreted from manual groundwater eleva-tion measurements in wells screened at depths ranging from 3.0 m to7.3 m BLS (below land surface) and from solution of three-point prob-lems using data from wells instrumented with pressure transducer/data loggers. A method similar to that described in Devlin (2003) wasused for automated solution of the three-point problem. Gradientswere estimated by fitting a plane to the hydraulic head data usingmul-tiple linear regression techniques. This allowed gradients to be estimat-ed on an hourly basis and provided data that were representative of thefull range of hydrologic conditions.
Fieldmeasurements of hydraulic conductivityweremade in a subsetof the existing conventional monitoring wells using both physical andpneumatic slug testing. Physical slug tests in wells screened withinportions of the aquifer characterized by low to moderate hydraulicconductivity were performed using slugs of a known displacementconstructed of solid PVC rods. Pneumatic slug tests within themore con-ductive portions of the aquifer andwithin the PRBwere performed usingamethod based on Butler (1997) that utilizes air pressure and vacuum toinitiate instantaneous changes in head within the well combined withhigh frequency monitoring of the aquifer response using data loggersand pressure transducers. The aquifer response data obtained duringthe slug tests were analyzed using the methods of Bouwer and Rice(1976) or Springer and Gelhar (1991), depending on the character ofthe observed response. Pneumatic slug tests were also performed invertical profiles of temporary well points installed at one locationupgradient of the PRB and at two locations within the PRB. The tempo-rary wells were constructed of 2.5-cm ID (inner diameter) schedule 40,flush threaded PVC with 0.6 m long, 0.51 cm slot size machine slottedscreens. The wells were installed through 5.4-cm OD (outer diameter)by 3.8-cm ID rods using a Geoprobe 6600 rig. Once the target depthwas reached, the well material was inserted through the rods andheld in place while the rods were removed, allowing PRB or formationmaterials to collapse around the well. The temporary test wells weredeveloped by pumping approximately 20 L of water from each wellusing pump and surge techniques.
A series of rising head and falling head slug tests were conducted ineachwell using positive andnegative pressure displacements, respective-ly. Each test series typically consisted of three displacement volumes and
one repeatmeasurement. Once the pressure in thewell equilibratedwiththe applied pressure, the well was vented instantaneously through anexhaust valve. The displacement and recovery of water levels wererecorded using a pressure transducer and data logger. Following each se-ries of tests, the temporarywellwas removed and the process repeated inthe same location at a different depth.
A sensitive electromagnetic borehole flowmeter was used to definethe relative hydraulic conductivity distribution of aquifer materials inthe vicinity of the PRB. The studies consisted of measuring the verticalcomponent of groundwater flow at fixed intervals in the wells underundisturbed (ambient) and under pumping conditions. Measurementswere made during constant-rate groundwater extraction to definethe distribution of groundwater flow to the well. The electromagnet-ic borehole flowmeter used in these studies was a commerciallyavailable system manufactured by Tisco, Inc., consisting of a 1.3-cmID downhole probe, a 2.5-cm ID downhole probe, and an electronicsmodule. The system is capable of measuring flow rates ranging fromless than 0.040 L min−1 to 40 L min−1.
3. Results and discussion
3.1. General parameters
Over the 15-year span of performance monitoring groundwater pHwithin the PRB was 3–4 units greater than the influent. No significantpH decreases within the reactive medium were detected through time
189R.T. Wilkin et al. / Science of the Total Environment 468–469 (2014) 186–194
(Fig. 2a). The steep pH gradient at the PRB entrance drives importantmineralization processes as noted in previous studies (e.g., Mathesonand Tratnyek, 1994; O'Hannesin and Gillham, 1998). Effluent pH isconsistently intermediate to the influent and the PRB. The changein redox potential (EH) between the influent and the PRB varied be-tween about −200 mV and −740 mV, with an apparent decreasein the redox gradient through time (Fig. 2b). Again, EH of the effluentis typically intermediate to the influent and the PRB. Although EH inthe PRB has generally maintained negative values that support re-ductive processes, such as biotic reduction of sulfate and abiotic re-duction of hexavalent chromium, it appears that system capacity tomaintain reducing conditions may be diminishing with time. Asnoted in previous studies, the specific conductance of groundwaterconsistently decreased between up-gradient and down-gradient lo-cations, reflecting mineral formation in the PRB (Wilkin and Puls,2003). The decrease in specific conductance, or total dissolved solids,between up-gradient and in-wall environments primarily resultsfrom decreases in the concentrations of calcium, bicarbonate, andsulfate (as well as magnesium, silicon, and nitrate; Fig. 2c). Thesechanges are related to precipitation of calcium carbonate, triggeredby increasing pH, and the reduction of sulfate to sulfide followed byprecipitation of mackinawite (Furukawa et al., 2002; Wilkin et al.,2003). As a result of these processes the residual composition oftreated water shifts from sodium-sulfate type to sodium-chloridetype (Fig. 3).
3.2. Chromium
Sampling frequency of compliance wells progressed from quar-terly (1995–2001), to biannual (2001–2005), to annual (2005–present; Fig. 4). Changes to the monitoring program were recom-mended and approved by the state regulatory agency as consistentperformance trends were documented. Long-term trends in chromiumconcentrations for monitoring wells MW13 and MW48 (up-gradient)and MW46, MW49, and MW50 (down-gradient) show that chromiumconcentrations above 3 μg/L (ICP-OES results) were never observedin compliance wells located hydraulically down-gradient of the PRB(Fig. 4b). Note that beginning in 2002, chromium concentrations
Fig. 3. Durov diagram showing water compositions and total dissolved solids in up-gradient (filleData from 2010 sampling event.
detected on the up-gradient side of the PRB began to drop precipi-tously, a trend possibly linked to source-area dithionite treatment(Malone et al., 2004). A detailed spatial and temporal representationof chromium concentrations in themulti-level well cluster immediatelyup-gradient of the PRB is shown in Fig. 4c. Initially, high chromiumlevelswere observed at a depth of 5 mBLS. From1996 to 2002maximalchromium concentrations shifted to shallower zones. After 2002, chro-mium concentrations over all depth intervals began to decrease andreached values b50 μg/L in 2007–2008; subsequently, concentrationsincreased at shallower levels (4.0 mand4.5 mBLS). Chromiumconcen-trations entering the PRB have decreased significantly with time andchromium influx has generally focused on the region above 5 m BLS.
High-resolution ICP-MS data indicate that chromium concentrationswithin and immediately down-gradient of the PRB have generally beenbelow 1 μg/L (mean values of 0.6 and 0.9 μg/L, respectively) since 2003.
Concentration data collected from multi-level wells in Transect 2provide a series of performance snapshots by revealing influent, interi-or, and effluent contaminant levels. Concentration data in Transect 2over fifteen years are summarized on cumulative percent diagrams togive an overall picture of performance through the lifetime of the PRB(Fig. 5). Influent concentrations of chromium have ranged from b0.1to about 4000 μg/L, with 50% of samples collected from the up-gradientML21 cluster above 50 μg/L. The highest concentrations of chromiumhave been observed over the depth interval from 4 to 5 m BLS. Cumula-tive concentration data for chromium within and down-gradient of thePRB show close agreement indicating that treatment of the down-gradient aquifer is a consequence of groundwater transport throughand reactionwithin the reactive medium (Fig. 5a). Chromium concentra-tions within and down-gradient of the PRB (ML24 and ML25) haveranged from b0.1 to 3 μg/L; the average treatment efficiency over fifteenyears is 99.9% (based on the 90th percentile influent concentration;%removal = [(Cin, 90% − Cout) / (Cin, 90%)] ∙ 100). A total of 220 sam-ples were collected from in-wall (ML24) and down-gradient (ML25)locations; chromium was not detected in any of these samples above aconcentration of 3 μg/L. Influent chromium concentrations have de-creased with time (Fig. 4c), which likely stems from dithionite treat-ment of the source area and natural attenuation of chromium in theaquifer between Hangar 79 and the PRB.
d purple circles), PRB (filled blue circles), and down-gradient locations (open black circles).
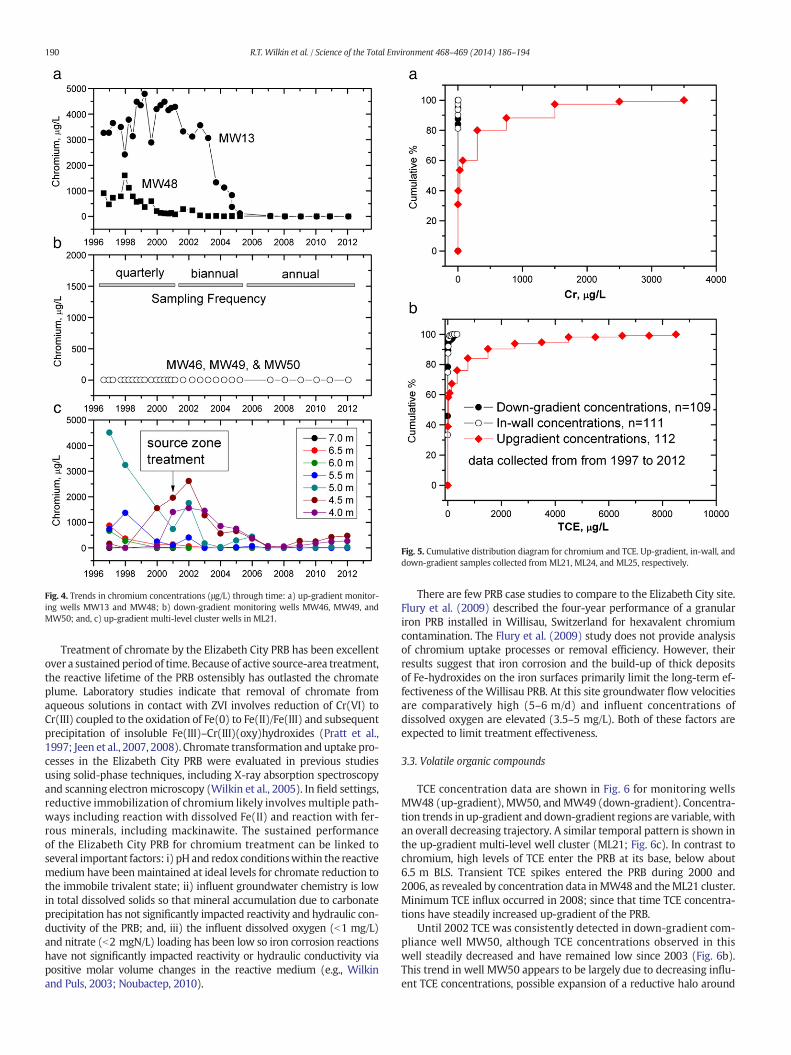
Fig. 4. Trends in chromium concentrations (μg/L) through time: a) up-gradient monitor-ing wells MW13 and MW48; b) down-gradient monitoring wells MW46, MW49, andMW50; and, c) up-gradient multi-level cluster wells in ML21.
Fig. 5. Cumulative distribution diagram for chromium and TCE. Up-gradient, in-wall, anddown-gradient samples collected from ML21, ML24, and ML25, respectively.
190 R.T. Wilkin et al. / Science of the Total Environment 468–469 (2014) 186–194
Treatment of chromate by the Elizabeth City PRB has been excellentover a sustained period of time. Because of active source-area treatment,the reactive lifetime of the PRB ostensibly has outlasted the chromateplume. Laboratory studies indicate that removal of chromate fromaqueous solutions in contact with ZVI involves reduction of Cr(VI) toCr(III) coupled to the oxidation of Fe(0) to Fe(II)/Fe(III) and subsequentprecipitation of insoluble Fe(III)–Cr(III)(oxy)hydroxides (Pratt et al.,1997; Jeen et al., 2007, 2008). Chromate transformation and uptake pro-cesses in the Elizabeth City PRB were evaluated in previous studiesusing solid-phase techniques, including X-ray absorption spectroscopyand scanning electronmicroscopy (Wilkin et al., 2005). In field settings,reductive immobilization of chromium likely involves multiple path-ways including reaction with dissolved Fe(II) and reaction with fer-rous minerals, including mackinawite. The sustained performanceof the Elizabeth City PRB for chromium treatment can be linked toseveral important factors: i) pH and redox conditionswithin the reactivemedium have beenmaintained at ideal levels for chromate reduction tothe immobile trivalent state; ii) influent groundwater chemistry is lowin total dissolved solids so that mineral accumulation due to carbonateprecipitation has not significantly impacted reactivity and hydraulic con-ductivity of the PRB; and, iii) the influent dissolved oxygen (b1 mg/L)and nitrate (b2 mgN/L) loading has been low so iron corrosion reactionshave not significantly impacted reactivity or hydraulic conductivity viapositive molar volume changes in the reactive medium (e.g., Wilkinand Puls, 2003; Noubactep, 2010).
There are few PRB case studies to compare to the Elizabeth City site.Flury et al. (2009) described the four-year performance of a granulariron PRB installed in Willisau, Switzerland for hexavalent chromiumcontamination. The Flury et al. (2009) study does not provide analysisof chromium uptake processes or removal efficiency. However, theirresults suggest that iron corrosion and the build-up of thick depositsof Fe-hydroxides on the iron surfaces primarily limit the long-term ef-fectiveness of the Willisau PRB. At this site groundwater flow velocitiesare comparatively high (5–6 m/d) and influent concentrations ofdissolved oxygen are elevated (3.5–5 mg/L). Both of these factors areexpected to limit treatment effectiveness.
3.3. Volatile organic compounds
TCE concentration data are shown in Fig. 6 for monitoring wellsMW48 (up-gradient), MW50, andMW49 (down-gradient). Concentra-tion trends in up-gradient and down-gradient regions are variable, withan overall decreasing trajectory. A similar temporal pattern is shown inthe up-gradient multi-level well cluster (ML21; Fig. 6c). In contrast tochromium, high levels of TCE enter the PRB at its base, below about6.5 m BLS. Transient TCE spikes entered the PRB during 2000 and2006, as revealed by concentration data inMW48 and theML21 cluster.Minimum TCE influx occurred in 2008; since that time TCE concentra-tions have steadily increased up-gradient of the PRB.
Until 2002 TCE was consistently detected in down-gradient com-pliance well MW50, although TCE concentrations observed in thiswell steadily decreased and have remained low since 2003 (Fig. 6b).This trend in well MW50 appears to be largely due to decreasing influ-ent TCE concentrations, possible expansion of a reductive halo around
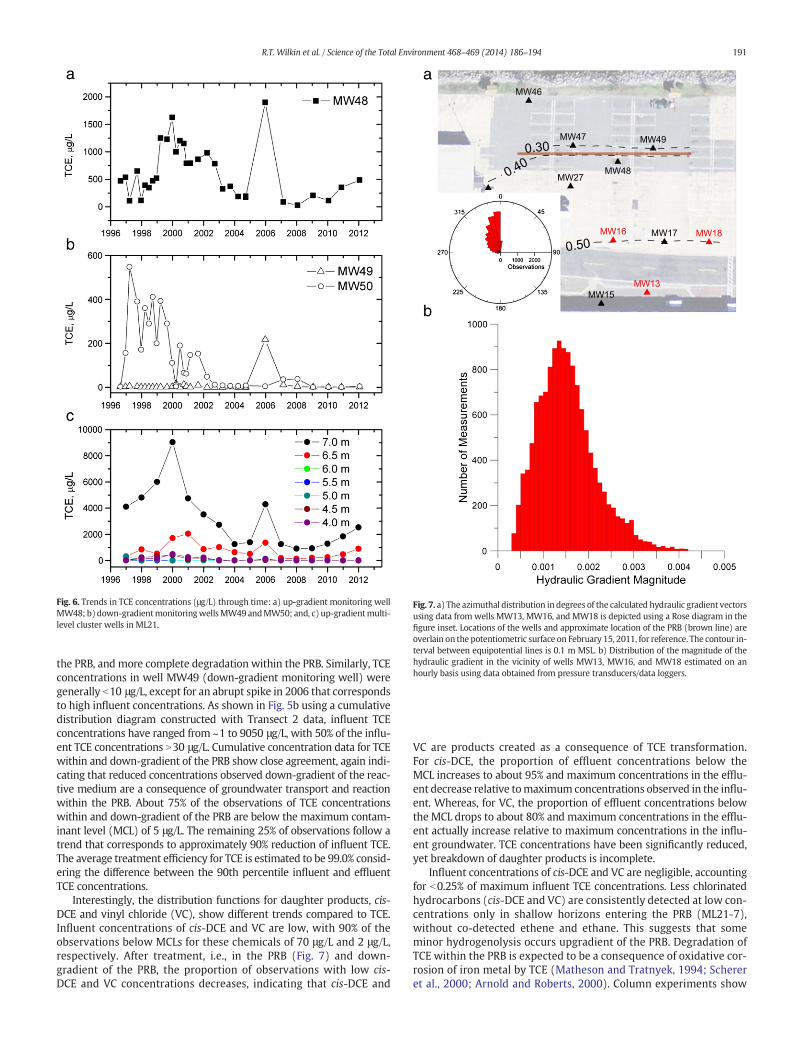
Fig. 6. Trends in TCE concentrations (μg/L) through time: a) up-gradient monitoring wellMW48; b) down-gradientmonitoringwellsMW49andMW50; and, c) up-gradientmulti-level cluster wells in ML21.
Fig. 7. a) The azimuthal distribution in degrees of the calculated hydraulic gradient vectorsusing data from wells MW13, MW16, and MW18 is depicted using a Rose diagram in thefigure inset. Locations of the wells and approximate location of the PRB (brown line) areoverlain on the potentiometric surface on February 15, 2011, for reference. The contour in-terval between equipotential lines is 0.1 m MSL. b) Distribution of the magnitude of thehydraulic gradient in the vicinity of wells MW13, MW16, and MW18 estimated on anhourly basis using data obtained from pressure transducers/data loggers.
191R.T. Wilkin et al. / Science of the Total Environment 468–469 (2014) 186–194
the PRB, and more complete degradation within the PRB. Similarly, TCEconcentrations in well MW49 (down-gradient monitoring well) weregenerally b10 μg/L, except for an abrupt spike in 2006 that correspondsto high influent concentrations. As shown in Fig. 5b using a cumulativedistribution diagram constructed with Transect 2 data, influent TCEconcentrations have ranged from ~1 to 9050 μg/L, with 50% of the influ-ent TCE concentrations N30 μg/L. Cumulative concentration data for TCEwithin and down-gradient of the PRB show close agreement, again indi-cating that reduced concentrations observed down-gradient of the reac-tive medium are a consequence of groundwater transport and reactionwithin the PRB. About 75% of the observations of TCE concentrationswithin and down-gradient of the PRB are below the maximum contam-inant level (MCL) of 5 μg/L. The remaining 25% of observations follow atrend that corresponds to approximately 90% reduction of influent TCE.The average treatment efficiency for TCE is estimated to be 99.0% consid-ering the difference between the 90th percentile influent and effluentTCE concentrations.
Interestingly, the distribution functions for daughter products, cis-DCE and vinyl chloride (VC), show different trends compared to TCE.Influent concentrations of cis-DCE and VC are low, with 90% of theobservations below MCLs for these chemicals of 70 μg/L and 2 μg/L,respectively. After treatment, i.e., in the PRB (Fig. 7) and down-gradient of the PRB, the proportion of observations with low cis-DCE and VC concentrations decreases, indicating that cis-DCE and
VC are products created as a consequence of TCE transformation.For cis-DCE, the proportion of effluent concentrations below theMCL increases to about 95% and maximum concentrations in the efflu-ent decrease relative tomaximum concentrations observed in the influ-ent. Whereas, for VC, the proportion of effluent concentrations belowthe MCL drops to about 80% and maximum concentrations in the efflu-ent actually increase relative to maximum concentrations in the influ-ent groundwater. TCE concentrations have been significantly reduced,yet breakdown of daughter products is incomplete.
Influent concentrations of cis-DCE and VC are negligible, accountingfor b0.25% of maximum influent TCE concentrations. Less chlorinatedhydrocarbons (cis-DCE and VC) are consistently detected at low con-centrations only in shallow horizons entering the PRB (ML21-7),without co-detected ethene and ethane. This suggests that someminor hydrogenolysis occurs upgradient of the PRB. Degradation ofTCE within the PRB is expected to be a consequence of oxidative cor-rosion of iron metal by TCE (Matheson and Tratnyek, 1994; Schereret al., 2000; Arnold and Roberts, 2000). Column experiments show
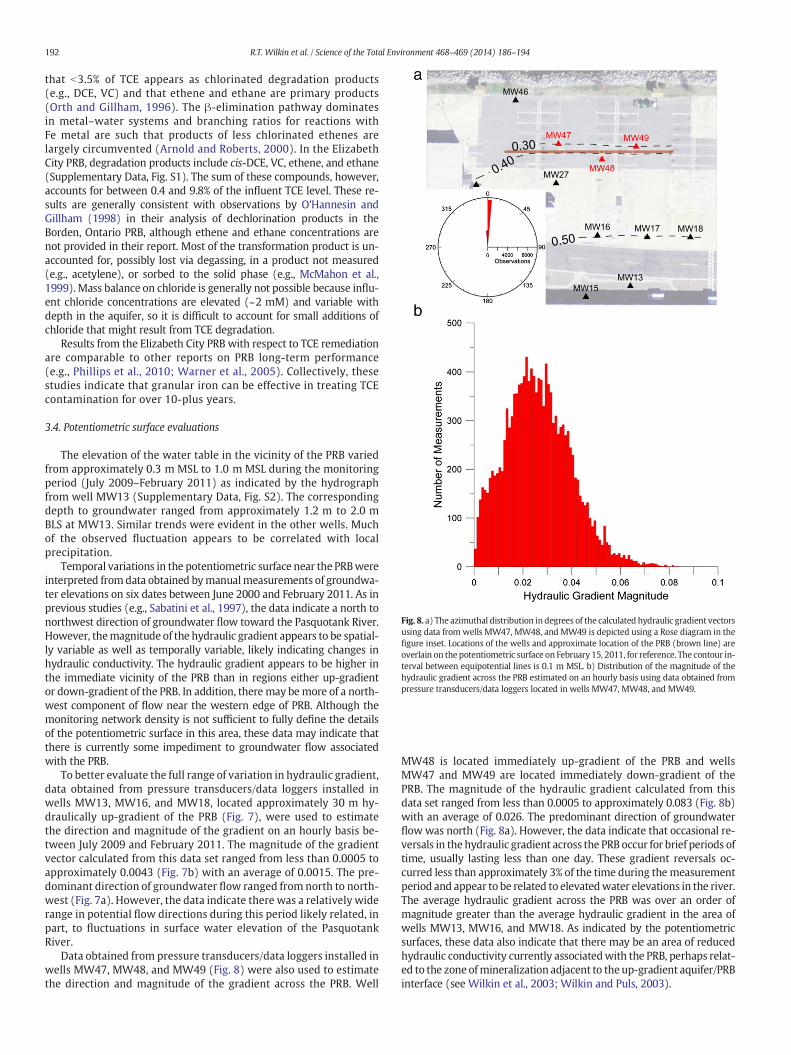
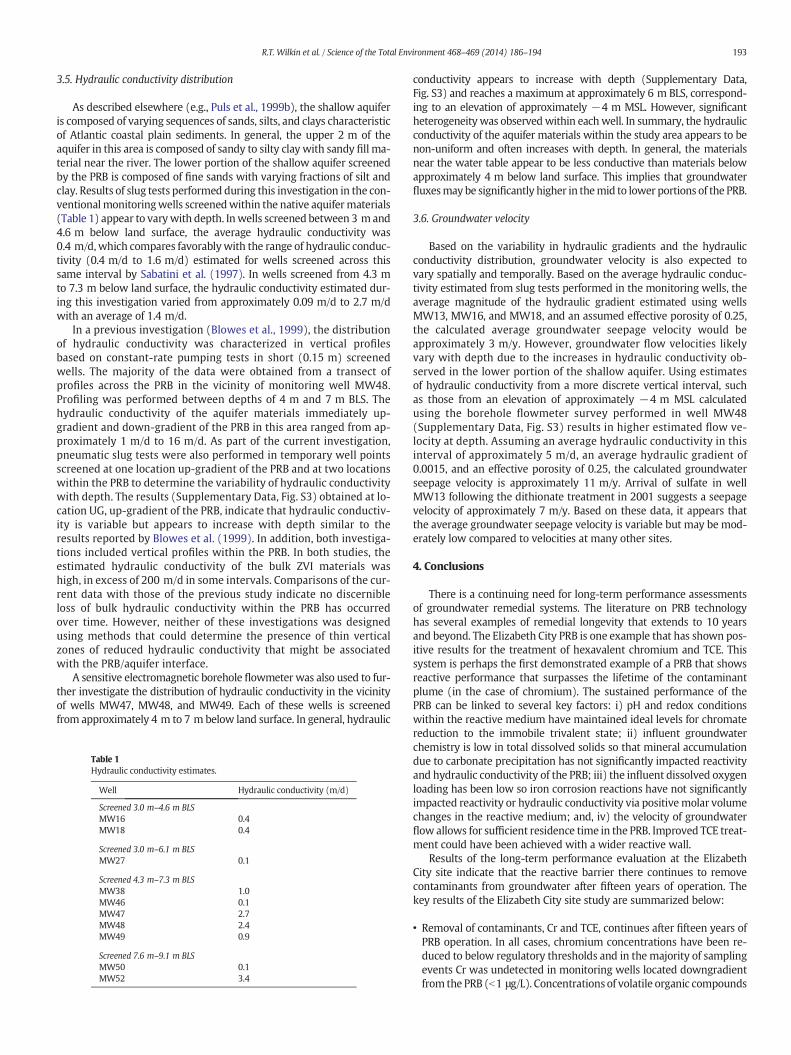
Fig. 8. a) The azimuthal distribution in degrees of the calculated hydraulic gradient vectorsusing data from wells MW47, MW48, and MW49 is depicted using a Rose diagram in thefigure inset. Locations of the wells and approximate location of the PRB (brown line) areoverlain on the potentiometric surface on February 15, 2011, for reference. The contour in-terval between equipotential lines is 0.1 m MSL. b) Distribution of the magnitude of thehydraulic gradient across the PRB estimated on an hourly basis using data obtained frompressure transducers/data loggers located in wells MW47, MW48, and MW49.
192 R.T. Wilkin et al. / Science of the Total Environment 468–469 (2014) 186–194
that b3.5% of TCE appears as chlorinated degradation products(e.g., DCE, VC) and that ethene and ethane are primary products(Orth and Gillham, 1996). The β-elimination pathway dominatesin metal–water systems and branching ratios for reactions withFe metal are such that products of less chlorinated ethenes arelargely circumvented (Arnold and Roberts, 2000). In the ElizabethCity PRB, degradation products include cis-DCE, VC, ethene, and ethane(Supplementary Data, Fig. S1). The sum of these compounds, however,accounts for between 0.4 and 9.8% of the influent TCE level. These re-sults are generally consistent with observations by O'Hannesin andGillham (1998) in their analysis of dechlorination products in theBorden, Ontario PRB, although ethene and ethane concentrations arenot provided in their report. Most of the transformation product is un-accounted for, possibly lost via degassing, in a product not measured(e.g., acetylene), or sorbed to the solid phase (e.g., McMahon et al.,1999). Mass balance on chloride is generally not possible because influ-ent chloride concentrations are elevated (~2 mM) and variable withdepth in the aquifer, so it is difficult to account for small additions ofchloride that might result from TCE degradation.
Results from the Elizabeth City PRB with respect to TCE remediationare comparable to other reports on PRB long-term performance(e.g., Phillips et al., 2010; Warner et al., 2005). Collectively, thesestudies indicate that granular iron can be effective in treating TCEcontamination for over 10-plus years.
3.4. Potentiometric surface evaluations
The elevation of the water table in the vicinity of the PRB variedfrom approximately 0.3 m MSL to 1.0 m MSL during the monitoringperiod (July 2009–February 2011) as indicated by the hydrographfrom well MW13 (Supplementary Data, Fig. S2). The correspondingdepth to groundwater ranged from approximately 1.2 m to 2.0 mBLS at MW13. Similar trends were evident in the other wells. Muchof the observed fluctuation appears to be correlated with localprecipitation.
Temporal variations in the potentiometric surface near the PRBwereinterpreted fromdata obtained bymanualmeasurements of groundwa-ter elevations on six dates between June 2000 and February 2011. As inprevious studies (e.g., Sabatini et al., 1997), the data indicate a north tonorthwest direction of groundwater flow toward the Pasquotank River.However, themagnitude of the hydraulic gradient appears to be spatial-ly variable as well as temporally variable, likely indicating changes inhydraulic conductivity. The hydraulic gradient appears to be higher inthe immediate vicinity of the PRB than in regions either up-gradientor down-gradient of the PRB. In addition, there may bemore of a north-west component of flow near the western edge of PRB. Although themonitoring network density is not sufficient to fully define the detailsof the potentiometric surface in this area, these data may indicate thatthere is currently some impediment to groundwater flow associatedwith the PRB.
To better evaluate the full range of variation in hydraulic gradient,data obtained from pressure transducers/data loggers installed inwells MW13, MW16, and MW18, located approximately 30 m hy-draulically up-gradient of the PRB (Fig. 7), were used to estimatethe direction and magnitude of the gradient on an hourly basis be-tween July 2009 and February 2011. The magnitude of the gradientvector calculated from this data set ranged from less than 0.0005 toapproximately 0.0043 (Fig. 7b) with an average of 0.0015. The pre-dominant direction of groundwater flow ranged from north to north-west (Fig. 7a). However, the data indicate there was a relatively widerange in potential flow directions during this period likely related, inpart, to fluctuations in surface water elevation of the PasquotankRiver.
Data obtained from pressure transducers/data loggers installed inwells MW47, MW48, and MW49 (Fig. 8) were also used to estimatethe direction and magnitude of the gradient across the PRB. Well
MW48 is located immediately up-gradient of the PRB and wellsMW47 and MW49 are located immediately down-gradient of thePRB. The magnitude of the hydraulic gradient calculated from thisdata set ranged from less than 0.0005 to approximately 0.083 (Fig. 8b)with an average of 0.026. The predominant direction of groundwaterflowwas north (Fig. 8a). However, the data indicate that occasional re-versals in the hydraulic gradient across the PRB occur for brief periods oftime, usually lasting less than one day. These gradient reversals oc-curred less than approximately 3% of the time during the measurementperiod and appear to be related to elevatedwater elevations in the river.The average hydraulic gradient across the PRB was over an order ofmagnitude greater than the average hydraulic gradient in the area ofwells MW13, MW16, and MW18. As indicated by the potentiometricsurfaces, these data also indicate that there may be an area of reducedhydraulic conductivity currently associatedwith the PRB, perhaps relat-ed to the zone ofmineralization adjacent to the up-gradient aquifer/PRBinterface (see Wilkin et al., 2003; Wilkin and Puls, 2003).
193R.T. Wilkin et al. / Science of the Total Environment 468–469 (2014) 186–194
3.5. Hydraulic conductivity distribution
As described elsewhere (e.g., Puls et al., 1999b), the shallow aquiferis composed of varying sequences of sands, silts, and clays characteristicof Atlantic coastal plain sediments. In general, the upper 2 m of theaquifer in this area is composed of sandy to silty clay with sandy fill ma-terial near the river. The lower portion of the shallow aquifer screenedby the PRB is composed of fine sands with varying fractions of silt andclay. Results of slug tests performed during this investigation in the con-ventionalmonitoringwells screenedwithin the native aquifermaterials(Table 1) appear to varywith depth. Inwells screened between 3 mand4.6 m below land surface, the average hydraulic conductivity was0.4 m/d, which compares favorablywith the range of hydraulic conduc-tivity (0.4 m/d to 1.6 m/d) estimated for wells screened across thissame interval by Sabatini et al. (1997). In wells screened from 4.3 mto 7.3 m below land surface, the hydraulic conductivity estimated dur-ing this investigation varied from approximately 0.09 m/d to 2.7 m/dwith an average of 1.4 m/d.
In a previous investigation (Blowes et al., 1999), the distributionof hydraulic conductivity was characterized in vertical profilesbased on constant-rate pumping tests in short (0.15 m) screenedwells. The majority of the data were obtained from a transect ofprofiles across the PRB in the vicinity of monitoring well MW48.Profiling was performed between depths of 4 m and 7 m BLS. Thehydraulic conductivity of the aquifer materials immediately up-gradient and down-gradient of the PRB in this area ranged from ap-proximately 1 m/d to 16 m/d. As part of the current investigation,pneumatic slug tests were also performed in temporary well pointsscreened at one location up-gradient of the PRB and at two locationswithin the PRB to determine the variability of hydraulic conductivitywith depth. The results (Supplementary Data, Fig. S3) obtained at lo-cation UG, up-gradient of the PRB, indicate that hydraulic conductiv-ity is variable but appears to increase with depth similar to theresults reported by Blowes et al. (1999). In addition, both investiga-tions included vertical profiles within the PRB. In both studies, theestimated hydraulic conductivity of the bulk ZVI materials washigh, in excess of 200 m/d in some intervals. Comparisons of the cur-rent data with those of the previous study indicate no discernibleloss of bulk hydraulic conductivity within the PRB has occurredover time. However, neither of these investigations was designedusing methods that could determine the presence of thin verticalzones of reduced hydraulic conductivity that might be associatedwith the PRB/aquifer interface.
A sensitive electromagnetic borehole flowmeter was also used to fur-ther investigate the distribution of hydraulic conductivity in the vicinityof wells MW47, MW48, and MW49. Each of these wells is screenedfrom approximately 4 m to 7 m below land surface. In general, hydraulic
Table 1Hydraulic conductivity estimates.
Well Hydraulic conductivity (m/d)
Screened 3.0 m–4.6 m BLSMW16 0.4MW18 0.4
Screened 3.0 m–6.1 m BLSMW27 0.1
Screened 4.3 m–7.3 m BLSMW38 1.0MW46 0.1MW47 2.7MW48 2.4MW49 0.9
Screened 7.6 m–9.1 m BLSMW50 0.1MW52 3.4
conductivity appears to increase with depth (Supplementary Data,Fig. S3) and reaches a maximum at approximately 6 m BLS, correspond-ing to an elevation of approximately −4 m MSL. However, significantheterogeneity was observedwithin eachwell. In summary, the hydraulicconductivity of the aquifer materials within the study area appears to benon-uniform and often increases with depth. In general, the materialsnear the water table appear to be less conductive than materials belowapproximately 4 m below land surface. This implies that groundwaterfluxesmay be significantly higher in themid to lower portions of the PRB.
3.6. Groundwater velocity
Based on the variability in hydraulic gradients and the hydraulicconductivity distribution, groundwater velocity is also expected tovary spatially and temporally. Based on the average hydraulic conduc-tivity estimated from slug tests performed in the monitoring wells, theaverage magnitude of the hydraulic gradient estimated using wellsMW13, MW16, and MW18, and an assumed effective porosity of 0.25,the calculated average groundwater seepage velocity would beapproximately 3 m/y. However, groundwater flow velocities likelyvary with depth due to the increases in hydraulic conductivity ob-served in the lower portion of the shallow aquifer. Using estimatesof hydraulic conductivity from a more discrete vertical interval, suchas those from an elevation of approximately −4 m MSL calculatedusing the borehole flowmeter survey performed in well MW48(Supplementary Data, Fig. S3) results in higher estimated flow ve-locity at depth. Assuming an average hydraulic conductivity in thisinterval of approximately 5 m/d, an average hydraulic gradient of0.0015, and an effective porosity of 0.25, the calculated groundwaterseepage velocity is approximately 11 m/y. Arrival of sulfate in wellMW13 following the dithionate treatment in 2001 suggests a seepagevelocity of approximately 7 m/y. Based on these data, it appears thatthe average groundwater seepage velocity is variable but may be mod-erately low compared to velocities at many other sites.
4. Conclusions
There is a continuing need for long-term performance assessmentsof groundwater remedial systems. The literature on PRB technologyhas several examples of remedial longevity that extends to 10 yearsand beyond. The Elizabeth City PRB is one example that has shown pos-itive results for the treatment of hexavalent chromium and TCE. Thissystem is perhaps the first demonstrated example of a PRB that showsreactive performance that surpasses the lifetime of the contaminantplume (in the case of chromium). The sustained performance of thePRB can be linked to several key factors: i) pH and redox conditionswithin the reactive medium have maintained ideal levels for chromatereduction to the immobile trivalent state; ii) influent groundwaterchemistry is low in total dissolved solids so that mineral accumulationdue to carbonate precipitation has not significantly impacted reactivityand hydraulic conductivity of the PRB; iii) the influent dissolved oxygenloading has been low so iron corrosion reactions have not significantlyimpacted reactivity or hydraulic conductivity via positivemolar volumechanges in the reactive medium; and, iv) the velocity of groundwaterflow allows for sufficient residence time in the PRB. Improved TCE treat-ment could have been achieved with a wider reactive wall.
Results of the long-term performance evaluation at the ElizabethCity site indicate that the reactive barrier there continues to removecontaminants from groundwater after fifteen years of operation. Thekey results of the Elizabeth City site study are summarized below:
• Removal of contaminants, Cr and TCE, continues after fifteen years ofPRB operation. In all cases, chromium concentrations have been re-duced to below regulatory thresholds and in the majority of samplingevents Cr was undetected in monitoring wells located downgradientfrom the PRB (b1 μg/L). Concentrations of volatile organic compounds
194 R.T. Wilkin et al. / Science of the Total Environment 468–469 (2014) 186–194
have been significantly reduced, but TCE concentrations above theMCL have been observed in some downgradient wells.
• After fifteen years, groundwater in the PRB is moderately alkaline(pH N 9) and moderately reducing (negative EH values). Time trendsin pH suggest quasi-steady-state conditions. Time trends in EH,however, suggest that the PRB is gradually losing the capacity tomaintain highly reducing conditions due to progressive exposureto groundwater. Time trends in specific conductance values indi-cate that influent solutes continue to be removed within the reac-tive medium and partitioned into the solid phase after fifteenyears of PRB operation. The geochemistry of groundwater down-gradient of the PRB is impacted by the PRB, in that higher pH andlower EH conditions are observed in wells located within 2 m ofthe down-gradient iron/aquifer interface.
• The Elizabeth City PRB has consistently removed inorganic carbon,sulfate, and calcium (as well as silicon, magnesium, and nitrate)from influent groundwater. These components have either beenprecipitated out in the PRB, adsorbed to iron granules or secondaryprecipitates within the PRB, or have been chemically transformedby biotic or abiotic processes.
Conflict of interest
The authors state that there are no conflicts of interest associatedwith this publication.
Acknowledgments
The U.S. Environmental Protection Agency through its Office ofResearch and Development funded the research described here. Ithas not been subjected to agency review and therefore does not nec-essarily reflect the views of the agency, and no official endorsementshould be inferred. Mention of trade names or commercial productsdoes not constitute endorsement or recommendation for use. Wegratefully acknowledge the research support provided by Shaw En-vironmental, Inc. (Contract #68-C-03-097). We thank Cindy Paul,Mary McNeil, Chunming Su, Cherri Adair, John Skender, Ken Jewell,Kyle Jones, and Alexandra Kirkpatrick for help in the field.
Appendix A. Supplementary data
Supplementary data to this article can be found online at http://dx.doi.org/10.1016/j.scitotenv.2013.08.056.
References
Arnold WA, Roberts AL. Pathways and kinetics of chlorinated ethylene and chlorinatedacetylene reaction with Fe(0) particles. Environ Sci Technol 2000;34:1794–805.
Blowes DW, Puls RW, Gillham RW, Ptacek CJ, Bennett TA, Bain JG, et al. An in situpermeable reactive barrier for the treatment of hexavalent chromium and tri-chloroethylene in ground water: volume 2, performance monitoring. EPA re-port, EPA/600/R-99/095b. U.S. Environmental Protection Agency; 1999.
Bouwer H, Rice RC. A slug test method for determining hydraulic conductivity ofunconfined aquifers with completely or partially penetrating wells. Water ResourRes 1976;12:423–8.
Butler Jr JJ. The design, performance, and analysis of slug tests. Lewis Publishers; 1997.Carniato L, Schoups G, Seuntjens P, Van Nooten T, Simons Q, Bastiaens L. Predicting lon-
gevity of iron permeable reactive barriers using multiple iron deactivation models.J Contam Hydrol 2012;142:93–108.
Devlin JF. A spreadsheet method of estimating best-fit hydraulic gradients using headdata from multiple wells. Ground Water 2003;41:316–20.
Flury B, Frommer J, Eggenberger U, Mäder U, Nachtegaal M, Kretzschmar R. Assessment oflong-term performance and chromate reduction mechanisms in a field scale perme-able reactive barrier. Environ Sci Technol 2009;43:6786–92.
Furukawa Y, Kim J,Watkins J,Wilkin R. Formation of ferrihydrite and associated corrosionproducts in permeable reactive barriers of zero-valent iron. Environ Sci Technol2002;36:5469–75.
Henderson AD, Demond AH. Long-term performance of zero-valent iron permeable reac-tive barriers: a critical review. Environ Eng Sci 2007;24:401–23.
Higgins MR, Olson TM. Life-cycle case study comparison of permeable reactive barrierversus pump-and-treat remediation. Environ Sci Technol 2009;43:9432–8.
Jeen SW, Jambor JL, Blowes DW, Gillham RW. Precipitates on granular iron in solutionscontaining calcium carbonate with trichloroethene and hexavalent chromium. Envi-ron Sci Technol 2007;41:1989–94.
Jeen SW, Blowes DW, Gillham RW. Performance evaluation of granular iron for removinghexavalent chromium under different geochemical conditions. J Contam Hydrol2008;95:76–91.
Kahn FA, Puls RW. In situ abiotic detoxification and immobilization of hexavalentchromium. Ground Water Monit Remediat 2003;23:77–84.
Kampbell DH, Vandegrift SA. Analysis of dissolved methane, ethane, and ethylene inground water by a standard gas chromatographic technique. J Chromatogr Sci1998;36:253–6.
Malone DR, Messier JP, Blaha F, Payne F. In situ immobilization of hexavalent chromiumin groundwater with ferrous iron: a case study. Remediation of chlorinated andrecalcitrant compounds — 2004, Proceedings of the 4th International Conference(Monterey, CA); 2004.
Matheson LJ, Tratnyek PG. Reductive dehalogenation of chlorinated methanes by ironmetal. Environ Sci Technol 1994;28:2045–53.
McMahon PB, Dennehy KF, SandstromMW. Hydraulic and geochemical performance of apermeable reactive barrier containing zero-valent iron, Denver Federal Center. GroundWater 1999;37:396–404.
Muchitsch N, Van Nooten T, Bastiaens L, Kjeldsen P. Integrated evaluation of the per-formance of a more than seven year old permeable reactive barrier at a site con-taminated with chlorinated aliphatic hydrocarbons (CAHs). J Contam Hydrol2011;126:258–70.
Noubactep C. The suitability of metallic iron for environmental remediation. Environ ProgSustain Energy 2010;29:289–91.
O'Hannesin SF, Gillham RW. Long-term performance of an in-situ “iron wall” for remedi-ation of VOCs. Ground Water 1998;36:164–70.
Orth WS, Gillham RW. Dechlorination of trichloroethene in aqueous solution using Fe0.Environ Sci Technol 1996;30:66–71.
Paul C, McNeil M, Beck F, Clark P, Wilkin R, Puls R. Capstone report on the application,monitoring, and performance of permeable reactive barriers for ground-water reme-diation, volume 2: soil and ground water sampling. EPA report, EPA/600/R-03/045b.U.S. Environmental Protection Agency; 2003. [145 pp.].
Phillips DH, Van Nooten T, Bastiaens L, Russell MI, Dickson K, Plant S, et al. Ten year per-formance evaluation of a field-scale zero-valent iron permeable reactive barrierinstalled to remediate trichloroethene contaminated groundwater. Environ Sci Technol2010;44:3861–9.
Pratt AR, Blowes DW, Ptacek CJ. Products of chromate reduction on proposed subsurfaceremediation material. Environ Sci Technol 1997;31:2492–8.
Puls RW, Blowes DW, Gillham RW. Long-term performance monitoring for a permeablereactive barrier at the U.S. Coast Guard Support Center, Elizabeth City, North Carolina.J Hazard Mater 1999a;68:109–24.
Puls RW, Paul CJ, Powell RM. The application of in situ permeable reactive (zero-valentiron) barrier technology for the remediation of chromate-contaminated groundwa-ter: a field test. Appl Geochem 1999b;14:989–1000.
Sabatini DA, Knox RC, Tucker EE, Puls RW. Innovative measures for subsurface chro-mium remediation: source zone, concentrated plume and dilute plume. Environ-mental research brief EPA/600/S-97/005. U.S. Environmental Protection Agency;1997.
Scherer MM, Richter S, Valentine RL, Alvarez PJJ. Chemistry and microbiology of perme-able reactive barriers for in situ groundwater clean up. Crit Rev Environ Sci Technol2000;30:363–411.
Springer RK, Gelhar LW. Characterization of large-scale aquifer heterogeneity inglacial outwash by analysis of slug tests with oscillatory response, Cape Cod,Massachusetts. Water resources investigations report 91-4034. U.S. GeologicalSurvey; 1991.
Warner SD, Longino BL, Zhang M, Bennett P, Szerdy FS, Hamilton LA. The first com-mercial permeable reactive barrier composed of granular iron: hydraulic andchemical performance at 10 years of operation. Permeable reactive barriers, Pro-ceedings of International Symposium on PRBs (Belfast, Northern Ireland); 2005.p. 32–42.
Wilkin RT, Puls RW. Capstone report on the application, monitoring, and performance ofpermeable reactive barriers for ground-water remediation, volume 1: performanceevaluations at two sites. EPA report, EPA/600/R-03/045a. U.S. Environmental Protec-tion Agency; 2003. [156 pp.].
Wilkin RT, Puls RW, Sewell GW. Long-term performance of permeable reactive barriersusing zero-valent iron: geochemical and microbiological effects. Ground Water2003;41:493–503.
Wilkin RT, Su C, Ford RG, Paul CJ. Chromium removal processes during groundwaterremediation by a zerovalent iron permeable reactive barrier. Environ Sci Technol2005;39:4599–605.