field gas chromatography/thermionic detector system for … · field gas chromatography/thermionic...
TRANSCRIPT
Field Gas Chromatography/ThermionicDetector System for On-SiteDetermination of Explosives in Soils
Alan D. Hewitt, Thomas F. Jenkins, and Thomas A. Ranney May 2001
Approved for public release; distribution is unlimited.
E
RD
C/C
RR
EL
TR
-01-9
Co
ld R
eg
ion
s R
esearc
ha
nd
En
gin
eeri
ng
Lab
ora
tory
US Army Corpsof Engineers®
Engineer Research andDevelopment Center
REPORT DOCUMENTATION PAGE
1. REPORT DATE(DD-MM-YYYY)01-05-2001
2. REPORT TYPETechnical Report
3. DATES COVERED (FROM - TO)xx-xx-2001 to xx-xx-2001
5a. CONTRACT NUMBER
5b. GRANT NUMBER
4. TITLE AND SUBTITLEField Gas Chromatography/ThermionicDetector System for On-SiteDetermination of Explosives in Soils
Unclassified
5c. PROGRAM ELEMENT NUMBER
5d. PROJECT NUMBER
5e. TASK NUMBER
6. AUTHOR(S)Hewitt, Alan D. ;Jenkins, Thomas F. ;Ranney, Thomas A. ;
5f. WORK UNIT NUMBER
7. PERFORMING ORGANIZATION NAME ANDADDRESSU.S.Army Engineer Research andDevelopment CenterCold Regions Research and EngineeringLaboratory72 Lyme RoadHanover , NH 03755-1290
8. PERFORMING ORGANIZATION REPORT NUMBER
10. SPONSOR/MONITOR'S ACRONYM(S)9. SPONSORING/MONITORING AGENCYNAME AND ADDRESSU.S. Army Environmental Center
Aberdeen Proving Ground , MD 21010-5401
11. SPONSOR/MONITOR'S REPORT NUMBER(S)
12. DISTRIBUTION/AVAILABILITY STATEMENTAPUBLIC RELEASE
U.S. Army Environmental Center

Aberdeen Proving Ground , MD 21010-5401
13. SUPPLEMENTARY NOTESAvailable from NTIS, Springfield, Virginia 22161.
14. ABSTRACTOn-site determination of nitroaromatic,nitramine,and nitrate ester explosives compounds insoils was performed using a field-portable gas chromatograph (GC)equipped with a thermionicionization detector (TID)selective for compounds with nitro functional groups.Soil sampleswere extracted with acetone.A 1-µL volume of the filtered soil extract was manually injectedinto the GC,allowing for the rapid qualification and quantification of the suite of explosivesthat often coexist in soils at military training facilities and other defense-related sites.Goodagreement was established for the concentrations of several explosives analytes when thismethod of analysis was compared to either high-performance liquid chromatography (Method8330)or GC electron capture (Method 8095)analysis.Comparisons were per- formed forsample extracts and for soil subsample replicates distributed for on-site preparation andanalysis during a field verification test performed under the auspices of the U.S.EnvironmentalProtection Agency ?s Environmental Technology Verification (ETV)Program.
15. SUBJECT TERMSExplosives; On-site; Gas chromatography; Soil
16. SECURITY CLASSIFICATION OF: 19a. NAME OF RESPONSIBLE PERSONFenster, [email protected]
a. REPORTUnclassified
b.ABSTRACTUnclassified
c. THIS PAGEUnclassified
17.LIMITATIONOFABSTRACTPublicRelease
18. NUMBEROF PAGES29
19b. TELEPHONE NUMBERInternational Area Code
Area Code Telephone Number703 767-9007DSN 427-9007

1. REPORT DATE (DD-MM-YY) 2. REPORT TYPE 3. DATES COVERED (From - To)
4. TITLE AND SUBTITLE 5a. CONTRACT NUMBER
5b. GRANT NUMBER
5c. PROGRAM ELEMENT NUMBER
6. AUTHOR(S) 5d. PROJECT NUMBER
5e. TASK NUMBER
5f. WORK UNIT NUMBER
7. PERFORMING ORGANIZATION NAME(S) AND ADDRESS(ES) 8. PERFORMING ORGANIZATION REPORT NUMBER
9. SPONSORING/MONITORING AGENCY NAME(S) AND ADDRESS(ES) 10. SPONSOR / MONITOR’S ACRONYM(S)
11. SPONSOR / MONITOR’S REPORT NUMBER(S)
12. DISTRIBUTION / AVAILABILITY STATEMENT
13. SUPPLEMENTARY NOTES
14. ABSTRACT
15. SUBJECT TERMS
16. SECURITY CLASSIFICATION OF: 17. LIMITATION OF 18. NUMBER 19a. NAME OF RESPONSIBLE PERSONOF ABSTRACT OF PAGES
a. REPORT b. ABSTRACT c. THIS PAGE 19b. TELEPHONE NUMBER (include area code)
U U U U 30
REPORT DOCUMENTATION PAGEPublic reporting burden for this collection of information is estimated to average 1 hour per response, including the time for reviewing instructions, searching existing data sources, gathering and maintaining the
data needed, and completing and reviewing this collection of information. Send comments regarding this burden estimate or any other aspect of this collection of information, including suggestions for reducingthis burden to Department of Defense, Washington Headquarters Services, Directorate for Information Operations and Reports (0704-0188), 1215 Jefferson Davis Highway, Suite 1204, Arlington, VA 22202-4302.Respondents should be aware that notwithstanding any other provision of law, no person shall be subject to any penalty for failing to comply with a collection of information if it does not display a currently valid
OMB control number. PLEASE DO NOT RETURN YOUR FORM TO THE ABOVE ADDRESS.
Form ApprovedOMB No. 0704-0188
Approved for public release; distribution is unlimited.
Available from NTIS, Springfield, Virginia 22161.
May 2001 Technical Report 01-9
Field Gas Chromatography/Thermionic Detector System
for On-Site Determination of Explosives in Soils
Alan D. Hewitt, Thomas F. Jenkins, and Thomas A. Ranney
U.S. Army Engineer Research and Development Center
Cold Regions Research and Engineering Laboratory
72 Lyme Road ERDC/CRREL TR-01-9
Hanover, New Hampshire 03755-1290
On-site determination of nitroaromatic, nitramine, and nitrate ester explosives compounds in soils was performed using a field-portable gas
chromatograph (GC) equipped with a thermionic ionization detector (TID) selective for compounds with nitro functional groups. Soil
samples were extracted with acetone. A 1-µL volume of the filtered soil extract was manually injected into the GC, allowing for the rapid
qualification and quantification of the suite of explosives that often coexist in soils at military training facilities and other defense-related
sites. Good agreement was established for the concentrations of several explosives analytes when this method of analysis was compared to
either high-performance liquid chromatography (Method 8330) or GC electron capture (Method 8095) analysis. Comparisons were per-
formed for sample extracts and for soil subsample replicates distributed for on-site preparation and analysis during a field verification test
performed under the auspices of the U.S. Environmental Protection Agency’s Environmental Technology Verification (ETV) Program.
Standard Form 298 (Rev. 8-98)]Prescribed by ANSI Std. 239.18
U.S. Army Environmental Center
Aberdeen Proving Ground, Maryland 21010-5401
Explosives On-site
Gas chromatography Soil
AEC
SFIM-AEC-ET-CR-200122

Abstract: On-site determination of nitroaromatic, nitra-
mine, and nitrate ester explosives compounds in
soils was performed using a field-portable gas chromato-
graph (GC) equipped with a thermionic ionization
detector (TID) selective for compounds with nitro
functional groups. Soil samples were extracted with ac-
etone. A 1-µL volume of the filtered soil extract was
manually injected into the GC, allowing for the rapid
qualification and quantification of the suite of explos-
ives that often coexist in soils at military training
facilities and other defense-related sites. Good
How to get copies of ERDC technical publications:
Department of Defense personnel and contractors may order reports through the Defense Technical Informa-tion Center:
DTIC-BR SUITE 09448725 JOHN J KINGMAN RDFT BELVOIR VA 22060-6218Telephone (800) 225-3842E-mail [email protected]
[email protected] http://www.dtic.mil/
All others may order reports through the National Technical Information Service:NTIS5285 PORT ROYAL RDSPRINGFIELD VA 22161Telephone (703) 487-4650
(703) 487-4639 (TDD for the hearing-impaired)E-mail [email protected] http://www.ntis.gov/index.html
For information on all aspects of the Cold Regions Research and Engineering Laboratory, visit ourWorld Wide Web site:
http://www.erdc.usace.army.mil
agreement was established for the concentrations of
several explosives analytes when this method of
analysis was compared to either high-performance
liquid chromatography (Method 8330) or GC electron
capture (Method 8095) analysis. Comparisons were per-
formed for sample extracts and for soil subsample
replicates distributed for on-site preparation and analy-
sis during a field verification test performed under the
auspices of the U.S. Environmental Protection
Agency’s Environmental Technology Verification (ETV)
Program.

Technical Report
ERDC/CRREL TR-01-9
Prepared for
U.S. ARMY ENVIRONMENTAL CENTER
SFIM-AEC-ET-CR-200122
Approved for public release; distribution is unlimited.
Field Gas Chromatography/ThermionicDetector System for On-SiteDetermination of Explosives in Soils
Alan D. Hewitt, Thomas F. Jenkins, and Thomas A. Ranney May 2001
US Army Corpsof Engineers®
Engineer Research andDevelopment Center

ii
PREFACE
This report was prepared by Alan D. Hewitt and Thomas F. Jenkins, Research Chemists,Environmental Sciences Branch, U.S. Army Cold Regions Research and Engineering Labo-ratory (CRREL), Engineer Research and Development Center (ERDC), Hanover, NewHampshire; and by Thomas A. Ranney, Staff Scientist, Science and Technology Corpora-tion, Hanover, New Hampshire.
Funding for this work was provided by the U.S. Army Environmental Center, Martin H.Stutz, Project Monitor. Technical reviews were provided by Dr. Clarence L. Grant, Profes-sor Emeritus, University of New Hampshire, and by Marianne E. Walsh, Chemical Engi-neer, CRREL. The authors thank the Environmental Technology Verification Program (EricN. Koglin, Amy B. Dindal, Dr. Charles K. Bayne, and Dr. Roger A. Jenkins); Jason Ai,Dames and Moore; Michael Nelson, Seattle District, U.S. Army Corps of Engineers; HarryCraig, U.S. Environmental Protection Agency Region 9; Thomas Berry, EnvironmentalLaboratory, ERDC, Vicksburg, Mississippi; and Marianne E. Walsh, CRREL, for perform-ing GC-ECD analyses.
This publication reflects the personal views of the authors and does not suggest or reflectthe policy, practices, programs, or doctrine of the U.S. Army or Government of the UnitedStates. The contents of this report are not to be used for advertising or promotional pur-poses. Citation of brand names does not constitute an official endorsement or approval ofthe use of such commercial products.

iii
CONTENTS
Preface ............................................................................................................................. ii
Introduction ..................................................................................................................... 1
Method and materials ...................................................................................................... 2
Instrumentation ........................................................................................................ 2
Calibration standards ............................................................................................... 3
Sample preparation .................................................................................................. 3
Instrument calibration .............................................................................................. 4
Field studies ..................................................................................................................... 4
Fort Leonard Wood .................................................................................................. 4
Umatilla Chemical Depot ........................................................................................ 5
Environmental Technology Verification Program (ETV) ........................................ 5
Results and discussion ..................................................................................................... 6
Fort Leonard Wood .................................................................................................. 6
Umatilla Chemical Depot ........................................................................................ 8
Environmental Technology Verification Program (ETV) ........................................ 10
Summary.......................................................................................................................... 15
Literature cited ................................................................................................................. 17
Appendix A: ETV Program GC-TID and reference laboratory results for
2,4-DNT, RDX, and TNT (mg/kg) .......................................................................... 19
Abstract ............................................................................................................................ 23
ILLUSTRATIONS
Figure
1. GC-TID chromatogram of 50 µg/L 2,4-DNT, TNT, and 2AmDNT, and
200 µg/L 4AmDNT ............................................................................................. 3
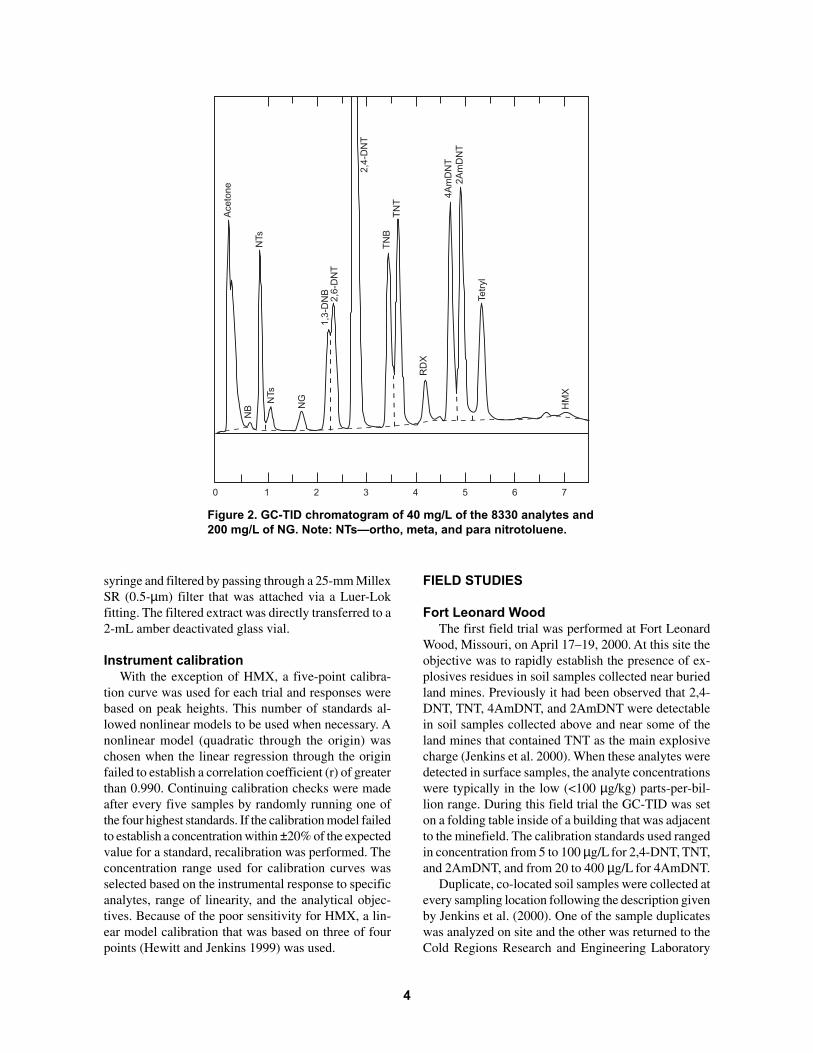
2. GC-TID chromatogram of 40 mg/L of the 8330 analytes and 200 mg/L
of NG ................................................................................................................... 4
3. Surface concentration (µg/kg) of 2,4-DNT near two buried land mines ............. 7
4. Comparison of RDX values established on site with GC-TID analysis and
by Method 8330 at a reference laboratory ........................................................... 13
5. Comparison of TNT values established on site with GC-TID analysis and
by Method 8330 at a reference laboratory ........................................................... 13
6. GC-TID chromatogram of 40 mg/L of the 8330 analytes ................................... 16

TABLES
Table
1. Methods for the detection of explosives recommended by the U.S. EPA ........... 2
2. Comparison between GC-TID-1 field and GC-ECD laboratory results
for explosives in solvent extracts of samples collected at the Fort
Leonard Wood minefield ..................................................................................... 8
3. Comparison between GC-TID and GC-ECD laboratory results for
explosives in solvent extracts of archived soil samples collected
at military facilities .............................................................................................. 9
4. Comparison between GC-TID field and GC-ECD laboratory results
for explosives in solvent extracts of soil and sediment samples collected
at the Umatilla Chemical Depot .......................................................................... 10
5. ETV program GC-TID and reference laboratory accuracy based on
spiked soil samples (n = 20) ................................................................................ 11
6. Number of GC-TID and reference laboratory spiked soil results within
acceptance range set by Environmental Resources Associates ........................... 11
7. ETV program GC-TID and reference laboratory precision for soil
sample replicates ................................................................................................. 12
8. ETV program GC-TID and reference laboratory false-positive results
for blank soil samples (n = 20) ............................................................................ 12
9. Comparison between on-site GC-TID and CRREL laboratory results
for TNT and 2,4-DNT in solvent extracts of ETV soil samples .......................... 14
10. Comparison between GC-TID and GC-ECD laboratory results for tetryl
in solvent extracts of ETV soil samples .............................................................. 15
11. Pre-demonstration results for HMX .................................................................... 15
12. Comparison between GC-TID laboratory and reference laboratory results
for HMX in selected ETV samples ...................................................................... 17
iv
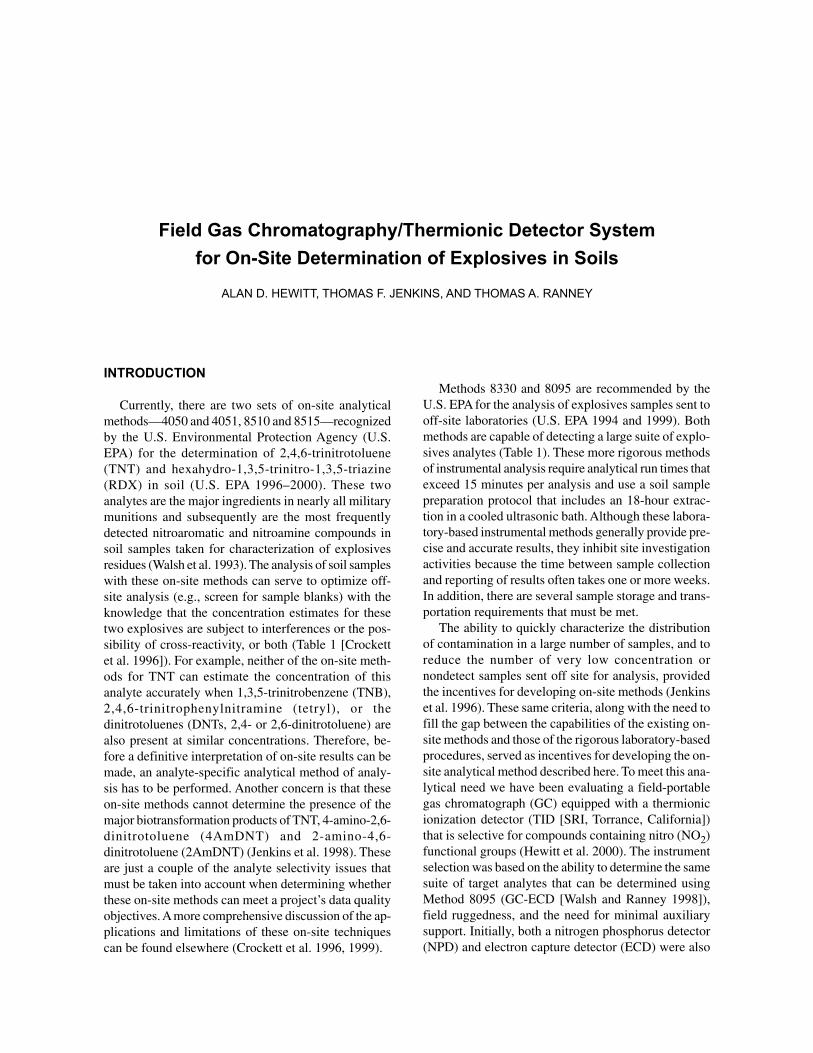
INTRODUCTION
Currently, there are two sets of on-site analyticalmethods—4050 and 4051, 8510 and 8515—recognizedby the U.S. Environmental Protection Agency (U.S.EPA) for the determination of 2,4,6-trinitrotoluene(TNT) and hexahydro-1,3,5-trinitro-1,3,5-triazine(RDX) in soil (U.S. EPA 1996–2000). These twoanalytes are the major ingredients in nearly all militarymunitions and subsequently are the most frequentlydetected nitroaromatic and nitroamine compounds insoil samples taken for characterization of explosivesresidues (Walsh et al. 1993). The analysis of soil sampleswith these on-site methods can serve to optimize off-site analysis (e.g., screen for sample blanks) with theknowledge that the concentration estimates for thesetwo explosives are subject to interferences or the pos-sibility of cross-reactivity, or both (Table 1 [Crockettet al. 1996]). For example, neither of the on-site meth-ods for TNT can estimate the concentration of thisanalyte accurately when 1,3,5-trinitrobenzene (TNB),2,4,6-trinitrophenylnitramine (tetryl), or thedinitrotoluenes (DNTs, 2,4- or 2,6-dinitrotoluene) arealso present at similar concentrations. Therefore, be-fore a definitive interpretation of on-site results can bemade, an analyte-specific analytical method of analy-sis has to be performed. Another concern is that theseon-site methods cannot determine the presence of themajor biotransformation products of TNT, 4-amino-2,6-dinitrotoluene (4AmDNT) and 2-amino-4,6-dinitrotoluene (2AmDNT) (Jenkins et al. 1998). Theseare just a couple of the analyte selectivity issues thatmust be taken into account when determining whetherthese on-site methods can meet a project’s data qualityobjectives. A more comprehensive discussion of the ap-plications and limitations of these on-site techniquescan be found elsewhere (Crockett et al. 1996, 1999).
Methods 8330 and 8095 are recommended by theU.S. EPA for the analysis of explosives samples sent tooff-site laboratories (U.S. EPA 1994 and 1999). Bothmethods are capable of detecting a large suite of explo-sives analytes (Table 1). These more rigorous methodsof instrumental analysis require analytical run times thatexceed 15 minutes per analysis and use a soil samplepreparation protocol that includes an 18-hour extrac-tion in a cooled ultrasonic bath. Although these labora-tory-based instrumental methods generally provide pre-cise and accurate results, they inhibit site investigationactivities because the time between sample collectionand reporting of results often takes one or more weeks.In addition, there are several sample storage and trans-portation requirements that must be met.
The ability to quickly characterize the distributionof contamination in a large number of samples, and toreduce the number of very low concentration ornondetect samples sent off site for analysis, providedthe incentives for developing on-site methods (Jenkinset al. 1996). These same criteria, along with the need tofill the gap between the capabilities of the existing on-site methods and those of the rigorous laboratory-basedprocedures, served as incentives for developing the on-site analytical method described here. To meet this ana-lytical need we have been evaluating a field-portablegas chromatograph (GC) equipped with a thermionicionization detector (TID [SRI, Torrance, California])that is selective for compounds containing nitro (NO2)functional groups (Hewitt et al. 2000). The instrumentselection was based on the ability to determine the samesuite of target analytes that can be determined usingMethod 8095 (GC-ECD [Walsh and Ranney 1998]),field ruggedness, and the need for minimal auxiliarysupport. Initially, both a nitrogen phosphorus detector(NPD) and electron capture detector (ECD) were also
Field Gas Chromatography/Thermionic Detector System
for On-Site Determination of Explosives in Soils
ALAN D. HEWITT, THOMAS F. JENKINS, AND THOMAS A. RANNEY

evaluated for use with a field-portable GC. However,overall they were not found to be as sensitive or as se-lective as the TID detector (Hewitt and Jenkins 1999,Hewitt et al. 2000). The TID is an electrically heatedemission source made in the shape of a bead composedof an alkali metal impregnated into a ceramic material(Patterson 1986). When compounds containing nitrofunctional groups impinge on the bead’s surface, theyare ionized, the negative ions move to a collector elec-trode, and the ion current at this electrode is measuredwith an electrometer. Therefore, this detector will re-spond not only to nitroaromatics and nitramines, but tonitrate esters as well. This report compares on-site GC-TID results to those obtained in the laboratory using ei-ther Method 8330 or 8095, for three different field trials.
METHOD AND MATERIALS
Instrumentation
In this study we used a field-transportable SRI Model8610C gas chromatograph equipped with a heated(250°C) TID detector, a heated (225°C) on-column
injection port, and an internal air compressor. The in-strument sells for less than $9K, but also requires a per-sonal computer ($1K) for controlling the oven tempera-ture program and for the collection and handling of data.Separations were performed on a Crossbond 100% dim-ethyl polysiloxane column, 15-m × 0.53-mm i.d., 1.5µm (DB-1). Injections of 1 µL were made manuallywith a 10-µL glass syringe (SGE) equipped with an extralong needle (6.0 to 7.0 cm). The oven temperature pro-gram, carrier gas and flow rate, detector voltage, andthe use of a supply of air to the detector were specificto the analytical objectives of the different field trials.
For the first field trial the target analytes were TNT,2,4-DNT (2,4-DNT is a manufacturing impurity in theproduction of TNT), and two environmental transfor-mation products of TNT, i.e., 2AmDNT and 4AmDNT.For this group of analytes a high level of sensitivity isachieved when using the settings originally recom-mended by the instrument manufacturer. Air was usedas the carrier gas and the potential of the TID bead wasset at –2.80 V (Hewitt et al. 2000). The air pressure forthe on-board air compressor was set at 10 psi for a car-rier gas flow rate of approximately 25 mL/min. The
Table 1. Methods for the detection of explosives recommended by the U.S. EPA.
Method no./vendor Analyte*: Interferences and cross-reactivities
Method 8515 / EnSys RIS TNT: TNT = TNT + TNB + DNB + DNTs + tetryl
Method 8510 / EnSys RIS RDX: RDX = RDX + HMX + PETN + NQ + NC + NG
Method 4050 / D TECH TNT: tetryl = 35%†; TNB = 23%; 2AmDNT = 11%;
2,4-DNT = 4%
Method 4051 / D TECH RDX: HMX = 3%
Methods 8330 TNT, TNB, DNB, 2,4-DNT, 2,6-DNT, Tetryl, 2AmDNT
4AmDNT, NT (3 isomers), NB, RDX, HMX
Method 8095 TNT, TNB, DNB, 2,4-DNT, 2,6-DNT, Tetryl, 2AmDNT
4AmDNT, NT (3 isomers), NB, RDX, HMX, PETN,
NG, 3,5-DNA
*Analyte abbreviations and names:
TNT—2,4,6-trinitrotoluene;
TNB—1,3,5-trinitrobenzene;
DNB—1,3-dinitrobenzene;
2,4-DNT—2,4-dinitrotoluene;
2,6-DNT—2,6-dinitrotoluene;
Tetryl—Methyl-2,4,6-trinitrophenylnitramine;
2AmDNT—2-amino-4,6-dinitrotoluene;
4AmDNT—4-amino-2,6-dinitrotoluene;
NT—ortho, meta, and para nitrotoluene;
3,5-DNA—3,5-dinitroaniline;
NB—Nitrobenzene;
RDX—Hexahydro-1,3,5-trinitro-1,3,5-triazine;
HMX—Octahydro-1,3,5,7-tetranitro-1,3,5,7-tetrazocine;
PETN—Pentaerythritol tetranitrate;
NQ—Nitroquanidine;
NC—Nitrocellulose;
NG—Nitroglycerin.
†Percent cross-reactivity
2

oven temperature program for this application was165°C for 1.5 min., ramp at 20°C/min. to 190°C, holdat 190°C for 1.25 min., allowing sample injections tobe made about every 4.5 min. Figure 1 shows a typicalchromatogram for 2,4-DNT, TNT, 4AmDNT, and2AmDNT under these conditions.
At two other field trials the explosives analytes ofconcern included both nitroaromatics and nitramineexplosives. The operating parameters for the analysisof both of these classes of explosives and nitrate esterswere based on the results of laboratory studies and apreliminary field trial (Hewitt and Jenkins 1999, Hewitt
et al. 2000). For the simultaneous analysis of all threetypes of explosives, the sensitivity is improved by us-ing ultra-high-purity nitrogen as the carrier gas and set-ting the TID potential at –3.40 V (Hewitt et al. 2000).The carrier gas pressure was set at 15 psi for an on-column flow rate of approximately 37 mL/min. Air wassupplied to the detector from the onboard compressorat a flow rate of approximately 25 mL/min, with a pres-sure setting of 5 psi. An oven temperature program of105°C, ramp at 10°C/min. to 115°C, ramp from 115°Cto 240°C at 25°C/min., hold at 240°C for 0.75 min.,allowed sample injections to be made about every 8.0min. Figure 2 shows a typical chromatogram for theseconditions.
Calibration standards
Analytical standards of 2,6-dinitrotoluene (2,6-DNT), 2,4-DNT, TNT, pentaerythritol tetranitrate(PETN), RDX, 4AmDNT, 2AmDNT, tetryl, and HMXwere prepared from standard analytical reference ma-terials (SARMs) obtained from the U.S. Army Envi-ronmental Center, Aberdeen Proving Ground, Mary-land. The preparation and handling of mixed analyteworking standards has been reported elsewhere (Hewittand Jenkins 1999). In addition, all of the explosivesanalytes listed in Table 1 for Method 8330 were pur-chased as a mixed stock standard (each analyte 1.00mg/mL), and nitroglycerin (NG) as a separate stockstandard (5.00 mg/mL), from AccuStandard, Inc. (NewHaven, CT). Both of these commercially prepared stockstandards were specially prepared using acetone as thesolvent.
Sample preparation
Sample collection, handling, and on-site preparationfor analysis varied for each trial based on the data qual-ity objectives. The soil samples ranged from 0.5 to 40g and were extracted with an equal-to-a-fivefold-greatervolume of acetone (i.e., 1:1 to 1:5). Extraction was per-formed in either glass or plastic bottles by manuallyshaking the soil–solvent slurry for 30 seconds or longer,then allowing the soil to settle. The total extraction pe-riod ranged from 5 to more than 30 minutes. The re-duced ratio of sample weight to extraction solvent vol-ume and short extraction period were used togetherwhen the main objective was to rapidly establish thepresence of explosives residues. In general, fieldextraction periods of 30 minutes or longer are recom-mended for quantitative estimates of explosives resi-dues in soils. Another general rule for quantitative ex-plosives measurements is that, when extracting a moistsoil, the volume of acetone should be at least twice themoist sample weight. Following extraction, an aliquotof the acetone was then drawn into a disposable plastic
TN
T
2,4
DN
T
2A
mD
NT
210 43
4A
mD
NT
Figure 1. GC-TID chromatogram of 50 µg/L 2,4-DNT,
TNT, and 2AmDNT, and 200 µg/L 4AmDNT.
3
syringe and filtered by passing through a 25-mm MillexSR (0.5-µm) filter that was attached via a Luer-Lokfitting. The filtered extract was directly transferred to a2-mL amber deactivated glass vial.
Instrument calibration
With the exception of HMX, a five-point calibra-tion curve was used for each trial and responses werebased on peak heights. This number of standards al-lowed nonlinear models to be used when necessary. Anonlinear model (quadratic through the origin) waschosen when the linear regression through the originfailed to establish a correlation coefficient (r) of greaterthan 0.990. Continuing calibration checks were madeafter every five samples by randomly running one ofthe four highest standards. If the calibration model failedto establish a concentration within ±20% of the expectedvalue for a standard, recalibration was performed. Theconcentration range used for calibration curves wasselected based on the instrumental response to specificanalytes, range of linearity, and the analytical objec-tives. Because of the poor sensitivity for HMX, a lin-ear model calibration that was based on three of fourpoints (Hewitt and Jenkins 1999) was used.
FIELD STUDIES
Fort Leonard Wood
The first field trial was performed at Fort LeonardWood, Missouri, on April 17–19, 2000. At this site theobjective was to rapidly establish the presence of ex-plosives residues in soil samples collected near buriedland mines. Previously it had been observed that 2,4-DNT, TNT, 4AmDNT, and 2AmDNT were detectablein soil samples collected above and near some of theland mines that contained TNT as the main explosivecharge (Jenkins et al. 2000). When these analytes weredetected in surface samples, the analyte concentrationswere typically in the low (<100 µg/kg) parts-per-bil-lion range. During this field trial the GC-TID was seton a folding table inside of a building that was adjacentto the minefield. The calibration standards used rangedin concentration from 5 to 100 µg/L for 2,4-DNT, TNT,and 2AmDNT, and from 20 to 400 µg/L for 4AmDNT.
Duplicate, co-located soil samples were collected atevery sampling location following the description givenby Jenkins et al. (2000). One of the sample duplicateswas analyzed on site and the other was returned to theCold Regions Research and Engineering Laboratory
2A
mD
NT
4A
mD
NT
HM
X
Tetr
yl
RD
X
TN
TT
NB
1,3
-DN
B
10 2 3 4 5 6 7
NGNTs
NTs
2,4
-DN
T
Aceto
ne
NB
2,6
-DN
T
Figure 2. GC-TID chromatogram of 40 mg/L of the 8330 analytes and
200 mg/L of NG. Note: NTs—ortho, meta, and para nitrotoluene.
4
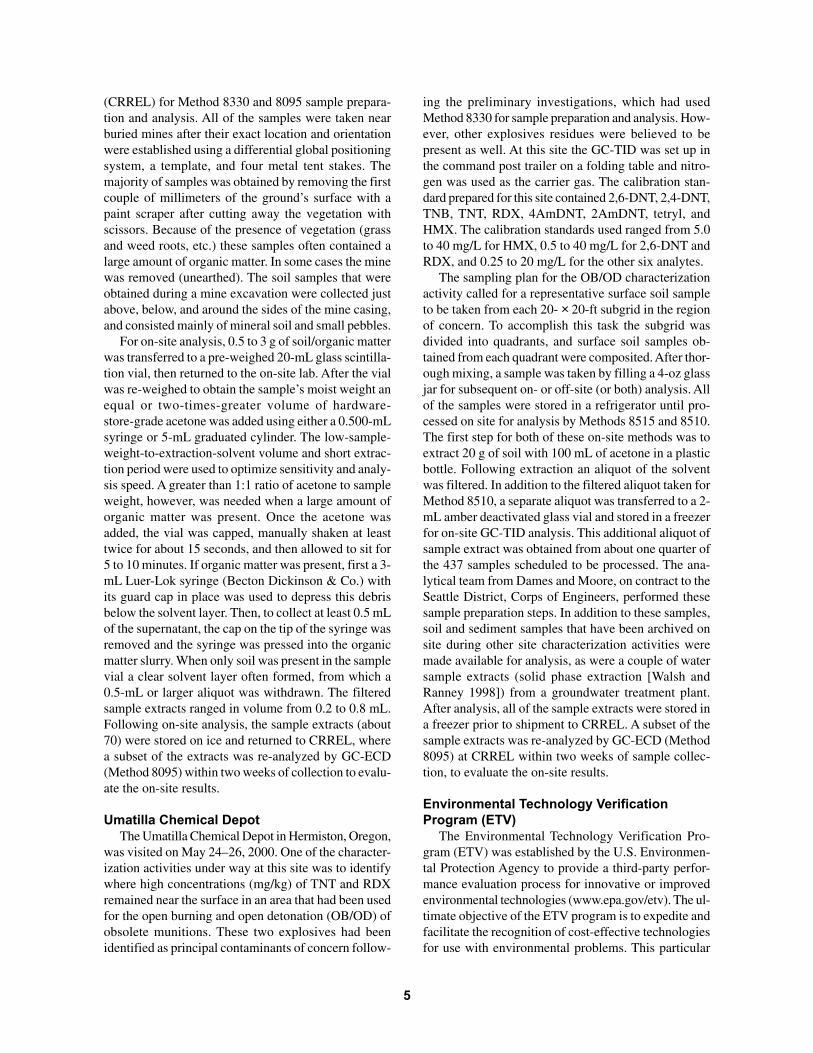
(CRREL) for Method 8330 and 8095 sample prepara-tion and analysis. All of the samples were taken nearburied mines after their exact location and orientationwere established using a differential global positioningsystem, a template, and four metal tent stakes. Themajority of samples was obtained by removing the firstcouple of millimeters of the ground’s surface with apaint scraper after cutting away the vegetation withscissors. Because of the presence of vegetation (grassand weed roots, etc.) these samples often contained alarge amount of organic matter. In some cases the minewas removed (unearthed). The soil samples that wereobtained during a mine excavation were collected justabove, below, and around the sides of the mine casing,and consisted mainly of mineral soil and small pebbles.
For on-site analysis, 0.5 to 3 g of soil/organic matterwas transferred to a pre-weighed 20-mL glass scintilla-tion vial, then returned to the on-site lab. After the vialwas re-weighed to obtain the sample’s moist weight anequal or two-times-greater volume of hardware-store-grade acetone was added using either a 0.500-mLsyringe or 5-mL graduated cylinder. The low-sample-weight-to-extraction-solvent volume and short extrac-tion period were used to optimize sensitivity and analy-sis speed. A greater than 1:1 ratio of acetone to sampleweight, however, was needed when a large amount oforganic matter was present. Once the acetone wasadded, the vial was capped, manually shaken at leasttwice for about 15 seconds, and then allowed to sit for5 to 10 minutes. If organic matter was present, first a 3-mL Luer-Lok syringe (Becton Dickinson & Co.) withits guard cap in place was used to depress this debrisbelow the solvent layer. Then, to collect at least 0.5 mLof the supernatant, the cap on the tip of the syringe wasremoved and the syringe was pressed into the organicmatter slurry. When only soil was present in the samplevial a clear solvent layer often formed, from which a0.5-mL or larger aliquot was withdrawn. The filteredsample extracts ranged in volume from 0.2 to 0.8 mL.Following on-site analysis, the sample extracts (about70) were stored on ice and returned to CRREL, wherea subset of the extracts was re-analyzed by GC-ECD(Method 8095) within two weeks of collection to evalu-ate the on-site results.
Umatilla Chemical Depot
The Umatilla Chemical Depot in Hermiston, Oregon,was visited on May 24–26, 2000. One of the character-ization activities under way at this site was to identifywhere high concentrations (mg/kg) of TNT and RDXremained near the surface in an area that had been usedfor the open burning and open detonation (OB/OD) ofobsolete munitions. These two explosives had beenidentified as principal contaminants of concern follow-
ing the preliminary investigations, which had usedMethod 8330 for sample preparation and analysis. How-ever, other explosives residues were believed to bepresent as well. At this site the GC-TID was set up inthe command post trailer on a folding table and nitro-gen was used as the carrier gas. The calibration stan-dard prepared for this site contained 2,6-DNT, 2,4-DNT,TNB, TNT, RDX, 4AmDNT, 2AmDNT, tetryl, andHMX. The calibration standards used ranged from 5.0to 40 mg/L for HMX, 0.5 to 40 mg/L for 2,6-DNT andRDX, and 0.25 to 20 mg/L for the other six analytes.
The sampling plan for the OB/OD characterizationactivity called for a representative surface soil sampleto be taken from each 20- × 20-ft subgrid in the regionof concern. To accomplish this task the subgrid wasdivided into quadrants, and surface soil samples ob-tained from each quadrant were composited. After thor-ough mixing, a sample was taken by filling a 4-oz glassjar for subsequent on- or off-site (or both) analysis. Allof the samples were stored in a refrigerator until pro-cessed on site for analysis by Methods 8515 and 8510.The first step for both of these on-site methods was toextract 20 g of soil with 100 mL of acetone in a plasticbottle. Following extraction an aliquot of the solventwas filtered. In addition to the filtered aliquot taken forMethod 8510, a separate aliquot was transferred to a 2-mL amber deactivated glass vial and stored in a freezerfor on-site GC-TID analysis. This additional aliquot ofsample extract was obtained from about one quarter ofthe 437 samples scheduled to be processed. The ana-lytical team from Dames and Moore, on contract to theSeattle District, Corps of Engineers, performed thesesample preparation steps. In addition to these samples,soil and sediment samples that have been archived onsite during other site characterization activities weremade available for analysis, as were a couple of watersample extracts (solid phase extraction [Walsh andRanney 1998]) from a groundwater treatment plant.After analysis, all of the sample extracts were stored ina freezer prior to shipment to CRREL. A subset of thesample extracts was re-analyzed by GC-ECD (Method8095) at CRREL within two weeks of sample collec-tion, to evaluate the on-site results.
Environmental Technology Verification
Program (ETV)
The Environmental Technology Verification Pro-gram (ETV) was established by the U.S. Environmen-tal Protection Agency to provide a third-party perfor-mance evaluation process for innovative or improvedenvironmental technologies (www.epa.gov/etv). The ul-timate objective of the ETV program is to expedite andfacilitate the recognition of cost-effective technologiesfor use with environmental problems. This particular
5

evaluation was performed at the Oak Ridge NationalLaboratory (ORNL), in Oak Ridge, Tennessee, August24–27, 2000, as part of the Site Characterization andMonitoring Technologies (SCMT) program, which isunder the supervision of EPA’s National Exposure Re-search Laboratory. This verification test evaluated theperformance of technologies for on-site analysis of soilsfor explosives.
At the ETV test site the GC-TID instrumentationand a sample preparation station were set up on sepa-rate folding tables under a canopy with mesh nettingon all four sides. During intermittent rainstorms a largetarp was pulled over the top of this canopy. For secu-rity reasons, each night the instrument and all supplieswere returned to their shipping containers and storedinside a locked building. Auxiliary support consistedof an electrical extension cord run from a nearby build-ing and a nitrogen gas cylinder. The description of thesamples used for the ETV program stated that the pri-mary explosives of concern would be TNT, 2,6-DNT,2,4-DNT, RDX, and HMX at concentrations rangingfrom 0 to 90,000 mg/kg (ORNL 2000). The calibrationstandard used for this field study contained all of theMethod 8330 analytes (Table 1) in concentrations rang-ing from 0.4 to 40 mg/L, dissolved in acetone, with theexception of HMX, which ranged from 2 to 40 mg/L.
The soil samples used for this ETV verification testwere obtained from five different military facilities(ORNL 2000). Large bulk soil samples were shippedto ORNL for processing and characterization. Thesebulk soil samples were homogenized by kneading thematerial in the plastic shipping bags, transferring por-tions onto glass plates, subjectively removing debris,air-drying, passing through a 2-mm mesh sieve, thenplacing into a 1-L widemouth jar and thoroughly mix-ing with a metal spatula. Next the sample was removedfrom the bottle and quartered. Each quarter was furthermixed, then a fourth of each quarter was recombinedinto new 1-L widemouth jars to yield four separatesample replicates, each of approximately 1000 g. Por-tions (20 to 40 g) were removed from each sample bottleand placed in a 4-oz glass sample jar for distribution toETV participants and to a reference laboratory whereMethod 8330 sample preparation and analysis was per-formed. In addition, five matrix spike samples werepurchased from a commercial reference standard ven-dor for distribution (ORNL 2000). These matrix spikesamples were also distributed as quadruplicatesubsamples. In total, 108 soil samples (27 quadrupli-cates) were extracted and analyzed. The samples weredistributed on site in lots of 12 using a double-blindformat, i.e., the sample jars were randomly numberedand the numbering was unique to each participant. Theonly information provided with the samples was the
site from which the soil had been originally obtained.However, this information was confounded by the ran-dom assignment of site locations to the blank and ma-trix spike samples.
Samples were prepared on site by extracting 20 to40 g of soil with a 40-mL volume of acetone. To mea-sure the sample weight, the jar’s contents were emp-tied into a disposable weighing dish, weighed, and thenreturned to the jar. Then 40 mL of acetone was addedusing an adjustable solvent dispenser. Extraction wasperformed by manually shaking the soil acetone slurryfor several short intervals (2 min.) over a 30-minuteperiod, then allowing the soil to settle. A 1.5-mL ali-quot of the extract was filtered in preparation for analy-sis. To screen sample extracts for high concentrationsof nitroaromatic compounds (e.g., TNT), a 0.25-mLvolume was transferred to a clear 2-mL vial and 0.01mL of a 5-mM tetrabutyl-ammonium hydroxide(TBAOH in water, the active reagent in Method 8515[Aldrich]) solution was added. The formation of a darkpurple or red solution provided a visual indication thata high concentration of nitroaromatic compounds waspresent. Depending on the color (i.e., the darker thecolor the greater the dilution) sample extracts were di-luted anywhere from 1:10 to 1:2000, or not diluted atall, prior to analysis. All of the samples analyzed on sitewere refrigerated after analysis and returned to CRREL.
RESULTS AND DISCUSSION
Fort Leonard Wood
2,4-DNT, TNT, 4AmDNT, and 2AmDNT were de-tected in a number of surface and subsurface soilsamples collected near buried land mines. Initially foursurface samples were collected directly above the cor-ners of buried land mines (Jenkins et al. 2000). For twoof the mines, where mg/kg levels of explosives resi-dues were detected in one or more of these initialsamples, an extensive iterative sampling protocol wasperformed. Surface soil samples were sequentially col-lected while moving away from the established hotspot(s) in several directions, in increments of 10 cm.This sampling scheme and on-site analysis allowed usto delineate the size of the explosives-related chemicalsignature plume present at the ground’s surface abovethese two buried land mines (Fig. 3). Before the devel-opment of this on-site analytical method, sample col-lection was performed using a set sampling design,which often was inefficient (the majority of samplescollected had nondetectable explosives concentrations),and we were unable to delineate the boundaries of thesurface plumes above these mines (Jenkins et al. 2000).However, this earlier work had established that the ex-
6

Figure 3. Surface con-
centration (µg/kg) of 2,4-
DNT near two buried land
mines.
7
EW
N
S
49
26(10 cm)
(10 cm)
(20 cm)
(30 cm)31(20 cm)
19(30 cm)
2.3(45 cm)
3.5(60 cm)
2.0(75 cm)
0(90 cm)
150
49
17
(30 cm)12
(45 cm)3.7
(60 cm)0(60 cm)
0
(10 cm)0
(10 cm)0
0
0 2.1
(45 cm)0
Scale
20 cm
Mine
2,4-DNT µg/kg
530
(30 cm)
100 (60 cm)
(30 cm)
(45 cm)
(90 cm)
(75 cm)
(20 cm)
(75 cm)
(75 cm)
(60 cm)
(45 cm)
(30 cm)
(20 cm)
(10 cm)(60 cm)
1.8 (90 cm)
Scale
20 cm
NW NE
SW SE
270
400 32013
1100
720
15
7.1
4.4
0
110
24
11
2.2
0
0
0
00
0
0
0
0
1.4
21
52
(10 cm)
(60 cm)
(45 cm)
(10 cm)
(30 cm)
(45 cm)
(60 cm)
(90 cm)
Mine
2,4-DNT µg/kg
plosives signatures at the surface were spatially het-erogeneous.
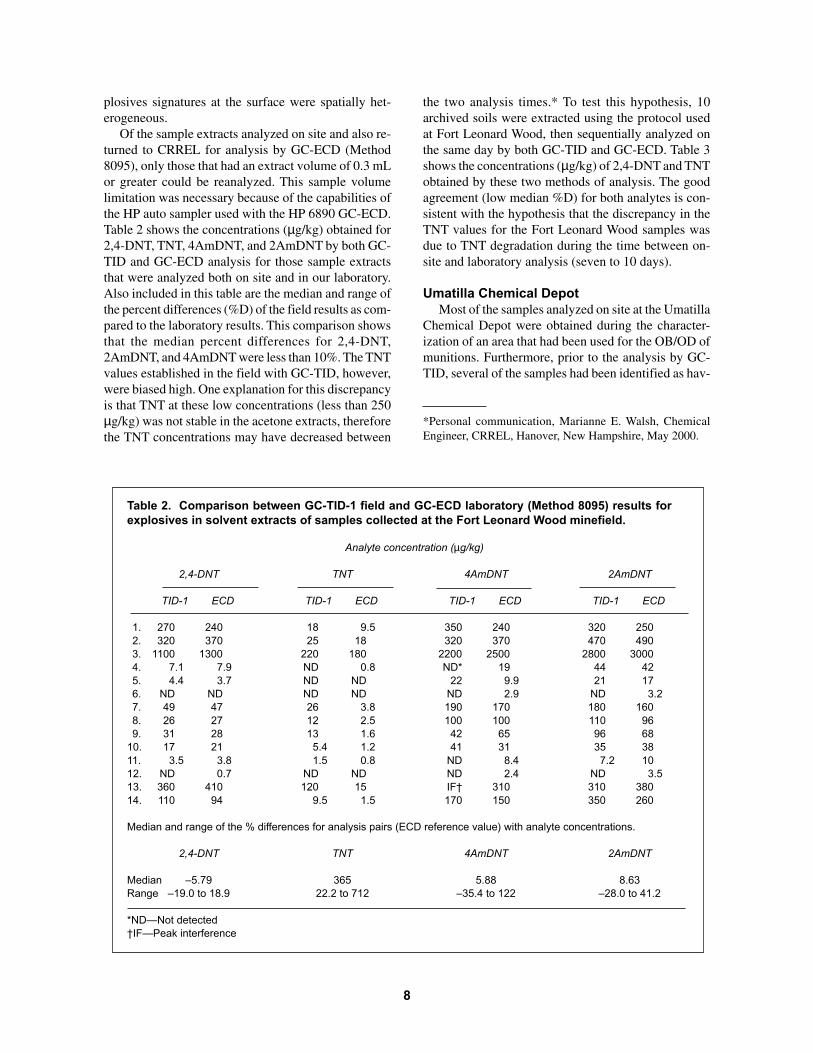
Of the sample extracts analyzed on site and also re-turned to CRREL for analysis by GC-ECD (Method8095), only those that had an extract volume of 0.3 mLor greater could be reanalyzed. This sample volumelimitation was necessary because of the capabilities ofthe HP auto sampler used with the HP 6890 GC-ECD.Table 2 shows the concentrations (µg/kg) obtained for2,4-DNT, TNT, 4AmDNT, and 2AmDNT by both GC-TID and GC-ECD analysis for those sample extractsthat were analyzed both on site and in our laboratory.Also included in this table are the median and range ofthe percent differences (%D) of the field results as com-pared to the laboratory results. This comparison showsthat the median percent differences for 2,4-DNT,2AmDNT, and 4AmDNT were less than 10%. The TNTvalues established in the field with GC-TID, however,were biased high. One explanation for this discrepancyis that TNT at these low concentrations (less than 250µg/kg) was not stable in the acetone extracts, thereforethe TNT concentrations may have decreased between
the two analysis times.* To test this hypothesis, 10archived soils were extracted using the protocol usedat Fort Leonard Wood, then sequentially analyzed onthe same day by both GC-TID and GC-ECD. Table 3shows the concentrations (µg/kg) of 2,4-DNT and TNTobtained by these two methods of analysis. The goodagreement (low median %D) for both analytes is con-sistent with the hypothesis that the discrepancy in theTNT values for the Fort Leonard Wood samples wasdue to TNT degradation during the time between on-site and laboratory analysis (seven to 10 days).
Umatilla Chemical Depot
Most of the samples analyzed on site at the UmatillaChemical Depot were obtained during the character-ization of an area that had been used for the OB/OD ofmunitions. Furthermore, prior to the analysis by GC-TID, several of the samples had been identified as hav-
*Personal communication, Marianne E. Walsh, ChemicalEngineer, CRREL, Hanover, New Hampshire, May 2000.
Table 2. Comparison between GC-TID-1 field and GC-ECD laboratory (Method 8095) results for
explosives in solvent extracts of samples collected at the Fort Leonard Wood minefield.
Analyte concentration (µg/kg)
2,4-DNT TNT 4AmDNT 2AmDNT
TID-1 ECD TID-1 ECD TID-1 ECD TID-1 ECD
1. 270 240 18 9.5 350 240 320 250
2. 320 370 25 18 320 370 470 490
3. 1100 1300 220 180 2200 2500 2800 3000
4. 7.1 7.9 ND 0.8 ND* 19 44 42
5. 4.4 3.7 ND ND 22 9.9 21 17
6. ND ND ND ND ND 2.9 ND 3.2
7. 49 47 26 3.8 190 170 180 160
8. 26 27 12 2.5 100 100 110 96
9. 31 28 13 1.6 42 65 96 68
10. 17 21 5.4 1.2 41 31 35 38
11. 3.5 3.8 1.5 0.8 ND 8.4 7.2 10
12. ND 0.7 ND ND ND 2.4 ND 3.5
13. 360 410 120 15 IF† 310 310 380
14. 110 94 9.5 1.5 170 150 350 260
Median and range of the % differences for analysis pairs (ECD reference value) with analyte concentrations.
2,4-DNT TNT 4AmDNT 2AmDNT
Median –5.79 365 5.88 8.63
Range –19.0 to 18.9 22.2 to 712 –35.4 to 122 –28.0 to 41.2
*ND—Not detected
†IF—Peak interference
8

ing high levels of TNT or RDX, or both, by Methods8510 and 8515. Several explosives analytes were de-tected in these soil samples, as well as the archived sedi-ment samples and water sample extracts that were madeavailable for analysis. The most frequently detectedanalytes by GC-TID were 2,4-DNT, TNB, TNT, RDX,and HMX. Table 4 shows the values obtained by bothGC-TID performed on site and GC-ECD (Method 8095)subsequently obtained in our laboratory at CRREL forTNB, TNT, and RDX.
The results in Table 4 show good agreement (medianpercent difference values of less than 13%) between thetwo methods of analysis for TNB, TNT, and RDX. Thereduction of TNT in the acetone extracts did not appearto occur as it had for the samples returned from FortLeonard Wood. Perhaps TNT is more stable in acetoneat the higher concentrations typical of these samples,or perhaps the storage condition (storage in a freezerversus on ice) used for these samples was better. 2,4-DNT was not included in this table because it waspresent only at concentrations below the lowest cali-bration standard used during this field demonstration.A couple of problems were encountered with the GC-TID estimates for HMX, i.e., false positives (three out
of 10 cases) or values considerably higher (3×, 3 out of10) than the Method 8095 results. The GC-TID chro-matograms that resulted in false positives or biased highHMX concentrations often had a very broad peak forthis explosive. This poor peak shape most likely is anindication that background interferences were present.
One of the more interesting findings of this field trialwas that, while the GC-TID results agreed with theMethod 8515 results for TNT, more often than not theydid not agree with the Method 8510 results for RDX.In those samples where Method 8510 obtained a re-sponse for RDX that resulted in a concentration thatwas not confirmed by GC-TID analysis, the GC-TIDchromatograms showed a peak(s) that eluted before 2,6-DNT or just before RDX, or both. Analysis of thesesame sample extracts in the laboratory by both GC-ECD and GC-TID established that the peak appearingbefore 2,6-DNT was NG while the peak on the frontedge of the RDX peak was PETN. Both NG and PETNare analytes that give a positive response when usingMethod 8510 (Crockett et al. 1996). Therefore, by us-ing the GC-TID, these analytes and HMX, all of whichgive a positive response by Method 8510, could be re-solved.
Table 3. Comparison between GC-TID and GC-ECD
laboratory (Method 8095) results for explosives in
solvent extracts of archived soil samples collected
at military facilities. Sample extracts were analyzed
by both methods at the same time.
Analyte concentration (µg/kg)
2,4-DNT TNT
TID ECD TID ECD
1. 140 130 47 47
2. 4.3 7.6 51 77
3. 290 300 290 320
4. ND ND ND 1.1
5. ND 0.8 0.8 1.7
6. 18 19 92 110
7. 7.5 8.8 0.7 0.7
8. 420 420 2.1 1.2
9. 9200 8000 28 32
10. 9.3 9.5 250 220
Median and range of the % differences for analysis pairs (ECD
reference value) with analyte concentrations.
2,4-DNT TNT
Median –2.72 –4.0
Range –43.4 to 15.0 –33.8 to 75.0
9

Environmental Technology Verification
Program (ETV)
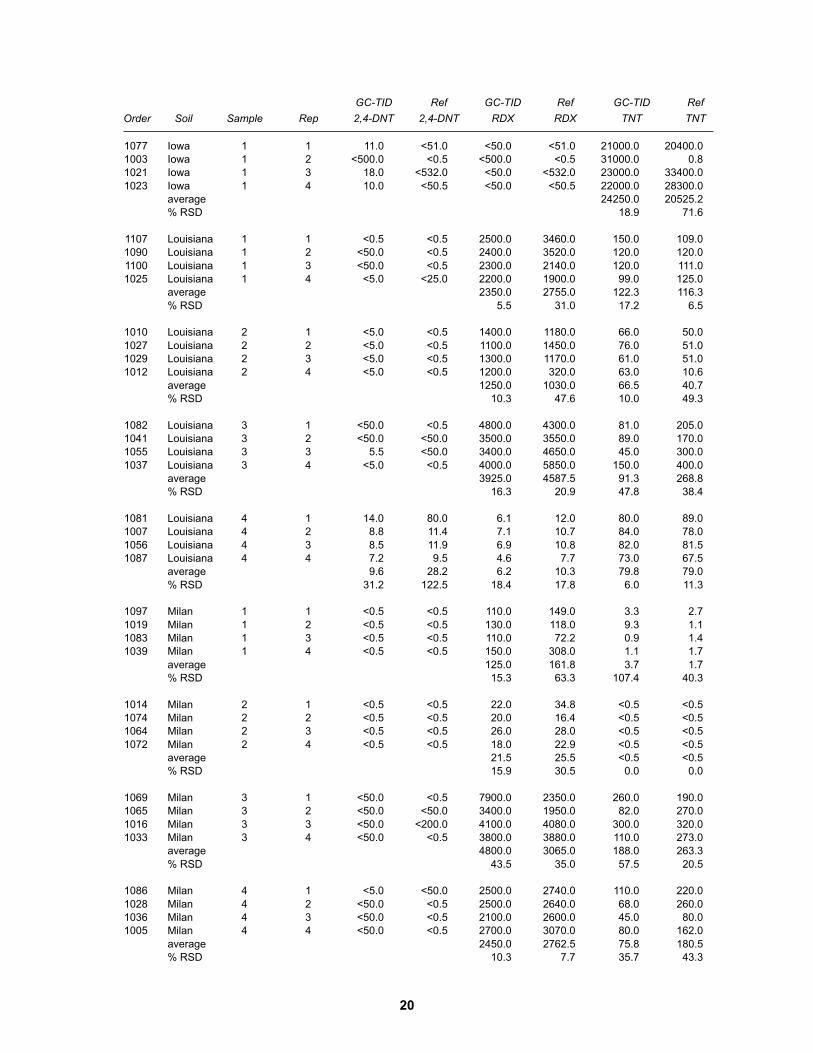
The on-site GC-TID and off-site reference labora-tory results for 2,4-DNT, TNT, and RDX are given inAppendix A. A cursory review of the values reported inAppendix A turned up two aberrant values reported bythe off-site reference laboratory (Blank 2-Replicate 2and Iowa 1-Replicate 2). These values were most likelydue to operator error (ORNL 2000). Both the referencelaboratory and the on-site GC-TID analyses were 100%complete, since values were reported for every sample.In the following discussion, we compare the analyticalresults from the on-site GC-TID analyses with thosefrom the reference laboratory using Method 8330. Oncepublicly available, an independent evaluation of the GC-TID performance in the form of a verification reportcan be found on the ETV web site.
The ETV samples included 20 soil samples spikedwith TNT and RDX to assess accuracy (% recovery). Asummary of results for both the GC-TID and a refer-ence laboratory analysis is presented in Table 5. Basedon the mean values, both the reference laboratory andGC-TID were unbiased. However, when comparing theindividual values to the acceptance criteria establishedby the developer (Environmental Resource Associates,Arvada, Colorado), the reference laboratory reportedmore outliers than the GC-TID (Table 6). For example,the reference laboratory reported two values for bothRDX and TNT that were higher than the expectedconcentration by 35% or more (Appendix A, Spike/PE,Sample 5-Replicate 2 and Sample 6-Replicate 3). Allfour of these reference laboratory values and two otherhigh values failed to meet the acceptance criteria thatwere set for these standard reference materials. In con-
Table 4. Comparison between GC-TID field and GC-ECD laboratory (Method
8095) results for explosives in solvent extracts of soil and sediment samples
collected at the Umatilla Chemical Depot.
Analyte concentration (mg/kg)
TNB TNT RDX
TID ECD TID ECD TID ECD
1. ND ND 480 430 ND ND
2. ND ND 2900 3700 ND ND
3. ND ND 0.25 0.11 ND 1.1
4. ND ND 5.8 4.6 ND 0.4
5. ND ND 980 780 ND ND
6. ND ND 520 440 ND ND
7. ND ND 0.20 0.30 ND ND
8. ND ND 15 14 ND ND
9. 2.2 3.2 18 19 ND ND
10. 18 16 220 210 ND ND
11. ND ND 1000 840 ND ND
12. ND ND ND ND 31 25
13. 22 14 40 33 ND ND
14. ND ND 620 550 400 380
15. 0.2 ND 0.25 0.40 12 9.4
16. ND ND 1100 870 ND ND
17. 3.2 4.3 0.10 0.16 6.0 5.4
18. 4.2 5.1 0.20 0.23 5.6 5.1
19. 50 36 1100 920 440 320
20. 49 26 1100 1000 440 430
21. ND ND 15,000 14,000 5900 6000
22. ND ND 20,000 16,000 8000 6700
Median and range of the % differences for analysis pairs (ECD reference value) with analyte
concentrations.
TNB TNT RDX
Median 12.5 11.6 11.1
Range –31.2 to 88.5 –37.5 to 127 –1.67 to 37.5
10
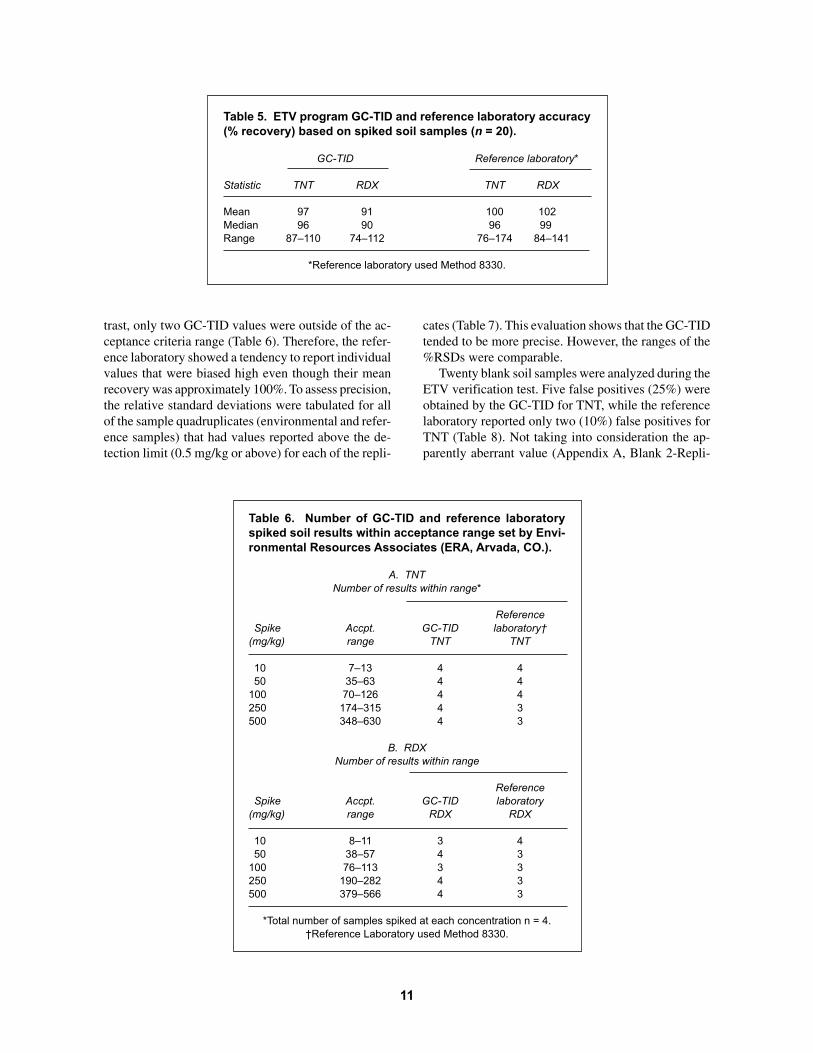
trast, only two GC-TID values were outside of the ac-ceptance criteria range (Table 6). Therefore, the refer-ence laboratory showed a tendency to report individualvalues that were biased high even though their meanrecovery was approximately 100%. To assess precision,the relative standard deviations were tabulated for allof the sample quadruplicates (environmental and refer-ence samples) that had values reported above the de-tection limit (0.5 mg/kg or above) for each of the repli-
cates (Table 7). This evaluation shows that the GC-TIDtended to be more precise. However, the ranges of the%RSDs were comparable.
Twenty blank soil samples were analyzed during theETV verification test. Five false positives (25%) wereobtained by the GC-TID for TNT, while the referencelaboratory reported only two (10%) false positives forTNT (Table 8). Not taking into consideration the ap-parently aberrant value (Appendix A, Blank 2-Repli-
Table 5. ETV program GC-TID and reference laboratory accuracy
(% recovery) based on spiked soil samples (n = 20).
GC-TID Reference laboratory*
Statistic TNT RDX TNT RDX
Mean 97 91 100 102
Median 96 90 96 99
Range 87–110 74–112 76–174 84–141
*Reference laboratory used Method 8330.
Table 6. Number of GC-TID and reference laboratory
spiked soil results within acceptance range set by Envi-
ronmental Resources Associates (ERA, Arvada, CO.).
A. TNT
Number of results within range*
Reference
Spike Accpt. GC-TID laboratory†
(mg/kg) range TNT TNT
10 7–13 4 4
50 35–63 4 4
100 70–126 4 4
250 174–315 4 3
500 348–630 4 3
B. RDX
Number of results within range
Reference
Spike Accpt. GC-TID laboratory
(mg/kg) range RDX RDX
10 8–11 3 4
50 38–57 4 3
100 76–113 3 3
250 190–282 4 3
500 379–566 4 3
*Total number of samples spiked at each concentration n = 4.
†Reference Laboratory used Method 8330.
11

cate 2), only one of the remaining false-positive valuesfor both methods of analysis was greater than 1.1 mg/kg. The carryover of TNT and other explosives, be-cause of cold spots in the injection port of the GC-TIDsystem, continues to be a concern even after adding aheated injection port to the GC (Hewitt and Jenkins1999). High concentrations of TNT could not be avoidedcompletely during the ETV verification test because ofthe necessity to analyze for RDX in the same sampleextract. Therefore, even with the addition of a heatedinjection port and screening samples prior to analysis,carryover appears to remain an issue of concern. Thisproblem is not unique to this GC system, and perhapswith further design changes it will become less of an is-sue in the future.
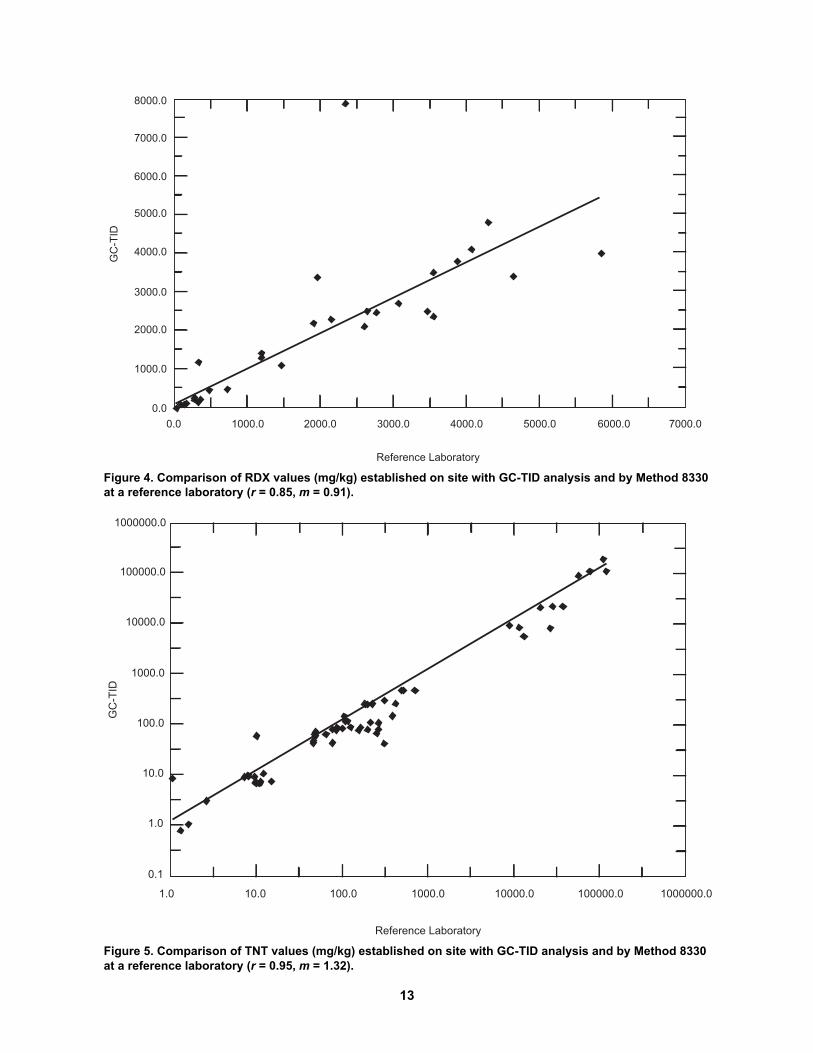
The experimental design also allows for compara-bility testing between the GC-TID and laboratoryresults for each individual sample that had analyte con-centrations estimated above 0.5 mg/kg by both meth-ods. For this comparison there were 12, 52, and 69comparable data points for 2,4-DNT, RDX, and TNT,respectively (aberrant TNT laboratory value removed).The correlation coefficients and slopes for the compari-son of these data points for 2,4-DNT, RDX, and TNTwere, respectively, r = 0.44 and m = 0.33, r = 0.85 andm = 0.91, r = 0.95 and m = 1.32. An additional analysis
of RDX and TNT value comparability between the twoanalyses was performed by assessing the ranges of %D.However, it should be recognized that in addition tovariability due to sample preparation and analysis, thereis variability (heterogeneity) in the analyte distributionwithin the sample jar from which the subsamples wereremoved for analysis by each participant and the refer-ence laboratory. With respect to the homogeneity ofthese analytes in each sample jar, RSDs of 20% or lesswere estimated for five replicate measurements (ORNL2000). This information does not readily lend itself tosetting an appropriate range for the %D, for judgingacceptability. With ±25 %D as the acceptance criterion,65% of the RDX and 45% of the TNT results are withinrange, whereas 96% of the RDX and 83% of the TNTresults are acceptable for ±50%D. Both of these com-parisons (regression analysis and %D) show that, ingeneral, there was good agreement between the twomethods of sample preparation and analysis for bothRDX and TNT (Fig. 4 and 5), and poor agreement for2,4-DNT.
In an attempt to understand the discrepancy betweenthe GC-TID and reference laboratory results for 2,4-DNT, the set of the samples that had been determinedto have this explosives analyte were reanalyzed byMethod 8330 at CRREL (Table 9). This analysis was
Table 7. ETV program GC-TID and reference laboratory precision (% RSD) for soil sample
replicates (quadruplicates).
GC-TID Reference laboratory*
Statistic 2,4-DNT TNT RDX 2,4-DNT TNT RDX
n = 4† n = 17 n = 13 n = 3 n = 18 n = 13
Mean 15 23 14 56 29 25
Median 9.0 13 10 32 25 21
Range 9–31 2–107 5–44 12–123 2–72 4 –63
*Reference laboratory used Method 8330.
†Mean is based only on sample sets where all four replicates had values reported.
Table 8. ETV program GC-TID and reference laboratory false-positive results for blank soil
samples (n = 20).
GC-TID Reference laboratory*
Statistic 2,4-DNT TNT RDX 2,4-DNT TNT RDX
No. FP† 0 5 0 0 2 0
% FP 0 25 0 0 10 0
*Reference laboratory used Method 8330.
†False-positive value reported.
12
8000.0
7000.0
6000.0
5000.0
4000.0
3000.0
2000.0
1000.0
0.0
0.0 1000.0 2000.0 3000.0 4000.0 5000.0 6000.0 7000.0
GC
-TID
Reference Laboratory
Figure 4. Comparison of RDX values (mg/kg) established on site with GC-TID analysis and by Method 8330
at a reference laboratory (r = 0.85, m = 0.91).
Figure 5. Comparison of TNT values (mg/kg) established on site with GC-TID analysis and by Method 8330
at a reference laboratory (r = 0.95, m = 1.32).
1000000.0
10000.0
1000.0
100.0
10.0
1.0
0.1
1.0 10.0 100.0 1000.0 10000.0 100000.0 1000000.0
100000.0
GC
-TID
Reference Laboratory
13
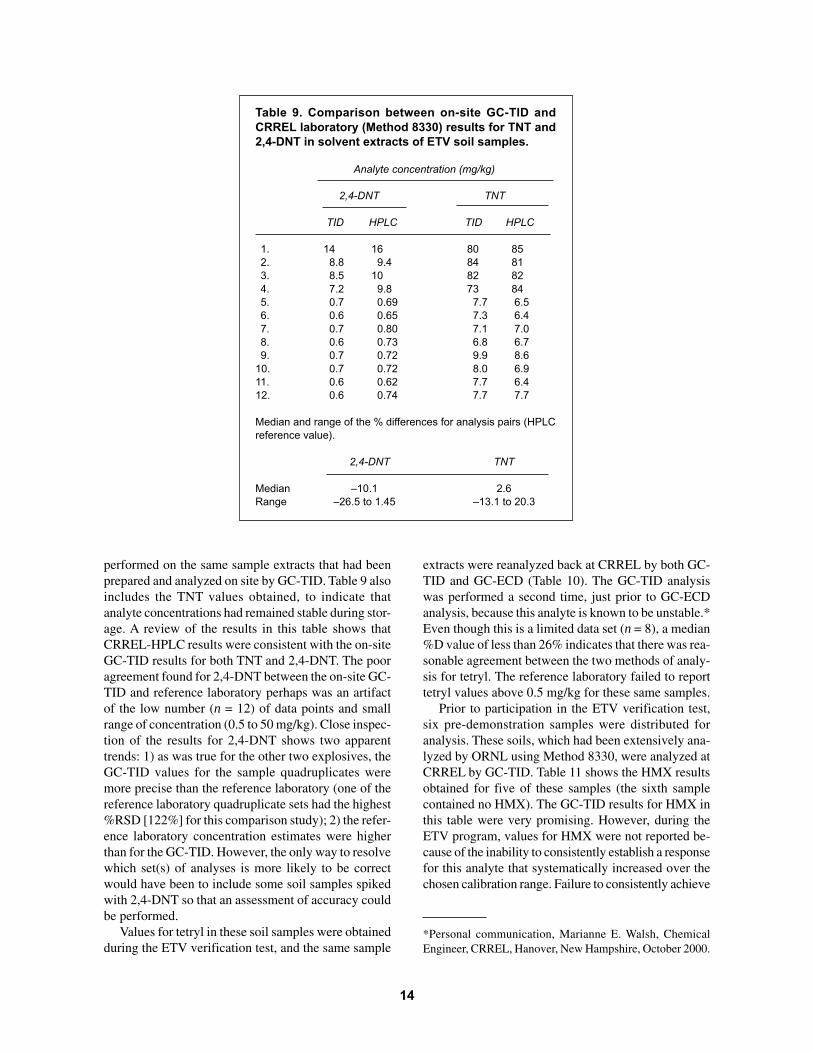
performed on the same sample extracts that had beenprepared and analyzed on site by GC-TID. Table 9 alsoincludes the TNT values obtained, to indicate thatanalyte concentrations had remained stable during stor-age. A review of the results in this table shows thatCRREL-HPLC results were consistent with the on-siteGC-TID results for both TNT and 2,4-DNT. The pooragreement found for 2,4-DNT between the on-site GC-TID and reference laboratory perhaps was an artifactof the low number (n = 12) of data points and smallrange of concentration (0.5 to 50 mg/kg). Close inspec-tion of the results for 2,4-DNT shows two apparenttrends: 1) as was true for the other two explosives, theGC-TID values for the sample quadruplicates weremore precise than the reference laboratory (one of thereference laboratory quadruplicate sets had the highest%RSD [122%] for this comparison study); 2) the refer-ence laboratory concentration estimates were higherthan for the GC-TID. However, the only way to resolvewhich set(s) of analyses is more likely to be correctwould have been to include some soil samples spikedwith 2,4-DNT so that an assessment of accuracy couldbe performed.
Values for tetryl in these soil samples were obtainedduring the ETV verification test, and the same sample
extracts were reanalyzed back at CRREL by both GC-TID and GC-ECD (Table 10). The GC-TID analysiswas performed a second time, just prior to GC-ECDanalysis, because this analyte is known to be unstable.*Even though this is a limited data set (n = 8), a median%D value of less than 26% indicates that there was rea-sonable agreement between the two methods of analy-sis for tetryl. The reference laboratory failed to reporttetryl values above 0.5 mg/kg for these same samples.
Prior to participation in the ETV verification test,six pre-demonstration samples were distributed foranalysis. These soils, which had been extensively ana-lyzed by ORNL using Method 8330, were analyzed atCRREL by GC-TID. Table 11 shows the HMX resultsobtained for five of these samples (the sixth samplecontained no HMX). The GC-TID results for HMX inthis table were very promising. However, during theETV program, values for HMX were not reported be-cause of the inability to consistently establish a responsefor this analyte that systematically increased over thechosen calibration range. Failure to consistently achieve
Table 9. Comparison between on-site GC-TID and
CRREL laboratory (Method 8330) results for TNT and
2,4-DNT in solvent extracts of ETV soil samples.
Analyte concentration (mg/kg)
2,4-DNT TNT
TID HPLC TID HPLC
1. 14 16 80 85
2. 8.8 9.4 84 81
3. 8.5 10 82 82
4. 7.2 9.8 73 84
5. 0.7 0.69 7.7 6.5
6. 0.6 0.65 7.3 6.4
7. 0.7 0.80 7.1 7.0
8. 0.6 0.73 6.8 6.7
9. 0.7 0.72 9.9 8.6
10. 0.7 0.72 8.0 6.9
11. 0.6 0.62 7.7 6.4
12. 0.6 0.74 7.7 7.7
Median and range of the % differences for analysis pairs (HPLC
reference value).
2,4-DNT TNT
Median –10.1 2.6
Range –26.5 to 1.45 –13.1 to 20.3
14
*Personal communication, Marianne E. Walsh, ChemicalEngineer, CRREL, Hanover, New Hampshire, October 2000.
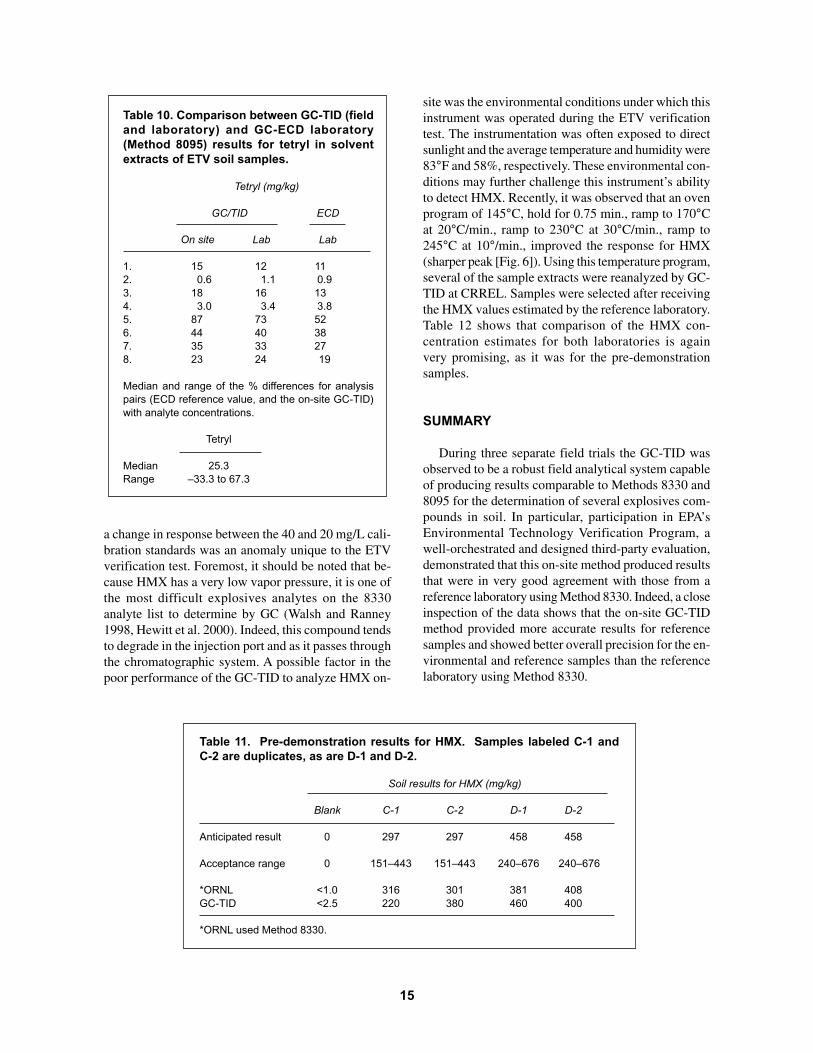
a change in response between the 40 and 20 mg/L cali-bration standards was an anomaly unique to the ETVverification test. Foremost, it should be noted that be-cause HMX has a very low vapor pressure, it is one ofthe most difficult explosives analytes on the 8330analyte list to determine by GC (Walsh and Ranney1998, Hewitt et al. 2000). Indeed, this compound tendsto degrade in the injection port and as it passes throughthe chromatographic system. A possible factor in thepoor performance of the GC-TID to analyze HMX on-
site was the environmental conditions under which thisinstrument was operated during the ETV verificationtest. The instrumentation was often exposed to directsunlight and the average temperature and humidity were83°F and 58%, respectively. These environmental con-ditions may further challenge this instrument’s abilityto detect HMX. Recently, it was observed that an ovenprogram of 145°C, hold for 0.75 min., ramp to 170°Cat 20°C/min., ramp to 230°C at 30°C/min., ramp to245°C at 10°/min., improved the response for HMX(sharper peak [Fig. 6]). Using this temperature program,several of the sample extracts were reanalyzed by GC-TID at CRREL. Samples were selected after receivingthe HMX values estimated by the reference laboratory.Table 12 shows that comparison of the HMX con-centration estimates for both laboratories is againvery promising, as it was for the pre-demonstrationsamples.
SUMMARY
During three separate field trials the GC-TID wasobserved to be a robust field analytical system capableof producing results comparable to Methods 8330 and8095 for the determination of several explosives com-pounds in soil. In particular, participation in EPA’sEnvironmental Technology Verification Program, awell-orchestrated and designed third-party evaluation,demonstrated that this on-site method produced resultsthat were in very good agreement with those from areference laboratory using Method 8330. Indeed, a closeinspection of the data shows that the on-site GC-TIDmethod provided more accurate results for referencesamples and showed better overall precision for the en-vironmental and reference samples than the referencelaboratory using Method 8330.
Table 10. Comparison between GC-TID (field
and laboratory) and GC-ECD laboratory
(Method 8095) results for tetryl in solvent
extracts of ETV soil samples.
Tetryl (mg/kg)
GC/TID ECD
On site Lab Lab
1. 15 12 11
2. 0.6 1.1 0.9
3. 18 16 13
4. 3.0 3.4 3.8
5. 87 73 52
6. 44 40 38
7. 35 33 27
8. 23 24 19
Median and range of the % differences for analysis
pairs (ECD reference value, and the on-site GC-TID)
with analyte concentrations.
Tetryl
Median 25.3
Range –33.3 to 67.3
Table 11. Pre-demonstration results for HMX. Samples labeled C-1 and
C-2 are duplicates, as are D-1 and D-2.
Soil results for HMX (mg/kg)
Blank C-1 C-2 D-1 D-2
Anticipated result 0 297 297 458 458
Acceptance range 0 151–443 151–443 240–676 240–676
*ORNL <1.0 316 301 381 408
GC-TID <2.5 220 380 460 400
*ORNL used Method 8330.
15

Aceto
ne
2,6
-DN
T &
1,3
-DN
B
2,4
-DN
T
TN
T
TN
B
4A
mD
NT
2A
mD
NT
Te
tryl
HM
X
RD
X
10 2 3 4 5 6
Figure 6. GC-TID chromatogram of 40 mg/L of the 8330 analytes.
16

Use of the on-site GC-TID method is compatiblewith the use of dynamic sampling plans being advo-cated by the U.S. EPA. This near-real-time capabilitygreatly improves the field sampling team’s ability toidentify which explosives analytes are present at a siteand characterize their distribution and concentrations.These capabilities and the low cost of the instrumentand sample preparation equipment make this methodof explosives residue analysis a good addition to thosealready endorsed by the US EPA.
LITERATURE CITED
Crockett, A.B., H.D. Craig, T.F. Jenkins, and W.E.Sisk (1996) Field sampling and selecting on-site ana-lytical methods for explosives in soil. Federal Facili-ties Forum Issue. EPA Report 540/R-97/501.Crockett, A.B., H.D. Craig, and T.F. Jenkins (1999)Field sampling and selecting on-site methods for ex-plosives in water. EPA Federal Facilities Forum Issue.EPA Report 600/S-99/002.Hewitt, A.D., and T.F. Jenkins (1999) On-site methodfor measuring nitroaromatic and nitramine explosivesin soil and groundwater using GC-NPD: Feasibility
Table 12. Comparison between GC-TID
laboratory and reference laboratory re-
sults for HMX in selected ETV samples.
(HMX mg/kg)
Sample TID Ref lab*
1050 240 370
1073 200 252
1092 230 259
1013 200 264
1034 200 278
1031 180 248
1098 240 322
1067 230 185
1026 280 300
1084 210 185
1066 300 392
1030 240 214
1097 12 22.2
1019 16 23.2
1083 15 16.5
1039 22 42
1014 1.7 8.3
1074 3.0 3.6
1064 2.8 3.5
1072 2.5 4.3
*Method 8330
Study. U.S. Army Cold Regions Research and Engi-neering Laboratory Special Report 99-9.Hewitt, A.D., T.F. Jenkins, and T.A. Ranney (2000)On-site method for nitroaromatic and nitramine explo-sives using GC-thermionic detectors. In 2nd Interna-tional Conference on Remediation of Chlorinated andRecalcitrant Compounds, Monterey, California, May22–25. (C2-1), p. 87–94.Jenkins, T.F., C.L. Grant, G.S. Brar, P.G. Thorne,T.A. Ranney, and P.W. Schumacher (1996) Assess-ment of sampling error associated with collection andanalysis of soil samples at explosives-contaminatedsites. U.S. Army Cold Regions Research and Engineer-ing Laboratory Special Report 96-15.Jenkins, T.F., M.E. Walsh, P.G. Thorne, P.H.Miyares, T.A. Ranney, C.L. Grant, and J. Esparza(1998) Site characterization at the inland firing rangeimpact area at Fort Ord. U.S. Army Cold Regions Re-search and Engineering Laboratory Special Report 98-9.Jenkins, T.F., M.E. Walsh, P.H. Miyares, J.A.Kopczynski, T.A. Ranney, V. George, J.C.Pennington, and T.E. Berry, Jr. (2000) Analysis ofexplosives-related chemical signatures in soil samplescollected near buried land mines. U.S. Army EngineerResearch and Development Center, ERDC/CRRELTechnical Report TR-00-5.ORNL (2000) Technology Verification Test Plan:Evaluation of explosives field analysis techniques. OakRidge National Laboratory, Oak Ridge, Tennessee.Patterson, P.L. (1986) Recent advances in thermionicionization detection for gas chromatography. Journalof Chromatographic Science, 24: p. 41–52.U.S. EPA (1994) Method 8330: Nitroaromatics andnitramines by HPLC. In Test Methods for EvaluatingSolid Waste, Physical/Chemical Methods, Office ofSolid Waste and Emergency Response. U.S. Environ-mental Protection Agency, Washington, D.C., SW-846,through update 4b (www.epa.gov/sw-846).U.S. EPA (1996a) Method 4050: TNT explosives insoil by immunoassay. In Test Methods for EvaluatingSolid Waste, Physical/Chemical Methods, Office ofSolid Waste and Emergency Response. U.S. Environ-mental Protection Agency, Washington, D.C., SW-846,through update 4b (www.epa.gov/sw-846).U.S. EPA (1996b) Method 4051: Hexahydro-1,3,5-trinitro-1,3,5-triazine (RDX) in soil by immunoassay.In Test Methods for Evaluating Solid Waste, Physical/Chemical Methods, Office of Solid Waste and Emer-gency Response. U.S. Environmental ProtectionAgency, Washington, D.C., SW-846, through update4b (www.epa.gov/sw-846).U.S. EPA (1996c) Method 8515: Colorimetric screen-ing method for trinitrotoluene (TNT) in soil. In TestMethods for Evaluating Solid Waste, Physical/Chemi-
17

cal Methods, Office of Solid Waste and Emergency Re-sponse. U.S. Environmental Protection Agency, Wash-ington, D.C., SW-846, through update 4b(www.epa.gov/sw-846).U.S. EPA (1999) Method 8095: Nitroaromatics andNitramine by GC-ECD. In Test Methods for Evaluat-ing Solid Waste, Physical/Chemical Methods, Office ofSolid Waste and Emergency Response. U.S. Environ-mental Protection Agency, Washington, D.C., SW-846,through update 4b (www.epa.gov/sw-846).U.S. EPA (2000) Method 8510: Colorimetric screen-ing procedure for RDX and HMX in soil. In Test Meth-ods for Evaluating Solid Waste, Physical/ChemicalMethods, Office of Solid Waste and Emergency Re-
sponse. U.S. Environmental Protection Agency, Wash-ington, D.C., SW-846, through update 4b(www.epa.gov/sw-846).Walsh, M.E., and T.A. Ranney (1998) Determinationof nitroaromatic, nitramine, and nitrate ester explosivesin water using SPE and GC-ECD: Comparison withHPLC. U.S. Army Cold Regions Research and Engi-neering Laboratory CRREL Report 98-2.Walsh, M.E., T.F. Jenkins, P.S. Schnitker, J.W.Elwell, and M.H. Stutz (1993) Evaluation of SW-846Method 8330 for characterization of site contaminatedwith residues of high explosives. U.S. Army Cold Re-gions Research and Engineering Laboratory SpecialReport 93-5.
18

GC-TID Ref GC-TID Ref GC-TID Ref
Order Soil Sample Rep 2,4-DNT 2,4-DNT RDX RDX TNT TNT
1079 Blank 1 1 <0.5 <0.5 <0.5 <0.5 <0.5 <0.5
1076 Blank 1 2 <0.5 <0.5 <0.5 <0.5 <0.5 <0.5
1062 Blank 1 3 <0.5 <0.5 <0.5 <0.5 <0.5 <0.5
1078 Blank 1 4 <0.5 <0.5 <0.5 <0.5 <0.5 <0.5
average
% RSD
1070 Blank 2 1 <0.5 <0.5 <0.5 <0.5 <0.5 <0.5
1108 Blank 2 2 <0.5 <51.0 <0.5 <51.0 <0.5 70900.0
1038 Blank 2 3 <0.5 <0.5 <0.5 <0.5 <0.5 <0.5
1054 Blank 2 4 <0.5 <0.5 <0.5 <0.5 <0.5 <0.5
average
% RSD
1043 Blank 3 1 <0.5 <0.5 <0.5 <0.5 <0.5 <0.5
1052 Blank 3 2 <0.5 <0.5 <0.5 <0.5 <0.5 <0.5
1008 Blank 3 3 <0.5 <0.5 <0.5 <0.5 1.1 <0.5
1102 Blank 3 4 <0.5 <0.5 <0.5 <0.5 0.5 <0.5
average
% RSD
1024 Blank 4 1 <0.5 <0.5 <0.5 <0.5 <0.5 0.9
1018 Blank 4 2 <0.5 <0.5 <0.5 <0.5 <0.5 <0.5
1101 Blank 4 3 <0.5 <0.5 <0.5 <0.5 0.7 <0.5
1022 Blank 4 4 <0.5 <0.5 <0.5 <0.5 0.5 <0.5
average
% RSD
1088 Blank 5 1 <0.5 <0.5 <0.5 <0.5 <0.5 <0.5
1046 Blank 5 2 <0.5 <0.5 <0.5 <0.5 <0.5 <0.5
1006 Blank 5 3 <0.5 <0.5 <0.5 <0.5 6.3 <0.5
1053 Blank 5 4 <0.5 <0.5 <0.5 <0.5 <0.5 <0.5
average
% RSD
1050 Fort Ord 1 1 <0.5 <0.5 <0.5 0.6 <0.5 <0.5
1073 Fort Ord 1 2 <0.5 <0.5 <0.5 <0.5 <0.5 0.8
1092 Fort Ord 1 3 <0.5 <0.5 <0.5 <0.5 <0.5 0.8
1013 Fort Ord 1 4 <0.5 <0.5 <0.5 0.5 <0.5 <0.5
average
% RSD
1034 Fort Ord 2 1 <0.5 <0.5 <0.5 <0.5 0.6 0.8
1031 Fort Ord 2 2 <0.5 <0.5 <0.5 <0.5 <0.5 2.1
1098 Fort Ord 2 3 <0.5 <0.5 <0.5 <0.5 3.0 0.8
1067 Fort Ord 2 4 <0.5 <0.5 <0.5 <0.5 0.5 0.8
average 0.9 1.1
% RSD 165.1 57.8
1026 Fort Ord 3 1 <0.5 <0.5 <0.5 <0.5 <0.5 <0.5
1084 Fort Ord 3 2 <0.5 <0.5 <0.5 <0.5 <0.5 <0.5
1066 Fort Ord 3 3 <0.5 <0.5 <0.5 <0.5 <0.5 <0.5
1030 Fort Ord 3 4 <0.5 <0.5 <0.5 <0.5 <0.5 <0.5
average
% RSD
APPENDIX A: ETV PROGRAM GC-TID AND REFERENCE LABORATORY RESULTS FOR 2,4-DNT,
RDX, AND TNT (mg/kg)
19
GC-TID Ref GC-TID Ref GC-TID Ref
Order Soil Sample Rep 2,4-DNT 2,4-DNT RDX RDX TNT TNT
1077 Iowa 1 1 11.0 <51.0 <50.0 <51.0 21000.0 20400.0
1003 Iowa 1 2 <500.0 <0.5 <500.0 <0.5 31000.0 0.8
1021 Iowa 1 3 18.0 <532.0 <50.0 <532.0 23000.0 33400.0
1023 Iowa 1 4 10.0 <50.5 <50.0 <50.5 22000.0 28300.0
average 24250.0 20525.2
% RSD 18.9 71.6
1107 Louisiana 1 1 <0.5 <0.5 2500.0 3460.0 150.0 109.0
1090 Louisiana 1 2 <50.0 <0.5 2400.0 3520.0 120.0 120.0
1100 Louisiana 1 3 <50.0 <0.5 2300.0 2140.0 120.0 111.0
1025 Louisiana 1 4 <5.0 <25.0 2200.0 1900.0 99.0 125.0
average 2350.0 2755.0 122.3 116.3
% RSD 5.5 31.0 17.2 6.5
1010 Louisiana 2 1 <5.0 <0.5 1400.0 1180.0 66.0 50.0
1027 Louisiana 2 2 <5.0 <0.5 1100.0 1450.0 76.0 51.0
1029 Louisiana 2 3 <5.0 <0.5 1300.0 1170.0 61.0 51.0
1012 Louisiana 2 4 <5.0 <0.5 1200.0 320.0 63.0 10.6
average 1250.0 1030.0 66.5 40.7
% RSD 10.3 47.6 10.0 49.3
1082 Louisiana 3 1 <50.0 <0.5 4800.0 4300.0 81.0 205.0
1041 Louisiana 3 2 <50.0 <50.0 3500.0 3550.0 89.0 170.0
1055 Louisiana 3 3 5.5 <50.0 3400.0 4650.0 45.0 300.0
1037 Louisiana 3 4 <5.0 <0.5 4000.0 5850.0 150.0 400.0
average 3925.0 4587.5 91.3 268.8
% RSD 16.3 20.9 47.8 38.4
1081 Louisiana 4 1 14.0 80.0 6.1 12.0 80.0 89.0
1007 Louisiana 4 2 8.8 11.4 7.1 10.7 84.0 78.0
1056 Louisiana 4 3 8.5 11.9 6.9 10.8 82.0 81.5
1087 Louisiana 4 4 7.2 9.5 4.6 7.7 73.0 67.5
average 9.6 28.2 6.2 10.3 79.8 79.0
% RSD 31.2 122.5 18.4 17.8 6.0 11.3
1097 Milan 1 1 <0.5 <0.5 110.0 149.0 3.3 2.7
1019 Milan 1 2 <0.5 <0.5 130.0 118.0 9.3 1.1
1083 Milan 1 3 <0.5 <0.5 110.0 72.2 0.9 1.4
1039 Milan 1 4 <0.5 <0.5 150.0 308.0 1.1 1.7
average 125.0 161.8 3.7 1.7
% RSD 15.3 63.3 107.4 40.3
1014 Milan 2 1 <0.5 <0.5 22.0 34.8 <0.5 <0.5
1074 Milan 2 2 <0.5 <0.5 20.0 16.4 <0.5 <0.5
1064 Milan 2 3 <0.5 <0.5 26.0 28.0 <0.5 <0.5
1072 Milan 2 4 <0.5 <0.5 18.0 22.9 <0.5 <0.5
average 21.5 25.5 <0.5 <0.5
% RSD 15.9 30.5 0.0 0.0
1069 Milan 3 1 <50.0 <0.5 7900.0 2350.0 260.0 190.0
1065 Milan 3 2 <50.0 <50.0 3400.0 1950.0 82.0 270.0
1016 Milan 3 3 <50.0 <200.0 4100.0 4080.0 300.0 320.0
1033 Milan 3 4 <50.0 <0.5 3800.0 3880.0 110.0 273.0
average 4800.0 3065.0 188.0 263.3
% RSD 43.5 35.0 57.5 20.5
1086 Milan 4 1 <5.0 <50.0 2500.0 2740.0 110.0 220.0
1028 Milan 4 2 <50.0 <0.5 2500.0 2640.0 68.0 260.0
1036 Milan 4 3 <50.0 <0.5 2100.0 2600.0 45.0 80.0
1005 Milan 4 4 <50.0 <0.5 2700.0 3070.0 80.0 162.0
average 2450.0 2762.5 75.8 180.5
% RSD 10.3 7.7 35.7 43.3
20

GC-TID Ref GC-TID Ref GC-TID Ref
Order Soil Sample Rep 2,4-DNT 2,4-DNT RDX RDX TNT TNT
1048 Milan 5 1 0.7 2.1 <0.5 <0.5 7.7 11.5
1047 Milan 5 2 0.6 2.7 <0.5 <0.5 7.3 10.2
1060 Milan 5 3 0.7 1.7 <0.5 <0.5 7.1 11.3
1059 Milan 5 4 0.6 1.6 <0.5 <0.5 6.8 10.6
average 0.7 2.0 <0.5 <0.5 7.2 10.9
% RSD 8.9 24.7 0.0 0.0 5.2 5.6
1103 Spike/PE 1 1 <0.5 <0.5 <0.5 <0.5 87.0 81.8
1044 Spike/PE 1 2 <0.5 <0.5 <0.5 <0.5 87.0 104.0
1095 Spike/PE 1 3 <0.5 <0.5 <0.5 <0.5 92.0 90.0
1094 Spike/PE 1 4 <0.5 <0.5 <0.5 <0.5 92.0 124.0
average 89.5 100.0
% RSD 3.2 18.5
1105 Spike/PE 2 1 <0.5 <0.5 84.0 111.0 <0.5 <0.5
1057 Spike/PE 2 2 <0.5 <0.5 76.0 90.5 <0.5 <0.5
1020 Spike/PE 2 3 <0.5 <0.5 88.0 98.0 2.4 <0.5
1063 Spike/PE 2 4 <0.5 <0.5 74.0 127.0 <0.5 <0.5
average 80.5 106.6
% RSD 8.2 15.0
1049 Spike/PE 3 1 <0.5 <0.5 49.0 49.5 11.0 8.4
1001 Spike/PE 3 2 <0.5 <0.5 56.0 45.0 10.0 7.6
1058 Spike/PE 3 3 <0.5 <0.5 47.0 63.5 9.9 10.0
1061 Spike/PE 3 4 <0.5 <0.5 46.0 51.0 10.0 8.5
average 49.5 52.3 10.2 8.6
% RSD 9.1 15.2 5.1 11.6
1104 Spike/PE 4 1 <0.5 <0.5 7.6 9.1 45.0 47.5
1096 Spike/PE 4 2 <0.5 <0.5 9.7 8.4 50.0 48.5
1071 Spike/PE 4 3 <0.5 <0.5 8.9 8.6 45.0 48.5
1106 Spike/PE 4 4 <0.5 <0.5 8.7 9.1 48.0 47.0
average 8.7 8.8 47.0 47.9
% RSD 9.9 4.0 5.2 1.6
1068 Spike/PE 5 1 <0.5 <0.5 440.0 460.0 260.0 230.0
1004 Spike/PE 5 2 <5.0 <0.5 490.0 455.0 240.0 205.0
1075 Spike/PE 5 3 <5.0 <0.5 490.0 705.0 260.0 435.0
1045 Spike/PE 5 4 <0.5 <0.5 450.0 445.0 260.0 205.0
average 467.5 516.3 255.0 268.8
% RSD 5.6 24.4 3.9 41.5
1099 Spike/PE 6 1 <5.0 <0.5 210.0 260.0 480.0 535.0
1042 Spike/PE 6 2 <5.0 <25.0 220.0 255.0 480.0 505.0
1093 Spike/PE 6 3 <5.0 <0.5 230.0 335.0 480.0 675.0
1017 Spike/PE 6 4 <0.5 <0.5 270.0 250.0 500.0 510.0
average 232.5 275.0 485.0 556.3
% RSD 11.3 14.6 2.1 14.4
1002 Volunteer 1 1 <500.0 <50.0 <500.0 <50.0 190000.0 108000.0
1091 Volunteer 1 2 59.0 <25.0 <50.0 <25.0 110000.0 75500.0
1089 Volunteer 1 3 60.0 19.0 <50.0 <5.0 110000.0 117000.0
1015 Volunteer 1 4 67.0 <250.0 <50.0 <250.0 94000.0 61000.0
average 126000.0 90375.0
% RSD 34.4 29.3
1085 Volunteer 2 1 30.0 <53.2 <50.0 <53.2 9000.0 11300.0
1051 Volunteer 2 2 29.0 <538.0 <50.0 <538.0 6200.0 12600.0
1011 Volunteer 2 3 35.0 <5.4 <50.0 6.5 8300.0 26200.0
1009 Volunteer 2 4 34.0 45.2 <50.0 <5.4 9400.0 8920.0
average 32.0 8225.0 14755.0
% RSD 9.2 17.3 52.7
21

GC-TID Ref GC-TID Ref GC-TID Ref
Order Soil Sample Rep 2,4-DNT 2,4-DNT RDX RDX TNT TNT
1035 Volunteer 3 1 0.7 2.0 <0.5 <0.5 9.9 12.0
1032 Volunteer 3 2 0.7 3.0 <0.5 <0.5 8.0 10.3
1040 Volunteer 3 3 0.6 2.2 <0.5 <0.5 7.7 13.8
1080 Volunteer 3 4 0.6 2.2 <0.5 <0.5 7.7 10.4
average 0.7 2.4 8.3 11.6
% RSD 8.9 18.9 12.7 14.2
22