fidelity variable insurance products - national life group · fidelity® variable insurance...
TRANSCRIPT
Fidelity® Variable Insurance Products:
High Income Portfolio
Annual ReportDecember 31, 2017
Annual Report
Performance 3Management’s Discussion of Fund Performance 4Investment Summary 5Investments 6Financial Statements 16Notes to Financial Statements 22Report of Independent Registered Public Accounting Firm
27
Trustees and Officers 28Shareholder Expense Example 35Board Approval of Investment Advisory Contracts and Management Fees
36
To view a fund’s proxy voting guidelines and proxy voting record for the 12-month period ended June 30, visit http://www.fidelity.com/proxyvotingresults or visit the Securities and Exchange Commission’s (SEC) web site at http://www.sec.gov.You may also call 1-877-208-0098 to request a free copy of the proxy voting guidelines.Fidelity® Variable Insurance Products are separate account options which are purchased through a variable insurance contract.Standard & Poor’s, S&P and S&P 500 are registered service marks of The McGraw-Hill Companies, Inc. and have been licensed for use by Fidelity Distributors Corporation.Other third-party marks appearing herein are the property of their respective owners.All other marks appearing herein are registered or unregistered trademarks or service marks of FMR LLC or an affiliated company. © 2018 FMR LLC. All rights reserved.
Contents
This report and the financial statements contained herein are submitted for the general information of the shareholders of the Fund. This report is not authorized for distribution to prospective investors in the Fund unless preceded or accompanied by an effective prospectus.A fund files its complete schedule of portfolio holdings with the SEC for the first and third quarters of each fiscal year on Form N-Q. Forms N-Q are available on the SEC’s web site at http://www.sec.gov. A fund’s Forms N-Q may be reviewed and copied at the SEC’s Public Reference Room in Washington, DC. Information regarding the operation of the SEC’s Public Reference Room may be obtained by calling 1-800-SEC-0330.For a complete list of a fund’s portfolio holdings, view the most recent holdings listing, semiannual report, or annual report on Fidelity’s web site at http://www.fidelity.com, http://www.institutional.fidelity.com, or http://www.401k.com, as applicable.NOT FDIC INSURED •MAY LOSE VALUE •NO BANK GUARANTEENeither the Fund nor Fidelity Distributors Corporation is a bank.
3 Annual Report
Performance: The Bottom Line
Average annual total return reflects the change in the value of an investment, assuming reinvestment of distributions from dividend income and capital gains (the profits earned upon the sale of securities that have grown in value, if any) and assuming a constant rate of performance each year. During periods of reimbursement by Fidelity, a fund’s total return will be greater than it would be had the reimbursement not occurred. Performance numbers are net of all underlying fund operating expenses, but do not include any insurance charges imposed by your insurance company’s separate account. If performance information included the effect of these additional charges, the total returns would have been lower. How a fund did yesterday is no guarantee of how it will do tomorrow.
Average Annual Total Returns
For the periods ended December 31, 2017 Past 1 year
Past 5 years
Past 10 years
Initial Class 7.13% 4.87% 6.36%Service Class 7.07% 4.75% 6.26%Service Class 2 6.91% 4.59% 6.09%Investor Class 6.95% 4.82% 6.33%
$10,000 Over 10 Years
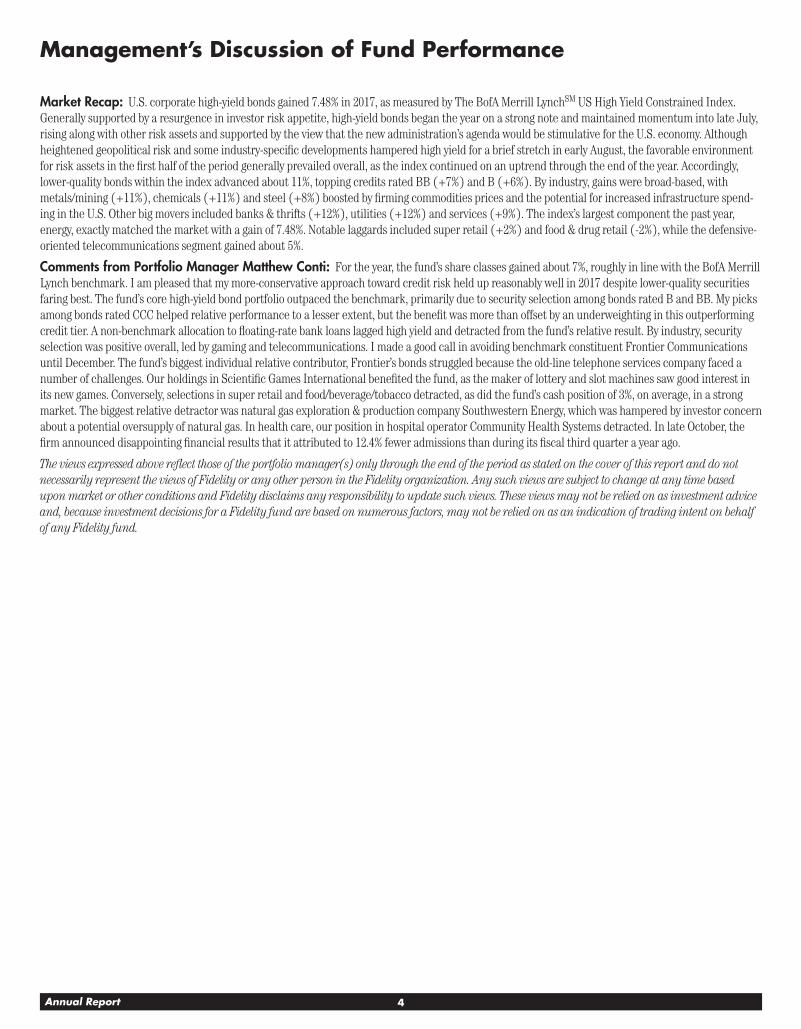
Let’s say hypothetically that $10,000 was invested in VIP High Income Portfolio – Initial Class on December 31, 2007.
The chart shows how the value of your investment would have changed, and also shows how the The BofA Merrill LynchSM US High Yield Constrained Index performed over the same period.
Period Ending Values
$18,523 VIP High Income Portfolio – Initial Class
$21,501 The BofA Merrill LynchSM US High Yield Constrained Index
4Annual Report
Management’s Discussion of Fund Performance
Market Recap: U.S. corporate high-yield bonds gained 7.48% in 2017, as measured by The BofA Merrill LynchSM US High Yield Constrained Index. Generally supported by a resurgence in investor risk appetite, high-yield bonds began the year on a strong note and maintained momentum into late July, rising along with other risk assets and supported by the view that the new administration’s agenda would be stimulative for the U.S. economy. Although heightened geopolitical risk and some industry-specific developments hampered high yield for a brief stretch in early August, the favorable environment for risk assets in the first half of the period generally prevailed overall, as the index continued on an uptrend through the end of the year. Accordingly, lower-quality bonds within the index advanced about 11%, topping credits rated BB (+7%) and B (+6%). By industry, gains were broad-based, with metals/mining (+11%), chemicals (+11%) and steel (+8%) boosted by firming commodities prices and the potential for increased infrastructure spend-ing in the U.S. Other big movers included banks & thrifts (+12%), utilities (+12%) and services (+9%). The index’s largest component the past year, energy, exactly matched the market with a gain of 7.48%. Notable laggards included super retail (+2%) and food & drug retail (-2%), while the defensive-oriented telecommunications segment gained about 5%.
Comments from Portfolio Manager Matthew Conti: For the year, the fund’s share classes gained about 7%, roughly in line with the BofA Merrill Lynch benchmark. I am pleased that my more-conservative approach toward credit risk held up reasonably well in 2017 despite lower-quality securities faring best. The fund’s core high-yield bond portfolio outpaced the benchmark, primarily due to security selection among bonds rated B and BB. My picks among bonds rated CCC helped relative performance to a lesser extent, but the benefit was more than offset by an underweighting in this outperforming credit tier. A non-benchmark allocation to floating-rate bank loans lagged high yield and detracted from the fund’s relative result. By industry, security selection was positive overall, led by gaming and telecommunications. I made a good call in avoiding benchmark constituent Frontier Communications until December. The fund’s biggest individual relative contributor, Frontier’s bonds struggled because the old-line telephone services company faced a number of challenges. Our holdings in Scientific Games International benefited the fund, as the maker of lottery and slot machines saw good interest in its new games. Conversely, selections in super retail and food/beverage/tobacco detracted, as did the fund’s cash position of 3%, on average, in a strong market. The biggest relative detractor was natural gas exploration & production company Southwestern Energy, which was hampered by investor concern about a potential oversupply of natural gas. In health care, our position in hospital operator Community Health Systems detracted. In late October, the firm announced disappointing financial results that it attributed to 12.4% fewer admissions than during its fiscal third quarter a year ago.
The views expressed above reflect those of the portfolio manager(s) only through the end of the period as stated on the cover of this report and do not necessarily represent the views of Fidelity or any other person in the Fidelity organization. Any such views are subject to change at any time based upon market or other conditions and Fidelity disclaims any responsibility to update such views. These views may not be relied on as investment advice and, because investment decisions for a Fidelity fund are based on numerous factors, may not be relied on as an indication of trading intent on behalf of any Fidelity fund.
5 Annual Report
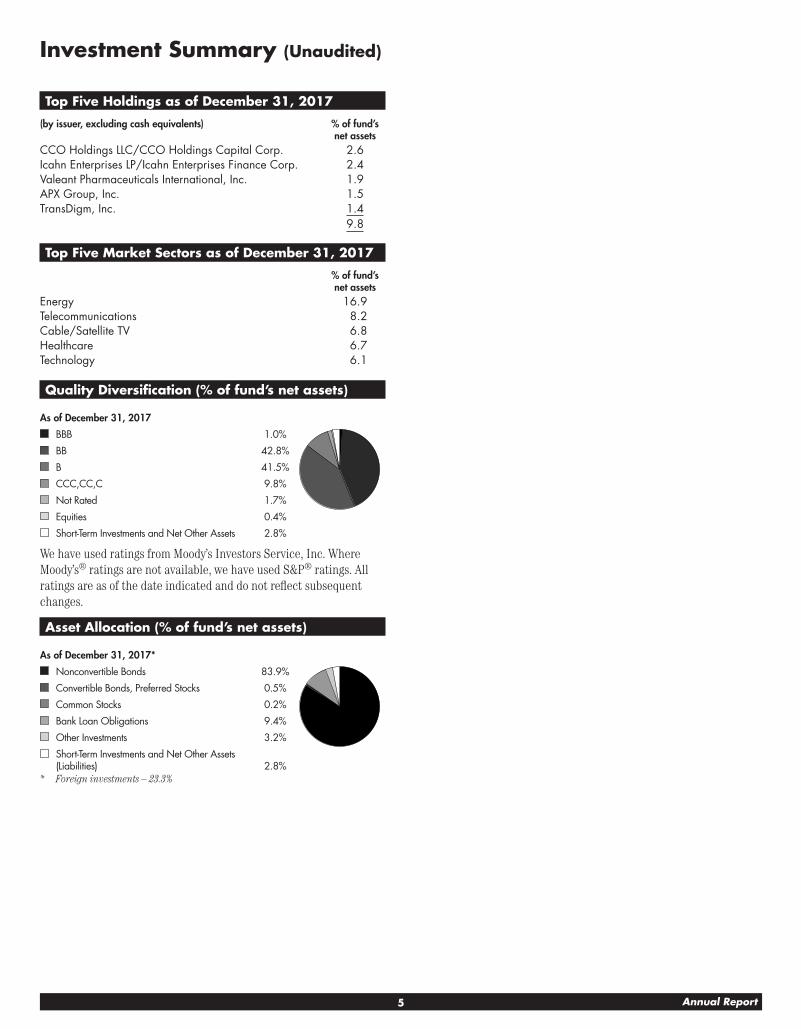
Investment Summary (Unaudited)
Top Five Holdings as of December 31, 2017
(by issuer, excluding cash equivalents) % of fund’s net assets
CCO Holdings LLC/CCO Holdings Capital Corp. 2.6Icahn Enterprises LP/Icahn Enterprises Finance Corp. 2.4Valeant Pharmaceuticals International, Inc. 1.9APX Group, Inc. 1.5TransDigm, Inc. 1.4
9.8
Top Five Market Sectors as of December 31, 2017
% of fund’s net assets
Energy 16.9Telecommunications 8.2Cable/Satellite TV 6.8Healthcare 6.7Technology 6.1
Quality Diversification (% of fund’s net assets)
As of December 31, 2017
BBB 1.0%
BB 42.8%
B 41.5%
CCC,CC,C 9.8%
Not Rated 1.7%
Equities 0.4%
Short-Term Investments and Net Other Assets 2.8%
We have used ratings from Moody’s Investors Service, Inc. Where Moody’s® ratings are not available, we have used S&P® ratings. All ratings are as of the date indicated and do not reflect subsequent changes.
Asset Allocation (% of fund’s net assets)
As of December 31, 2017*
Nonconvertible Bonds 83.9%
Convertible Bonds, Preferred Stocks 0.5%
Common Stocks 0.2%
Bank Loan Obligations 9.4%
Other Investments 3.2%
Short-Term Investments and Net Other Assets (Liabilities) 2.8%
* Foreign investments – 23.3%
6Annual Report
See accompanying notes which are an integral part of the financial statements.
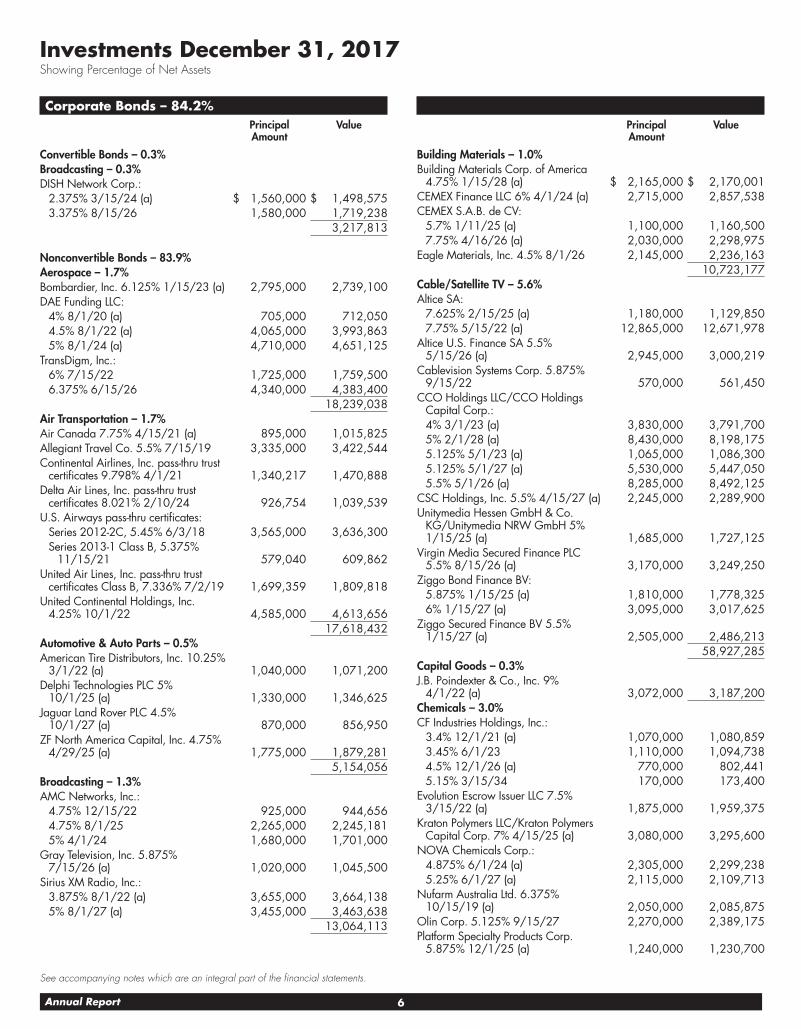
Corporate Bonds – 84.2%Principal Amount
Value
Convertible Bonds – 0.3%Broadcasting – 0.3%DISH Network Corp.:
2.375% 3/15/24 (a) $ 1,560,000 $ 1,498,5753.375% 8/15/26 1,580,000 1,719,238
3,217,813
Nonconvertible Bonds – 83.9%Aerospace – 1.7%Bombardier, Inc. 6.125% 1/15/23 (a) 2,795,000 2,739,100DAE Funding LLC:
4% 8/1/20 (a) 705,000 712,0504.5% 8/1/22 (a) 4,065,000 3,993,8635% 8/1/24 (a) 4,710,000 4,651,125
TransDigm, Inc.:6% 7/15/22 1,725,000 1,759,5006.375% 6/15/26 4,340,000 4,383,400
18,239,038Air Transportation – 1.7%Air Canada 7.75% 4/15/21 (a) 895,000 1,015,825Allegiant Travel Co. 5.5% 7/15/19 3,335,000 3,422,544Continental Airlines, Inc. pass-thru trust
certificates 9.798% 4/1/21 1,340,217 1,470,888Delta Air Lines, Inc. pass-thru trust
certificates 8.021% 2/10/24 926,754 1,039,539U.S. Airways pass-thru certificates:
Series 2012-2C, 5.45% 6/3/18 3,565,000 3,636,300Series 2013-1 Class B, 5.375%
11/15/21 579,040 609,862United Air Lines, Inc. pass-thru trust
certificates Class B, 7.336% 7/2/19 1,699,359 1,809,818United Continental Holdings, Inc.
4.25% 10/1/22 4,585,000 4,613,65617,618,432
Automotive & Auto Parts – 0.5%American Tire Distributors, Inc. 10.25%
3/1/22 (a) 1,040,000 1,071,200Delphi Technologies PLC 5%
10/1/25 (a) 1,330,000 1,346,625Jaguar Land Rover PLC 4.5%
10/1/27 (a) 870,000 856,950ZF North America Capital, Inc. 4.75%
4/29/25 (a) 1,775,000 1,879,2815,154,056
Broadcasting – 1.3%AMC Networks, Inc.:
4.75% 12/15/22 925,000 944,6564.75% 8/1/25 2,265,000 2,245,1815% 4/1/24 1,680,000 1,701,000
Gray Television, Inc. 5.875% 7/15/26 (a) 1,020,000 1,045,500
Sirius XM Radio, Inc.:3.875% 8/1/22 (a) 3,655,000 3,664,1385% 8/1/27 (a) 3,455,000 3,463,638
13,064,113
Investments December 31, 2017Showing Percentage of Net Assets
Principal Amount
Value
Building Materials – 1.0%Building Materials Corp. of America
4.75% 1/15/28 (a) $ 2,165,000 $ 2,170,001CEMEX Finance LLC 6% 4/1/24 (a) 2,715,000 2,857,538CEMEX S.A.B. de CV:
5.7% 1/11/25 (a) 1,100,000 1,160,5007.75% 4/16/26 (a) 2,030,000 2,298,975
Eagle Materials, Inc. 4.5% 8/1/26 2,145,000 2,236,16310,723,177
Cable/Satellite TV – 5.6%Altice SA:
7.625% 2/15/25 (a) 1,180,000 1,129,8507.75% 5/15/22 (a) 12,865,000 12,671,978
Altice U.S. Finance SA 5.5% 5/15/26 (a) 2,945,000 3,000,219
Cablevision Systems Corp. 5.875% 9/15/22 570,000 561,450
CCO Holdings LLC/CCO Holdings Capital Corp.:4% 3/1/23 (a) 3,830,000 3,791,7005% 2/1/28 (a) 8,430,000 8,198,1755.125% 5/1/23 (a) 1,065,000 1,086,3005.125% 5/1/27 (a) 5,530,000 5,447,0505.5% 5/1/26 (a) 8,285,000 8,492,125
CSC Holdings, Inc. 5.5% 4/15/27 (a) 2,245,000 2,289,900Unitymedia Hessen GmbH & Co.
KG/Unitymedia NRW GmbH 5% 1/15/25 (a) 1,685,000 1,727,125
Virgin Media Secured Finance PLC 5.5% 8/15/26 (a) 3,170,000 3,249,250
Ziggo Bond Finance BV:5.875% 1/15/25 (a) 1,810,000 1,778,3256% 1/15/27 (a) 3,095,000 3,017,625
Ziggo Secured Finance BV 5.5% 1/15/27 (a) 2,505,000 2,486,213
58,927,285Capital Goods – 0.3%J.B. Poindexter & Co., Inc. 9%
4/1/22 (a) 3,072,000 3,187,200Chemicals – 3.0%CF Industries Holdings, Inc.:
3.4% 12/1/21 (a) 1,070,000 1,080,8593.45% 6/1/23 1,110,000 1,094,7384.5% 12/1/26 (a) 770,000 802,4415.15% 3/15/34 170,000 173,400
Evolution Escrow Issuer LLC 7.5% 3/15/22 (a) 1,875,000 1,959,375
Kraton Polymers LLC/Kraton Polymers Capital Corp. 7% 4/15/25 (a) 3,080,000 3,295,600
NOVA Chemicals Corp.:4.875% 6/1/24 (a) 2,305,000 2,299,2385.25% 6/1/27 (a) 2,115,000 2,109,713
Nufarm Australia Ltd. 6.375% 10/15/19 (a) 2,050,000 2,085,875
Olin Corp. 5.125% 9/15/27 2,270,000 2,389,175Platform Specialty Products Corp.
5.875% 12/1/25 (a) 1,240,000 1,230,700
7 Annual Report
See accompanying notes which are an integral part of the financial statements.
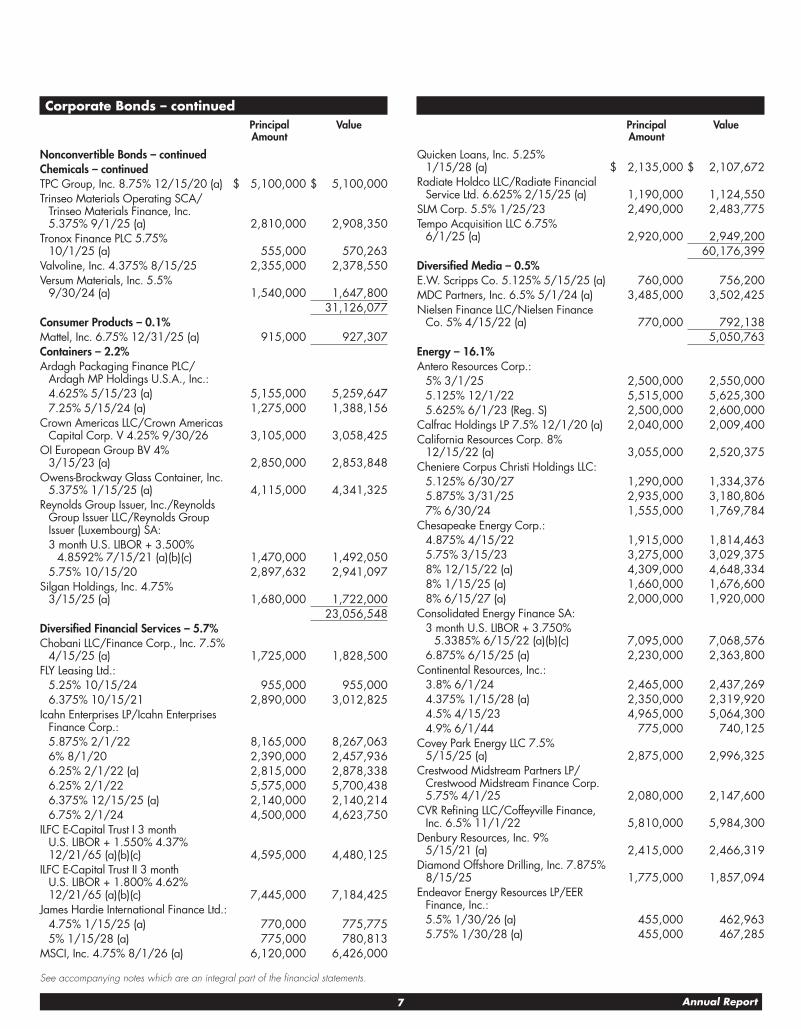
Corporate Bonds – continuedPrincipal Amount
Value
Nonconvertible Bonds – continuedChemicals – continuedTPC Group, Inc. 8.75% 12/15/20 (a) $ 5,100,000 $ 5,100,000Trinseo Materials Operating SCA/
Trinseo Materials Finance, Inc. 5.375% 9/1/25 (a) 2,810,000 2,908,350
Tronox Finance PLC 5.75% 10/1/25 (a) 555,000 570,263
Valvoline, Inc. 4.375% 8/15/25 2,355,000 2,378,550Versum Materials, Inc. 5.5%
9/30/24 (a) 1,540,000 1,647,80031,126,077
Consumer Products – 0.1%Mattel, Inc. 6.75% 12/31/25 (a) 915,000 927,307Containers – 2.2%Ardagh Packaging Finance PLC/
Ardagh MP Holdings U.S.A., Inc.:4.625% 5/15/23 (a) 5,155,000 5,259,6477.25% 5/15/24 (a) 1,275,000 1,388,156
Crown Americas LLC/Crown Americas Capital Corp. V 4.25% 9/30/26 3,105,000 3,058,425
OI European Group BV 4% 3/15/23 (a) 2,850,000 2,853,848
Owens-Brockway Glass Container, Inc. 5.375% 1/15/25 (a) 4,115,000 4,341,325
Reynolds Group Issuer, Inc./Reynolds Group Issuer LLC/Reynolds Group Issuer (Luxembourg) SA:3 month U.S. LIBOR + 3.500%
4.8592% 7/15/21 (a) (b) (c) 1,470,000 1,492,0505.75% 10/15/20 2,897,632 2,941,097
Silgan Holdings, Inc. 4.75% 3/15/25 (a) 1,680,000 1,722,000
23,056,548Diversified Financial Services – 5.7%Chobani LLC/Finance Corp., Inc. 7.5%
4/15/25 (a) 1,725,000 1,828,500FLY Leasing Ltd.:
5.25% 10/15/24 955,000 955,0006.375% 10/15/21 2,890,000 3,012,825
Icahn Enterprises LP/Icahn Enterprises Finance Corp.:5.875% 2/1/22 8,165,000 8,267,0636% 8/1/20 2,390,000 2,457,9366.25% 2/1/22 (a) 2,815,000 2,878,3386.25% 2/1/22 5,575,000 5,700,4386.375% 12/15/25 (a) 2,140,000 2,140,2146.75% 2/1/24 4,500,000 4,623,750
ILFC E-Capital Trust I 3 month U.S. LIBOR + 1.550% 4.37% 12/21/65 (a) (b) (c) 4,595,000 4,480,125
ILFC E-Capital Trust II 3 month U.S. LIBOR + 1.800% 4.62% 12/21/65 (a) (b) (c) 7,445,000 7,184,425
James Hardie International Finance Ltd.:4.75% 1/15/25 (a) 770,000 775,7755% 1/15/28 (a) 775,000 780,813
MSCI, Inc. 4.75% 8/1/26 (a) 6,120,000 6,426,000
Principal Amount
Value
Quicken Loans, Inc. 5.25% 1/15/28 (a) $ 2,135,000 $ 2,107,672
Radiate Holdco LLC/Radiate Financial Service Ltd. 6.625% 2/15/25 (a) 1,190,000 1,124,550
SLM Corp. 5.5% 1/25/23 2,490,000 2,483,775Tempo Acquisition LLC 6.75%
6/1/25 (a) 2,920,000 2,949,20060,176,399
Diversified Media – 0.5%E.W. Scripps Co. 5.125% 5/15/25 (a) 760,000 756,200MDC Partners, Inc. 6.5% 5/1/24 (a) 3,485,000 3,502,425Nielsen Finance LLC/Nielsen Finance
Co. 5% 4/15/22 (a) 770,000 792,1385,050,763
Energy – 16.1%Antero Resources Corp.:
5% 3/1/25 2,500,000 2,550,0005.125% 12/1/22 5,515,000 5,625,3005.625% 6/1/23 (Reg. S) 2,500,000 2,600,000
Calfrac Holdings LP 7.5% 12/1/20 (a) 2,040,000 2,009,400California Resources Corp. 8%
12/15/22 (a) 3,055,000 2,520,375Cheniere Corpus Christi Holdings LLC:
5.125% 6/30/27 1,290,000 1,334,3765.875% 3/31/25 2,935,000 3,180,8067% 6/30/24 1,555,000 1,769,784
Chesapeake Energy Corp.:4.875% 4/15/22 1,915,000 1,814,4635.75% 3/15/23 3,275,000 3,029,3758% 12/15/22 (a) 4,309,000 4,648,3348% 1/15/25 (a) 1,660,000 1,676,6008% 6/15/27 (a) 2,000,000 1,920,000
Consolidated Energy Finance SA:3 month U.S. LIBOR + 3.750%
5.3385% 6/15/22 (a) (b) (c) 7,095,000 7,068,5766.875% 6/15/25 (a) 2,230,000 2,363,800
Continental Resources, Inc.:3.8% 6/1/24 2,465,000 2,437,2694.375% 1/15/28 (a) 2,350,000 2,319,9204.5% 4/15/23 4,965,000 5,064,3004.9% 6/1/44 775,000 740,125
Covey Park Energy LLC 7.5% 5/15/25 (a) 2,875,000 2,996,325
Crestwood Midstream Partners LP/Crestwood Midstream Finance Corp. 5.75% 4/1/25 2,080,000 2,147,600
CVR Refining LLC/Coffeyville Finance, Inc. 6.5% 11/1/22 5,810,000 5,984,300
Denbury Resources, Inc. 9% 5/15/21 (a) 2,415,000 2,466,319
Diamond Offshore Drilling, Inc. 7.875% 8/15/25 1,775,000 1,857,094
Endeavor Energy Resources LP/EER Finance, Inc.:5.5% 1/30/26 (a) 455,000 462,9635.75% 1/30/28 (a) 455,000 467,285
8Annual Report
See accompanying notes which are an integral part of the financial statements.
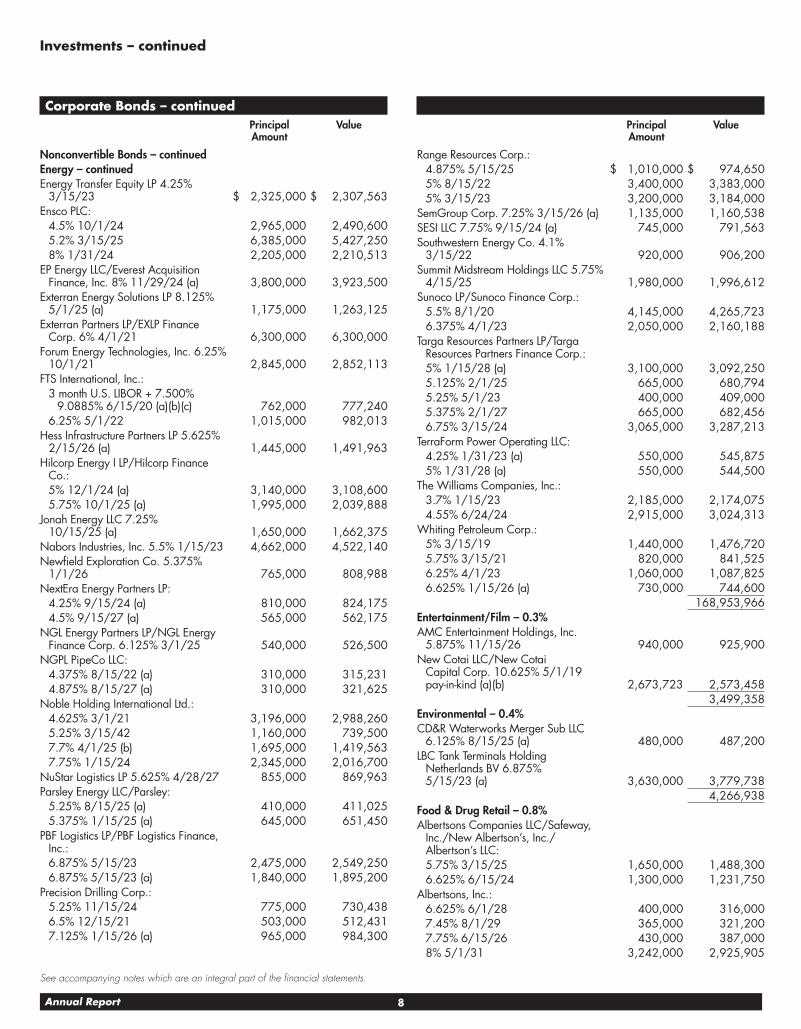
Investments – continued
Corporate Bonds – continuedPrincipal Amount
Value
Nonconvertible Bonds – continuedEnergy – continuedEnergy Transfer Equity LP 4.25%
3/15/23 $ 2,325,000 $ 2,307,563Ensco PLC:
4.5% 10/1/24 2,965,000 2,490,6005.2% 3/15/25 6,385,000 5,427,2508% 1/31/24 2,205,000 2,210,513
EP Energy LLC/Everest Acquisition Finance, Inc. 8% 11/29/24 (a) 3,800,000 3,923,500
Exterran Energy Solutions LP 8.125% 5/1/25 (a) 1,175,000 1,263,125
Exterran Partners LP/EXLP Finance Corp. 6% 4/1/21 6,300,000 6,300,000
Forum Energy Technologies, Inc. 6.25% 10/1/21 2,845,000 2,852,113
FTS International, Inc.:3 month U.S. LIBOR + 7.500%
9.0885% 6/15/20 (a) (b) (c) 762,000 777,2406.25% 5/1/22 1,015,000 982,013
Hess Infrastructure Partners LP 5.625% 2/15/26 (a) 1,445,000 1,491,963
Hilcorp Energy I LP/Hilcorp Finance Co.:5% 12/1/24 (a) 3,140,000 3,108,6005.75% 10/1/25 (a) 1,995,000 2,039,888
Jonah Energy LLC 7.25% 10/15/25 (a) 1,650,000 1,662,375
Nabors Industries, Inc. 5.5% 1/15/23 4,662,000 4,522,140Newfield Exploration Co. 5.375%
1/1/26 765,000 808,988NextEra Energy Partners LP:
4.25% 9/15/24 (a) 810,000 824,1754.5% 9/15/27 (a) 565,000 562,175
NGL Energy Partners LP/NGL Energy Finance Corp. 6.125% 3/1/25 540,000 526,500
NGPL PipeCo LLC:4.375% 8/15/22 (a) 310,000 315,2314.875% 8/15/27 (a) 310,000 321,625
Noble Holding International Ltd.:4.625% 3/1/21 3,196,000 2,988,2605.25% 3/15/42 1,160,000 739,5007.7% 4/1/25 (b) 1,695,000 1,419,5637.75% 1/15/24 2,345,000 2,016,700
NuStar Logistics LP 5.625% 4/28/27 855,000 869,963Parsley Energy LLC/Parsley:
5.25% 8/15/25 (a) 410,000 411,0255.375% 1/15/25 (a) 645,000 651,450
PBF Logistics LP/PBF Logistics Finance, Inc.:6.875% 5/15/23 2,475,000 2,549,2506.875% 5/15/23 (a) 1,840,000 1,895,200
Precision Drilling Corp.:5.25% 11/15/24 775,000 730,4386.5% 12/15/21 503,000 512,4317.125% 1/15/26 (a) 965,000 984,300
Principal Amount
Value
Range Resources Corp.:4.875% 5/15/25 $ 1,010,000 $ 974,6505% 8/15/22 3,400,000 3,383,0005% 3/15/23 3,200,000 3,184,000
SemGroup Corp. 7.25% 3/15/26 (a) 1,135,000 1,160,538SESI LLC 7.75% 9/15/24 (a) 745,000 791,563Southwestern Energy Co. 4.1%
3/15/22 920,000 906,200Summit Midstream Holdings LLC 5.75%
4/15/25 1,980,000 1,996,612Sunoco LP/Sunoco Finance Corp.:
5.5% 8/1/20 4,145,000 4,265,7236.375% 4/1/23 2,050,000 2,160,188
Targa Resources Partners LP/Targa Resources Partners Finance Corp.:5% 1/15/28 (a) 3,100,000 3,092,2505.125% 2/1/25 665,000 680,7945.25% 5/1/23 400,000 409,0005.375% 2/1/27 665,000 682,4566.75% 3/15/24 3,065,000 3,287,213
TerraForm Power Operating LLC:4.25% 1/31/23 (a) 550,000 545,8755% 1/31/28 (a) 550,000 544,500
The Williams Companies, Inc.:3.7% 1/15/23 2,185,000 2,174,0754.55% 6/24/24 2,915,000 3,024,313
Whiting Petroleum Corp.:5% 3/15/19 1,440,000 1,476,7205.75% 3/15/21 820,000 841,5256.25% 4/1/23 1,060,000 1,087,8256.625% 1/15/26 (a) 730,000 744,600
168,953,966Entertainment/Film – 0.3%AMC Entertainment Holdings, Inc.
5.875% 11/15/26 940,000 925,900New Cotai LLC/New Cotai
Capital Corp. 10.625% 5/1/19 pay-in-kind (a) (b) 2,673,723 2,573,458
3,499,358Environmental – 0.4%CD&R Waterworks Merger Sub LLC
6.125% 8/15/25 (a) 480,000 487,200LBC Tank Terminals Holding
Netherlands BV 6.875% 5/15/23 (a) 3,630,000 3,779,738
4,266,938Food & Drug Retail – 0.8%Albertsons Companies LLC/Safeway,
Inc./New Albertson’s, Inc./Albertson’s LLC:5.75% 3/15/25 1,650,000 1,488,3006.625% 6/15/24 1,300,000 1,231,750
Albertsons, Inc.:6.625% 6/1/28 400,000 316,0007.45% 8/1/29 365,000 321,2007.75% 6/15/26 430,000 387,0008% 5/1/31 3,242,000 2,925,905
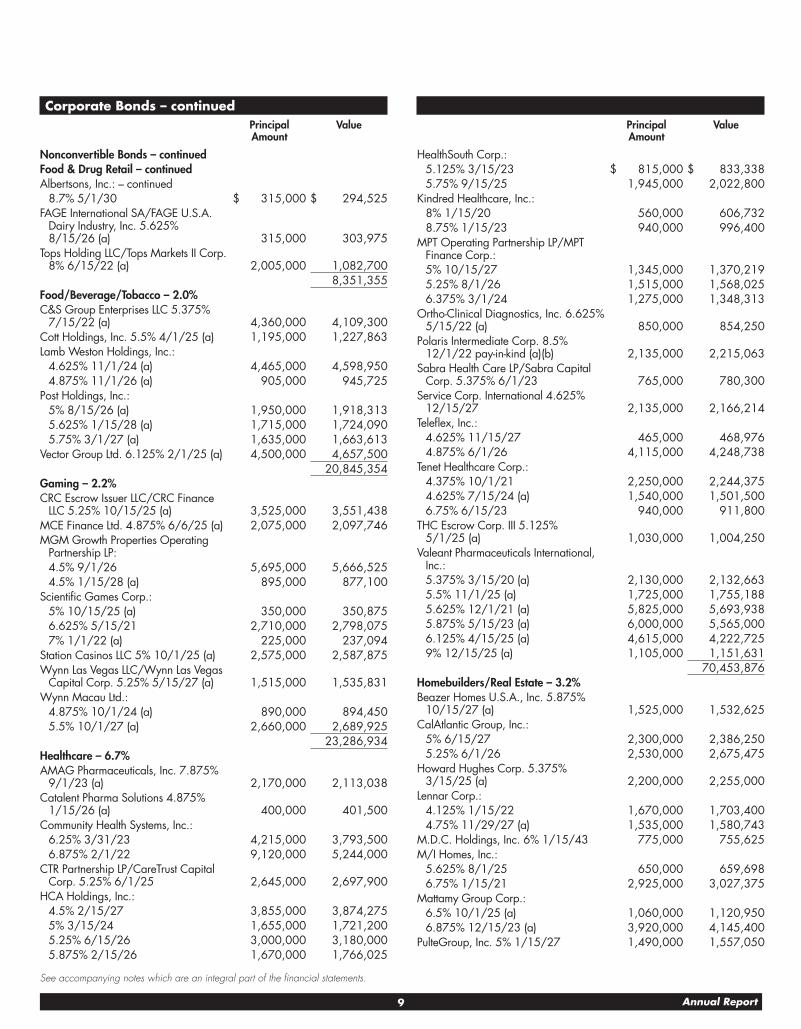
9 Annual Report
See accompanying notes which are an integral part of the financial statements.
Corporate Bonds – continuedPrincipal Amount
Value
Nonconvertible Bonds – continuedFood & Drug Retail – continuedAlbertsons, Inc.: – continued
8.7% 5/1/30 $ 315,000 $ 294,525FAGE International SA/FAGE U.S.A.
Dairy Industry, Inc. 5.625% 8/15/26 (a) 315,000 303,975
Tops Holding LLC/Tops Markets II Corp. 8% 6/15/22 (a) 2,005,000 1,082,700
8,351,355Food/Beverage/Tobacco – 2.0%C&S Group Enterprises LLC 5.375%
7/15/22 (a) 4,360,000 4,109,300Cott Holdings, Inc. 5.5% 4/1/25 (a) 1,195,000 1,227,863Lamb Weston Holdings, Inc.:
4.625% 11/1/24 (a) 4,465,000 4,598,9504.875% 11/1/26 (a) 905,000 945,725
Post Holdings, Inc.:5% 8/15/26 (a) 1,950,000 1,918,3135.625% 1/15/28 (a) 1,715,000 1,724,0905.75% 3/1/27 (a) 1,635,000 1,663,613
Vector Group Ltd. 6.125% 2/1/25 (a) 4,500,000 4,657,50020,845,354
Gaming – 2.2%CRC Escrow Issuer LLC/CRC Finance
LLC 5.25% 10/15/25 (a) 3,525,000 3,551,438MCE Finance Ltd. 4.875% 6/6/25 (a) 2,075,000 2,097,746MGM Growth Properties Operating
Partnership LP:4.5% 9/1/26 5,695,000 5,666,5254.5% 1/15/28 (a) 895,000 877,100
Scientific Games Corp.:5% 10/15/25 (a) 350,000 350,8756.625% 5/15/21 2,710,000 2,798,0757% 1/1/22 (a) 225,000 237,094
Station Casinos LLC 5% 10/1/25 (a) 2,575,000 2,587,875Wynn Las Vegas LLC/Wynn Las Vegas
Capital Corp. 5.25% 5/15/27 (a) 1,515,000 1,535,831Wynn Macau Ltd.:
4.875% 10/1/24 (a) 890,000 894,4505.5% 10/1/27 (a) 2,660,000 2,689,925
23,286,934Healthcare – 6.7%AMAG Pharmaceuticals, Inc. 7.875%
9/1/23 (a) 2,170,000 2,113,038Catalent Pharma Solutions 4.875%
1/15/26 (a) 400,000 401,500Community Health Systems, Inc.:
6.25% 3/31/23 4,215,000 3,793,5006.875% 2/1/22 9,120,000 5,244,000
CTR Partnership LP/CareTrust Capital Corp. 5.25% 6/1/25 2,645,000 2,697,900
HCA Holdings, Inc.:4.5% 2/15/27 3,855,000 3,874,2755% 3/15/24 1,655,000 1,721,2005.25% 6/15/26 3,000,000 3,180,0005.875% 2/15/26 1,670,000 1,766,025
Principal Amount
Value
HealthSouth Corp.:5.125% 3/15/23 $ 815,000 $ 833,3385.75% 9/15/25 1,945,000 2,022,800
Kindred Healthcare, Inc.:8% 1/15/20 560,000 606,7328.75% 1/15/23 940,000 996,400
MPT Operating Partnership LP/MPT Finance Corp.:5% 10/15/27 1,345,000 1,370,2195.25% 8/1/26 1,515,000 1,568,0256.375% 3/1/24 1,275,000 1,348,313
Ortho-Clinical Diagnostics, Inc. 6.625% 5/15/22 (a) 850,000 854,250
Polaris Intermediate Corp. 8.5% 12/1/22 pay-in-kind (a) (b) 2,135,000 2,215,063
Sabra Health Care LP/Sabra Capital Corp. 5.375% 6/1/23 765,000 780,300
Service Corp. International 4.625% 12/15/27 2,135,000 2,166,214
Teleflex, Inc.:4.625% 11/15/27 465,000 468,9764.875% 6/1/26 4,115,000 4,248,738
Tenet Healthcare Corp.:4.375% 10/1/21 2,250,000 2,244,3754.625% 7/15/24 (a) 1,540,000 1,501,5006.75% 6/15/23 940,000 911,800
THC Escrow Corp. III 5.125% 5/1/25 (a) 1,030,000 1,004,250
Valeant Pharmaceuticals International, Inc.:5.375% 3/15/20 (a) 2,130,000 2,132,6635.5% 11/1/25 (a) 1,725,000 1,755,1885.625% 12/1/21 (a) 5,825,000 5,693,9385.875% 5/15/23 (a) 6,000,000 5,565,0006.125% 4/15/25 (a) 4,615,000 4,222,7259% 12/15/25 (a) 1,105,000 1,151,631
70,453,876Homebuilders/Real Estate – 3.2%Beazer Homes U.S.A., Inc. 5.875%
10/15/27 (a) 1,525,000 1,532,625CalAtlantic Group, Inc.:
5% 6/15/27 2,300,000 2,386,2505.25% 6/1/26 2,530,000 2,675,475
Howard Hughes Corp. 5.375% 3/15/25 (a) 2,200,000 2,255,000
Lennar Corp.:4.125% 1/15/22 1,670,000 1,703,4004.75% 11/29/27 (a) 1,535,000 1,580,743
M.D.C. Holdings, Inc. 6% 1/15/43 775,000 755,625M/I Homes, Inc.:
5.625% 8/1/25 650,000 659,6986.75% 1/15/21 2,925,000 3,027,375
Mattamy Group Corp.:6.5% 10/1/25 (a) 1,060,000 1,120,9506.875% 12/15/23 (a) 3,920,000 4,145,400
PulteGroup, Inc. 5% 1/15/27 1,490,000 1,557,050
10Annual Report
See accompanying notes which are an integral part of the financial statements.
Investments – continued
Corporate Bonds – continuedPrincipal Amount
Value
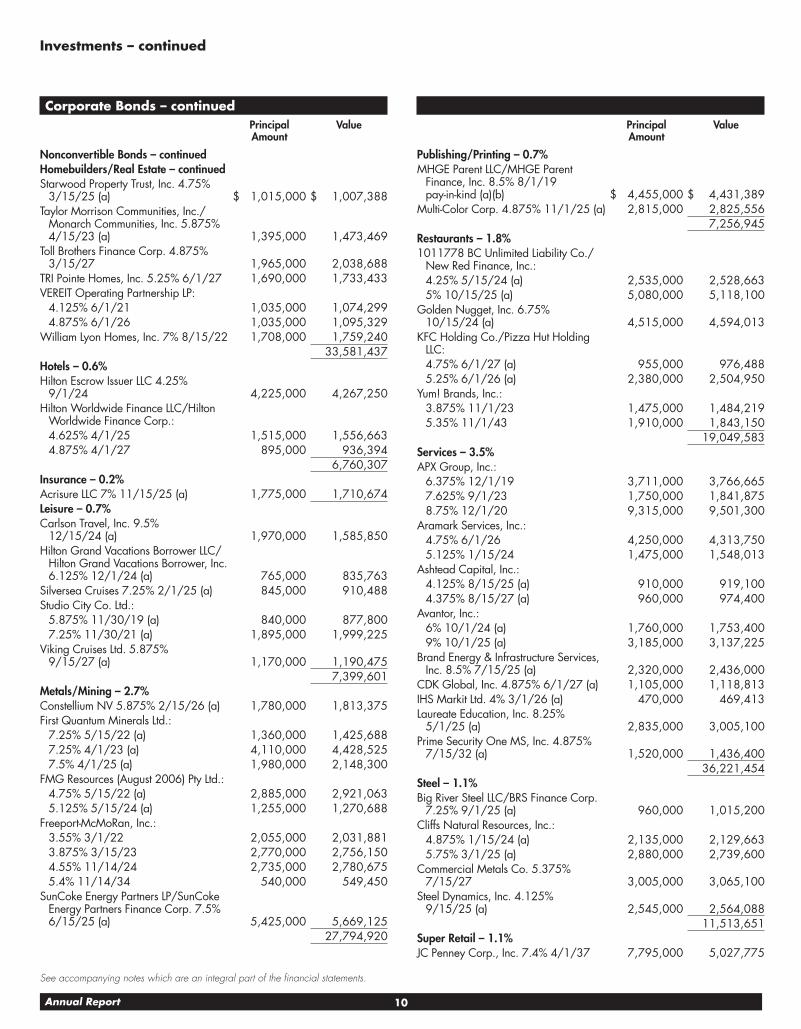
Nonconvertible Bonds – continuedHomebuilders/Real Estate – continuedStarwood Property Trust, Inc. 4.75%
3/15/25 (a) $ 1,015,000 $ 1,007,388Taylor Morrison Communities, Inc./
Monarch Communities, Inc. 5.875% 4/15/23 (a) 1,395,000 1,473,469
Toll Brothers Finance Corp. 4.875% 3/15/27 1,965,000 2,038,688
TRI Pointe Homes, Inc. 5.25% 6/1/27 1,690,000 1,733,433VEREIT Operating Partnership LP:
4.125% 6/1/21 1,035,000 1,074,2994.875% 6/1/26 1,035,000 1,095,329
William Lyon Homes, Inc. 7% 8/15/22 1,708,000 1,759,24033,581,437
Hotels – 0.6%Hilton Escrow Issuer LLC 4.25%
9/1/24 4,225,000 4,267,250Hilton Worldwide Finance LLC/Hilton
Worldwide Finance Corp.:4.625% 4/1/25 1,515,000 1,556,6634.875% 4/1/27 895,000 936,394
6,760,307Insurance – 0.2%Acrisure LLC 7% 11/15/25 (a) 1,775,000 1,710,674Leisure – 0.7%Carlson Travel, Inc. 9.5%
12/15/24 (a) 1,970,000 1,585,850Hilton Grand Vacations Borrower LLC/
Hilton Grand Vacations Borrower, Inc. 6.125% 12/1/24 (a) 765,000 835,763
Silversea Cruises 7.25% 2/1/25 (a) 845,000 910,488Studio City Co. Ltd.:
5.875% 11/30/19 (a) 840,000 877,8007.25% 11/30/21 (a) 1,895,000 1,999,225
Viking Cruises Ltd. 5.875% 9/15/27 (a) 1,170,000 1,190,475
7,399,601Metals/Mining – 2.7%Constellium NV 5.875% 2/15/26 (a) 1,780,000 1,813,375First Quantum Minerals Ltd.:
7.25% 5/15/22 (a) 1,360,000 1,425,6887.25% 4/1/23 (a) 4,110,000 4,428,5257.5% 4/1/25 (a) 1,980,000 2,148,300
FMG Resources (August 2006) Pty Ltd.:4.75% 5/15/22 (a) 2,885,000 2,921,0635.125% 5/15/24 (a) 1,255,000 1,270,688
Freeport-McMoRan, Inc.:3.55% 3/1/22 2,055,000 2,031,8813.875% 3/15/23 2,770,000 2,756,1504.55% 11/14/24 2,735,000 2,780,6755.4% 11/14/34 540,000 549,450
SunCoke Energy Partners LP/SunCoke Energy Partners Finance Corp. 7.5% 6/15/25 (a) 5,425,000 5,669,125
27,794,920
Principal Amount
Value
Publishing/Printing – 0.7%MHGE Parent LLC/MHGE Parent
Finance, Inc. 8.5% 8/1/19 pay-in-kind (a) (b) $ 4,455,000 $ 4,431,389
Multi-Color Corp. 4.875% 11/1/25 (a) 2,815,000 2,825,5567,256,945
Restaurants – 1.8%1011778 BC Unlimited Liability Co./
New Red Finance, Inc.:4.25% 5/15/24 (a) 2,535,000 2,528,6635% 10/15/25 (a) 5,080,000 5,118,100
Golden Nugget, Inc. 6.75% 10/15/24 (a) 4,515,000 4,594,013
KFC Holding Co./Pizza Hut Holding LLC:4.75% 6/1/27 (a) 955,000 976,4885.25% 6/1/26 (a) 2,380,000 2,504,950
Yum! Brands, Inc.:3.875% 11/1/23 1,475,000 1,484,2195.35% 11/1/43 1,910,000 1,843,150
19,049,583Services – 3.5%APX Group, Inc.:
6.375% 12/1/19 3,711,000 3,766,6657.625% 9/1/23 1,750,000 1,841,8758.75% 12/1/20 9,315,000 9,501,300
Aramark Services, Inc.:4.75% 6/1/26 4,250,000 4,313,7505.125% 1/15/24 1,475,000 1,548,013
Ashtead Capital, Inc.:4.125% 8/15/25 (a) 910,000 919,1004.375% 8/15/27 (a) 960,000 974,400
Avantor, Inc.:6% 10/1/24 (a) 1,760,000 1,753,4009% 10/1/25 (a) 3,185,000 3,137,225
Brand Energy & Infrastructure Services, Inc. 8.5% 7/15/25 (a) 2,320,000 2,436,000
CDK Global, Inc. 4.875% 6/1/27 (a) 1,105,000 1,118,813IHS Markit Ltd. 4% 3/1/26 (a) 470,000 469,413Laureate Education, Inc. 8.25%
5/1/25 (a) 2,835,000 3,005,100Prime Security One MS, Inc. 4.875%
7/15/32 (a) 1,520,000 1,436,40036,221,454
Steel – 1.1%Big River Steel LLC/BRS Finance Corp.
7.25% 9/1/25 (a) 960,000 1,015,200Cliffs Natural Resources, Inc.:
4.875% 1/15/24 (a) 2,135,000 2,129,6635.75% 3/1/25 (a) 2,880,000 2,739,600
Commercial Metals Co. 5.375% 7/15/27 3,005,000 3,065,100
Steel Dynamics, Inc. 4.125% 9/15/25 (a) 2,545,000 2,564,088
11,513,651Super Retail – 1.1%JC Penney Corp., Inc. 7.4% 4/1/37 7,795,000 5,027,775
11 Annual Report
See accompanying notes which are an integral part of the financial statements.
Corporate Bonds – continuedPrincipal Amount
Value
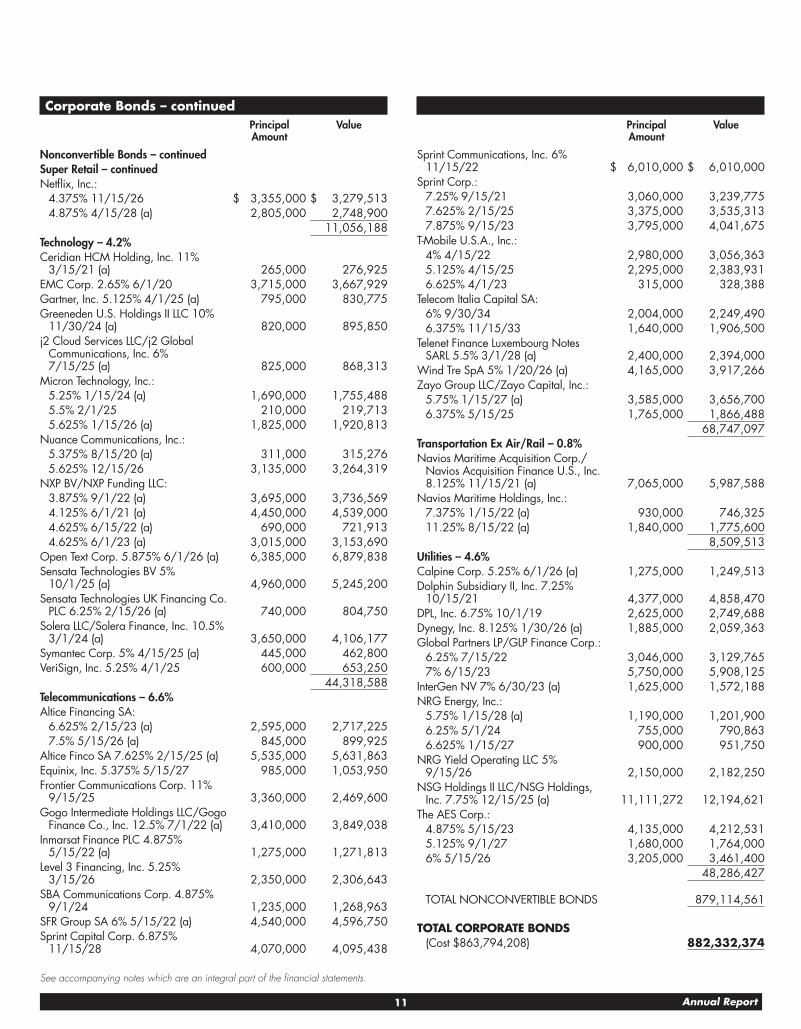
Nonconvertible Bonds – continuedSuper Retail – continuedNetflix, Inc.:
4.375% 11/15/26 $ 3,355,000 $ 3,279,5134.875% 4/15/28 (a) 2,805,000 2,748,900
11,056,188Technology – 4.2%Ceridian HCM Holding, Inc. 11%
3/15/21 (a) 265,000 276,925EMC Corp. 2.65% 6/1/20 3,715,000 3,667,929Gartner, Inc. 5.125% 4/1/25 (a) 795,000 830,775Greeneden U.S. Holdings II LLC 10%
11/30/24 (a) 820,000 895,850j2 Cloud Services LLC/j2 Global
Communications, Inc. 6% 7/15/25 (a) 825,000 868,313
Micron Technology, Inc.:5.25% 1/15/24 (a) 1,690,000 1,755,4885.5% 2/1/25 210,000 219,7135.625% 1/15/26 (a) 1,825,000 1,920,813
Nuance Communications, Inc.:5.375% 8/15/20 (a) 311,000 315,2765.625% 12/15/26 3,135,000 3,264,319
NXP BV/NXP Funding LLC:3.875% 9/1/22 (a) 3,695,000 3,736,5694.125% 6/1/21 (a) 4,450,000 4,539,0004.625% 6/15/22 (a) 690,000 721,9134.625% 6/1/23 (a) 3,015,000 3,153,690
Open Text Corp. 5.875% 6/1/26 (a) 6,385,000 6,879,838Sensata Technologies BV 5%
10/1/25 (a) 4,960,000 5,245,200Sensata Technologies UK Financing Co.
PLC 6.25% 2/15/26 (a) 740,000 804,750Solera LLC/Solera Finance, Inc. 10.5%
3/1/24 (a) 3,650,000 4,106,177Symantec Corp. 5% 4/15/25 (a) 445,000 462,800VeriSign, Inc. 5.25% 4/1/25 600,000 653,250
44,318,588Telecommunications – 6.6%Altice Financing SA:
6.625% 2/15/23 (a) 2,595,000 2,717,2257.5% 5/15/26 (a) 845,000 899,925
Altice Finco SA 7.625% 2/15/25 (a) 5,535,000 5,631,863Equinix, Inc. 5.375% 5/15/27 985,000 1,053,950Frontier Communications Corp. 11%
9/15/25 3,360,000 2,469,600Gogo Intermediate Holdings LLC/Gogo
Finance Co., Inc. 12.5% 7/1/22 (a) 3,410,000 3,849,038Inmarsat Finance PLC 4.875%
5/15/22 (a) 1,275,000 1,271,813Level 3 Financing, Inc. 5.25%
3/15/26 2,350,000 2,306,643SBA Communications Corp. 4.875%
9/1/24 1,235,000 1,268,963SFR Group SA 6% 5/15/22 (a) 4,540,000 4,596,750Sprint Capital Corp. 6.875%
11/15/28 4,070,000 4,095,438
Principal Amount
Value
Sprint Communications, Inc. 6% 11/15/22 $ 6,010,000 $ 6,010,000
Sprint Corp.:7.25% 9/15/21 3,060,000 3,239,7757.625% 2/15/25 3,375,000 3,535,3137.875% 9/15/23 3,795,000 4,041,675
T-Mobile U.S.A., Inc.:4% 4/15/22 2,980,000 3,056,3635.125% 4/15/25 2,295,000 2,383,9316.625% 4/1/23 315,000 328,388
Telecom Italia Capital SA:6% 9/30/34 2,004,000 2,249,4906.375% 11/15/33 1,640,000 1,906,500
Telenet Finance Luxembourg Notes SARL 5.5% 3/1/28 (a) 2,400,000 2,394,000
Wind Tre SpA 5% 1/20/26 (a) 4,165,000 3,917,266Zayo Group LLC/Zayo Capital, Inc.:
5.75% 1/15/27 (a) 3,585,000 3,656,7006.375% 5/15/25 1,765,000 1,866,488
68,747,097Transportation Ex Air/Rail – 0.8%Navios Maritime Acquisition Corp./
Navios Acquisition Finance U.S., Inc. 8.125% 11/15/21 (a) 7,065,000 5,987,588
Navios Maritime Holdings, Inc.:7.375% 1/15/22 (a) 930,000 746,32511.25% 8/15/22 (a) 1,840,000 1,775,600
8,509,513Utilities – 4.6%Calpine Corp. 5.25% 6/1/26 (a) 1,275,000 1,249,513Dolphin Subsidiary II, Inc. 7.25%
10/15/21 4,377,000 4,858,470DPL, Inc. 6.75% 10/1/19 2,625,000 2,749,688Dynegy, Inc. 8.125% 1/30/26 (a) 1,885,000 2,059,363Global Partners LP/GLP Finance Corp.:
6.25% 7/15/22 3,046,000 3,129,7657% 6/15/23 5,750,000 5,908,125
InterGen NV 7% 6/30/23 (a) 1,625,000 1,572,188NRG Energy, Inc.:
5.75% 1/15/28 (a) 1,190,000 1,201,9006.25% 5/1/24 755,000 790,8636.625% 1/15/27 900,000 951,750
NRG Yield Operating LLC 5% 9/15/26 2,150,000 2,182,250
NSG Holdings II LLC/NSG Holdings, Inc. 7.75% 12/15/25 (a) 11,111,272 12,194,621
The AES Corp.:4.875% 5/15/23 4,135,000 4,212,5315.125% 9/1/27 1,680,000 1,764,0006% 5/15/26 3,205,000 3,461,400
48,286,427
TOTAL NONCONVERTIBLE BONDS 879,114,561
TOTAL CORPORATE BONDS(Cost $863,794,208) 882,332,374
12Annual Report
See accompanying notes which are an integral part of the financial statements.
Investments – continued
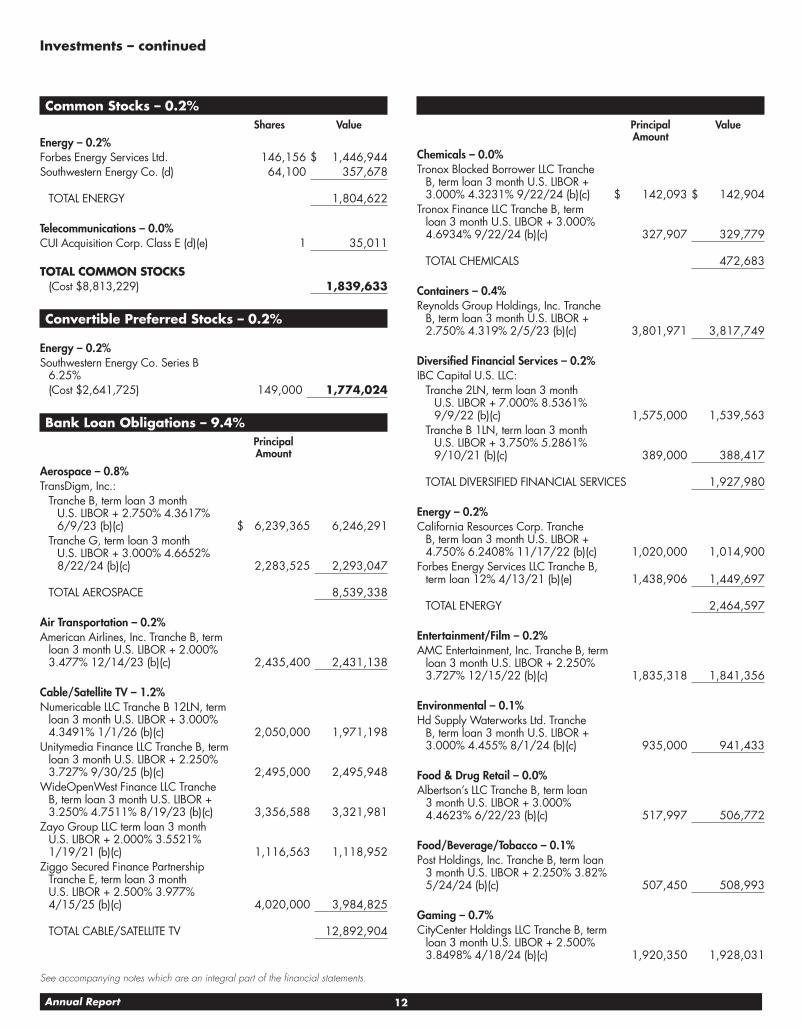
Common Stocks – 0.2%Shares Value
Energy – 0.2%Forbes Energy Services Ltd. 146,156 $ 1,446,944Southwestern Energy Co. (d) 64,100 357,678
TOTAL ENERGY 1,804,622
Telecommunications – 0.0%CUI Acquisition Corp. Class E (d) (e) 1 35,011
TOTAL COMMON STOCKS(Cost $8,813,229) 1,839,633
Convertible Preferred Stocks – 0.2%
Energy – 0.2%Southwestern Energy Co. Series B
6.25%(Cost $2,641,725) 149,000 1,774,024
Bank Loan Obligations – 9.4%Principal Amount
Aerospace – 0.8%TransDigm, Inc.:
Tranche B, term loan 3 month U.S. LIBOR + 2.750% 4.3617% 6/9/23 (b) (c) $ 6,239,365 6,246,291
Tranche G, term loan 3 month U.S. LIBOR + 3.000% 4.6652% 8/22/24 (b) (c) 2,283,525 2,293,047
TOTAL AEROSPACE 8,539,338
Air Transportation – 0.2%American Airlines, Inc. Tranche B, term
loan 3 month U.S. LIBOR + 2.000% 3.477% 12/14/23 (b) (c) 2,435,400 2,431,138
Cable/Satellite TV – 1.2%Numericable LLC Tranche B 12LN, term
loan 3 month U.S. LIBOR + 3.000% 4.3491% 1/1/26 (b) (c) 2,050,000 1,971,198
Unitymedia Finance LLC Tranche B, term loan 3 month U.S. LIBOR + 2.250% 3.727% 9/30/25 (b) (c) 2,495,000 2,495,948
WideOpenWest Finance LLC Tranche B, term loan 3 month U.S. LIBOR + 3.250% 4.7511% 8/19/23 (b) (c) 3,356,588 3,321,981
Zayo Group LLC term loan 3 month U.S. LIBOR + 2.000% 3.5521% 1/19/21 (b) (c) 1,116,563 1,118,952
Ziggo Secured Finance Partnership Tranche E, term loan 3 month U.S. LIBOR + 2.500% 3.977% 4/15/25 (b) (c) 4,020,000 3,984,825
TOTAL CABLE/SATELLITE TV 12,892,904
Principal Amount
Value
Chemicals – 0.0%Tronox Blocked Borrower LLC Tranche
B, term loan 3 month U.S. LIBOR + 3.000% 4.3231% 9/22/24 (b) (c) $ 142,093 $ 142,904
Tronox Finance LLC Tranche B, term loan 3 month U.S. LIBOR + 3.000% 4.6934% 9/22/24 (b) (c) 327,907 329,779
TOTAL CHEMICALS 472,683
Containers – 0.4%Reynolds Group Holdings, Inc. Tranche
B, term loan 3 month U.S. LIBOR + 2.750% 4.319% 2/5/23 (b) (c) 3,801,971 3,817,749
Diversified Financial Services – 0.2%IBC Capital U.S. LLC:
Tranche 2LN, term loan 3 month U.S. LIBOR + 7.000% 8.5361% 9/9/22 (b) (c) 1,575,000 1,539,563
Tranche B 1LN, term loan 3 month U.S. LIBOR + 3.750% 5.2861% 9/10/21 (b) (c) 389,000 388,417
TOTAL DIVERSIFIED FINANCIAL SERVICES 1,927,980
Energy – 0.2%California Resources Corp. Tranche
B, term loan 3 month U.S. LIBOR + 4.750% 6.2408% 11/17/22 (b) (c) 1,020,000 1,014,900
Forbes Energy Services LLC Tranche B, term loan 12% 4/13/21 (b) (e) 1,438,906 1,449,697
TOTAL ENERGY 2,464,597
Entertainment/Film – 0.2%AMC Entertainment, Inc. Tranche B, term
loan 3 month U.S. LIBOR + 2.250% 3.727% 12/15/22 (b) (c) 1,835,318 1,841,356
Environmental – 0.1%Hd Supply Waterworks Ltd. Tranche
B, term loan 3 month U.S. LIBOR + 3.000% 4.455% 8/1/24 (b) (c) 935,000 941,433
Food & Drug Retail – 0.0%Albertson’s LLC Tranche B, term loan
3 month U.S. LIBOR + 3.000% 4.4623% 6/22/23 (b) (c) 517,997 506,772
Food/Beverage/Tobacco – 0.1%Post Holdings, Inc. Tranche B, term loan
3 month U.S. LIBOR + 2.250% 3.82% 5/24/24 (b) (c) 507,450 508,993
Gaming – 0.7%CityCenter Holdings LLC Tranche B, term
loan 3 month U.S. LIBOR + 2.500% 3.8498% 4/18/24 (b) (c) 1,920,350 1,928,031
13 Annual Report
See accompanying notes which are an integral part of the financial statements.
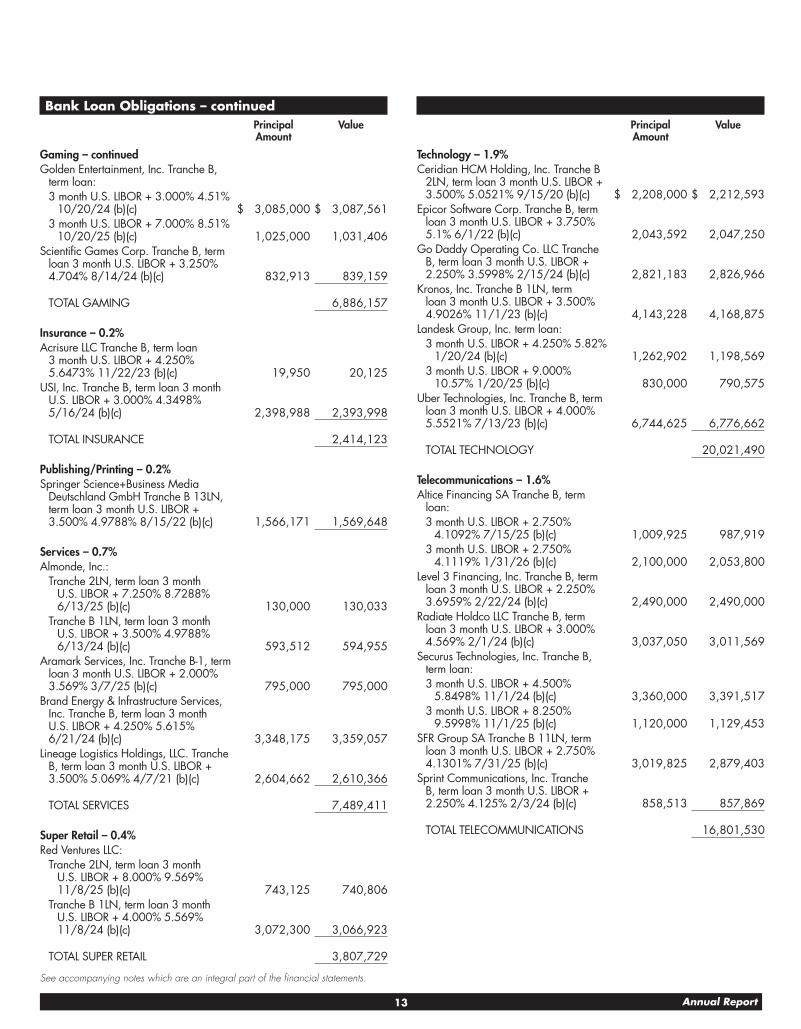
Bank Loan Obligations – continuedPrincipal Amount
Value
Gaming – continuedGolden Entertainment, Inc. Tranche B,
term loan:3 month U.S. LIBOR + 3.000% 4.51%
10/20/24 (b) (c) $ 3,085,000 $ 3,087,5613 month U.S. LIBOR + 7.000% 8.51%
10/20/25 (b) (c) 1,025,000 1,031,406Scientific Games Corp. Tranche B, term
loan 3 month U.S. LIBOR + 3.250% 4.704% 8/14/24 (b) (c) 832,913 839,159
TOTAL GAMING 6,886,157
Insurance – 0.2%Acrisure LLC Tranche B, term loan
3 month U.S. LIBOR + 4.250% 5.6473% 11/22/23 (b) (c) 19,950 20,125
USI, Inc. Tranche B, term loan 3 month U.S. LIBOR + 3.000% 4.3498% 5/16/24 (b) (c) 2,398,988 2,393,998
TOTAL INSURANCE 2,414,123
Publishing/Printing – 0.2%Springer Science+Business Media
Deutschland GmbH Tranche B 13LN, term loan 3 month U.S. LIBOR + 3.500% 4.9788% 8/15/22 (b) (c) 1,566,171 1,569,648
Services – 0.7%Almonde, Inc.:
Tranche 2LN, term loan 3 month U.S. LIBOR + 7.250% 8.7288% 6/13/25 (b) (c) 130,000 130,033
Tranche B 1LN, term loan 3 month U.S. LIBOR + 3.500% 4.9788% 6/13/24 (b) (c) 593,512 594,955
Aramark Services, Inc. Tranche B-1, term loan 3 month U.S. LIBOR + 2.000% 3.569% 3/7/25 (b) (c) 795,000 795,000
Brand Energy & Infrastructure Services, Inc. Tranche B, term loan 3 month U.S. LIBOR + 4.250% 5.615% 6/21/24 (b) (c) 3,348,175 3,359,057
Lineage Logistics Holdings, LLC. Tranche B, term loan 3 month U.S. LIBOR + 3.500% 5.069% 4/7/21 (b) (c) 2,604,662 2,610,366
TOTAL SERVICES 7,489,411
Super Retail – 0.4%Red Ventures LLC:
Tranche 2LN, term loan 3 month U.S. LIBOR + 8.000% 9.569% 11/8/25 (b) (c) 743,125 740,806
Tranche B 1LN, term loan 3 month U.S. LIBOR + 4.000% 5.569% 11/8/24 (b) (c) 3,072,300 3,066,923
TOTAL SUPER RETAIL 3,807,729
Principal Amount
Value
Technology – 1.9%Ceridian HCM Holding, Inc. Tranche B
2LN, term loan 3 month U.S. LIBOR + 3.500% 5.0521% 9/15/20 (b) (c) $ 2,208,000 $ 2,212,593
Epicor Software Corp. Tranche B, term loan 3 month U.S. LIBOR + 3.750% 5.1% 6/1/22 (b) (c) 2,043,592 2,047,250
Go Daddy Operating Co. LLC Tranche B, term loan 3 month U.S. LIBOR + 2.250% 3.5998% 2/15/24 (b) (c) 2,821,183 2,826,966
Kronos, Inc. Tranche B 1LN, term loan 3 month U.S. LIBOR + 3.500% 4.9026% 11/1/23 (b) (c) 4,143,228 4,168,875
Landesk Group, Inc. term loan:3 month U.S. LIBOR + 4.250% 5.82%
1/20/24 (b) (c) 1,262,902 1,198,5693 month U.S. LIBOR + 9.000%
10.57% 1/20/25 (b) (c) 830,000 790,575Uber Technologies, Inc. Tranche B, term
loan 3 month U.S. LIBOR + 4.000% 5.5521% 7/13/23 (b) (c) 6,744,625 6,776,662
TOTAL TECHNOLOGY 20,021,490
Telecommunications – 1.6%Altice Financing SA Tranche B, term
loan:3 month U.S. LIBOR + 2.750%
4.1092% 7/15/25 (b) (c) 1,009,925 987,9193 month U.S. LIBOR + 2.750%
4.1119% 1/31/26 (b) (c) 2,100,000 2,053,800Level 3 Financing, Inc. Tranche B, term
loan 3 month U.S. LIBOR + 2.250% 3.6959% 2/22/24 (b) (c) 2,490,000 2,490,000
Radiate Holdco LLC Tranche B, term loan 3 month U.S. LIBOR + 3.000% 4.569% 2/1/24 (b) (c) 3,037,050 3,011,569
Securus Technologies, Inc. Tranche B, term loan:3 month U.S. LIBOR + 4.500%
5.8498% 11/1/24 (b) (c) 3,360,000 3,391,5173 month U.S. LIBOR + 8.250%
9.5998% 11/1/25 (b) (c) 1,120,000 1,129,453SFR Group SA Tranche B 11LN, term
loan 3 month U.S. LIBOR + 2.750% 4.1301% 7/31/25 (b) (c) 3,019,825 2,879,403
Sprint Communications, Inc. Tranche B, term loan 3 month U.S. LIBOR + 2.250% 4.125% 2/3/24 (b) (c) 858,513 857,869
TOTAL TELECOMMUNICATIONS 16,801,530
14Annual Report
See accompanying notes which are an integral part of the financial statements.
Investments – continued
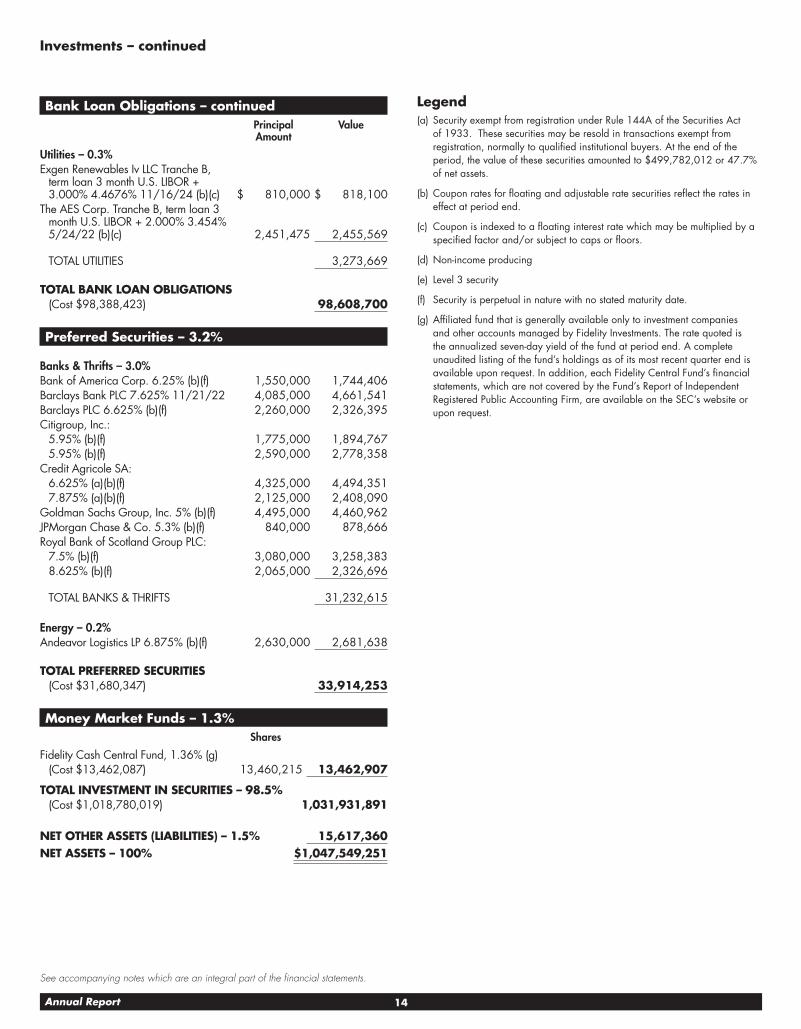
Bank Loan Obligations – continuedPrincipal Amount
Value
Utilities – 0.3%Exgen Renewables Iv LLC Tranche B,
term loan 3 month U.S. LIBOR + 3.000% 4.4676% 11/16/24 (b) (c) $ 810,000 $ 818,100
The AES Corp. Tranche B, term loan 3 month U.S. LIBOR + 2.000% 3.454% 5/24/22 (b) (c) 2,451,475 2,455,569
TOTAL UTILITIES 3,273,669
TOTAL BANK LOAN OBLIGATIONS(Cost $98,388,423) 98,608,700
Preferred Securities – 3.2%
Banks & Thrifts – 3.0%Bank of America Corp. 6.25% (b) (f) 1,550,000 1,744,406Barclays Bank PLC 7.625% 11/21/22 4,085,000 4,661,541Barclays PLC 6.625% (b) (f) 2,260,000 2,326,395Citigroup, Inc.:
5.95% (b) (f) 1,775,000 1,894,7675.95% (b) (f) 2,590,000 2,778,358
Credit Agricole SA:6.625% (a) (b) (f) 4,325,000 4,494,3517.875% (a) (b) (f) 2,125,000 2,408,090
Goldman Sachs Group, Inc. 5% (b) (f) 4,495,000 4,460,962JPMorgan Chase & Co. 5.3% (b) (f) 840,000 878,666Royal Bank of Scotland Group PLC:
7.5% (b) (f) 3,080,000 3,258,3838.625% (b) (f) 2,065,000 2,326,696
TOTAL BANKS & THRIFTS 31,232,615
Energy – 0.2%Andeavor Logistics LP 6.875% (b) (f) 2,630,000 2,681,638
TOTAL PREFERRED SECURITIES(Cost $31,680,347) 33,914,253
Money Market Funds – 1.3%Shares
Fidelity Cash Central Fund, 1.36% (g)(Cost $13,462,087) 13,460,215 13,462,907
TOTAL INVESTMENT IN SECURITIES – 98.5%(Cost $1,018,780,019) 1,031,931,891
NET OTHER ASSETS (LIABILITIES) – 1.5% 15,617,360NET ASSETS – 100% $1,047,549,251
Legend(a) Security exempt from registration under Rule 144A of the Securities Act
of 1933. These securities may be resold in transactions exempt from registration, normally to qualified institutional buyers. At the end of the period, the value of these securities amounted to $499,782,012 or 47.7% of net assets.
(b) Coupon rates for floating and adjustable rate securities reflect the rates in effect at period end.
(c) Coupon is indexed to a floating interest rate which may be multiplied by a specified factor and/or subject to caps or floors.
(d) Non-income producing
(e) Level 3 security
(f) Security is perpetual in nature with no stated maturity date.
(g) Affiliated fund that is generally available only to investment companies and other accounts managed by Fidelity Investments. The rate quoted is the annualized seven-day yield of the fund at period end. A complete unaudited listing of the fund’s holdings as of its most recent quarter end is available upon request. In addition, each Fidelity Central Fund’s financial statements, which are not covered by the Fund’s Report of Independent Registered Public Accounting Firm, are available on the SEC’s website or upon request.
15 Annual Report
See accompanying notes which are an integral part of the financial statements.
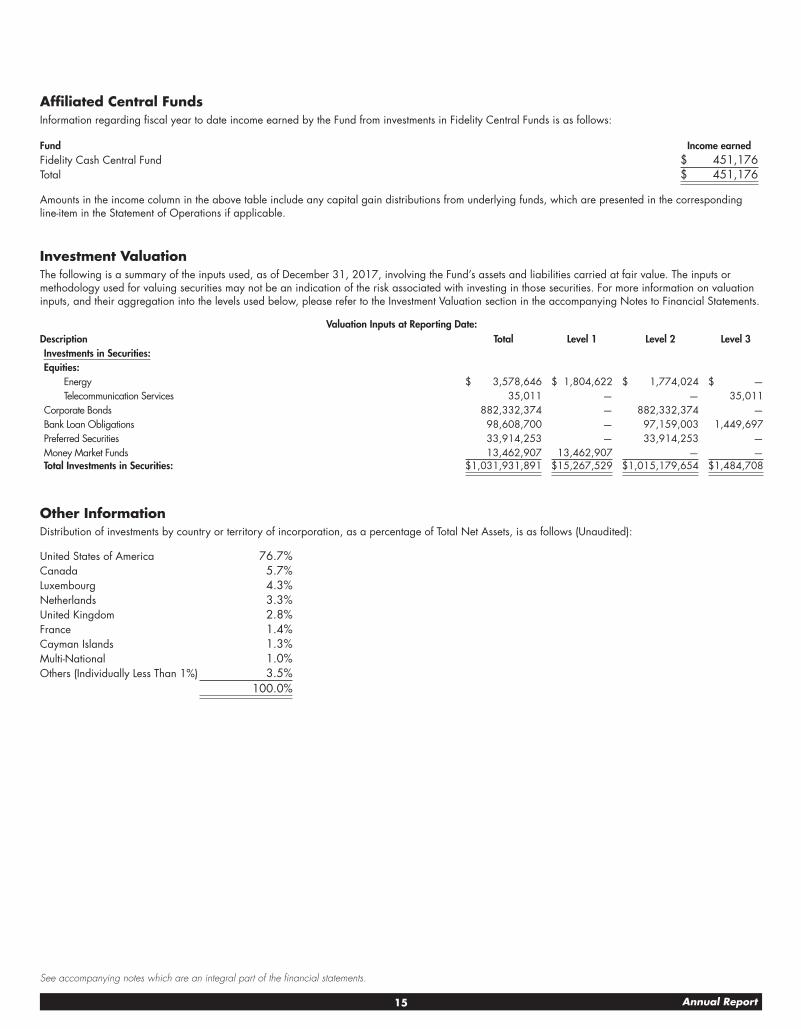
Affiliated Central FundsInformation regarding fiscal year to date income earned by the Fund from investments in Fidelity Central Funds is as follows:
Fund Income earnedFidelity Cash Central Fund $ 451,176Total $ 451,176
Amounts in the income column in the above table include any capital gain distributions from underlying funds, which are presented in the corresponding line-item in the Statement of Operations if applicable.
Investment ValuationThe following is a summary of the inputs used, as of December 31, 2017, involving the Fund’s assets and liabilities carried at fair value. The inputs or methodology used for valuing securities may not be an indication of the risk associated with investing in those securities. For more information on valuation inputs, and their aggregation into the levels used below, please refer to the Investment Valuation section in the accompanying Notes to Financial Statements.
Valuation Inputs at Reporting Date:Description Total Level 1 Level 2 Level 3Investments in Securities:Equities:
Energy $ 3,578,646 $ 1,804,622 $ 1,774,024 $ —Telecommunication Services 35,011 — — 35,011
Corporate Bonds 882,332,374 — 882,332,374 —Bank Loan Obligations 98,608,700 — 97,159,003 1,449,697Preferred Securities 33,914,253 — 33,914,253 —Money Market Funds 13,462,907 13,462,907 — —Total Investments in Securities: $ 1,031,931,891 $ 15,267,529 $ 1,015,179,654 $ 1,484,708
Other InformationDistribution of investments by country or territory of incorporation, as a percentage of Total Net Assets, is as follows (Unaudited):
United States of America 76.7%Canada 5.7%Luxembourg 4.3%Netherlands 3.3%United Kingdom 2.8%France 1.4%Cayman Islands 1.3%Multi-National 1.0%Others (Individually Less Than 1%) 3.5%
100.0%
16Annual Report
See accompanying notes which are an integral part of the financial statements.
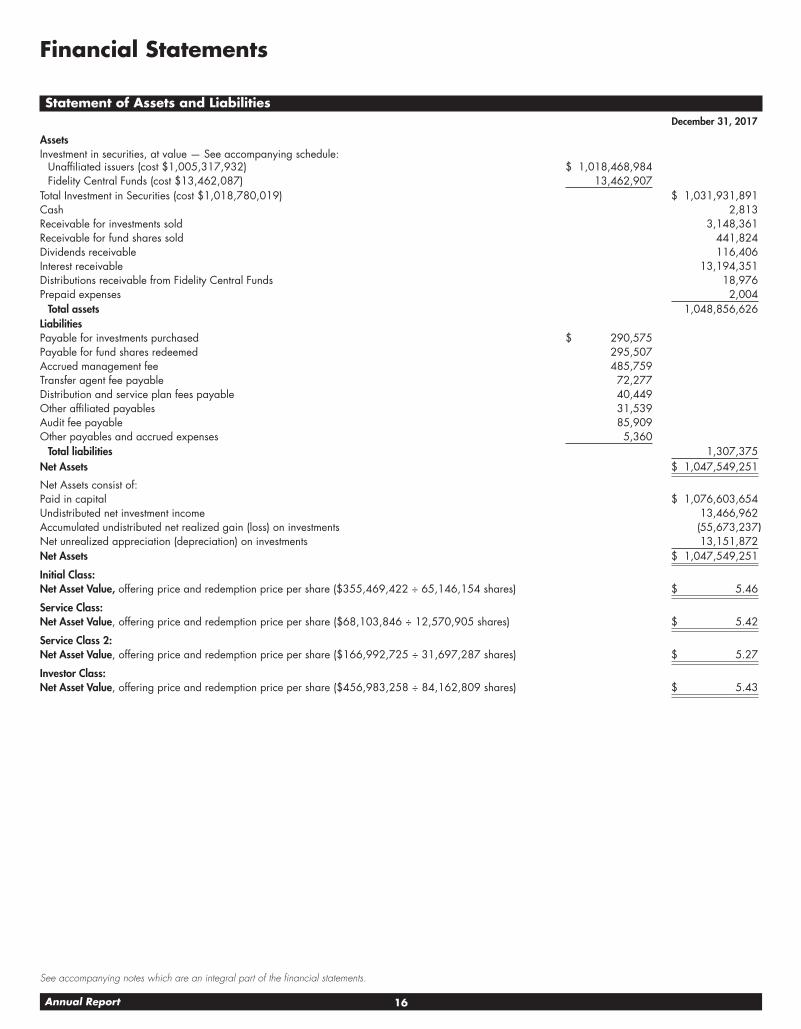
Financial Statements
Statement of Assets and LiabilitiesDecember 31, 2017
Assets Investment in securities, at value — See accompanying schedule:
Unaffiliated issuers (cost $1,005,317,932) $ 1,018,468,984Fidelity Central Funds (cost $13,462,087) 13,462,907
Total Investment in Securities (cost $1,018,780,019) $ 1,031,931,891Cash 2,813Receivable for investments sold 3,148,361Receivable for fund shares sold 441,824Dividends receivable 116,406Interest receivable 13,194,351Distributions receivable from Fidelity Central Funds 18,976Prepaid expenses 2,004
Total assets 1,048,856,626Liabilities Payable for investments purchased $ 290,575Payable for fund shares redeemed 295,507Accrued management fee 485,759Transfer agent fee payable 72,277Distribution and service plan fees payable 40,449Other affiliated payables 31,539Audit fee payable 85,909Other payables and accrued expenses 5,360
Total liabilities 1,307,375Net Assets $ 1,047,549,251
Net Assets consist of: Paid in capital $ 1,076,603,654Undistributed net investment income 13,466,962Accumulated undistributed net realized gain (loss) on investments (55,673,237)Net unrealized appreciation (depreciation) on investments 13,151,872Net Assets $ 1,047,549,251
Initial Class: Net Asset Value, offering price and redemption price per share ($355,469,422 ÷ 65,146,154 shares) $ 5.46
Service Class: Net Asset Value, offering price and redemption price per share ($68,103,846 ÷ 12,570,905 shares) $ 5.42
Service Class 2: Net Asset Value, offering price and redemption price per share ($166,992,725 ÷ 31,697,287 shares) $ 5.27
Investor Class: Net Asset Value, offering price and redemption price per share ($456,983,258 ÷ 84,162,809 shares) $ 5.43
17 Annual Report
See accompanying notes which are an integral part of the financial statements.
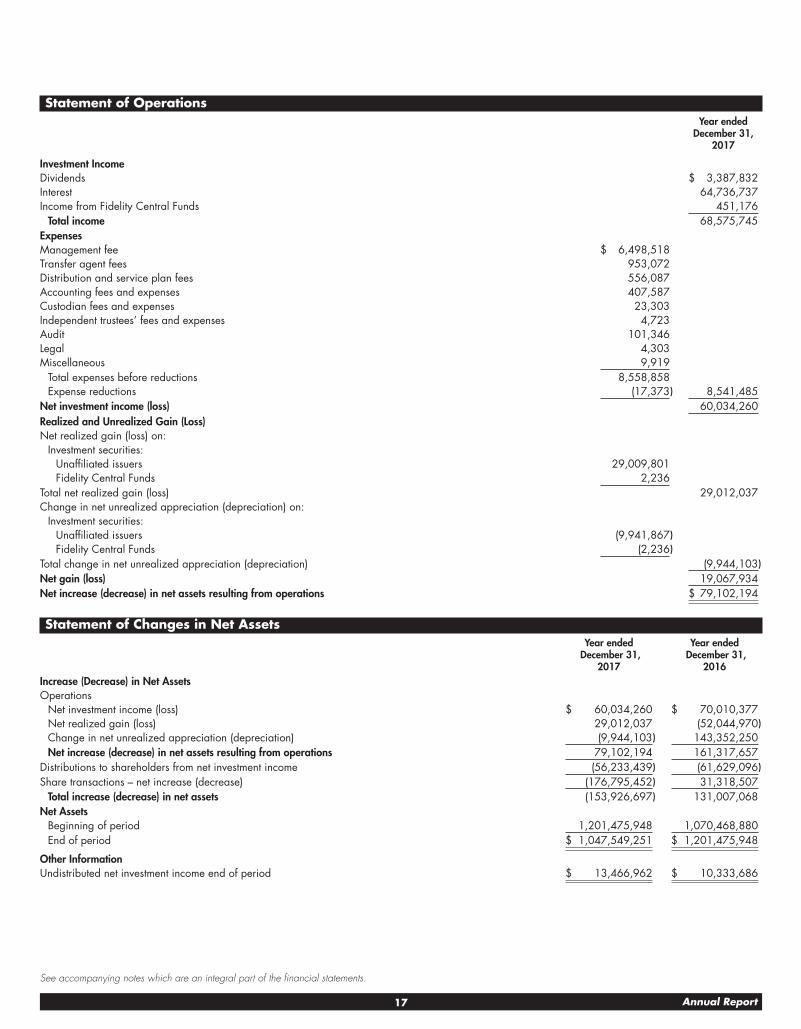
Statement of OperationsYear ended
December 31, 2017
Investment Income Dividends $ 3,387,832Interest 64,736,737Income from Fidelity Central Funds 451,176
Total income 68,575,745Expenses Management fee $ 6,498,518Transfer agent fees 953,072Distribution and service plan fees 556,087Accounting fees and expenses 407,587Custodian fees and expenses 23,303Independent trustees’ fees and expenses 4,723Audit 101,346Legal 4,303Miscellaneous 9,919
Total expenses before reductions 8,558,858Expense reductions (17,373) 8,541,485
Net investment income (loss) 60,034,260Realized and Unrealized Gain (Loss) Net realized gain (loss) on:
Investment securities: Unaffiliated issuers 29,009,801Fidelity Central Funds 2,236
Total net realized gain (loss) 29,012,037Change in net unrealized appreciation (depreciation) on:
Investment securities: Unaffiliated issuers (9,941,867)Fidelity Central Funds (2,236)
Total change in net unrealized appreciation (depreciation) (9,944,103)Net gain (loss) 19,067,934Net increase (decrease) in net assets resulting from operations $ 79,102,194
Statement of Changes in Net AssetsYear ended
December 31, 2017
Year ended December 31,
2016Increase (Decrease) in Net Assets Operations
Net investment income (loss) $ 60,034,260 $ 70,010,377Net realized gain (loss) 29,012,037 (52,044,970)Change in net unrealized appreciation (depreciation) (9,944,103) 143,352,250Net increase (decrease) in net assets resulting from operations 79,102,194 161,317,657
Distributions to shareholders from net investment income (56,233,439) (61,629,096)Share transactions – net increase (decrease) (176,795,452) 31,318,507
Total increase (decrease) in net assets (153,926,697) 131,007,068Net Assets
Beginning of period 1,201,475,948 1,070,468,880End of period $ 1,047,549,251 $ 1,201,475,948
Other Information Undistributed net investment income end of period $ 13,466,962 $ 10,333,686

18Annual Report
See accompanying notes which are an integral part of the financial statements.
Financial Highlights
VIP High Income Portfolio Initial Class
Years ended December 31, 2017 2016 2015 2014 2013Selected Per–Share Data Net asset value, beginning of period $ 5.38 $ 4.95 $ 5.52 $ 5.80 $ 5.81Income from Investment Operations
Net investment income (loss) A .290 .320 .333 .317 .330Net realized and unrealized gain (loss) .091 .402 (.531) (.251) .014
Total from investment operations .381 .722 (.198) .066 .344Distributions from net investment income (.301) (.292) (.364) (.347) (.354)Tax return of capital – – (.008) – –
Total distributions (.301) (.292) (.372) (.347) (.354)Redemption fees added to paid in capital A – – –B .001 –B
Net asset value, end of period $ 5.46 $ 5.38 $ 4.95 $ 5.52 $ 5.80
Total Return C,D 7.13% 14.61% (3.63)% 1.16% 5.95%Ratios to Average Net Assets E,F
Expenses before reductions .67% .68% .68% .68% .68%Expenses net of fee waivers, if any .67% .68% .68% .68% .68%Expenses net of all reductions .67% .68% .68% .68% .68%Net investment income (loss) 5.22% 6.05% 5.94% 5.31% 5.55%
Supplemental Data Net assets, end of period (000 omitted) $ 355,469 $ 457,620 $ 437,798 $ 493,390 $ 587,376Portfolio turnover rate G 70% 73% 69% 79% 85%
A Calculated based on average shares outstanding during the period.B Amount represents less than $.0005 per share.C Total returns do not reflect charges attributable to your insurance company’s separate account. Inclusion of these charges would reduce the total returns shown.D Total returns would have been lower if certain expenses had not been reduced during the applicable periods shown.E Fees and expenses of any underlying Fidelity Central Funds are not included in the Fund’s expense ratio. The Fund indirectly bears its proportionate share of the expenses of any underlying Fidelity Central Funds.F Expense ratios reflect operating expenses of the class. Expenses before reductions do not reflect amounts reimbursed by the investment adviser or reductions from brokerage service arrangements or reductions from other expense offset
arrangements and do not represent the amount paid by the class during periods when reimbursements or reductions occur. Expenses net of fee waivers reflect expenses after reimbursement by the investment adviser but prior to reductions from brokerage service arrangements or other expense offset arrangements. Expenses net of all reductions represent the net expenses paid by the class.
G Amount does not include the portfolio activity of any underlying Fidelity Central Funds.
19 Annual Report
See accompanying notes which are an integral part of the financial statements.
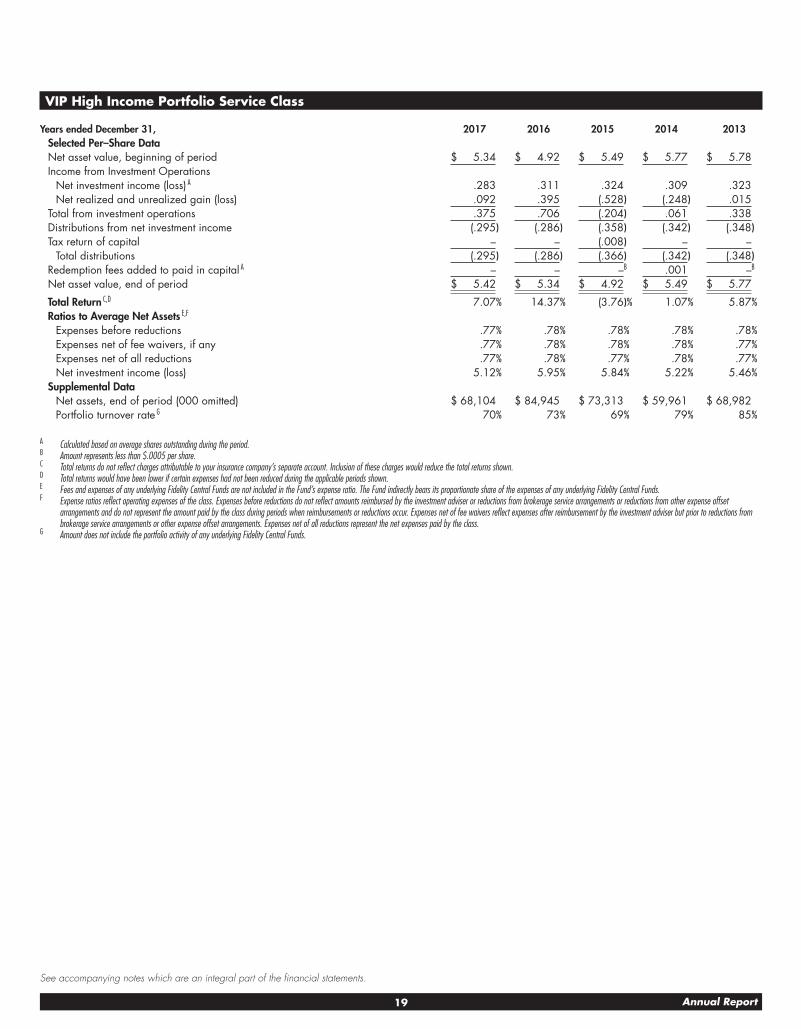
VIP High Income Portfolio Service Class
Years ended December 31, 2017 2016 2015 2014 2013Selected Per–Share Data Net asset value, beginning of period $ 5.34 $ 4.92 $ 5.49 $ 5.77 $ 5.78Income from Investment Operations
Net investment income (loss) A .283 .311 .324 .309 .323Net realized and unrealized gain (loss) .092 .395 (.528) (.248) .015
Total from investment operations .375 .706 (.204) .061 .338Distributions from net investment income (.295) (.286) (.358) (.342) (.348)Tax return of capital – – (.008) – –
Total distributions (.295) (.286) (.366) (.342) (.348)Redemption fees added to paid in capital A – – –B .001 –B
Net asset value, end of period $ 5.42 $ 5.34 $ 4.92 $ 5.49 $ 5.77
Total Return C,D 7.07% 14.37% (3.76)% 1.07% 5.87%Ratios to Average Net Assets E,F
Expenses before reductions .77% .78% .78% .78% .78%Expenses net of fee waivers, if any .77% .78% .78% .78% .77%Expenses net of all reductions .77% .78% .77% .78% .77%Net investment income (loss) 5.12% 5.95% 5.84% 5.22% 5.46%
Supplemental Data Net assets, end of period (000 omitted) $ 68,104 $ 84,945 $ 73,313 $ 59,961 $ 68,982Portfolio turnover rate G 70% 73% 69% 79% 85%
A Calculated based on average shares outstanding during the period.B Amount represents less than $.0005 per share.C Total returns do not reflect charges attributable to your insurance company’s separate account. Inclusion of these charges would reduce the total returns shown.D Total returns would have been lower if certain expenses had not been reduced during the applicable periods shown.E Fees and expenses of any underlying Fidelity Central Funds are not included in the Fund’s expense ratio. The Fund indirectly bears its proportionate share of the expenses of any underlying Fidelity Central Funds.F Expense ratios reflect operating expenses of the class. Expenses before reductions do not reflect amounts reimbursed by the investment adviser or reductions from brokerage service arrangements or reductions from other expense offset
arrangements and do not represent the amount paid by the class during periods when reimbursements or reductions occur. Expenses net of fee waivers reflect expenses after reimbursement by the investment adviser but prior to reductions from brokerage service arrangements or other expense offset arrangements. Expenses net of all reductions represent the net expenses paid by the class.
G Amount does not include the portfolio activity of any underlying Fidelity Central Funds.
20Annual Report
See accompanying notes which are an integral part of the financial statements.
Financial Highlights – continued
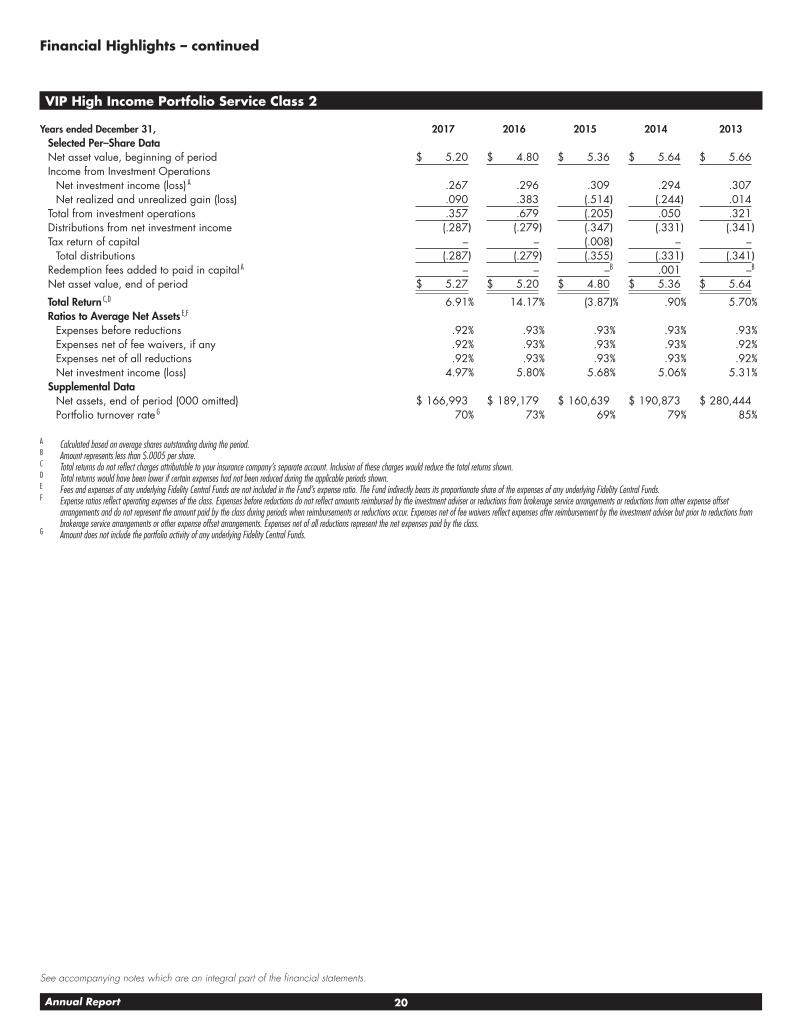
VIP High Income Portfolio Service Class 2
Years ended December 31, 2017 2016 2015 2014 2013Selected Per–Share Data Net asset value, beginning of period $ 5.20 $ 4.80 $ 5.36 $ 5.64 $ 5.66Income from Investment Operations
Net investment income (loss) A .267 .296 .309 .294 .307Net realized and unrealized gain (loss) .090 .383 (.514) (.244) .014
Total from investment operations .357 .679 (.205) .050 .321Distributions from net investment income (.287) (.279) (.347) (.331) (.341)Tax return of capital – – (.008) – –
Total distributions (.287) (.279) (.355) (.331) (.341)Redemption fees added to paid in capital A – – –B .001 –B
Net asset value, end of period $ 5.27 $ 5.20 $ 4.80 $ 5.36 $ 5.64
Total Return C,D 6.91% 14.17% (3.87)% .90% 5.70%Ratios to Average Net Assets E,F
Expenses before reductions .92% .93% .93% .93% .93%Expenses net of fee waivers, if any .92% .93% .93% .93% .92%Expenses net of all reductions .92% .93% .93% .93% .92%Net investment income (loss) 4.97% 5.80% 5.68% 5.06% 5.31%
Supplemental Data Net assets, end of period (000 omitted) $ 166,993 $ 189,179 $ 160,639 $ 190,873 $ 280,444Portfolio turnover rate G 70% 73% 69% 79% 85%
A Calculated based on average shares outstanding during the period.B Amount represents less than $.0005 per share.C Total returns do not reflect charges attributable to your insurance company’s separate account. Inclusion of these charges would reduce the total returns shown.D Total returns would have been lower if certain expenses had not been reduced during the applicable periods shown.E Fees and expenses of any underlying Fidelity Central Funds are not included in the Fund’s expense ratio. The Fund indirectly bears its proportionate share of the expenses of any underlying Fidelity Central Funds.F Expense ratios reflect operating expenses of the class. Expenses before reductions do not reflect amounts reimbursed by the investment adviser or reductions from brokerage service arrangements or reductions from other expense offset
arrangements and do not represent the amount paid by the class during periods when reimbursements or reductions occur. Expenses net of fee waivers reflect expenses after reimbursement by the investment adviser but prior to reductions from brokerage service arrangements or other expense offset arrangements. Expenses net of all reductions represent the net expenses paid by the class.
G Amount does not include the portfolio activity of any underlying Fidelity Central Funds.
21 Annual Report
See accompanying notes which are an integral part of the financial statements.
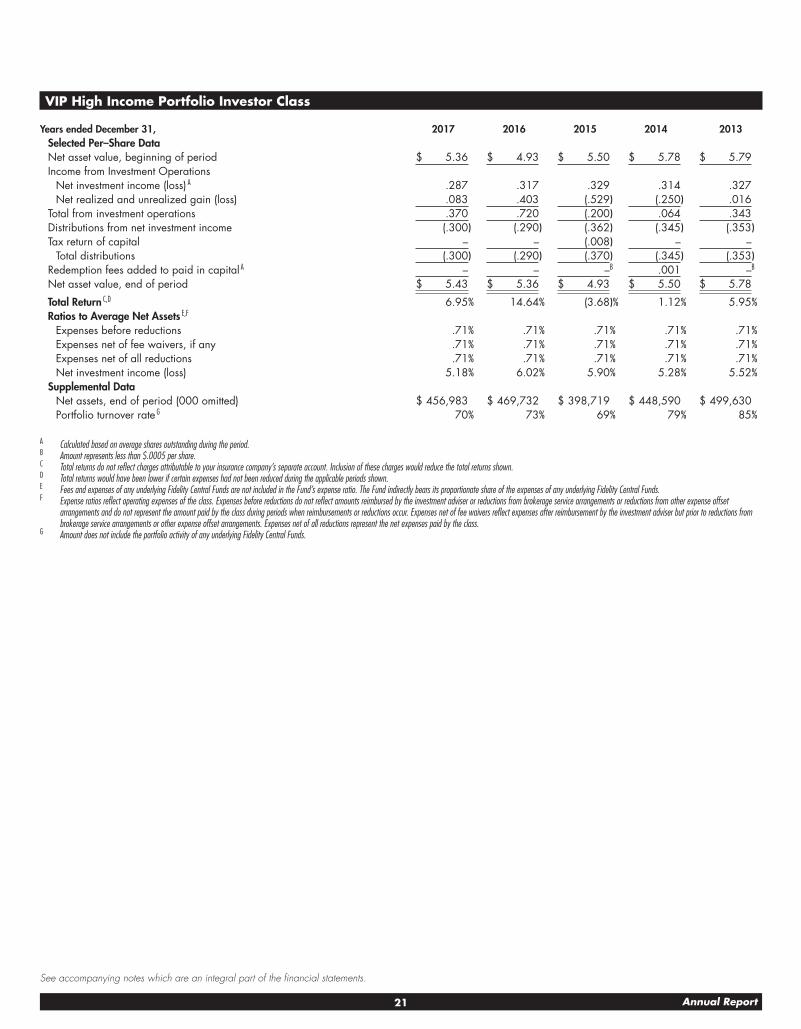
VIP High Income Portfolio Investor Class
Years ended December 31, 2017 2016 2015 2014 2013Selected Per–Share Data Net asset value, beginning of period $ 5.36 $ 4.93 $ 5.50 $ 5.78 $ 5.79Income from Investment Operations
Net investment income (loss) A .287 .317 .329 .314 .327Net realized and unrealized gain (loss) .083 .403 (.529) (.250) .016
Total from investment operations .370 .720 (.200) .064 .343Distributions from net investment income (.300) (.290) (.362) (.345) (.353)Tax return of capital – – (.008) – –
Total distributions (.300) (.290) (.370) (.345) (.353)Redemption fees added to paid in capital A – – –B .001 –B
Net asset value, end of period $ 5.43 $ 5.36 $ 4.93 $ 5.50 $ 5.78
Total Return C,D 6.95% 14.64% (3.68)% 1.12% 5.95%Ratios to Average Net Assets E,F
Expenses before reductions .71% .71% .71% .71% .71%Expenses net of fee waivers, if any .71% .71% .71% .71% .71%Expenses net of all reductions .71% .71% .71% .71% .71%Net investment income (loss) 5.18% 6.02% 5.90% 5.28% 5.52%
Supplemental Data Net assets, end of period (000 omitted) $ 456,983 $ 469,732 $ 398,719 $ 448,590 $ 499,630Portfolio turnover rate G 70% 73% 69% 79% 85%
A Calculated based on average shares outstanding during the period.B Amount represents less than $.0005 per share.C Total returns do not reflect charges attributable to your insurance company’s separate account. Inclusion of these charges would reduce the total returns shown.D Total returns would have been lower if certain expenses had not been reduced during the applicable periods shown.E Fees and expenses of any underlying Fidelity Central Funds are not included in the Fund’s expense ratio. The Fund indirectly bears its proportionate share of the expenses of any underlying Fidelity Central Funds.F Expense ratios reflect operating expenses of the class. Expenses before reductions do not reflect amounts reimbursed by the investment adviser or reductions from brokerage service arrangements or reductions from other expense offset
arrangements and do not represent the amount paid by the class during periods when reimbursements or reductions occur. Expenses net of fee waivers reflect expenses after reimbursement by the investment adviser but prior to reductions from brokerage service arrangements or other expense offset arrangements. Expenses net of all reductions represent the net expenses paid by the class.
G Amount does not include the portfolio activity of any underlying Fidelity Central Funds.
22Annual Report
Notes to Financial StatementsFor the period ended December 31, 2017
1. Organization.
VIP High Income Portfolio (the Fund) is a fund of Variable Insurance Products Fund (the Trust) and is authorized to issue an unlimited number of shares. The Trust is registered under the Investment Company Act of 1940, as amended (the 1940 Act), as an open-end management invest-ment company organized as a Massachusetts business trust. Shares of the Fund may only be purchased by insurance companies for the purpose of funding variable annuity or variable life insurance contracts. The Fund offers the following classes of shares: Initial Class shares, Service Class shares, Service Class 2 shares and Investor Class shares. All classes have equal rights and voting privileges, except for matters affecting a single class.
2. Investments in Fidelity Central Funds.
The Fund invests in Fidelity Central Funds, which are open-end investment companies generally available only to other investment companies and accounts managed by the investment adviser and its affiliates. The Fund’s Schedule of Investments lists each of the Fidelity Central Funds held as of period end, if any, as an investment of the Fund, but does not include the underlying holdings of each Fidelity Central Fund. As an Investing Fund, the Fund indirectly bears its proportionate share of the expenses of the underlying Fidelity Central Funds.
The Money Market Central Funds seek preservation of capital and current income and are managed by Fidelity Investments Money Management, Inc. (FIMM), an affiliate of the investment adviser. Annualized expenses of the Money Market Central Funds as of their most recent shareholder report date are less than .005%.
A complete unaudited list of holdings for each Fidelity Central Fund is available upon request or at the Securities and Exchange Commission (the SEC) website at www.sec.gov. In addition, the financial statements of the Fidelity Central Funds, which are not covered by the Fund’s Report of Independent Registered Public Accounting Firm, are available on the SEC website or upon request.
3. Significant Accounting Policies.
The Fund is an investment company and applies the accounting and reporting guidance of the Financial Accounting Standards Board (FASB) Accounting Standards Codification Topic 946 Financial Services – Investments Companies. The financial statements have been prepared in conformity with accounting principles generally accepted in the United States of America (GAAP), which require management to make certain estimates and assumptions at the date of the financial statements. Actual results could differ from those estimates. Subsequent events, if any, through the date that the financial statements were issued have been evaluated in the preparation of the financial statements. The following summarizes the significant accounting policies of the Fund:
Investment Valuation. Investments are valued as of 4:00 p.m. Eastern time on the last calendar day of the period. The Board of Trustees (the Board) has delegated the day to day responsibility for the valuation of the Fund’s investments to the Fair Value Committee (the Committee) established by the Fund’s investment adviser. In accordance with valuation policies and procedures approved by the Board, the Fund attempts to obtain prices from one or more third party pricing vendors or brokers to value its investments. When current market prices, quotations or currency exchange rates are not readily available or reliable, investments will be fair valued in good faith by the Committee, in accordance with procedures adopted by the Board. Factors used in determining fair value vary by investment type and may include market or investment specific events, changes in interest rates and credit quality. The frequency with which these procedures are used cannot be predicted and they may be uti-lized to a significant extent. The Committee oversees the Fund’s valuation policies and procedures and reports to the Board on the Committee’s activities and fair value determinations. The Board monitors the appropriateness of the procedures used in valuing the Fund’s investments and ratifies the fair value determinations of the Committee.
The Fund categorizes the inputs to valuation techniques used to value its investments into a disclosure hierarchy consisting of three levels as shown below:
Level 1 – quoted prices in active markets for identical investments
Level 2 – other significant observable inputs (including quoted prices for similar investments, interest rates, prepayment speeds, etc.)
Level 3 – unobservable inputs (including the Fund’s own assumptions based on the best information available)
Valuation techniques used to value the Fund’s investments by major category are as follows:
Debt securities, including restricted securities, are valued based on evaluated prices received from third party pricing vendors or from brokers who make markets in such securities. Corporate bonds, bank loan obligations and preferred securities are valued by pricing vendors who utilize matrix pricing which considers yield or price of bonds of comparable quality, coupon, maturity and type or by broker-supplied prices. When inde-pendent prices are unavailable or unreliable, debt securities may be valued utilizing pricing methodologies which consider similar factors that would be used by third party pricing vendors. Debt securities are generally categorized as Level 2 in the hierarchy but may be Level 3 depending on the circumstances. The Fund invests a significant portion of its assets in below investment grade securities. The value of these securities can be more volatile due to changes in the credit quality of the issuer and is sensitive to changes in economic, market and regulatory conditions.
23 Annual Report
Equity securities, including restricted securities, for which market quotations are readily available, are valued at the last reported sale price or official closing price as reported by a third party pricing vendor on the primary market or exchange on which they are traded and are categorized as Level 1 in the hierarchy. In the event there were no sales during the day or closing prices are not available, securities are valued at the last quoted bid price or may be valued using the last available price and are generally categorized as Level 2 in the hierarchy. Utilizing these tech-niques may result in transfers between Level 1 and Level 2. For equity securities, including restricted securities, where observable inputs are limited, assumptions about market activity and risk are used and these securities may be categorized as Level 3 in the hierarchy.
Investments in open-end mutual funds, including the Fidelity Central Funds, are valued at their closing net asset value (NAV) each business day and are categorized as Level 1 in the hierarchy.
Changes in valuation techniques may result in transfers in or out of an assigned level within the disclosure hierarchy. The aggregate value of investments by input level as of December 31, 2017 is included at the end of the Fund’s Schedule of Investments.
Investment Transactions and Income. For financial reporting purposes, the Fund’s investment holdings and NAV include trades executed through the end of the last business day of the period. The NAV per share for processing shareholder transactions is calculated as of the close of business of the New York Stock Exchange (NYSE), normally 4:00 p.m. Eastern time and includes trades executed through the end of the prior business day. Gains and losses on securities sold are determined on the basis of identified cost and includes proceeds received from litigation. Dividend income is recorded on the ex-dividend date, except for certain dividends from foreign securities where the ex-dividend date may have passed, which are recorded as soon as the Fund is informed of the ex-dividend date. Non-cash dividends included in dividend income, if any, are recorded at the fair market value of the securities received. Income and capital gain distributions from Fidelity Central Funds, if any, are recorded on the ex-dividend date. Interest income is accrued as earned and includes coupon interest and amortization of premium and accre-tion of discount on debt securities as applicable. Paid in Kind (PIK) income is recorded at the fair market value of the securities received. Debt obligations may be placed on non-accrual status and related interest income may be reduced by ceasing current accruals and writing off interest receivables when the collection of all or a portion of interest has become doubtful based on consistently applied procedures. A debt obligation is removed from non-accrual status when the issuer resumes interest payments or when collectability of interest is reasonably assured.
Class Allocations and Expenses. Investment income, realized and unrealized capital gains and losses, common expenses of the Fund, and certain fund-level expense reductions, if any, are allocated daily on a pro-rata basis to each class based on the relative net assets of each class to the total net assets of the Fund. Each class differs with respect to transfer agent and distribution and service plan fees incurred. Certain expense reductions may also differ by class. For the reporting period, the allocated portion of income and expenses to each class as a percent of its aver-age net assets may vary due to the timing of recording these transactions in relation to fluctuating net assets of the classes. Expenses directly attributable to a fund are charged to that fund. Expenses attributable to more than one fund are allocated among the respective funds on the basis of relative net assets or other appropriate methods. Expense estimates are accrued in the period to which they relate and adjustments are made when actual amounts are known.
Income Tax Information and Distributions to Shareholders. Each year, the Fund intends to qualify as a regulated investment company under Subchapter M of the Internal Revenue Code, including distributing substantially all of its taxable income and realized gains. As a result, no provision for U.S. Federal income taxes is required. As of December 31, 2017, the Fund did not have any unrecognized tax benefits in the financial statements; nor is the Fund aware of any tax positions for which it is reasonably possible that the total amounts of unrecognized tax benefits will significantly change in the next twelve months. The Fund files a U.S. federal tax return, in addition to state and local tax returns as required. The Fund’s federal income tax returns are subject to examination by the Internal Revenue Service (IRS) for a period of three fiscal years after they are filed. State and local tax returns may be subject to examination for an additional fiscal year depending on the jurisdiction.
Distributions are declared and recorded on the ex-dividend date. Income dividends and capital gain distributions are declared separately for each class. Income and capital gain distributions are determined in accordance with income tax regulations, which may differ from GAAP.
Capital accounts within the financial statements are adjusted for permanent book-tax differences. These adjustments have no impact on net assets or the results of operations. Capital accounts are not adjusted for temporary book-tax differences which will reverse in a subsequent period.
Book-tax differences are primarily due to market discount, deferred trustees compensation, capital loss carryforwards, defaulted bonds, expiring capital loss carryforwards and losses deferred due to wash sales.
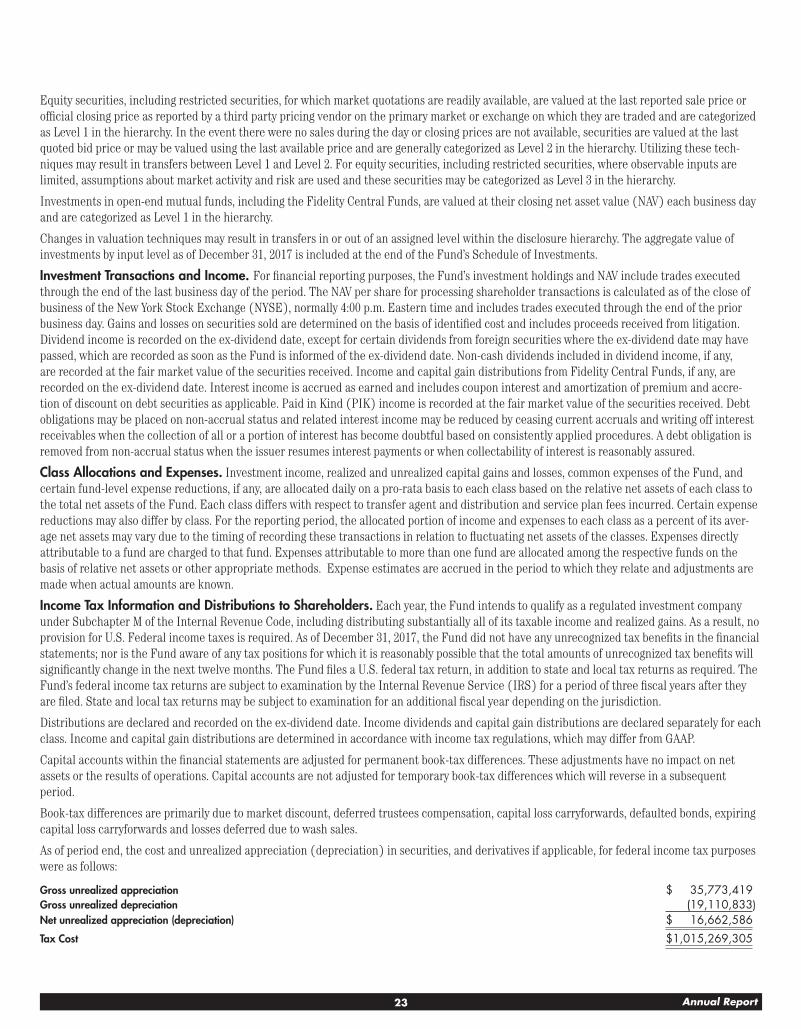
As of period end, the cost and unrealized appreciation (depreciation) in securities, and derivatives if applicable, for federal income tax purposes were as follows:
Gross unrealized appreciation $ 35,773,419Gross unrealized depreciation (19,110,833)Net unrealized appreciation (depreciation) $ 16,662,586
Tax Cost $ 1,015,269,305
24Annual Report
Notes to Financial Statements – continued
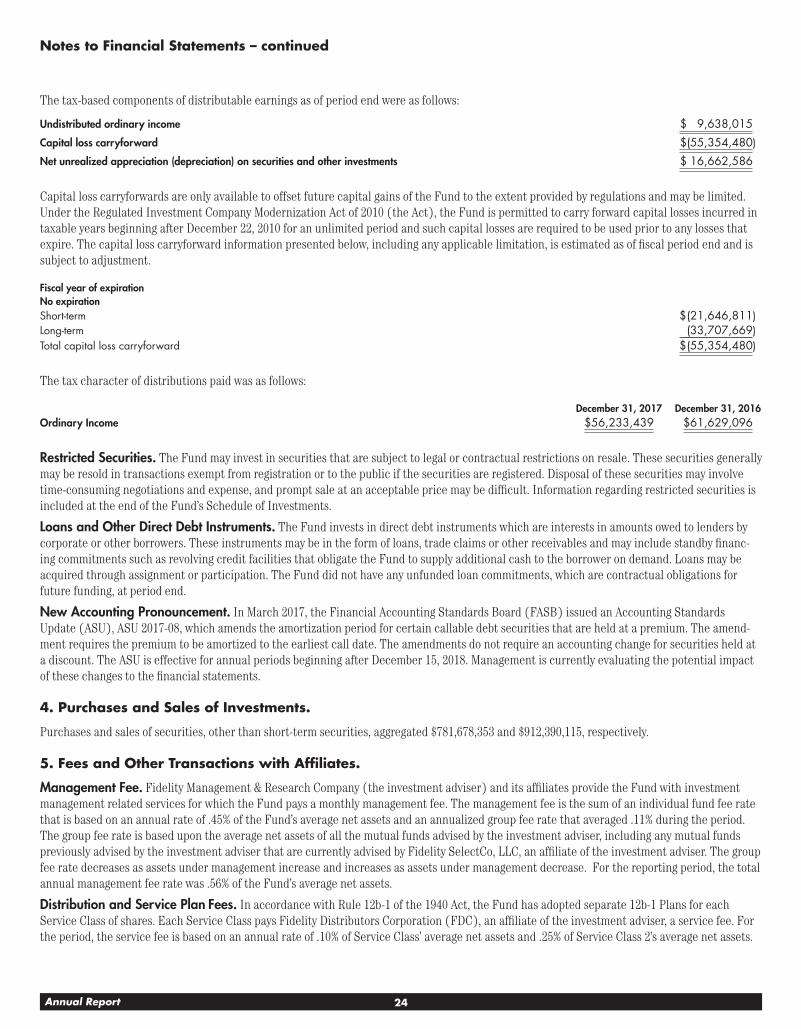
The tax-based components of distributable earnings as of period end were as follows:
Undistributed ordinary income $ 9,638,015
Capital loss carryforward $ (55,354,480)
Net unrealized appreciation (depreciation) on securities and other investments $ 16,662,586
Capital loss carryforwards are only available to offset future capital gains of the Fund to the extent provided by regulations and may be limited. Under the Regulated Investment Company Modernization Act of 2010 (the Act), the Fund is permitted to carry forward capital losses incurred in taxable years beginning after December 22, 2010 for an unlimited period and such capital losses are required to be used prior to any losses that expire. The capital loss carryforward information presented below, including any applicable limitation, is estimated as of fiscal period end and is subject to adjustment.
Fiscal year of expirationNo expirationShort-term $ (21,646,811)Long-term (33,707,669)Total capital loss carryforward $ (55,354,480)
The tax character of distributions paid was as follows:
December 31, 2017 December 31, 2016Ordinary Income $ 56,233,439 $ 61,629,096
Restricted Securities. The Fund may invest in securities that are subject to legal or contractual restrictions on resale. These securities generally may be resold in transactions exempt from registration or to the public if the securities are registered. Disposal of these securities may involve time-consuming negotiations and expense, and prompt sale at an acceptable price may be difficult. Information regarding restricted securities is included at the end of the Fund’s Schedule of Investments.
Loans and Other Direct Debt Instruments. The Fund invests in direct debt instruments which are interests in amounts owed to lenders by corporate or other borrowers. These instruments may be in the form of loans, trade claims or other receivables and may include standby financ-ing commitments such as revolving credit facilities that obligate the Fund to supply additional cash to the borrower on demand. Loans may be acquired through assignment or participation. The Fund did not have any unfunded loan commitments, which are contractual obligations for future funding, at period end.
New Accounting Pronouncement. In March 2017, the Financial Accounting Standards Board (FASB) issued an Accounting Standards Update (ASU), ASU 2017-08, which amends the amortization period for certain callable debt securities that are held at a premium. The amend-ment requires the premium to be amortized to the earliest call date. The amendments do not require an accounting change for securities held at a discount. The ASU is effective for annual periods beginning after December 15, 2018. Management is currently evaluating the potential impact of these changes to the financial statements.
4. Purchases and Sales of Investments.
Purchases and sales of securities, other than short-term securities, aggregated $781,678,353 and $912,390,115, respectively.
5. Fees and Other Transactions with Affiliates.
Management Fee. Fidelity Management & Research Company (the investment adviser) and its affiliates provide the Fund with investment management related services for which the Fund pays a monthly management fee. The management fee is the sum of an individual fund fee rate that is based on an annual rate of .45% of the Fund’s average net assets and an annualized group fee rate that averaged .11% during the period. The group fee rate is based upon the average net assets of all the mutual funds advised by the investment adviser, including any mutual funds previously advised by the investment adviser that are currently advised by Fidelity SelectCo, LLC, an affiliate of the investment adviser. The group fee rate decreases as assets under management increase and increases as assets under management decrease. For the reporting period, the total annual management fee rate was .56% of the Fund’s average net assets.
Distribution and Service Plan Fees. In accordance with Rule 12b-1 of the 1940 Act, the Fund has adopted separate 12b-1 Plans for each Service Class of shares. Each Service Class pays Fidelity Distributors Corporation (FDC), an affiliate of the investment adviser, a service fee. For the period, the service fee is based on an annual rate of .10% of Service Class’ average net assets and .25% of Service Class 2’s average net assets.
25 Annual Report
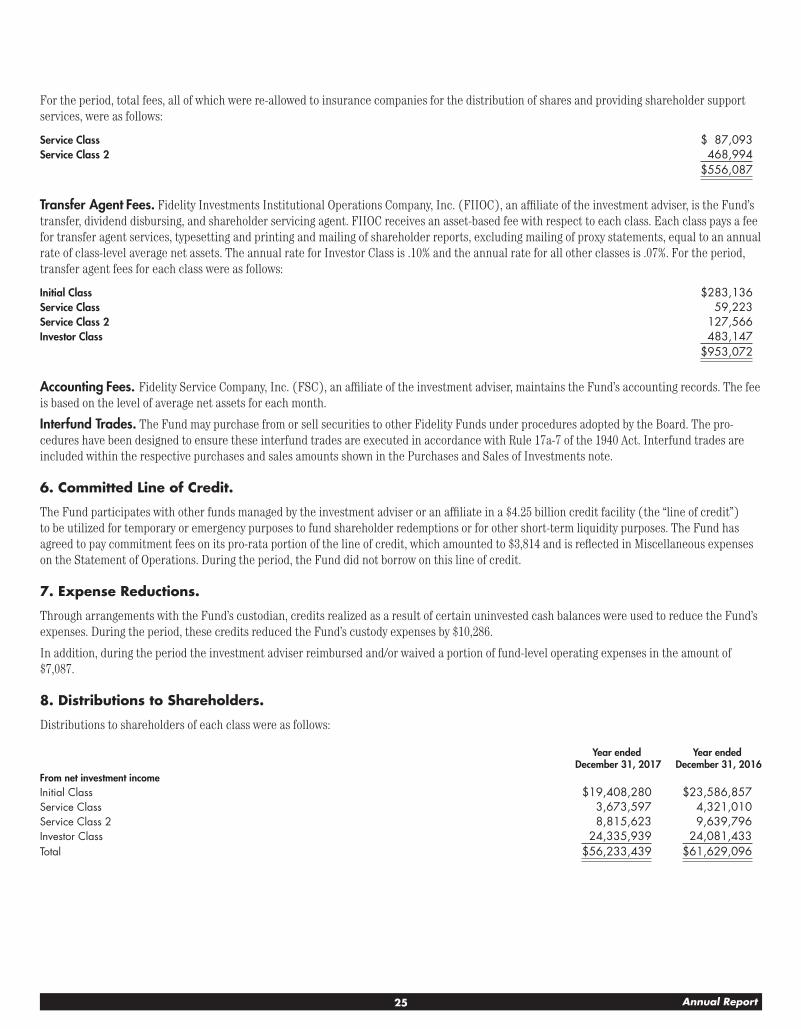
For the period, total fees, all of which were re-allowed to insurance companies for the distribution of shares and providing shareholder support services, were as follows:
Service Class $ 87,093Service Class 2 468,994
$ 556,087
Transfer Agent Fees. Fidelity Investments Institutional Operations Company, Inc. (FIIOC), an affiliate of the investment adviser, is the Fund’s transfer, dividend disbursing, and shareholder servicing agent. FIIOC receives an asset-based fee with respect to each class. Each class pays a fee for transfer agent services, typesetting and printing and mailing of shareholder reports, excluding mailing of proxy statements, equal to an annual rate of class-level average net assets. The annual rate for Investor Class is .10% and the annual rate for all other classes is .07%. For the period, transfer agent fees for each class were as follows:
Initial Class $ 283,136Service Class 59,223Service Class 2 127,566Investor Class 483,147
$ 953,072
Accounting Fees. Fidelity Service Company, Inc. (FSC), an affiliate of the investment adviser, maintains the Fund’s accounting records. The fee is based on the level of average net assets for each month.
Interfund Trades. The Fund may purchase from or sell securities to other Fidelity Funds under procedures adopted by the Board. The pro-cedures have been designed to ensure these interfund trades are executed in accordance with Rule 17a-7 of the 1940 Act. Interfund trades are included within the respective purchases and sales amounts shown in the Purchases and Sales of Investments note.
6. Committed Line of Credit.
The Fund participates with other funds managed by the investment adviser or an affiliate in a $4.25 billion credit facility (the “line of credit”) to be utilized for temporary or emergency purposes to fund shareholder redemptions or for other short-term liquidity purposes. The Fund has agreed to pay commitment fees on its pro-rata portion of the line of credit, which amounted to $3,814 and is reflected in Miscellaneous expenses on the Statement of Operations. During the period, the Fund did not borrow on this line of credit.
7. Expense Reductions.
Through arrangements with the Fund’s custodian, credits realized as a result of certain uninvested cash balances were used to reduce the Fund’s expenses. During the period, these credits reduced the Fund’s custody expenses by $10,286.
In addition, during the period the investment adviser reimbursed and/or waived a portion of fund-level operating expenses in the amount of $7,087.
8. Distributions to Shareholders.
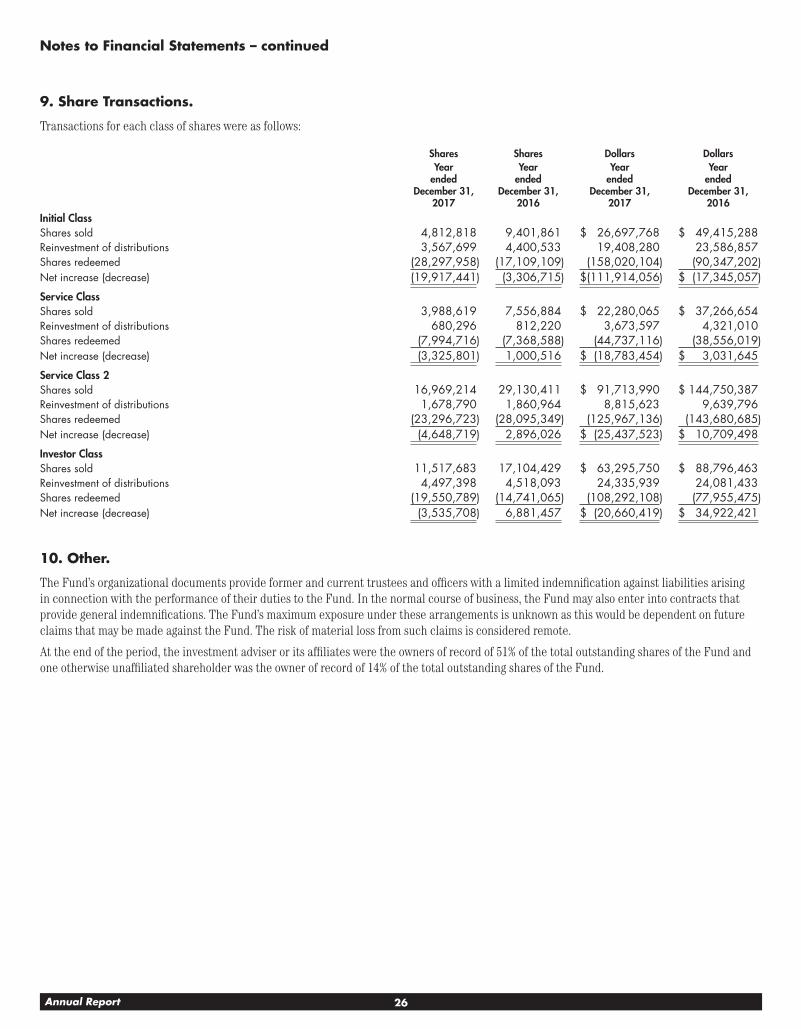
Distributions to shareholders of each class were as follows:
Year ended December 31, 2017
Year ended December 31, 2016
From net investment incomeInitial Class $ 19,408,280 $ 23,586,857Service Class 3,673,597 4,321,010Service Class 2 8,815,623 9,639,796Investor Class 24,335,939 24,081,433Total $ 56,233,439 $ 61,629,096
26Annual Report
Notes to Financial Statements – continued
9. Share Transactions.
Transactions for each class of shares were as follows:
Shares Shares Dollars DollarsYear
ended December 31,
2017
Year ended
December 31, 2016
Year ended
December 31, 2017
Year ended
December 31, 2016
Initial Class Shares sold 4,812,818 9,401,861 $ 26,697,768 $ 49,415,288Reinvestment of distributions 3,567,699 4,400,533 19,408,280 23,586,857Shares redeemed (28,297,958) (17,109,109) (158,020,104) (90,347,202)Net increase (decrease) (19,917,441) (3,306,715) $ (111,914,056) $ (17,345,057)
Service Class Shares sold 3,988,619 7,556,884 $ 22,280,065 $ 37,266,654Reinvestment of distributions 680,296 812,220 3,673,597 4,321,010Shares redeemed (7,994,716) (7,368,588) (44,737,116) (38,556,019)Net increase (decrease) (3,325,801) 1,000,516 $ (18,783,454) $ 3,031,645
Service Class 2 Shares sold 16,969,214 29,130,411 $ 91,713,990 $ 144,750,387Reinvestment of distributions 1,678,790 1,860,964 8,815,623 9,639,796Shares redeemed (23,296,723) (28,095,349) (125,967,136) (143,680,685)Net increase (decrease) (4,648,719) 2,896,026 $ (25,437,523) $ 10,709,498
Investor Class Shares sold 11,517,683 17,104,429 $ 63,295,750 $ 88,796,463Reinvestment of distributions 4,497,398 4,518,093 24,335,939 24,081,433Shares redeemed (19,550,789) (14,741,065) (108,292,108) (77,955,475)Net increase (decrease) (3,535,708) 6,881,457 $ (20,660,419) $ 34,922,421
10. Other.
The Fund’s organizational documents provide former and current trustees and officers with a limited indemnification against liabilities arising in connection with the performance of their duties to the Fund. In the normal course of business, the Fund may also enter into contracts that provide general indemnifications. The Fund’s maximum exposure under these arrangements is unknown as this would be dependent on future claims that may be made against the Fund. The risk of material loss from such claims is considered remote.
At the end of the period, the investment adviser or its affiliates were the owners of record of 51% of the total outstanding shares of the Fund and one otherwise unaffiliated shareholder was the owner of record of 14% of the total outstanding shares of the Fund.
27 Annual Report
Report of Independent Registered Public Accounting Firm
To the Board of Trustees of Variable Insurance Products Fund and Shareholders of VIP High Income Portfolio:
Opinion on the Financial StatementsWe have audited the accompanying statement of assets and liabilities, including the schedule of investments, of VIP High Income Portfolio (one of the funds constituting Variable Insurance Products Fund, referred to hereafter as the “Fund”) as of December 31, 2017, the related state-ment of operations for the year ended December 31, 2017, the statement of changes in net assets for each of the two years in the period ended December 31, 2017, including the related notes, and the financial highlights for each of the five years in the period ended December 31, 2017 (col-lectively referred to as the “financial statements”). In our opinion, the financial statements present fairly, in all material respects, the financial position of the Fund as of December 31, 2017, the results of its operations for the year then ended, the changes in its net assets for each of the two years in the period ended December 31, 2017 and the financial highlights for each of the five years in the period ended December 31, 2017 in conformity with accounting principles generally accepted in the United States of America.
Basis for OpinionThese financial statements are the responsibility of the Fund’s management. Our responsibility is to express an opinion on the Fund’s financial statements based on our audits. We are a public accounting firm registered with the Public Company Accounting Oversight Board (United States) (“PCAOB”) and are required to be independent with respect to the Fund in accordance with the U.S. federal securities laws and the applicable rules and regulations of the Securities and Exchange Commission and the PCAOB.
We conducted our audits of these financial statements in accordance with the standards of the PCAOB. Those standards require that we plan and perform the audit to obtain reasonable assurance about whether the financial statements are free of material misstatement, whether due to error or fraud.
Our audits included performing procedures to assess the risks of material misstatement of the financial statements, whether due to error or fraud, and performing procedures that respond to those risks. Such procedures included examining, on a test basis, evidence regarding the amounts and disclosures in the financial statements. Our audits also included evaluating the accounting principles used and significant esti-mates made by management, as well as evaluating the overall presentation of the financial statements. Our procedures included confirmation of securities owned as of December 31, 2017 by correspondence with the custodian, agent banks and brokers; when replies were not received from brokers, we performed other auditing procedures. We believe that our audits provide a reasonable basis for our opinion.
PricewaterhouseCoopers LLP Boston, Massachusetts February 15, 2018 We have served as the auditor of one or more investment companies in the Fidelity group of funds since 1932.
28Annual Report
Trustees and Officers
The Trustees, Members of the Advisory Board (if any), and officers of the trust and fund, as applicable, are listed below. The Board of Trustees governs the fund and is responsible for protecting the interests of shareholders. The Trustees are experienced executives who meet periodically throughout the year to oversee the fund’s activities, review contractual arrangements with companies that provide services to the fund, oversee management of the risks associated with such activities and contractual arrangements, and review the fund’s performance. Except for Jonathan Chiel, each of the Trustees oversees 190 funds. Mr. Chiel oversees 145 funds.
The Trustees hold office without limit in time except that (a) any Trustee may resign; (b) any Trustee may be removed by written instrument, signed by at least two-thirds of the number of Trustees prior to such removal; (c) any Trustee who requests to be retired or who has become incapacitated by illness or injury may be retired by written instrument signed by a majority of the other Trustees; and (d) any Trustee may be removed at any special meeting of shareholders by a two-thirds vote of the outstanding voting securities of the trust. Each Trustee who is not an interested person (as defined in the 1940 Act) of the trust and the fund is referred to herein as an Independent Trustee. Each Independent Trustee shall retire not later than the last day of the calendar year in which his or her 75th birthday occurs. The Independent Trustees may waive this mandatory retirement age policy with respect to individual Trustees. Officers and Advisory Board Members hold office without limit in time, except that any officer or Advisory Board Member may resign or may be removed by a vote of a majority of the Trustees at any regular meeting or any special meeting of the Trustees. Except as indicated, each individual has held the office shown or other offices in the same company for the past five years.
The fund’s Statement of Additional Information (SAI) includes more information about the Trustees. To request a free copy, call Fidelity at 1-877-208-0098.
Experience, Skills, Attributes, and Qualifications of the Trustees. The Governance and Nominating Committee has adopted a statement of policy that describes the experience, qualifications, attributes, and skills that are necessary and desirable for potential Independent Trustee can-didates (Statement of Policy). The Board believes that each Trustee satisfied at the time he or she was initially elected or appointed a Trustee, and continues to satisfy, the standards contemplated by the Statement of Policy. The Governance and Nominating Committee also engages professional search firms to help identify potential Independent Trustee candidates who have the experience, qualifications, attributes, and skills consistent with the Statement of Policy. From time to time, additional criteria based on the composition and skills of the current Independent Trustees, as well as experience or skills that may be appropriate in light of future changes to board composition, business conditions, and regula-tory or other developments, have also been considered by the professional search firms and the Governance and Nominating Committee. In addition, the Board takes into account the Trustees’ commitment and participation in Board and committee meetings, as well as their leadership of standing and ad hoc committees throughout their tenure.
In determining that a particular Trustee was and continues to be qualified to serve as a Trustee, the Board has considered a variety of criteria, none of which, in isolation, was controlling. The Board believes that, collectively, the Trustees have balanced and diverse experience, qualifica-tions, attributes, and skills, which allow the Board to operate effectively in governing the fund and protecting the interests of shareholders. Information about the specific experience, skills, attributes, and qualifications of each Trustee, which in each case led to the Board’s conclusion that the Trustee should serve (or continue to serve) as a trustee of the fund, is provided below.
Board Structure and Oversight Function. James C. Curvey is an interested person and currently serves as Chairman. The Trustees have determined that an interested Chairman is appropriate and benefits shareholders because an interested Chairman has a personal and profes-sional stake in the quality and continuity of services provided to the fund. Independent Trustees exercise their informed business judgment to appoint an individual of their choosing to serve as Chairman, regardless of whether the Trustee happens to be independent or a member of management. The Independent Trustees have determined that they can act independently and effectively without having an Independent Trustee serve as Chairman and that a key structural component for assuring that they are in a position to do so is for the Independent Trustees to constitute a substantial majority for the Board. The Independent Trustees also regularly meet in executive session. Ned C. Lautenbach serves as Chairman of the Independent Trustees and as such (i) acts as a liaison between the Independent Trustees and management with respect to matters important to the Independent Trustees and (ii) with management prepares agendas for Board meetings.
Fidelity® funds are overseen by different Boards of Trustees. The fund’s Board oversees Fidelity’s high income and certain equity funds, and other Boards oversee Fidelity’s investment-grade bond, money market, asset allocation, and sector funds. The asset allocation funds may invest in Fidelity® funds overseen by the fund’s Board. The use of separate Boards, each with its own committee structure, allows the Trustees of each group of Fidelity® funds to focus on the unique issues of the funds they oversee, including common research, investment, and operational issues. On occasion, the separate Boards establish joint committees to address issues of overlapping consequences for the Fidelity® funds overseen by each Board.
The Trustees operate using a system of committees to facilitate the timely and efficient consideration of all matters of importance to the Trustees, the fund, and fund shareholders and to facilitate compliance with legal and regulatory requirements and oversight of the fund’s activities and associated risks. The Board, acting through its committees, has charged FMR and its affiliates with (i) identifying events or circumstances the occurrence of which could have demonstrably adverse effects on the fund’s business and/or reputation; (ii) implementing processes and controls to lessen the possibility that such events or circumstances occur or to mitigate the effects of such events or circumstances if they do occur; and (iii) creating and maintaining a system designed to evaluate continuously business and market conditions in order to facilitate the identification and implementation processes described in (i) and (ii) above. Because the day-to-day operations and activities of the fund are carried out by or through FMR, its affiliates, and other service providers, the fund’s exposure to risks is mitigated but not eliminated by the processes overseen
29 Annual Report
by the Trustees. While each of the Board’s committees has responsibility for overseeing different aspects of the fund’s activities, oversight is exercised primarily through the Operations, Audit, and Compliance Committees. In addition, the Independent Trustees have worked with FMR to enhance the Board’s oversight of investment and financial risks, legal and regulatory risks, technology risks, and operational risks, including the development of additional risk reporting to the Board. For example, a working group comprised of Independent Trustees and FMR has worked and continues to work to review the Fidelity®funds’ valuation-related activities, reporting and risk management. Appropriate personnel, includ-ing but not limited to the fund’s Chief Compliance Officer (CCO), FMR’s internal auditor, the independent accountants, the fund’s Treasurer and portfolio management personnel, make periodic reports to the Board’s committees, as appropriate, including an annual review of Fidelity’s risk management program for the Fidelity®funds. The responsibilities of each standing committee, including their oversight responsibilities, are described further under “Standing Committees of the Trustees.”
Interested Trustees*:
Correspondence intended for a Trustee who is an interested person may be sent to Fidelity Investments, 245 Summer Street, Boston, Massachusetts 02210.
Name, Year of Birth; Principal Occupations and Other Relevant Experience+
Jonathan Chiel (1957)
Year of Election or Appointment: 2016 Trustee
Mr. Chiel also serves as Trustee of other Fidelity® funds. Mr. Chiel is Executive Vice President and General Counsel for FMR LLC (diversified financial services company, 2012-present). Previously, Mr. Chiel served as general counsel (2004-2012) and senior vice president and deputy general counsel (2000-2004) for John Hancock Financial Services; a partner with Choate, Hall & Stewart (1996-2000) (law firm); and an Assistant United States Attorney for the United States Attorney’s Office of the District of Massachusetts (1986-95), including Chief of the Criminal Division (1993-1995). Mr. Chiel is a director on the boards of the Boston Bar Foundation and the Maimonides School.
James C. Curvey (1935)
Year of Election or Appointment: 2007 Trustee Chairman of the Board of Trustees
Mr. Curvey also serves as Trustee of other Fidelity® funds. Mr. Curvey is a Director of Fidelity Research & Analysis Co. (invest-ment adviser firm, 2009-present), and Vice Chairman (2007-present) and Director of FMR LLC (diversified financial services company). In addition, Mr. Curvey serves as an Overseer for the Boston Symphony Orchestra and a member of the board of Artis-Naples, Naples, Florida, and as a Trustee for Brewster Academy, Wolfeboro, New Hampshire. Previously, Mr. Curvey served as a Director of Fidelity Investments Money Management, Inc. (investment adviser firm, 2009-2014) and a Director of FMR and FMR Co., Inc. (investment adviser firms, 2007-2014).
Charles S. Morrison (1960)
Year of Election or Appointment: 2014 Trustee
Mr. Morrison also serves as Trustee of other funds. He serves as President of Fidelity SelectCo, LLC (investment adviser firm, 2017-present) and Fidelity Management & Research Company (FMR) (investment adviser firm, 2016-present), a Director of Fidelity Investments Money Management, Inc. (FIMM) (investment adviser firm, 2014-present), Director of Fidelity SelectCo, LLC (investment adviser firm, 2014-present), President, Asset Management (2014-present), and is an employee of Fidelity Investments. Previously, Mr. Morrison served as Vice President of Fidelity’s Fixed Income and Asset Allocation Funds (2012-2014), President, Fixed Income (2011-2014), Vice President of Fidelity’s Money Market Funds (2005-2009), President, Money Market Group Leader of FMR (investment adviser firm, 2009), and Senior Vice President, Money Market Group of FMR (2004-2009). Mr. Morrison also served as Vice President of Fidelity’s Bond Funds (2002-2005), certain Balanced Funds (2002-2005), and certain Asset Allocation Funds (2002-2007), and as Senior Vice President (2002-2005) of Fidelity’s Bond Division.
* Determined to be an “Interested Trustee” by virtue of, among other things, his or her affiliation with the trust or various entities under common control with FMR.
+ The information includes the Trustee’s principal occupation during the last five years and other information relating to the experience, attri-butes, and skills relevant to the Trustee’s qualifications to serve as a Trustee, which led to the conclusion that the Trustee should serve as a Trustee for the fund.
30Annual Report
Trustees and Officers – continued
Independent Trustees:
Correspondence intended for an Independent Trustee may be sent to Fidelity Investments, P.O. Box 55235, Boston, Massachusetts 02205-5235.
Name, Year of Birth; Principal Occupations and Other Relevant Experience+
Dennis J. Dirks (1948)
Year of Election or Appointment: 2005 Trustee
Mr. Dirks also serves as Trustee of other Fidelity® funds. Prior to his retirement in May 2003, Mr. Dirks was Chief Operating Officer and a member of the Board of The Depository Trust & Clearing Corporation (DTCC). He also served as President, Chief Operating Officer, and Board member of The Depository Trust Company (DTC) and President and Board member of the National Securities Clearing Corporation (NSCC). In addition, Mr. Dirks served as Chief Executive Officer and Board member of the Government Securities Clearing Corporation, Chief Executive Officer and Board member of the Mortgage-Backed Securities Clearing Corporation, as a Trustee and a member of the Finance Committee of Manhattan College (2005-2008), as a Trustee and a member of the Finance Committee of AHRC of Nassau County (2006-2008), as a member of the Independent Directors Council (IDC) Governing Council (2010-2015), and as a member of the Board of Directors for The Brookville Center for Children’s Services, Inc. (2009-2017). Mr. Dirks is a member of the Finance Committee (2016-present) and Board of Directors (2017-present) of the Asolo Repertory Theatre.
Alan J. Lacy (1953)
Year of Election or Appointment: 2008 Trustee
Mr. Lacy also serves as Trustee of other Fidelity® funds. Mr. Lacy serves as a Director of Bristol-Myers Squibb Company (global pharmaceuticals, 2008-present). He is a Trustee of the California Chapter of The Nature Conservancy (2015-present) and a Director of the Center for Advanced Study in the Behavioral Sciences at Stanford University (2015-present). In addition, Mr. Lacy served as Senior Adviser (2007-2014) of Oak Hill Capital Partners, L.P. (private equity) and also served as Chief Executive Officer (2005) and Vice Chairman (2005-2006) of Sears Holdings Corporation (retail) and Chief Executive Officer and Chairman of the Board of Sears, Roebuck and Co. (retail, 2000-2005). Previously, Mr. Lacy served as Chairman (2014-2017) and a member (2010-2017) of the Board of Directors of Dave & Buster’s Entertainment, Inc. (restaurant and entertain-ment complexes), as Chairman (2008-2011) and a member (2006-2015) of the Board of Trustees of the National Parks Conservation Association, and as a member of the Board of Directors for The Hillman Companies, Inc. (hardware wholesal-ers, 2010-2014), Earth Fare, Inc. (retail grocery, 2010-2014), and The Western Union Company (global money transfer, 2006-2011).
Ned C. Lautenbach (1944)
Year of Election or Appointment: 2000 Trustee Chairman of the Independent Trustees
Mr. Lautenbach also serves as Trustee of other Fidelity® funds. Mr. Lautenbach currently serves as Vice Chair of the Board of Governors, State University System of Florida (2013-present) and is a member of the Council on Foreign Relations (1994-pres-ent). He is also a member and has most recently served as Chairman of the Board of Directors of Artis-Naples (2012-pres-ent). Previously, Mr. Lautenbach served as a member and then Lead Director of the Board of Directors of Eaton Corporation (diversified industrial, 1997-2016). He was also a Partner and Advisory Partner at Clayton, Dubilier & Rice, LLC (private equity investment, 1998-2010), as well as a Director of Sony Corporation (2006-2007). In addition, Mr. Lautenbach also had a 30-year career with IBM (technology company) during which time he served as Senior Vice President and a member of the Corporate Executive Committee (1968-1998).
Joseph Mauriello (1944)
Year of Election or Appointment: 2008 Trustee
Mr. Mauriello also serves as Trustee of other Fidelity® funds. Prior to his retirement in January 2006, Mr. Mauriello served in numerous senior management positions including Deputy Chairman and Chief Operating Officer (2004-2005), and Vice Chairman of Financial Services (2002-2004) of KPMG LLP US (professional services, 1965-2005). Mr. Mauriello currently serves as a member of the Board of Directors of XL Group plc. (global insurance and re-insurance, 2006-present) and the Independent Directors Council (IDC) Governing Council (2015-present). Previously, Mr. Mauriello served as a Director of the Hamilton Funds of the Bank of New York (2006-2007) and of Arcadia Resources Inc. (health care services and products, 2007-2012).
31 Annual Report
Cornelia M. Small (1944)
Year of Election or Appointment: 2005 Trustee
Ms. Small also serves as Trustee of other Fidelity® funds. Ms. Small is a member of the Board of Directors (2009-present) and Chair of the Investment Committee (2010-present) of the Teagle Foundation. Ms. Small also serves on the Investment Committee of the Berkshire Taconic Community Foundation (2008-present). Previously, Ms. Small served as Chairperson (2002-2008) and a member of the Investment Committee and Chairperson (2008-2012) and a member of the Board of Trustees of Smith College. In addition, Ms. Small served as Chief Investment Officer, Director of Global Equity Investments, and a member of the Board of Directors of Scudder, Stevens & Clark and Scudder Kemper Investments.
William S. Stavropoulos (1939)
Year of Election or Appointment: 2001 Trustee Vice Chairman of the Independent Trustees
Mr. Stavropoulos also serves as Trustee of other Fidelity® funds. Mr. Stavropoulos serves as President and Founder of the Michigan Baseball Foundation, the Great Lakes Loons (2007-present). Mr. Stavropoulos is Chairman Emeritus of the Board of Directors of The Dow Chemical Company, where he previously served in numerous senior management positions, includ-ing President, CEO (1995-2000; 2002-2004), Chairman of the Executive Committee (2000-2006), and as a member of the Board of Directors (1990-2006). Currently, Mr. Stavropoulos is Chairman of the Board of Directors of Univar Inc. (global distributor of commodity and specialty chemicals), a Director of Teradata Corporation (data warehousing and technology solutions), and a member of the Advisory Board for Metalmark Capital LLC (private equity investment, 2005-present). Mr. Stavropoulos is an operating advisor to Clayton, Dubilier & Rice, LLC (private equity investment). In addition, Mr. Stavropoulos is a member of the University of Notre Dame Advisory Council for the College of Science, a Trustee of the Rollin L. Gerstacker Foundation, and a Director of Artis-Naples in Naples, Florida. Previously, Mr. Stavropoulos served as a Director of Chemical Financial Corporation (bank holding company, 1993-2012) and Tyco International, Ltd. (multinational manufacturing and services, 2007-2012).
David M. Thomas (1949)
Year of Election or Appointment: 2008 Trustee
Mr. Thomas also serves as Trustee of other Fidelity® funds. Mr. Thomas serves as Non-Executive Chairman of the Board of Directors of Fortune Brands Home and Security (home and security products, 2011-present), as a member of the Board of Directors (2004-present) and Presiding Director (2013-present) of Interpublic Group of Companies, Inc. (marketing communi-cation), and as a member of the Board of Trustees of the University of Florida (2013-present). Previously, Mr. Thomas served as Executive Chairman (2005-2006) and Chairman and Chief Executive Officer (2000-2005) of IMS Health, Inc. (pharma-ceutical and healthcare information solutions), and a Director of Fortune Brands, Inc. (consumer products, 2000-2011).
+ The information includes the Trustee’s principal occupation during the last five years and other information relating to the experience, attri-butes, and skills relevant to the Trustee’s qualifications to serve as a Trustee, which led to the conclusion that the Trustee should serve as a Trustee for the fund.
Advisory Board Members and Officers:
Correspondence intended for an officer or Peter S. Lynch may be sent to Fidelity Investments, 245 Summer Street, Boston, Massachusetts 02210. Officers appear below in alphabetical order.
Name, Year of Birth; Principal Occupation
Peter S. Lynch (1944)
Year of Election or Appointment: 2003 Member of the Advisory Board
Mr. Lynch also serves as Member of the Advisory Board of other Fidelity® funds. Mr. Lynch is Vice Chairman and a Director of FMR (investment adviser firm) and FMR Co., Inc. (investment adviser firm). In addition, Mr. Lynch serves as a Trustee of Boston College and as the Chairman of the Inner-City Scholarship Fund. Previously, Mr. Lynch served on the Special Olympics International Board of Directors (1997-2006).
32Annual Report
Trustees and Officers – continued
Elizabeth Paige Baumann (1968)
Year of Election or Appointment: 2017 Anti-Money Laundering (AML) Officer
Ms. Baumann also serves as AML Officer of other funds. She is Chief AML Officer (2012-present) and Senior Vice President (2014-present) of FMR LLC (diversified financial services company) and is an employee of Fidelity Investments. Previously, Ms. Baumann served as AML Officer of the funds (2012-2016), and Vice President (2007-2014) and Deputy Anti-Money Laundering Officer (2007-2012) of FMR LLC.
Marc R. Bryant (1966)
Year of Election or Appointment: 2015 Secretary and Chief Legal Officer (CLO)
Mr. Bryant also serves as Secretary and CLO of other funds. Mr. Bryant serves as CLO, Secretary, and Senior Vice President of Fidelity Management & Research Company (investment adviser firm, 2015-present) and FMR Co., Inc. (investment adviser firm, 2015-present); Secretary of Fidelity SelectCo, LLC (investment adviser firm, 2015-present) and Fidelity Investments Money Management, Inc. (investment adviser firm, 2015-present); and CLO of Fidelity Management & Research (Hong Kong) Limited and FMR Investment Management (UK) Limited (investment adviser firms, 2015-present) and Fidelity Management & Research (Japan) Limited (investment adviser firm, 2016-present). He is Senior Vice President and Deputy General Counsel of FMR LLC (diversified financial services company). Previously, Mr. Bryant served as Secretary and CLO of Fidelity Rutland Square Trust II (2010-2014) and Assistant Secretary of Fidelity’s Fixed Income and Asset Allocation Funds (2013-2015). Prior to joining Fidelity Investments, Mr. Bryant served as a Senior Vice President and the Head of Global Retail Legal for AllianceBernstein L.P. (2006-2010), and as the General Counsel for ProFund Advisors LLC (2001-2006).
William C. Coffey (1969)
Year of Election or Appointment: 2009 Assistant Secretary
Mr. Coffey also serves as Assistant Secretary of other funds. He is Senior Vice President and Deputy General Counsel of FMR LLC (diversified financial services company, 2010-present), and is an employee of Fidelity Investments. Previously, Mr. Coffey served as Vice President and Associate General Counsel of FMR LLC (2005-2009).
Jonathan Davis (1968)
Year of Election or Appointment: 2010 Assistant Treasurer
Mr. Davis also serves as Assistant Treasurer of other funds. Mr. Davis serves as Assistant Treasurer of FMR Capital, Inc. (2017-present) and is an employee of Fidelity Investments. Previously, Mr. Davis served as Vice President and Associate General Counsel of FMR LLC (diversified financial services company, 2003-2010).
Adrien E. Deberghes (1967)
Year of Election or Appointment: 2016 Assistant Treasurer
Mr. Deberghes also serves as an officer of other funds. He serves as Assistant Treasurer of FMR Capital, Inc. (2017-present), Executive Vice President of Fidelity Investments Money Management, Inc. (FIMM) (investment adviser firm, 2016-present), and is an employee of Fidelity Investments (2008-present). Prior to joining Fidelity Investments, Mr. Deberghes was Senior Vice President of Mutual Fund Administration at State Street Corporation (2007-2008), Senior Director of Mutual Fund Administration at Investors Bank & Trust (2005-2007), and Director of Finance for Dunkin’ Brands (2000-2005). Previously, Mr. Deberghes served in other fund officer roles.
Stephanie J. Dorsey (1969)
Year of Election or Appointment: 2010 Assistant Treasurer
Ms. Dorsey also serves as an officer of other funds. Ms. Dorsey serves as Assistant Treasurer of FMR Capital, Inc. (2017-pres-ent), is an employee of Fidelity Investments (2008-present), and has served in other fund officer roles. Prior to joining Fidelity Investments, Ms. Dorsey served as Treasurer (2004-2008) of the JPMorgan Mutual Funds and Vice President (2004-2008) of JPMorgan Chase Bank.

33 Annual Report
Howard J. Galligan III (1966)
Year of Election or Appointment: 2014 Chief Financial Officer
Mr. Galligan also serves as Chief Financial Officer of other funds. Mr. Galligan serves as President of Fidelity Pricing and Cash Management Services (FPCMS) (2014-present) and as a Director of Strategic Advisers, Inc. (investment adviser firm, 2008-present). Previously, Mr. Galligan served as Chief Administrative Officer of Asset Management (2011-2014) and Chief Operating Officer and Senior Vice President of Investment Support for Strategic Advisers, Inc. (2003-2011).
Thomas C. Hense (1964)
Year of Election or Appointment: 2008, 2010, or 2015 Vice President
Mr. Hense serves as Vice President of Fidelity Advisor® Multi-Asset Income Fund (2015) and other funds (High Income (2008), Small Cap (2008), and Value (2010) funds), and is an employee of Fidelity Investments (1993-present). Previously, Mr. Hense served as a portfolio manager for Fidelity’s Institutional Money Management Group (Pyramis) (2003-2008).
Brian B. Hogan (1964)
Year of Election or Appointment: 2009 Vice President
Mr. Hogan also serves as Trustee or Vice President of other funds. Mr. Hogan serves as a Director of FMR Investment Management (UK) Limited (investment adviser firm, 2015-present) and Fidelity SelectCo, LLC (investment adviser firm, 2014-present) and President of the Equity Division of FMR (investment adviser firm, 2009-present). Previously, Mr. Hogan served as Senior Vice President, Equity Research of FMR (2006-2009) and as a portfolio manager. Mr. Brian B. Hogan is not related to Mr. Colm A. Hogan.
Colm A. Hogan (1973)
Year of Election or Appointment: 2016 Deputy Treasurer
Mr. Hogan also serves as an officer of other funds. Mr. Hogan serves as Assistant Treasurer of FMR Capital, Inc. (2017-pres-ent) and is an employee of Fidelity Investments (2005-present). Mr. Colm A. Hogan is not related to Mr. Brian B. Hogan.
Chris Maher (1972)
Year of Election or Appointment: 2013 Assistant Treasurer
Mr. Maher serves as Assistant Treasurer of other funds. Mr. Maher is Vice President of Valuation Oversight, serves as Assistant Treasurer of FMR Capital, Inc. (2017-present), and is an employee of Fidelity Investments. Previously, Mr. Maher served as Vice President of Asset Management Compliance (2013), Vice President of the Program Management Group of FMR (invest-ment adviser firm, 2010-2013), and Vice President of Valuation Oversight (2008-2010).
Rieco E. Mello (1969)
Year of Election or Appointment: 2017 Assistant Treasurer
Mr. Mello also serves as Assistant Treasurer of other funds. Mr. Mello serves as Assistant Treasurer of FMR Capital, Inc. (2017-present) and is an employee of Fidelity Investments (1995-present).
Kenneth B. Robins (1969)
Year of Election or Appointment: 2016 Chief Compliance Officer
Mr. Robins also serves as an officer of other funds. Mr. Robins serves as Compliance Officer of Fidelity Management & Research Company and FMR Co., Inc. (investment adviser firms, 2016-present) and is an employee of Fidelity Investments (2004-present). Previously, Mr. Robins served as Executive Vice President of Fidelity Investments Money Management, Inc. (investment adviser firm, 2013-2016) and served in other fund officer roles.
34Annual Report
Trustees and Officers – continued
Stacie M. Smith (1974)
Year of Election or Appointment: 2016 President and Treasurer
Ms. Smith also serves as an officer of other funds. Ms. Smith serves as Assistant Treasurer of FMR Capital, Inc. (2017-pres-ent), is an employee of Fidelity Investments (2009-present), and has served in other fund officer roles. Prior to joining Fidelity Investments, Ms. Smith served as Senior Audit Manager of Ernst & Young LLP (accounting firm, 1996-2009). Previously, Ms. Smith served as Deputy Treasurer of certain Fidelity® funds (2013-2016).
Marc L. Spector (1972)
Year of Election or Appointment: 2016 Assistant Treasurer
Mr. Spector also serves as an officer of other funds. Mr. Spector serves as Assistant Treasurer of FMR Capital, Inc. (2017-pres-ent) and is an employee of Fidelity Investments (2016-present). Prior to joining Fidelity Investments, Mr. Spector served as Director at the Siegfried Group (accounting firm, 2013-2016), and prior to Siegfried Group as audit senior manager at Deloitte & Touche (accounting firm, 2005-2013).
Renee Stagnone (1975)
Year of Election or Appointment: 2016 Assistant Treasurer
Ms. Stagnone also serves as an officer of other funds. Ms. Stagnone serves as Assistant Treasurer of FMR Capital, Inc. (2017-present) and is an employee of Fidelity Investments (1997-present). Previously, Ms. Stagnone served as Deputy Treasurer of certain Fidelity® funds (2013-2016).
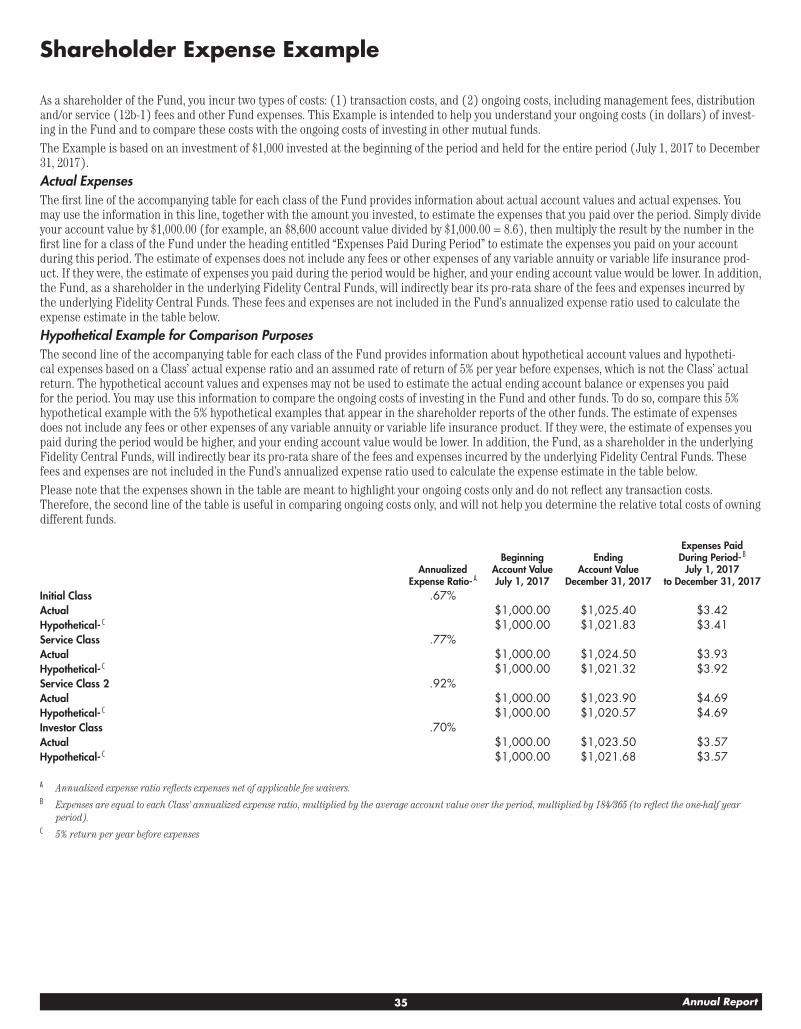
35 Annual Report
Shareholder Expense Example
As a shareholder of the Fund, you incur two types of costs: (1) transaction costs, and (2) ongoing costs, including management fees, distribution and/or service (12b-1) fees and other Fund expenses. This Example is intended to help you understand your ongoing costs (in dollars) of invest-ing in the Fund and to compare these costs with the ongoing costs of investing in other mutual funds.The Example is based on an investment of $1,000 invested at the beginning of the period and held for the entire period (July 1, 2017 to December 31, 2017).Actual ExpensesThe first line of the accompanying table for each class of the Fund provides information about actual account values and actual expenses. You may use the information in this line, together with the amount you invested, to estimate the expenses that you paid over the period. Simply divide your account value by $1,000.00 (for example, an $8,600 account value divided by $1,000.00 = 8.6), then multiply the result by the number in the first line for a class of the Fund under the heading entitled “Expenses Paid During Period” to estimate the expenses you paid on your account during this period. The estimate of expenses does not include any fees or other expenses of any variable annuity or variable life insurance prod-uct. If they were, the estimate of expenses you paid during the period would be higher, and your ending account value would be lower. In addition, the Fund, as a shareholder in the underlying Fidelity Central Funds, will indirectly bear its pro-rata share of the fees and expenses incurred by the underlying Fidelity Central Funds. These fees and expenses are not included in the Fund’s annualized expense ratio used to calculate the expense estimate in the table below.Hypothetical Example for Comparison PurposesThe second line of the accompanying table for each class of the Fund provides information about hypothetical account values and hypotheti-cal expenses based on a Class’ actual expense ratio and an assumed rate of return of 5% per year before expenses, which is not the Class’ actual return. The hypothetical account values and expenses may not be used to estimate the actual ending account balance or expenses you paid for the period. You may use this information to compare the ongoing costs of investing in the Fund and other funds. To do so, compare this 5% hypothetical example with the 5% hypothetical examples that appear in the shareholder reports of the other funds. The estimate of expenses does not include any fees or other expenses of any variable annuity or variable life insurance product. If they were, the estimate of expenses you paid during the period would be higher, and your ending account value would be lower. In addition, the Fund, as a shareholder in the underlying Fidelity Central Funds, will indirectly bear its pro-rata share of the fees and expenses incurred by the underlying Fidelity Central Funds. These fees and expenses are not included in the Fund’s annualized expense ratio used to calculate the expense estimate in the table below.Please note that the expenses shown in the table are meant to highlight your ongoing costs only and do not reflect any transaction costs. Therefore, the second line of the table is useful in comparing ongoing costs only, and will not help you determine the relative total costs of owning different funds.
Annualized Expense Ratio- A
Beginning Account Value July 1, 2017
Ending Account Value
December 31, 2017
Expenses Paid During Period- B
July 1, 2017 to December 31, 2017
Initial Class .67%Actual $1,000.00 $1,025.40 $3.42Hypothetical- C $1,000.00 $1,021.83 $3.41Service Class .77%Actual $1,000.00 $1,024.50 $3.93Hypothetical- C $1,000.00 $1,021.32 $3.92Service Class 2 .92%Actual $1,000.00 $1,023.90 $4.69Hypothetical- C $1,000.00 $1,020.57 $4.69Investor Class .70%Actual $1,000.00 $1,023.50 $3.57Hypothetical- C $1,000.00 $1,021.68 $3.57
A Annualized expense ratio reflects expenses net of applicable fee waivers.B Expenses are equal to each Class’ annualized expense ratio, multiplied by the average account value over the period, multiplied by 184/365 (to reflect the one-half year
period).C 5% return per year before expenses
36Annual Report
Board Approval of Investment Advisory Contracts and Management Fees
VIP High Income Portfolio
Each year, the Board of Trustees, including the Independent Trustees (together, the Board), votes on the renewal of the management contract with Fidelity Management & Research Company (FMR) and the sub-advisory agreements (together, the Advisory Contracts) for the fund. FMR and the sub-advisers are referred to herein as the Investment Advisers. The Board, assisted by the advice of fund counsel and Independent Trustees’ counsel, requests and considers a broad range of information relevant to the renewal of the Advisory Contracts throughout the year.
The Board meets regularly and, at each of its meetings, covers an extensive agenda of topics and materials and considers factors that are relevant to its annual consideration of the renewal of the fund’s Advisory Contracts, including the services and support provided to the fund and its share-holders. The Board has established various standing committees (Committees), each composed of and chaired by Independent Trustees with varying backgrounds, to which the Board has assigned specific subject matter responsibilities in order to enhance effective decision-making by the Board. The Board, acting directly and through its Committees, requests and receives information concerning the annual consideration of the renewal of the fund’s Advisory Contracts. The Board also meets as needed to review matters specifically related to the Board’s annual consider-ation of the renewal of the Advisory Contracts. Members of the Board may also meet with trustees of other Fidelity funds through ad hoc joint committees to discuss certain matters relevant to all of the Fidelity funds.
At its July 2017 meeting, the Board unanimously determined to renew the fund’s Advisory Contracts. In reaching its determination, the Board considered all factors it believed relevant, including (i) the nature, extent, and quality of the services to be provided to the fund and its share-holders (including the investment performance of the fund); (ii) the competitiveness of the fund’s management fee and total expense ratio relative to peer funds; (iii) the total costs of the services to be provided by and the profits to be realized by Fidelity from its relationships with the fund; and (iv) the extent to which, if any, economies of scale exist and would be realized as the fund grows, and whether any economies of scale are appropriately shared with fund shareholders.
In considering whether to renew the Advisory Contracts for the fund, the Board reached a determination, with the assistance of fund counsel and Independent Trustees’ counsel and through the exercise of its business judgment, that the renewal of the Advisory Contracts was in the best interests of the fund and its shareholders and that the compensation payable under the Advisory Contracts was fair and reasonable. The Board’s decision to renew the Advisory Contracts was not based on any single factor, but rather was based on a comprehensive consideration of all the information provided to the Board at its meetings throughout the year. The Board, in reaching its determination to renew the Advisory Contracts, was aware that shareholders of the fund have a broad range of investment choices available to them, including a wide choice among funds offered by Fidelity’s competitors, and that the fund’s shareholders, who have the opportunity to review and weigh the disclosure provided by the fund in its prospectus and other public disclosures, have chosen to invest in this fund, which is part of the Fidelity family of funds.
Amendment to Group Fee Rate. The Board also approved an amendment to the management contract for the fund to add an additional break-point to the group fee schedule, effective October 1, 2017. The Board noted that the additional breakpoint would result in lower management fee rates as Fidelity’s assets under management increase.
Nature, Extent, and Quality of Services Provided. The Board considered Fidelity’s staffing as it relates to the fund, including the back-grounds of investment personnel of Fidelity, and also considered the fund’s investment objective, strategies, and related investment philosophy. The Independent Trustees also had discussions with senior management of Fidelity’s investment operations and investment groups. The Board considered the structure of the investment personnel compensation program and whether this structure provides appropriate incentives to act in the best interests of the fund. Additionally, the Board considered the portfolio managers’ investments, if any, in the funds that they manage.
Resources Dedicated to Investment Management and Support Services. The Board and the Fund Oversight and Research Committees reviewed the general qualifications and capabilities of Fidelity’s investment staff, including its size, education, experience, and resources, as well as Fidelity’s approach to recruiting, training, managing, and compensating investment personnel. The Board noted that Fidelity has continued to increase the resources devoted to non-U.S. offices, including expansion of Fidelity’s global investment organization. The Board also noted that Fidelity’s analysts have extensive resources, tools and capabilities that allow them to conduct sophisticated quantitative and fundamental analysis, as well as credit analysis of issuers, counterparties and guarantors. Further, the Board considered that Fidelity’s investment profession-als have sufficient access to global information and data so as to provide competitive investment results over time, and that those professionals also have access to sophisticated tools that permit them to assess portfolio construction and risk and performance attribution characteristics continuously, as well as to transmit new information and research conclusions rapidly around the world. Additionally, in its deliberations, the Board considered Fidelity’s trading, risk management, compliance, and technology and operations capabilities and resources, which are integral parts of the investment management process.
Shareholder and Administrative Services. The Board considered (i) the nature, extent, quality, and cost of advisory, administrative, and share-holder services performed by the Investment Advisers and their affiliates under the Advisory Contracts and under separate agreements covering transfer agency, pricing and bookkeeping, and securities lending services for the fund; (ii) the nature and extent of the supervision of third party service providers, principally custodians, subcustodians, and pricing vendors; and (iii) the resources devoted to, and the record of compliance with, the fund’s compliance policies and procedures. The Board also reviewed the allocation of fund brokerage, including allocations to brokers
37 Annual Report
affiliated with the Investment Advisers, the use of brokerage commissions to pay fund expenses, and the use of “soft” commission dollars to pay for research services.
The Board noted that the growth of fund assets over time across the complex allows Fidelity to reinvest in the development of services designed to enhance the value or convenience of the Fidelity funds as investment vehicles. These services include 24-hour access to account information and market information through telephone representatives and over the Internet, investor education materials and asset allocation tools, and the expanded availability of Fidelity Investor Centers.
In 2014, the Board formed an ad hoc Committee on Transfer Agency Fees to review the variety of transfer agency fee structures throughout the industry and Fidelity’s competitive positioning with respect to industry participants.
Investment in a Large Fund Family. The Board considered the benefits to shareholders of investing in a Fidelity fund, including the benefits of investing in a fund that is part of a large family of funds offering a variety of investment disciplines and providing a large variety of mutual fund investor services. The Board noted that Fidelity had taken, or had made recommendations that resulted in the Fidelity funds taking, a number of actions over the previous year that benefited particular funds, including: (i) continuing to dedicate additional resources to Fidelity’s invest-ment research process, and to the support of the senior management team that oversees asset management; (ii) continuing efforts to enhance Fidelity’s global research capabilities; (iii) launching new funds and making other enhancements to meet client needs; (iv) launching new share classes of existing funds; (v) eliminating purchase minimums and broadening eligibility requirements for certain lower-priced share classes; (vi) reducing management fees and total expenses for certain growth equity funds and index funds; (vii) lowering expense caps for certain existing funds and classes to reduce expenses borne by shareholders; (viii) eliminating short-term redemption fees for certain funds; (ix) introducing a new pricing structure for certain funds of funds that is expected to reduce overall expenses paid by shareholders; (x) rationalizing product lines and gaining increased efficiencies through proposals for fund mergers and share class consolidations; (xi) continuing to develop, acquire and implement systems and technology to improve services to the funds and shareholders, strengthen information security, and increase efficiency; and (xii) implementing enhancements to further strengthen Fidelity’s product line to increase investors’ probability of success in achieving their investment goals, including retirement income goals.
Investment Performance. The Board considered whether the fund has operated in accordance with its investment objective, as well as its record of compliance with its investment restrictions and its performance history.
The Board took into account discussions with representatives of the Investment Advisers about fund investment performance that occur at Board meetings throughout the year. In this regard the Board noted that as part of regularly scheduled fund reviews and other reports to the Board on fund performance, the Board considers annualized return information for the fund for different time periods, measured against a securities market index (“benchmark index”) and a peer group of funds with similar objectives (“peer group”), if any. In its evaluation of fund investment performance, the Board gave particular attention to information indicating changes in performance of certain Fidelity funds for specific time periods and discussed with the Investment Advisers the reasons for any overperformance or underperformance.
In addition to reviewing absolute and relative fund performance, the Independent Trustees periodically consider the appropriateness of fund performance metrics in evaluating the results achieved. In general, the Independent Trustees believe that fund performance should be evaluated based on net performance (after fees and expenses) of both the highest performing and lowest performing fund share classes, where applicable, compared to appropriate benchmark indices, over appropriate time periods that may include full market cycles, and compared to peer groups, as applicable, over the same periods, taking into account relevant factors including the following: general market conditions; issuer-specific infor-mation; and fund cash flows and other factors.
The Independent Trustees recognize that shareholders evaluate performance on a net basis over their own holding periods, for which one-, three-, and five-year periods are often used as a proxy. For this reason, the performance information reviewed by the Board also included net cumulative calendar year total return information for the fund and an appropriate benchmark index and peer group for the most recent one-, three-, and five-year periods, as shown below. Returns are shown compared to the 25th percentile (top of box, 75% beaten) and 75th percentile (bottom of box, 25% beaten) of the peer universe.
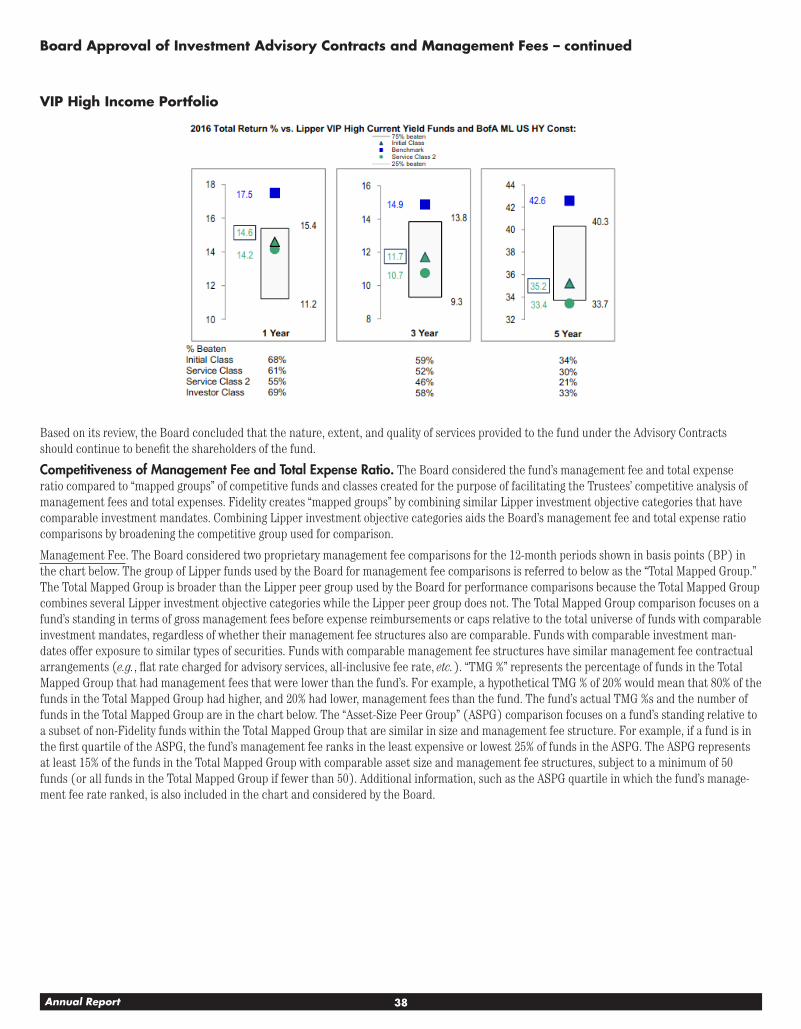
38Annual Report
Board Approval of Investment Advisory Contracts and Management Fees – continued
VIP High Income Portfolio
Based on its review, the Board concluded that the nature, extent, and quality of services provided to the fund under the Advisory Contracts should continue to benefit the shareholders of the fund.
Competitiveness of Management Fee and Total Expense Ratio. The Board considered the fund’s management fee and total expense ratio compared to “mapped groups” of competitive funds and classes created for the purpose of facilitating the Trustees’ competitive analysis of management fees and total expenses. Fidelity creates “mapped groups” by combining similar Lipper investment objective categories that have comparable investment mandates. Combining Lipper investment objective categories aids the Board’s management fee and total expense ratio comparisons by broadening the competitive group used for comparison.
Management Fee. The Board considered two proprietary management fee comparisons for the 12-month periods shown in basis points (BP) in the chart below. The group of Lipper funds used by the Board for management fee comparisons is referred to below as the “Total Mapped Group.” The Total Mapped Group is broader than the Lipper peer group used by the Board for performance comparisons because the Total Mapped Group combines several Lipper investment objective categories while the Lipper peer group does not. The Total Mapped Group comparison focuses on a fund’s standing in terms of gross management fees before expense reimbursements or caps relative to the total universe of funds with comparable investment mandates, regardless of whether their management fee structures also are comparable. Funds with comparable investment man-dates offer exposure to similar types of securities. Funds with comparable management fee structures have similar management fee contractual arrangements (e.g., flat rate charged for advisory services, all-inclusive fee rate, etc.). “TMG %” represents the percentage of funds in the Total Mapped Group that had management fees that were lower than the fund’s. For example, a hypothetical TMG % of 20% would mean that 80% of the funds in the Total Mapped Group had higher, and 20% had lower, management fees than the fund. The fund’s actual TMG %s and the number of funds in the Total Mapped Group are in the chart below. The “Asset-Size Peer Group” (ASPG) comparison focuses on a fund’s standing relative to a subset of non-Fidelity funds within the Total Mapped Group that are similar in size and management fee structure. For example, if a fund is in the first quartile of the ASPG, the fund’s management fee ranks in the least expensive or lowest 25% of funds in the ASPG. The ASPG represents at least 15% of the funds in the Total Mapped Group with comparable asset size and management fee structures, subject to a minimum of 50 funds (or all funds in the Total Mapped Group if fewer than 50). Additional information, such as the ASPG quartile in which the fund’s manage-ment fee rate ranked, is also included in the chart and considered by the Board.
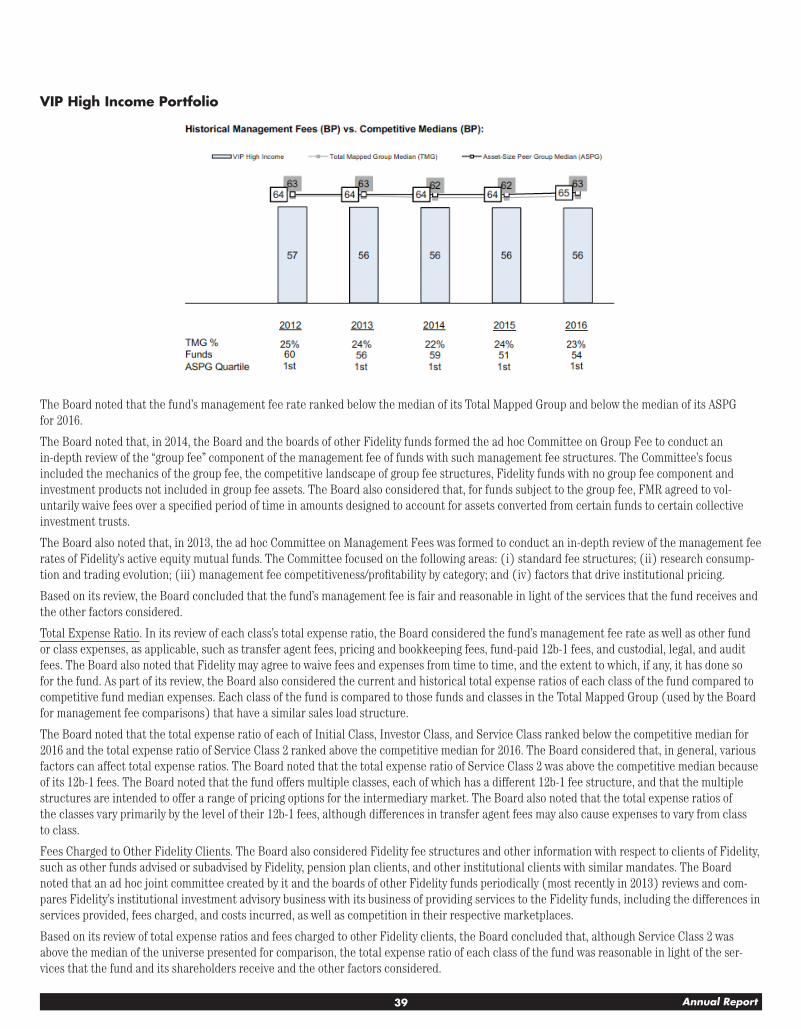
39 Annual Report
VIP High Income Portfolio
The Board noted that the fund’s management fee rate ranked below the median of its Total Mapped Group and below the median of its ASPG for 2016.
The Board noted that, in 2014, the Board and the boards of other Fidelity funds formed the ad hoc Committee on Group Fee to conduct an in-depth review of the “group fee” component of the management fee of funds with such management fee structures. The Committee’s focus included the mechanics of the group fee, the competitive landscape of group fee structures, Fidelity funds with no group fee component and investment products not included in group fee assets. The Board also considered that, for funds subject to the group fee, FMR agreed to vol-untarily waive fees over a specified period of time in amounts designed to account for assets converted from certain funds to certain collective investment trusts.
The Board also noted that, in 2013, the ad hoc Committee on Management Fees was formed to conduct an in-depth review of the management fee rates of Fidelity’s active equity mutual funds. The Committee focused on the following areas: (i) standard fee structures; (ii) research consump-tion and trading evolution; (iii) management fee competitiveness/profitability by category; and (iv) factors that drive institutional pricing.
Based on its review, the Board concluded that the fund’s management fee is fair and reasonable in light of the services that the fund receives and the other factors considered.
Total Expense Ratio. In its review of each class’s total expense ratio, the Board considered the fund’s management fee rate as well as other fund or class expenses, as applicable, such as transfer agent fees, pricing and bookkeeping fees, fund-paid 12b-1 fees, and custodial, legal, and audit fees. The Board also noted that Fidelity may agree to waive fees and expenses from time to time, and the extent to which, if any, it has done so for the fund. As part of its review, the Board also considered the current and historical total expense ratios of each class of the fund compared to competitive fund median expenses. Each class of the fund is compared to those funds and classes in the Total Mapped Group (used by the Board for management fee comparisons) that have a similar sales load structure.
The Board noted that the total expense ratio of each of Initial Class, Investor Class, and Service Class ranked below the competitive median for 2016 and the total expense ratio of Service Class 2 ranked above the competitive median for 2016. The Board considered that, in general, various factors can affect total expense ratios. The Board noted that the total expense ratio of Service Class 2 was above the competitive median because of its 12b-1 fees. The Board noted that the fund offers multiple classes, each of which has a different 12b-1 fee structure, and that the multiple structures are intended to offer a range of pricing options for the intermediary market. The Board also noted that the total expense ratios of the classes vary primarily by the level of their 12b-1 fees, although differences in transfer agent fees may also cause expenses to vary from class to class.
Fees Charged to Other Fidelity Clients. The Board also considered Fidelity fee structures and other information with respect to clients of Fidelity, such as other funds advised or subadvised by Fidelity, pension plan clients, and other institutional clients with similar mandates. The Board noted that an ad hoc joint committee created by it and the boards of other Fidelity funds periodically (most recently in 2013) reviews and com-pares Fidelity’s institutional investment advisory business with its business of providing services to the Fidelity funds, including the differences in services provided, fees charged, and costs incurred, as well as competition in their respective marketplaces.
Based on its review of total expense ratios and fees charged to other Fidelity clients, the Board concluded that, although Service Class 2 was above the median of the universe presented for comparison, the total expense ratio of each class of the fund was reasonable in light of the ser-vices that the fund and its shareholders receive and the other factors considered.
40Annual Report
Board Approval of Investment Advisory Contracts and Management Fees – continued
Costs of the Services and Profitability. The Board considered the revenues earned and the expenses incurred by Fidelity in conducting the business of developing, marketing, distributing, managing, administering and servicing the fund and servicing the fund’s shareholders. The Board also considered the level of Fidelity’s profits in respect of all the Fidelity funds.
On an annual basis, Fidelity presents to the Board information about the profitability of its relationships with the fund. Fidelity calculates profit-ability information for each fund, as well as aggregate profitability information for groups of Fidelity funds and all Fidelity funds, using a series of detailed revenue and cost allocation methodologies which originate with the books and records of Fidelity on which Fidelity’s audited financial statements are based. The Audit Committee of the Board reviews any significant changes from the prior year’s methodologies.
PricewaterhouseCoopers LLP (PwC), independent registered public accounting firm and auditor to Fidelity and certain Fidelity funds, has been engaged annually by the Board as part of the Board’s assessment of Fidelity’s profitability analysis. PwC’s engagement includes the review and assessment of the methodologies used by Fidelity in determining the revenues and expenses attributable to Fidelity’s mutual fund business, and completion of agreed-upon procedures in respect of the mathematical accuracy of the fund profitability information and its conformity to established allocation methodologies. After considering PwC’s reports issued under the engagement and information provided by Fidelity, the Board concluded that while other allocation methods may also be reasonable, Fidelity’s profitability methodologies are reasonable in all material respects.
The Board also reviewed Fidelity’s non-fund businesses and potential fall-out benefits related to the mutual fund business as well as cases where Fidelity’s affiliates may benefit from or be related to the fund’s business.
The Board considered the costs of the services provided by and the profits realized by Fidelity in connection with the operation of the fund and was satisfied that the profitability was not excessive.
Economies of Scale. The Board considered whether there have been economies of scale in respect of the management of the Fidelity funds, whether the Fidelity funds (including the fund) have appropriately benefited from any such economies of scale, and whether there is potential for realization of any further economies of scale. The Board considered the extent to which the fund will benefit from economies of scale as assets grow through increased services to the fund, through waivers or reimbursements, or through fee or expense ratio reductions. The Board also noted that a committee (the Economies of Scale Committee) created by it and the boards of other Fidelity funds periodically (most recently in 2013) analyzes whether Fidelity attains economies of scale in respect of the management and servicing of the Fidelity funds, whether the Fidelity funds have appropriately benefited from such economies of scale, and whether there is potential for realization of any further economies of scale.
The Board recognized that the fund’s management contract incorporates a “group fee” structure, which provides for lower group fee rates as total group assets increase, and for higher group fee rates as total group assets decrease (with “group assets” defined to include fund assets under FMR’s management plus the assets of sector funds previously under FMR’s management). FMR calculates the group fee rates based on a tiered asset “breakpoint” schedule that varies based on asset class. The Board considered that the group fee is designed to deliver the benefits of economies of scale to fund shareholders when total Fidelity fund assets increase, even if assets of any particular fund are unchanged or have declined, because some portion of Fidelity’s costs are attributable to services provided to all Fidelity funds, and all funds benefit if those costs can be allocated among more assets. The Board concluded that, given the group fee structure, fund shareholders will benefit from lower management fees as group assets increase at the fund complex level, regardless of whether Fidelity achieves any such economies of scale.
The Board concluded, taking into account the analysis of the Economies of Scale Committee, that economies of scale, if any, are being appropri-ately shared between fund shareholders and Fidelity.
Additional Information Requested by the Board. In order to develop fully the factual basis for consideration of the Fidelity funds’ advisory contracts, the Board requested and received additional information on certain topics, including: (i) fund performance trends, in particular the underperformance of certain funds, and Fidelity’s long-term strategies for certain funds; (ii) Fidelity’s fund profitability methodology, profitability trends for certain funds, and the impact of certain factors on fund profitability results, including the impact of market trends on actively managed funds; (iii) the use of performance fees and the calculation of performance adjustments, including the impact of underperformance and fund outflows on performance adjustments; (iv) metrics for evaluating index fund performance; (v) Fidelity’s group fee structure, including the group fee breakpoint schedules; (vi) the terms of Fidelity’s contractual and voluntary expense cap arrangements with the funds; (vii) the methodology with respect to evaluating competitive fund data and peer group classifications and fee comparisons; (viii) the expense structures for different funds and classes; (ix) Fidelity’s arrangements with affiliated sub-advisers on behalf of the funds; (x) information regarding other accounts man-aged by Fidelity, including institutional accounts and collective investment trusts; (xi) recent changes to the fee structure for certain funds of funds; and (xii) the impact of the Department of Labor’s new fiduciary rule on the funds’ comparative expense information.
Based on its evaluation of all of the conclusions noted above, and after considering all factors it believed relevant, the Board concluded that the advisory fee structures are fair and reasonable, and that the fund’s Advisory Contracts should be renewed.

41 Annual Report

VIPHI-ANN-0218 1.540029.120