fertility differentials among migrants …...fertility differentials among migrants and non-migrants...
TRANSCRIPT
FERTILITY DIFFERENTIALS AMONG MIGRANTS AND NON-MIGRANTS INTHE PHILIPPINES
by: Ro-Ann A. BacalB.S.Commerce, Xavier University, 1977
Development Economics (Graduate Diploma), University of the Philippines, 1983
A thesis submitted in partial fulfillment of the requirements for the degree of Master of Arts in Demography at the Australian National University.
Canberra, Australia March, 1989

D E C L A R A T I O N
Except where otherwise indicated, this thesis is my own work.
Ro-Ann A. Bacal March, 1989

D E D I C A T I O N
For HIM...
who gifted Bill, Karma, Maureen and me
with baby Joshua Mario.
iv
A C K N O W L E D G M E N T S
It may be easy to decide on a research topic to undertake, but one needs the expertise to help figure out exactly what ought to be done in the various phases of thesis work. For this, I am indebted to several persons.
Dr. David Lucas (my supervisor) coached me from the start and provided advise during the critical stage of concept-building. He always found time to read even my sketchy drafts, always had an ear to listen to my ideas, and always had that ready pat-on-the-back, encouraging me to go on despite impending difficulties brought about by my pregnancy. Dr. Lado Ruzicka helped me improve my investigation by suggesting alternative analytical techniques, while Dr. Paul Meyer (my adviser) was generous with his time in checking the whole thesis before submission to the examiners. In the early phases of the work, useful tips were picked up during consultations with Dr. Michael Costello, Dr. Alan Gray, " Dr. Gavin Jones, Dr. Huw Jones, Dr. Charles Price, Dr. Christabel Young, and Ms. Josie Cabigon.
I am very grateful to Dr. Corazon Raymundo for allowing me to use the 1933 NDS dataset and for writing back when survey issues needed clarification. Thanks to Arlene Abueg who copied the NDS datatape in Manila and to Di Cook who did the subsetting and inputing on the mainframe in Australia. My heartfelt appreciation to Chris McMurray who edited the final draft in the quickest time possible and for
V
facilitating in finding a printing machine for the final reproduction of my paper. Thanks also to Ms. Shayne Walsh for giving her nod to use the centre's lazer printer and to John Donovan who helped me print some of the more problematic tables. I would not have finished this thesis as planned were it not for the kind assistance of Dr. Kim Streatfield in lending me one of his project's PC.
The opportunity of coming to Australia for a course in Demography was presented to me by Ms. Bridge Jayme. But I will always be grateful to my boss, Director Macario F. Saniel, Jr. (NEDA-Region X), who favourably endorsed myapplication and allowed me to be away from my post for two years. Many thanks also to DDG Florian Alburo who eventually approved my study leave.
I cannot fail to thank my friends who were there to lend a hand when I needed one, in whatever fix I was in. Mysincere thanks to Janet Antonio, Myrna Austria, Emily Cabegin, Abelle Cajita, Fariastuti, Susan Gascon, Beth Go, Miranda Korzy, Richard Makalew, Marian May, Lily Mugot, Nyan Myint, Merlyne Paunlagui, Nicky Peralta, Jo Roper, and Sunaryanto.
Throughout the course, I was constantly inspired by the support and love of my family. Without them, this sacrifice would have been meaningless.
Sa inyong lahat ang aking taos pusong pasasalamat!
Ro-Ann A. Bacal March, 1989
vi
A B S T R A C T
The main purpose of this study is to ascertain the extent to which the fertility of migrant women in the Philippines is different from that of non-migrants. The 1983 National Demographic Survey (NDS) was the source of data for attaining the objectives of this study and ascertaining: (1) the profile of migrants at the time of first move; (2) the characteristics of migrants and non-migrants at the time of survey; (3) differences in cumulative and current fertility behaviour according to migration status; (4) differences in average pregnancy intervals of migrants before and after their latest move with those of non-migrants; and (5) whether differences in the fertility pattern among the sampled currently married women was due to the moves they have made or some other explanatory variables. The primary investigation included the use of crosstabulations, standardizations, and multivariate analysis (specifically, multiple classification analysis).
Relatively minor support was accorded to the conceptual framework put forward by the study which was based on traditional concepts rationalizing the interrelationship between fertility and migration. The general pattern that emerged from the tables on cumulative fertility of migrants and non-migrants points to very little variation in the mean number of children ever born in younger ages but some distinct differences in older ages, even after controlling
vii
for education, labour force participation and contraceptive use status. The findings on current fertility, as demonstrated by the age-specific marital fertility rates, point to lower fertility among migrants whose place of destination was urban and higher fertility among those whose place of destination was rural. But again, the differences are not pronounced. When contrasting the pregnancy intervals of migrants after their latest move with the average pregnancy intervals of non-migrants, the findings illustrate the propensity of the latter to have longer pregnancy intervals. The resulting figures, however, reveal only slight differences between the two. This, more or less, concurs with the findings from the analysis of cumulative and current fertility. Finally, results of the multiple classification analysis indicate that migration had a negligible contribution to explaining the variations in cumulative fertility compared to the other socio-economic and demographic variables included in the model.
One possible conclusion is that migration does not in itself raise fertility rates by bringing high fertility women in urban areas. However, because migration is age selective and contributes to inflating the age groups in the peak reproductive years, it has the potential to raise the number of births in cities and contribute to the natural increase in urban growth. Hence, it may be worthwhile considering the strategy of using the country's population redistribution policy as a mechanism for fertility reduction.
viii
T A B L E O F C O N T E N T S
PAGEDeclaration.......................................... iiDedication........................................... iiiAcknowledgements..................................... ivAbstract............................................. viTable of Contents................................... viiiList of Tables....................................... xMap of the Philippines.............................. xiiCHAPTER
1. INTRODUCTION1.1 Background and Objectives............ 11.2 Source of Data....................... 41.3 Limitations of Data.................. 51.4 Organization of Thesis............... 7
2. REVIEW OF THEORETICAL ISSUES ANDLITERATURE2.1 Theoretical Issues
2.1.1 Selectivity Model............. 92.1.2 Disruption Model.............. 102.1.3 Adaptation Model.............. 11
2.2 Empirical Findings from PhilippineResearches........................... 12
3. CONCEPTUAL FRAMEWORK AND METHODSOF ANALYSIS3.1 Conceptual Framework ................ 163.2 Hypotheses........................... 183.3 Methods of Analysis.................. 193.4 Operational Definitions
3.4.1 Sub-Grouping byMigration Status............. 21
3.4.2 Dependent Variables...... 243.4.3 Independent Variables......... 25
4. A PROFILE OF MIGRANTS AND NON-MIGRANTS4.1 Characteristics of Migrants at the
Time of First Move4.1.1 Age Distribution.............. 284.1.2 Marital Status................ 3 04.1.3 Level of Education............ 3 24.1.4 Economic Activity............. 3 54.1.5 Reasons for Moving............ 39
4.2 Characteristics of Migrants andNon-Migrants at the Time of Survey4.2.1 Age Distribution.............. 424.2.2 Level of Education............ 444.2.3 Economic Activity............. 4 64.2.4 Age at First Marriage......... 484.2.5 Contraceptive Knowledge and
Use Status.................... 494.3 Summary.............................. 51
ix
5. CUMULATIVE AND CURRENT FERTILITY DIFFERENTIALS BETWEEN MIGRANTS AND NON-MIGRANTS5.1 Cumulative Fertility Differentials.... 56
5.1.1 Education, Fertility,and Migration................. 58
5.1.2 Labour Force Participation,Fertility and Migration....... 63
5.1.3 Contraceptive Use Status,Fertility and Migration....... 67
5.2 Current Fertility Differentials...... 696. PREGNANCY INTERVAL DIFFERENTIALS AND
MULTIPLE CLASSIFICATION ANALYSIS6.1 Pregnancy Interval Differentials..... 726.2 Multiple Classification Analysis of
Cumulative Fertility Among theSampled CMW.......................... 77
7. SUMMARY, CONCLUSIONS AND POLICY IMPLICATIONS 82
Figure 1. Conceptual Framework for the Study of Fertility Differentials Among Migrants and Non-Migrants............... 17
Appendix A. National Weights Applied inCalculations........................... 88
Appendix B. Definition of Urban and Rural Areas..... 89Appendix C. Detailed Sub-Classification of
Occupations............................ 9 0REFERENCES........................................... 92
X
L I S T O F T A B L E S
Table PAGE4.1 Age Distribution of Migrants at
the Time of First Move, By Migration Status................................ 2 9
4.2a Marital Status of Migrants at theTime of First Move, By Migration Status................................ 3 0
4.2b Marital Status of Migrants at theTime of First Move, By Year of FirstMove.................................. 31
4.3a Migrants by Level of Education at theTime of First Move, By Migration Status................................ 34
4.3b Cumulative Distribution of Migrants,By Level of Education at the Time of First Move............................ 34
4.3c Level of Education of Migrants at theTime of First Move, By year of First Move.................................. 3 6
4.4a Labour Force Participation of Migrants,At the Time of First Move............. 37
4.4b Labour Force Participation of Migrantsat the Time of First Move, By year of First Move............................ 38
4.5a Migrants' Main Reason for Moving toFirst Area of Destination, By Migration Status................................ 4 0
4.5b Migrants' Main Reason for Moving toFirst Area of Destination, By Year of First Move............................ 41
4.6 Age Distribution of Currently MarriedWomen at the Time of Survey, By Migration Status...................... 43
4.7a Level of Education of Currently MarriedWomen at the Time of Survey, By Migration Status...................... 45
4.7b Cumulative Distribution of CMW, ByLevel of Education at the Time of Survey, By Migration Status........... 4 6
4.8 Labour Force Participation of CMW at theTime of Survey, By Migration Status.... 47
xi
4.9 Age at First Marriage of CMW at theTime of Survey, By Migration Status.... 48
4.10 Contraceptive Knowledge/Use Statusof CMW at the Time of Survey, By Migration Status........ '.............. 50
5.1 Mean Number of Children Ever Born for Currently Married Women, By Age Group,By Migration Status................... 57
5.2 Mean Number of Children Ever Born for Currently Married Women, By Durationof Marriage, By Migration Status...... 58
5.3 Mean Number of Children Ever Born forCurrently Married Women, By Level of Education and Age Group............... 59
5.4a Mean Number of Children Ever Born forCurrently Married Women, By Economic Activity and Age Group................ 64
5.4b Mean Number of Children Ever Born forCurrently Married Women, By Type of Employment and Age Group.............. 66
5.5 Mean Number of Children Ever Born forCurrently Married Women, By Contraceptive Use Status and Age Group.............. 68
5.6 Age-Specific Marital Fertility Rates for Currently Married Women, By BroadAge Groups, By Migration Status....... 7 0
6.1 Pregnancy Intervals of Migrants and Non-Migrants, By Duration of Marriage..... 73
6.2a Distribution of Migrants and Non-Migrants, By Pregnancy Intervals...... 75
6.2b Cumulative Distribution of Migrantsand Non-Migrants, By Pregnancy Intervals.............................. 7 6
6.3 Two-Way Analysis of Variance ofCumulative Fertility Among Currently Married Women, Testing All Possible Two-Way Interactions.................. 78
5.10 Unadjusted and Adjusted Mean Number ofChildren Ever Born for Currently Married Women, By Selected Socio-Economic and Demographic Variables................. 80
xii
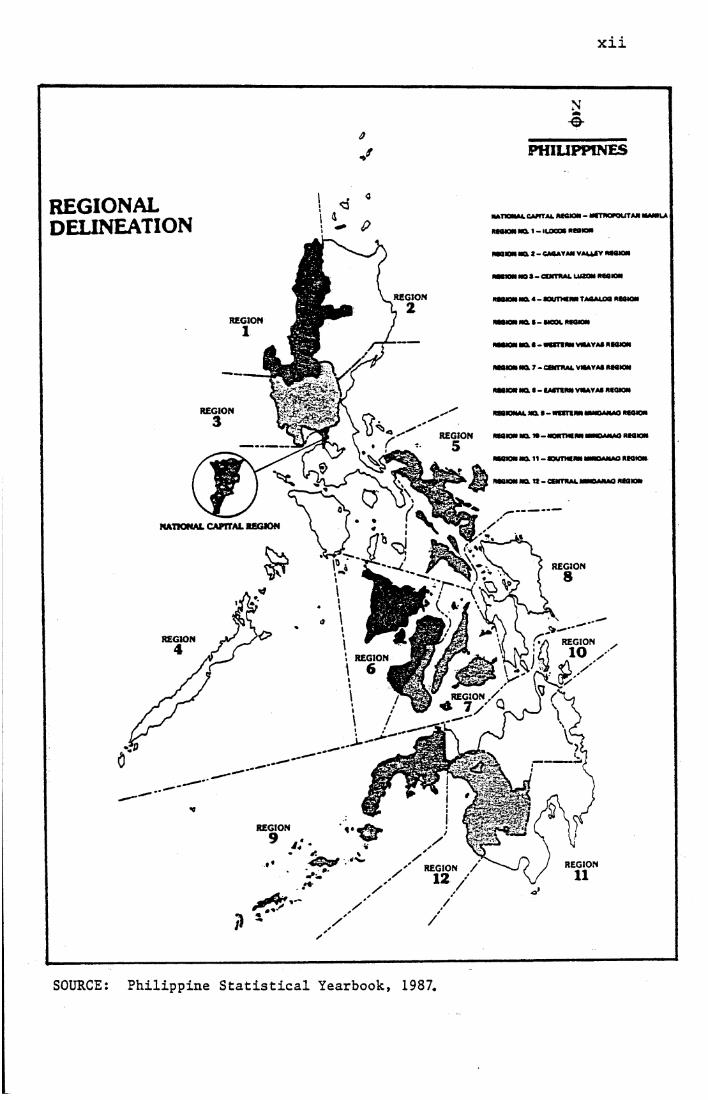
REGIONALDELINEATION
REGION1
N&
PHILIPPINES
M tnO M H , U H T M . ft*« IO« - MSTROPOUTAR MAMLA
ftMIOM NO. 1 - I LOCOS RMWW
M O I M l - C A S A V AM V A L U V M O M
W W W MO S - C H T 1 U I LUZON M S KM
W W W ML 4 - U m « « TA4AJL0Q ft «MOM
w ww w a s - wool rsoww
w w w wa • - w s m m vwAr as ftianw
W W W w a 7 - CSKTRAL VWAVAS RM W W
W W W NO. • - CAST1RW VWAVAS RM W W
W W M A L NCI S -W tS n R W M M W A M A O RM W W
ftcaw w w a i s - m o n thsrw w w m m o r m w w
RSOWW w a 11 - SOUTHS RW MNM3.U1I.0 RMWW
w w w wa a - c w n u i mmw.ia.i.0 rmww
REGION11
SOURCE: Philippine Statistical Yearbook 1987.
1
Chapter 1. INTRODUCTION
1.1 Background and ObjectivesThis study is but one in the growing field of social
science research attempting to examine migrant and nonmigrant fertility differentials. The special attention accorded to these sub-groups is born out of the greater incidence of internal migration occurring throughout the developing world in general, and in the Philippines in particular. While there is general agreement that most population mobility, particularly in developing countries, has its roots in a range of spatial, sectoral and class inequalities, there is some debate among researchers as to whether mobility in itself is serving to exacerbate those inequalities or acting to reduce them (Hugo, 1982:189).
In the Philippines, issues relating to urbanization and spatial development (both causes and consequences of internal migration) gained prominence by the late '70s, so much so that they became one of the government's priority areas of development policy by the early '80s. This concern was an offshoot of studies (Pernia et al., 1983) indicating shifts from frontierward to urbanward migration in the '60s and, subsequently, a more pronounced urban-industrial orientation of population movements in later years. The present pattern indicates a strong bias of movements towards the National Capital Region (Metropolitan Manila) and regional centres and is clearly manifested by the increased concentration of population contributed by migration to these areas. Between 1970 and 1980, for instance, it was estimated that 55 per
2
cent of Metro Manila's population growth was a result of migration (Concepcion, 1983:397). Currently, the major concern of planners is the apparently unabatable influx of people brought about by rural to urban and even urban to urban migration. Increasing numbers in cities and ooblaciones (i.e. the seat of municipal government and mostly the largest urban area in the municipality) mean increasing demands for jobs, housing, health care and other services and infrastructures which the government can ill-afford. Likewise, planners are beginning to look into the possible effects on the "quality" and composition of the population of sending areas as a result of out-migration.
Over and above these concerns is the growing interest among policy-makers in empirical evidence which suggests that movements of people operate selectively to affect fertility. For instance, studies in the Philippine setting (Hendershot, 1971; del Fierro, 1974; Hiday, 1978; Sudarsono, 1984), although done at the local level, generally confirm that rural to urban migrants have lower fertility than rural, at times even urban, non-migrants. Speculations have become rife as to whether urbanization and rural to urban migration bring about a reduction in fertility of the general population. If so, then strategies for population transfers from highly fertile rural areas to relatively low fertile urban areas may be a viable option for attempts by government at dealing with the country's population growth and redistribution problems. Moreover, if return migrants bring with them the lower fertility behaviour adapted from urban places, then they, serving as models for the non-migrant
3
rural population, can facilitate in lowering rural fertility (Goldstein and Goldstein, 1983).
Unlike previous surveys, the 1983 National Demographic Survey includes a migration history of repondents, providing researchers with the opportunity to take a more in-depth look at the consequences of internal migration at the national or country-wide level. Hence, this thesis, unlike previous studies on the interrelationship of migration and fertility, expands the investigation to consider urban and rural nonmigrants, migrants by stream and migrants by freguency of move. If differences in fertility behaviour are noted among rural/urban non-migrants and rural to urban migrants, will this observation hold true for other types of migrants as well?
In particular, the following objectives will be pursued:1. to present a profile of migrants at the time of first move and find out the extent to which migration is selective of people in terms of age, marital status, education, labour force participation;2. to compare the characteristics of migrants and nonmigrants at the time of survey and find out any differences in age, education, labour force participation, knowledge and use of contraceptive methods, and preferred family size;3. to ascertain any differences in cumulative fertility (controlling for selected socio-economic and demographic variables) and current fertility behaviour among migrants and non-migrants;
4
4. to contrast the average pregnancy intervals of migrants before and after their latest move with those of non-migrants; and5. to verify whether any difference in the fertility pattern among the sampled currently married women was due to the moves they have made or some other explanatory variables.
1•2 Source of DataThe primary data to be used in the study are the results
of the 1983 National Demographic Survey (NDS) conducted by the University of the Philippines Population Institute (UPPI) in cooperation with the Office of Population Studies of the University of San Carlos (OPS,USC) and the Research Institute for Mindanao Culture of Xavier University (RIMCU,XU). Aside from serving as a link to the 1968 and 1973 rounds of the NDS, data collected in 1983 were expanded to include information on the respondents' migration history, allowing a more comprehensive picture of lifetime and short-term movements within the country. This, along with data on household characteristics, pregnancy history, nuptiality, contraception and fertility preferences, provides a rich source of information for the study to be undertaken.
The sampling design of the 1983 NDS consists of a stratified two-stage sample wherein the primary sampling units, the baranaavs (i.e. the smallest political unit in the country) were selected, with replacement, and with probability proportional to the number of households per barangav. The households, as the secondary sampling units,
5
were sampled systematically with a random start. The eligible respondents were all ever-married women aged 15-49 years old belonging to the targeted households. A total of 13,000 households were selected, averaging 1,000 households for each of the 13 regions of the country. To compensate for over- or under-sampling in some barangays brought about by differing sampling fractions used for the urban and rural strata, the UPPI has specified weights to be applied when deriving population estimates from the survey (see Appendix A for weights applied in calculations and Appendix B for definitions of urban and rural areas).
1.3 Limitations of DataWhile the 1983 NDS provides a rich source of information
on migration for purposes of looking into lifetime, period, interregional movements as well as residential preferences, its major constraint is its sample size. Faced with a lengthy guestionnaire and a limited budget, the 1,000 households targeted for each region were divided into two groups such that ever-married women (EMW) aged 15-49 years in half or 500 of these households were administered the entire questionnaire (Group A) , while the remaining 500 households were not asked about their detailed migration, nuptiality and employment experiences (Group B) . In effect, only 5,400 of the total sample of EMW aged 15-49 is relevant for the study at hand.
Attempts at analyzing the interrelationship of migration and fertility, especially in exploring the selectivity theory require comparison of characteristics among or between
6
various types of migrants and non-migrants (whether rural or urban). It is obvious, therefore, how further breaking down these groups into various socio-economic and demographic characteristics could result in even smaller numbers. Hence, it was necessary to limit the categorization of some explanatory variables used in the study in order to be assured of a reasonable number of cases to be analyzed.
In verifying the characteristics of migrants and nonmigrants, one is also confronted with other limitations. For instance, while the 1983 NDS data provides information on the age, education, marital status and labour force participation of EMW at the time of move, these could only be compared with the characteristics of non-migrants at the time of survey. In relation to this, one common concern among researchers has been the extent to which data collected from respondents at the time of survey about their characteristics in the past (as outlined in the detailed migration histories) are representative of the population as a whole in the past (Goldstein and Goldstein, 1982:137). Since the sampling units covered in a survey are selected based on current criteria, they do not necessarily provide representative coverage of the various parts of the country in the past. Moreover, differences in mortality incidence among migrants and non-migrants, particularly among women with many children may bias the sample population as the survey could only capture the surviving population. These limitations, among others, must be borne in mind, especially in the presentation of differential characteristics of the respondents at the time of move and at the time of survey.
7
Since the respondents of the 1983 NDS are EMW aged 15- 49, the survey has, in effect, excluded women whose childbearing experiences may have started/occurred earlier or later than this age range. As well, it ignores never married women who may have conceived a child outside a legal marriage, although these are not believed to be numerous. In the present study, the unit of analysis is further confined to currently married women (CMW) aged 15-49. Preliminary exploration of the data show that 94 per cent of the total sampled women are currently married; four per cent, widowed; and two per cent, divorced or separated. Aside from the fact that CMW represent an overwhelming majority of the total sample, focusing on this group of women avoided shifts such as referring to CMW when discussing current fertility differentials and EMW when discussing cumulative fertility differentials. Furthermore, a comparison of crosstabulations of cumulative fertility of CMW and EMW showed minor differences.
1.4 Organization of ThesisThe study is organized as follows. The first chapter
presents an introduction and background to the study, its objectives, a brief description of the main source of data to be used, and a summary of data limitations encountered. Chapter 2 gives a review of the main theoretical issues that have become the basis of some of the concepts and propositions put forward by researchers regarding fertility differentials of migrants and non-migrants. It also presents the empirical findings of some studies done in the
8
Philippines. Chapter 3 specifies the conceptual framework adopted by the study, details the hypotheses tested, describes the methods of analysis performed, and provides a list of operational definitions of the dependent and independent variables examined. Chapter 4 gives ademographic and socio-economic profile of non-migrants and migrants, while Chapters 5 and 6 present the findings and analyses of the major issues confronted by the study. Lastly, Chapter 7 summarizes the whole thesis and outlines some policy implications that may be relevant for planners, decision-makers, and researchers.
9
Chapter 2. REVIEW OF THEORETICAL ISSUES AND RELEVANT LITERATURE
2.1 Theoretical IssuesBasically, three models are used to explain differences
in fertility patterns and levels among migrants and nonmigrants, viz: the selectivity model, the disruption model, and the adaptation model. The three differ largely from the point of view of whether fertility is affected before, during, or after the migration process.
2.1.1 SELECTIVITY MODELThe selectivity model assumes that migration is not a
random process but that migrants are ’’selected" at place of origin. Certain common characteristics in such variables as age, education, and occupation have been observed among individuals who had a higher propensity to move. The model contends that even when these characteristics are controlled, migrants continue to have lower fertility than non-migrants. In other words, even if the migrants had not moved, they would have lower fertility than the non-migrants in their place of origin.
Goldstein (1983:4) suggests that the rational behaviour that motivates individuals to move, especially to urban locations, may also lead them to restrict the size of their families. Macisco et al. (1970), on the other hand, view the selection of migrants as linked to various socio-economic factors thought to affect fertility through the "social mobility" model. Here, migration, particularly to urban areas, is perceived to be selective of persons with high
10
aspirations and the potential for upward mobility. Migrants, therefore, are likely to participate in and be influenced by the urban culture in their desire to "get ahead.1' As such, early marriage and the arrival of children are seen as obstacles to upward social improvement prompting migrants to postpone marriage and adopt contraception and other fertility-limiting practices.
Another interpretation of the selectivity model has been proposed by Ribe and Schultz (1980). They claim that when individuals from rural areas decide to move, the decision on whether to migrate to an urban area or remain in the rural sector is assumed to be influenced by their preferred family size. Those preferring a larger family would be more inclined to relocate in another rural area and those preferring a smaller family would be inclined to move to an urban area.
2.1.2 DISRUPTION MODELIt is possible that the migration process itself may
interfere with the fertility behaviour of migrants. Baker (1981) points out that the movements of couples may be sufficiently stressful from a socio-psychological perspective as to affect their physiological capacity to conceive and bear children. In trying to rationalize the dynamics of the disruption process, Ritchey and Stokes (1972) suggest this could be the result of anticipatory decisions by migrants to postpone childbearing to reduce the costs and logistic difficulties associated with migration. Shaw (1975) further suggests that migration, especially to urban areas, may be of
11
sufficient significance in a social sense so as to effect a change in age of entry into marital unions.
The disruption of fertility has been generally observed to be temporary and, eventually, the normal pace of fertility is expected to be resumed. In fact, the pace may accelerate to compensate for earlier delays in childbearing (Goldstein and Goldstein, 1983:7). Depending on its impact, the disruption effect on fertility could influence the total average number of children ever born.
2.1.3 ADAPTATION MODELIn contrast to the selectivity model that assumes
migrants have lower fertility than non-migrants, the adaptation model assumes that the fertility of migrants does not differ much from the population at place of origin. The model contends that migrants, particularly from rural areas, have higher fertility before and upon reaching their places of destination. In due time, as migrants become acquainted and at ease with the norms in the city, the tendency will be for them to adopt the behaviour, including lower fertility patterns, of their urban counterparts. The basis behind this model has been the observation that fertility in rural areas is generally higher than in urban areas and has been defended within the context of the "demographic transition" theory (Davis, 1963). Hence, the adaptation model is viewed as but a continuum of the process by which fertility and mortality are expected to decrease as industrialization and developmentincrease.
12
Through participation in the social and economic activities available at the place of destination, migrants are presumed to be subjected to various degrees of pressures relevant to decisions regarding family size. Therefore, they are likely to eventually shift their orientation towards fertility. Changes in fertility behaviour will vary with respect to differences in such socio-economic variables as income, education, labour force participation (Magnani, 1980:19). At the same time, the degree of similarity in terms of institutional supports for fertility between places of origin and destination would be influential in determining the extent to which migrants conform to the childbearing behaviour in cities (Zarate and Zarate, 1975).
2.2 Empirical Findings from Philippine ResearchesRelatively little work has been done in the Philippines
to investigate the interrelationship of migration and fertility. This is due primarily to the dearth of survey data that would permit a more meaningful testing of the theoretical issues just discussed. Prior to the NDS, studies along these lines were limited to local settings.
Hendershot's study (1971) of rural to urban migrants and urban natives was based on surveys conducted by UPPI in selected urban communities in Manila, and rural towns in Calasiao (Pangasinan) and Miagao (Iloilo). Results of the study indicate lower fertility of in-migrants originating in Northeastern Luzon and in the Panay island compared to "natives“ of Manila and has been attributed to the social mobility model. The findings, however, do not adequately
13
account for the means by which lower fertility is achieved; neither family planning nor later marriage provides an explanation.
In an attempt to reconcile the apparently contradictory findings in studies of migrant-native fertility differences, Hendershot suggests that there may be stages of urbanization which differ in the selective tendencies of rural-urban migration. In early urbanization, when poor transportation and communication systems make travelling costly, migration is highly selective and tends to producemigrant fertility below that of urban natives. Astransportation and communication networks become moreavailable and affordable, migrants are less selective andfertility approximates that of the rural population.
Del Fierro (1974), in his thesis focusing on rural migrants to and urban non-migrants of Cagayan de Oro City in Mindanao, states that the migration experience is conducive to lower fertility, particularly for young and recently married women. While urban natives possessed superior educational and occupational qualities to the migrants, lower fertility among the latter persisted. He admits, however, that his reliance on cumulative fertility was inadequate to relate childbearing to the timing of migration.
Hiday (1978) made use of a 1970 household survey by the Institute of Behavioural Science, University of Colorado conducted in Magsaysay and Matanao, Davao (Mindanao) to compare the fertility of rural sedentaries (non-movers), rural to rural migrants and rural to urban migrants. She
14
found that age-specific fertility rates and child-woman ratios depict a "declining gradient of fertility with social distance from the home communities;" that is, rural sedentary women have the highest fertility; rural to rural migrants, having experienced migration but not urbanization, have lower fertility; and rural to urban migrants, having experienced both migration and urbanization, have the lowest fertility. Urbanization, in general, appears to have a negative effect on fertility independent of migration.
A refined perspective of the fertility-migration interrelationship was suggested by Pernia (1981) using the 1973 NDS data through his "migration cycle" model. The model assumes that the fertility-migration relationship is not linear but U-shaped. That is, fertility prior to migration is relatively high but generally lower than the rural average, perhaps on account of selectivity. Upon arrival at destination, migrants temporarily experience dislocaton and difficulties which affect childbearing. Later, after adjustment to the area, childbearing becomes easier and fertility again increases as the couple tries to attain their desired family size. This finding suggests duration of residence as an alternative explanation for fertility differences among migrants and non-migrants.
Sudarsono (1984) using the 1980 and 1981 Philippine Migration Study data on migrants from Ilocos Norte to Manila and non-migrants in Ilocos Norte confirms the common finding that when age, duration of marriage, education and labour force status are controlled, migrants exhibit a lower average
15
number of living children compared to Ilocos non-migrants. If the inter-temporal aspect of migration is taken into consideration, however, an inverted U-shaped curve becomes apparent which seems to bear out the expectation of the migration cycle model.
16
Chapter 3. CONCEPTUAL FRAMEWORK and METHODS OF ANALYSIS
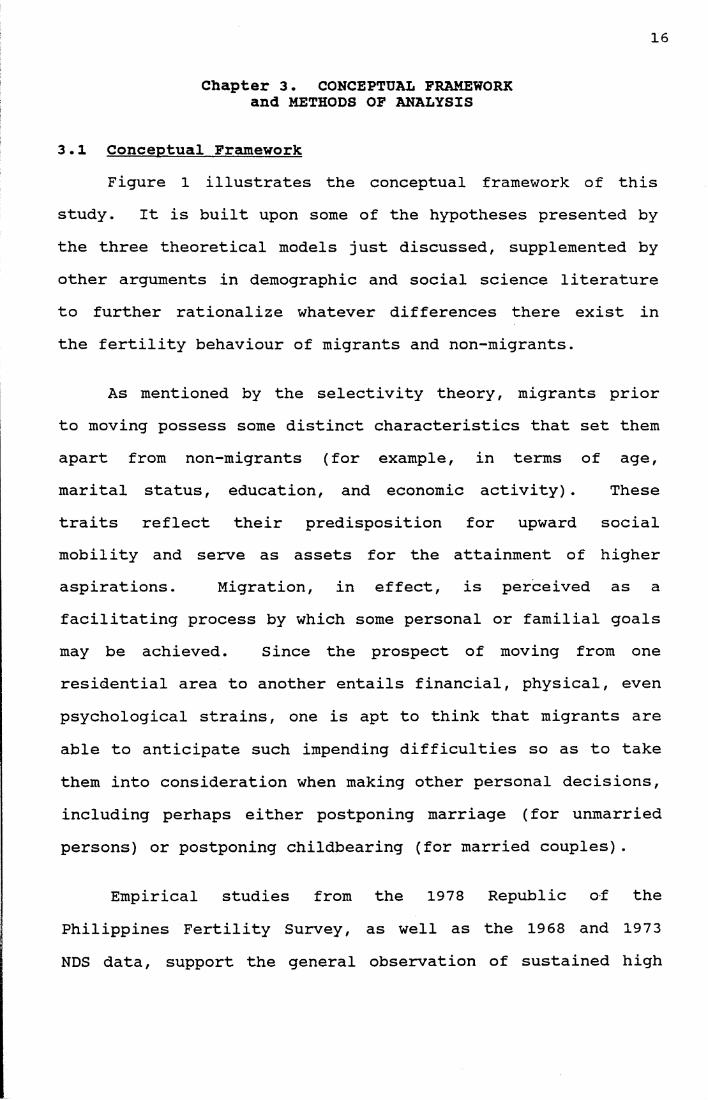
3.1 Conceptual FrameworkFigure 1 illustrates the conceptual framework of this
study. It is built upon some of the hypotheses presented by the three theoretical models just discussed, supplemented by other arguments in demographic and social science literature to further rationalize whatever differences there exist in the fertility behaviour of migrants and non-migrants.
As mentioned by the selectivity theory, migrants prior to moving possess some distinct characteristics that set them apart from non-migrants (for example, in terms of age, marital status, education, and economic activity). These traits reflect their predisposition for upward social mobility and serve as assets for the attainment of higher aspirations. Migration, in effect, is perceived as a facilitating process by which some personal or familial goals may be achieved. Since the prospect of moving from one residential area to another entails financial, physical, even psychological strains, one is apt to think that migrants are able to anticipate such impending difficulties so as to take them into consideration when making other personal decisions, including perhaps either postponing marriage (for unmarried persons) or postponing childbearing (for married couples).
Empirical studies from the 1978 Republic of the Philippines Fertility Survey, as well as the 1968 and 1973 NDS data, support the general observation of sustained high
SOCIAL M
OBIL
ITY
MIGR
ATIO
N DI
SRUP
TION
IN
ASPI
RATI
ONS
----
----
> DE
CISI
ON--
----
--> FE
RTIL
ITY/
NUPT
IALI
TY
17
gEh0*Wo%ou
CO >1-po •HEh W >O P •H< ■p -P
ÜP mw GEH 0 0H rH -H -H> nj -P ßH ■P flJ 0EH •H Ü cO <D P 2 oW rt T3 oni ß <l> <DWCO * * * *
oca•H«•aao5uO’T3cHA
AT3§*•H>T3C■U1)H-)<4A0•HA*COoU<4
(03Ou<4>
(4
C Q<4
incl
udin
g pl
ace
differentials, d
istance, k
inship n
etwork,
information
ri<
retu
rns
to a
nd p
erce
ived
val
ue o
f migration, e
tc.
(Lee,
1966), h
owever,
only
the "
social m
obil
ity
aspi
rations" f
actor
is c
aptured
in t
he f
ramewo
it i
s mo
re r
elev
ant
to t
he p
rese
nt s
tudy.
18
fertility patterns in rural areas and lower fertility in urban areas. Non-migrants, because of their constant exposure to the same social environment, are expected to take on the fertility behaviour prevailing in their residence of upbringing. Migrants, on the other hand, having been subjected to a new environment, different sets of values and norms, in due time will more likely alter their perceptions about the benefits and costs of children and, eventually, perhaps their family size preferences. This change or process of assimilation is viewed in this study as dependent upon the similarity or dissimilarity of the place of origin and destination, the duration of stay, and the frequency of moves made by the individuals. The impact of migration on fertility is assumed to be manifested in some of the intermediate variables (Davis and Blake, 1956) that directly affect fertility and ultimately reflect differences in either the cumulative or current fertility or even the pregnancy intervals of migrants and non-migrants.
3.2 HypothesesOn the basis of the above conceptual framework, the
following hypotheses will be tested using appropriate research and statistical methods:
1. Migrants are expected to consistently exhibit lower cumulative and current fertility compared to nonmigrants .2. Among the migrants, women whose place of destination is urban register lower fertility rates than women whose place of destination is rural. Furthermore, multiple
19
movers are expected to have lower fertility than onetime movers.3. Differences in fertility persist even when controlling for age, duration of marriage, education, labour force participation, and contraceptive use status.4. In examining their latest move, migrants have longer pregnancy intervals after (compared to intervals before) their migration experience, even when controlling for duration of marriage. Migrants are expected to have longer pregnancy intervals after the move compared to non-migrants.5. Migration has a significant impact as an explanatory variable for fertility differences among the currently married women in the study.
3.3 Methods of AnalysisIn verifying whether migrants are "selected1' in terms of
specific socio-economic and demographic characteristics even before the move, a brief profile of this group of CMW will be presented using crosstabulations. An analytical comparison will also be made between migrants and nonmigrants of socio-economic and demographic characteristics prevailing at the time of survey.
Crosstabulations will be utilized in presenting differences in cumulative and current fertility. In calculating the mean number of children ever born, as the indicator for cumulative fertility, the breakdown procedure with the crossbreak subcommand of the Statistical Package for
20
the Social Sciences (SPSS-X) is adopted. This proceduredisplays the means, standard deviations, and cell counts for a dependent variable (in this case, number of livebirths) across groups defined by one or more independent variables (SPSS-X, 1987). Current fertility, on the other hand, as denoted by the age-specific marital fertility rates, was calculated based on the number of livebirths of CMW in the different sub-groups in the past two years (1981 and 1982).
In examining pregnancy interval differentials, two approaches are pursued. One is calculating the average intervals experienced by the CMW, controlling for duration of marriage; and the other is determining the percentage distribution of women under various pregnancy intervals grouped into 12-month periods.
In order to determine which of the independentvariables, including migration status, would explain the differences in fertility among the CMW, a multivariate analysis is carried out. Multiple Classification Analysis (MCA) is a technique for examining the interrelationships between several predictor (independent) variables and a dependent variable within the context of an additive model (Andrews et.al, 1969) . One of its advantages is that it can handle even nominal variables that need to be used as predictors. A key feature of the MCA technique is its ability to show the effect of each predictor on the dependent variable both before and after taking into account the effects of all other variables (using the heirarchical approach) and the SPSS-X program specifically delivers an
21
output which is conveniently interpretable. Since the method assumes that the data are understandable in terms of an additive model, an important implication of this is that the program is insensitive to interaction, which may not be the case for the study under consideration. Hence, a two-way analysis of variance for testing two-way interactions of variables was undertaken. Fortunately, results of this testing by looking at the level of the F sign and by computing the ratio between the sum of square interaction over the sum of square mean effects (Soeradji and Hatmadji, 1985) revealed very minimal interactions between the pairs of independent variables and, therefore, can be ignored.
As mentioned in Chapter 1, the UPPI has specified weights (see Appendix A) to compensate for over- or undersampling in some barangays. These weights were utilized in generating crosstabulations and similar calculations.However, these were not used in the multivariate analysis (i.e. multiple classification analysis and analysis of variance) in order to avoid any distortions that may result from their application.
3.4 Operational Definitions3.4.1 SUB-GROUPING BY MIGRATION STATUS
The advantage of using migration history data is that detailed description of movements across time and space allows one to set up different criteria for defining and classifying migrants (Da Vanzo, 1982:98). Ironically, the richness of this type of data, particularly when related to other socio-economic and demographic changes experienced by
22
respondents in their lifetime, is often matched by their complexity. It may be necessary, therefore, to consider relating the time period to which relevant variables that are to be investigated refer to the timing of migration.
Based on previous fertility studies, demographers consider the common reproductive life span of women in the Philippines to be between the age groups 15-49 (or 45) years old. Since the survey reckons the migration experiences of the respondents from age 15, the latter has been considered as the starting point for determining the place of origin of migrants. All CMW who responded having changed their residence since age 15 and stayed in another place for at least three consecutive months for purposes of taking up residence on a more or less permanent basis are considered to be migrants. Movements included in the migration history include those wherein women cross well-defined boundaries at least at the barangav level (Cabegin, 1983:25).
Two major types of migrants are to be examined in the study: migrants by stream or choice of destination, and migrants by frequency or number of moves. Most of the researches on fertility differentials among migrants and nonmigrants are concentrated on the impact of the choice of destination on the behaviour of individuals. However, with so many cases of women experiencing several moves in their lifetimes, one cannot help but wonder whether it is in fact the frequency of migration experiences which affect the behaviour of individuals more. This study hopes to provide some answers to this question.
23
Migrants by stream are sub-classified into urban to urban (U-U), urban to rural (U-R), rural to rural (R-R), and rural to urban (R-U) migrants. For women who have moved only once in their lifetime, the type of place of origin will simply be the starting point at which movements were included in the survey (in this case, the place of residence at age 15) . However, for women with multiple moves, a problem arises as to which place of origin (and, therefore, type of origin) to pinpoint. Goldstein and Goldstein (1983:143) suggest considering the place of longest previous residence as the place of origin. But, with up to 11 migration experiences included in the 1983 NDS, complications arise when a woman has had the same duration for two or more previous residences or when differences in duration are only a few months. In order to make the analysis less complex and to allow a simpler program for retrieving data, the definition of streams has been confined to determining the place of residence at age 15 and the place of residence at the time of survey. The definition, albeit less refined, is appropriate, especially as the period in consideration (i.e. age 15 up to the age at time of survey) corresponds very conveniently with the woman's reproductive life span.
Migrants by frequency are classified into individuals who moved only once? moved more than once but returned to the previous place of residence at age 15 at the time of survey (return migrant); and moved more than once, always to a new place of residence (repeat migrant) . The idea is to take advantage of the wealth of information available from the
migration history and find out the possible impact of the number of moves a woman has made on her fertility, if any.
Non-migrants, on the other hand, include CMW who had never changed residence since age 15 up to the time of survey. They are sub-classified into urban and rural nonmigrants based on the type of residence at age 15.
3.4.2 DEPENDENT VARIABLESThe analysis of differentials in fertility behaviour
between and among the various sub-groups of CMW just enumerated will be performed by looking at their cumulative and current fertility levels, as well as their pregnancy intervals. The respondent's number of livebirths up to the time of survey (or children ever born) refers to cumulative fertility, while the number of livebirths in the past two years (in this case, 1981 and 1982) refers to current or period fertility. The former is derived by subtracting the CMW's pregnancy losses from their total pregnancies. Women who were never pregnant or who had had only stillbirths were considered as women with no livebirths, hence zero pregnancy. Pregnancy intervals, expressed in months, were calculated from the termination of one pregnancy (whether livebirth or stillbirth) to another. Note that the interval betweenmarriage and the first pregnancy was not included in the calculation in order to avoid complications brought about by some cases whereby the first pregnancy occurred before marriage (note that there were no cases wherein the second pregnancy occurred before marriage).
25
3.4.3 INDEPENDENT VARIABLESAmong the independent or explanatory variables used in
the study are the following:
Age - expressed in completed years, is the age of the woman as of last birthday.Age at first marriage - for women married only once, it is her age in completed years when she and her present husband married; for women married more than once, it is her age in completed years when her first marriage began. Marriage, as referred to in the 1983 NDS, includes both legal and consensual unions so that the reference date is when the couple started living together, whether solemnized by a formal rite or not. Duration of marriage - for women married only once, it is the period, expressed in completed years, from the beginning of her marriage and the survey year; while, for women married more than once, it is the period from the beginning of her first marriage and the survey year. Level of education - is the highest educational attainment of the women broken down into the following categories: none — no formal schooling; elementary —some or all primary schooling (Grades I to VII) ; high school — some or all secondary schooling and some vocational training; college — some college education without graduation, completed college degree, and postgraduate training. A more detailed breakdown is used when describing the profile of migrants and nonmigrants, whereas some categories needed to be combined
26
when analyzing cumulative fertility differentials because of a few cases in some cells.Labour force participation status - women were classified into those currently engaged in any economic activity and those not. The categories used here are "working" and "not working." Furthermore, working women were sub-classified as those having either "white- collar" jobs, referring to professional, proprietary, and high-status occupations, and "non-white collar" jobs, referring to all other types of jobs (see Appendix B for listings under these categories).Contraceptive knowledge and use status - women were divided into those who had never heard of any family planning (FP) method; women who had heard of at least one FP method but never tried any; women who were currently using any of the FP methods; and women who had tried at least one of the FP methods but were not currently using any. In the analysis of cumulative fertility, these were further merged into "never-user" and "ever-user." The former refers to CMW' who had never heard of (and, thus, never tried) plus those who had heard of but never tried any contraceptive method; while the latter refers to CMW who were currently using plus those who had tried by were not currently using contraceptive methods.
27
Chapter 4. A PROFILE OF MIGRANTS AND NON-MIGRANTS
This chapter presents a description of the currently married women (CMW) in the sample according to their migration status. The first part focuses on thecharacteristics of the various types of migrants at the time of first move after age 15 while the second part shows a comparative analysis of socio-economic and demographic characteristics of migrants and non-migrants at the time of survey. For the former, an attempt was also made todistinguish the migrants by year of move (grouped into the interval years 1948-1959 or '50s, 1960-1969 or '60s, and 1970-1982 or '70s) in order to compare any changes in the traits of migrant cohorts over the years.
Of the sampled CMW (5,092) calculated from the 198 3 NDS data, about half the total number are non-migrants (i.e. women who never changed residence since age 15) while the other half are migrants. Rural non-migrants outnumber urban non-migrants by 138 per cent reflecting the predominating spatial distribution of population in the Philippines. Applying the operational definitions adopted in this study (cf. Chapter 3) the migrants by stream are made up of the following: rural to rural (33%); urban to urban (29%) ; urban to rural (25%); and rural to urban (13%). Migrants by frequency, on the other hand, are composed of one-time (45%) ; multiple, repeat (37%); and multiple, return (18%) movers.
The increase in the proportion of urban to urban migrants is an interesting feature here as it manifests a
28
shift in the types of population transfer that have emerged in recent years. In her review of migration streams in the Philippines, Pascual (1966) pointed out that the main features of migration patterns during the period 1948-1960 were rural to rural (i.e. from old settlement areas to new areas which were considered pioneer and resettlement areas) and rural to urban (i.e. from rural areas to Manila, the primate city, and other major centers like Cebu and Davao). From 1960 to 1968, while rural to urban and rural to rural migration accounted for 46 and 39 per cent, respectively, of total lifetime inter-regional migration, the period saw an increase in urban to urban flows. Whether the current flow of movements reflect a change in the motivation of migrants, a shift in the demands of economic prospects being sought, or an indication of the development of the areas of destination are some issues that should be investigated with interest by social researchers.
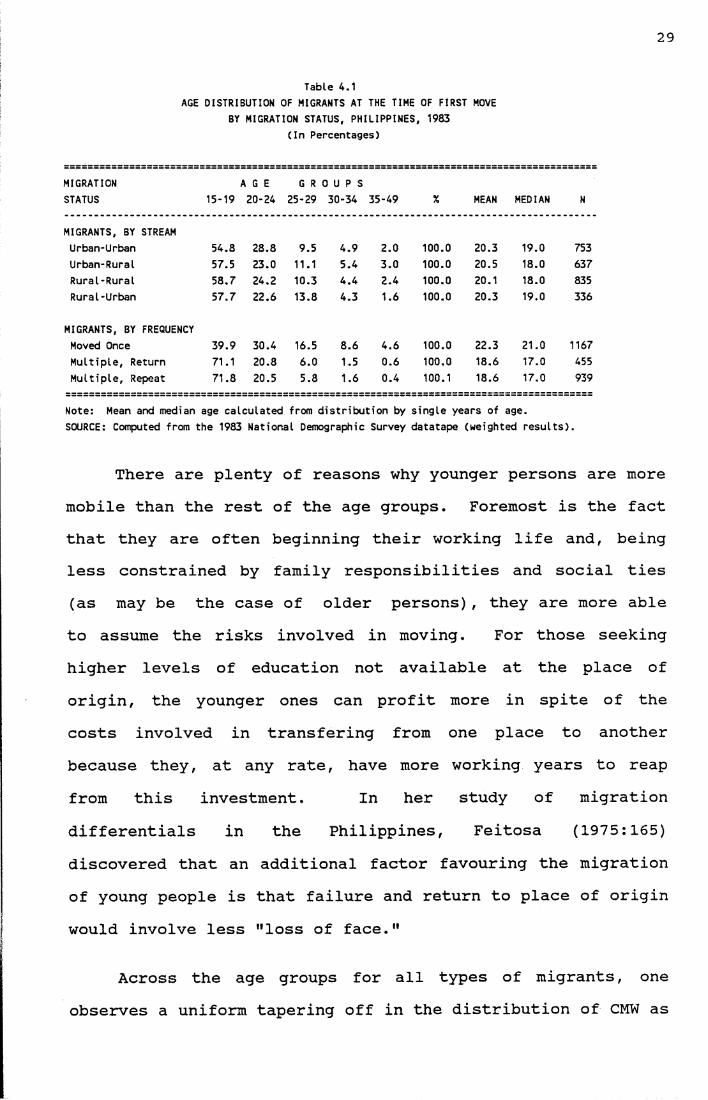
4.1 Characteristics of Migrants at the Time of First Move4.1.1 AGE DISTRIBUTION
The prevalent observation of age selectivity among migrants is evident in Table 4.1. Among migrants by stream, more than half of the CMW were between the ages 15-19, with rural to rural migrants claiming slightly more women in this age group than the rest. About 7 out of 10 multiple (return and repeat) migrants, on the other hand, were found in the 15-19 age group, contrasting significantly with 4 out of 10one-time movers.
29
Table 4.1AGE DISTRIBUTION OF MIGRANTS AT THE TIME OF FIRST MOVE
BY MIGRATION STATUS, PHILIPPINES, 1983 (In Percentages)
MIGRATIONSTATUS 15-19
A G E20-24
G R 25-29
0 U P S 30-34 35-49 % MEAN MEDIAN N
MIGRANTS, BY STREAMUrban-Urban 54.8 28.8 9.5 4.9 2.0 100.0 20.3 19.0 753Urban-Rural 57.5 23.0 11.1 5.4 3.0 100.0 20.5 18.0 637Rural-Rural 58.7 24.2 10.3 4.4 2.4 100.0 20.1 18.0 835Rural-Urban 57.7 22.6 13.8 4.3 1.6 100.0 20.3 19.0 336
MIGRANTS, BY FREQUENCYMoved Once 39.9 30.4 16.5 8.6 4.6 100.0 22.3 21.0 1167Multiple, Return 71.1 20.8 6.0 1.5 0.6 100.0 18.6 17.0 455Multiple, Repeat 71.8 20.5 5.8 1.6 0.4 100.1 18.6 17.0 939
Note: Mean and median age calculated from distribution by single years of age.SOURCE: Computed from the 1983 National Demographic Survey datatape (weighted results).
There are plenty of reasons why younger persons are more mobile than the rest of the age groups. Foremost is the fact that they are often beginning their working life and, being less constrained by family responsibilities and social ties (as may be the case of older persons), they are more able to assume the risks involved in moving. For those seeking higher levels of education not available at the place of origin, the younger ones can profit more in spite of the costs involved in transfering from one place to another because they, at any rate, have more working years to reap from this investment. In her study of migration differentials in the Philippines, Feitosa (1975:165) discovered that an additional factor favouring the migration of young people is that failure and return to place of origin would involve less "loss of face."
Across the age groups for all types of migrants, one observes a uniform tapering off in the distribution of CMW as
30
the ages get older. This pattern is particularly common in developing countries, but not necessarily in more advanced economies (e.g. U.S.A., Britain, Australia) where a slightincrease in the rate of migration is found in specific older ages as a result of retirement or institutionalization (Lewis, 1982:84).
The median age for migrants to rural areas and multiple (both return and repeat) movers is slightly lower than migrants to urban areas and one-time movers. Migrants of all types of streams had a mean age of 20 years; multiple movers, almost 19 years; while one-time movers, a relatively older age of 22 years.
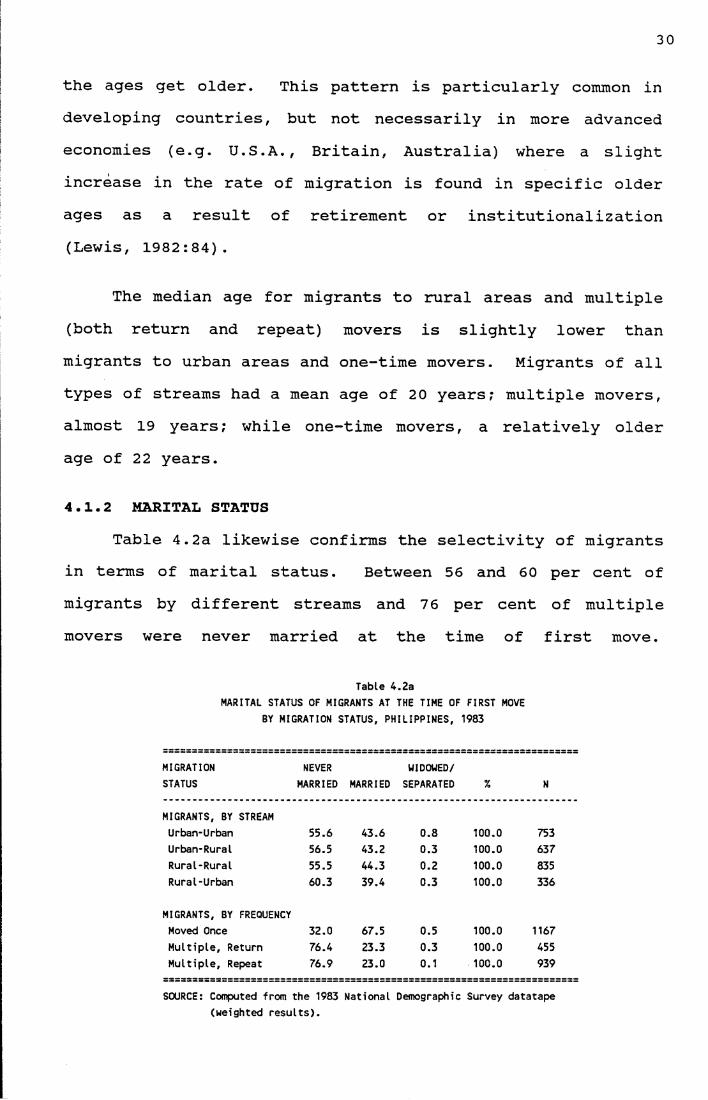
4.1.2 MARITAL STATUSTable 4.2a likewise confirms the selectivity of migrants
in terms of marital status. Between 56 and 60 per cent of migrants by different streams and 76 per cent of multiple movers were never married at the time of first move.
Table 4.2aMARITAL STATUS OF MIGRANTS AT THE TIME OF FIRST MOVE
BY MIGRATION STATUS, PHILIPPINES, 1983
MIGRATIONSTATUS
NEVERMARRIED MARRIED
WIDOWED/SEPARATED % N
MIGRANTS, BY STREAMUrban-Urban 55.6 43.6 0.8 100.0 753Urban-Rural 56.5 43.2 0.3 100.0 637Rural-Rural 55.5 44.3 0.2 100.0 835Rural-Urban 60.3 39.4 0.3 100.0 336
MIGRANTS, BY FREQUENCYMoved Once 32.0 67.5 0.5 100.0 1167Multiple, Return 76.4 23.3 0.3 100.0 455Multiple, Repeat 76.9 23.0 0.1 100.0 939
SOURCE: Computed from the 1983 National Demographic Survey datatape (weighted results).
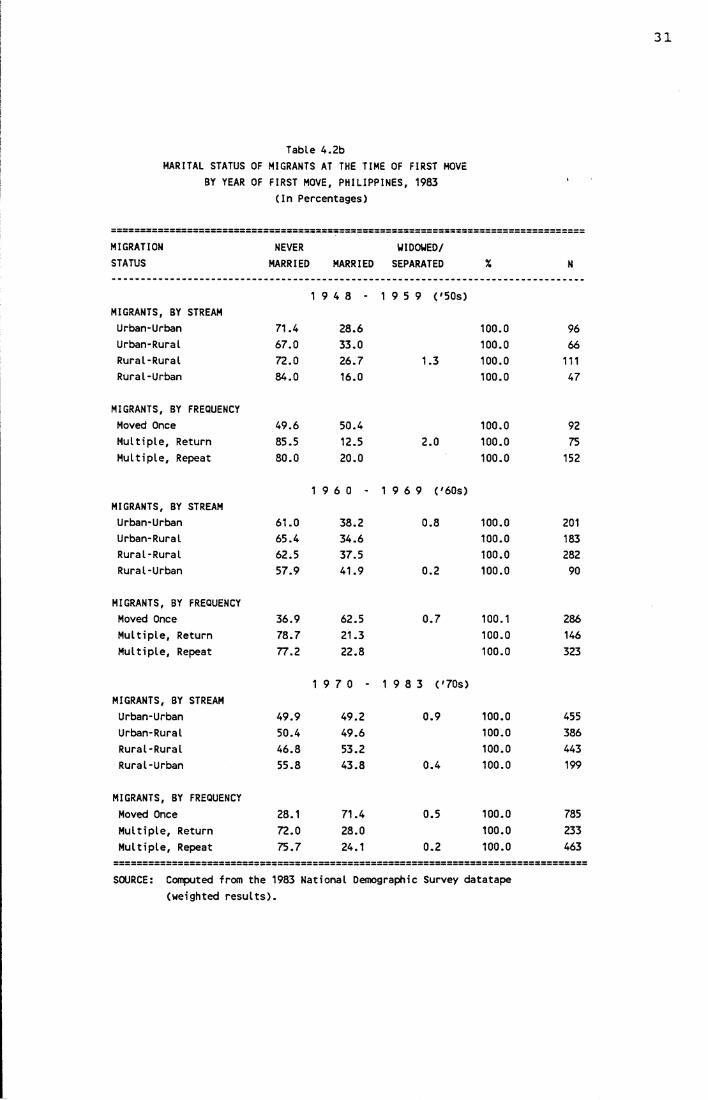
Table 4 .2bMARITAL STATUS OF MIGRANTS AT THE TIME OF FIRST MOVE
BY YEAR OF FIRST MOVE, PHILIPPINES, 1983
( I n Percentages)
MIGRATION NEVER WIDOWED/
STATUS MARRIED MARRIED SEPARATED % N
1 9
co 1 9 5 9 ( '5 0 s )MIGRANTS, BY STREAM
Urban-Urban 71.4 28.6 100.0 96Urban-Rural 67.0 33 .0 100.0 66Rura l-R ural 72.0 26 .7 1.3 100.0 111Rural-Urban 84.0 16.0 100.0 47
MIGRANTS, BY FREQUENCYMoved Once 49 .6 50.4 100.0 92M u l t ip le , Return 85.5 12.5 2 .0 100.0 75M u l t ip le , Repeat 80.0 20.0 100.0 152
1 9 6 0 - 1 9 6 9 ( '6 0 s )MIGRANTS, BY STREAM
Urban-Urban 61.0 38.2 0 .8 100.0 201Urban-Rural 65.4 34 .6 100.0 183Rural-Rural 62.5 37.5 100.0 282Rural-Urban 57.9 41 .9 0 .2 100.0 90
MIGRANTS, BY FREQUENCYMoved Once 36.9 62.5 0 .7 100.1 286M u l t ip le , Return 78 .7 21.3 100.0 146M u l t ip le , Repeat 77.2 22.8 100.0 323
1 9 7 0 - 1 9 8 3 ( '7 0 s )MIGRANTS, BY STREAM
Urban-Urban 49 .9 49.2 0 .9 100.0 455
Urban-Rural 50.4 49 .6 100.0 386
Rura l-R ural 46 .8 53.2 100.0 443Rural-Urban 55.8 43 .8 0 .4 100.0 199
MIGRANTS, BY FREQUENCY
Moved Once 28.1 71.4 0 .5 100.0 785
M u l t ip le , Return 72.0 28.0 100.0 233
M u l t ip le , Repeat 75 .7 24.1 0 .2 100.0 463
SOURCE: Computed from the 1983 National Demographic Survey datatape
(weighted r e s u l ts ) .
32
However, one-time movers depict another picture as only one third of them were never married then. Selectivity in age and marital status is related in the sense that singlefemales can afford to take more chances in moving compared with married women since they are not bound by family ties. The costs of transfers and settling in the place ofdestination are also generally much less. This may explain the higher incidence of single women, particularly amongmultiple movers.
An interesting trend is observed in Table 4.2b asmigrants are distinguished by year of move. That is, while migrants (except for one-time movers) are predominantly single at the time of first move, the incidence seem to be diminishing in recent years. For instance, about 71 per cent of urban to urban migrants in the '50s were single, but by the '7 0s this has decreased to only 50 per cent. It may be that better and cheaper transportation networks and utilities through the years may have provided some incentives for married women to consider the prospects of migration compared to the more difficult circumstances in previous years. If so, then Balan's (1969) contention that migrants at the latter stage of a country's development are less selective than in earlier stages may be relevant here.
4.1.3 LEVEL OF EDUCATION
The level of education of individuals may be viewed as either a determinant or a consequence of migration. As a determinant, educated individuals are regarded as relatively more mobile and adaptable, brighter and more alert to
33
changing opportunities (Browning, 1971). Where educational facilities are wanting as in rural areas, the desire for higher and better educational opportunities can be enough reason to migrate. Also, where individuals have attained higher average educational levels than their age counterparts in their place of origin, they may be more inclined to move to continue their education. Once migrants reach their place of destination, the achievement of higher education is then considered a consequence.
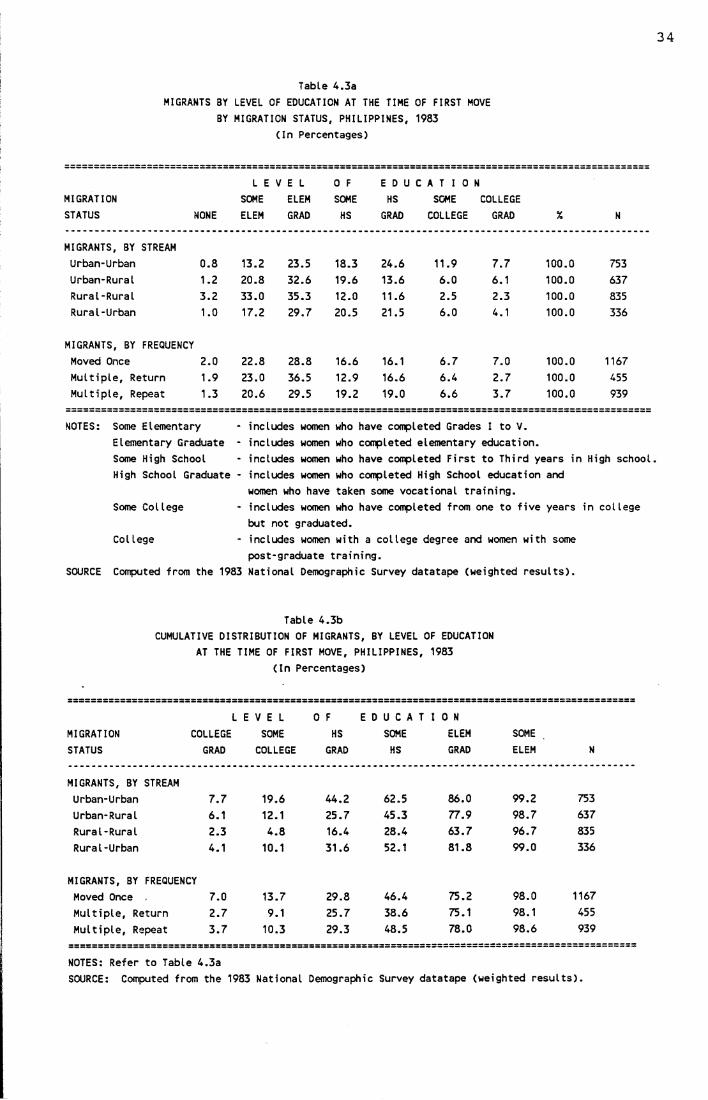
Tables 4.3a and 4.3b display the levels of education of migrants at the time of first move. The universality of education in the Philippines is very well illustrated here as more than 95 per cent of all CMW have had formal schooling. The level of educational attainment leaves much to be desired, though, as only a handful of migrants ever took or finished college. Among the migrants by stream, the urban to urban movers fared best as 44 per cent of them attended at least high school and about 2 0 per cent had some college education or were graduates. In contrast, only 28 per cent of the rural to rural movers had some high school education and five per cent reached at least college. Among migrants by frequency, the figures show that one-time movers had higher educational achievement compared to the multiple movers. The return migrants achieved the least with only 9 per cent taking up some college course.
In Table 4.3b, migrants whose destination was rural clearly had lower educational levels compared to those settling in urban areas. Lesser formal schooling may be one
34
Table 4.3aMIGRANTS BY LEVEL OF EDUCATION AT THE TIME OF FIRST MOVE
BY MIGRATION STATUS, PHILIPPINES, 1983 (In Percentages)
MIGRATIONSTATUS NONE
L E SOME ELEM
V E L ELEM GRAD
0 F SC*E HS
E D U HSGRAD
C A T I 0 SOME COLLEGE
NCOLLEGEGRAD % N
MIGRANTS, BY STREAMUrban-Urban 0.8 13.2 23.5 18.3 24.6 11.9 7.7 100.0 753Urban-Rural 1.2 20.8 32.6 19.6 13.6 6.0 6.1 100.0 637Rural-Rural 3.2 33.0 35.3 12.0 11.6 2.5 2.3 100.0 835Rural-Urban 1.0 17.2 29.7 20.5 21.5 6.0 4.1 100.0 336
MIGRANTS, BY FREQUENCYMoved Once 2.0 22.8 28.8 16.6 16.1 6.7 7.0 100.0 1167Multiple, Return 1.9 23.0 36.5 12.9 16.6 6.4 2.7 100.0 455Multiple, Repeat 1.3 20.6 29.5 19.2 19.0 6.6 3.7 100.0 939
NOTES:
SOURCE
Some Elementary Elementary Graduate - Some High School High School Graduate -
Some College
College
Computed from the 1983
includes women who have completed Grades I to V. includes women who completed elementary education.includes women who have completed First to Third years in High school, includes women who completed High School education and women who have taken some vocational training.includes women who have completed from one to five years in college but not graduated.includes women with a college degree and women with some post-graduate training.National Demographic Survey datatape (weighted results).
Table 4.3bCUMULATIVE DISTRIBUTION OF MIGRANTS, BY LEVEL OF EDUCATION
AT THE TIME OF FIRST MOVE, PHILIPPINES, 1983(In Percentages)
L E V E L 0 F E D U C A T I 0 NMIGRATION COLLEGE SOME HS SOME ELEM SOMESTATUS GRAD COLLEGE GRAD HS GRAD ELEM N
MIGRANTS, BY STREAMUrban-Urban 7.7 19.6 44.2 62.5 86.0 99.2 753Urban-Rural 6.1 12.1 25.7 45.3 77.9 98.7 637Rural-Rural 2.3 4.8 16.4 28.4 63.7 96.7 835Rural-Urban 4.1 10.1 31.6 52.1 81.8 99.0 336
MIGRANTS, BY FREQUENCYMoved Once 7.0 13.7 29.8 46.4 75.2 98.0 1167Multiple, Return 2.7 9.1 25.7 38.6 75.1 98.1 455Multiple, Repeat 3.7 10.3 29.3 48.5 78.0 98.6 939===========================================================:======================================NOTES: Refer to Table 4.3aSOURCE: Computed from the 1983 National Demographic Survey datatape (weighted results).
35
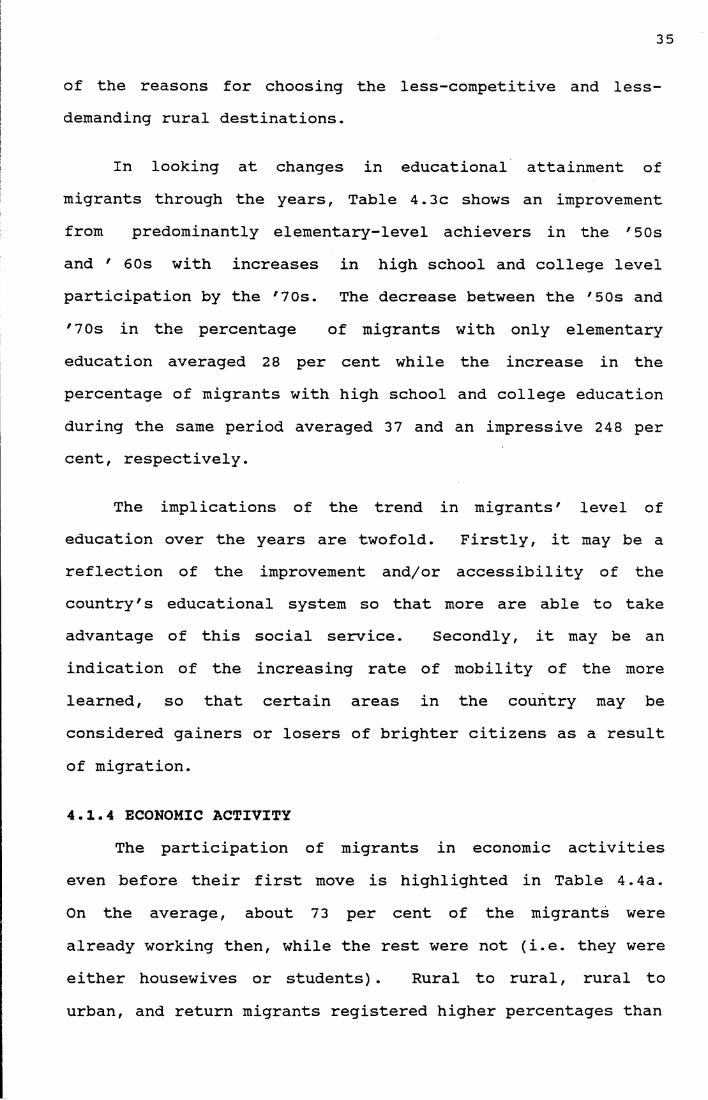
of the reasons for choosing the less-competitive and less- demanding rural destinations.
In looking at changes in educational attainment of migrants through the years, Table 4.3c shows an improvement from predominantly elementary-level achievers in the '50s and ' 60s with increases in high school and college level participation by the '70s. The decrease between the '50s and '7 0s in the percentage of migrants with only elementary education averaged 28 per cent while the increase in the percentage of migrants with high school and college education during the same period averaged 37 and an impressive 248 per cent, respectively.
The implications of the trend in migrants' level of education over the years are twofold. Firstly, it may be a reflection of the improvement and/or accessibility of the country's educational system so that more are able to take advantage of this social service. Secondly, it may be an indication of the increasing rate of mobility of the more learned, so that certain areas in the country may be considered gainers or losers of brighter citizens as a result of migration.
4.1.4 ECONOMIC ACTIVITYThe participation of migrants in economic activities
even before their first move is highlighted in Table 4.4a. On the average, about 7 3 per cent of the migrants were already working then, while the rest were not (i.e. they were either housewives or students). Rural to rural, rural to urban, and return migrants registered higher percentages than
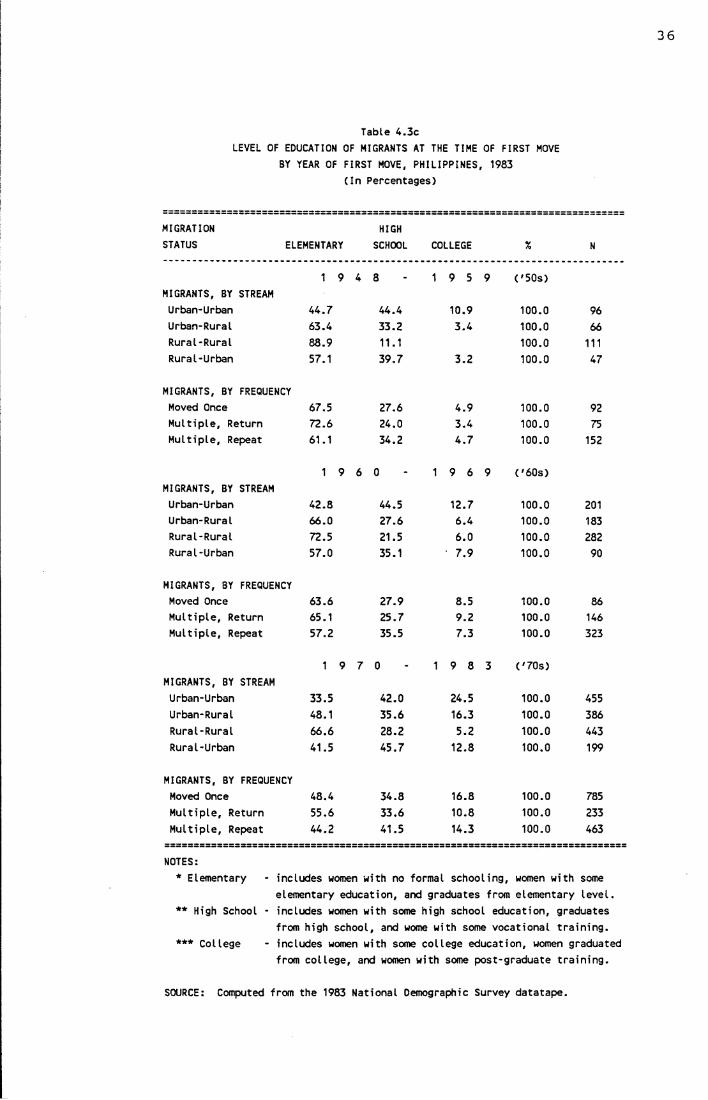
Table 4.3cLEVEL OF EDUCATION OF MIGRANTS AT THE TIME OF FIRST MOVE
BY YEAR OF FIRST MOVE, PHILIPPINES, 1983 (In Percentages)
MIGRATION HIGHSTATUS ELEMENTARY SCHOOL COLLEGE % N
1 9 4 8 1 9 5 9 ('50s)MIGRANTS, BY STREAMUrban-Urban 44.7 44.4 10.9 100.0 96Urban-Rural 63.4 33.2 3.4 100.0 66Rural-Rural 88.9 11.1 100.0 111Rural-Urban 57.1 39.7 3.2 100.0 47
MIGRANTS, BY FREQUENCYMoved Once 67.5 27.6 4.9 100.0 92Multiple, Return 72.6 24.0 3.4 100.0 75Multiple, Repeat 61.1 34.2 4.7 100.0 152
1 9 6 0 1 9 6 9 ('60s)MIGRANTS, BY STREAMUrban-Urban 42.8 44.5 12.7 100.0 201Urban-Rural 66.0 27.6 6.4 100.0 183Rural-Rural 72.5 21.5 6.0 100.0 282Rural-Urban 57.0 35.1 7.9 100.0 90
MIGRANTS, BY FREQUENCYMoved Once 63.6 27.9 8.5 100.0 86Multiple, Return 65.1 25.7 9.2 100.0 146Multiple, Repeat 57.2 35.5 7.3 100.0 323
1 9 7 0 1 9 8 3 ('70s)MIGRANTS, BY STREAMUrban-Urban 33.5 42.0 24.5 100.0 455Urban-Rural 48.1 35.6 16.3 100.0 386Rural-Rural 66.6 28.2 5.2 100.0 443Rural-Urban 41.5 45.7 12.8 100.0 199
MIGRANTS, BY FREQUENCYMoved Once 48.4 34.8 16.8 100.0 785Multiple, Return 55.6 33.6 10.8 100.0 233Multiple, Repeat 44.2 41.5 14.3 100.0 463
NOTES:* Elementary - includes women with no formal schooling, women with some
elementary education, and graduates from elementary level.** High School - includes women with some high school education, graduates
from high school, and wome with some vocational training.* * * College - includes women with some college education, women graduated
from college, and women with some post-graduate training.
SOURCE: Computed from the 1983 National Demographic Survey datatape.
37
Table 4.4aLABOUR FORCE PARTICIPATION OF MIGRANTS
AT THE TIME OF FIRST MOVE, PHILIPPINES, 1983 (In Percentages)
MIGRATIONSTATUS
ECONOMICWORKING
ACTIVITY NOT WORKING % N
MIGRANTS, BY STREAMUrban-Urban 70.4 29.6 100.0 753Urban-Rural 61.3 38.7 100.0 637Rural-Rural 79.2 20.8 100.0 835Rural-Urban 77.5 22.5 100.0 336
MIGRANTS, BY FREQUENCYMoved Once 70.5 29.5 100.0 1167Multiple, Return 80.2 19.8 100.0 455Multiple, Repeat 69.8 30.2 100.0 939
SOURCE: Computed from the 1983 National Demographic Survey datatape(weighted results).
the other types. In cases where the migrants' place of origin was rural, the higher participation rates may be due to greater working opportunities in agriculture, as may be implied by the fact that in 1980 about 67 per cent of the country's labour force was estimated to be in this sector (NEDA,1987).
In looking at the trend of participation in economic activities through the years (Table 4.4b), however, one observes an unstable picture. Between the '50s and '60s, an increase in the proportion of working women among urban to urban, rural to urban and multiple migrants is discerned but, curiously, by the '70s the rates have declined. On the other hand, urban to rural, rural to rural, one-time and return migrants experience a decline in proportion of working women between the '50s and '60s but their participation increased
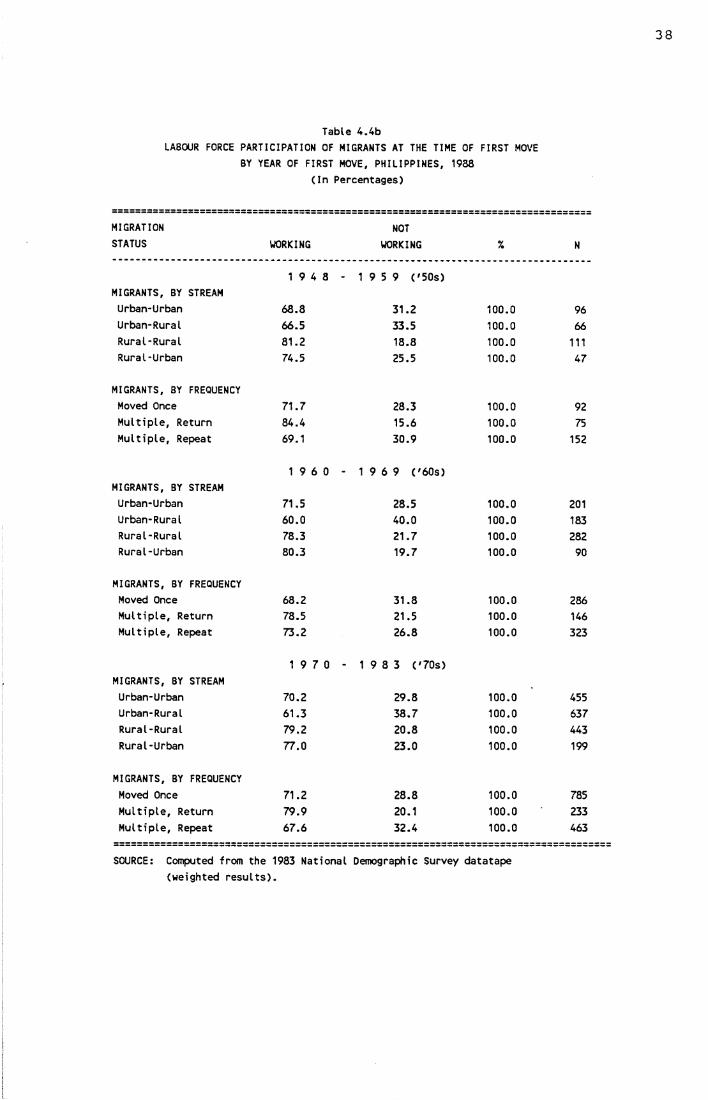
Table 4.4bLABOUR FORCE PARTICIPATION OF MIGRANTS AT THE TIME OF FIRST MOVE
BY YEAR OF FIRST MOVE, PHILIPPINES, 1933 (In Percentages)
==================================================================================MIGRATION NOTSTATUS WORKING WORKING % N
1 9 4 8 - 1 9 5 9 ('50s)MIGRANTS, BY STREAMUrban-Urban 63.8 31.2 100.0 96Urban-Rural 66.5 33.5 100.0 66Rural-Rural 81.2 18.8 100.0 111Rural-Urban 74.5 25.5 100.0 47
MIGRANTS, BY FREQUENCYMoved Once 71.7 28.3 100.0 92Multiple, Return 84.4 15.6 100.0 75Multiple, Repeat 69.1 30.9 100.0 152
1 9 6 0 - 1 9 6 9 ('60s)MIGRANTS, BY STREAMUrban-Urban 71.5 28.5 100.0 201Urban-Rural 60.0 40.0 100.0 183Rural-Rural 78.3 21.7 100.0 282Rural-Urban 80.3 19.7 100.0 90
MIGRANTS, BY FREQUENCYMoved Once 68.2 31.8 100.0 286Multiple, Return 78.5 21.5 100.0 146Multiple, Repeat 73.2 26.8 100.0 323
1 9 7 0 - 1 9 8 3 ('70s)MIGRANTS, BY STREAMUrban-Urban 70.2 29.8 100.0 455Urban-Rural 61.3 38.7 100.0 637Rural-Rural 79.2 20.8 100.0 443Rural-Urban 77.0 23.0 100.0 199
MIGRANTS, BY FREQUENCYMoved Once 71.2 28.8 100.0 785Multiple, Return 79.9 20.1 100.0 233Multiple, Repeat 67.6 32.4 100.0 463
SOURCE: Computed from the 1983 National Demographic Survey datatape(weighted results).
39
by the '80s. No explanation can be offered as to the possible cause of this trend.4.1.5 REASONS FOR MOVING
Migrants, more often than not, are persons rationally motivated by a set of reasons, most commonly by a desire to improve their economic or social status. According to Ravenstein (1835:167-227), migrants move from areas of poverty to areas of opportunity, so that once a person becomes dissatisfied in his present location, then moving elsewhere becomes a matter of consideration. But then, despite being satisfied in one's present situation, information about greater opportunities elsewhere may persuade a person to move (Lewis, 1982:100). These "push" factors (forces which encourage a person to leave one place) and "pull" factors (those that attract a person to another place) have been the focus of attention of studies that have attempted to determine the causes of or reasons for migration.
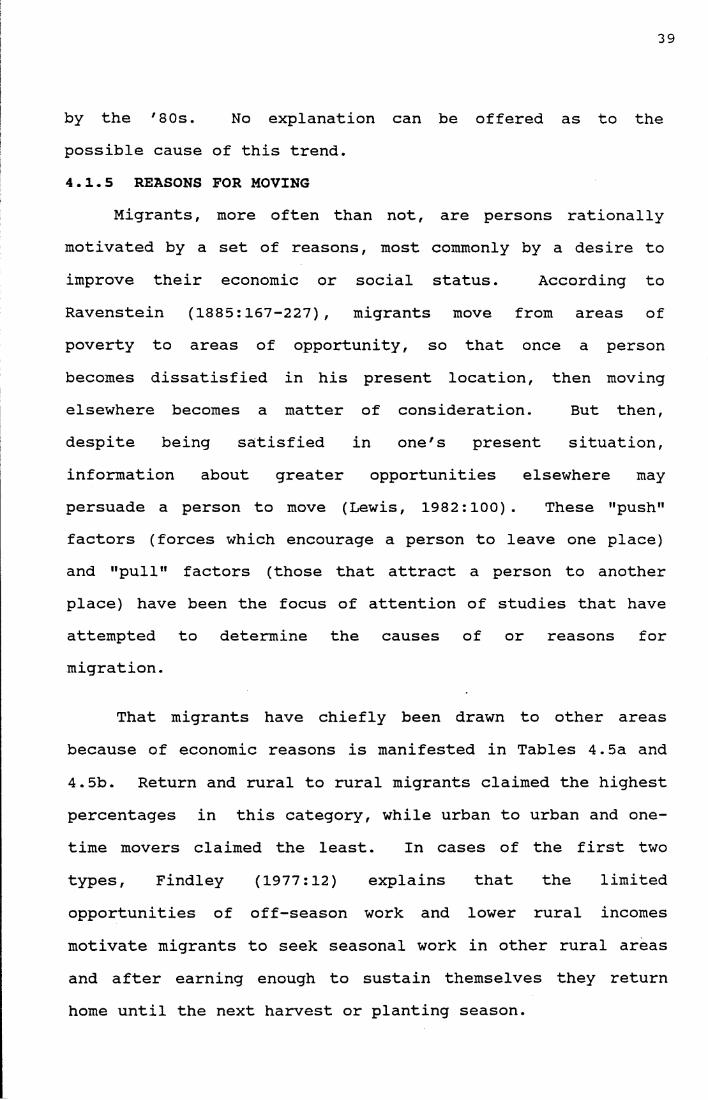
That migrants have chiefly been drawn to other areas because of economic reasons is manifested in Tables 4.5a and 4.5b. Return and rural to rural migrants claimed the highest percentages in this category, while urban to urban and onetime movers claimed the least. In cases of the first two types, Findley (1977:12) explains that the limited opportunities of off-season work and lower rural incomes motivate migrants to seek seasonal work in other rural areas and after earning enough to sustain themselves they return home until the next harvest or planting season.
40
Table 4.5aMIGRANTS' MAIN REASON FOR MOVING TO FIRST AREA OF DESTINATION
BY MIGRATION STATUS, PHILIPPINES, 1983 (In Percentages)
MIGRATIONSTATUS
M A I
ECONOMIC
N REEDUCATION RELATED
A S 0 N FAMILY
RELATED
F O RMARRIAGERELATED
M O V )HOUSINGRELATED
: n gOTHERREASONS % N
MIGRANTS, BY STREAMUrban-Urban 24.1 7.3 24.9 8.1 31.2 4.4 100.0 753Urban-Rural 31.9 5.0 30.5 12.3 16.5 3.3 100.0 637Rural-Rural 42.8 3.5 25.0 12.4 12.9 3.4 100.0 835Rural-Urban 33.2 7.5 24.7 13.3 17.4 3.9 100.0 336
MIGRANTS, BY FREQUENCYMoved Once 27.2 2.0 20.6 19.8 26.7 3.7 100.0 1167Multiple, Return 47.3 9.2 25.4 3.3 12.4 2.4 100.0 455Multiple, Repeat 34.1 8.1 33.7 4.8 14.8 4.5 100.0 939
SOURCE: Computed from the 1983 National Demographic Survey datatape (weighted results).
The second most common reason for moving is family-related. Here, one may infer the occurrence of chain migration whereby some members of the family may initially have moved to another residence with the other members eventually following. The predominance of chain migration, especially in a close-knit family system as is the case in the Philippines is one of the contributory factors to the sustained transfers from one area to another. Family-related moves seem to be more prevalent among repeat migrants and urban to rural migrants. Those moves that were made because of changes in housing locations, a related reason, came as the third most common with more urban to urban and one-timemovers.
41
Table 4 .5bMIGRANTS' MAIN REASON FOR MOVING TO FIRST AREA OF DESTINATION
BY YEAR OF FIRST MOVE, PHILIPPINES, 1983
( In Percentages)
M A I N R E A S O N F O R M O V I N GMIGRATION
STATUS ECONOMIC
EDUCATION
RELATEDFAMILY
RELATEDMARRIAGERELATED
HOUSING
RELATEDOTHER
REASONS %
1 9 4 8 1 9 5 9 ( '5 0 s )MIGRANTS, BY STREAM
Urban-Urban 22.2 11.0 31 .4 4 .5 28.2 2 .7 100.0Urban-Rural 39.1 6.1 26.8 15.0 10.1 2 .9 100.0R u ra l-R ura l 40 .2 3 .8 33.3 6 .7 13.9 2.1 100.0Rural-Urban 25.0 6 .6 41.0 5 .7 20 .8 0 .9 100.0
MIGRANTS, BY FREQUENCY
Moved Once 25 .7 0 .5 16.6 21.3 32.1 3 .8 100.0M u l t ip le , Return 43 .9 9 .4 36.3 0 .8 9 .6 100.0M u l t ip le , Repeat 30 .7 9 .5 40 .3 2 .7 14.5 2 .3 100.0
1 9 6 0 1 9 6 9 ( '6 0 s )MIGRANTS, BY STREAM
Urban-Urban 25.3 9 .8 24.0 7 .7 29.4 3 .8 100.0Urban-Rural 35.1 8 .9 26.5 7 .6 16.5 5 .4 100.0Rura l-R ural 45 .6 4 .7 23 .7 13.4 9 .2 3 .4 100.0Rural-Urban 35.8 9 .3 20 .8 16.2 15.7 2 .2 100.0
M IG R A N T S , BY FREQUENCYMoved Once 29.1 2.5 20.4 21.2 23.1 3 .7 100.0M u l t ip le , Return 53.4 14.5 18.6 4 .2 5 .9 3 .4 100.0M u l t ip le , Repeat 35 .4 9 .0 30.0 4 .4 16.9 4 .3 100.0
1 9 7 0 1 9 8 3 ( '7 0 s )MIGRANTS, BY STREAM
Urban-Urban 24.0 5 .4 23 .9 9.1 3 2 .7 4 .9 100.0Urban-Rural 29.1 2 .9 33.0 14.9 17.6 2 .5 100.0Rura l-R ural 41 .7 2 .7 23 .7 13.2 14.9 3 .8 100.0Rural-Urban 34.0 6 .9 22.6 13.8 17.4 5 .3 100.0
M IG R A N T S , BY FREQUENCY
Moved Once 26 .7 2 .0 21.1 19.1 27.4 3 .7 100.0M u l t ip le , Return 44.6 5 .8 26.1 3 .5 17.4 2 .6 100.0M u l t ip le , Repeat 34 .4 6 .9 34.2 5 .7 13.4 5 .4 100.0
N
96
6611147
9275
152
201183280
89
286144
322
455
382
438
198
779
233
461
SOURCE: Computed from the 1983 National Demographic Survey datatape (weighted r e s u l t s ) .
42
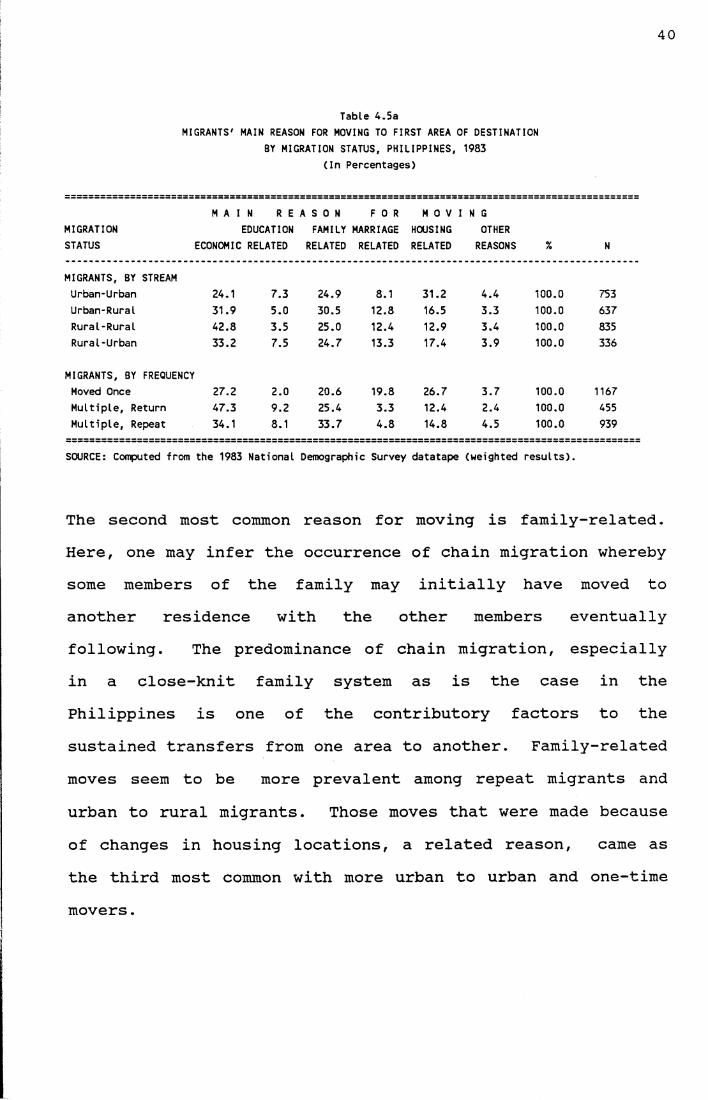
Over the years, the economic-, family-, and housing- related reasons have remained the predominant motivations for migrants. There seem to be a decrease in economically- motivated transfers between the '60s and '7 0s though, while there was an increase in housing-related moves in the same period.
4.2 Characteristics of Migrants and Non-Migrants at theTime of SurveyBy way of testing the selectivity hypothesis and in
order to present a more logical match-up between non-migrants and migrants by stream, comparisons of characteristics will be based on the women's place of origin. Rural non-migrants will be compared with rural to rural and rural to urban migrants (to be referred to as rural migrants) and urban nonmigrants will be compared with urban to urban and urban to rural migrants (or together, the urban migrants). As for migrants by frequency, any significant differences in their characteristics will be contrasted with the average findings from both urban and rural non-migrants.
4.2.1 AGE DISTRIBUTIONCuriously, the selectivity of migrants by age, as
clearly demonstrated in Table 4.1, is nowhere reflected in the age distribution of CMW by migration status at the time of survey (Table 4.6). There were more non-migrants in the younger ages 15-29 years than any of the migrant categories, either by stream or by frequency. The only ages where migrants outnumber non-migrants were 30-34. This could well be an example of the problem cited by Goldstein and Goldstein (1982:137) about retrospective data being possibly distorted
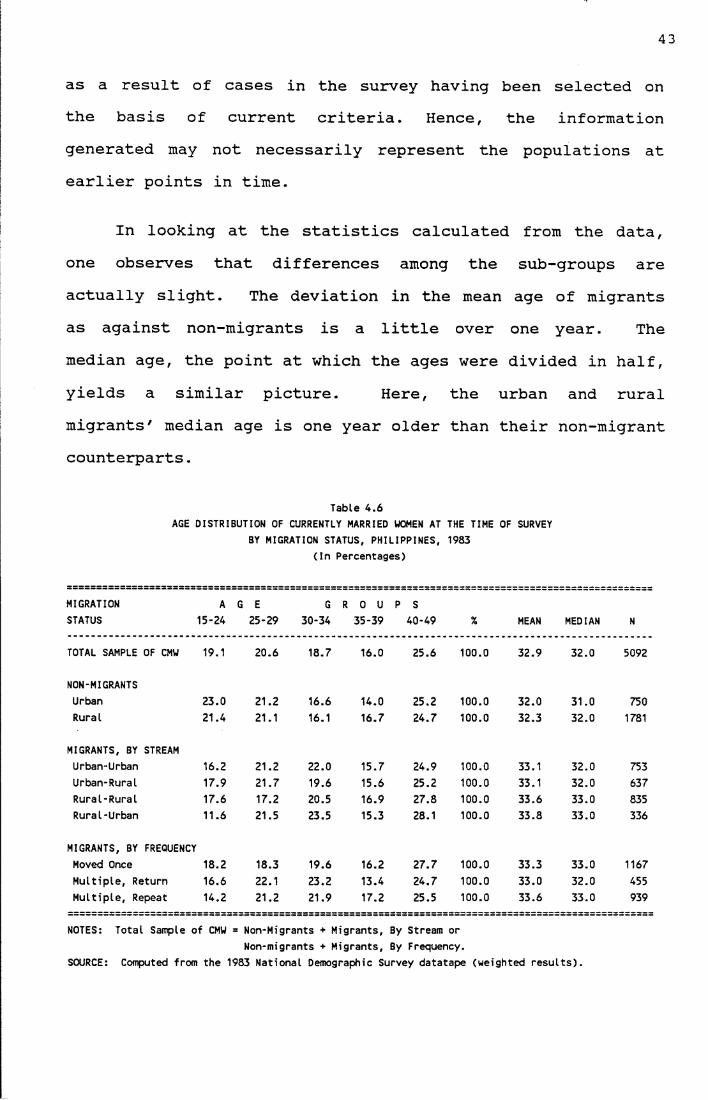
43
as a result of cases in the survey having been selected onthe basis of current criteria. Hence, the informationgenerated may not necessarily represent the populations at earlier points in time.
In looking at the statistics calculated from the data, one observes that differences among the sub-groups are actually slight. The deviation in the mean age of migrants as against non-migrants is a little over one year. Themedian age, the point at which the ages were divided in half,yields a similar picture. Here, the urban and rural migrants' median age is one year older than their non-migrant counterparts.
Table 4.6AGE DISTRIBUTION OF CURRENTLY MARRIED WOMEN AT THE TIME OF SURVEY
BY MIGRATION STATUS, PHILIPPINES, 1983 (In Percentages)
MIGRATIONSTATUS
A15-24
G E 25-29
G30-34
R 0 U 35-39
P S 40-49 % MEAN MEDIAN N
TOTAL SAMPLE OF CMW 19.1 20.6 18.7 16.0 25.6 100.0 32.9 32.0 5092
NON-MIGRANTSUrban 23.0 21.2 16.6 14.0 25.2 100.0 32.0 31.0 750Rural 21.4 21.1 16.1 16.7 24.7 100.0 32.3 32.0 1781
MIGRANTS, BY STREAMUrban-Urban 16.2 21.2 22.0 15.7 24.9 100.0 33.1 32.0 753Urban-Rural 17.9 21.7 19.6 15.6 25.2 100.0 33.1 32.0 637Rural-Rural 17.6 17.2 20.5 16.9 27.8 100.0 33.6 33.0 835Rural-Urban 11.6 21.5 23.5 15.3 28.1 100.0 33.8 33.0 336
MIGRANTS, BY FREQUENCYMoved Once 18.2 18.3 19.6 16.2 27.7 100.0 33.3 33.0 1167Multiple, Return 16.6 22.1 23.2 13.4 24.7 100.0 33.0 32.0 455Multiple, Repeat 14.2 21.2 21.9 17.2 25.5 100.0 33.6 33.0 939
NOTES: Total Sample of CMW = Non-Migrants + Migrants, By Stream orNon-migrants + Migrants, By Frequency.
SOURCE: Computed from the 1983 National Demographic Survey datatape (weighted results).
44
In brief, the selectivity of migrants as far as age is concerned may best be appreciated when referred to at the time of move. While the corresponding distribution of nonmigrants cannot be calculated for the same period, the glaring concentration of movers in the younger ages (i.e. over 80 per cent in ages 15-24 years) confirms this distinctive trait among migrants that has been observed in related studies throughout the world.
4.2.2 LEVEL OF EDUCATIONEven if, on the average, only 6 per cent of the migrants
indicated education as their main reason for moving, the comparative advantage of migrants in terms of educational attainment can be gleaned from Tables 4.7a and 4.7b. Specifically, Table 4.7b shows higher percentage distribution of rural migrants at all levels of schooling compared to rural non-migrants. On the other hand, while urban to urban migrants achieved higher educational status than urban nonmigrants, the urban to rural migrants did not perform any better than their non-migrant counterparts. But then, both categories of urban migrants included fewer women with no formal schooling than were among urban non-migrants. Also, while the percentage share of one-time and multiple movers was greater at higher educational levels than that of rural non-migrants, they were out-performed by urban non-migrants. Taking the average distribution of non-migrants and comparing them to the average distribution of migrants by frequency, however, the figures indicate that more of the latter were receiving more schooling.
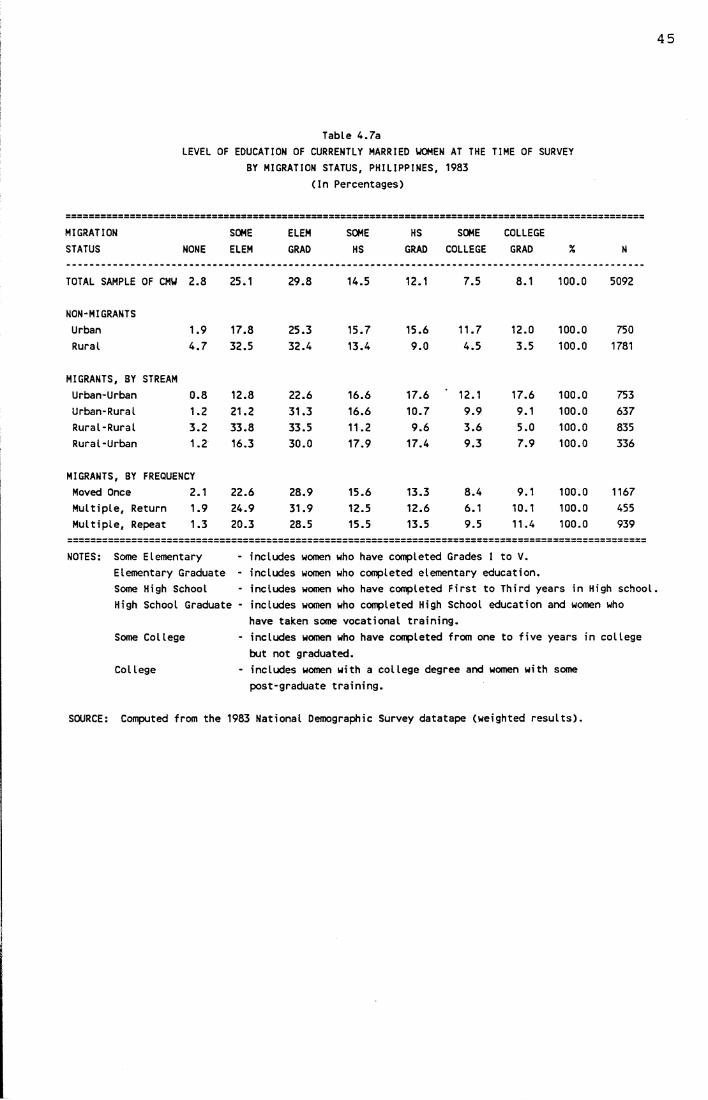
45
Table 4.7aLEVEL OF EDUCATION OF CURRENTLY MARRIED WOMEN AT THE TIME OF SURVEY
BY MIGRATION STATUS, PHILIPPINES, (In Percentages)
1983
MIGRATION SOME ELEM SOME HS SOME COLLEGESTATUS NONE ELEM GRAD HS GRAD COLLEGE GRAD % N
TOTAL SAMPLE OF CMW 2.8 25.1 29.8 14.5 12.1 7.5 8.1 100.0 5092
NON-MIGRANTSUrban 1.9 17.8 25.3 15.7 15.6 11.7 12.0 100.0 750Rural 4.7 32.5 32.4 13.4 9.0 4.5 3.5 100.0 1781
MIGRANTS, BY STREAMUrban-Urban 0.8 12.8 22.6 16.6 17.6 12.1 17.6 100.0 753Urban-Rural 1.2 21.2 31.3 16.6 10.7 9.9 9.1 100.0 637Rural-Rural 3.2 33.8 33.5 11.2 9.6 3.6 5.0 100.0 835Rural-Urban 1.2 16.3 30.0 17.9 17.4 9.3 7.9 100.0 336
MIGRANTS, BY FREQUENCYMoved Once 2.1 22.6 28.9 15.6 13.3 8.4 9.1 100.0 1167Multiple, Return 1.9 24.9 31.9 12.5 12.6 6.1 10.1 100.0 455Multiple, Repeat 1.3 20.3 28.5 15.5 13.5 9.5 11.4 100.0 939
NOTES: Some ElementaryElementary Graduate Some High School High School Graduate
Some College
Col lege
includes women who have completed Grades I to V. includes women who completed elementary education.includes women who have completed First to Third years in High school, includes women who completed High School education and women who have taken some vocational training.includes women who have completed from one to five years in college but not graduated.includes women with a college degree and women with some post-graduate training.
SOURCE: Computed from the 1983 National Demographic Survey datatape (weighted results).
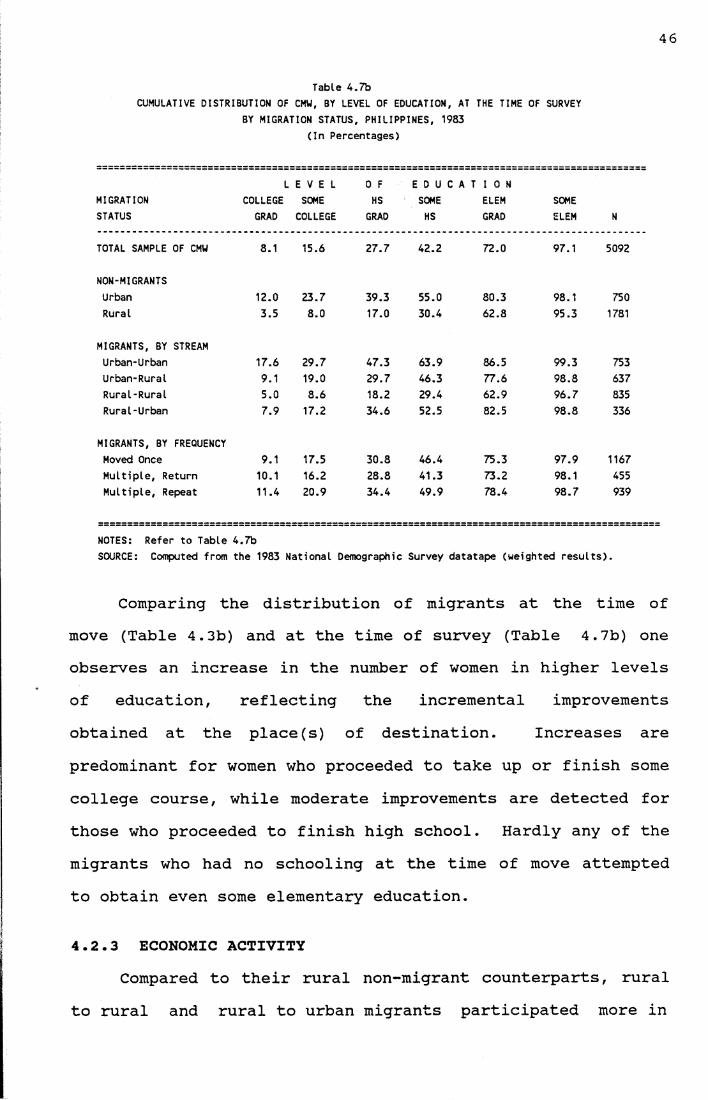
46
Table 4.7bCUMULATIVE DISTRIBUTION OF CMW, BY LEVEL OF EDUCATION, AT THE TIME OF SURVEY
BY MIGRATION STATUS, PHILIPPINES, 1983 (In Percentages)
MIGRATIONSTATUS
LCOLLEGEGRAD
E V E L SOME COLLEGE
0 F HSGRAD
E D U C A SOME HS
T I 0 N ELEM GRAD
SOMEELEM N
TOTAL SAMPLE OF CMW 8.1 15.6 27.7 42.2 72.0 97.1 5092
NON-MIGRANTSUrban 12.0 23.7 39.3 55.0 80.3 98.1 750Rural 3.5 8.0 17.0 30.4 62.8 95.3 1781
MIGRANTS, BY STREAMUrban-Urban 17.6 29.7 47.3 63.9 86.5 99.3 753Urban-Rural 9.1 19.0 29.7 46.3 77.6 98.8 637Rural-Rural 5.0 8.6 18.2 29.4 62.9 96.7 835Rural-Urban 7.9 17.2 34.6 52.5 82.5 98.8 336
MIGRANTS, BY FREQUENCYMoved Once 9.1 17.5 30.8 46.4 75.3 97.9 1167Multiple, Return 10.1 16.2 28.8 41.3 73.2 98.1 455Multiple, Repeat 11.4 20.9 34.4 49.9 78.4 98.7 939
NOTES: Refer to Table 4.7bSOURCE: Computed from the 1983 National Demographic Survey datatape (weighted results).
Comparing the distribution of migrants at the time of move (Table 4.3b) and at the time of survey (Table 4.7b) one observes an increase in the number of women in higher levels of education, reflecting the incremental improvements obtained at the place(s) of destination. Increases are predominant for women who proceeded to take up or finish some college course, while moderate improvements are detected for those who proceeded to finish high school. Hardly any of the migrants who had no schooling at the time of move attempted to obtain even some elementary education.
4.2.3 ECONOMIC ACTIVITYCompared to their rural non-migrant counterparts, rural
to rural and rural to urban migrants participated more in
Table 4.8LABOUR FORCE PARTICIPATION OF CMU AT THE TIME OF SURVEY
BY MIGRATION STATUS, PHILIPPINES, 1983 (In Percentages)
MIGRATIONSTATUS
ECONOMICWORKING
ACTIVITY NOT WORKING % N
TOTAL SAMPLE OF CMW 27.7 72.3 100.0 5092
NON-MIGRANTSUrban 32.6 67.4 100.0 750Rural 22.2 77.8 100.0 1779
MIGRANTS, BY STREAMUrban-Urban 38.8 61.2 100.0 753Urban-Rural 23.1 76.9 100.0 637Rural-Rural 25.3 74.7 100.0 835Rural-Urban 35.4 64.6 100.0 336
MIGRANTS, BY FREQUENCYMoved Once 27.8 72.2 100.0 1167Multiple, Return 31.3 68.7 100.0 455Multiple, Repeat 32.2 67.8 100.0 939
SOURCE: Computed from the 1983 National Demographic Survey datatape (weighted results).
economic activities (Table 4.8). On the other hand, while more urban to urban migrants (39 per cent) were working compared to urban non-migrants (33 per cent), urban to rural migrants (23 per cent) participated much less. Amongmigrants by frequency, the multiple movers* were more likely to be engaged in some economic activity than one-timemovers. It may be that the reason for the recurrence of migration is precisely in the pursuit of better working opportunities in various places. The highest proportion of non-working women were found among rural non-migrants who, apparently, were not taking advantage of employmentopportunities in their area as much as their migrantcounterparts.
area as much as
48
However, data on migrants' participation in economic activities at the time of the survey contrasts sharply with their participation at the time of move. While, on the average, about 73 per cent of the migrants were working at the time of first move, this dramatically decreased to an average of 31 per cent at the time of survey. This may be due to the pressures of family-formation that has taken its eventual toll (note that at the time of first move, the majority of the migrants were still not married) . If so, then this situation depicts the negative impact of migration whereby a considerable proportion of women become dependents instead of being productive contributors to society.
4.2.4 AGE AT FIRST MARRIAGERural non-migrants apparently marry the earliest (Table
4.9) with an average age at first marriage of 19 years, lower
Table 4.9AGE AT FIRST MARRIAGE OF CMU AT THE TIME OF SURVEY
BY MIGRATION STATUS, PHILIPPINES, 1983
======================:MIGRATIONSTATUS
=====================================A G E AT M A R R I A G E10-19 20-24 25-29 30-49
::::::::
%
========
MEAN
:===== = = =
MEDIAN
:=== = :
N
TOTAL SAMPLE OF CMW 48.9 37.6 10.5 3.0 100.0 20.2 20.0 5092
NON-MIGRANTSUrban 45.7 40.2 10.5 3.6 100.0 20.4 20.0 750Rural 59.3 31.1 7.7 1.9 100.0 19.1 18.0 1781
MIGRANTS, BY STREAMUrban-Urban 38.3 42.4 15.2 4.1 100.0 21.2 21.0 753Urban-Rural 43.9 42.6 10.0 3.5 100.0 20.6 20.0 637Rural-Rural 48.3 37.8 10.6 3.3 100.0 20.3 20.0 835Rural-Urban 35.8 45.0 15.6 3.6 100.0 21.4 21.0 336
MIGRANTS, BY FREQUENCYMoved Once 48.0 39.0 10.1 2.9 100.0 20.3 20.0 1167Multiple, Return 42.7 38.8 12.6 5.9 100.0 21.2 20.0 455Multiple, Repeat 35.9 45.3 15.3 3.5 100.0 21.3 21.0 939
SOURCE: Computed from the 1983 National Demographic Survey datatape (weighted results).
49
than the total sample average of 20 years. In fact, 59 per cent of rural non-migrants marry between the ages 10-19 years old, which is about 2 3 and 66 per cent more than rural to rural and rural to urban migrants, respectively. Differences between urban non-migrants and urban migrants in the same age group are fewer, with the former registering about 17 per cent more than urban to urban migrants and only 2 per cent more than urban to rural migrants. Furthermore, on the average, there were 10 per cent more urban and rural nonmigrants marrying in these young ages compared to the average distribution of migrants by frequency.
Since marriage exposes women to conception, the data indicate that childbearing will start early for more nonmigrants, especially those coming from rural areas, than for the rest of the sub-groups. Data on mean age at first marriage indicate, though, that there is very little variation between the sub-groups. The average exposure to childbearing among the CMW in the sample, therefore, will relatively be the same.
4.2.5 CONTRACEPTIVE KNOWLEDGE AND USE STATUSNearly every woman in the sample had heard of at least
one family planning method (Table 4.10). However, while 59 per cent of rural non-migrants and 53 per cent of rural to rural migrants had heard of contraception, they had never tried any method. In contrast, only 3 6 per cent of urban to urban migrants had heard but never used contraceptivemethods.
50
Table 4.10CONTRACEPTIVE KNOWLEDGE/USE STATUS OF CMU AT THE TIME OF SURVEY
BY MIGRATION STATUS, PHILIPPINES, 1983 (In Percentages)
========================================================================================:==========CONTRACEPTIVE KNOWLEDGE/USE STATUS
MIGRATIONSTATUS
Never Heard & Never Used
Heard But Never Used
Tried But Not Currently Using
CurrentlyUsing % N
TOTAL SAMPLE OF CMU 2.1 49.9 17.6 30.4 100.0 5092
NON-MIGRANTSUrban 1.0 44.6 19.2 35.2 100.0 750Rural 4.1 59.0 14.1 22.8 100.0 1781
MIGRANTS, BY STREAMUrban-Urban 0.8 36.0 22.1 41.1 100.0 753Urban-Rural 0.9 48.3 18.7 32.1 100.0 637Rural-Rural 1.5 52.9 17.0 28.6 100.0 835Rural-Urban 1.0 41.6 22.3 35.1 100.0 336
MIGRANTS, BY FREQUENCYMoved Once 1.4 48.8 17.1 32.7 100.0 1167Multiple, Return 0.8 45.4 20.0 33.8 100.0 455Multiple, Repeat 0.9 41.0 22.6 35.5 100.0 939
SOURCE: Computed from the 1983 National Demographic Survey datatape (weighted results).
About 41 per cent of urban to urban migrants were currently using contraceptive methods, which is 11 per cent more than their urban non-migrant counterparts. However, there were five per cent less urban to rural migrants compared to urban non-migrants in this category. On the other hand, both rural to rural and rural to urban migrants included more current users than rural non-migrants.
Ever-users of contraceptive methods were derived by adding the current users and those who have tried but were not currently using. Here, the same pattern is observed wherein rural non-migrants included only 37 per cent of ever users compared to rural to rural (46 per cent) and rural to urban (57 per cent) migrants. Also, more urban to urban
51
migrants were ever-users than urban non-migrants, while fewer urban to rural migrants were ever-users. Among the migrants by frequency, the largest number of ever-users were repeat migrants (58 per cent) while the least were among women who moved only once (50 per cent) . The results indicate that women who, at one time or another, resided in an urban area or who migrate more often are likely to know about or be using contraceptive methods.
4.3 SummaryThe selectivity of migrants, specifically in terms of
age, marital status and labour force participation, has been supported by this study. Over the years, though, there have been perceptible changes in the characteristics of movers. Compared to migrants in the '50s and '60s, there were more married women, more high school and college level achievers, and more housing-related (versus economic-related) moves in the '70s.
In contrasting migrants and non-migrants at the time of survey, there was a distinct pattern in the socio-economic characteristics of the women whereby migrants, either by stream or frequency, were generally "better off" than rural non-migrants. That is, migrants had higher levels of education, were engaged in economic activities, were married at a later age, and more likely to be using contraceptive methods than rural non-migrants. However, urban non-migrants in turn had higher levels than the migrants.
Interestingly, the study tends to manifest a pattern of selectivity among migrants whose place of destination was
52
urban. For instance, urban to urban and rural to urban migrants displayed the foregoing characteristics just as much, if not more than, urban non-migrants. Urban to rural migrants, although originating from an urban area, however, did not compare well with urban non-migrants (although they were "better-off" than rural non-migrants). The tendency for the better-educated, the more economically active, and the family planner migrating to urban areas indicate a potential imbalance of human resources that could have long-term implications to rural areas. The issue that is about to be addressed is whether migrant women also bring with them the fertility behaviour prevailing in their place of origin or whether interaction with the population in areas of destination motivates them to adopt the fertility practicesthereat.
53
CHAPTER 5. CUMULATIVE AND CURRENT FERTILITY DIFFERENTIALS BETWEEN MIGRANTS AND NON-MIGRANTS
This chapter seeks to ascertain whether there are any differences in cumulative and current fertility behaviour between migrants and non-migrants. The conceptual framework developed earlier serves to guide the analysis that will be undertaken, albeit less comprehensively, in order to test the hypotheses proposed in this study (cf. Chapter 3) in as simple and straightforward a manner as possible.
More than a biological phenomenon, fertility is a sociological and cultural issue (Engracia and Kim, 1979:1). It is largely influenced by prevailing customs, values and social practices in the community so that, in many ways, society bears upon people's normative behaviour. To the extent, therefore, that social, economic and cultural disparities exist, fertility differentials may be observed. And there is all too obvious a difference in lifestyles and standards of living between urban and rural societies. Hence, it is expected that differences in fertility behaviour will exist between these two types of areas.
Empirical studies, as earlier discussed, generally confirm the prevalence of lower fertility in urban areas compared to rural areas. As a result of movements from one place to another and their inevitable exposure to the norms and values prevailing at places of destination, the question arises as to whether women migrants eventually adapt the fertility behaviour observed thereat. Results of researches undertaken in this regard have been diverse. For instance,
54
while studies in Bombay (Visaria, 1971) , Bangkok (Goldstein, 1973) , Korea (Ro, 1976) and Ghana (Ankrah, 1979) indicate lower fertility among female migrants to urban areas compared to non-migrants in places of origin and destination, studies in four Latin American cities (Myers, 1966 as cited in Ankrah, 1979), in Puerto Rico (Macisco, Bouvier and Weller, 1970) and in the Iranian city of Isfahan (Gulick and Gulick, 1976) found the fertility of migrants to be higher than that of native urban non-migrants.
Furthermore, researches in Thailand (Goldstein and Tirasawat, 1977), and in Bangkok and Bogota (Magnani, 1980) observed lower fertility among younger migrants to urban areas and similar or higher fertility among older migrants as compared to natives of similar ages, indicating a "crossingover" between the ages of 30 and 40. But then again,Hendershot's (1971) study of migration to Manila andElizaga's (1966) analysis of fertility differences forSantiago, Chile point to higher fertility among younger migrants and lower fertility among older migrants compared to similarly aged natives.
Such contradictions in research findings have been attributed by Zarate and Zarate (1975) to methodological and analytical variations in addition to, or instead of, differences in migration and fertility per se. Macisco (1968) observes further that there have been differences in study design, samples studied, and operationalization of key concepts of migration and fertility, making comparisons of studies difficult. But Goldscheider (1971) maintains that
55
the absence of conceptual frameworks and organizing schemes has led researches to be fragmented, undirected and theoretically sterile.
This study benefitted from the detailed migration and pregnancy histories retrieved from the 1983 National Demographic Survey which provided a better perspective on issues which have been difficult to investigate with traditional cross-sectional data. Studies made by Hiday (1978), Hendershot (1971), and most Philippine research on the subject matter have been constrained by the limited data they had during their time, so much so that they had to be contented to examine simply the cumulative fertility behaviour of survey respondents. The present study goes beyond the analysis of children ever born.
The first part of the analysis looks at results of crosstabulations on cumulative fertility (the mean number of children ever born - CEB) among migrants and non-migrants, controlling for age, with education, labour force participation, and contraceptive use status serving as independent variables. Calculations, controlling for duration of marriage, were also undertaken to determine fertility differentials according to the woman's exposure to the risk of pregnancy. Results showed minor departures from findings when controlling for age. Hence, only the summary measure (i.e. mean number of CEB in each sub-group, standardized by duration of marriage) will be featured in thetables.
56
There are disadvantages in relying on differentials in cumulative fertility because of the possibility of births occurring during prior migration experiences (as in the case of multiple movers). Hence, attributing changes infertility behaviour to the possibility of having assimilated the behaviour at the place of destination (specifically at the time of survey) may be too sweeping if not inaccurate. Hence, by way of improving the analysis, differences in current fertility as measured by the marital age-specific fertility and total marital fertility rates among migrants and non-migrants were also investigated. Further analysis on pregnancy intervals will be presented in the next chapter.
5.1 Cumulative Fertility Differentials Among Migrants andNon-MigrantsIn order to maintain a sufficient number of cases for a
more credible analysis, the categories of migrants by stream were reduced to urban migrants (whose destination is urban) and rural migrants (whose destination is rural). The intention here is to find out the impact of the place of destination on the fertility behaviour of migrants.
Table 5.1 shows the mean number of children ever born (CEB) for currently married women (CMW) by age groups. At the younger ages of 15-24 the fertility of CMW of all migration statuses are practically the same. Between the ages 2 5 and 49, however, the mean number of CEB among wives in urban areas is clearly lower than their rural counterparts. Furthermore, urban and rural non-migrants have higher age-standardized mean numbers of CEB compared to urban and rural migrants, although differences across the age
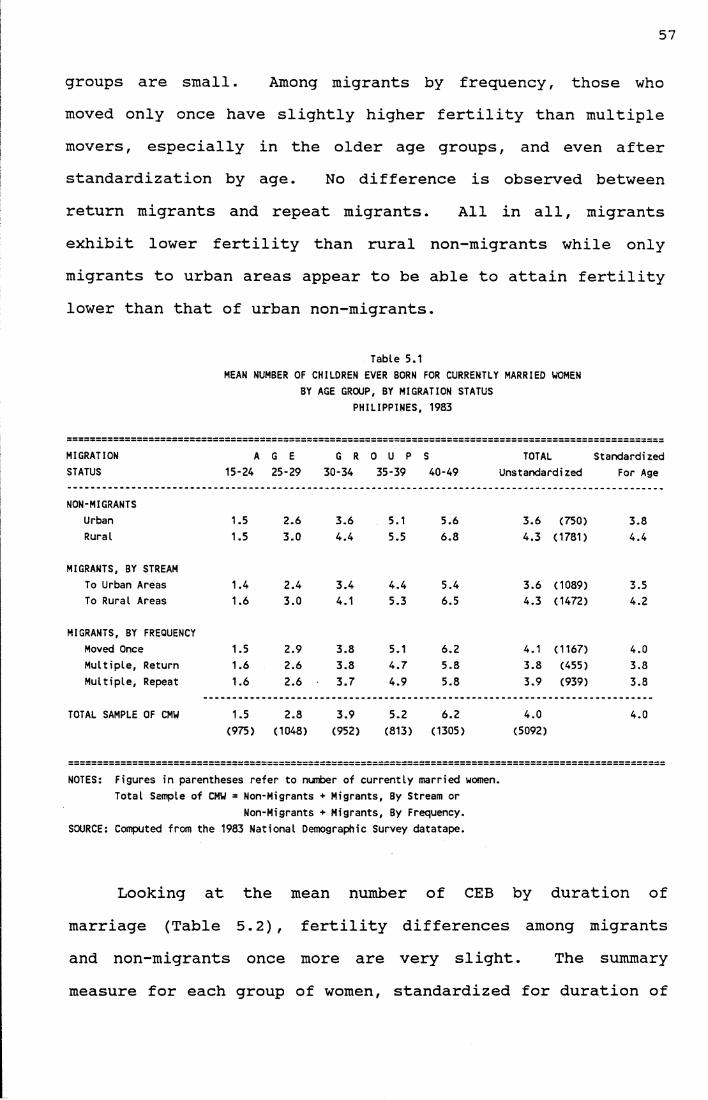
57
groups are small. Among migrants by frequency, those who moved only once have slightly higher fertility than multiple movers, especially in the older age groups, and even after standardization by age. No difference is observed between return migrants and repeat migrants. All in all, migrants exhibit lower fertility than rural non-migrants while only migrants to urban areas appear to be able to attain fertility lower than that of urban non-migrants.
Table 5.1MEAN NUMBER OF CHILDREN EVER BORN FOR CURRENTLY MARRIED WOMEN
BY AGE GROUP, BY MIGRATION STATUS PHILIPPINES, 1983
MIGRATION A G E G R O U P S TOTAL StandardizedSTATUS 15-24 25-29 30-34 35-39 40-49 Unstandardi zed For Age
NON-MIGRANTSUrban 1.5 2.6 3.6 5.1 5.6 3.6 (750) 3.8Rural 1.5 3.0 4.4 5.5 6.8 4.3 (1731) 4.4
MIGRANTS, BY STREAMTo Urban Areas 1.4 2.4 3.4 4.4 5.4 3.6 (1089) 3.5To Rural Areas 1.6 3.0 4.1 5.3 6.5 4.3 (1472) 4.2
MIGRANTS, BY FREQUENCYMoved Once 1.5 2.9 3.8 5.1 6.2 4.1 (1167) 4.0Multiple, Return 1.6 2.6 3.8 4.7 5.8 3.8 (455) 3.8Multiple, Repeat 1.6 2.6 3.7 4.9 5.8 3.9 (939) 3.8
TOTAL SAMPLE OF CMW 1.5(975)
2.8(1048)
3.9(952)
5.2(813)
6.2(1305)
4.0(5092)
4.0
NOTES: Figures in parentheses refer to number of currently married women.Total Sample of CMW = Non-Migrants + Migrants, By Stream or
Non-Migrants + Migrants, By Frequency. SOURCE: Computed from the 1983 National Demographic Survey datatape.
Looking at the mean number of CEB by duration of marriage (Table 5.2), fertility differences among migrants and non-migrants once more are very slight. The summary measure for each group of women, standardized for duration of
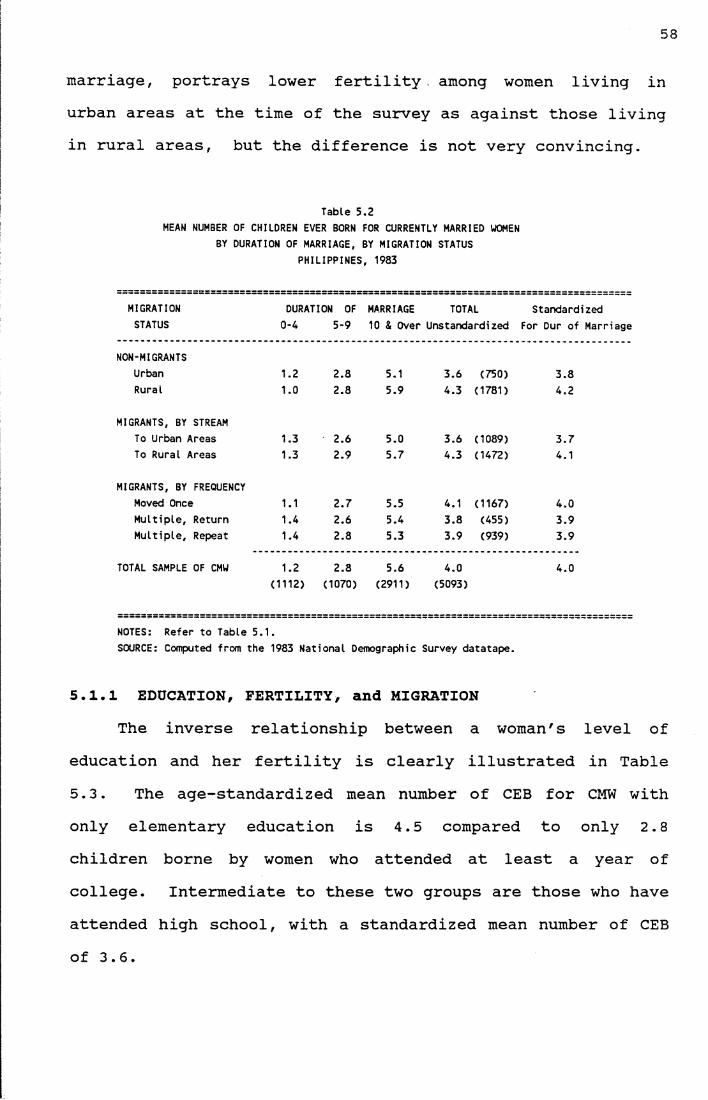
58
marriage, portrays lower fertility among women living in urban areas at the time of the survey as against those living in rural areas, but the difference is not very convincing.
Table 5.2MEAN NUMBER OF CHILDREN EVER BORN FOR CURRENTLY MARRIED WOMEN
BY DURATION OF MARRIAGE, BY MIGRATION STATUS PHILIPPINES, 1983
========================================================================================MIGRATIONSTATUS
DURATION OF 0-4 5-9
MARRIAGE 10 & Over
TOTALUnstandardized
Standardized For Dur of Marriage
NON-MIGRANTSUrban 1.2 2.8 5.1 3.6 (750) 3.8Rural 1.0 2.8 5.9 4.3 (1781) 4.2
MIGRANTS, BY STREAMTo Urban Areas 1.3 2.6 5.0 3.6 (1089) 3.7To Rural Areas 1.3 2.9 5.7 4.3 (1472) 4.1
MIGRANTS, BY FREQUENCYMoved Once 1.1 2.7 5.5 4.1 (1167) 4.0Multiple, Return 1.4 2.6 5.4 3.8 (455) 3.9Multiple, Repeat 1.4 2.8 5.3 3.9 (939) 3.9
TOTAL SAMPLE OF CMW 1.2(1112)
2.8(1070)
5.6(2911)
4.0(5093)
4.0
NOTES: Refer to Table 5.1.SOURCE: Computed from the 1983 National Demographic Survey datatape.
5.1.1 EDUCATION, FERTILITY, and MIGRATIONThe inverse relationship between a woman's level of
education and her fertility is clearly illustrated in Table 5.3. The age-standardized mean number of CEB for CMW withonly elementary education is 4.5 compared to only 2.8 children borne by women who attended at least a year of college. Intermediate to these two groups are those who have attended high school, with a standardized mean number of CEBof 3.6
Table
5.3
MEAN N
UMBER
OF C
HILDREN
EVER B
ORN
FOR
CURREN
TLY
MARR
IED
WOMEN
BY L
EVEL OF
EDUCATION
AND
AGE
GROUP
PHILIPPINES, 1983
59
II -H id 1 i iII 2 -H 1 i iII ttJ u 1 rH np rH n r *3* rH CN i 00 VO m as m as 00 i r*II M u 1 • • • • • • • i • • • • • • in Q P id 1 n r n r <3* np n r *3* <3* i 00 O0 00 oo cn oo oo i oon 2 Q £ 1 i iii eg 1 i iit l-H > . 2 1 i iu Q 2 0 1 i iu 2 1 i iii < 1 i iii Q 0) 1 i in 2 01 1 00 r - o m VO rH CM i m p - r - oo o i n CO 00 i voH < < 1 • • • • • • • i • • • • i11 E-* 1 n r n r n r n r np *3* i n r 00 oo oo cn oo 00 i 00II CO >1 1 i iIt CQ 1 i iII 1 i in 1 i ih 1 i iii T> 1 i iii 4) 1 i iii N 1 —* i iu •H 1 —K as i „—„ „—„ iii T3 1 00 00 CM rH VO r * O i m a \ VO 00 t " n r oo iii IH 1 00 CM 00 00 CM VO p - i 00 as r - *p cn rH p - iii id 1 00 tH n r as VO CN *3* i CM oo oo oo cn rH CM i» T ) 1 'h- ' r i r ■*—r •*>-r —- ■—" iii c 1 i o i 00ii <d 1 VO as nT 00 o rH VO i 00 nT rH o 00 m CM VO vo i CN mii 2 1 • • • • • • • i • OS • • • • • • • i • o oii (0 1 n r np *P np i n np *3* i n r CM 00 oo 00 00 cn o o 00 i oo rHii c 1 i i wii CD 1 i iii 1 i iii 1 i iii 1 i iit 1 i iii <3\ 1 i iii CO 1 CM O O p* o 00 rH i 00 VO o CN r - CM n r rH i CO 00it 1 1 • • • • • • • i • rH • • • • • • • i • n rii O 1 vo r - VO VO r - m VO i VO as m vo m vo m vo VO i m CNii « T 1 i iii 2 1 i * iii 1 i -It iii 1 i 2 iH 1 i iII I D CM 1 -It i iII cn 1 > -• r - as O r * c o 00 m i r * n r O rH rH 00 * P o o as i n r CMII 1 1 • • • • • • • i • 00 • • • • • • i • VOII lO 1 lO in in m m <3* in i m m in n r n r * P •«y m 00 i *p rHII O cn 1 i ■—* O iII 1 05 i iII 1 i i
1
05111
<iii
2 iii
cn 1 CM 00 CM m n r *3* <3* i vo VO o vo p* rH as CM VO i vo n rII 1 1 Eh • • • • • • i • O • • . • i • ooII O o 1 n r n r *3* n r n r *3* *3* i n r m 00 00 00 o o cn o o o o i 00 CNIt cn 1 i CO i w •II 1 2 i iII 1 i iII 1 i iII 1 2 i iII 01 1 i iII c m 1 np 00 OS n r m CN rH i 00 00 o o 00 m p* CO o i vo 00n l 1 £ • • • • • • • i • rH 2 • • • • • • • i • n rii m 1 00 00 CM 00 00 00 00 i 00 m CN CN CM CN CM CM CM i CM 00ii 2 CM 1 i iiiii
11
2 ii
o ii
iiiiii
o11 2
ii l-H
ii
!!1 i
ii
CM 1 Cd r * r * VO 00 CO 00 p* i p* as 2 m CN CM m CM CN P- i n r rHii < 1 1 • • • • • • • i • VO • • • • . • i • r*u LO 1 rH rH rH rH rH rH rH i rH n r rH rH rH rH r-1 rH rH i rH o oiiii
t"H 11
ii
ii
iin
11
ii >H
ii
it l £ 2 C 4-> £ 2 C 2it 1 < ID M td < 2 u idit l 2 to to a P 4) 2 m to a p 4)ii 1 2 fl «J 2 4-1 CU 2 id (d 2 2 an 1 Eh 4) 4) 2 4) 41 Eh 4) 4) 2 4) 4)ii l CO M M 2 2 2 2 M U 2 2 2it 1 < < 4) < < 41H 1 cn >H >H O «. v w >H O v «II 1 Eh 2 C •—I 2 C 4) 4) rH Eh 2 C •H 2 c 4) 41 i-Hn 1 2 to id o rH rH id 2 id id o *—1 i-H idii 2 1 < - JQ u » a a 4-) < » 2 M «. a a 2H o l C5 C *—1 c o M D cn T3 •<H ■H 0 2 C <-H 2 M p 2 T5 -H ■H 0II M l C5 (0 Eh D 2 Eh 4) •U 4J Eh O id id Eh 2 2 Eh 4) 2 2 Ehn Eh CO 1 l-H XI u 2 2 > rH rH 1 M 2 M 2 2 > rH i-H 1ii < ID 1 £ u D < 0 0 < 0 P p 2 £ M P < 0 0 < 0 p P 2ii 2 Eh 1 l ID 2 2 Eh Eh 2 £ £ £ P l 2 2 2 Eh £h 2 £ £ £ Pn O < 1 2 O O cn 2 O a c oii i-i Eh 1 O n M O l-H l-Hn £ CO 1 2 £ £ 2 £ £
cont
inue
d next p
age
STANDARDIZED
60
liIInit
oCM
0)O'«3a
iiiiii»ii
nHiiiiiiiiiiiiii»nHniiitHIIIIIIIIIIIIIIIIIIIIIIniiiiiiiiiiDIIIIIIIIIIIIII
nitiiiiii
I ii ii ii ii n ii ii ii n ii ii iiitiiniiiiHII Hnitiiiiitiiiiiiiiiiii
©p©
• 3n Va> ©p p
U td x : O 'C © 1 D p 10 o> l II V •p p
•P HJ 1 II id 3 mP -H 1 1 M 0(0 P 1 O co CM rH O CO CM 1 rH II O ' C CdP P 1 • • • • • • • 1 • 1 ©0 <0 1 CO co CO CO CO CO CO i co 1 > i E
a 2 1 1 u 0 £1 1 id 3 0
>1 P 1 1 P nCQ 0 1 II c T>
1 | © C A1 H £ © P
a) 1 i © -pO ' 1 r~ r-H P~ VO ON 00 i ao n rH - 3
< 1 • • • • • • • i • K © <01 <N co CM CM CM eg CM l eg n © C
> i 1 ii •o p ©CQ 1 H c © E
1 it © 3 01 i T) 31 ii ©
"0 1 H c P T>© 1 N 0 O ' CN 1 N. ,—, — .— H -H ©
-P 1 P- CO CM co T x> II P rHT> 1 r - 00 O' o r - O ' II © 0P 1 rH rH CM rH CM '— rH n o 0 10f l 1 «W '-- ' — '- r —• — .—„ » 3 A ©
•o 1 CM ii T> O Pc 1 v£> r~ 00 rH 00 O ' l r * in O ' » © in ©(0 1 • • • • • • • 1 • ON o n 3
p 1 eg eg CM CM co CO 1 eg r - m n • So A T)n 1 '—• ii c u O ' ©c 1 g V © •P P
2 1 II E P A O '1 n o c1 ii 5 © ©1 ii E C O ' •1 a i n © o © ©
O ' 1 in n © rH •p rH aCO •M’ 1 V£> lO co rH 00 ON in 1 rH ao o n •rH © p rH ©
1 1 • • . • • | • co co D H © 0 po l co CO g* T 1 rH rH n M © o O ©'T 1 ■*—' n © E 3 p
cu 1 H E o TJ *. ©1 11 to © c •o1 II So 01 * t| rH rH •p >
CD O ' l * a .—. II P c 0 p ©CO l « ON VO CM ao VO ao vT 1 ao r - CO II C 0 0 © >1 l • • . • • 1 • rH rH H © -H A o p
m 1 Cd CO co CO co eg CO 1 co rH 00 II p p o 3 3O co 1 —' '—' II M © m T) CQ
1 « S3 O ©1 1 0 S3 A O1 o II TJ tji © •P
Cd 1 II <M © •P O ' AHT 1 a R 0 A © aCO 1 O ON r~ o o ao 00 1 ON eg CM II 0 rH ©1 1 Cd • • • • • • • 1 • rH m g M C © •H p
O o 1 co eg CM CO CO eg CM 1 eg eg O ' 8 © E 0 O 'CO 1 — R 0 o 0
1 8 e p co E1 ►d II 3 -H ©1 R C 3 A E a1 R P 0
O ' 1 ,—» ,—. R 0 C •P n rHCM 1 rd ON rH MO O ' VO ON 00 l ao eg ao R P © 3 ©1 1 • • . • • • • 1 • ON R E A G
m 1 rH eg rH rH rH rH rH 1 rH rH o R M 0 C P 0Cd cm 1 rH R © 3 © •P ■P
1 o - r R 4H E 3 P1 R © CO 0 ©1 g M M' 3 C 2
a 1 R rH ©1 o R in (0 E CO
■̂ r 1 a .—* II © 10 © 0 aoCM 1 rH rH CO r - rH rH o 1 rH in m R m © T> 3 O '
< l 1 • • . • • • • | • co R © T3 3 rHin 1 rH rH rH o rH rH rH 1 rH rH O ' II jS 3 rH mrH 1 >—* ---■ II P rH U © ©
1 || C O c T> A1 R © C •p 3 P1 R M -P rH1 o R © 1 0 £1 2 R Cd 1 • c 01 2 Cd c P s R rH O' •p P1 < 2 u © 2 R C > 0 c P1 Cd «0 CO c * D 0) U R ■P P 0 •p 11 OS f l (0 Cd a R © A c V1 Eh a) © 2 <1) © ClH R n p 0 •p © ©1 CO P p Cd os o R © C CQ © O ' p1 < < <D fl p © p © 31 co >H >H O Cd R 3 E A p rH a1 H CQ C rH CQ C <D a) rd R O ' © O ' rH E1 2 tO © o rH rH fU td II •P rH •P rH 0 0
2 1 < - _Q p a Cd •P 2 R Cb Cd 2 © CJ • oO 1 cd C *H CO p 3 CO V •H •P 0 < II c O'M 1 O CÖ (T3 Eh 2 OS Eh a) 4J P CQ R HC HI 0 * c ••H CO 1 M A P 2 2 > rH rH 1 R • • He ■p * -p Cd
1 2 p 3 < 0 0 < o 0 3 X) hd R CQ p * c CJa h l 1 2 os OS Eh Eh OS 2 s 2 D < II Cd © -p OSo < 1 2 O a C/) Eh R Eh 0 © 2M E-l 1 O HH hH O R O 0 p O2 CO 1 2 2 2 Eh fl 2 > p CQ
61
Earlier comparison of educational attainment between non-migrants and migrants depicted the latter as having achieved higher levels of schooling than the former, which could lead one to expect migrants to have lower fertility than non-migrants. Findley (1977:66) puts forward two hypotheses on why education could facilitate fertility decline. First, education may enable women to find work which may compete with large families. Second, education may lead to a broader understanding of the benefits and risks associated with reduced family size and an increased willingness to take such risks.
When looking at the fertility behaviour of migrants and non-migrants by level of education, however, one is confronted with only slight differences across the age groups. What is conspicuous is that older urban non-migrants and urban migrants with elementary education have, on the average, almost one child less than rural non-migrants and rural migrants. Among migrants, by frequency, those in age group 4 0-49 and who moved only once exhibited the highest mean number of CEB (7.0) compared to multiple return (5.8) or multiple repeat migrants (6.1).
For wives with high school education, migrants to urban areas have lower fertility compared to either urban or rural non-migrants. On the other hand, migrants to rural areas have higher fertility than the non-migrants. Both age-and marriage duration-standardized mean number of CEB, however, showed very little differences between the sub-groups. Contrary to what was shown at the elementary level, women who
62
moved only once had lower fertility than multiple migrants. Differences are observed starting in age groups 35-39, although here the multiple (repeat) movers exhibited low fertility as well.
Finally, for women with college education, urban and rural migrants showed lower fertility after standardization compared to rural non-migrants. Urban non-migrants registered the lowest fertility when considering both standardized and unstandardized measures, even though urban migrants had lower fertility between the age groups 25-29 up to 35-39. One-time movers, as was found out among high school achievers, had fewer children compared to multiple movers, particularly in the later ages between 40-49. At the college level, the multiple (return) migrants had lower fertility compared to the other migrants by frequency in the age group 35-39.
The general pattern that has emerged from the tables is that of similar fertility in younger ages, then a slightly higher fertility in the older age groups. Some "cross-over" from slightly higher fertility among younger migrants to lower fertility among older migrants is perceptible among those whose destination is rural and specifically among elementary and high school achievers. No such trend is present among urban migrants nor college-level migrants.
It is interesting to note that the difference between the mean number of CEB for elementary and high school levels is greater compared to the difference between high school and college levels. This observation hints at a threshold level
63
where the impact of further education will be less. However, further analysis to isolate the impact of increments inschooling on further reducing fertility may need to becarried out.
5.1.2 LABOUR FORCE PARTICIPATION, FERTILITY and MIGRATION
The participation of women in the labour force has often been viewed as a means by which fertility decline may be effected. Partly, this is because of its correlation with education (i.e. persons in the labour force are more likely to have some formal or informal training) and partly because of its potential influence on the decision of couples as regards their family size, particularly when opportunitycosts are considered. Also, it is hypothesized that women who work in higher level occupations will have lowerfertility because these occupations tend to be incompatible with the role of housewife (Findley, 1977:67). In thefollowing analysis, the reader is cautioned that the information on labour force refers to the status of women only at the time of survey and, therefore, does not reflect the actual work history of women during their entire childbearing period.
Table 5.4a shows that working wives indeed tend to have fewer children than non-working wives. For instance, the completed family size of working women (5.7) aged 40-49 is about one child less than that of non-working women (6.5). Non-migrants exhibit higher fertility compared to migrants but differences across the age groups are not consistent. In general, rural non-migrants registered the highest
64
Table 5.4aMEAN NUMBER OF CHILDREN EVER BORN FOR CURRENTLY MARRIED WOMEN
BY ECONOMIC,ACTIVITY AND AGE GROUP PHILIPPINES, 1983
S T A N D A R D I Z E DMIGRATION A G E G R O U P S By DurationSTATUS 15-24 25-29 30-34 35-39 40-49 Unstandardized By Age of Marriage
W 0 R K I N GNON-MIGRANTS
Urban 1.2 2.1 3.2 4.8 4.8 3.6 (245) 3.2 3.5Rural 1.4 2.9 4.2 5.5 6.7 4.7 (395) 4.2 4.2
MIGRANTS, BY STREAMTo Urban Areas 1.3 1.9 3.0 4.1 5.0 3.5 (411) 3.1 3.4To Rural Areas 1.7 2.8 3.8 5.2 6.1 4.4 (358) 4.0 4.1
MIGRANTS, BY FREQUENCYMoved Once 1.4 2.4 3.2 4.6 5.4 4.0 (324) 3.5 3.6Multiple, Return 1.7 2.7 3.5 4.3 5.5 3.7 (142) 3.6 3.9Multiple, Repeat 1.3 1.9 3.4 4.6 5.6 4.0 (302) 3.5 3.7
Sub-Total 1.4 2.4 3.5 4.9 5.7 4.1 3.7 3.8(133) (248) (308) (283) (437) (1409)
N O T W 0 R K I N GNON-MIGRANTS
Urban 1.5 2.8 3.9 5.4 6.1 3.6 (506) 4 .0 4.0Rural 1.5 3.1 4.5 5.6 6.9 4.2 (1384) 4.4 4.2
MIGRANTS, 3Y STREAMTo Urban Areas 1.4 2.6 3.6 4.8 5.7 3.6 (78) 3.7 3.8To Rural Areas 1.6 3.0 4.2 5.3 5.6 4.2 (1114) 4.0 4.2
MIGRANTS, BY FREQUENCYMoved Once 1.5 3.0 4.0 5.3 6.7 4.1 (842) 4.2 4.1Multiple, Return 1.6 2.6 4.0 4.9 6.0 3.8 (313) 3.9 4.0Multiple, Repeat 1.6 2.9 3.9 5.0 5.9 3.9 (637) 4.0 4.0
Sub-Total 1.5 2.9 4.1 5.3 6.5 4.0 4.2 4.1(843) (798) (644) (530) (868) (3682)
TOTAL SAMPLE OF CMW (975) (1048) (952) (813) (1305) (5092)
NOTES: Figures in parentheses refer to number of currently married women.SOURCE: Computed from the 1983 National Demographic Survey datatape
65
fertility, and urban migrants the lowest, both in the working and non-working categories.
In order to better demonstrate the impact of employment on fertility, Table 5.4b presents the mean number of CEB according to the mother's type of occupation; that is, whether they were employed in white collar or non-white collar occupations (see Appendix C for detailed classification). The figures show that women with non-white collar jobs had, on the average, more children in all age groups (but more pronounced in older years) than women with white collar jobs. While minute differences are observed among migrants and non-migrants among the white collar occupation category, a more pronounced variation in fertility is exhibited in the non-white collar occupation group. Migrants, particularly to rural places, had lower fertility than their non-migrant counterparts. In the age group 40-49, rural non-migrants experienced the highest fertility with 7.1 children, compared to only 5.3 children borne by urban nonmigrants or even 6.6 children borne by rural migrants. Among migrants by frequency, women in white collar jobs and who experienced multiple (repeat) moves had about one child less than one-time movers, or nearly so, compared to multiple (return) movers in the older age group.
In summary, although some distinct variation in fertility is detected between women with white collar and non-white collar jobs, a rather weak relationship is observed between labour force participation (i.e. classifying CMW into the general working or not working categories) and fertility.
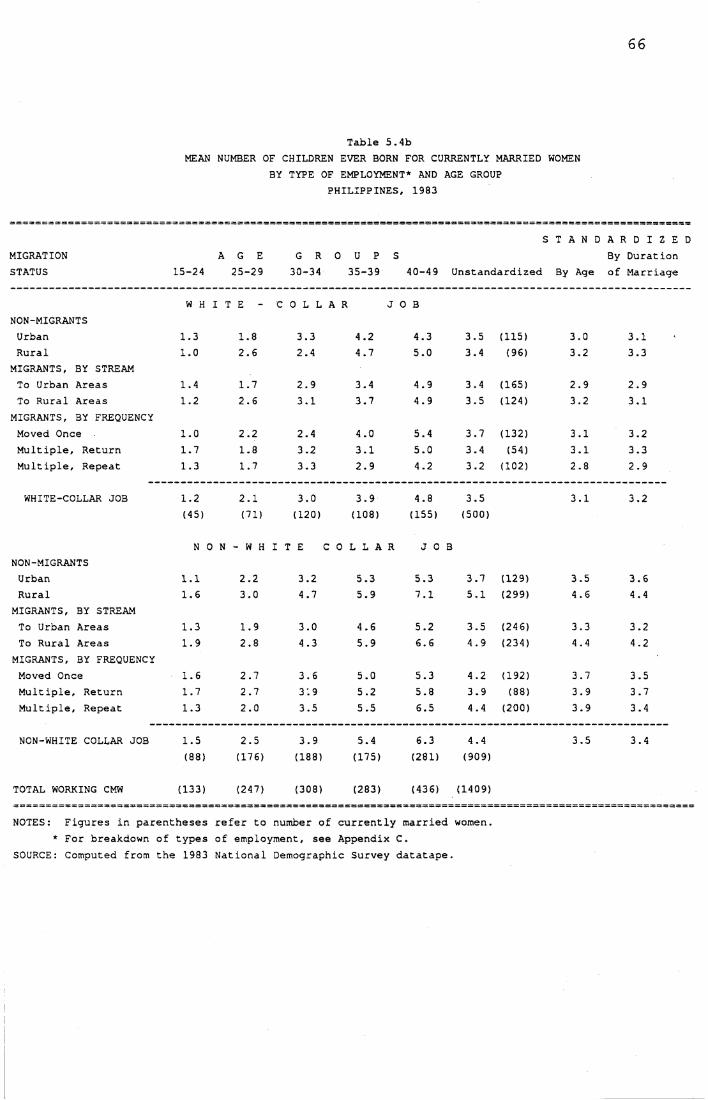
66
Table 5.4bMEAN NUMBER OF CHILDREN EVER BORN FOR CURRENTLY MARRIED WOMEN
BY TYPE OF EMPLOYMENT* AND AGE GROUP PHILIPPINES, 1983
S T A N D A R D I Z E DMIGRATION A G E G R O U P S By DurationSTATUS 15-24 25-29 30-34 35-39 40-49 Unstandardized By Age of Marriage
W H I T E C O L L A R J O BNON-MIGRANTSUrban 1.3 1.8 3.3 4.2 4.3 3.5 (115) 3.0 3.1Rural 1.0 2.6 2.4 4.7 5.0 3.4 (96) 3.2 3.3
MIGRANTS, BY STREAMTo Urban Areas 1.4 1.7 2.9 3.4 4.9 3.4 (165) 2.9 2.9To Rural Areas 1.2 2.6 3.1 3.7 4.9 3.5 (124) 3.2 3.1
MIGRANTS, BY FREQUENCYMoved Once 1.0 2.2 2.4 4.0 5.4 3.7 (132) 3.1 3.2Multiple, Return 1.7 1.8 3.2 3.1 5.0 3.4 (54) 3.1 3.3Multiple, Repeat 1.3 1.7 3.3 2.9 4.2 3.2 (102) 2.9 2.9
WHITE-COLLAR JOB 1.2 2.1 3.0 3.9 4.8 3.5 3.1 3.2(45) (71) (120) (108) (155) (500)
N 0 N - W H I T E C O L L A R J O BNON-MIGRANTSUrban 1.1 2.2 3.2 5.3 5.3 3.7 (129) 3.5 3.6Rural 1.6 3.0 4.7 5.9 7.1 5.1 (299) 4.6 4.4
MIGRANTS, BY STREAMTo Urban Areas 1.3 1.9 3.0 4.6 5.2 3.5 (246) 3.3 3.2To Rural Areas 1.9 2.8 4.3 5.9 6.6 4.9 (234) 4.4 4.2
MIGRANTS, BY FREQUENCYMoved Once 1.6 2.7 3.6 5.0 5.3 4.2 (192) 3.7 3.5Multiple, Return 1.7 2.7 3‘.9 5.2 5.8 3.9 (88) 3.9 3.7Multiple, Repeat 1.3 2.0 3.5 5.5 6.5 4.4 (200) 3.9 3.4
NON-WHITE COLLAR JOB 1.5 2.5 3.9 5.4 6.3 4.4 3.5 3.4(88) (176) (188) (175) (281) (909)
TOTAL WORKING CMW (133) (247) (308) (283) (436) (1409)
NOTES: Figures in parentheses refer to number of currently married women.* For breakdown of types of employment, see Appendix C.
SOURCE: Computed from the 1983 National Demographic Survey datatape.
67
This phenomenon may be explained by the system of extended families in the Philippines (Engracia and Kim, 1979:19-20). Here, conflict in the role of mother and worker is reduced as relatives can be depended upon to assist in child-rearing while the mother is away for work. Moreover, helpers can be hired at a relatively cheap rate to relieve mothers of the task of looking after the children.
5.1.3 STATUS OF CONTRACEPTIVE USE, FERTILITY and MIGRATIONThe use of modern contraceptive methods became popular
in the Philippines only in the early '70s when the government officially launched its Family Planning Program. But already, as illustrated in Table 4.10 a majority of the wives interviewed had heard of and, for purposes of either limiting or spacing births, tried at least one method.
Tables 5.5 presents the mean number of CEB for never- users and ever-users of contraception. Curiously, the figures show that ever-users (those who have tried at least one modern method of contraception) had slightly higher fertility than wives who had never used a method and this is manifested in almost all ages. For example, never-user migrants to urban areas and multiple movers in the age group 40-49 had one child less than their ever-user counterparts. This observation indicates that family planning is more likely being sought out by wives with larger families. This pattern was, likewise, noted by Engracia and Kim (1979) in their study of fertility differentials among Filipino women wherein they surmised that couples with small family size had little inclination to practice birth control.
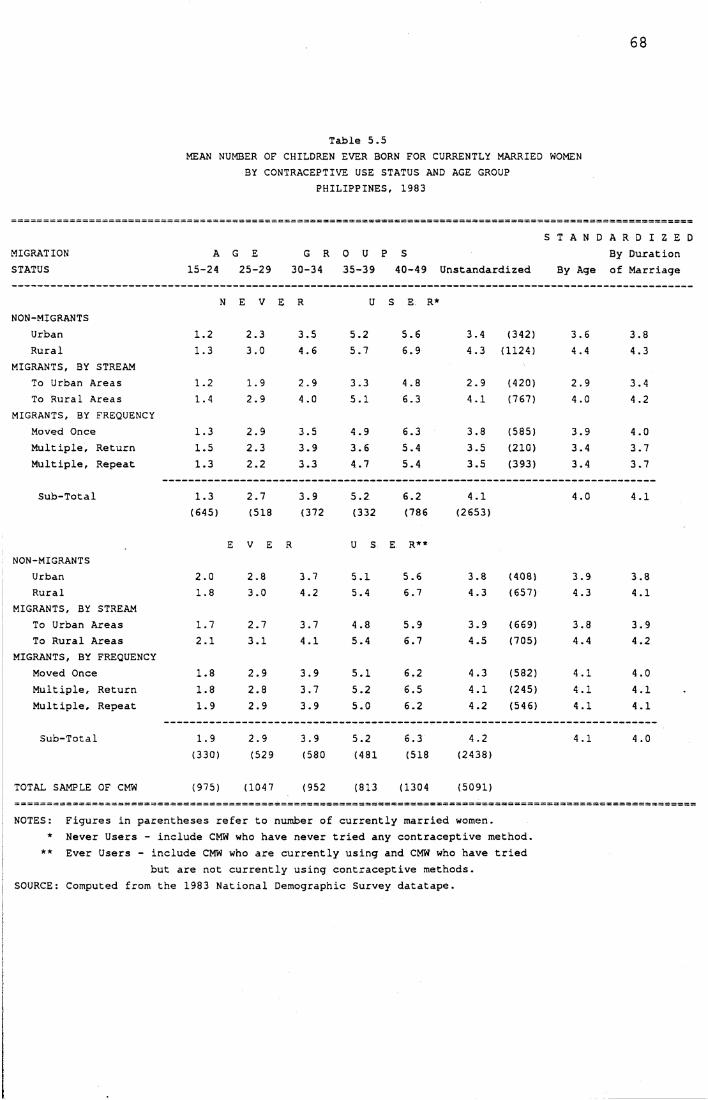
68
Table 5.5MEAN NUMBER OF CHILDREN EVER BORN FOR CURRENTLY MARRIED WOMEN
BY CONTRACEPTIVE USE STATUS AND AGE GROUP PHILIPPINES, 1983
MIGRATIONSTATUS
A15-24
G E 25-29
G R 30-34
0 U 35-39
P S 40-49 Unstandardized
S T A N D
By Age
A R D I Z E D By Duration of Marriage
N E V E R U S E R*NON-MIGRANTS
Urban 1.2 2.3 3.5 5.2 5.6 3.4 (342) 3.6 3.8Rural 1.3 3.0 4.6 5.7 6.9 4.3 (1124) 4.4 4.3
MIGRANTS, BY STREAMTo Urban Areas 1.2 1.9 2.9 3.3 4.8 2.9 (420) 2.9 3.4To Rural Areas 1.4 2.9 4.0 5.1 6.3 4.1 (767) 4.0 4.2
MIGRANTS, 3Y FREQUENCYMoved Once 1.3 2.9 3.5 4.9 6.3 3.8 (585) 3.9 4.0Multiple, Return 1.5 2.3 3.9 3.6 5.4 3.5 (210) 3.4 3.7Multiple, Repeat 1.3 2.2 3.3 4.7 5.4 3.5 (393) 3.4 3.7
Sub-Total 1.3 2.7 3.9 5.2 6.2 4.1 4.0 4.1(645) (518 (372 (332 (786 (2653)
E V E R U S E R**NON-MIGRANTS
Urban 2.0 2.8 3.7 5.1 5.6 3.8 (408) 3.9 3.8Rura 1 1.8 3.0 4.2 5.4 6.7 4.3 (657) 4.3 4.1
MIGRANTS, BY STREAMTo Urban Areas 1.7 2.7 3.7 4.8 5.9 3.9 (669) 3.8 3.9To Rural Areas 2.1 3.1 4.1 5.4 6.7 4.5 (705) 4.4 4.2
MIGRANTS, BY FREQUENCYMoved Once 1.8 2.9 3.9 5.1 6.2 4.3 (582) 4.1 4.0Multiple, Return 1.8 2.8 3.7 5.2 6.5 4.1 (245) 4.1 4.1Multiple, Repeat 1.9 2.9 3.9 5.0 6.2 4.2 (546) 4.1 4 .1
Sub-Total 1.9 2.9 3.9 5.2 6.3 4.2 4.1 4.0(330) (529 (580 (481 (518 (2438)
TOTAL SAMPLE OF CMW (975) (1047 (952 (813 (1304 (5091)
NOTES:
★ ★
SOURCE:
Figures in parentheses refer to number of currently married women.Never Users - include CMW who have never tried any contraceptive method. Ever Users - include CMW who are currently using and CMW who have tried
but are not currently using contraceptive methods.Computed from the 1983 National Demographic Survey datatape.
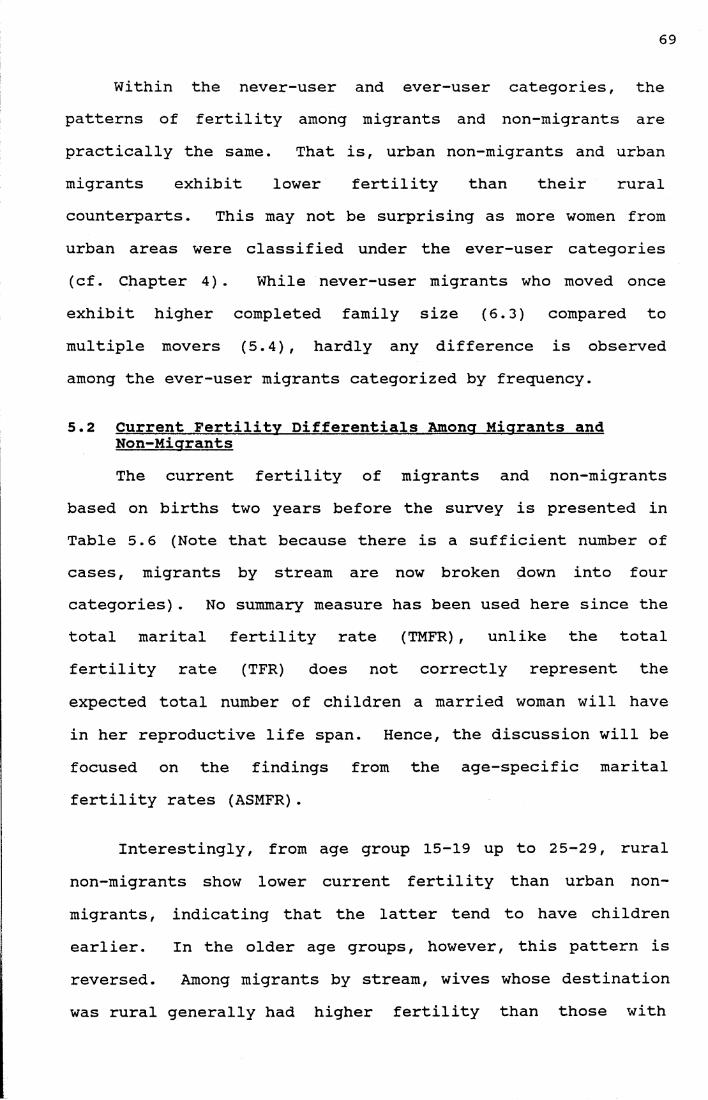
69
Within the never-user and ever-user categories, the patterns of fertility among migrants and non-migrants are practically the same. That is, urban non-migrants and urban migrants exhibit lower fertility than their rural counterparts. This may not be surprising as more women from urban areas were classified under the ever-user categories (cf. Chapter 4) . While never-user migrants who moved once exhibit higher completed family size (6.3) compared to multiple movers (5.4), hardly any difference is observed among the ever-user migrants categorized by frequency.
5.2 Current Fertility Differentials Among Migrants andNon-MigrantsThe current fertility of migrants and non-migrants
based on births two years before the survey is presented in Table 5.6 (Note that because there is a sufficient number of cases, migrants by stream are now broken down into four categories). No summary measure has been used here since the total marital fertility rate (TMFR), unlike the total fertility rate (TFR) does not correctly represent the expected total number of children a married woman will have in her reproductive life span. Hence, the discussion will be focused on the findings from the age-specific marital fertility rates (ASMFR).
Interestingly, from age group 15-19 up to 25-29, rural non-migrants show lower current fertility than urban nonmigrants, indicating that the latter tend to have children earlier. In the older age groups, however, this pattern is reversed. Among migrants by stream, wives whose destination was rural generally had higher fertility than those with
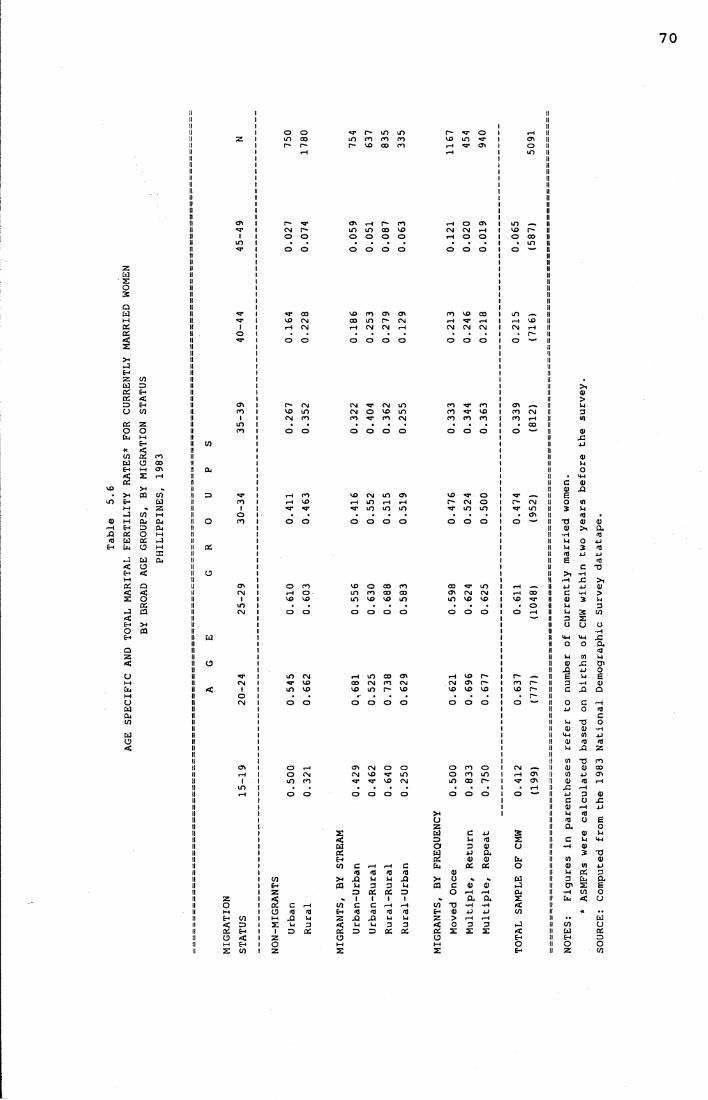
AGE
SPEC
IFIC
AND
TOT
AL M
ARIT
AL F
ERTI
LITY
RAT
ES*
FOR
CURR
ENTL
Y MA
RRIE
D WOME!
70
IIII||
Zo ouO 00r* r*
*3* P* in in lo co co co p- vo co co
r* oVO d"N 'VTH 'T
lj
ON IIO IIIT) ||
|| on
lD
r*cm r~ o oo o
ON H LO Oo o o o
p~ co CO VOo o o o
r-H o onCM CM rH»—♦ o oo o o
LO IIVß P IIo CO II
• lO ||O — II
<3* 00VO CM t-4 CMO O
VO CO ON ON CO lO P* CM rH (N CM rHO O O O
rn vo corH *3* rHCM CM CM O O O
in —rH VO CM rH• r- o ^
IIII
H<c/}zHH
S coo 00HH ONZ rH
S CO CJH zCO HH
(J HH:rcj a.o<Q<OXX
s
P- CM vo in cm coo o
rH CO rH VO *3* «3*O O
O CO rH OVO VOO O
CM CM lOcm o vo in ro co cmo o o o
VO CM Ln ON rH in rH rH in in ino o o o
VO O 00 COm co co com vo vo ino o o o
CO *3* COCO *3* VOCO CO COo o o
VO «3* O ( CM O*3* in in o o o
ST
4J
*3*cmin
. ONo
II
CM CM VO VO
O O O
m cm 3 vo m voo o
rH m ao on CO CM CO CM VO LO P“ voo o o o
rH vo r-CM ON [VO VO VOo o o
I— - -— . I!CO P* IIvo P II• r- iiO ^ II
O rHO CM m coo o
ON CM O O (\ vo ^ in vo r\jo o o o
^ <T3XI U u aZD X
c c<T3X> X)
<T3 <T3V4 X>D inX ZD<-H rH03 <TJu u
O CO o o co m in coo o o
C 4Jin <TJa O 4J a.<D 03 oc a:a? vrH r-Ha a.
3 32: z
CN ~r-l*T !T\
ws<inJ<OE->
ljII
II
i!ii
ii
NOTE
S:
Figu
res
in p
aren
thes
es re
fer
to n
umbe
r of
cur
rent
ly m
arri
ed
* AS
MFRs
wer
e ca
lcul
ated
bas
ed o
n bi
rths
of
CMW
with
in tw
o ye,
SOUR
CE:
Comp
uted
fr
om t
he 19
83 Na
tion
al De
mogr
aphi
c Su
rvey
dat
atap
e
71
urban destinations. Rural to rural migrants particularly experienced the highest ASMFRs in the very fertile age groups 15-19 up to 25-29. On the other hand, rural to urban migrants had the lowest fertility in age groups 15-24 and 35- 44. Among migrants by frequency, multiple movers posted higher ASMFRs than one-time movers. In fact, their fertility was markedly higher than that of non-migrants. Is it possible that higher fertility prompts couples to migrate more in search of better economic opportunities in other areas?
When comparing the migrants by stream from the nonmigrants no clear pattern emerges. Some age groups show lower fertility among migrants compared to their non-migrant counterparts, other age groups show higher fertility. This and the above-findings may indicate that it is not so much the process of moving per se that affects the fertility behaviour of women but the type of destination that generates an impact on women's outlook on childbearing. The issue on whether migration indeed has an impact on fertility has been brought to the fore.
72
CHAPTER 6. PREGNANCY INTERVAL DIFFERENTIALS AND MULTIPLECLASSIFICATION ANALYSIS
A different way of analyzing fertility differentials among migrants and non-migrants is to look at their average birth or pregnancy intervals. This chapter thus aims to contrast the average pregnancy intervals of migrants before and after their latest move with that of non-migrants to see whether either group is more likely to space their children closer to or farther from one another. Furthermore, by way of finding out whether migration has a significant impact as an explanatory variable for fertility differences among the currently married women covered in the survey, a multivariate analysis will be presented.
6.1 Pregnancy Interval Differentials Among Migrants andNon-MigrantsIn order to take into account all conceptions
experienced by the respondents, whether successful (livebirth) or not (stillbirth), the interval referred to in this study has been calculated from the termination of each pregnancy. As pointed out in Chapter 3, the interval between marriage and the first pregnancy termination was not included in the calculation because of complications brought about by some cases wherein the first pregnancy occured before marriage.
Table 6.1 shows the average pregnancy intervals of migrants and non-migrants, controlling for duration of marriage. In order to determine whether migration had any
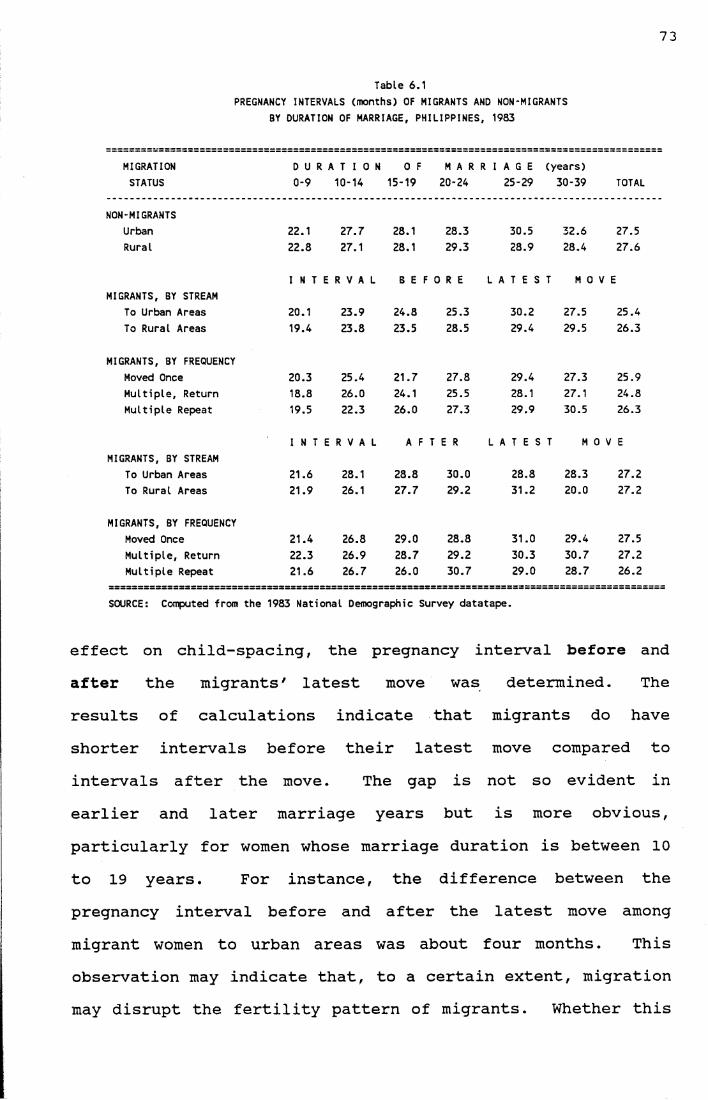
73
Table 6.1PREGNANCY INTERVALS (months) OF MIGRANTS AND NON-MIGRANTS
BY DURATION OF MARRIAGE, PHILIPPINES, 1983
MIGRATIONSTATUS
D U R 0-9
A T I 0 N 10-14
0 F 15-19
M A R20-24
R I A G E 25-29
(years)30-39 TOTAL
NON-MIGRANTSUrban 22.1 27.7 28.1 28.3 30.5 32.6 27.5Rural 22.8 27.1 28.1 29.3 28.9 28.4 27.6
I N T E R V A L B E F O R E L A T E S T M O V EMIGRANTS, BY STREAM
To Urban Areas 20.1 23.9 24.8 25.3 30.2 27.5 25.4To Rural Areas 19.4 23.8 23.5 28.5 29.4 29.5 26.3
MIGRANTS, BY FREQUENCYMoved Once 20.3 25.4 21.7 27.8 29.4 27.3 25.9Multiple, Return 18.8 26.0 24.1 25.5 28.1 27.1 24.8Multiple Repeat 19.5 22.3 26.0 27.3 29.9 30.5 26.3
I N T E R V A L A F T E R L A T E S T M 0 V EMIGRANTS, BY STREAM
To Urban Areas 21.6 28.1 28.8 30.0 28.8 28.3 27.2To Rural Areas 21.9 26.1 27.7 29.2 31.2 20.0 27.2
MIGRANTS, BY FREQUENCYMoved Once 21.4 26.8 29.0 28.8 31.0 29.4 27.5Multiple, Return 22.3 26.9 28.7 29.2 30.3 30.7 27.2Multiple Repeat 21.6 26.7 26.0 30.7 29.0 28.7 26.2
SOURCE: Computed from the 1983 National Demographic Survey datatape.
effect on child-spacing, the pregnancy interval before and after the migrants' latest move was determined. Theresults of calculations indicate that migrants do have shorter intervals before their latest move compared to intervals after the move. The gap is not so evident in earlier and later marriage years but is more obvious, particularly for women whose marriage duration is between 10 to 19 years. For instance, the difference between the pregnancy interval before and after the latest move among migrant women to urban areas was about four months. This observation may indicate that, to a certain extent, migration may disrupt the fertility pattern of migrants. Whether this

74
observation is temporary or permanent, however, would entail further examination of pregnancy intervals experienced by the migrants for some specified duration of stay after their move.
Curiously, there is hardly any difference in thepregnancy intervals among non-migrants in rural and urbanareas, among migrants to rural and urban areas, or amongmigrants by frequency of moves. Between migrants and nonmigrants, however, the former exhibit shorter intervals before the move, then relatively longer intervals after the move compared to the intervals of their non-migrantcounterparts. The differences between the average intervals of non-migrants with those of migrants after the move, however, are slight. This suggests that the disruptioneffect, implied earlier by the differences in intervals before and after the migration experience, hardly had any effect in prolonging the spacing of pregnancies of migrants compared to non-migrants.
Another approach to analyzing pregnancy intervaldifferentials is provided by Table 6.2a showing the distribution of migrants and non-migrants according to the average pregnancy interval. The figures show that the majority (about 76%) of the migrants had average pregnancy intervals of at most 12 months before their latest move, compared to only about 45 per cent after their latest move. In fact, while only about two per cent of the migrants had pregnancy intervals of more than 48 months preceding their
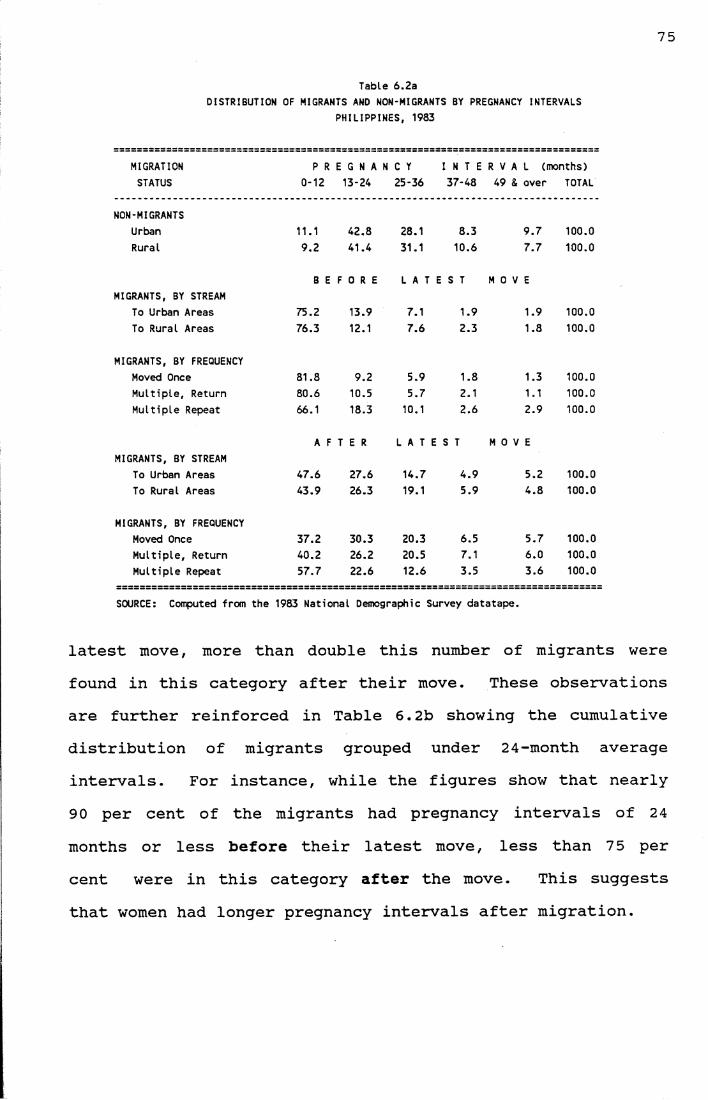
75
Table 6.2aDISTRIBUTION OF MIGRANTS AND NON-MIGRANTS BY PREGNANCY INTERVALS
PHILIPPINES, 1983
MIGRATIONSTATUS
P R 0-12
E G N A N 13-24
C Y 25-36
I N T E 37-48
R V A L (months) 49 & over TOTAL
NON-MIGRANTSUrban 11.1 42.8 28.1 8.3 9.7 100.0Rural 9.2 41.4 31.1 10.6 7.7 100.0
B E F O R E L A T E S T M O V EMIGRANTS, BY STREAM
To Urban Areas 75.2 13.9 7.1 1.9 1.9 100.0To Rural Areas 76.3 12.1 7.6 2.3 1.8 100.0
MIGRANTS, BY FREQUENCYMoved Once 81.8 9.2 5.9 1.8 1.3 100.0Multiple, Return 80.6 10.5 5.7 2.1 1.1 100.0Multiple Repeat 66.1 18.3 10.1 2.6 2.9 100.0
A F T E R L A T E S T M O V EMIGRANTS, BY STREAM
To Urban Areas 47.6 27.6 14.7 4.9 5.2 100.0To Rural Areas 43.9 26.3 19.1 5.9 4.8 100.0
MIGRANTS, BY FREQUENCYMoved Once 37.2 30.3 20.3 6.5 5.7 100.0Multiple, Return 40.2 26.2 20.5 7.1 6.0 100.0Multiple Repeat 57.7 22.6 12.6 3.5 3.6 100.0
SOURCE: Computed from the 1983 National Demographic Survey datatape.
latest move, more than double this number of migrants were found in this category after their move. These observations are further reinforced in Table 6.2b showing the cumulative distribution of migrants grouped under 24-month average intervals. For instance, while the figures show that nearly 90 per cent of the migrants had pregnancy intervals of 2 4 months or less before their latest move, less than 7 5 per cent were in this category after the move. This suggests that women had longer pregnancy intervals after migration.
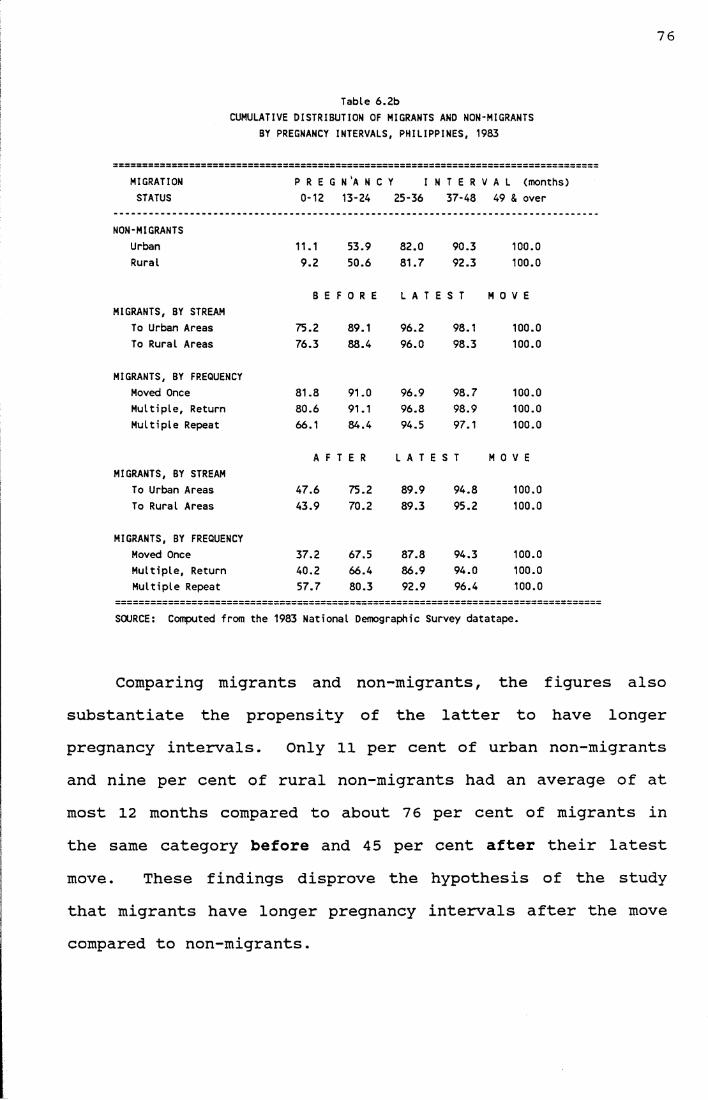
76
Table 6.2bCUMULATIVE DISTRIBUTION OF MIGRANTS AND NON-MIGRANTS
BY PREGNANCY INTERVALS, PHILIPPINES, 1983
MIGRATIONSTATUS
P R E G 0-12
N 'A N C 13-24
Y I25-36
N T E R 37-43
V A L (months) 49 & over
NON-MIGRANTSUrban 11.1 53.9 82.0 90.3 100.0Rural 9.2 50.6 81.7 92.3 100.0
B E F O R E L A T E S T M O V EMIGRANTS, BY STREAM
To Urban Areas 75.2 89.1 96.2 98.1 100.0To Rural Areas 76.3 88.4 96.0 98.3 100.0
MIGRANTS, BY FREQUENCYMoved Once 81.8 91.0 96.9 98.7 100.0Multiple, Return 80.6 91.1 96.8 98.9 100.0Multiple Repeat 66.1 84.4 94.5 97.1 100.0
A F T E R L A T E S T M O V EMIGRANTS, BY STREAM
To Urban Areas 47.6 75.2 89.9 94.8 100.0To Rural Areas 43.9 70.2 89.3 95.2 100.0
MIGRANTS, BY FREQUENCYMoved Once 37.2 67.5 87.8 94.3 100.0Multiple, Return 40.2 66.4 86.9 94.0 100.0Multiple Repeat 57.7 80.3 92.9 96.4 100.0
SOURCE: Computed from the 1983 National Demographic Survey datatape.
Comparing migrants and non-migrants, the figures also substantiate the propensity of the latter to have longer pregnancy intervals. Only 11 per cent of urban non-migrants and nine per cent of rural non-migrants had an average of at most 12 months compared to about 7 6 per cent of migrants in the same category before and 45 per cent after their latest move. These findings disprove the hypothesis of the study that migrants have longer pregnancy intervals after the move compared to non-migrants.
77
6.2 Multiple Classification Analysis of CumulativeFertility Among the Sampled CMWThe multivariate analysis performed in the study
attempts to find out whether migration had a significant impact as an explanatory variable for fertility differences among the women covered in the survey. The multiple classification analysis (MCA) using the heirarchical approach was adopted because of its advantages as discussed in Chapter 3. The dependent variable is mean number of CEB,representing cumulative fertility, while the independent variables include education, labour force participation,contraceptive use status and migration status. Age andduration of marriage were treated as covariates in theanalysis. In order to test whether the model used in the study is insensitive to interactions, a two-way analysis of variance (ANOVA) was performed to test all possible two-way interactions for pairs of the selected independent variables. The three-staged methodology adopted by Soeradji and Hatmadji (1982:16) for determining whether results of tests for interactions may be ignored or not was used. The steps included the following:
1. examining the significance level of the F value. If it was greater than or equal to 5 per cent, the interaction between the independent variables would be considered insignificant.2. If it was less than 5 per cent, the ratio of the sum of squares of the interaction term to the sum of squares of the main effects was further examined. If the ratio
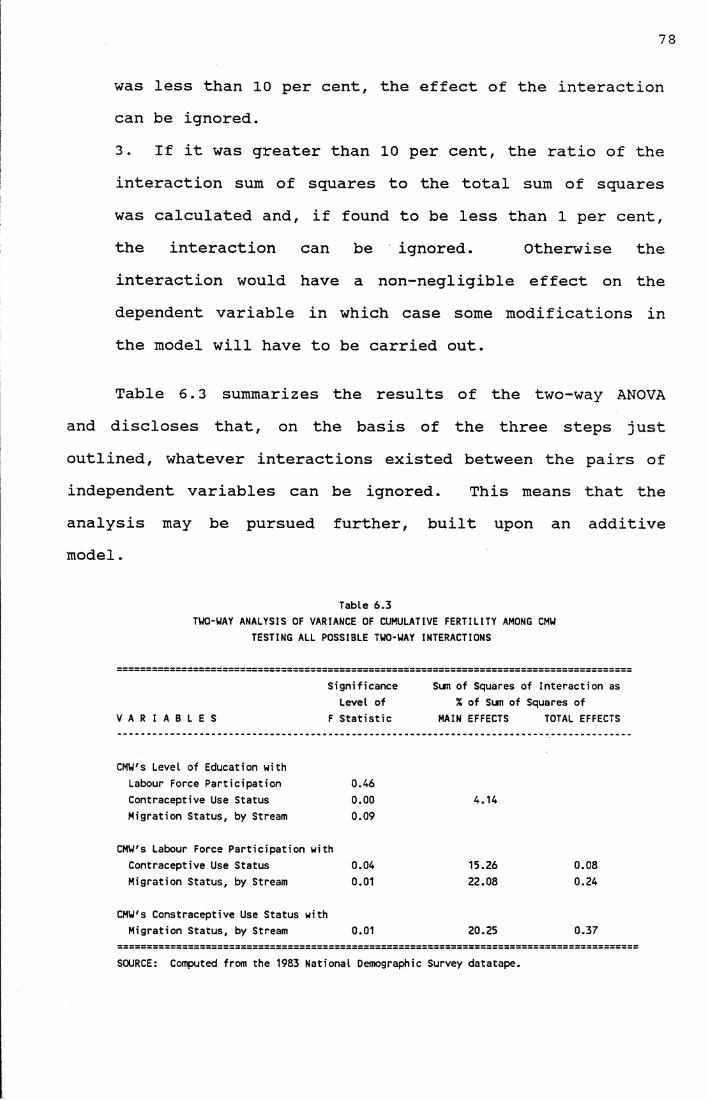
78
was less than 10 per cent, the effect of the interaction can be ignored.3. If it was greater than 10 per cent, the ratio of the interaction sum of squares to the total sum of squares was calculated and, if found to be less than 1 per cent, the interaction can be ignored. Otherwise the interaction would have a non-negligible effect on the dependent variable in which case some modifications in the model will have to be carried out.
Table 6.3 summarizes the results of the two-way ANOVA and discloses that, on the basis of the three steps just outlined, whatever interactions existed between the pairs of independent variables can be ignored. This means that the analysis may be pursued further, built upon an additive model.
Table 6.3TWO-WAY ANALYSIS OF VARIANCE OF CUMULATIVE FERTILITY AMONG CMW
TESTING ALL POSSIBLE TWO-WAY INTERACTIONS
V A R I A B L E S
Significance Level of
F Statistic
Sum of Squares of Interaction as% of Sum of Squares of
MAIN EFFECTS TOTAL EFFECTS
CMW's Level of Education with Labour Force Participation Contraceptive Use Status
0.460.000.09
4.14Migration Status, by Stream
CMW's Labour Force Participation with Contraceptive Use Status Migration Status, by Stream
0.040.01
15.2622.08
0.080.24
CMW's Constraceptive Use Status with Migration Status, by Stream 0.01 20.25 0.37
SOURCE: Computed from the 1983 National Demographic Survey datatape.
79
The multiple classification analysis (Table 6.4) yielded a multiple correlation coefficient squared (R2) of .58. In other words, the proportion of variance in the fertility of the women in the study explained by the model or the independent variables plus covariates altogether is about 58 per cent. By looking at the low correlation ratios of the independent variables, though, one can surmise that the covariates (age and duration of marriage) made a greater contribution in explaining variations in the dependent variable.
When taking into account the unadjusted mean number of children ever born, a woman's level of education came out as the most important variable for explaining variations in the means, followed by migration status. After adjusting for the independent variables (except the covariates), the woman's level of education continued to exhibit higher beta coefficients but, this time, seconded by contraceptive use status. Finally, when means were adjusted for both independent variables and covariates at the same time (i.e. when "holding constant" all predictors in the analysis) the woman's level of education and contraceptive use status came out as more important than either labour force participation or migration status.
While the unadjusted means show significant differences in parity (CEB) by migration status, this observation virtually disappears once education, labour force participation and contraceptive use status were taken into consideration. Further minor reductions of the effect of
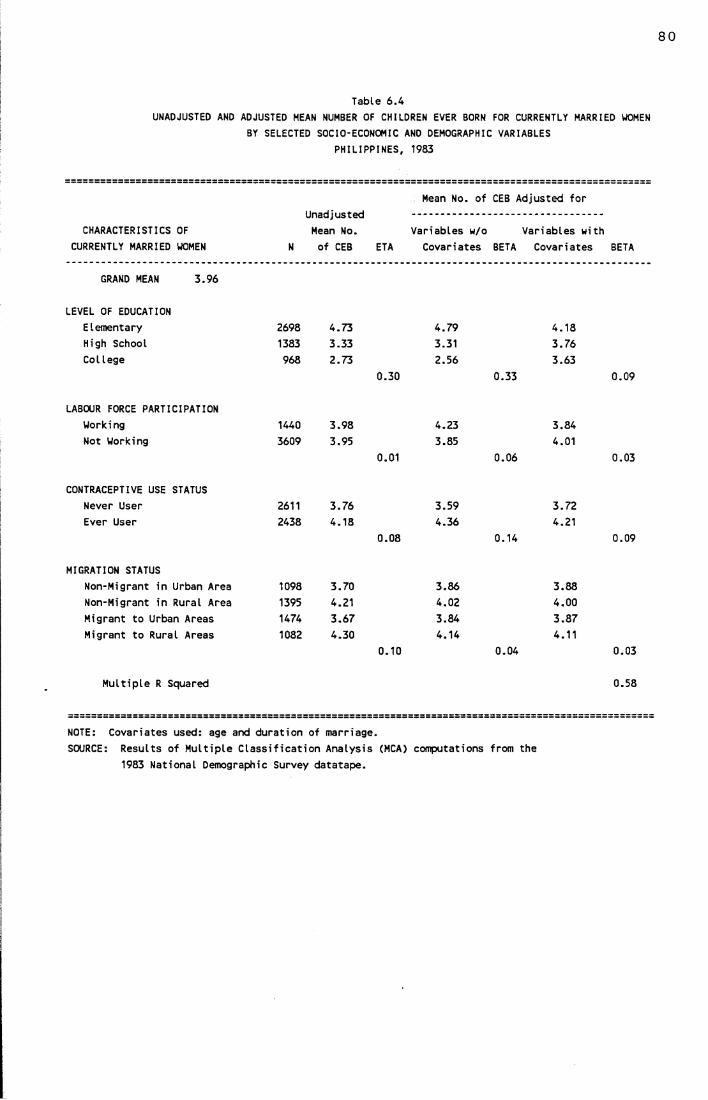
80
T a b le 6 . 4
UNADJUSTED AND ADJUSTED MEAN NUMBER OF CHILDREN EVER BORN FOR CURRENTLY MARRIED WOMEN
BY SELECTED SOCIO-ECONOMIC AND DEMOGRAPHIC VARIABLES
PHILIPPINES, 1983
CHARACTERISTICS OF
CURRENTLY MARRIED WOMEN N
Unadjusted
Mean No.
of CEB ETA
Mean No. of
V a r ia b l e s w/o
C o v a r ia te s
CEB A d ju s te d f o r
V a r ia b l e s w ith
BETA C o v a r ia te s BETA
GRAND MEAN 3 .9 6
LEVEL OF EDUCATION
E lem enta ry 2698 4 .7 3 4 .7 9 4 .1 8
High School 1383 3 .3 3 3.31 3 .7 6
Col lege 968 2 .7 3 2 .5 6 3 .6 3
0 .3 0 0 .3 3 0 .0 9
LABOUR FORCE PARTICIPATION
Working 1440 3 .9 8 4 .2 3 3 .8 4
Not Working 3609 3 .9 5 3 .8 5 4 .0 1
0.01 0 .0 6 0 .0 3
CONTRACEPTIVE USE STATUS
Never User 2611 3 .7 6 3 .5 9 3 .7 2
Ever User 2438 4 .1 8 4 .3 6 4 .2 1
0 .0 8 0 .1 4 0 .0 9
MIGRATION STATUS
N on -M ig ran t in Urban Area 1098 3 .7 0 3 .8 6 3 .8 8
N on -M ig ran t in R ura l Area 1395 4.21 4 .0 2 4 .0 0
M ig ra n t to Urban Areas 1474 3 .6 7 3 .8 4 3 . 8 7
M ig ra n t to R ura l Areas 1082 4 .3 0 4 .1 4 4 .1 1
0 .1 0 0 .0 4 0 .0 3
M u l t i p l e R Squared 0 .5 8
NOTE: C o v a r ia te s used: age and d u r a t io n o f m a rr ia g e .
SOURCE: R e s u lts o f M u l t i p l e C l a s s i f i c a t i o n A n a ly s is (MCA) com puta t ions from the
1983 N a t io n a l Demographic Survey d a ta t a p e .
81
migration results from controlling for age and marriage duration. Chapter 3 has revealed that migration is selective in terms of these socio-economic and demographic factors and it is these differences from non-migrants that causes the unadjusted figures to give the impression of a migration effect on fertility.
32
7. SUMMARY, CONCLUSIONS AND POLICY IMPLICATIONS
The main purpose of this study was to ascertain the extent to which the fertility of migrants was different from that of non-migrants. Magnani (1980:225) aptly put forward two reasons why this issue is important: first, to the extent that migrant women are unable to assimilate into the lifestyles and behavioral patterns prominent in urban centers and cities and continue to exhibit fertility levels characteristic of rural areas, they will contribute heavily to the already rapid rates of growth in the urban areas; second, the common association of migration with "modern" values and behaviour and as a possible motivation for fertility reduction is an important aspect of the overall development scenario insofar as movement between more and less modern areas may serve as a catalyst to speed up development and modernization in the less developed areas.
The analysis was done by examining the cumulative fertility of non-migrants and migrants (by stream and by frequency) using crosstabulations and controlling for selected socio-economic variables. By way of validating the observations noted thereat, current fertility and pregnancy intervals were assessed as well. Finally, a multivariate analysis was performed to determine the extent to which migration, as against selected socio-economic variables, contributed to differential fertility among the currently married women (CMW) in the study.
83
Relatively minor support was accorded to the conceptual framework put forward by the study which was based on traditional concepts rationalizing the interrelationship between fertility and migration. The general pattern that emerged from the tables points to very little variation in fertility in younger ages and some distinct differences in older ages. This implies that while the tempo of fertility is relatively similar among the CMW in the earlier years of their reproductive span, the completed family size as manifested in the fertility performance of older women (specifically in the age groups 35-49 years) eventually discloses whatever disparities in fertility that may exist between migrants and non-migrants. In this regard, since many of the older migrant women may be those whose duration of residence in their place of destination was longer than that of younger migrant women (as implied by some very young ages at the time of first move) the assimilation process may have been more successful in their cases than among women whose migration might have taken place only in recent years. Also, it may be that the migration process may be less constraining in recent years. Progress in transportation and communication facilities in the Philippines may have lessened the pressures and difficulties associated with the migration experience so that movements may now have little or only a temporary impact on fertility.
The findings on current fertility, as demonstrated by the women's age specific marital fertility rates, point to lower fertility among migrants whose place of destination
84
was urban and higher fertility among those whose place of destination was rural. But again, the differences are not pronounced. The pressures traditionally associated with urbanization or "modernization1* may have little impact and may no longer drastically alter the fertility behaviour of migrants. This prompts one to surmise that the basic premise underlying the assimilation theory (adapted from the "demographic transition" theory) may have become irrelevant or that the process of urbanization in certain areas may, in fact, be occurring at a slow pace.
Upon comparing the pregnancy intervals of migrants before and after their latest move, it was obvious that the migrants tended to have longer intervals after the migration experience, indicating, to a certain extent, some form of disruption in the fertility pattern of the movers. But then when contrasting the pregnancy intervals of migrants after their latest move with the average pregnancy intervals of non-migrants, the resulting figures again revealed only very slight differences between the two which, more or less, concurs with the findings from the analysis of cumulative and current fertility.
While it was anticipated that significant fertility differentials would be observed among non-migrants and migrants by frequency (i.e. one-time and multiple movers) the tables showed minor differences. As well, expectations of lower fertility among multiple versus one-time movers were not met and conflicting results were obtained. These findings suggest that migration may not be an important
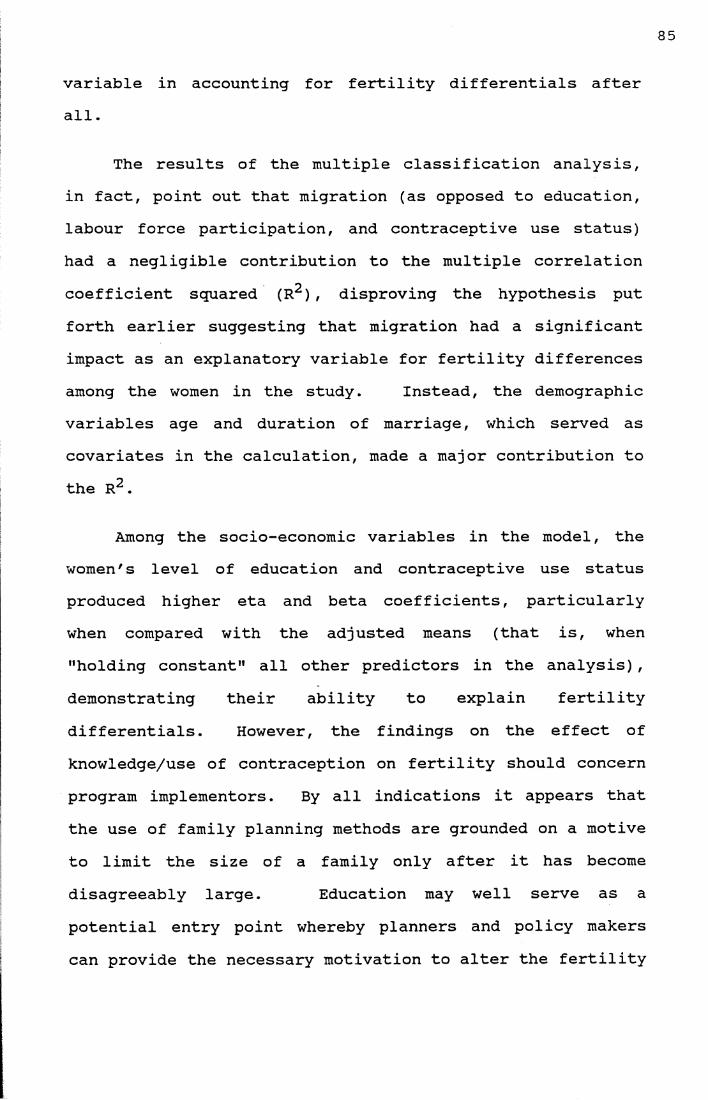
35
variable in accounting for fertility differentials after all.
The results of the multiple classification analysis, in fact, point out that migration (as opposed to education, labour force participation, and contraceptive use status) had a negligible contribution to the multiple correlation coefficient squared (R2), disproving the hypothesis put forth earlier suggesting that migration had a significant impact as an explanatory variable for fertility differences among the women in the study. Instead, the demographic variables age and duration of marriage, which served as covariates in the calculation, made a major contribution to the R2.
Among the socio-economic variables in the model, the women's level of education and contraceptive use status produced higher eta and beta coefficients, particularly when compared with the adjusted means (that is, when "holding constant" all other predictors in the analysis), demonstrating their ability to explain fertility differentials. However, the findings on the effect of knowledge/use of contraception on fertility should concern program implementors. By all indications it appears that the use of family planning methods are grounded on a motive to limit the size of a family only after it has become disagreeably large. Education may well serve as a potential entry point whereby planners and policy makers can provide the necessary motivation to alter the fertility
86
behaviour of women towards that which is consistent with national population goals.
The three models which formed the basis of the conceptual framework used in the study were useful in understanding the findings presented in Chapters 4,5 and 6. In particular, the comparison of socio-economic and demographic characteristics of migrants and non-migrants at the time of first move and at the time of survey highlighted the main argument of the selectivity model that migrants, at the time of move, were likely to be "better off" than non-migrants. Variations in pregnancy intervals before and after their latest move, on the other hand, were better appreciated when viewed in the context of the disruption model. Finally, the current and cumulative fertility differentials point to the extent to which the adaptation model was relevant in the analysis.
One is tempted to conclude that migration does not in itself raise fertility rates by bringing high fertility women into urban areas. However, because migration is age selective and contributes to inflating the age groups in the peak reproductive years, it has the potential to raise the number of births in cities and contribute to the natural increase in urban growth. The challenge, therefore, is to facilitate and hasten the development of smaller towns and cities to provide alternative destinations for migration flows. Data showing lesser rural-to-urban migration and more urban-to-rural moves serve as an encouraging sign of a changing trend in
87
population transfers. The role of government now is to draw up a more specific spatial plan that will determine areas where in-migration will be encouraged or discouraged, which would further minimize inequities prevailing in and between rural and urban areas. In such a plan, it may be worthwhile considering the strategy of using the country's population redistribution policy as a mechanism for fertility reduction.
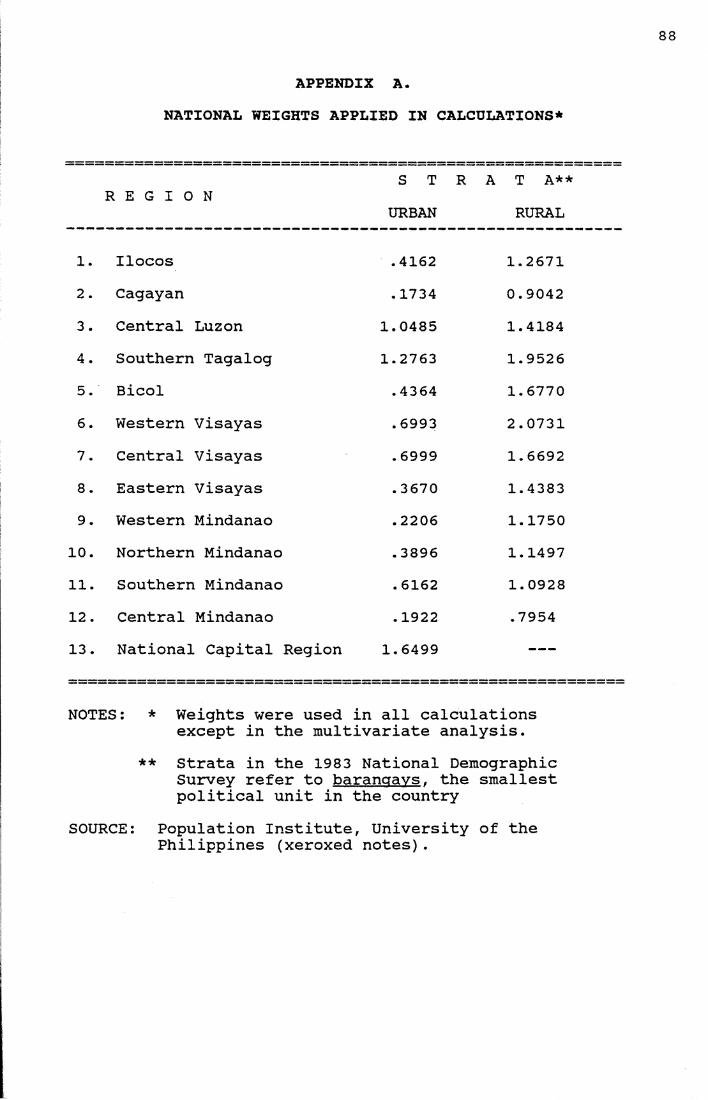
APPENDIX A.NATIONAL WEIGHTS APPLIED IN CALCULATIONS*
R E G I O NS T R
URBANA T A**
RURAL
1 . Ilocos .4162 1.26712 . Cagayan . 1734 0.90423 . Central Luzon 1.0485 1.41844 . Southern Tagalog 1.2763 1.95265. Bicol .4364 1.67706. Western Visayas . 6993 2.07317. Central Visayas . 6999 1.66928 . Eastern Visayas .3670 1.43839 . Western Mindanao . 2206 1.175010. Northern Mindanao . 3896 1.149711. Southern Mindanao . 6162 1.092812 . Central Mindanao . 1922 .795413 . National Capital Region 1.6499 —
NOTES: * Weights were used in all calculationsexcept in the multivariate analysis.
** Strata in the 1983 National Demographic Survey refer to baranaavs. the smallest political unit in the country
SOURCE: Population Institute, University of thePhilippines (xeroxed notes).

89
APPENDIX B
DEFINITION OF URBAN AND RURAL AREAS
Adopting the definitions used in the 197 0 and 197 5 censuses, as well as the 1980 NDS, the following are recognized as urban areas in the 1983 NDS:
1. In their entirety, all cities and municipalities having a population density of at least 1,000 persons per square kilometer.
2. Poblaciones or central districts of municipalities and cities which have a population density of at least 500 persons per square kilometer.
3. Poblaciones or central districts (not included in 1 and 2), regardless of the population size, which comply with all three of these criteria:a. street pattern, i.e., network of streets in
either parallel or right-angle orientation;b. at least six establishments (commercial,
manufacturing, recreational and/or personal services); and
c. at least three of the following:1) a town hall, church or chapel with
religious services at least once a month;2) a public plaza, park, or cemetery;3) a market place or building where trading
activities are carried on at least once a week;
4) a public building like a school, hospital, puericulture and health center
or library.4. Barangays having at least 1,000 inhabitants which
meet the conditions set forth in 3 above, and where the occupation of the inhabitants is predominantly non-farming or fishing.
All other areas not meeting any of the above criteria are classified as rural.
SOURCE: National Census and Statistics Office, 1983.

90
APPENDIX CDETAILED SUB-CLASSIFICATION OF OCCUPATIONS
I. White Collar (referring to professional,proprietary, and ’'high-status’1 occupations)PROFESSIONAL, TECHNICAL AND RELATED WORKERS: physical scientists, architects, engineers, aircraft and ship's officers, life scientists, medical, dental, and veterinary workers, mathematicians, statisticians, systems analysts, social scientists, accountants and auditors, justices, judges and lawyers, teachers (including supervisors and principals), workers in religion, authors, journalists, sculptors, painters, photographers and creative artists, composers and performing artists, athletes, sportsmen.ADMINISTRATIVE, EXECUTIVE AND MANAGERIAL: legislative officials, government administrators and government executives, managers, clerical supervisors, transport and communications supervisors, wholesale and retail managers and working proprietors, sales supervisors and buyers, technical salesmen, insurancem real estate, securities and business services salesmen and auctioneers, catering and lodging managers and working proprietors, farm managers and overseers, production supervisors and general foremen.
II. Non-White Collar (referring to all other types of occupations)CLERICAL AND RELATED WORKERS:secretaries, stenogrpahers, typists, card- and tape- punching machine operators, bookkeepers, cashiers, computing machine operators, transport conductors, mail distribution clerks and messengers, telephone and telegraph operators.SALES WORKERS:salesmen, shop assistants, demonstrators, streets vendors, canvassers, and newsvendors.SERVICE WORKERS:housekeepers and helpers, cooks, waiters, bartenders, building caretakers, cleaners, launderers, dry cleaners, pressers, hairdressers, barbers,beauticians, fire-fighters, policemen and detectives, guides, undertakers and embalmers, medical aides, hospitality girls, ushers.

91
AGRICULTURAL, ANIMAL HUSBANDRY, FORESTRY WORKERS, FISHERMEN AND HUNTERS:farmers and other farm workers, foresters, loggers, forest guards, gatherers, fishermen, hunters.PRODUCTION AND RELATED WORKERS, TRANSPORT EQUIPMENT OPERATORS AND LABORERS:miners, quarrymen, well drillers, metal processors, wood preparation workers and paper makers, chemical processors, spinners, weavers, knitters, dyers, tanners and pelt dressers, food and beverage processors, tobacco preparers and tobacco product makers, tailors, dressmakers, sewers, upholsterers, footwear and leather goods makers, furniture makers, stone cutters and carvers, blacksmiths, toolmakers and machine-tool operators, machine fitters, machine assemblers and precision-instrument makers, electrical fitters and electronics workers, broadcasting station and sound-equipment operators and cinema projectionists, plumbers, welders, sheet metal and structural metal preparers, jewelry and precious metal workers, glass formers, potters, rubber and plastic product makers, paper and paperboard product makers, printers, construction workers, painters, bricklayers, carpenters and other laborers not elsewhere classified.
Based on the Philippine Standard Occupational Classification, National Census and Statistics Office.
SOURCE:
92
ANDREWS, F.,1969
ANKRAH, K.T.1979
BAKER, P.T.1981
BALAN, J.1969
BROWNING, H1971
CABEGIN, E.1987
CONCEPCION,1987
DA VANZO, J1982
E F E R E N C E S
J. MORGAN and J. SONQUISTMultiple Classification Analysis: A Report on a Computer Program for Multiple Regression Using Categorical Predictors. Michigan: Institute for Social Research.
Assimilation or Selectivity: A Test of Competing Theses on the Relationship Between Rural-Urban Migration and Fertility in Ghana (Ph.D. dissertation). University of Cincinnati. Michigan: University Microfilms International.
"Modernization, Migration, and Health:A Methodological Puzzle with Examples from the Samoans," paper presented at the Conference on Conseguences of Migration. Honolulu: East-West Population Institute.
"Migrant-Native Socioeconomic Differences in Latin American Cities: A Structural Analysis." Latin American Research Review 4:3-29.
and W. FEINDT"The Social and Economic Context of Migration to Monterrey, Mexico" in Latin American Urban Research. F.F. Rabinovitz and F.M. Trueblood, eds.Beverly Hills: Sage.
"Female Migrant-Stayer Differences" in Demography at the Crossroads. Volume II: Migration, (xeroxed mimeograph copy of forthcoming document). Quezon City: UPPI.
"Introduction" in Demography at the Crossroads. Volume II: Migration, (xeroxed mimeograph copy of forthcoming document). Quezon City: UPPI.
"Techniques for Analysis of Migration History Data" in National Migration Surveys: X. Guidelines for Analyses. New York: U.N.
DAVIS, K.1963 "The Theory of Change and Response in
Modern Demographic History." Population Index. 29:345-366.
DAVIS, K. and J. BLAKE1956 "Social Structure and Fertility."
Economic Development and Cultural Change. Vol. 4 (April), pp.211-235.
DEL FIERRO, A.C. JR.1974 Rural-Urban Migration and Differential
Fertility in the Philippines (Ph.D. dissertation). University of Kentucky. Michigan: University Microfilms International.
ELIZAGA, J .C.1966 "A Study of Migration to Greater
Santiago." Demography. 3(2): 352-377.ENGRACIA, L. and Y. KIM
1979 "Fertility Differentials Among FilipinoWomen." UNFPA-NCSO Population Research Project, Monograph No.15. Manila: NCSO.
FEITOSA, L.M.B.1975 Internal Migration in the Philippines:
A Study on Migration Differentials. (Ph.D. Dissertation). Brown University. Michigan: University Microfilms International.
FINDLEY, S.E.1977 Planning for Internal Migration: A Review
of Issues and Policies in Developing Countries. Washington: Bureau of Census, U.S. Department of Commerce.
GOLDSCHEIDER, C.1971 "An Outline of the Migration System" in
Proceedings of the International Population Conference, London. 1969.Vol.4. Liege: International Union for the Scientific Study of Population, pp. 2746-2754.
GOLDSTEIN, S.1973 "Interrelations Between Migration and
Fertility in Thailand." Demography.10(2):225-241.
Urbanization, Migration and Development" in Urban Migrants in Developing Nations: Patterns and Problems of Adjustment, edited by Calvin Goldscheider. Colorado: Westview Press.
1983
GOLDSTEIN, S. and A. GOLDSTEIN1981 Surveys of Miaration in Developina
Countries: A Methodoloaical Review (Pacers of the East-West Population Institute No. 71). Honolulu: East-West Center.
1982 "Techniques for Analysis of the Interrelations Between Migration and Fertility" in National Miaration Surveys: X. Guidelines for Analyses. New York: U.N
1983 Miaration and Fertility in Peninsular Malaysia: An Analysis Usina Life HistoryData. Santa Monicaf California: Rand.
GOLDSTEIN, S. and P. TIRASAWAT1977 The Fertility of Miarants to Urban
Places in Thailand. (Papers of the East- West Population Institute, No.43). Honolulu: East-West Center.
GULICK, M. and J. GULICK1976 "Migrant and Native Married Women in the
Iranian City of Isfahan." Anthropoloaical Quarterly, 49(1):53-61.
HENDERSHOT, G.E.1971 "Cityward Migration and Urban Fertility
in the Philippines." Philippine Socioloaical Review. 19(3-41:183-191.
HIDAY, V.1978 "Migration, Urbanization, and Fertility
in the Philippines." International Miaration Review. 12(31:370-385.
HUGO, G.J.1982 "Evaluation of the Impact of Migration on
Individuals, Households and Communities" in National Miaration Surveys: X. Guide- lines for Analyses. New York: U.N.
KUZNETS, S.1964 "Introduction: Population Redistribution,
Migration and Economic Growth" in Population Redistribution and Economic Growth. United States, 1870-1950. Vol.III. Philadelphia: American Philosophical Assn.
LEE, E.S.1966 "A Theory of Miaration." Demoaraphv,
3:47-57.
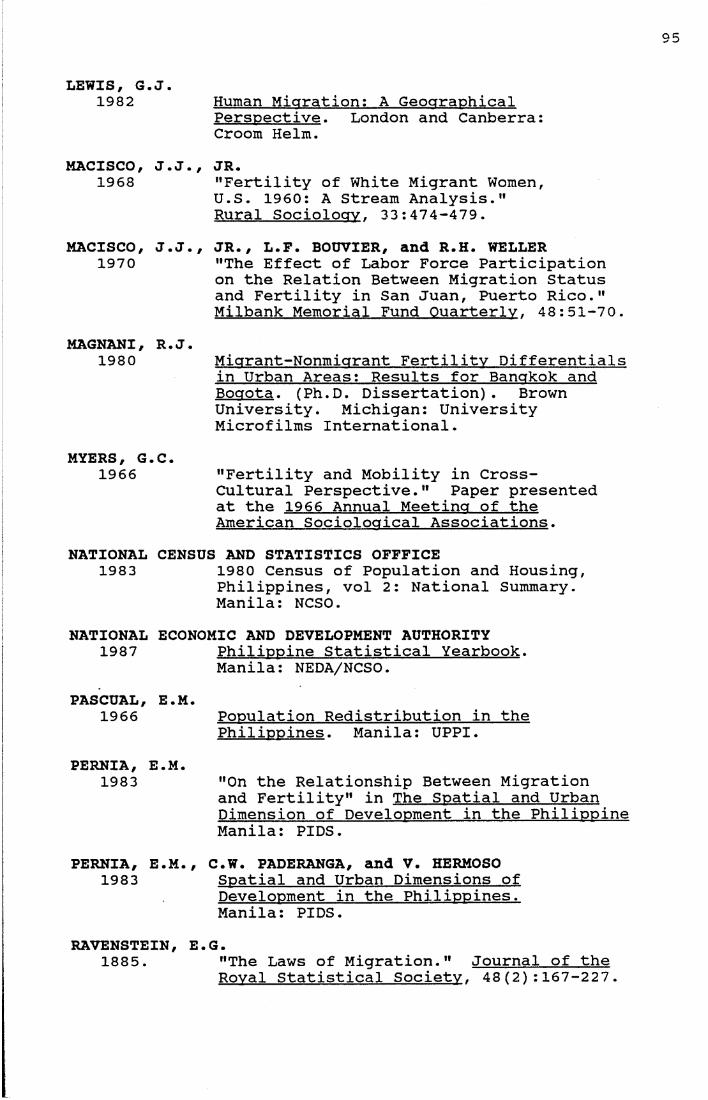
LEWIS, G.1982
MACISCO,1968
MACISCO,1970
MAGNANI,1980
MYERS, G1966
NATIONAL1983
NATIONAL1987
PASCUAL,1966
PERNIA,1983
PERNIA,1983
J.Human Migration; A Geographical Perspective. London and Canberra:Croom Helm.
J • J•, JR •"Fertility of White Migrant Women,U.S. 1960: A Stream Analysis."Rural Sociology. 33:474-479.
J.J., JR., L.F. BOUVIER, and R.H. WELLER"The Effect of Labor Force Participation on the Relation Between Migration Status and Fertility in San Juan, Puerto Rico." Milbank Memorial Fund Quarterly. 48:51-70.
R. J.Miarant-Nonmigrant Fertility Differentials in Urban Areas: Results for Bangkok and Bogota. (Ph.D. Dissertation). Brown University. Michigan: University Microfilms International.
,c."Fertility and Mobility in Cross- Cultural Perspective." Paper presented at the 1966 Annual Meeting of the American Sociological Associations.
CENSUS AND STATISTICS OFFFICE1980 Census of Population and Housing, Philippines, vol 2: National Summary. Manila: NCSO.
ECONOMIC AND DEVELOPMENT AUTHORITYPhilippine Statistical Yearbook.Manila: NEDA/NCSO.
E.M.Population Redistribution in the Philippines. Manila: UPPI.
3.M."On the Relationship Between Migration and Fertility" in The Spatial and Urban Dimension of Development in the Philippine Manila: PIDS.
S. M., C.W. PADERANGA, and V. HERMOSOSpatial and Urban Dimensions of Development in the Philippines.Manila: PIDS.
"The Laws of Migration." Journal of the Royal Statistical Society, 48 (2): 167-227 .
RAVENSTEIN,1885.
RIBE, H. and T.P. SCHULTZ1980 Migrant and Native Fertility in Colombia:
Evidence of Selectivity From the 1973 Census. Connecticut: Yale University.and R.S. STOKES"Residence Background, Migration and Fertility." Demography. 9:217-230."Migration and Fertility in Korea" in The Dynamics of Migration: Internal Migration and Fertility. Occasional Monograph Series No.5, Vol.l. The Smithsonian Institute: Interdisciplinary Communications Program, pp. 259-266.
SHAW, R.P.1975 Migration Theory and Fact. Bibliography
Series No.5. Philadelphia: Regional Science Research Institute.
RITCHEY, P.N.1972
RO, K.1976
SOERADJI, B. and S.H. HATMADJI1982 "Contraceptive Use in Java-Bali: A
Multivariate Analysis of the Determinants of Contraceptive Use." Scientific Reports. No. 24. Netherlands: International Statistical Institute.
SPSS INC.1987 SPSS^ User's Guide: A Complete Guide to
SPSS^~Language and Operations. Illinois: McGraw-Hill.
SUDARSONO, H.K.1984 An Analysis of Migration-Fertility
Relationship: Ilocos-Manila, Philippines. (Masters Thesis). Quezon City: University of the Philippines.
TODARO, M.P.1976 Internal Migration in Developing Countries
A Review of Research Findings from Africa Asia and Latin America. International Development Research Centre.
UNITED NATIONS. ESCAP1982 National Migration Surveys: X. Guidelines
for Analyses. (Comparative Study on Migration, Urbanization and Development in the ESCAP Region). New York: U.N.
VISARIA, P.M.1971 "Urbanization, Migration and Fertility in
India" in The Family in Transition. Washington: National Institute of Health.
ZARATE,1975
.and A.U.DE ZARATE"On the Reconciliation of Research Findings of Migrant-Nonmigrant Fertility Differentials in Urban Areas." International Migration Review. IX(2): 115-156.