femtosekunden-fluoreszenzspektroskopie ... · zusammenfassung die zeitaufgel¨oste...
TRANSCRIPT

Femtosekunden-Fluoreszenzspektroskopiephotoisomerisierender Molekule
Bernhard Schmidt
Munchen 2004


Femtosekunden-Fluoreszenzspektroskopiephotoisomerisierender Molekule
Bernhard Schmidt
Dissertationsschriftangefertigt an der Fakultat fur Physikder Ludwig-Maximilians-Universitat
Munchen
vorgelegt vonBernhard Schmidt
aus Blasendorf
Munchen, den 1.Dezember 2004

Erstgutachter: Prof. Dr. Wolfgang Zinth
Zweitgutachter: Prof. Dr. Josef Wachtveitl
Tag der mundlichen Prufung: 11. Februar 2005

The Guide is definitive.Reality is frequently inaccurate.
(Douglas Adams. The Restaurant at the End of the Universe)


Zusammenfassung
Die zeitaufgeloste Fluoreszenzspektroskopie stellt einen Zugang zur Dynamik vonMolekulen dar. Da schnelle molekulare Vorgange, wie z.B. Isomerisierungen, inner-halb weniger 100 fs oder sogar darunter ablaufen konnen, erfordert ihre UntersuchungTechniken, die Zeitauflosungen in diesem Bereich erlauben. Elektronische Meßver-fahren erreichen derartige Zeitauflosungen jedoch nicht. Daher wird bei zeitaufgelo-sten Fluoreszenzmessungen auf optische Methoden zuruckgegriffen. In dieser Arbeitwird der Aufbau und die Weiterentwicklung eines Meßsystems fur die zeitaufgelosteBeobachtung von Fluoreszenzspektren molekularer Proben auf der Basis des Kerr-Effekts vorgestellt. Nach Anregung der Proben mit Laserimpulsen im ultraviolettenoder sichtbaren Spektralbereich kann bei einer Zeitauflosung von ca. 100 fs gleichzei-tig eine Messung uber einen sehr breiten Spektralbereich vom nahen Ultraviolettenbis ins nahe Infrarote durchgefuhrt werden.
Auf dieser Grundlage wird die Fluoreszenz einer Reihe von Proben untersucht,die nach optischer Anregung isomerisieren. Es handelt sich hierbei um die Molekule4-Nitro-4’-(Dimethylamino)-Azobenzol, Bakteriorhodopsin und Proteorhodopsin.
Das Push-Pull substituierte Azobenzolderivat 4-Nitro-4’-(Dimethylamino)-Azo-benzol (NA) isomerisiert nach Photoanregung ebenso wie das unsubstituierte Azoben-zol. Trotz stark unterschiedlicher elektronischer Struktur offenbart sich eine erstaun-liche Ahnlichkeit in der Dynamik beider Molekule. Beide Systeme besitzen in derEmission ein ahnliches biphasisches Verhalten. Fur NA wurden Zeitkonstanten von0.08 ps und 0.8 ps und ein verzogerter Anstieg der Fluoreszenz im langwelligen Teilder Spektren bestimmt. Ein Unterschied zu unsubstituiertem Azobenzol besteht inden um etwa den Faktor drei kurzeren Zeitkonstanten von NA.
Der primare Schritt im Photozyklus von Bakteriorhodopsin (BR) besteht inder Isomerisierung des Retinalmolekuls, welches als Chromophor dient. Wahrenddie Zeitskalen dieser Isomerisierung aus transienten Absorptionsexperimenten be-reits bekannt sind, unterliegen die damit assoziierten molekularen Prozesse weiter-hin einer kontroversen Diskussion. In den hier durchgefuhrten Emissionsmessungenwurde neben den bereits bekannten Zeitkonstanten von < 0.15 ps und 0.45 ps furden Fall niedriger Anregungsdichten das erste Mal ein dynamischer Stokes-Shift aufder Zeitskala von 0.2 ps entdeckt. Im Falle hoher Anregungsdichten konnen die deut-lichen Anderungen der zeitaufgelosten Spektren Mehrphotonenabsorptionen zuge-ordnet werden.
Erst vor kurzer Zeit wurde das Proteorhodopsin (PR) als neues Mitglied derFamilie der rhodopsinartigen Proteine entdeckt. Ebenso wie bei BR ist der primareSchritt des Photozyklus die Isomerisierung seines Retinalmolekuls. Hier wurden zumersten Mal zeitaufgeloste Fluoreszenzmessungen an PR durchgefuhrt. Es wurde, wieauch bei BR, ein dynamischer Stokes-Shift gefunden. Im Gegensatz zu BR besitztPR in der Emission jedoch drei Zeitkonstanten von < 0.15 ps, 0.45 ps und 4 ps. Diedritte Zeitkonstante kann mit einem spektral dunklen Zwischenzustand assoziiertwerden.


Inhaltsverzeichnis
1 Einleitung 1
2 Der Kerr-Schalter 92.1 Prinzip des optischen Schalters . . . . . . . . . . . . . . . . . . . . . 92.2 Up-Conversion . . . . . . . . . . . . . . . . . . . . . . . . . . . . . . 102.3 Funktionsweise des Kerr-Schalters . . . . . . . . . . . . . . . . . . . . 112.4 Experimenteller Aufbau . . . . . . . . . . . . . . . . . . . . . . . . . 132.5 Wahl des Kerr-Mediums . . . . . . . . . . . . . . . . . . . . . . . . . 162.6 Charakterisierung des Kerr-Schalters . . . . . . . . . . . . . . . . . . 182.7 β-Carotin in Toluol . . . . . . . . . . . . . . . . . . . . . . . . . . . . 212.8 Zusammenfassung . . . . . . . . . . . . . . . . . . . . . . . . . . . . . 23
3 Isomerisierung von 4-Nitro-4’-(Dimethylamino)-Azobenzol 253.1 Photochemie von Azobenzol . . . . . . . . . . . . . . . . . . . . . . . 253.2 Zeitaufgeloste Fluoreszenzmessung von 4-Nitro-4’-(Dimethylamino)-
Azobenzol . . . . . . . . . . . . . . . . . . . . . . . . . . . . . . . . . 263.3 Erstellung eines Reaktionsmodells . . . . . . . . . . . . . . . . . . . . 31
4 Untersuchung der Primarreaktion von Bakteriorhodopsin 354.1 Ubersicht . . . . . . . . . . . . . . . . . . . . . . . . . . . . . . . . . 354.2 Fluoreszenzmessung mit niedriger Anregungsdichte . . . . . . . . . . 374.3 Fluoreszenzmessung mit hoher Anregungsdichte . . . . . . . . . . . . 434.4 Zusammenfassende Bemerkung . . . . . . . . . . . . . . . . . . . . . 44
5 Untersuchung der Primarreaktion von Proteorhodopsin 475.1 Ubersicht . . . . . . . . . . . . . . . . . . . . . . . . . . . . . . . . . 475.2 Zeitaufgeloste Fluoreszenzmessung . . . . . . . . . . . . . . . . . . . 495.3 Zusammenfassende Bemerkung . . . . . . . . . . . . . . . . . . . . . 54
Abbildungsverzeichnis 55
Literaturverzeichnis 57
Lebenslauf 67
Danksagung 69
v

Inhaltsverzeichnis
Anhang 71
vi

1 Einleitung
Seit jeher interessieren sich Menschen fur den zeitlichen Ablauf von Ereignissen. DieMenschen des Altertums verwendeten zur Einteilung der Zeit noch Sonnen-, Sand-und Wasseruhren. Der wohl erste Mensch, der sich mit der genaueren Messung vonkurzeren Zeitintervallen beschaftigte, war Galileo Galilei [1]. Die von ihm eingesetz-ten Methoden, wie die Messung seines eigenen Pulses oder von ihm konstruiertePendeluhren, besaßen laut seiner eigenen Einschatzung die Genauigkeit eines Zehn-tels eines Pulsschlags. Etwa um dieselbe Zeit wurden die ersten Verbindungen ent-deckt, die bei Bestrahlung mit Sonnenlicht sichtbares Licht emittieren. Im Jahr1565 berichtete N. Monardes, daß Wasser, welches eine bestimmte Holzart (lignumnephriticum) enthalt, im Sonnenlicht gluht [2]. Im Laufe der Zeit keimte ein immergroßer werdendes Interesse an Phanomenen, welche mit der Abstrahlung von Lichtverbunden sind, und deren zeitlichem Ablauf auf. Da die Reaktionszeit des mensch-lichen Auges aber fur die Verfolgung schneller Prozesse nicht ausreicht, wurden zudiesem Zweck verschiedene experimentelle Ansatze entwickelt.
Schon 1834 benutzte Wheatstone einen rotierenden Spiegel um die Lebensdauereines Funkens zu bestimmen [3]. Mit dieser ersten Anwendung einer Schmierbild-kamera konnte er zeigen, daß die Existenzdauer einiger Funken kurzer als 10−6 sist. Im Jahr 1858 wurde das erste Phosphoroskop von E. Bequerel gebaut [4–6].Damit war es moglich, Phosphoreszenzzerfallszeiten bis hinab zu 10−3 s zu messen. Inseinen Schlierenexperimenten um das Jahr 1867 erzeugte A. Topler mit einem kurzenLichtfunken eine Schallwelle, welche er sukzessive mit einem zweiten zeitverzogertenFunken abtastete [7, 8]. Das Prinzip dieser Experimente wird auch heute noch inder zeitaufgelosten Spektroskopie angewandt. Abraham und Lemoine konnten be-reits 1899 mit Hilfe einer Kerr-Zelle und eines elektrischen Funkens eine Zeitauf-losung von 10−8 s demonstrieren [9, 10]. Eine Entladung von Kondensatorplat-ten aktivierte gleichzeitig eine mit CS2 gefullte Kerr-Zelle und eine Funkenstrecke.Der Lichtweg zwischen der Funkenquelle und der Kerr-Zelle war variabel. War dieVerzogerungsstrecke langer als ca. 4 m, wurde kein Licht mehr transmittiert. Abra-ham und Lemoine schlossen daraus, daß der fur den Kerr-Effekt verantwortlicheMechanismus schneller als 10−8 s ist. Da heute fur den Kerr-Effekt in CS2 eineAntwortzeit von ca. 2 ps (1 ps = 10−12 s) bekannt ist [11], wurde somit in Wahrheitdie Dauer des elektrischen Funkens gemessen. Dieses Experiment verwendete alserstes das Prinzip einer variablen Verzogerungsstrecke zur Messung von kurzen Zeit-intervallen.
Die Antwortzeit der CS2-Kerr-Zelle von 2 ps zeigt bereits, daß molekulare Pro-zesse - hier die Rotation des CS2-Molekuls - sich auf sehr kurzen Zeitskalen ab-spielen konnen. Sollen solche Prozesse in Molekulen untersucht werden, erfordert
1

1 Einleitung
dies eine Synchronisation dieser Prozesse auf der gleichen Zeitskala. Da sich vielemolekulare Prozesse durch Lichtanregung induzieren lassen, kann eine solche Syn-chronisation durch Anregung der Molekule mit kurzen Lichtimpulsen erfolgen. Mittedes 20. Jahrhunderts wurden molekulare (photochemische) Vorgange im Bereich vonMilli- bis Mikrosekunden durch Verwendung von Lichtblitzen studiert, die Zeitsskalawar dabei durch die Dauer der Lichtblitze gegeben. Diese sogenannte Blitzlicht-Photolyse wurde von Norrish und Porter um das Jahr 1950 eingefuhrt [1, 12, 13]. Sieerhielten dafur 1967 den Nobelpreis fur Chemie. Die Zeitauflosung in der Spektros-kopie konnte jedoch lange Zeit mangels geeignet kurzer Lichtimpulse nicht uber denBereich von Nanosekunden (1 ns = 10−9 s) hinaus gesteigert werden.
Erst in den Jahren nach der Einfuhrung des Lasers im Jahr 1960 wurden wiedergroßere Fortschritte auf dem Gebiet der zeitaufgelosten Spektroskopie erzielt. Wah-rend der sechziger Jahre des 20. Jahrhunderts wurden die Konzepte der Guteschal-tung (engl. Q-Switch) und der Modenkopplung eingefuhrt und realisiert. Mit moden-gekoppelten Lasern erreichte man erstmals Impulsdauern im Bereich von Pikosekun-den. Shank und Ippen stellten 1974 den ersten modengekoppelten Farbstofflasermit Impulsdauern von weniger als 1 ps vor [14]. Wahrend der neunziger Jahredes 20. Jahrhunderts wurden die Farbstofflaser durch modengekoppelte Titan-SaphirLaser ersetzt [15]. Mit Hilfe parametrischer Verstarker lassen sich heutzutage Impuls-dauern bis hinab zu wenigen Femtosekunden (siehe z.B. [16–18]) erreichen, welcheuber den gesamten ultravioletten, sichtbaren und nahinfraroten Spektralbereich ein-stellbar sind (siehe z.B. [19, 20]).
Mit der Entwicklung immer kurzerer Laserimpulse wurde es endlich moglich,auch die schnellsten physikalischen und chemischen Prozesse in Molekulen, welchesich auf der Zeitskala von einigen 10 Femtosekunden (1 fs = 10−15 s) abspielen,aufzuklaren. Diese Zeitskala ergibt sich aus den Schwingungsperioden molekularerSchwingungen, die eine Art untere Grenze fur die Reaktionszeiten darstellen. Diehochsten beobachteten Schwingungsfrequenzen in Molekulen liegen bei ca. 3000 cm−1
(siehe z.B. [21]), was einer Periodendauer von ca. 10 fs entspricht. Untersuchun-gen in diesem Bereich sind daher außerst wichtig fur das Verstandnis elementarerchemischer Vorgange. Fur dieses wissenschaftliche Arbeitsgebiet wurde der Begriff‘Femtochemie’ gepragt. Die Bedeutung dieses Feldes wurde durch die Verleihung desChemie-Nobelpreises an Ahmed Zewail im Jahr 1999 unterstrichen.
Werden Molekule durch Lichtabsorption in angeregte Zustande versetzt, so fin-den dort verschiedene photophysikalische und photochemische Prozesse statt. Nachelektronischer Anregung kommt es in der Regel zu Schwingungsrelaxationen inner-halb des angeregten Zustands. Elektronisch angeregte Zustande konnen nun strahlendoder nichtstrahlend in andere angeregte Zustande oder den Grundzustand relaxieren.Ebenso kann ein Elektronen- oder Protonentransfer auftreten. Weitere Moglichkeitender Dynamik angeregter Molekule sind Isomerisierungen, Torsionen und komplexerePhotoreaktionen. Diese Vorgange sind in der Regel mit Anderungen der optischenEigenschaften verknupft, z.B. der Absorption und der Emission. Die zeitliche Verfol-gung dieser Anderungen der optischen Eigenschaften kann folglich dazu beitragen,
2

wertvolle Informationen zur Erklarung der Vorgange in Molekulen zu gewinnen.Die am weitesten verbreitete Untersuchungsmethode der Kurzzeitspektroskopie
ist die Messung der transienten Absorption. Nach Anregung einer Probe mit einemkurzen Laserimpuls wird die zeitliche und spektrale Absorptionsanderung im Anre-gungsvolumen mit Hilfe eines ebenfalls sehr kurzen Abtastimpulses verfolgt [1]. Beitransienten Absorptionsexperimenten tragen mehrere Komponenten zur Anderungdes Signals bei (Abb. 1.1). Nach Anregung der Probe kommt es zunachst zu einemAusbleichen des Grundzustandes, d.h. die Absorption im Bereich der Wellenlangedes Anregungsimpulses nimmt ab. Angeregte Zustande konnen nun auch selbst ab-sorbieren, was zu einer Zunahme der Absorption fuhrt. Dazu kommt noch der Beitragder stimulierten Emission, welcher wiederum eine Abnahme der Absorption bewirkt.
fluorescence νhνh
S
0 S0
S
S
S
1 1
2 2
S
Transient Absorption
stimulatedemission
ground statebleaching
Fluorescence
excited stateabsorption
Abbildung 1.1: Signalbeitrage bei Fluoreszenz und transienter Absorption
Der Vorteil dieser Methode ist, daß die gesamte Dynamik eines Molekuls nach Pho-toanregung abgefragt wird, d.h. Vorgange in den elektronisch angeregten Zustan-den und im Grundzustand werden untersucht. Die Separation der Signalbeitrage inzeitaufgelosten Absorptionsspektren ist jedoch unter Umstanden nur schwer zu be-werkstelligen, so daß eine eindeutige Zuordnung zu den einzelnen Zustanden oft nichtmoglich ist.
Viel einfacher hingegen gestaltet sich die Interpretation von Fluoreszenzspek-tren. Nach Anregung in einen (meist den ersten) elektronisch angeregten Zustandtritt nur die Emission aus diesem Zustand in niedrigere elektronische Zustandeoder den elektronischen Grundzustand auf (Abb. 1.1). Daher spiegelt die Dynamikder Fluoreszenzemission ausschließlich das Verhalten von elektronisch angeregtenZustanden wieder. Die zeitaufgeloste Fluoreszenzspektroskopie ist somit die idealeTechnik zum Studium von angeregten Zustanden. Einschrankend muß allerdings er-
3

1 Einleitung
wahnt werden, daß die exklusive Beobachtung von elektronisch angeregten Zustandennur dann gewahrleistet ist, wenn bestimmte experimentelle Rahmenbedingungen er-fullt sind. Die spektrale Charakteristik des Fluoreszenzlichts kann durch statischeReabsorption oder durch transiente Absorption in der Probe verandert werden. Esmuß daher sichergestellt werden, daß durch diese sogenannten inneren Filtereffektekeine zusatzlichen Absorptionsbeitrage auftreten. Dies wird z.B. durch ausreichendeVerdunnung der Probe oder dadurch, daß die Fluoreszenz- und die statischen bzw.transienten Absorptionsbanden spektral nicht ubereinander liegen, erreicht.
Auf der experimentellen Seite ergibt sich bei der Messung zeitaufgeloster Emis-sionsspektren folgendes Problem: Bei der Aufnahme von Fluoreszenzspektren ineinem elektronisch gesteuerten Detektor wird das Zeitverhalten des auftreffendenLichts mindestens uber die minimale Antwortszeit des Detektionssystems integriert.Da die Zeitauflosung samtlicher elektronischer Detektionsverfahren (z.B. Einzelpho-tonenzahlung, Schmierbildkamera) bestenfalls im Bereich von Pikosekunden liegt, istauf diesem Weg eine Zeitauflosung im Femtosekundenbereich nicht moglich.
Ein Ziel dieser Arbeit ist daher der Aufbau und die Weiterentwicklung einesMeßsystems fur die zeitaufgeloste Beobachtung von Fluoreszenzspektren molekula-rer Proben. Nach Anregung der Proben mit Laserimpulsen im ultravioletten odersichtbaren Spektralbereich soll bei einer Zeitauflosung von ca. 100 fs gleichzeitig eineMessung uber einen sehr breiten Spektralbereich vom nahen Ultravioletten bis insnahe Infrarote durchgefuhrt werden. Diese Zielsetzung laßt sich in Form eines soge-nannten Kerr-Schalters (siehe auch [22–27]) realisieren, dessen Aufbau und Charak-terisierung in dieser Arbeit vorgestellt werden soll.
Zur Interpretation von Emissionsspektren mussen erst einige grundsatzlicheUberlegungen angefuhrt werden. Die Gesamtwellenfunktion Ψ eines Molekuls laßtsich unter der Annahme, daß man die Bewegung der Elektronen (Koordinaten ri)von der Bewegung der Kerne (Koordinaten Rj) trennen kann, als Produkt eines elek-tronischen und eines Schwingungsanteils der Kerne schreiben (Born-OppenheimerNaherung):
Ψ = Ψel(ri, Rj) ·Ψv(Rj).
Dies wird nahe gelegt durch den großen Masseunterschied, der zu einer viel lang-sameren Bewegung der Kerne gegenuber der Bewegung der Elektronen fuhrt. Indieser Naherung haben die Geschwindigkeiten der Atomkerne keinen Einfluß auf dieelektronische Wellenfunktion Ψel. Wird weiterhin die parametrische Abhangigkeitder elektronischen Wellenfunktion von den Kernkoordinaten Rj vernachlassigt, sospricht man von der Crude Born-Oppenheimer (CBO) Naherung. Es wird dann dieelektronische Wellenfunktion der Gleichgewichtsgeometrie verwendet. Damit hangtnur noch die Kernwellenfunktion Ψv von den Kernkoordinaten ab.
Behandelt man in dieser Naherung die Wahrscheinlichkeit eines elektronischenUberganges, dann laßt sich der allgemeine Ausdruck fur die Ubergangswahrschein-lichkeit
4

|µif |2 = |〈Ψi|er|Ψf〉|2,der durch das Quadrat des Ubergangsdipolmoments µif zwischen den beteiligtenZustanden gegeben ist, faktorisieren:
|µif |2CBO = |〈Ψel,i|er|Ψel,f〉|2 · |〈Ψv,i|Ψv,f〉|2.Elektronenubergange finden dabei so schnell statt ( ∼ 10−15 s), daß sich der Kernab-stand wahrend des Elektronensprungs nicht andert (Franck-Condon Prinzip). Dieswird durch die vertikalen Pfeile in Abb. 1.2 veranschaulicht (Absorption und Emis-sion). Die elektronischen Anteile |〈Ψel,i|er|Ψel,f〉|2 werden als elektronische Uber-gangsmomente, die Schwingungsanteile |〈Ψv,i|Ψv,f〉|2 als Franck-Condon Faktorenbezeichnet. Die elektronischen Ubergangsmomente sind ein Maß fur die gesamteUbergangswahrscheinlichkeit, die Franck-Condon Faktoren beschreiben die relativenUbergangswahrscheinlichkeiten zwischen den einzelnen Schwingungsniveaus der be-teiligten Zustande.
Die zeitliche Verfolgung von Emissionsspektren kann neben den Lebensdauernangeregter Zustande, d.h der Zeitabhangigkeit der spektral integrierten Emissions-intensitat, auch wichtige Informationen uber die Reaktionen von inter- und in-tramolekularen Schwingungsfreiheitsgraden auf die elektronische Anregung liefern.Diese außern sich durch Anderung der spektralen Lage und Form der Emissions-spektren (siehe z.B. Potentialschema in Abb. 1.2). Auf diese Weise konnen mit Hilfezeitaufgeloster Fluoreszenzmessungen die Dynamik von Molekulen selbst wie auchihrer Losungsmittelumgebung verfolgt werden.
S
S1
S0
νh
hν
1S
0
Abbildung 1.2: Potentialschemata fur gebundene und reaktive Systeme bei elektronischerAnregung. Nach Anregung von Molekulen in einen elektronisch angeregten Zustand findetinnerhalb dieses Zustands Schwingungsrelaxation statt. Dies fuhrt zu einer Anderung derspektralen Lage und Form der Emissionsspektren.
In Systemen mit hoher Fluoreszenzquantenausbeute findet man fur die Fluoreszenz-spektren eine Art Spiegelsymmetrie zu den zugehorigen Absorptionsspektren. Eine
5

1 Einleitung
solche Spiegelsymmetrie kann dann auftreten, wenn die Potentiale des elektronischangeregten Zustands und des Grundzustands harmonisch genahert werden konnen,sich die Schwingungsfrequenzen und die Normalmoden in beiden Zustanden nichtwesentlich andern und der elektronisch angeregte Zustand vor der Emission vibra-torisch relaxiert ist (siehe z.B. [28, 29]). Fur Systeme, welche eine ultraschnelle Pho-toreaktion durchlaufen, sind dagegen in ihren zeitaufgelosten Fluoreszenzspektrendie folgenden charakteristischen Eigenschaften zu erwarten:
(i) Aufgrund einer (gedampften) Bewegung auf der Potentialflache des elektro-nisch angeregten Zustands verringert sich die Energielucke zwischen angeregtem Zu-stand und Grundzustand (Abb. 1.2). Im Laufe der Zeit verschieben sich dadurch dieMaxima der Fluoreszenzspektren hin zu großeren Wellenlangen. Solche dynamischenStokes-Shifts werden sowohl fur Systeme mit gebundenen als auch fur Systeme mit re-aktiven elektronisch angeregten Potentialflachen gefunden. In gebundenen Systementritt dieser Effekt oft als Folge der dielektrischen Relaxation der Losungsmittelumge-bung der Molekule auf [30, 31]. Eine derartige losungsmittelinduzierte Verschiebungandert jedoch (abgesehen von einem ν3-Faktor [30]) die spektral integrierte Emis-sionsintensitat nicht.
(ii) In reaktiven Systemen kann es zusatzlich noch zu einer spektralen Ver-schiebung kommen, welche durch eine Bewegung entlang einer reaktiven intramoleku-laren Koordinate ausgelost wird. Im Zuge einer solchen Bewegung mit großer Am-plitude konnen sich die Franck-Condon Faktoren fur die Emission und bzw. oderdie elektronischen Ubergangsmomente andern, was wiederum eine Anderung (inder Regel eine Reduktion) der spektral integrierten Fluoreszenzintensitat verursacht[31, 32]. Derlei Intensitatseffekte wurden bereits in einigen Molekulen mit beobachtet.Beispiele sind Azobenzol [33], Nitroaniline [34] und Triarylpyrylium Farbstoffe [32].Diese experimentellen Befunde sind in Ubereinstimmung mit quantenchemischenRechnungen [34, 35], welche oft eine deutliche Anderung der Ubergangsdipolmo-mente bei Bewegungen entlang reaktiver intramolekularer Koordinaten mit großerAmplitude vorhersagen.
(iii) Schließlich beendet die Entleerung des elektronisch angeregten Zustandsdas Aussenden von Fluoreszenz. Diese Entleerung kann auf verschiedene Art undWeise erfolgen, wie etwa durch interne Konversion (internal conversion, IC) in denGrundzustand oder einen niedrigeren elektronischen Zustand, durch Ubergang inden Triplett-Zustand (inter system crossing, ISC) oder durch die Entstehung vonPhotoprodukten.
Bei der Betrachtung der Kinetiken von Molekulen muß also zwischen relaxier-ten und definierten Zustanden auf der einen und schwingungsangeregten und re-aktiven Zustanden auf der anderen Seite unterschieden werden. Nur fur relaxierteund definierte Zustande sind die Ubergangswahrscheinlichkeiten und somit die Uber-gangsraten zwischen den beteiligten Zustanden zeitlich konstant und nur im Fallezeitlich konstanter Raten ist die Kinetik der Ubergange exponentiell. Die Anzahlder exponentiellen Zerfalle ist hierbei durch die Anzahl der emittierenden Zustandegegeben. Wird beispielsweise ein Molekul in den niedrigsten elektronischen Zustand
6

angeregt, so tritt unabhangig von der Anzahl der Ubergange, welche aus diesem Zu-stand in andere Zustande fuhren, nur eine einzige Zeitkonstante auf (Abb. 1.3). Erstwenn ein hoherer elektronisch angeregter Zustand erreicht wird, sind fur die Beschrei-bung seines Zerfalls in niedrigere elektronisch angeregte Zustande und schließlich inden Grundzustand mehrere Zeitkonstanten notwendig (Abb. 1.3).
In schwingungsangeregten und reaktiven Zustanden andern sich die Ubergangs-wahrscheinlichkeiten wegen der in (i) und (ii) genannten Vorgange insbesondere zufruhen Verzogerungszeiten bezuglich ihrer spektralen Verteilung und Amplitude. Diezugehorigen Kinetiken besitzen ein vom exponentiellen Zerfall abweichendes Verhal-ten. Das spezifische Verhalten in solchen Fallen ist abhangig von den Potentialflachender beteiligten Zustande und den Anregungsbedingungen und muß fur die betreffen-den Molekule jeweils gesondert ermittelt werden.
h
S
0
S
1
2
S
νT1
νh
S
S
S0
1
2
k
k
kk
1
1
2 2
τ =1 k2
= 1k1
τ = 1k2
2τ 1 ,k
1+
Abbildung 1.3: Zeitkonstanten in einem Ratengleichungsmodell
Der Anpassung der Daten zeitaufgeloster Fluoreszenz- und auch transienter Ab-sorptionsexperimente muß also stets ein kinetisches Modell zu Grunde liegen. Esmussen hierzu Annahmen uber die Freiheitsgrade des Systems, die beteiligten Po-tentialflachen und die daraus resultierende Dynamik gemacht werden. Ein solcherAnsatz fur Molekule, in welchen nach Anregung eine Bewegung mit großer Am-plitude stattfindet, ist beispielsweise durch ein System von Diffusionsgleichungengegeben [32]. Derartige Auswertungen sind jedoch wegen der Unsicherheit der Vo-raussetzungen nicht immer einfach zu bewerkstelligen. Ein erster Einblick in dieAnzahl der beteiligten Vorgange kann z.B. aus der Singularwertzerlegung (singularvalue decomposition, SVD) der experimentellen Daten gewonnen werden [36–38].
7
1 Einleitung
Haufig erfolgt die Anpassung zeitaufgeloster Daten mit Hilfe von Exponentialfunk-tionen, obwohl ein Ratenmodell fur die Beschreibung der Kinetik der betreffendenMolekule eigentlich nicht gerechtfertigt ist. Hierfur werden dann in der Regel einegroßere Anzahl an Exponentialtermen benotigt, als durch die Anzahl emittierenderZustande erlaubt ist. Obwohl durch eine solche Vorgehensweise die physikalischenund chemischen Vorgange, welche in den Molekulen stattfinden, nur unzureichendbeschrieben werden, wird sie oftmals dennoch benutzt, um einen ersten Uberblick zuerhalten.
Auf der Grundlage des im Rahmen dieser Arbeit entwickelten Kerr-Schalter Sy-stems soll die Fluoreszenz einer Reihe von Proben untersucht werden, welche nachoptischer Anregung ultraschnelle Photoreaktionen durchlaufen. Einen Schwerpunktbilden dabei Molekule, die in Folge einer optischen Anregung isomerisieren. Es han-delt sich hierbei um die Molekule 4-Nitro-4’-(Dimethylamino)-Azobenzol, Bakterio-rhodopsin und Proteorhodopsin. Die Ergebnisse der zeitaufgelosten Fluoreszenzmes-sungen sollen dargestellt und auf der Grundlage der oben gemachten Uberlegungendiskutiert werden.
Die vorliegende Arbeit wurde in kumulativer Form erstellt. Den einzelnen Kapitelnliegen die folgenden Veroffentlichungen zu Grunde:
Kapitel 2: B. Schmidt, S. Laimgruber, W. Zinth, and P. Gilch. A broadband Kerrshutter for femtosecond fluorescence spectroscopy. Appl. Phys. B, 76:809-814, 2003.[siehe Anhang A]
Kapitel 3: B. Schmidt, C. Sobotta, S. Malkmus, S. Laimgruber, M. Braun, W. Zinth,and P. Gilch. Femtosecond Fluorescence and Absorption Dynamics of an Azobenzenewith a Strong Push-Pull Substitution. J. Phys. Chem. A, 108:4399-4404, 2004. [sieheAnhang B]
Kapitel 4: B. Schmidt, C. Sobotta, B. Heinz, S. Laimgruber, M. Braun, and P. Gilch.Excited State Dynamics of Bacteriorhodopsin Probed by Broadband FemtosecondFluorescence Spectroscopy. Biochim. Biophys. Acta, accepted. [siehe Anhang C]
Kapitel 5: Die Veroffentlichung der Daten dieses Kapitels ist zum gegenwartigenZeitpunkt noch nicht erfolgt, befindet sich jedoch in Vorbereitung.
8

2 Der Kerr-Schalter
Fur die zeitaufgeloste Fluoreszenzspektroskopie stehen verschiedene Methoden zurVerfugung. Zum einen gibt es elektronische Methoden, wie Einzelphotonenzahlung(Time Correlated Single Photon Counting, [39]) und Schmierbildkamera (Streakcam-era, [39]). Da diese jedoch keine Zeitauflosung im Femtosekundenbereich erlauben,soll hier nicht naher auf sie eingegangen werden. Um eine Zeitauflosung im Bereichvon ∼100 fs zu erreichen, kommen rein optische Methoden zum Einsatz, die auf demPrinzip eines optischen Schalters (optical gate) basieren.
2.1 Prinzip des optischen Schalters
Im Folgenden soll erst das Prizip eines optischen Schalters erlautert und dann dieFunktionsweise des Kerr-Schalters im Vergleich zu der Up-Conversion Technik dar-gestellt werden.
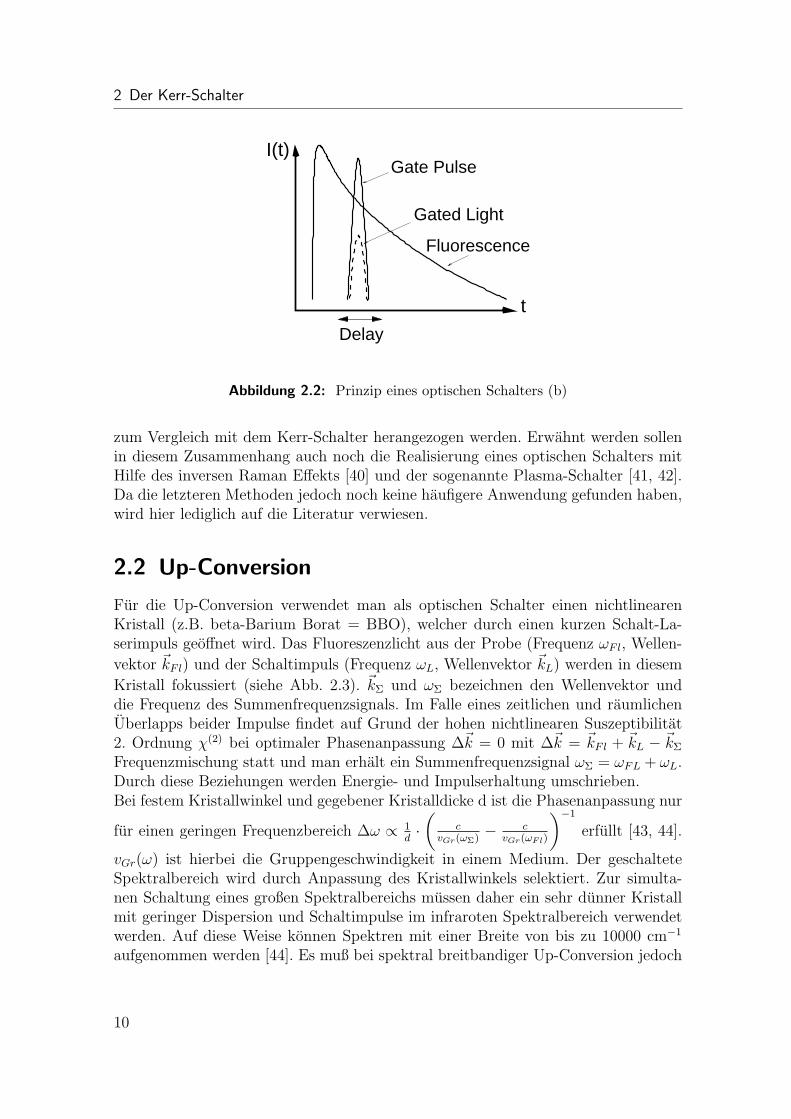
In einem optischen Schalter treffen ein Fluoreszenzlichtimpuls und ein kurzeroptischer Schaltimpuls aufeinander (Abb. 2.1). Der Schaltimpuls ist dabei um dieZeit t gegenuber dem Fluoreszenzlichtimpuls verzogert. Durch den Schaltimpuls wer-den die Transmissionseigenschaften des Schalters kurzfristig geandert (Zu- oder Ab-nahme der Transmission, Abb. 2.2). Das fur die Dauer des Schaltimpulses transmit-tierte Signal sollte proportional zur Intensitat des Fluoreszenzlichts zu der gegebenenVerzogerungszeit sein. Das Abtasten der Fluoreszenzintsitat entlang der Zeitachse er-folgt durch eine Veranderung der Wegstrecke, welche der Schaltimpuls zu durchlaufenhat. Jede Anderung der vom Schaltimpuls zuruckgelegten Strecke ∆s bedeutet einenUnterschied in der Laufzeit von ∆t = ∆s/c (c = Lichtgeschwindigkeit).
Delayline
OpticalSwitch
Gated
Light
Fluorescence Light
Gate Pulse
Abbildung 2.1: Prinzip eines optischen Schalters (a)
Das Prinzip eines optischen Schalters ist auf verschiedene Art und Weise realisiertworden. Der bisher gebrauchlichste Ansatz ist die Up-Conversion und soll daher auch
9
2 Der Kerr-Schalter
t
Gate Pulse
Gated Light
Fluorescence
I(t)
Delay
Abbildung 2.2: Prinzip eines optischen Schalters (b)
zum Vergleich mit dem Kerr-Schalter herangezogen werden. Erwahnt werden sollenin diesem Zusammenhang auch noch die Realisierung eines optischen Schalters mitHilfe des inversen Raman Effekts [40] und der sogenannte Plasma-Schalter [41, 42].Da die letzteren Methoden jedoch noch keine haufigere Anwendung gefunden haben,wird hier lediglich auf die Literatur verwiesen.
2.2 Up-Conversion
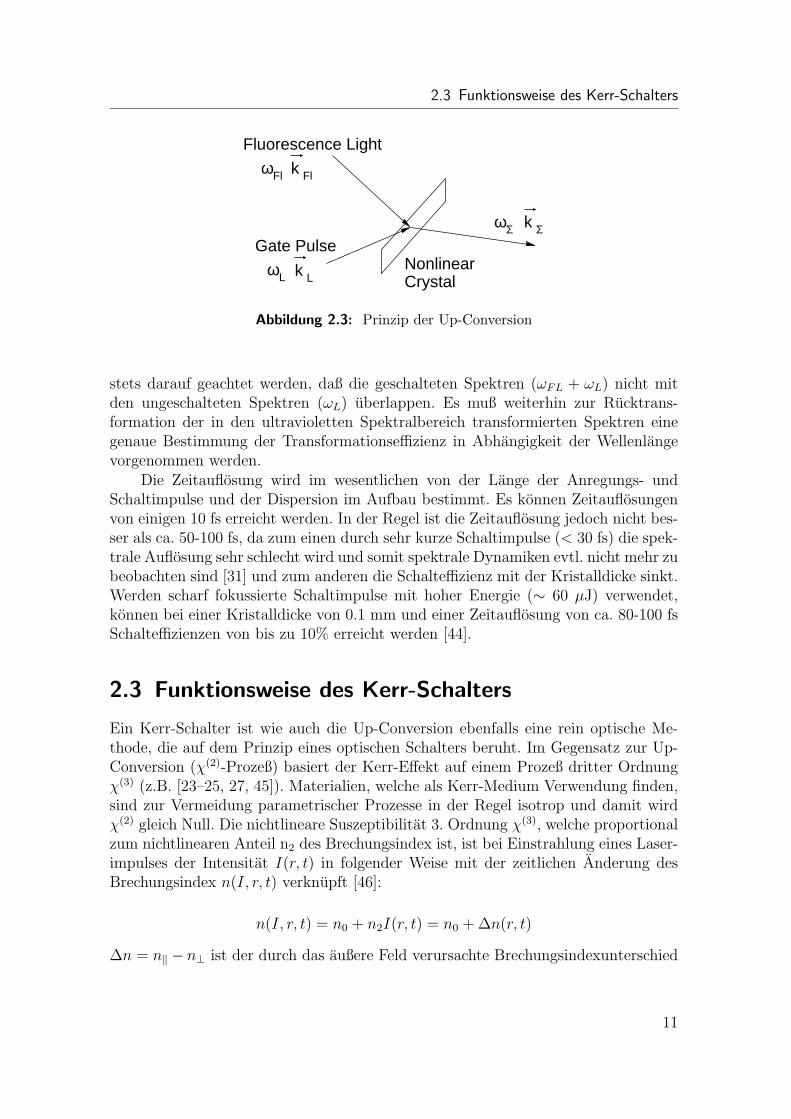
Fur die Up-Conversion verwendet man als optischen Schalter einen nichtlinearenKristall (z.B. beta-Barium Borat = BBO), welcher durch einen kurzen Schalt-La-serimpuls geoffnet wird. Das Fluoreszenzlicht aus der Probe (Frequenz ωFl, Wellen-
vektor ~kFl) und der Schaltimpuls (Frequenz ωL, Wellenvektor ~kL) werden in diesem
Kristall fokussiert (siehe Abb. 2.3). ~kΣ und ωΣ bezeichnen den Wellenvektor unddie Frequenz des Summenfrequenzsignals. Im Falle eines zeitlichen und raumlichenUberlapps beider Impulse findet auf Grund der hohen nichtlinearen Suszeptibilitat2. Ordnung χ(2) bei optimaler Phasenanpassung ∆~k = 0 mit ∆~k = ~kFl + ~kL − ~kΣ
Frequenzmischung statt und man erhalt ein Summenfrequenzsignal ωΣ = ωFL + ωL.Durch diese Beziehungen werden Energie- und Impulserhaltung umschrieben.Bei festem Kristallwinkel und gegebener Kristalldicke d ist die Phasenanpassung nur
fur einen geringen Frequenzbereich ∆ω ∝ 1d·(
cvGr(ωΣ)
− cvGr(ωFl)
)−1
erfullt [43, 44].
vGr(ω) ist hierbei die Gruppengeschwindigkeit in einem Medium. Der geschalteteSpektralbereich wird durch Anpassung des Kristallwinkels selektiert. Zur simulta-nen Schaltung eines großen Spektralbereichs mussen daher ein sehr dunner Kristallmit geringer Dispersion und Schaltimpulse im infraroten Spektralbereich verwendetwerden. Auf diese Weise konnen Spektren mit einer Breite von bis zu 10000 cm−1
aufgenommen werden [44]. Es muß bei spektral breitbandiger Up-Conversion jedoch
10
2.3 Funktionsweise des Kerr-Schalters
k Fl
Lk
ωΣ
NonlinearCrystal
Gate Pulse
Fluorescence Light
k Σ
ωFl
ωL
Abbildung 2.3: Prinzip der Up-Conversion
stets darauf geachtet werden, daß die geschalteten Spektren (ωFL + ωL) nicht mitden ungeschalteten Spektren (ωL) uberlappen. Es muß weiterhin zur Rucktrans-formation der in den ultravioletten Spektralbereich transformierten Spektren einegenaue Bestimmung der Transformationseffizienz in Abhangigkeit der Wellenlangevorgenommen werden.
Die Zeitauflosung wird im wesentlichen von der Lange der Anregungs- undSchaltimpulse und der Dispersion im Aufbau bestimmt. Es konnen Zeitauflosungenvon einigen 10 fs erreicht werden. In der Regel ist die Zeitauflosung jedoch nicht bes-ser als ca. 50-100 fs, da zum einen durch sehr kurze Schaltimpulse (< 30 fs) die spek-trale Auflosung sehr schlecht wird und somit spektrale Dynamiken evtl. nicht mehr zubeobachten sind [31] und zum anderen die Schalteffizienz mit der Kristalldicke sinkt.Werden scharf fokussierte Schaltimpulse mit hoher Energie (∼ 60 µJ) verwendet,konnen bei einer Kristalldicke von 0.1 mm und einer Zeitauflosung von ca. 80-100 fsSchalteffizienzen von bis zu 10% erreicht werden [44].
2.3 Funktionsweise des Kerr-Schalters
Ein Kerr-Schalter ist wie auch die Up-Conversion ebenfalls eine rein optische Me-thode, die auf dem Prinzip eines optischen Schalters beruht. Im Gegensatz zur Up-Conversion (χ(2)-Prozeß) basiert der Kerr-Effekt auf einem Prozeß dritter Ordnungχ(3) (z.B. [23–25, 27, 45]). Materialien, welche als Kerr-Medium Verwendung finden,sind zur Vermeidung parametrischer Prozesse in der Regel isotrop und damit wirdχ(2) gleich Null. Die nichtlineare Suszeptibilitat 3. Ordnung χ(3), welche proportionalzum nichtlinearen Anteil n2 des Brechungsindex ist, ist bei Einstrahlung eines Laser-impulses der Intensitat I(r, t) in folgender Weise mit der zeitlichen Anderung desBrechungsindex n(I, r, t) verknupft [46]:
n(I, r, t) = n0 + n2I(r, t) = n0 + ∆n(r, t)
∆n = n‖ − n⊥ ist der durch das außere Feld verursachte Brechungsindexunterschied
11

2 Der Kerr-Schalter
Pol.1
Pol.2
Kerr−Medium
Dete
cto
r
FluorescenceLight
GatePulse
Abbildung 2.4: Prinzip des Kerr-Schalters
zwischen außerordentlichem und ordentlichem Brechungsindex relativ zur Polarisa-tionsrichtung des Laserimpulses.
In einem Kerr-Schalter befindet sich ein isotropes Kerr-Medium zwischen zweigekreuzten Polarisatoren (Abb. 2.4). Ohne Schaltimpuls kann Fluoreszenzlicht diePolarisatoren nicht passieren, der Kerr-Schalter ist geschlossen. Wird ein intensi-ver, linear polarisierter Laserimpuls auf das Kerr-Medium fokussiert, wird im Kerr-Medium eine Anisotropie induziert, d.h. das Kerr-Medium wird doppelbrechend, derKerr-Schalter ist offen. Stehen die Polarisationsrichtungen von Fluoreszenzlicht undSchaltimpuls geeignet zueinander, d.h. optimalerweise unter einem Winkel Θ = 45◦,so wird aus der linearen Polarisation des Fluoreszenzlichts eine elliptische Polari-sation [46]. Ein Teil dieses Lichts kann nun den zweiten Polarisator passieren unddetektiert werden.
Wahrend bei der Up-Conversion der simultan zu schaltende Frequenzbereichdurch die Phasenanpassung vorgegeben ist, entfallt fur den Kerr-Schalter diese Be-schrankung. Auf Grund des physikalischen Prinzips ist der simultan zu schaltendeFrequenzbereich lediglich durch die Transmissionseigenschaften der verwendeten op-tischen Komponenten beschrankt.
Die Zeitauflosung eines Kerr-Schalters wird im wesentlichen von den Impuls-dauern der Anregungs- und Schaltimpulse, der Gruppengeschwindigkeitsdispersionim Aufbau, dem Winkel zwischen Schalt- und Fluoreszenzlicht und den Eigenschaftendes Kerr-Mediums bestimmt. Fur die Schalteffizienz T , d.h. das Verhaltnis vongeschaltetem Fluoreszenzlicht pro Zeiteinheit zu dem auf das Kerr-Medium einfal-lenden Fluoreszenzlicht gilt [25, 47]:
T = sin2(2Θ) · sin2(1
2ϕ(r, t))
ϕ(r, t) = 2π∆n(r, t)l/λFl ist die im Kerr-Glas induzierte Phasenverschiebung zwi-schen ordentlichem und außerordentlichem Anteil des elektrischen Feldes des Fluores-zenzlichts der Wellenlange λFl in einem Kerr-Medium der Schichtdicke l. Bei Θ = 45◦
kann fur kleine Phasenverschiebungen ϕ(r, t) die Schalteffizienz durch
12

2.4 Experimenteller Aufbau
T ≈ π2n22l
2I2Schalt/λ
2Fl
genahert werden. Die Schalteffizienz eines Kerr-Schalters ist also proportional zumQuadrat der Schaltimpulsintensitat ISchalt, dem nichtlinearen Brechungsindex n2, derLange l des Kerr-Mediums und umgekehrt proportional zum Quadrat der Wellen-lange λFl.
Obwohl der Kerr-Effekt bereits kurz nach der Einfuhrung der ersten modenge-koppelten Laser fur die zeitaufgeloste Fluoreszenzmessung im Pikosekundenbereichverwendet wurde [45], wird diese Technik erst seit wenigen Jahren fur Messungen imFemtosekundenbereich eingesetzt [23–26]. In der praktischen Realisierung ergebensich jedoch Probleme, welche einen effektiven Einsatz dieser Technik erschweren. DasLicht der Schaltimpulse wird zum Teil am Kerr-Medium gestreut und erzeugt amDetektor ein Signal, welches um mehrere Großenordnungen hoher ist als das geschal-tete Fluoreszenzsignal. Dieser Untergrund kann nur durch Einsatz geeigneter Filterunterdruckt werden. Da bisher stets Schaltimpulse mit Wellenlangen von ca. 800 nm(die Fundamentale der Titan-Saphir Lasersysteme) verwendet wurden, konnte Fluo-reszenzlicht im nahinfraroten Spektralbereich > 750 nm nicht zeitaufgelost gemessenwerden. Mehrphotonenabsorptionen im Kerr-Medium erzeugen einen intensiven Un-tergrund uber den gesamten sichtbaren Spektralbereich [25]. Dieser fuhrt zu einerdeutlichen Reduktion des Signal- zu Rauschverhaltnisses. Messungen mit geringerSignalstarke sind auf diese Weise nicht mehr moglich. Die Dispersion der verwende-ten optischen Komponenten beeinflusst die Laufzeiten der verschiedenen Wellenlan-gen eines Fluoreszenzspektrums. Die hoherenergetischen blauen spektralen Anteileeines Spektrums werden relativ zu den niederenergetischen roten Anteilen verzogert.Dies fuhrt in Abhangigkeit von der Große der Dispersion zu einer Verlangerung derMeßzeiten und einer Verschlechterung der Zeitauflosung.
Im Rahmen dieser Arbeit wurde ein Kerr-Schalter entwickelt, welcher all dieseEinschrankungen nicht mehr besitzt. Fur zeitaufgeloste Messungen steht nun einDetektionsfenster von ca. 350 - 1000 nm zur Verfugung. Durch Verwendung vonSchaltimpulsen im nahinfraroten (NIR) Spektralbereich bei ca. 1100 nm wird der imKerr-Medium entstehende Untergrund weitgehend beseitigt. Der Einsatz reflektiverOptik und dunnschichtiger Breitbandpolarisatoren reduziert die Dispersion auf einMinimum. Dies fuhrt zu kurzeren Meßzeiten und einer besseren Zeitauflosung. Beieiner Zeitauflosung von < 100 fs ist nun Fluoreszenzspektroskopie an Molekulen,welche ultraschnelle Photoreaktionen durchlaufen, moglich.
2.4 Experimenteller Aufbau
Die folgende Darstellung berucksichtigt einige kleinere Modifikationen gegenuberdem Stand, wie er in [48] beschrieben wurde. Diese Modifikationen zielen zum einenauf die Verbesserung der Zeitauflosung (ursprunglich ca. 130 fs auf heute ca. 90 fs)
13
2 Der Kerr-Schalter
und zum anderen auf die Steigerung der spektralen Effizienz im ultravioletten Spek-tralbereich zwischen 350 nm und 400 nm.
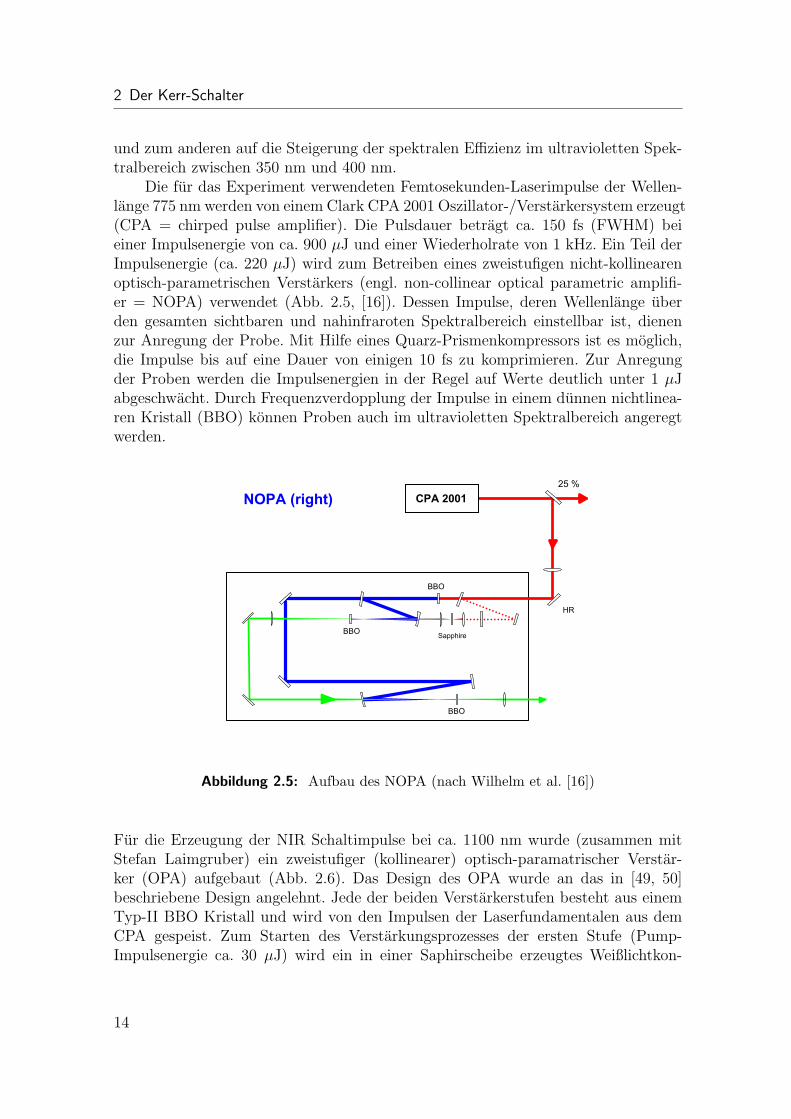
Die fur das Experiment verwendeten Femtosekunden-Laserimpulse der Wellen-lange 775 nm werden von einem Clark CPA 2001 Oszillator-/Verstarkersystem erzeugt(CPA = chirped pulse amplifier). Die Pulsdauer betragt ca. 150 fs (FWHM) beieiner Impulsenergie von ca. 900 µJ und einer Wiederholrate von 1 kHz. Ein Teil derImpulsenergie (ca. 220 µJ) wird zum Betreiben eines zweistufigen nicht-kollinearenoptisch-parametrischen Verstarkers (engl. non-collinear optical parametric amplifi-er = NOPA) verwendet (Abb. 2.5, [16]). Dessen Impulse, deren Wellenlange uberden gesamten sichtbaren und nahinfraroten Spektralbereich einstellbar ist, dienenzur Anregung der Probe. Mit Hilfe eines Quarz-Prismenkompressors ist es moglich,die Impulse bis auf eine Dauer von einigen 10 fs zu komprimieren. Zur Anregungder Proben werden die Impulsenergien in der Regel auf Werte deutlich unter 1 µJabgeschwacht. Durch Frequenzverdopplung der Impulse in einem dunnen nichtlinea-ren Kristall (BBO) konnen Proben auch im ultravioletten Spektralbereich angeregtwerden.
� � � � � � � �
� �
� �
� �
�
� � � � � � � �
� � �
� � � � � � � � �
Abbildung 2.5: Aufbau des NOPA (nach Wilhelm et al. [16])
Fur die Erzeugung der NIR Schaltimpulse bei ca. 1100 nm wurde (zusammen mitStefan Laimgruber) ein zweistufiger (kollinearer) optisch-paramatrischer Verstar-ker (OPA) aufgebaut (Abb. 2.6). Das Design des OPA wurde an das in [49, 50]beschriebene Design angelehnt. Jede der beiden Verstarkerstufen besteht aus einemTyp-II BBO Kristall und wird von den Impulsen der Laserfundamentalen aus demCPA gespeist. Zum Starten des Verstarkungsprozesses der ersten Stufe (Pump-Impulsenergie ca. 30 µJ) wird ein in einer Saphirscheibe erzeugtes Weißlichtkon-
14

2.4 Experimenteller Aufbau
tinuum verwendet. Das Signal der ersten Stufe wird dann in der zweiten Stufe(Pump-Impulsenergie ca. 200 µJ) auf eine Impulsenergie von uber 20 µJ verstarkt.Die Signalimpulse (ca. 1100 nm) werden anschließend durch einen Polarisator vonden Idlerimpulsen (ca. 2.6 µm) getrennt und in einem SF10-Prismenkompressor aufca. 40 fs komprimiert.
BS
Delayline
DM DM DMλ/2−Plate
Signal20 Jµ 40 fs
DM
BS
DelaylineOPA 1110 nm
VariableDensityFilter
Plateλ/2−
Sapphire BBO (3 mm)(4 mm)
BBO (4 mm)
CPA 2001
Polarizer
Abbildung 2.6: Aufbau des OPA (BS=Strahlteiler, DM=Dichroitischer Spiegel)
Fur den effizienten Betrieb eines optischen Schalters mit einer Zeitauflosung im Fem-tosekundenbereich muß das Fluoreszenzlicht der Probe unter einem moglichst großenRaumwinkel eingesammelt werden. Ebenso muß darauf geachtet werden, die Disper-sion auf dem Weg zwischen Probe und Kerr-Medium moglichst gering zu halten. Ausdiesen Grunden wurde fur den Aufbau des Kerr-Schalters so weit wie moglich reflek-tive Optik verwendet (Abb. 2.7). Zwei Mikroskopobjektive (Typ Cassegranian, Fa.Ealing, Numerische Apertur 0.5, Fokallange 13 mm) sammeln das Fluoreszenzlichtein und bilden es auf das Kerr-Medium ab. Als Kerr-Medium dienen Quarzglas-platten (SUPRASIL 300, Fa. Helma) mit einer Schichtdicke zwischen 0.3 mm und1.2 mm. Das Fluoreszenzlicht wird von einem Drahtgitterpolarisator (ProFluxTM
PPL04C, Substratdicke 0.7 mm, Ausloschung 1:1000 fur λ > 350 nm) polarisiert,welcher sich zwischen dem zweiten Mikroskopobjektiv und dem Kerr-Medium befin-det. Ein zweiter Drahtgitterpolarisator hinter dem Kerr-Medium dient (in Abwesen-heit von Schaltimpulsen) zur Ausloschung des Fluoreszenzlichts. Die Schaltimpulsewerden uber einen kleinen Spiegel in der Abschattung des zweiten Mikroskopobjek-tivs auf das Kerr-Medium abgebildet. Die Polarisationsrichtung der Schaltimpulseist relativ zur Polarisationsrichtung des Fluoreszenzlichts um 45◦ gedreht. Das Fluo-reszenzlicht und die Schaltimpulse laufen kollinear durch das Kerr-Medium. Dadurchwird eine Verschlechterung der Zeitauflosung, welche die Folge einer nicht-kollinearenAnordnung ware, verhindert. Das geschaltete Fluoreszenzlicht wird mit Hilfe vonaluminiumbeschichteten Off-Axis Parabolspiegeln eingesammelt und auf den Spaltdes Spektrographen abgebildet. Im Gegensatz zu den ursprunglich verwendetetensilberbeschichteten Spiegeln und der achromatischen Linse [48] ist hier die Reflek-tivitat im ultravioletten Spektralbereich deutlich großer und somit zwischen 350 nm
15

2 Der Kerr-Schalter
und 400 nm ein hoheres Signal zu erreichen. Die Durchmesser und Brennweitender Off-Axis Parabolspiegel wurden so gewahlt, daß das gesamte geschaltete Fluo-reszenzlicht auf das Gitter des Spektrographen abgebildet wird. Ein senkrecht zurAusbreitungsrichtung der Fluoreszenz stehender dielektrischer Spiegel (HR 1060 nm,45◦) und fur das jeweilige Experiment geeignet gewahlte Langpaßfilter dienen zumHerausfiltern des gestreuten Schalt- und Anregungslichts. Der Spektrograph (ActonResearch, Spektra Pro 300i, f = 300 mm, Apertur 0.25) ist mit zwei Gittern mit 150Strichen/mm ausgestattet, deren Wellenlangen maximaler Reflektion bei 500 nmbzw. 800 nm liegen. Das spektral aufgeloste Fluoreszenzlicht wird von einer mitflussigem Stickstoff gekuhlten CCD-Kamera (Princeton Instruments, Spec-10:400B)detektiert. Der durch diese Anordnung abgedeckte Spektralbereich erstreckt sich vonca. 350 - 1000 nm.
Medium
µ
Delayline
BS
40 fs
OPA
Kerr−
MicroscopeObjektives(Cassegranian)
1110 nm
Pola
riser
Sam
ple
Ti−Sapphire Laser/Amplifier
(Clark CPA 2001)
NOPA
Polariser
µ10 J
< 50 fs
Polariser
λ/2−
Pla
te
20 JS
pectr
ogra
ph
CC
D−
Cam
era
HR 1060 nm
LongpassFilter
Abbildung 2.7: Aufbau des Kerr-Schalter Systems
2.5 Wahl des Kerr-Mediums
Die Wahl eines geeigneten Kerr-Mediums ist an verschiedene Rahmenbedingungengeknupft. Die im Kerr-Medium induzierte Anisotropie sollte dem elektrischen Feldder Schaltimpulse nahezu instantan folgen. Die Gruppengeschwindigkeitsdispersionmuß moglichst gering sein. Der durch das Auftreffen der Schaltimpulse erzeugteUntergrund darf nicht sehr hoch sein. Dagegen muß die Schalteffizienz groß genugsein. Schließlich sollte das Kerr-Medium vom ultravioletten bis in den nahinfrarotenSpektralbereich transparent sein. Wahrend die ersten beiden Punkte Voraussetzungfur eine gute Zeitauflosung sind, sind die nachsten beiden Punkte wichtig fur ein
16

2.5 Wahl des Kerr-Mediums
Cou
nts/
s
Wavelength [nm]
SrTiO3
DDG
SF 5
Abbildung 2.8: Durch die Schaltimpulse (λ = 775 nm) induziertes Untergrundsignalverschiedener Kerr-Glaser (DDG = Diadeckglas). Das sehr viel schwacher ausgepragteUntergrundsignal in Quarzglas ist hier nicht eingezeichnet.
gutes Signal- zu Rauschverhaltnis.
Daher kommen fur eine Zeitauflosung im Bereich von 100 fs als Kerr-Mediumnur Festkorper (in der Regel Glaser) in Frage. In Flussigkeiten und Gasen findet dieAusrichtung und Relaxation der Molekule nach Einstrahlung der Schaltimpulse imZeitbereich von Pikosekunden statt (zum Vergleich zwischen CS2 und Bi2O3-Glassiehe z.B. [22]). In Festkorpern tragt zur induzierten Anisotropie im Wesentlichennur die Auslenkung der Elektronen bei, welche dem elektrischen Feld der Schaltim-pulse nahezu instantan folgen (siehe z.B. [51]). Ein moglicher Beitrag der Kerne zurAnisotropie ist in Festkorpern nur sehr schwach ausgepragt [51] und wird hier nichtbeobachtet.
Glaser mit großem nichtlinearem Brechungsindex n2 scheinen auf den erstenBlick die geeignete Wahl als Kerr-Medium zu sein. Jedoch besitzen solche Glaser stetsauch eine große Dispersion im sichtbaren Spektralbereich (siehe z.B. [51]), was zueiner Verschlechterung der Zeitauflosung fuhrt. Aus diesem Grund wurde, trotz desrelativ kleinen nichtlinearen Brechungsindex n2, Quarzglas als Kerr-Medium gewahlt.Unter den getesteten Glasern (SrTiO3, BK 7 Glas, SF 5 Glas) wird mit Quarzglasdie beste Zeitauflosung erreicht.
Die Schalteffizienz fur das an einer Streuscheibe gestreute Licht der Anregungsim-pulse liegt dennoch in Abhangigkeit der Schichtdicke des Kerr-Mediums bei ca. 2-10%. Da fur das Fluoreszenzlicht von Proben das Anregungsvolumen großer, dieAbbildung auf das Kerr-Medium also schlechter ist als fur das an einer Streuscheibegestreutes Anregungslicht, ist die Schalteffizienz etwas geringer, betragt aber trotz-dem noch ca. 1-4%.
17
2 Der Kerr-Schalter
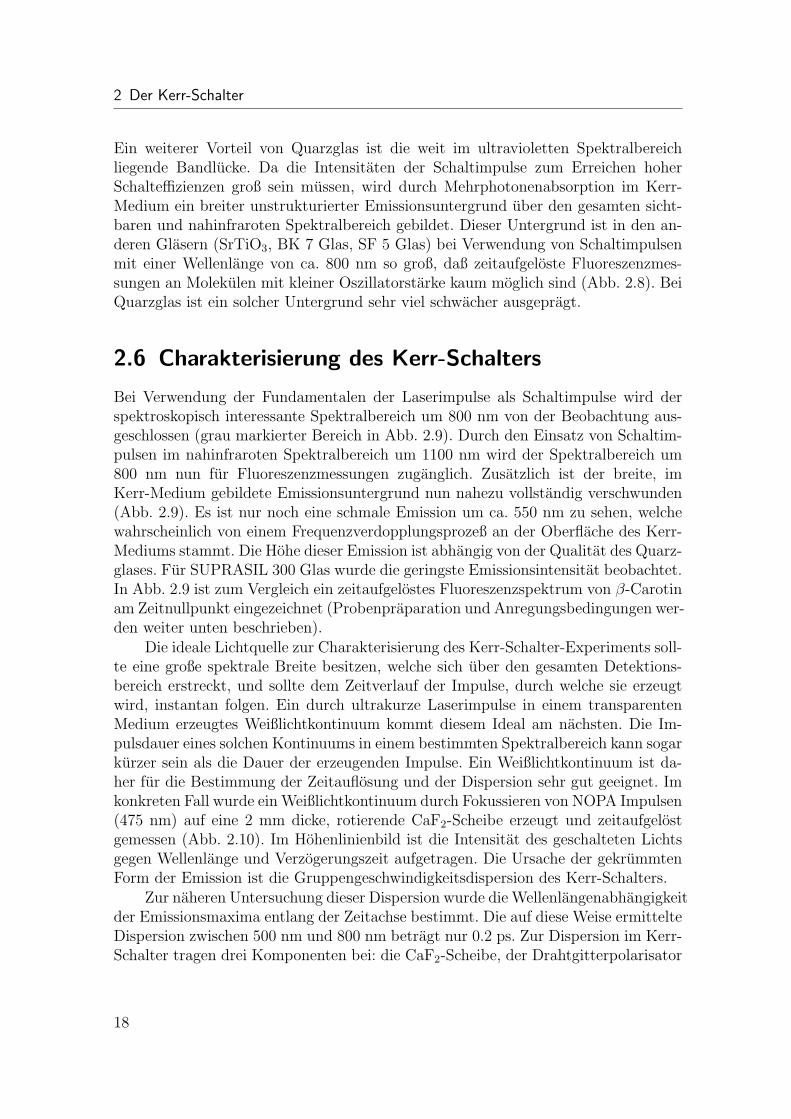
Ein weiterer Vorteil von Quarzglas ist die weit im ultravioletten Spektralbereichliegende Bandlucke. Da die Intensitaten der Schaltimpulse zum Erreichen hoherSchalteffizienzen groß sein mussen, wird durch Mehrphotonenabsorption im Kerr-Medium ein breiter unstrukturierter Emissionsuntergrund uber den gesamten sicht-baren und nahinfraroten Spektralbereich gebildet. Dieser Untergrund ist in den an-deren Glasern (SrTiO3, BK 7 Glas, SF 5 Glas) bei Verwendung von Schaltimpulsenmit einer Wellenlange von ca. 800 nm so groß, daß zeitaufgeloste Fluoreszenzmes-sungen an Molekulen mit kleiner Oszillatorstarke kaum moglich sind (Abb. 2.8). BeiQuarzglas ist ein solcher Untergrund sehr viel schwacher ausgepragt.
2.6 Charakterisierung des Kerr-Schalters
Bei Verwendung der Fundamentalen der Laserimpulse als Schaltimpulse wird derspektroskopisch interessante Spektralbereich um 800 nm von der Beobachtung aus-geschlossen (grau markierter Bereich in Abb. 2.9). Durch den Einsatz von Schaltim-pulsen im nahinfraroten Spektralbereich um 1100 nm wird der Spektralbereich um800 nm nun fur Fluoreszenzmessungen zuganglich. Zusatzlich ist der breite, imKerr-Medium gebildete Emissionsuntergrund nun nahezu vollstandig verschwunden(Abb. 2.9). Es ist nur noch eine schmale Emission um ca. 550 nm zu sehen, welchewahrscheinlich von einem Frequenzverdopplungsprozeß an der Oberflache des Kerr-Mediums stammt. Die Hohe dieser Emission ist abhangig von der Qualitat des Quarz-glases. Fur SUPRASIL 300 Glas wurde die geringste Emissionsintensitat beobachtet.In Abb. 2.9 ist zum Vergleich ein zeitaufgelostes Fluoreszenzspektrum von β-Carotinam Zeitnullpunkt eingezeichnet (Probenpraparation und Anregungsbedingungen wer-den weiter unten beschrieben).
Die ideale Lichtquelle zur Charakterisierung des Kerr-Schalter-Experiments soll-te eine große spektrale Breite besitzen, welche sich uber den gesamten Detektions-bereich erstreckt, und sollte dem Zeitverlauf der Impulse, durch welche sie erzeugtwird, instantan folgen. Ein durch ultrakurze Laserimpulse in einem transparentenMedium erzeugtes Weißlichtkontinuum kommt diesem Ideal am nachsten. Die Im-pulsdauer eines solchen Kontinuums in einem bestimmten Spektralbereich kann sogarkurzer sein als die Dauer der erzeugenden Impulse. Ein Weißlichtkontinuum ist da-her fur die Bestimmung der Zeitauflosung und der Dispersion sehr gut geeignet. Imkonkreten Fall wurde ein Weißlichtkontinuum durch Fokussieren von NOPA Impulsen(475 nm) auf eine 2 mm dicke, rotierende CaF2-Scheibe erzeugt und zeitaufgelostgemessen (Abb. 2.10). Im Hohenlinienbild ist die Intensitat des geschalteten Lichtsgegen Wellenlange und Verzogerungszeit aufgetragen. Die Ursache der gekrummtenForm der Emission ist die Gruppengeschwindigkeitsdispersion des Kerr-Schalters.
Zur naheren Untersuchung dieser Dispersion wurde die Wellenlangenabhangigkeitder Emissionsmaxima entlang der Zeitachse bestimmt. Die auf diese Weise ermittelteDispersion zwischen 500 nm und 800 nm betragt nur 0.2 ps. Zur Dispersion im Kerr-Schalter tragen drei Komponenten bei: die CaF2-Scheibe, der Drahtgitterpolarisator
18
2.6 Charakterisierung des Kerr-Schalters
Abbildung 2.9: Emissionsuntergrund von Quarzglas (durchgezogene Linie) bei Verwen-dung von Schaltimpulsen bei ca. 1100 nm. Zum Vergleich ist ein zeitaufgelostes Fluores-zenzspektrum von β-Carotin (unterbrochene Linie) am Zeitnullpunkt eingezeichnet, beiwelchem der Untergrund bereits subtrahiert wurde. Die grau markierte Flache stellt denbei Verwendung von Schaltimpulsen um ca. 800 nm von der Beobachtung ausgeschlossenenBereich dar.
(Substrat 0.7 mm Corning 1737F Glas) und das Kerr-Medium (1 mm Quarzglas).Unter der Annahme, daß das Weißlichtkontinuum in der Mitte der CaF2-Scheibeerzeugt wird, wurde fur die Dispersion ein theoretischer Wert von 209 fs berech-net. Dieser Wert stimmt sehr gut mit dem gemessenen Wert uberein. Die in denExperimenten gemessenen Daten werden jeweils um den hier bestimmten Beitragder Dispersion zeitnullpunktskorrigiert. Es wird dabei zusatzlich noch der Beitragdes jeweiligen Losungsmittels berucksichtigt. Die Losungsmitteldispersionsdaten sindder Literatur entnommen (z.B. [52]). Zur Uberprufung der Dispersionskorrektur wirdvor einem Experiment in einer Kuvette mit reinem Losungsmittel ein Weißlichtkon-tinuum erzeugt (welches jedoch nicht so spektral breit ist wie das in CaF2 erzeugte).Die so gefundenen Daten stimmen ebenfalls mit den zuvor ermittelten Daten fur dasbreitbandige CaF2-Weißlichtkontinuum uberein.
Mit Hilfe der Weißlichtdaten kann nicht nur die Dispersion bestimmt, sonderndurch Bestimmung der Halbwertsbreite entlang der Zeitachse experimentell auch eineuntere Grenze der Zeitauflosung angegeben werden (∼80 fs fur ein Kerr-Medium derSchichtdicke dKM = 1.0 mm). Simulationen zur Zeitauflosung ergeben fur Impuls-dauern der Anregungs- und Schaltimpulse von ∼40 fs abhangig von der Wellen-lange und der Schichtdicke des Kerr-Mediums Werte zwischen 60 fs (λAnr = 550 nm,dKM = 0.3 mm) und 120 fs (λAnr = 480 nm, dKM = 1.2 mm). Tatsachlich konntedurch Optimierung der Kompressoranordnung in der Impulserzeugung und durch
19

2 Der Kerr-Schalter
Abbildung 2.10: Zeitaufgeloste Messung eines Weißlichtkontinuums, erzeugt in einerCaF2-Scheibe. Die Intensitat des geschalteten Lichts ist aufgetragen gegen Wellenlangeund Verzogerungszeit.
Verwendung eines dunneren Kerr-Mediums (dKM = 0.3 mm anstatt dKM = 1.0 mm)die Zeitauflosung von ca. 130 fs [48] auf ca. 90 fs verbessert werden (siehe auchMessung an β-Carotin in Toluol).
Außer der Zeitnullpunktskorrektur muß bei der Auswertung der aufgenomme-nen Spektren auch die spektrale Empfindlichkeit des Aufbaus berucksichtigt wer-den. Zwei Faktoren tragen zu dieser Empfindlichkeit bei: die ’statische’ Empfind-lichkeit und die Wellenlangenabhangigkeit der Schalteffizienz g(λ). Unter der ’stati-schen’ Empfindlichkeit versteht man die Transmissions- und Reflektionseigenschaftender optischen Komponenten und die Quantenausbeute der CCD-Kamera. Mit Hilfeeines Schwarzen Strahlers als Referenz kann diese Empfindlichkeit leicht bestimmtund in den Spektren korrigiert werden. Fur die Schalteffizienz T (λ) wird, wie be-reits zuvor beschrieben, eine Abnahme mit zunehmender Wellenlange erwartet, dafur eine vorgegebene Kerr-Anisotropie die Phasenverschiebung im Kerr-Medium mitzunehmender Wellenlange abnimmt. Diese Beziehung wird experimentell uberpruft,indem das stationare Spektrum Scw(λ) mit den entlang der Zeitachse integriertenzeitaufgelosten Spektren S(λ, t) verglichen wird:
T (λ) =1
τcc
∫ ∞0
S(λ, t)dt
Scw(λ)
Als Offnungszeit des Kerr-Schalters τcc wird die experimentell bestimmte Zeitauf-losung (FWHM) eingesetzt. Prinzipiell ist τcc zwar eine von der Wellenlange ab-hangige Große, jedoch hat sich im Experiment gezeigt, daß die Offnungszeit des Kerr-Schalters uber den gesamten Spektralbereich der Fluoreszenz der gemessenen Pro-
20

2.7 β-Carotin in Toluol
ben in etwa konstant bleibt. Unter der Annahme, daß der nichtlineare Brechungsin-dex, welcher fur den Kerr-Effekt verantwortlich ist, vernachlassigt werden kann, soll-te die Schalteffizienz T (λ) proportional zu 1
λ2 [25, 47] sein, d.h Multiplikation derentlang der Zeitachse integrierten Spektren sollte das stationare Spektrum Scw(λ)wiedergeben. Daß dies in der Tat der Fall ist, zeigt Abb. 2.11. Aus diesem Grundwerden fur die spektrale Korrektur alle Spektren mit λ2 multipliziert.
Abbildung 2.11: Stationare Spektren von β-Carotin in Toluol. Die Fluoreszenzspektrenwurden mit Hilfe des Kerr-Schalters aufgenommen und sind auf die spektrale Empfind-lichkeit des Aufbaus korrigiert. Das nicht zeitaufgeloste Spektrum (durchgezogene Linie)wurde bei offener Polarisatorstellung aufgenommen. Die zeitaufgelosten Spektren wurdenentlang der Zeitachse integriert und sind mit (gestrichene Linie) und ohne (gepunkteteLinie) λ2-Korrektur (siehe Text) eingezeichnet.
2.7 β-Carotin in Toluol
Die Leistungsfahigkeit des Kerr-Schalters unter echten experimentellen Bedingungensoll nun an einem Farbstoff demonstriert werden. Eine geeignete Wahl ist β-Carotin,da es ein sehr großes optisches Ubergangsdipolmoment besitzt (der Extinktionskoef-fizient in Cyclohexan ist ε = 134300 M−1cm−1, [53]) und daher ein großes transientesFluoreszenzsignal zu erwarten ist. Da β-Carotin bereits ausgiebig untersucht wordenist (z.B. [53–55]), ist eine Uberprufung der Meßergebnisse moglich.
Fur die Absorptionsmessungen wurden 1.5 · 10−4 M und fur die Emissionsmes-sungen 7.5 · 10−4 M Losungen von β-Carotin in Toluol jeweils frisch hergestellt. Eswurden jeweils Quarzglaskuvetten mit einer Schichtdicke von 1 mm verwendet. Beiden Emissionsmessungen wurde die Probe umgepumpt, so daß mit jedem Laserim-puls ein frisches Probenvolumen angeregt wurde. Die Anregung mit NOPA Impulsen
21
2 Der Kerr-Schalter
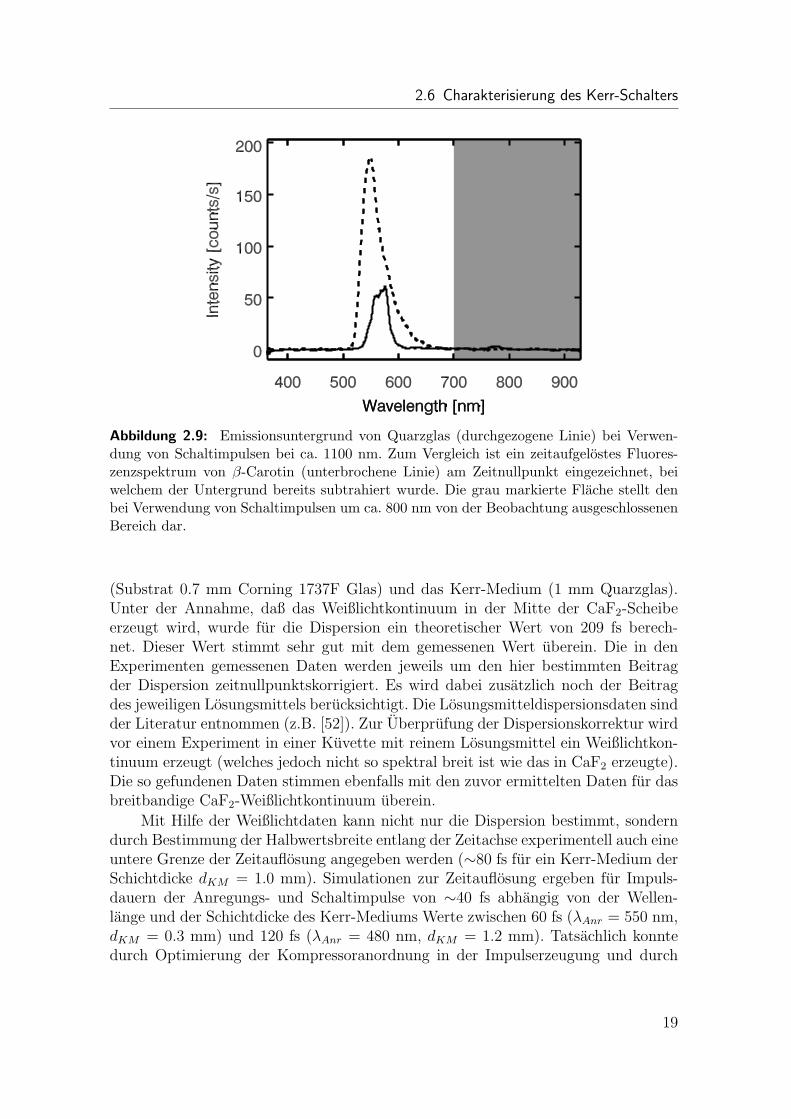
erfolgte bei einer Zentralwellenlange von 490 nm (Pulsenergie 130 nJ) nahe dem Ab-sorptionsmaximum von β-Carotin (Abb. 2.11). Die zeitaufgelosten Spektren (Abb.2.12) wurden bei einer Schaltimpulsenergie von ca. 20 µJ und einer Belichtungszeitvon 6 s pro Schritt der Verzogerungsstrecke aufgenommen. Die gesamte Meßzeitfur die hier gezeigten Daten betrug weniger als zehn Minuten. Das Maximum derzeitaufgelosten Spektren liegt bei ca. 540 nm. Abgesehen von einer geringfugigenVerbreiterung und einer leichten Verschiebung der Spektren bleibt deren Form uberden gesamten Zeitverlauf im wesentlichen erhalten. Dies ist in hervorragender Uber-einstimmung mit den Ergebnissen von Macpherson und Gillbro [53], die das Fluo-reszenzmaximum bei 542 nm sehen und ebenfalls keine Anderung der Spektren mitder Zeit finden.
Der Zeitverlauf der Fluoreszenz am Emissionsmaximum wurde mit Hilfe einerModellfunktion angepaßt. Die Modellfunktion besteht aus zwei exponentiellen Zer-fallen, die zur Simulation der endlichen Zeitauflosung mit einer Gaußfunktion gefaltetsind. Die besten Werte der Anpassung sind 90 fs fur die Zeitauflosung (FWHM) und115 fs fur den dominanten Zerfall. Fur den zweiten exponentiellen Zerfall wird beieiner Amplitude von nur 3% eine Zeitkonstante von∼400 fs bestimmt. Der hier gefun-dene Wert von 115 fs ist sehr nahe an dem mit Hilfe von Up-Conversion Messungenbestimmten Wert von 144 fs [53]. Die leichte Abweichung kann zumindest teilweisedurch die Verwendung einer bi-exponentiellen Anpassungsfunktion hier und einermono-exponentiellen Anpassungsfunktion in [53] erklart werden.
Abbildung 2.12: Zeitaufgeloste Spektren von β-Carotin in Toluol. Die Spektren sindzeitnullpunkts- und spektral korrigiert.
22

2.8 Zusammenfassung
Abbildung 2.13: Zeitverlauf der Fluoreszenz von β-Carotin in Toluol am Emissionsmaxi-mum
2.8 Zusammenfassung
Das im Rahmen dieser Arbeit entwickelte Kerr-Schalter System ist (meines Wissens)das erste, welches bei einer Zeitauflosung von ca. 100 fs die Messung von Fluores-zenzspektren vom ultravioletten bis in den nahinfraroten Spektralbereich (350 nm -1000 nm) ermoglicht. Bei einer Schalteffizienz von mehreren Prozent des einfallen-den Fluoreszenzlichts und einem außerst niedrigen Untergrund wird ein sehr gutesSignal- zu Rauschverhaltnis erzielt, welches auch Experimente an Proben mit kleinerstrahlender Rate erlaubt. Wegen der simultanen Schaltung kompletter Spektren istdiese Technik selbst breitbandiger Up-Conversion [44] uberlegen. Da im Gegensatzzur Up-Conversion die Notwendigkeit der Rucktransformation der Spektren in densichtbaren Spektralbereich entfallt, sind auch Messungen bis weit in den ultraviolet-ten Spektralbereich moglich. Die Leistungsfahigkeit des Kerr-Schalter Systems wirdauch durch die in den nachsten Kapiteln vorgestellten Studien demonstriert.
23

2 Der Kerr-Schalter
24

3 Isomerisierung von4-Nitro-4’-(Dimethylamino)-Azobenzol
3.1 Photochemie von Azobenzol
Azobenzole werden seit dem Aufkommen der chemischen Industrie im 19. Jahrhun-dert als Farbstoffe verwendet [56]. Bis heute finden sie eine breite Anwendung inWissenschaft und Technik. Eine recht bekannte technische Anwendung ist beispiels-weise die Beschichtung von beschreibbaren CD’s und DVD’s. Da Azobenzolfarbstoffeeinen hohen Brechungsindex (∼2) und eine hohe Lebensdauer besitzen und gebun-den an ein Metallion sehr temperaturstabil sind (bis ca. 300◦C) [57], kann eine langeLebensdauer des Datentragers und eine hohe Datensicherheit gewahrleistet werden.
Die thermisch stabile Form von Azoben-
NN
NN
cis
h
trans
ν
Abbildung 3.1: trans → cis Iso-merisierung des Azobenzols. Im trans-Zustand hat Azobenzol eine Lange von∼9 A, welche sich im cis-Zustand auflediglich ∼5 A reduziert.
zol ist das trans-Isomer, bei dem die beidenPhenylringe auf entgegengesetzten Seiten derAzogruppe (-N=N-) liegen (Abb. 3.1). Pho-toanregung von Azobenzol induziert eine Iso-merisierung in das metastabile cis-Isomer (diePhenylringe liegen auf der gleichen Seite). An-regung des cis-Isomers fuhrt zur Ruckbildungder trans-Form. Da es sich bei solchen Iso-merisierungen um einen zentralen Prozeß derorganischen Chemie handelt, wurde die Iso-merisierung intensiver untersucht (siehe un-ten).
Eine weitere Motivation fur diese Stu-dien sind (wissenschaftliche) Anwendungen,die auf der betrachtlichen Geometrieanderungim Zuge der Isomerisierung beruhen. Einesolch große Anderung der Geometrie des Mo-lekuls kann beispielsweise dazu verwendet wer-den, die Faltung (trans→cis) bzw. Entfaltung(cis→trans) eines Peptidrings anzuregen undzu untersuchen [58–60]. Auf diese Weise konn-ten wertvolle Erkenntnisse zur Proteinfaltunggewonnen werden.
Azobenzol wurde mit verschiedenen experimentellen Methoden, wie transientenAbsorptionsmessungen [61–64], zeitaufgelosten Fluoreszenzmessungen [33, 65] und
25
3 Isomerisierung von 4-Nitro-4’-(Dimethylamino)-Azobenzol
zeitaufgeloster Photoelektronenspektroskopie [66] ausfuhrlich untersucht. Zeitaufge-loste transiente Absorptionsmessungen [62, 63] haben fur die trans→cis–Reaktionein biphasisches Verhalten mit Zeitkonstanten von 0.32 ps und 2.1 ps in Ethanolbzw. 0.34 ps und 3.0 ps in DMSO gefunden. Die cis→trans–Reaktion ist mit 0.17 psin Ethanol bzw. 0.1 ps in DMSO deutlich schneller und nur einfach exponentiell.
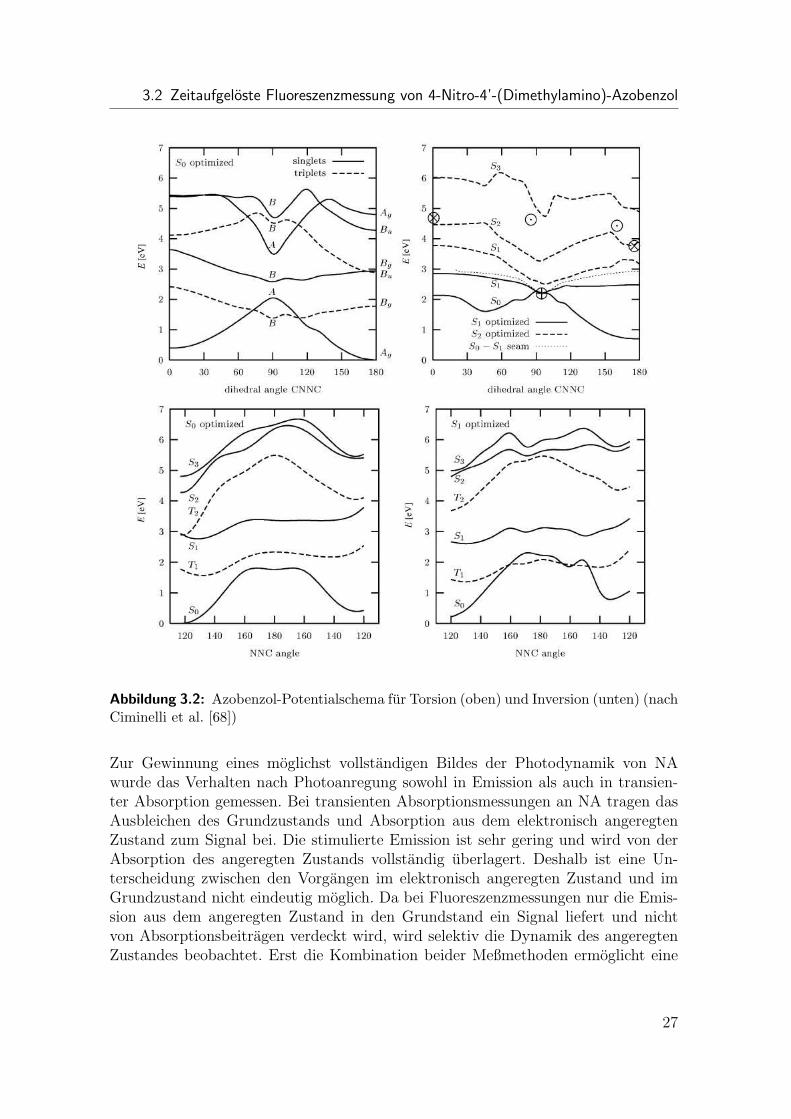
Auf der Grundlage dieser Experimente durchgefuhrte quantenchemische Berech-nungen (z.B. [67–69]) haben verschiedene Reaktions- und Potentialschemata ergeben.In den hier beispielsweise dargestellten Simulationen nach Ciminelli et al. [68] (Abb.3.2) wurden die Potentialflachen des Grundzustands und mehrerer elektronisch an-geregter Zustande berechnet. Fur die Torsion um die N=N Bindung wird eine bar-rierefreie Bewegung entlang der Reaktionskoordinate auf der elektronisch angeregtenPotentialflache vorhergesagt, wahrend fur die Inversion eine kleine Barriere uberwun-den werden muß. Daraus wird geschlossen, daß als Mechanismus der Isomerisierungdie Torsion bevorzugt wird. Die Interpretation der Ergebnisse der Experimente undRechnungen ist jedoch nach wie vor ein Gegenstand der Diskussion. Es ist bishernicht gelungen, eindeutig die Potentialverlaufe der beteiligten Zustande oder gar denReaktionsmechanismus zu bestimmen. Selbst die Anzahl der beteiligten Zustande istnoch nicht klar festgelegt (z.B. [64] vs. [66]).
3.2 Zeitaufgeloste Fluoreszenzmessung von4-Nitro-4’-(Dimethylamino)-Azobenzol
In der hier vorliegenden Arbeit wird ein Push-Pull substituiertes Azobenzolmolekuluntersucht (4-Nitro-4’-(Dimethylamino)-Azobenzol, NA). Es sollen Gemeinsamkei-ten und Unterschiede zu unsubstituiertem Azobenzol herausgearbeitet werden. Diessoll zu einem besseren Verstandnis des Potentialbildes von Azobenzol beitragen unddie Grundlage fur einen Vergleich mit quantenchemischen Berechnungen bilden.
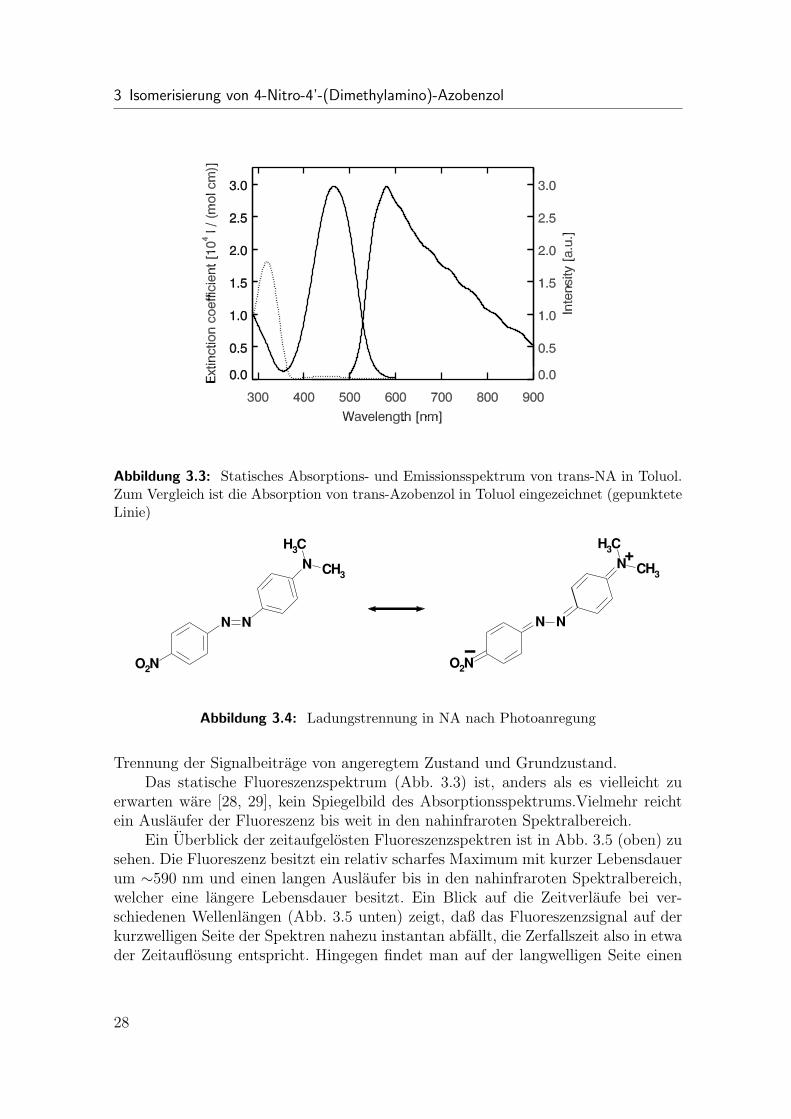
Das Hinzufugen dieser speziellen Substituenten zu Azobenzol fuhrt zu einerAnderung der elektronischen Struktur des Molekuls (siehe Vergleich der statischenSpektren von trans-NA und trans-Azobenzol in Abb. 3.3). Resonanz-Raman Experi-mente [70, 71] zeigen, daß bei NA in Losungsmitteln, welche zumindest leicht polarsind (z.B. Benzol), die Photoanregung zu einem Ubergang in einen ladungsgetrennten(CT-) Zustand fuhrt (Abb. 3.4) und NA anschließend, ebenso wie Azobenzol, vomtrans- in den cis-Zustand isomerisiert. Aus einer Analyse der Absorptionsspektren[70, 71] geht hervor, daß die CT-Absorptionsbande in diesen Losungsmitteln nahezumit der nπ∗-Bande und der ππ∗-Bande zusammenfallt, diese jedoch dominiert. Eskann auf Grund dieser Analyse weiterhin als sehr wahrscheinlich angenommen wer-den, daß die CT-Absorption den Ubergang in den niedrigsten elektronisch angeregtenZustand darstellt. Die deutliche Anderung der elektronischen Struktur zeigt sich auchdaran, daß die thermische Ruckreaktion vom cis- zum trans-Zustand, im Gegensatzzum Azobenzol, sehr schnell ist. Sie verlauft abhangig vom Losungsmittel in einigen10 Sekunden bis weit unter 1 Sekunde [72].
26
3.2 Zeitaufgeloste Fluoreszenzmessung von 4-Nitro-4’-(Dimethylamino)-Azobenzol
Abbildung 3.2: Azobenzol-Potentialschema fur Torsion (oben) und Inversion (unten) (nachCiminelli et al. [68])
Zur Gewinnung eines moglichst vollstandigen Bildes der Photodynamik von NAwurde das Verhalten nach Photoanregung sowohl in Emission als auch in transien-ter Absorption gemessen. Bei transienten Absorptionsmessungen an NA tragen dasAusbleichen des Grundzustands und Absorption aus dem elektronisch angeregtenZustand zum Signal bei. Die stimulierte Emission ist sehr gering und wird von derAbsorption des angeregten Zustands vollstandig uberlagert. Deshalb ist eine Un-terscheidung zwischen den Vorgangen im elektronisch angeregten Zustand und imGrundzustand nicht eindeutig moglich. Da bei Fluoreszenzmessungen nur die Emis-sion aus dem angeregten Zustand in den Grundstand ein Signal liefert und nichtvon Absorptionsbeitragen verdeckt wird, wird selektiv die Dynamik des angeregtenZustandes beobachtet. Erst die Kombination beider Meßmethoden ermoglicht eine
27
3 Isomerisierung von 4-Nitro-4’-(Dimethylamino)-Azobenzol
Abbildung 3.3: Statisches Absorptions- und Emissionsspektrum von trans-NA in Toluol.Zum Vergleich ist die Absorption von trans-Azobenzol in Toluol eingezeichnet (gepunkteteLinie)
N CH3
CH3
NN
O2N
N
O2N
N CH3
CH3
N
+
−
Abbildung 3.4: Ladungstrennung in NA nach Photoanregung
Trennung der Signalbeitrage von angeregtem Zustand und Grundzustand.Das statische Fluoreszenzspektrum (Abb. 3.3) ist, anders als es vielleicht zu
erwarten ware [28, 29], kein Spiegelbild des Absorptionsspektrums.Vielmehr reichtein Auslaufer der Fluoreszenz bis weit in den nahinfraroten Spektralbereich.
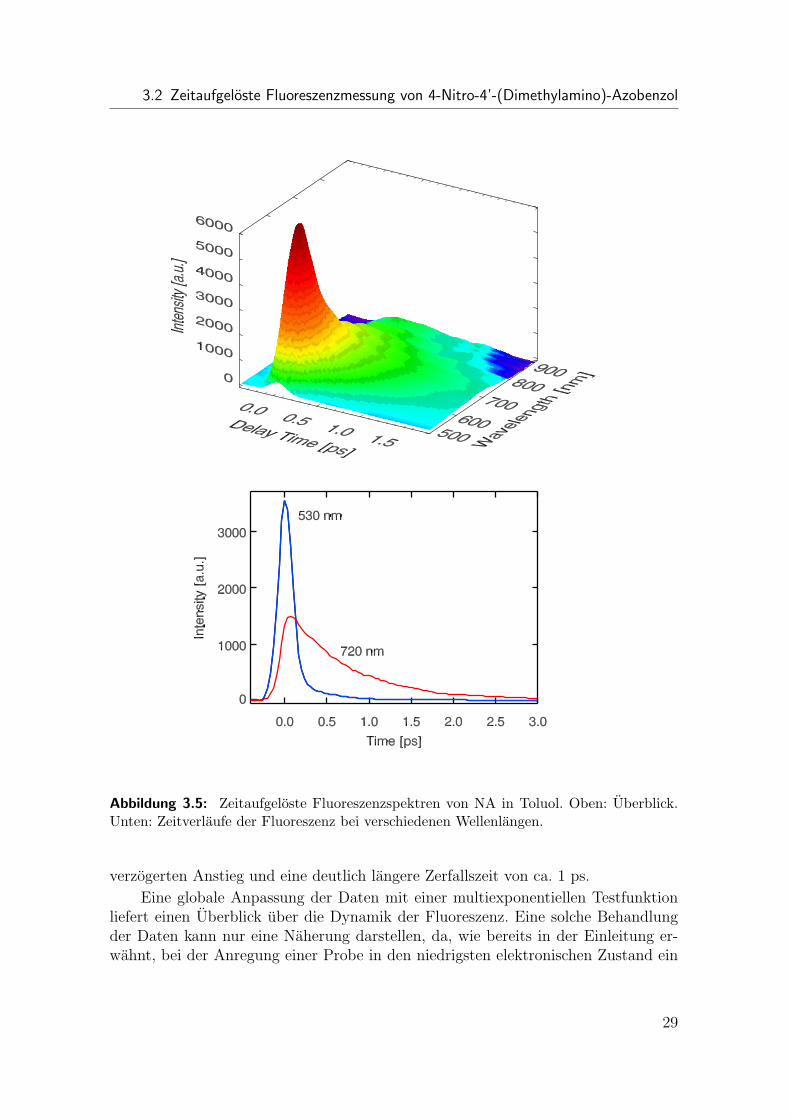
Ein Uberblick der zeitaufgelosten Fluoreszenzspektren ist in Abb. 3.5 (oben) zusehen. Die Fluoreszenz besitzt ein relativ scharfes Maximum mit kurzer Lebensdauerum ∼590 nm und einen langen Auslaufer bis in den nahinfraroten Spektralbereich,welcher eine langere Lebensdauer besitzt. Ein Blick auf die Zeitverlaufe bei ver-schiedenen Wellenlangen (Abb. 3.5 unten) zeigt, daß das Fluoreszenzsignal auf derkurzwelligen Seite der Spektren nahezu instantan abfallt, die Zerfallszeit also in etwader Zeitauflosung entspricht. Hingegen findet man auf der langwelligen Seite einen
28
3.2 Zeitaufgeloste Fluoreszenzmessung von 4-Nitro-4’-(Dimethylamino)-Azobenzol
Abbildung 3.5: Zeitaufgeloste Fluoreszenzspektren von NA in Toluol. Oben: Uberblick.Unten: Zeitverlaufe der Fluoreszenz bei verschiedenen Wellenlangen.
verzogerten Anstieg und eine deutlich langere Zerfallszeit von ca. 1 ps.
Eine globale Anpassung der Daten mit einer multiexponentiellen Testfunktionliefert einen Uberblick uber die Dynamik der Fluoreszenz. Eine solche Behandlungder Daten kann nur eine Naherung darstellen, da, wie bereits in der Einleitung er-wahnt, bei der Anregung einer Probe in den niedrigsten elektronischen Zustand ein
29
3 Isomerisierung von 4-Nitro-4’-(Dimethylamino)-Azobenzol
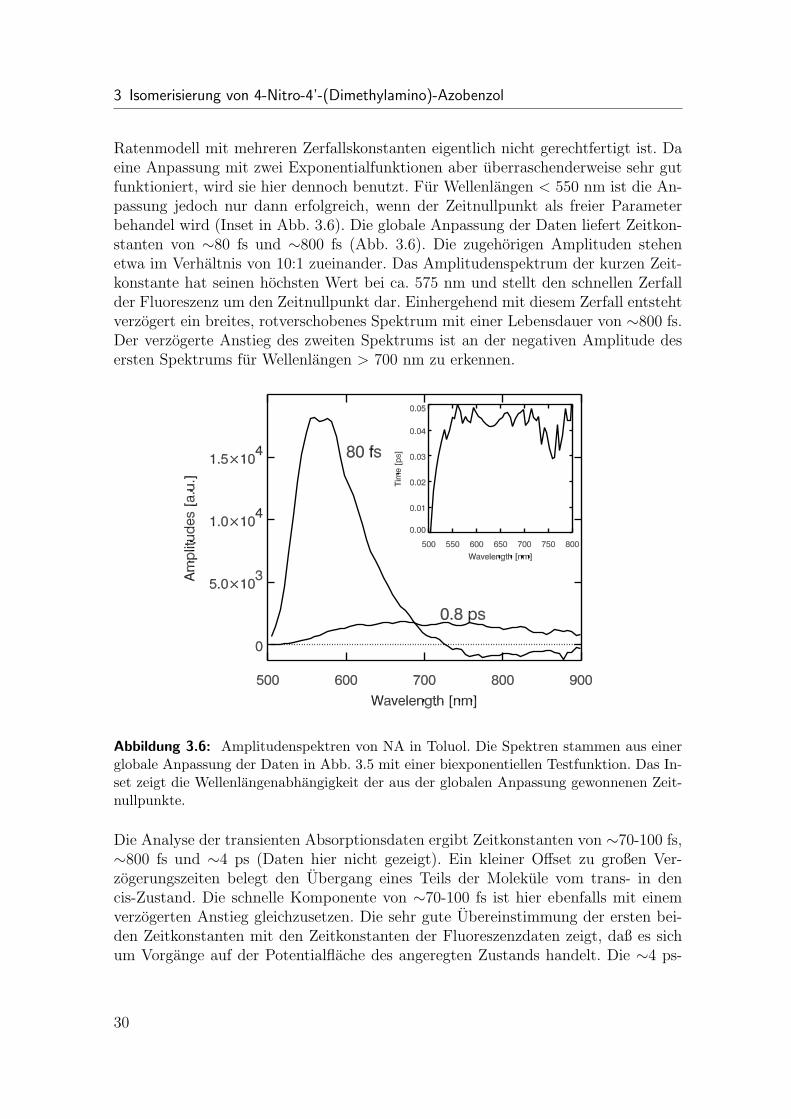
Ratenmodell mit mehreren Zerfallskonstanten eigentlich nicht gerechtfertigt ist. Daeine Anpassung mit zwei Exponentialfunktionen aber uberraschenderweise sehr gutfunktioniert, wird sie hier dennoch benutzt. Fur Wellenlangen < 550 nm ist die An-passung jedoch nur dann erfolgreich, wenn der Zeitnullpunkt als freier Parameterbehandel wird (Inset in Abb. 3.6). Die globale Anpassung der Daten liefert Zeitkon-stanten von ∼80 fs und ∼800 fs (Abb. 3.6). Die zugehorigen Amplituden stehenetwa im Verhaltnis von 10:1 zueinander. Das Amplitudenspektrum der kurzen Zeit-konstante hat seinen hochsten Wert bei ca. 575 nm und stellt den schnellen Zerfallder Fluoreszenz um den Zeitnullpunkt dar. Einhergehend mit diesem Zerfall entstehtverzogert ein breites, rotverschobenes Spektrum mit einer Lebensdauer von ∼800 fs.Der verzogerte Anstieg des zweiten Spektrums ist an der negativen Amplitude desersten Spektrums fur Wellenlangen > 700 nm zu erkennen.
Abbildung 3.6: Amplitudenspektren von NA in Toluol. Die Spektren stammen aus einerglobale Anpassung der Daten in Abb. 3.5 mit einer biexponentiellen Testfunktion. Das In-set zeigt die Wellenlangenabhangigkeit der aus der globalen Anpassung gewonnenen Zeit-nullpunkte.
Die Analyse der transienten Absorptionsdaten ergibt Zeitkonstanten von ∼70-100 fs,∼800 fs und ∼4 ps (Daten hier nicht gezeigt). Ein kleiner Offset zu großen Ver-zogerungszeiten belegt den Ubergang eines Teils der Molekule vom trans- in dencis-Zustand. Die schnelle Komponente von ∼70-100 fs ist hier ebenfalls mit einemverzogerten Anstieg gleichzusetzen. Die sehr gute Ubereinstimmung der ersten bei-den Zeitkonstanten mit den Zeitkonstanten der Fluoreszenzdaten zeigt, daß es sichum Vorgange auf der Potentialflache des angeregten Zustands handelt. Die ∼4 ps-
30

3.3 Erstellung eines Reaktionsmodells
Komponente ist demzufolge einer Dynamik des elektronischen Grundzustands zuzu-schreiben.
3.3 Erstellung eines Reaktionsmodells
Durch Kombination der Ergebnisse beider Experimente kann ein Modell der Dy-namik von NA nach Photoanregung entwickelt werden (Abb. 3.8). Zunachst falltdabei der große Stokes-Shift von δνs ≈ 4200 cm−1 zwischen dem Maximum der Ab-sorption und dem Maximum des Spektrums der kurzen Zeitkonstante auf. Unter derVoraussetzung, daß es in Abwesenheit von Schwingungs- und Losungsmittelrelaxatio-nen zu keiner spektralen Verschiebung des Maximums der Fluoreszenz relativ zumMaximum der Absorption kame, mußte man einen solchen Stokes-Shift alleine Re-laxationen bzw. Dephasierungen von Schwingungsanregungen und Losungsmittelre-laxationen zuordnen. Generell hangt ein Stokes-Shift mit der Reorganisationsenergieλ bei optischen Ubergangen zusammen und sollte, falls die Fluoreszenzlebensdauergroßer als die Schwingungs- und Losungsmittelrelaxationszeiten ist, ca. 2λ sein (Abb.3.7).
S0
S1
νh
λ
λ
~
~
Abbildung 3.7: Reorganisationsenergie λ bei optischen Ubergangen
Resonanz-Raman Experimente [70] finden fur NA eine gesamte Reorganisations-energie λ von 2429 cm−1, welche sich wiederum in einen Schwingungs- und einenLosungsmittelanteil aufteilt. Ein Stokes-Shift von δνs, der einer effektiven Reorgani-sationsenergie von 2100 cm−1 entspricht, wurde also bedeuten, daß die Relaxationbzw. Dephasierung von Schwingungsanregungen und der großte Teil der Losungsmit-telrelaxation schneller als die Zeitauflosung des Experiments ablaufen. Im Inset inAbb. 3.6, in dem die Wellenlangenabhangigkeit der aus der globalen Anpassung
31

3 Isomerisierung von 4-Nitro-4’-(Dimethylamino)-Azobenzol
0 νS
4 ps
0.8 ps
S1
h
trans
cis
80 fs
Abbildung 3.8: Reaktionsmodell von NA nach Photoanregung
gewonnenen Zeitnullpunkte dargestellt wird, ist somit nur noch der den langsame-ren Teilen der Losungsmittelrelaxation zuzuschreibende Anteil des Stokes-Shifts zusehen. Eine genauere Analyse ist wegen der dominanten Uberlagerung durch dieschnelle Zerfallskomponente nicht moglich.
Der Beginn der Isomerisierung kann mit dem Zerfall der schnellen Fluoreszenz-komponente verknupft werden. Beim CT-Ubergang handelt es sich nach [70, 71]sehr wahrscheinlich um eine Anregung in den niedrigsten elektronischen Zustand.Daher kann der schnelle Zerfall nicht mit einem Ubergang zwischen elektronisch an-geregten Zustanden verbunden werden. Er wird stattdessen einer Bewegung großerAmplitude entlang der Isomerisierungskoordinate zugeschrieben, da dies nach Kapi-tel 1 ebenfalls zu einer starken Reduktion der Emissionswahrscheinlichkeit fuhrenkann. Im Laufe dieses ca. 70-100 fs dauernden Prozesses erholt sich die Absorp-tion des Grundzustands noch nicht, da in den transienten Absorptionsspektren furdas Ausbleichen des Grundzustands keine schnelle Zeitkonstante zu sehen ist. Dembreiten Emissionsspektrum, welches zu der 0.8 ps Zeitkonstante gehort, wird dieEntleerung des elektronisch angeregten Zustands durch interne Konversion in einenheißen Grundzustand zugeordnet. Die spektrale Signatur der 4 ps Komponente derAbsorptionsspektren - Absorptionsabnahme auf der langwelligen Seite des NA Ab-sorptionsspektrums und Absorptionszunahme hin zum Absorptionsmaximum - be-deutet eine Relaxation dieses heißen Grundzustands entweder zuruck in den trans-oder in den cis-Grundzustand.
Der Vergleich von NA mit Azobenzol offenbart eine bemerkenswerte Ahnlichkeit
32

3.3 Erstellung eines Reaktionsmodells
in der Dynamik beider Molekule. Beide Systeme besitzen in der Emission das gleichebiphasische Verhalten, auf welches in der transienten Absorption die Relaxation einesheißen Grundzustands folgt. Der einzige Unterschied besteht in den um etwa den Fak-tor drei langeren Zeitkonstanten fur das unsubstituierte Azobenzol. Dies ist sehr er-staunlich, da eine derart große Anderung der elektronischen Struktur durch hinzufu-gen von Substituenten eine ausgepragtere Anderung des Verhaltens erwarten ließ.Es scheint, daß ein biphasisches Verhalten eine generelle Eigenschaft von Azoben-zol und unabhangig von Substituenten ist. Die Dynamik von Azobenzol wird alsodurch Substituenten nicht wesentlich beeinflußt. Dies ist beispielsweise relevant furdie Interpretation der Ergebnisse von Experimenten, in welchen Azobenzol als Schal-termolekul verwendet wird, da hierbei die zu schaltenden Molekule als Substituentenangesehen werden konnen.
33

3 Isomerisierung von 4-Nitro-4’-(Dimethylamino)-Azobenzol
34

4 Untersuchung der Primarreaktion vonBakteriorhodopsin
4.1 Ubersicht
Das Halobacterium Salinarum, welches zur Gruppe der Archaeen gehort, lebt in war-men, stark salzhaltigen Gewassern, die einer hohen Sonneneinstrahlung ausgesetztsind [73]. Zur Gewinnung von Energie aus Licht und von Information aus dessenspektraler Zusammensetzung besitzt es in seiner Zellmembran vier verwandte Reti-nalproteine. Es handelt sich hierbei um Bakteriorhodopsin, Halorhodopsin und Sen-sorrhodopsin I und II.
Die Sensorrhodopsine sorgen dafur, daß die Bakterien gefahrliches ultravio-lettes Licht meiden und Bereiche mit fur sie gunstigem Licht zwischen 500 nmund 650 nm aufsuchen. Bakteriorhodopsin und Halorhodopsin fungieren als licht-getriebene Protonen- bzw. Chloridpumpen. Protonen werden aus der Zelle hinaus-und Chloridionen in die Zelle hineintransportiert. Durch den so entstehenden elektro-chemischen Protonengradienten wird die Synthese von Adenosin Triphosphat (ATP)angetrieben. Der Transport von Chloridionen dient der Aufrecherhaltung der Iso-Osmolaritat der Zelle.
Aus dieser Gruppe von Proteinen ist Bakteriorhodopsin (BR) das bisher am in-tensivsten untersuchte und ist daher das Musterbeispiel lichtgetriebener Membran-proteine. BR besteht aus 248 Aminosauren und enthalt als einzigen Chromophor einRetinalmolekul. Das Retinal ist uber eine protonierte Schiffsche Base an das Lysin216 der Proteinsequenz von BR gebunden (Abb. 4.1) und befindet sich in seinerfunktional aktiven, lichtadaptierten Form im all-trans-Zustand. Nach Photoanregungisomerisiert das Retinal in den 13-cis-Zustand und initiiert damit einen thermischgetriebenen Zyklus mit mehreren spektroskopisch unterscheidbaren Intermediaten(J, K, L, M, N, O). Im Laufe dieses Zyklus wird das Proton der Schiffschen Basean den extrazellularen Kanal abgegeben und ein neues Proton aus dem Zellinnerenaufgenommen. Wahrend der Zyklusdauer von ∼10 ms kehrt das Retinal wieder inden trans-Zustand zuruck.
Das Retinal in BR besitzt sechs konjugierte Doppelbindungen und kann daherprinzipiell an verschiedenen Stellen isomerisieren (Abb. 4.1). In der Tat ist die Pho-toisomerisierung des freien Retinals in Losung weder sehr selektiv noch sehr effizient.Beispielsweise ist in Methanol und Hexan die Quantenausbeute der Isomerisierungin die Zustande 7-cis, 9-cis, 11-cis und 13-cis zusammen <15% [74]. Dagegen ist imBR-Proteingerust die Isomerisierung des Retinals vom trans- in den 13-cis-Zustandmit einer Quantenausbeute von ∼0.6 sehr effizient [75–79]. Dem Protein wird dabei
35

4 Untersuchung der Primarreaktion von Bakteriorhodopsin
Abbildung 4.1: Retinal mit protonierter Schiffscher Base. Nach Absorption eines Photonsisomerisiert das Retinal um die C13 = C14 Bindung.
eine katalytische Rolle zugeschrieben [79].
Die Dynamik dieses ersten Schritts des Photozyklus war der Inhalt vieler tran-sienter Absorptionsexperimente [75, 80–87]. In fruhen Untersuchungen [75, 80, 81]wurde nach optischer Anregung fur den ersten angeregten Zustand S1 eine Dynamikim Subpikosekundenbereich gefunden. Spatere transiente Absorptionsexperimentekonnten die ultraschnelle Dynamik von BR mit großerer Genauigkeit auflosen. Un-mittelbar nach Photoanregung entsteht im Spektrum ein breites, transientes Loch,dessen Amplitude fur ca. 0.2 ps konstant bleibt [83]. Fur die initiale Dynamik des an-geregten Zustands wird ein zweiphasiges Verhalten mit Zeitkonstanten von < 150 fsund∼450 fs beobachtet [82, 86]. Studien mit hoher Zeitauflosung finden außerdem einoszillatorisches Verhalten des transienten Absorptionssignals auf Grund von Wellen-paketsbewegungen auf den Potentialflachen des angeregten Zustands und des Grund-zustands [87–89]. Einhergehend mit dem Zerfall des angeregten Zustands sieht maninnerhalb ∼450 fs das Erscheinen einer rotverschobenen Absorptionsbande, welcheden Aufbau des J Intermediats kennzeichnet [82, 85, 86]. Diese Absorptionsbandezerfallt in 3 - 5 ps wieder und zeigt damit den Ubergang in den K Grundzustand an[75, 78].
Bei transienten Absorptionsmessungen an BR ist es schwierig, die Vorgange inden einzelnen Zustanden voneinander zu unterscheiden. Im Bereich der maximalenFluoreszenz von ca. 650 nm - 850 nm wird die stimulierte Emission zum großenTeil von Absorptionsbeitragen des elektronisch angeregten Zustands und der fruhenIntermediate uberdeckt [83, 85, 86]. Es ist daher nur schwer moglich, die Signal-
36

4.2 Fluoreszenzmessung mit niedriger Anregungsdichte
beitragen des elektronisch angeregten Zustands, des Grundzustands und der Inter-mediate zu trennen. Um die Dynamik des elektronisch angeregten Zustands selektivzu beobachten, ist es daher notwendig, die Fluoreszenz nach Anregung zeitaufgelostzu messen.
Bisher wurden jedoch nur zwei zeitaufgeloste Fluoreszenzmessungen des prima-ren Schritts der Photoreaktion von BR veroffentlicht [90, 91]. In beiden Experimentenwurde die Up-Conversion Technik verwendet. Du et al. [90] fanden drei Zeitkonstan-ten mit Werten von 90-240 fs, 0.6-0.9 ps und 9.0-13.0 ps. Die Amplitude der drittenZeitkonstante wurde mit bis zu 25% angegeben. Es konnte aber nicht sichergestelltwerden, daß die Probe zwischen zwei Anregungsimpulsen vollstandig ausgetauschtwurde. Haacke et al. [91] beobachteten nur zwei Zeitkonstanten. Die kurze Zerfalls-zeit wachst mit zunehmender Wellenlange von 150 fs auf 400 fs an. Die lange Zeit-konstante wird mit ∼10 ps angegeben und hat eine Amplitude von 4%. Allerdingsist die Zeitauflosung dieses Experiments nur ca. 250 fs, so daß die Zeitverlaufe imSubpikosekundenbereich nicht besser aufgelost werden konnen. Obwohl beide Expe-rimente ahnliche Ergebnisse aufweisen, unterscheiden sie sich doch deutlich in derDynamik des Subpikosekundenbereichs und der Amplitude der langen Zeitkonstante.
Da diese Abweichungen voneinander und von den Ergebnissen transienter Ab-sorptionsmessungen dringend der Klarung bedurfen, wurden zeitaufgeloste Fluores-zenzmessungen an BR unter klar definierten Bedingungen durchgefuhrt. Es wurdedarauf geachtet, die Probe zwischen zwei Anregungsimpulsen auszutauschen und diezeitliche und spektrale Korrektur der Meßdaten so akkurat wie moglich durchzufuh-ren. Im Laufe der Experimente wurde in mehreren Meßreihen die Anregungsdichtezwischen ∼0.07 und ∼40 Photonen pro BR-Molekul variiert.
4.2 Fluoreszenzmessung mit niedrigerAnregungsdichte
Zur Gewahrleistung von Anregungsbedingungen, die den in der Natur vorkommenden– soweit dies in zeitaufgelosten Experimenten uberhaupt zu erreichen ist – moglichstnahe sind, wurden relativ niedrige Anregungsdichten zwischen ∼0.07 und ∼1 Pho-tonen pro BR-Molekul gewahlt. In diesem Bereich wurden keine systematischen Ab-weichungen der Ergebnisse der einzelnen Messungen voneinander gefunden. Wegendes besseren Signal- zu Rauschverhaltnises wird hier bei der Darstellung der Datendie Messung mit der Anregungsdichte von ∼0.3 Photonen pro Molekul der Messungmit der Anregungsdichte von ∼0.07 Photonen pro Molekul vergezogen. Nach Anre-gung mit Impulsen einer Wellenlange von ∼565 nm emittiert BR eine spektral brei-te und kurzlebige Fluoreszenz (Abb. 4.2). Im Spektralbereich zwischen 630 nm und900 nm zerfallt die Fluoreszenz auf der Subpikosekunden- bis Pikosekundenzeitskala.Wahrend im kurzwelligeren Spektralbereich die Spektren sehr schnell zerfallen, istdie Lebensdauer im langerwelligen Spektralbereich etwas großer (∼0.5 ps). Zusatzlichgibt es noch eine Komponente mit einer Lebensdauer von mehreren Pikosekunden
37
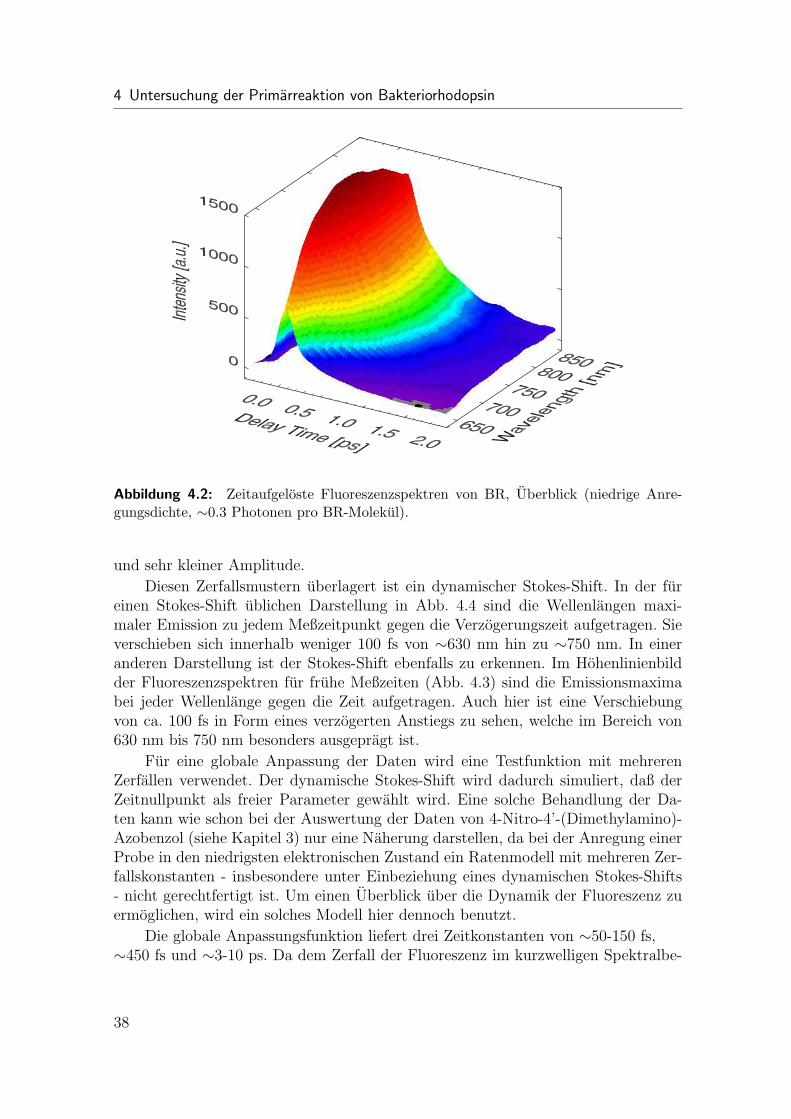
4 Untersuchung der Primarreaktion von Bakteriorhodopsin
Abbildung 4.2: Zeitaufgeloste Fluoreszenzspektren von BR, Uberblick (niedrige Anre-gungsdichte, ∼0.3 Photonen pro BR-Molekul).
und sehr kleiner Amplitude.
Diesen Zerfallsmustern uberlagert ist ein dynamischer Stokes-Shift. In der fureinen Stokes-Shift ublichen Darstellung in Abb. 4.4 sind die Wellenlangen maxi-maler Emission zu jedem Meßzeitpunkt gegen die Verzogerungszeit aufgetragen. Sieverschieben sich innerhalb weniger 100 fs von ∼630 nm hin zu ∼750 nm. In eineranderen Darstellung ist der Stokes-Shift ebenfalls zu erkennen. Im Hohenlinienbildder Fluoreszenzspektren fur fruhe Meßzeiten (Abb. 4.3) sind die Emissionsmaximabei jeder Wellenlange gegen die Zeit aufgetragen. Auch hier ist eine Verschiebungvon ca. 100 fs in Form eines verzogerten Anstiegs zu sehen, welche im Bereich von630 nm bis 750 nm besonders ausgepragt ist.
Fur eine globale Anpassung der Daten wird eine Testfunktion mit mehrerenZerfallen verwendet. Der dynamische Stokes-Shift wird dadurch simuliert, daß derZeitnullpunkt als freier Parameter gewahlt wird. Eine solche Behandlung der Da-ten kann wie schon bei der Auswertung der Daten von 4-Nitro-4’-(Dimethylamino)-Azobenzol (siehe Kapitel 3) nur eine Naherung darstellen, da bei der Anregung einerProbe in den niedrigsten elektronischen Zustand ein Ratenmodell mit mehreren Zer-fallskonstanten - insbesondere unter Einbeziehung eines dynamischen Stokes-Shifts- nicht gerechtfertigt ist. Um einen Uberblick uber die Dynamik der Fluoreszenz zuermoglichen, wird ein solches Modell hier dennoch benutzt.
Die globale Anpassungsfunktion liefert drei Zeitkonstanten von ∼50-150 fs,∼450 fs und ∼3-10 ps. Da dem Zerfall der Fluoreszenz im kurzwelligen Spektralbe-
38
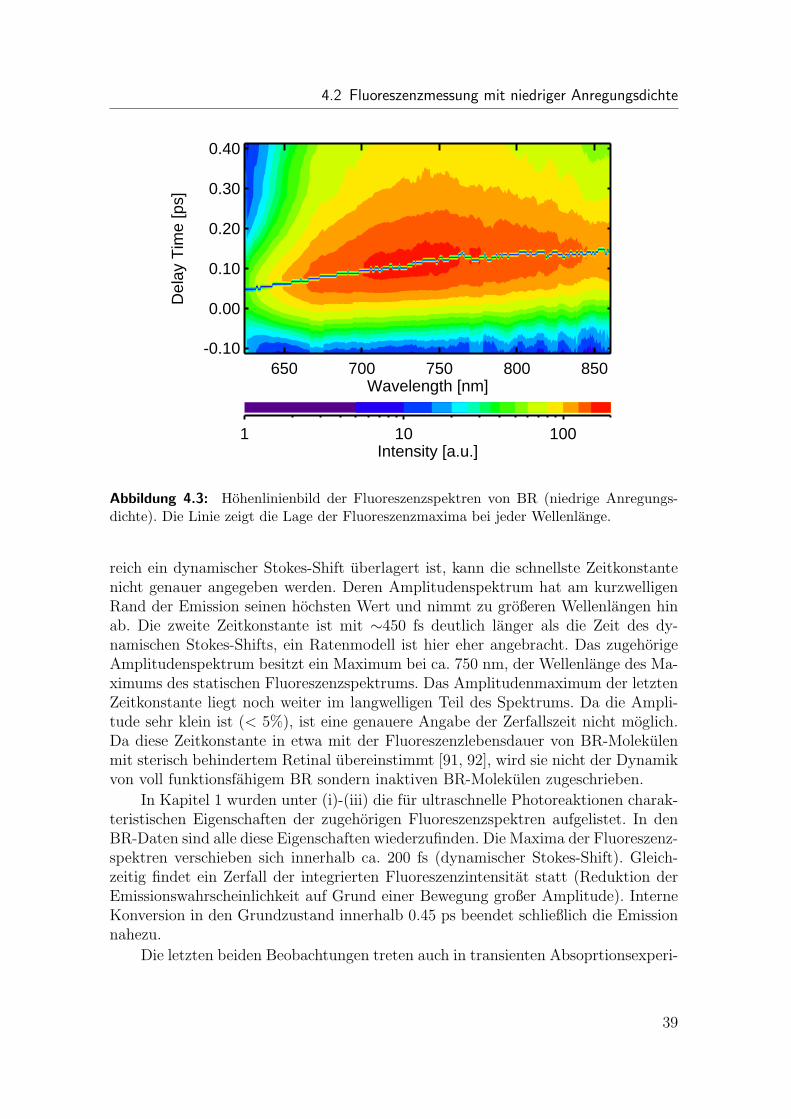
4.2 Fluoreszenzmessung mit niedriger Anregungsdichte
650 700 750 800 850Wavelength [nm]
-0.10
0.00
0.10
0.20
0.30
0.40
Del
ay T
ime
[ps]
1 10 100Intensity [a.u.]
Abbildung 4.3: Hohenlinienbild der Fluoreszenzspektren von BR (niedrige Anregungs-dichte). Die Linie zeigt die Lage der Fluoreszenzmaxima bei jeder Wellenlange.
reich ein dynamischer Stokes-Shift uberlagert ist, kann die schnellste Zeitkonstantenicht genauer angegeben werden. Deren Amplitudenspektrum hat am kurzwelligenRand der Emission seinen hochsten Wert und nimmt zu großeren Wellenlangen hinab. Die zweite Zeitkonstante ist mit ∼450 fs deutlich langer als die Zeit des dy-namischen Stokes-Shifts, ein Ratenmodell ist hier eher angebracht. Das zugehorigeAmplitudenspektrum besitzt ein Maximum bei ca. 750 nm, der Wellenlange des Ma-ximums des statischen Fluoreszenzspektrums. Das Amplitudenmaximum der letztenZeitkonstante liegt noch weiter im langwelligen Teil des Spektrums. Da die Ampli-tude sehr klein ist (< 5%), ist eine genauere Angabe der Zerfallszeit nicht moglich.Da diese Zeitkonstante in etwa mit der Fluoreszenzlebensdauer von BR-Molekulenmit sterisch behindertem Retinal ubereinstimmt [91, 92], wird sie nicht der Dynamikvon voll funktionsfahigem BR sondern inaktiven BR-Molekulen zugeschrieben.
In Kapitel 1 wurden unter (i)-(iii) die fur ultraschnelle Photoreaktionen charak-teristischen Eigenschaften der zugehorigen Fluoreszenzspektren aufgelistet. In denBR-Daten sind alle diese Eigenschaften wiederzufinden. Die Maxima der Fluoreszenz-spektren verschieben sich innerhalb ca. 200 fs (dynamischer Stokes-Shift). Gleich-zeitig findet ein Zerfall der integrierten Fluoreszenzintensitat statt (Reduktion derEmissionswahrscheinlichkeit auf Grund einer Bewegung großer Amplitude). InterneKonversion in den Grundzustand innerhalb 0.45 ps beendet schließlich die Emissionnahezu.
Die letzten beiden Beobachtungen treten auch in transienten Absoprtionsexperi-
39
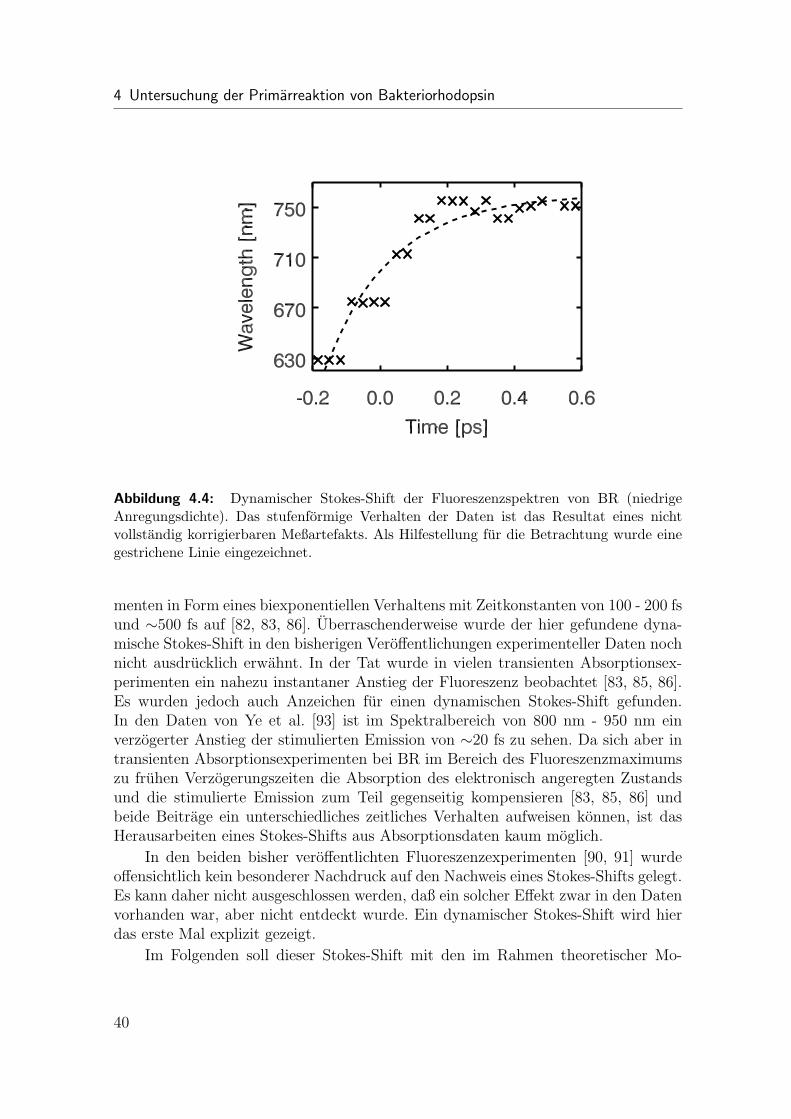
4 Untersuchung der Primarreaktion von Bakteriorhodopsin
Abbildung 4.4: Dynamischer Stokes-Shift der Fluoreszenzspektren von BR (niedrigeAnregungsdichte). Das stufenformige Verhalten der Daten ist das Resultat eines nichtvollstandig korrigierbaren Meßartefakts. Als Hilfestellung fur die Betrachtung wurde einegestrichene Linie eingezeichnet.
menten in Form eines biexponentiellen Verhaltens mit Zeitkonstanten von 100 - 200 fsund ∼500 fs auf [82, 83, 86]. Uberraschenderweise wurde der hier gefundene dyna-mische Stokes-Shift in den bisherigen Veroffentlichungen experimenteller Daten nochnicht ausdrucklich erwahnt. In der Tat wurde in vielen transienten Absorptionsex-perimenten ein nahezu instantaner Anstieg der Fluoreszenz beobachtet [83, 85, 86].Es wurden jedoch auch Anzeichen fur einen dynamischen Stokes-Shift gefunden.In den Daten von Ye et al. [93] ist im Spektralbereich von 800 nm - 950 nm einverzogerter Anstieg der stimulierten Emission von ∼20 fs zu sehen. Da sich aber intransienten Absorptionsexperimenten bei BR im Bereich des Fluoreszenzmaximumszu fruhen Verzogerungszeiten die Absorption des elektronisch angeregten Zustandsund die stimulierte Emission zum Teil gegenseitig kompensieren [83, 85, 86] undbeide Beitrage ein unterschiedliches zeitliches Verhalten aufweisen konnen, ist dasHerausarbeiten eines Stokes-Shifts aus Absorptionsdaten kaum moglich.
In den beiden bisher veroffentlichten Fluoreszenzexperimenten [90, 91] wurdeoffensichtlich kein besonderer Nachdruck auf den Nachweis eines Stokes-Shifts gelegt.Es kann daher nicht ausgeschlossen werden, daß ein solcher Effekt zwar in den Datenvorhanden war, aber nicht entdeckt wurde. Ein dynamischer Stokes-Shift wird hierdas erste Mal explizit gezeigt.
Im Folgenden soll dieser Stokes-Shift mit den im Rahmen theoretischer Mo-
40
4.2 Fluoreszenzmessung mit niedriger Anregungsdichte
delle gemachten Vorhersagen zur Primarreaktion von BR verglichen werden. DieseModelle konnen in zwei Gruppen unterteilt werden. Die Zwei-Zustands Modelle[82, 83, 89, 94–97] benotigen zur Beschreibung der Photodynamik von BR denGrundzustand und den ersten angeregten Zustand. In den Drei-Zustands Modellen[85, 98] wird zusatzlich die Potentialflache eines zweiten angeregten Zustands einge-fuhrt, welche mit derjenigen des ersten angeregten Zustands wechselwirkt. Die Zwei-Zustands Modelle konnen daruberhinaus durch die Art und Weise unterschiedenwerden, in der die Dynamik des angeregten Zustands behandelt wird.
Das einfachste Zwei-Zustands Modell ist das Ein-Moden Modell, in welchem dieTorsion um die C13 = C14 Doppelbindung die einzige Reaktionskoordinate darstellt.Im inertialen Fall [96] ist der Zerfall des elektronisch angeregten Zustands schnellgegenuber der Schwingungsrelaxation. Im uberdampften Fall [82, 83] (Abb. 4.5 a)verlaßt das im angeregten Zustand erzeugte Wellenpaket den Franck-Condon Bereichin weniger als 0.2 ps. Im Laufe dieser Bewegung relaxiert die Schwingungsanregungdes angeregten Zustands zumindest teilweise. Im Zwei-Moden Modell [89, 94, 97](Abb. 4.5 b) gibt es nicht nur eine niederfrequente Torsionskoordinate sondern aucheine hochfrequente Streckkoordinate. In einer initialen Bewegung in Form einer Re-laxation von C-C Bindungen verlaßt das Wellenpaket den Franck-Condon Bereichin Richtung eines stationaren Punkts. Das Wellenpaket bewegt sich dann innerhalbvon ca. 0.5 ps entlang der Torsionskoordinate in Richtung eines konischen Schnitts.Das Viel-Moden Modell [95] (Abb. 4.5 c) beinhaltet neben einer niederfrequentenTorsionskoordinate mehrere hochfrequente Moden. Entlang einer Reaktionskette, inderen Verlauf sukzessive jeweils eine andere Schwingungskoordinate angeregt wird,wird der isomerisierte Zustand innerhalb von ca. 3.5 ps erreicht.
In den Drei-Zustands Modellen [85, 98] (Abb. 4.5 d) existieren aufgrund vonWechselwirkungen zwischen dem ersten und dem zweiten elektronisch angeregtenZustand Barrieren entlang der Torsionkoordinate. Nach Photoanregung in einen re-lativ flachen Franck-Condon Bereich wird die Barriere in Richtung des konischenSchnitts innerhalb ca. 0.5 ps uberwunden. Wegen des recht flachen Franck-CondonBereichs und der Notwendigkeit, vor dem Erreichen des reaktiven Bereichs eine Bar-riere zu uberwinden, wird in diesem Modell kein Stokes-Shift erwartet. Aus diesemGrund paßt der hier gefundene dynamische Stokes-Shift nicht in dieses Modell.
Andererseits ist wiederum fur den uberdampften Fall des Zwei-Zustands Mo-dells auf jeden Fall ein dynamischer Stokes-Shift auf der Zeitskala der Bewegung desWellenpakets aus dem Franck-Condon Bereich erforderlich. Abhangig von der ini-tialen spektralen Verteilung und der Relaxation entlang der hochfrequenten Streckko-ordinate kann auch das Zwei-Zustands, Zwei-Moden Modell die Erklarung fur einendynamischen Stokes-Shift liefern. Schließlich kann das Auftreten eines dynamischenStokes-Shifts auch durch Modelle erklart werden, welche einen Verzweigungsmecha-nismus beinhalten. Ein solcher Ansatz wurde mehrere unterschiedliche Reaktionsko-ordinaten erfordern [86]. Zum Beispiel konnte eine Verzweigung in eine reaktive undeine nicht reaktive Schwingungskoordinate zu einem dynamischen Stokes-Shift aufder Zeitskala der Relaxation der nicht reaktiven Schwingung fuhren, wahrend der
41

4 Untersuchung der Primarreaktion von Bakteriorhodopsin
Abbildung 4.5: Reaktionsmodelle der Primarreaktion von BR nach Photoanregung. a)-c)Zwei-Zustands Modelle: a) uberdampfter Fall [82, 83], b) Zwei-Moden Modell [89, 94, 97],c) Viel-Moden Modell [95]. d) Drei-Zustands Modell [85, 98].
Weg uber die reaktive Koordinate in die Bildung der isomerisierten Konfigurationmunden wurde.
Die einfache Betrachtung der hier dargestellten Daten erlaubt jedoch noch nichtdie eindeutige Festlegung eines Mechanismus fur die Primarreaktion von BR. Hierzuwaren weitergehende theoretische Berechnungen auf der Basis der verschiedenen Mo-delle im Vergleich mit den experimentellen Daten notwendig. Es soll hier lediglichfestgehalten werden, daß zeitaufgeloste Fluoreszenzdaten solche Berechnungen er-leichtern wurden, da im Gegesatz zu transienten Absorptionsexperimenten die Ab-sorption des angeregten Zustands nicht berucksichtigt werden muß.
42
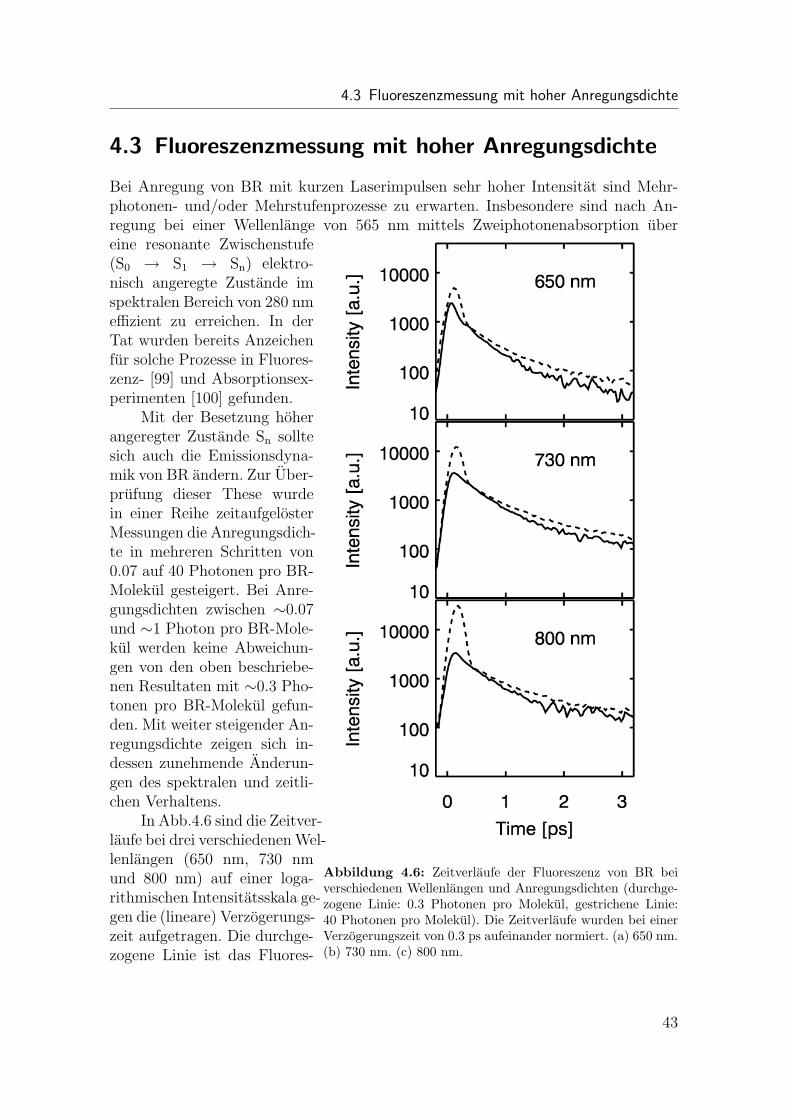
4.3 Fluoreszenzmessung mit hoher Anregungsdichte
4.3 Fluoreszenzmessung mit hoher Anregungsdichte
Bei Anregung von BR mit kurzen Laserimpulsen sehr hoher Intensitat sind Mehr-photonen- und/oder Mehrstufenprozesse zu erwarten. Insbesondere sind nach An-regung bei einer Wellenlange von 565 nm mittels Zweiphotonenabsorption ubereine resonante Zwischenstufe(S0 → S1 → Sn) elektro-nisch angeregte Zustande imspektralen Bereich von 280 nmeffizient zu erreichen. In derTat wurden bereits Anzeichenfur solche Prozesse in Fluores-zenz- [99] und Absorptionsex-perimenten [100] gefunden.
Mit der Besetzung hoherangeregter Zustande Sn solltesich auch die Emissionsdyna-mik von BR andern. Zur Uber-prufung dieser These wurdein einer Reihe zeitaufgelosterMessungen die Anregungsdich-te in mehreren Schritten von0.07 auf 40 Photonen pro BR-Molekul gesteigert. Bei Anre-gungsdichten zwischen ∼0.07und ∼1 Photon pro BR-Mole-kul werden keine Abweichun-gen von den oben beschriebe-nen Resultaten mit ∼0.3 Pho-tonen pro BR-Molekul gefun-den. Mit weiter steigender An-regungsdichte zeigen sich in-dessen zunehmende Anderun-gen des spektralen und zeitli-chen Verhaltens.
In Abb.4.6 sind die Zeitver-laufe bei drei verschiedenen Wel-lenlangen (650 nm, 730 nmund 800 nm) auf einer loga-rithmischen Intensitatsskala ge-gen die (lineare) Verzogerungs-zeit aufgetragen. Die durchge-zogene Linie ist das Fluores-
Abbildung 4.6: Zeitverlaufe der Fluoreszenz von BR beiverschiedenen Wellenlangen und Anregungsdichten (durchge-zogene Linie: 0.3 Photonen pro Molekul, gestrichene Linie:40 Photonen pro Molekul). Die Zeitverlaufe wurden bei einerVerzogerungszeit von 0.3 ps aufeinander normiert. (a) 650 nm.(b) 730 nm. (c) 800 nm.
43

4 Untersuchung der Primarreaktion von Bakteriorhodopsin
zenzsignal bei einer geringen Anregungsdichte von ∼0.3 Photonen pro Molekul,wahrend die gestrichene Linie das Fluoreszenzsignal bei einer hohen Anregungs-dichte von ∼40 Photonen pro Molekul ist. Es werden zwei signifikante Anderungenbeobachtet:
(i) Mit zunehmender Anregungsdichte steigt die Amplitude der schnellsten Zeit-konstante (< 0.15 ps) stark an. Dieser Effekt nimmt zu großeren Wellenlange hin zu.Die Emissionsmaxima verschieben sich dabei geringfugig zu spateren Verzogerungs-zeiten (siehe Abb. 4.6, gestrichene Linie).
(ii) Mit zunehmender Anregungsdichte verlangert sich die zweite Zerfallszeit von∼0.45 ps auf ∼0.7 ps (siehe ebenfalls Abb. 4.6, gestrichene Linie). Die spektrale Sig-natur des Amplitudenspektrums dieser Zeitkonstante andert sich dabei nicht.
Diese Effekte lassen sich am besten durch Anregungsprozesse in hohere Zustandeerklaren. Zum einen konnen strahlende Ubergange zwischen hoher angeregtenZustanden (Sn → Sm) auftreten. Da der Zerfall hoher angeregter Zustande durchinterne Konversion sehr schnell sein sollte, wird eine kurzlebige, zeitlich leicht ver-schobene Fluoreszenz erwartet. Wegen den im allgemeinen relativ zum S1 → S0
Ubergang kleineren Energielucken zwischen hoher angeregten Zustanden, sollte dasEmissionsspektrum zu großeren Wellenlangen hin verschoben sein. In der Tat istdies in den Fluoreszenzspektren mit hoher Anregungsdichte zu sehen. Die Ampli-tude einer kurzlebigen und rotverschobenen Komponente nimmt mit wachsenderAnregungsdichte deutlich zu (Abb. 4.6).
Zum anderen mussen Molekule, welche vom S1 Zustand in hoher angeregteZustande gebracht werden, auch wieder in diesen Zustand zuruckkehren. Da dieRepopulation des ersten angeregten Zustands durch interne Konversion eine gewisseZeit benotigt, sollte eine scheinbare Verlangerung der Lebensdauer zu sehen sein.Tatsachlich tritt mit steigender Anregungsdichte eine Verlangerung der Lebensdauervon 0.45 ps auf 0.7 ps auf (Abb. 4.6). Da dabei das zugehorige Spektrum gleichbleibt, kann davon ausgegangen werden, daß auch wirklich der Zerfall des S1 Zu-stands beobachtet wird.
4.4 Zusammenfassende Bemerkung
Die Photoprozesse in BR werden seit uber 30 Jahren untersucht. Obwohl Uber-einstimmung darin besteht, daß nach Photoanregung eine Isomerisierung des Reti-nals stattfindet, ist der Ablauf dieser Primarreaktion noch immer nicht detailliertaufgeklart. Ein großer Teil der experimentellen Information basiert auf transientenAbsorptionsmessungen. Da sich bei transienten Absorptionsmessungen die Signal-beitrage von stimulierter Emission und Absorption des angeregten Zustands und derfruhen Intermediate uberlagern, erweist sich ein Vergleich mit theoretischen Modellenals schwierig. Dagegen sind die Anforderungen an eine theoretische Auswertung vonFluoreszenzdaten viel geringer, da nur der elektronisch angeregte Zustand und derGrundzustand zum Signal beitragen.
In dieser Arbeit wurden erstmals zeitaufgeloste Fluoreszenzexperimente an BR
44

4.4 Zusammenfassende Bemerkung
bei unterschiedlichen Anregungsdichten durchgefuhrt. Aufgrund der zuvor gemach-ten Uberlegungen konnen die Anderungen der zeitaufgelosten Spektren bei hoher An-regungsdichte Mehrphotonenabsorption zugeordnet werden. Dies erlaubt es, einigeder in der Literatur gefundenen Abweichungen zu erklaren. Im Bereich niedriger An-regungsdichte wurde hier das erste Mal ein dynamischer Stokes-Shift gefunden. InUbereinstimmung mit anderen Experimenten wurden Zeitkonstanten von < 0.15 psund 0.45 ps bestimmt.
45

4 Untersuchung der Primarreaktion von Bakteriorhodopsin
46
5 Untersuchung der Primarreaktion vonProteorhodopsin
5.1 Ubersicht
Bis vor einigen Jahren waren rhodopsinartige Proteine nur als Bestandteil von Ar-chaeen (z.B. Bakteriorhodopsin (BR), Halorhodopsin, Sensorrhodopsin I und II) undEukaryonten (z.B. Photorezeptorzellen der Retina des Auges) bekannt. Kurzlich je-doch wurde das Proteorhodopsin (PR) als neues Mitglied der retinalbindenden Pro-teinfamilie des Typs I entdeckt [101, 102]. Erstmals wurde es durch Gensequenzierungvon naturlich in Meerwasser vorkommenden Planktonbakterien gefunden. Die Auf-schlusselung des Genoms von γ-Proteobakterien ergab eine sehr große Ahnlichkeitder Aminosauresequenzen von Proteorhodopsin und Rhodopsinen aus Archaeen. Inden folgenden Jahren wurde weltweit eine große Zahl homologer Sequenzen in ver-schiedenen Planktonbakterienarten identifiziert [103–105] (siehe Abb. 5.1).
Ebenso wie BR ist auch PR eine lichtgetriebene Protonenpumpe. Der auf dieseWeise entstehende Protonengradient konnte - wie auch bei BR - der Sicherung desEnergiebedarfs der Zelle dienen. Die weite Verbreitung von PR in Meeresbakterienwurde in diesem Fall den Schluß nahelegen, daß es sich bei diesem Mechanismus umeine alternative und bisher unbekannte Art der Energiegewinnung durch Photosyn-these handeln konnte.
Nach Photoanregung durchlauft PR einen Photozyklys, welcher demjenigen inBR sehr ahnlich ist. Die verschiedenen Intermediate werden mit K, M, N und Obezeichnet [106–110]. Der primare Protonenakzeptor Asp97 des PR-Molekuls besitzteinen pKa-Wert zwischen 7.1 [107] und 7.68 [108]. Der Protonentransport ist daherabhangig vom pH-Wert. In der naturlichen, leicht basischen Umgebung von PRwerden Protonen aus dem Zellinneren nach außen transportiert [107, 108]. In saurerUmgebung findet dagegen kein Protonentransport [111] oder gar ein zelleinwartsgerichteter Protonentransport statt [108]. In Abhangigkeit vom pH-Wert verschiebtsich das Absorptionsmaximum von 518 nm (pH = 11.5) nach 539 nm (pH = 4.0)[108]. Dieser Effekt wird dem Protonierungsgrad des primaren ProtonenakzeptorsAsp97 zugeschrieben [111].
Wie in allen anderen rhodopsinartigen Proteinen ist der Schlusselschritt desPhotozyklus auch in PR die Photoisomerisierung des Retinals. Das Verhaltnis vonall-trans zu 13-cis Retinal in PR betragt bei basischem pH ca. 60% zu 40% im licht-adaptierten und ca. 80% zu 20% im dunkeladaptierten Zustand. Bei saurem pH trittkeine Licht-/Dunkeladaption auf, das Verhaltnis von von 13-cis zu all-trans Retinalist stets ca. 80% zu 20% [108]. Licht- und dunkeladaptiertes PR zeigt im Gegensatz
47

5 Untersuchung der Primarreaktion von Proteorhodopsin
Abbildung 5.1: Phylogenetischer Stammbaum rhodopsinartiger Gene (nach Venter et al.[105])
zu BR keine Verschiebung des Absorptionsmaximums, lediglich der Extinktionskoef-fizient ist bei Lichtadaption ca. 10% niedriger [108].
Da die Photoisomerisierung des Retinals von solch großer Bedeutung fur dieFunktionalitat von PR ist, wurde bereits von Huber et al. [112] ein transientes Ab-sorptionsexperiment mit einer Zeitauflosung im Femtosekundenbereich an PR beipH = 9 und pH = 6 durchgefuhrt. Es wurden drei Zeitkonstanten von < 0.2 ps,∼0.4 ps und ∼8 ps bei basischem pH und < 0.2 ps, ∼0.7 ps und ∼15 ps bei saurempH bestimmt. Die erste Zeitkonstante (< 0.2 ps) wird analog der Modellbildung beiBR [82, 83, 89, 94, 95, 97] einem schnellen Verlassen des Franck-Condon Bereichsentlang einer Reaktionskoordinate (z.B. Relaxation von C-C Bindungen) zugeordnet.
Fur das Auftreten der beiden anderen Zeitkonstanten sind zwei Erklarungenvorstellbar: (i) In der PR Probe konnten zwei unterschiedliche Spezies mit unter-schiedlichem spektralen und dynamischen Verhalten existieren. Da sich das Retinalin PR stets teilweise im 13-cis und teilweise im all-trans Zustand befindet und beide
48

5.2 Zeitaufgeloste Fluoreszenzmessung
Zustande ein sehr ahnliches Absorptionsverhalten besitzen [108], konnte moglicher-weise auch die 13-cis-Form mit Licht angeregt werden und eine von der all-trans-Formverschiedene Dynamik aufweisen. (ii) Das Verlassen des Franck-Condon Bereichskonnte in PR, wie z.B. bereits fur die Isomerisierung des Retinals in Halorhodopsinvorgeschlagen wurde [113], auf unterschiedlichen Reaktionswegen stattfinden (Abb.5.2). Die konische Durchschneidung (CI) wird entweder direkt (τ1) oder uber einenZwischenzustand (τ3) erreicht. Von dort relaxiert das Retinal entweder wieder zuruckin den Grundzustand oder isomerisiert und leitet damit den Photozyklus ein (τ2).
Die pH-Abhangigkeit der zweiten und dritten Zeitkonstante legt nahe, daß dieGeschwindigkeit und Effizienz der primaren Photoreaktion in BR von der Ladungs-verteilung in der Nahe der Schiffschen Base kontrolliert wird.
Abbildung 5.2: Energie- und Reaktionsschema der ersten Schritte des PR-Photozyklusnach Huber et al. [112]
5.2 Zeitaufgeloste Fluoreszenzmessung
Die zeitaufgelosten Experimente von Huber et al. [112] wurden mit einer nicht solu-bilisierten Probe durchgefuhrt, d.h. die PR-Molekule sind noch in Membranstucken
49

5 Untersuchung der Primarreaktion von Proteorhodopsin
der sie exprimierenden E. coli Bakterien verankert. Da nicht solubilisierte Molekulewegen der Streuung des Lichts an den Membranstucken schwerer zu handhabensind als solubilisierte Molekule, wurde eine solubilisierte PR Probe bei ihrem natur-lichen, leicht basischen pH-Wert von ∼8.0 sowohl in zeitaufgeloster Emission als auchin transienter Absorption vermessen. Die zeitaufgelosten Emissionsmessungen sinddabei die ersten, die bislang an PR durchgefuhrt wurden. Es soll getestet werden,ob zwischen beiden Probenformen (solubilisiert und nicht solubilisiert) Unterschiedeauftreten. Weiterhin soll durch die zeitaufgeloste Fluoreszenzmessung gezielt die Dy-namik des elektronisch angeregten Zustands untersucht werden. Es wurde bei denMessungen darauf geachtet, die Anregungsdichte niedrig genug zu halten, so daßkeine Mehrphotoneneffekte, wie in Kapitel 4 beschrieben, vorkommen.
Nach Anregung der Probe mit Impulsen einer Wellenlange von ∼525 nm emit-tiert PR ahnlich wie BR eine spektral breite und kurzlebige Fluoreszenz (Abb. 5.3).Im Spektralbereich zwischen 500 nm und 850 nm zerfallt die Fluoreszenz auf derSubpikosekunden- bis Pikosekundenzeitskala. Anders als bei BR ist bei PR jedochein Zerfall im Pikosekundenbereich mit deutlich großerer Amplitude zu beobachten.Zusatzlich gibt es zu spaten Verzogerungszeiten noch einen Offset mit kleiner Am-plitude. Dieser wird aber, wie schon bei BR, inaktiven PR-Molekulen zugeschrieben[91, 92].
Abbildung 5.3: Zeitaufgeloste Fluoreszenzspektren von PR, Uberblick (niedrige Anre-gungsdichte, ∼0.4 Photonen pro Molekul)
Ebenso wie bei BR findet man auch bei PR einen dynamischen Stokes-Shift. Die fureinen Stokes-Shift ubliche Darstellung in Abb. 5.5 zeigt die Maxima der Emission
50

5.2 Zeitaufgeloste Fluoreszenzmessung
fur jeden Meßzeitpunkt aufgetragen gegen die Wellenlange. Innerhalb weniger 100 fsverschieben sie sich von ∼580 nm hin zu ∼700 nm. Im Hohenlinienbild der Fluo-reszenzspektren fur fruhe Meßzeiten (Abb. 5.4) sind die Emissionsmaxima bei jederWellenlange gegen die Zeit aufgetragen. Es tritt hier ebenfalls eine Verschiebung vonca. 100 fs in Form eines verzogerten Anstiegs auf.
600 650 700 750 800Wavelength [nm]
0.0
0.2
0.4
0.6
Del
ay T
ime
[ps]
1 10 100Intensity [a.u.]
Abbildung 5.4: Hohenlinienbild der Fluoreszenzspektren von PR. Die Linie zeigt die Lageder Fluoreszenzmaxima bei jeder Wellenlange.
Zur Gewinnung eines Uberblicks uber die Zerfallsdynamik der Fluoreszenz von PRwird analog zum Vorgehen bei BR eine globale Anpassung der Daten mit einerTestfunktion mit mehreren Zeitkonstanten vorgenommen. Der dynamische Stokes-Shift wird durch einen freien Zeitnullpunktsparameter simuliert. Naturlich ist einsolches Vorgehen beim Auftreten eines Stokes-Shifts, wie schon im vorhergehendenKapitel dargelegt, fur fruhe Verzogerungszeiten nur eine Naherung der tatsachlichenDynamik.
Aus der globalen Anpassung ergeben sich drei Zeitkonstanten von ∼50-150 fs,∼450 fs und ∼4 ps. Da sich zu fruhen Verzogerungszeiten der Zerfall der Fluoreszenzund der dynamische Stokes-Shift uberlagern, kann die schnellste Zeitkonstante nichtgenauer angegeben werden. Ihre Amplitude ist am kurzwelligen Rand des Spektrumsam großten und auf der langwelligen Seite fast verschwunden. Die zweite und diedritte Zeitkonstante besitzen sehr ahnliche Spektren mit Maxima bei ca. 700 nm,deren Amplituden in etwa im Verhaltnis 10:3 stehen. Da diese Zeiten deutlich großerals die Dauer des Stokes-Shifts sind, ist ein Ratenmodell fur sie als gerechtfertigtanzusehen.
51

5 Untersuchung der Primarreaktion von Proteorhodopsin
Abbildung 5.5: Dynamischer Stokes-Shift der Fluoreszenzspektren von PR. Das stufenfor-mige Verhalten der Daten ist das Resultat eines nicht vollstandig korrigierbaren Meßarte-fakts. Als Hilfestellung fur die Betrachtung wurde eine gestrichene Linie eingezeichnet.
Die transienten Absorptionsexperimente an solubilisiertem PR kommen zu den glei-chen Ergebnissen wie bereits in Ref. [112] fur nicht solubilisiertes PR gezeigt, abermit besserem Signal- zu Rauschverhaltnis. Ebenso stimmen die transienten Absorp-tionsdaten sehr gut mit den Fluoreszenzdaten uberein. Die dritte Zeitkonstante wirdfur die transiente Absorption zwar global mit ∼8 ps angegeben, jedoch ergibt eineisolierte Anpassung der Kanale mit stimulierter Emission in Ubereinstimmung mitden Fluoreszenzdaten einen Wert von ca. 3-6 ps fur den langsamen Fluoreszenzzerfall.
Die sehr große Ahnlichkeit der Spektren der zweiten und der dritten Zeitkon-stante stutzen das in [112] vorgeschlagene Potentialschema und die darin enthaltenenReaktionswege (Abb. 5.6). Da mit τ2 ∼450 fs und τ3 ∼4 ps zwei deutlich voneinan-der verschiedene Zeitkonstanten auftreten, mussen unter der Voraussetzung, daß inder PR-Probe keine unterschiedlichen Spezies mit unterschiedlichem spektralen unddynamischen Verhalten existieren, nach dem schnellen Verlassen des Franck-CondonBereichs (SFC
1 ) zwei verschiedene Zustande besetzt werden. Wegen der fast identi-schen Spektren der zweiten und der dritten Zeitkonstante konnte man nun schließen,daß einer der beiden Zustande (Srelax
1 ) ein spektroskopisch dunkler Zwischenzustandist und die gesamte Emission aus dem Bereich der konischen Durchschneidung (SCI
1 )stammt. Die konische Durchschneidung SCI
1 wurde somit entweder direkt mit derZeitkonstante τ1 oder indirekt mit der Zeitkonstante τ3 uber den Zwischenzustand(Srelax
1 ) besetzt werden. Von dort wurde das Retinal dann entweder wieder zuruck in
52
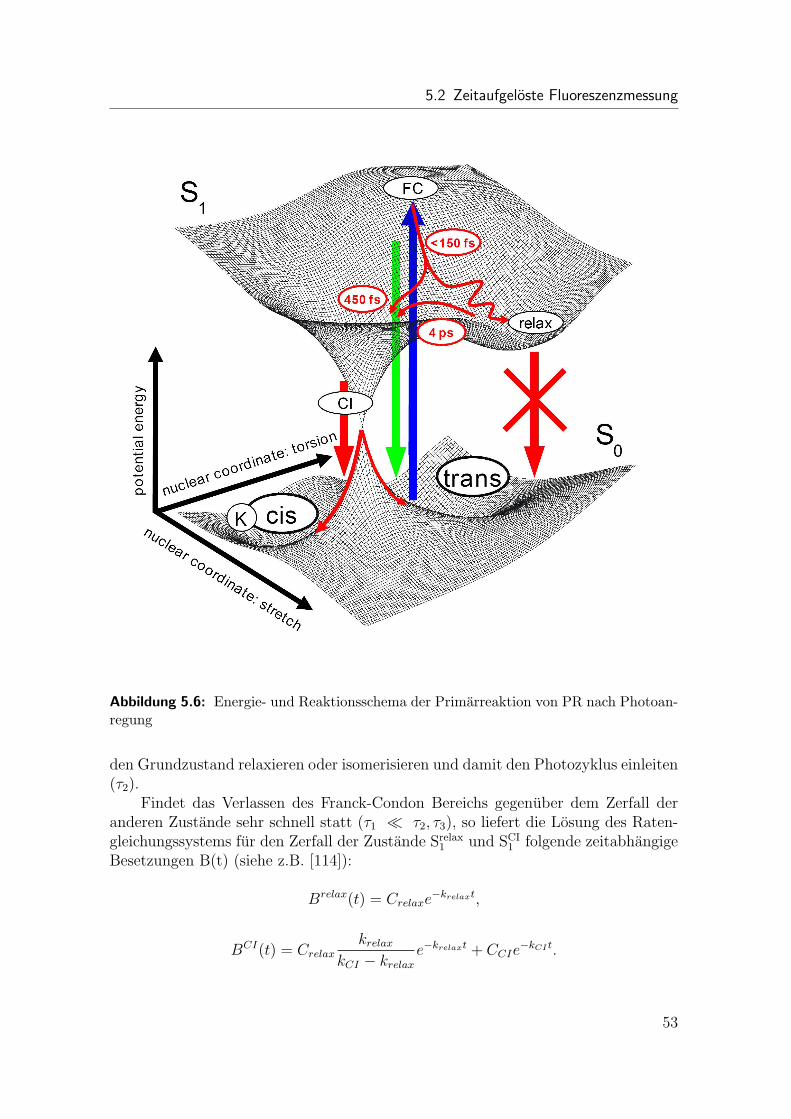
5.2 Zeitaufgeloste Fluoreszenzmessung
Abbildung 5.6: Energie- und Reaktionsschema der Primarreaktion von PR nach Photoan-regung
den Grundzustand relaxieren oder isomerisieren und damit den Photozyklus einleiten(τ2).
Findet das Verlassen des Franck-Condon Bereichs gegenuber dem Zerfall deranderen Zustande sehr schnell statt (τ1 � τ2, τ3), so liefert die Losung des Raten-gleichungssystems fur den Zerfall der Zustande Srelax
1 und SCI1 folgende zeitabhangige
Besetzungen B(t) (siehe z.B. [114]):
Brelax(t) = Crelaxe−krelaxt,
BCI(t) = Crelaxkrelax
kCI − krelax
e−krelaxt + CCIe−kCI t.
53
5 Untersuchung der Primarreaktion von Proteorhodopsin
krelax = 1τ3
und kCI = 1τ2
sind die Ratenkonstanten fur den Zerfall der jeweiligenZustande. Crelax und CCI sind Konstanten, die durch die initiale Besetzung derZustande Srelax
1 und SCI1 gegeben sind.
Da sowohl die Ratenkonstanten krelax = 2.5 ·1011 s−1 und kCI = 2.2 ·1012 s−1 alsauch das Verhaltnis der Amplituden der zugehorigen Zerfalle (Arelax : ACI = 3 : 10)aus der Auswertung der experimentellen Daten bekannt sind, ist es moglich, dieinitiale Besetzung der Zustande zu berechnen. Nach kurzer Rechnung ergibt sich furdie initialen Besetzungen ein Verhaltnis von Brelax(0) : BCI(0) = 0.65 : 0.35.
5.3 Zusammenfassende Bemerkung
In diesem Experiment wurden zum ersten Mal zeitaufgeloste Fluoreszenzmessungenan Proteorhodopsin durchgefuhrt. Neben einem dynamischen Stokes-Shift wurdendrei Zeitkonstanten von ∼50-150 fs, ∼450 fs und ∼4 ps gefunden. Es wird fest-gestellt, daß die Ergebnisse gut mit den Ergebnissen transienter Absorptionsexperi-mente ubereinstimmen. Weiterhin ist festzuhalten, daß die bereits in den transien-ten Absorptionsexperimenten bestimmten Zeitkonstanten auf Grund der Analyseder zeitaufgelosten Fluoreszenzdaten alle der Dynamik des elektronisch angeregtenZustands von PR zuzuordnen sind. Da zudem die zweite und dritte Zeitkonstan-te ahnliche Spektren und Amplituden aufweisen, wird das von Huber et al. [112]vorgeschlagene Energie- und Reaktionsschema gestutzt.
54
Abbildungsverzeichnis
1.1 Signalbeitrage bei Fluoreszenz und transienter Absorption . . . . . . 31.2 Potentialschema fur elektronische Anregung . . . . . . . . . . . . . . 51.3 Zeitkonstanten in einem Ratengleichungsmodell . . . . . . . . . . . . 7
2.1 Prinzip eines optischen Schalters (a) . . . . . . . . . . . . . . . . . . 92.2 Prinzip eines optischen Schalters (b) . . . . . . . . . . . . . . . . . . 102.3 Prinzip der Up-Conversion . . . . . . . . . . . . . . . . . . . . . . . . 112.4 Prinzip des Kerr-Schalters . . . . . . . . . . . . . . . . . . . . . . . . 122.5 Aufbau des NOPA . . . . . . . . . . . . . . . . . . . . . . . . . . . . 142.6 Aufbau des OPA . . . . . . . . . . . . . . . . . . . . . . . . . . . . . 152.7 Aufbau des Kerr-Schalter Systems . . . . . . . . . . . . . . . . . . . . 162.8 Schaltimpulsuntergrund verschiedener Kerr-Glaser . . . . . . . . . . . 172.9 Emissionsuntergrund von Quarzglas . . . . . . . . . . . . . . . . . . . 192.10 Weißlichtkontinuum . . . . . . . . . . . . . . . . . . . . . . . . . . . . 202.11 Statische Spektren von β-Carotin in Toluol . . . . . . . . . . . . . . . 212.12 Zeitaufgeloste Spektren von β-Carotin in Toluol . . . . . . . . . . . . 222.13 Zeitverlauf der Fluoreszenz am Emissionsmaximum . . . . . . . . . . 23
3.1 trans → cis Isomerisierung des Azobenzols . . . . . . . . . . . . . . . 253.2 Azobenzol-Potentialschema . . . . . . . . . . . . . . . . . . . . . . . . 273.3 Statisches Absorptions- und Emissionsspektrum von trans-NA in Toluol 283.4 Ladungstrennung in NA nach Photoanregung . . . . . . . . . . . . . 283.5 Zeitaufgeloste Fluoreszenzspektren von NA in Toluol . . . . . . . . . 293.6 Amplitudenspektren von NA in Toluol . . . . . . . . . . . . . . . . . 303.7 Reorganisationsenergie λ bei optischen Ubergangen . . . . . . . . . . 313.8 Reaktionsmodell von NA nach Photoanregung . . . . . . . . . . . . . 32
4.1 Retinal mit protonierter Schiffscher Base . . . . . . . . . . . . . . . . 364.2 Zeitaufgeloste Fluoreszenzspektren von BR, Uberblick . . . . . . . . . 384.3 Hohenlinienbild der Fluoreszenzspektren von BR . . . . . . . . . . . . 394.4 Dynamischer Stokes-Shift der Fluoreszenzspektren von BR . . . . . . 404.5 Reaktionsmodelle der Primarreaktion von BR nach Photoanregung . 424.6 Zeitverlaufe der Fluoreszenz von BR bei verschiedenen Anregungs-
dichten . . . . . . . . . . . . . . . . . . . . . . . . . . . . . . . . . . . 43
5.1 Phylogenetischer Stammbaum rhodopsinartiger Gene . . . . . . . . . 48
55

Abbildungsverzeichnis
5.2 Energie- und Reaktionsschema nach Huber et al. . . . . . . . . . . . . 495.3 Zeitaufgeloste Fluoreszenzspektren von PR, Uberblick . . . . . . . . . 505.4 Hohenlinienbild der Fluoreszenzspektren von PR . . . . . . . . . . . . 515.5 Dynamischer Stokes-Shift der Fluoreszenzspektren von PR . . . . . . 525.6 Energie- und Reaktionsschema der Primarreaktion von PR nach Pho-
toanregung . . . . . . . . . . . . . . . . . . . . . . . . . . . . . . . . 53
56

Literaturverzeichnis
[1] S.L. Shapiro, editor. Ultrashort Light Pulses. Springer, Berlin, 1977. 1, 2, 3
[2] I.B. Berlman. Handbook of Fluorescence Spectra of Aromatic Molecules. Aca-demic Press, New York and London, 1971. 1
[3] C. Wheatstone. Some experiments to measure the velocity of electricity andthe duration of electric light. Phil. Trans., pages 583–591, 1834. 1
[4] E. Bequerel. Recherches sur Divers Effets Lumineux qui Resultent de l’Actionde la Lumiere sur le Corps. Ann. Chim. Phys., 55:5–128, 1859. 1
[5] E. Bequerel. Recherches sur Divers Effets Lumineux qui Resultent de l’Actionde la Lumiere sur le Corps; Composition de la Lumiere Emise. Ann. Chim.Phys., 57:40–124, 1859. 1
[6] E. Bequerel. Recherches sur Divers Effets Lumineux qui Resultent de l’Actionde la Lumiere sur le Corps. Ann. Chim. Phys., 62:5–100, 1861. 1
[7] A. Topler. Vibroskopische Beobachtungen uber die Schwingungsphasen sin-gender Flammen (der chemischen Harmonica) mit Benutzung des Schlierenap-parates. Ann. Physik und Chemie, 128:126–139, 1866. 1
[8] A. Topler. Optische Studien nach der Methode der Schlierenbeobachtung. Ann.Physik und Chemie, 131:33–55,180–215, 1867. 1
[9] H. Abraham and J. Lemoine. Disparition instantanee du phenomene de Kerr.Compt. Rend., 129:206–211, 1899. 1
[10] H. Abraham and J. Lemoine. Nouvelle Methode de Mesure des Durees Infinites-imales. Analyse de la Disparition des Phenomenes Electro-Optiques. Ann.Chim. Phys., 20:264–287, 1900. 1
[11] E.P. Ippen and C.V. Shank. Picosecond response of a high repetition rate CS2
optical Kerr gate. Appl. Phys. Lett., 26:92–93, 1975. 1
[12] N. Bloembergen. From nanosecond to femtosecond science. Rev. Mod. Phys.,71:S283–S287, 1999. 2
[13] G. Porter. Flash photolysis and spectroscopy. A new method for the study offree-radical reactions. Proc. Roy. Soc. (London), A200:284–300, 1950. 2
57
Literaturverzeichnis
[14] C.V. Shank and E.P. Ippen. Subpicosecond kilowatt pulses from a mode-lockedcw dye laser. Appl. Phys. Lett., 24:373–375, 1974. 2
[15] D.E. Spence, P.N. Kean, and W. Sibbett. 60-fsec pulse generation from aself-mode-locked Ti:sapphire laser. Opt. Lett., 16:42–44, 1991. 2
[16] T. Wilhelm, J. Piel, and E. Riedle. Sub-20-fs pulses tunable across the visi-ble from a blue-pumped single-pass noncollinear parametric converter. OpticsLetters, 22(19):1494–1496, 1997. T261. 2, 14
[17] G. Cerullo, M. Nisoli, and S. De Silvestri. Generation of 11 fs Pulses tunableacross the Visible by Optical Parametric Amplification. Appl. Phys. Lett.,71(25):3616–3618, 1997. 2
[18] R. Huber, H. Satzger, W. Zinth, and J. Wachtveitl. Noncollinear optical para-metric amplifiers with output parameters improved by the application of awhite light continuum generated in CaF2. Opt. Commun., 194:443–448, 2001.2
[19] S. Lochbrunner, T. Wilhelm, J. Piel, P. Huppmann, S. Sporlein, and E. Riedle.Tunable visible and NIR parametric amplifiers at 1 kHz and pulse lengths downto 10 fs. Ultrafast Phenomena XI, Springer Series in Chem. Physics, pages 57– 59, 1998. 2
[20] P. Baum, S. Lochbrunner, and E. Riedle. Tunable sub-10-fs ultraviolet pulsesgenerated by achromatic frequency doubling. Opt. Lett., 29:1686–1688, 2004.2
[21] B. Schrader and W. Meier, editors. Raman/IR Atlas of Organic Compounds.Verlag Chemie, Weinheim, 1975. 2
[22] N. Sugimoto, S. Ito, S. Fujiwara, T. Suzuki, H. Kanbara, and K. Hirao. Fem-tosecond and terahertz optical Kerr shutter switching in glass containing highconcentration of bi2o3. Opt. Comm., 161:47–50, 1999. 4, 17
[23] S. Kinoshita, H. Ozawa, Y. Kanematsu, I. Tanaka, N. Sugimoto, and S. Fuji-wara. Efficient Optical Kerr Shutter for Femtosecond Time-resolved Lumines-cence Spectroscopy. Rev. Sci. Instrum., 71:3317–3322, 2000. 4, 11, 13
[24] Y. Kanematsu, H. Ozawa, I. Tanaka, and S. Kinoshita. Femtosecond OpticalKerr-Gate Measurement of Fluorescence Spectra of Dye Solutions. J. Lumin.,87-89:917–919, 2000. 4, 11, 13
[25] J. Takeda, K. Nakajima, S. Kurita, S. Tomimoto, S. Saito, and T. Suemoto.Time-resolved Luminescence Spectroscopy by the Optical Kerr-Gate MethodApplicable to Ultrafast Relaxation Processes. Phys. Rev. B, 62(15):10083–10087, 2000. 4, 11, 12, 13, 21
58
Literaturverzeichnis
[26] R. Nakamura and Y. Kanematsu. A simple and effective method for femtosec-ond spectral snapshots. J. Lumin., 94-95:559–563, 2001. 4, 13
[27] S. Arzhantsev and M. Maroncelli. Design and characterisation of a femtosecondfluorescence spectrometer based on optical Kerr gating. Appl. Spectrosc., inpress, 2004. 4, 11
[28] H. Haken and H.C. Wolf, editors. Molekulphysik und Quantenchemie. Springer-Verlag, Berlin, Heidelberg, 1992. 6, 28
[29] J. Kopecky, editor. Photochemistry. A visual Approach. VCH, New York,Weinheim, Cambridge, 1992. 6, 28
[30] M. L. Horng, J. A. Gardecki, A. Papazyan, and M. Maroncelli. SubpicosecondMeasurements of Polar Solvation Dynamics: Coumarin 153 Revisited. J. Phys.Chem., 99:17311–17337, 1995. 6
[31] M. Glasbeek and H. Zhang. Femtosecond Studies of Solvation and Intramolecu-lar Configurational Dynamics of Fluorophores in Liquid Solution. Chem. Rev.,104:1929–1954, 2004. 6, 11
[32] D. Abramavicius, V. Gulbinas, L. Valkunas, Y.-J. Shiu, K. Liang, M. Hayashi,and S. Lin. Molecular Twisting and Relaxation in the Excited State of Tri-arylpyrylium Cations. J. Phys. Chem. A, 106:8864–8869, 2002. 6, 7
[33] Y.-C. Lu, C.W. Chang, and E. W.-G. Diau. Femtosecond fluorescence dynam-ics of trans-azobenzene in hexane on excitation to the S1(n, π∗) state. J. Chin.Chem. Soc. Taip., 49:693–701, 2002. 6, 25
[34] S.A. Kovalenko, R. Schanz, V.M. Farztdinov, H. Hennig, and N.P. Ernsting.Femtosecond Relaxation of Photoexcited Para-Nitroaniline: Solvation, ChargeTransfer, Internal Conversion and Cooling. Chem. Phys. Lett., 323:312–322,2000. 6
[35] D. Markovitsi, H. Sigal, C. Ecoffet, P. Millie, F. Charra, C. Fiorini, J.-M. Nunzi,H. Strzelecka, M. Veber, and C. Jallabert. Charge transfer in triaryl pyryliumcations. Theoretical and experimental study. Chem. Phys., 182:69–80, 1994. 6
[36] J. Hofrichter, E.R. Henry, J.H. Sommer, R. Deutsch, M. Ikeda-Saito, T. Yo-netani, and W.A. Eaton. Nanosecond Optical Spectra of Iron-Cobalt HybridHemoglobins: Geminate Recombination Conformational Changes, and Inter-subunit Communication. Biochemistry, 24:2667–2679, 1985. 7
[37] S.J. Hug, J.W. Lewis, C.M. Einterz, T.E. Thorgeirsson, and D.S. Kliger.Nanosecond photolysis of rhodopsin: Evidence for a new, blue-shifted inter-mediate. Biochemistry, 29:1475–1485, 1990. 7
59
Literaturverzeichnis
[38] N.P. Ernsting, S.A. Kovalenko, T. Senyushkina, J. Saam, and V. Farztdinov.Wave-Packet-Assisted Decomposition of Femtosecond Transient Ultraviolet-Visible Absorption Spectra: Application to Excited-State Intramolecular Pro-ton Transfer in Solution. J. Phys. Chem. A, 105:3443–3453, 2001. 7
[39] C. Rulliere, editor. Femtosecond Laser Pulses. Springer-Verlag, Berlin, Heidel-berg, New York, 1998. 9
[40] Q. An, W. Zinth, and P. Gilch. In Situ Determination of Fluorescence Lifetimesvia Inverse Raman Scattering. Opt. Comm., 202:209–216, 2002. 10
[41] D. von der Linde and H. Schueler. Breakdown threshold and Plasma Formationin Femtosecond Laser-Solid Interaction. J. Opt. Soc. Am. B., 13:216–222, 1996.10
[42] U. Teubner, U. Wagner, and E. Foerster. Sub 10-fs Gating of Optical Pulses.J. Phys. B., 34:2993–3002, 2001. 10
[43] Y.R. Shen, editor. The Principles of Nonlinear Optics. Wiley, New York, 1984.10
[44] R. Schanz, S.A. Kovalenko, V. Kharlanov, and N.P. Ernsting. Broad-band fluo-rescence up-conversion for femtosecon spectroscopy. Appl. Phys. Lett., 79:566–568, 2001. 10, 11, 23
[45] M.A. Duguay. The ultrafast optical Kerr shutter. Prog. Opt., 14:161–193, 1976.11, 13
[46] W. Zinth and H. J. Korner, editors. Physik 3 Optik , Quantenphanomene undAufbau der Atome. Oldenbourg, Munchen Wien, 1998. 11, 12
[47] J. Herrmann and B. Wilhelmi. Laser fur ultrakurze Lichtimpulse. Physik-Verlag, Weinheim, 1984. 12, 21
[48] B. Schmidt, S. Laimgruber, W. Zinth, and P. Gilch. A broadband Kerr shutterfor femtosecond fluorescence spectroscopy. Appl. Phys. B, 76:809–814, 2003.13, 15, 20
[49] R.A. Kaindl, M. Wurm, K. Reimann, P. Hamm, A.M. Weiner, and M. Wo-erner. Generation, shaping, and characterization of intense femtosecond pulsestunable from 3 to 20 µm. J. Opt. Soc. Am. B, 17:2086–2090, 2000. 14
[50] P. Hamm, R.A. Kaindl, and J. Stenger. Noise suppresion in femtosecond mid-infrared light sources. Opt. Lett., 25:1798–1800, 2000. 14
[51] J.E. Aber, M.C. Newstein, and B.A. Garetz. Femtosecond optical kerr effectmeasurements in silicate glasses. J. Opt. Soc. Am. B, 17:120–127, 2000. 17
60

Literaturverzeichnis
[52] D.R. Lide and H.P.R. Frederikse, editors. CRC Handbook of Chemistry andPhysics, 76th edition. CRC Press, Boca Raton, New York, London, Tokyo,1996. 19
[53] A.N. Macpherson and T. Gillbro. Solvent Dependence of the Ultrafast s2−−s1
Internal Coversion Rate of β − carotene. J. Phys. Chem. A, 102:5049–5058,1998. 21, 22
[54] M. Mimuro, S. Akimoto, S. Takaichi, and I. Yamazaki. Effect of molecu-lar structures and solvents on the excited state dynamics of the s2 state ofcarotenoids analyzed by the femtosecond up-conversion method. J. Am. Chem.Soc., 119:1452–1453, 1997. 21
[55] H. Kandori, H. Sasabe, and M. Mimuro. Direct determination of a lifetimeof the s2 state of .beta.-carotene by femtosecond time-resolved fluorescencespectroscopy. J. Am. Chem. Soc., 116:2671–2672, 1994. 21
[56] H. Zollinger. Color Chemistry: Syntheses, Properties and Applications of Or-ganic Dyes and Pigments. VCH Verlagsgesellschaft, Weinheim, 1987. 25
[57] H. Park, E.-R. Kim, D.J. Kim, and H. Lee. Synthesis of Metal-Azo Dyes andTheir Optical and Thermal Properties as Recording Materials for DVD-R.Bull. Chem. Soc. Jpn., 75:2067–2070, 2002. 25
[58] S. Sporlein, H. Carstens, H. Satzger, C. Renner, R. Behrendt, L. Moroder,P. Tavan, W. Zinth, and J. Wachtveitl. Ultrafast spectroscopy reveals sub-nanosecond peptide conformational dynamics and validates molecular dynam-ics simulation. P. Natl. Acad. Sci USA 99, 99:7998–8002, 2002. 25
[59] J. Wachtveitl, S. Sporlein, H. Satzger, B. Fonrobert, C. Renner, R. Behrendt,D. Oesterheldt, L. Moroder, and W. Zinth. Ultrafast Conformational Dynamicsin Cyclic Azobenzene Peptides of Increased Flexibility. Biophys. J., 86:2350–2362, 2004. 25
[60] H. Satzger, C. Root, C. Renner, R. Behrendt, L. Moroder, J. Wachtveitl, andW. Zinth. Picosecond Dynamics in Water Soluble Azobenzene-Peptides. Chem.Phys. Lett., 2004. 25
[61] I.K. Lednev, T.Q. Ye, R.E. Hester, and J.N. Moore. Femtosecond time-resolveduv-visible absorption spectroscopy of trans-azobenzene in solution. J. Phys.Chem., 100:13338–13341, 1996. 25
[62] T. Nagele, R. Hoche, W. Zinth, and J. Wachtveitl. Femtosecond photoismer-izazion of cis-azobenzene. Chem. Phys. Lett., 272:489–496, 1997. 25, 26
61

Literaturverzeichnis
[63] H. Satzger, S. Sporlein, C. Root, J. Wachtveitl, W. Zinth, and P. Gilch. Fluores-cence spectra of trans- and cis-azobenzene — emission from the franck-condonstate. Chem. Phys. Lett., 372:216–223, 2003. 25, 26
[64] H. Satzger, C. Root, and M. Braun. Excited-State Dynamics of trans- andcis-Azobenzene after UV Excitation in the pi-pi* Band. J. Phys. Chem. A,108:6265–6271, 2004. 25, 26
[65] T. Fujino, S.Yu. Arzhantsev, and T. Tahara. Femtosecond Time-ResolvedFluorescence Study of Photoisomerization of trans-azobenzene. J. Phys. Chem.A, 8123-8129:8123–8129, 2001. 25
[66] T. Schultz, J. Quenneville, B. Levine, A. Toniolo, T. J. Martinez, S. Lochbrun-ner, M. Schmitt, J. P. Shaffer, M. Z. Zgierski, and A. Stolow. Mechanism andDynamics of Azobenzene Photoisomerization. J. Am. Chem. Soc., 125:8098–8099, 2003. 26
[67] S. Monti, G. Orlandi, and P. Palmieri. Features of the photochemically activestate surfaces of azobenzene. Chem. Phys., 71:87–99, 1982. 26
[68] C. Ciminelli, G. Granucci, and M. Persico. The Photoisomerization Mechanismof Azobenzene: A Semiclassical Simulation of Nonadiabatic Dynamics. Chem.Eur. J., 10:2327–2341, 2004. 26, 27
[69] E. W.-G. Diau. A New Trans-to-Cis Photoisomerization Mechanism of Azoben-zene on the S1(n,*) Surface. J. Phys. Chem. A, 108:950–956, 2004. 26
[70] N. Biswas and S. Umapathy. Study of solvent effects on the molecular structureand the reorganization energies of 4 − nitro − 4′ − dimethylaminoazobenzeneusing resonance raman intensities. J. Raman Spectrosc., 32:471–480, 2001. 26,31, 32
[71] N. Biswas and S. Umapathy. Resonance raman study of the solvent dynamicsfor ultrafast charge transfer transition in 4−nitro−4′−dimthyl−azobenzene.J. Chem. Phys., 118:5526–5536, 2003. 26, 32
[72] K. Gille, H. Knoll, and K. Quitzsch. Rate Constants of the Thermal Cis-TransIsomerization of Azobenzene Dyes in Solvents, Acetone/Water Mixtures, andin Microheterogeneous Surfactant Solutions. Int. J. Chem. Kinet., 31:337–350,1999. 26
[73] U. Haupts, J. Tittor, and D. Oesterhelt. CLOSING IN ON BACTERI-ORHODOPSIN: Progress in Understanding the Molecule. Annu. Rev. Biophys.Biomol. Struct., 28:367–399, 1999. 35
62
Literaturverzeichnis
[74] K.A. Freedman and R.S. Becker. Comparative Investigation of the Photoiso-merization of the Protonated and Unprotonated n-Butylamine Schiff Bases of9-cis-, 11-cis-, 13-cis-, and all-trans-Retinals. J. Am. Chem. Soc., 108:1245–1251, 1986. 35
[75] H.-J. Polland, M.A. Franz, W. Zinth, W. Kaiser, E. Kolling, and D. Oesterhelt.Early Picosecond Events in the Photocycle of Bacteriorhodopsin. Biophys. J.,49:651–662, 1986. 35, 36
[76] J. Tittor and D. Oesterhelt. The quantum yield of bacteriorhodopsin. FEBSLett., 263:269–273, 1990. 35
[77] M. Rohr, W. Gartner, G. Schweitzer, A. Holzwarth, and S. Braslavsky. Quan-tum Yields of the Photochromic Equilibrium between Bacteriorhodopsin andIts Bathointermediate K. Femto- and Nanosecond Optoacoustic Spectroscopy.J. Phys. Chem., 96:6055–6061, 1992. 35
[78] S. Logunov, M. El-Sayed, L. Song, and J. Lanyi. Photoisomerization QuantumYield and Apparent Energy Content of the K Intermediate in the Photocyclesof Bacteriorhodopsin, Its Mutants D85N, R82Q, and D212N, and DeionizedBlue Bacteriorhodopsin. J. Phys. Chem., 100:2391–2398, 1996. 35, 36
[79] M.A. El-Sayed and S. Logunov. On the molecular origin of the protein catalysisof the primary process in bacteriorhodopsin photosynthesis: Retinal photoiso-merization. Pure Appl. Chem., 69:749–754, 1997. 35, 36
[80] M.C. Nuss, W. Zinth, W. Kaiser, E. Kolling, and D. Oesterhelt. Femtosec-ond Spectroscopy of the First Events of the Photochemical Cycle in Bacteri-orhodopsin. Chem. Phys. Lett., 117:1–7, 1985. 36
[81] A. Sharkov, A. Pakulev, and Y. Matveetz. Primary Events in Bacteri-orhodopsin Probed by Subpicosecond Spectroscopy. Biochim. Biophys. Acta,808:94–102, 1985. 36
[82] J. Dobler, W. Zinth, W. Kaiser, and D. Oesterhelt. Excited-State ReactionDynamics of Bacteriorhodopsin Studied by Femtosecond Spectroscopy. Chem.Phys. Lett., 144:215–220, 1988. 36, 40, 41, 42, 48
[83] R. Mathies, C. Cruz, W. Pollard, and C. Shank. Direct Observation of the Fem-tosecond Excited-State Cis-Trans Isomerisation in Bacteriorhodopsin. Science,240:777–779, 1988. 36, 40, 41, 42, 48
[84] G. Haran, K. Wynne, A. Xie, Q. He, M. Chance, and R. M. Hochstrasser.Excited state dynamics of bacteriorhodopsin revealed by transient stimulatedemission spectra. Chem. Phys. Lett., 261:389–395, 1996. 36
63
Literaturverzeichnis
[85] K.C. Hasson, F. Gai, and P.A. Anfinrud. The photoisomerization of retinal inbacteriorhodopsin: Experimental evidence for a three-state model. Proc. Natl.Acad. Sci. USA, 93:15124–15129, 1996. 36, 40, 41, 42
[86] T. Ye, N. Friedman, Y. Gat, G. Atkinson, M. Sheves, M. Ottolenghi, andS. Ruhman. On the Nature of the Primary Light-Induced Events in Bacteri-orhodopsin: Ultrafast Spectroscopy of Native and c13 = c14 Locked Pigments.J. Phys. Chem. B, 103:5122–5130, 1999. 36, 40, 41
[87] B. Hou, N. Friedman, S. Ruhman, M. Sheves, and M. Ottolenghi. UltrafastSpectroscopy of the Protonated Schiff Bases of Free and C13=C14 LockedRetinals. J. Phys. Chem. B, 105:7042–7048, 2001. 36
[88] S.L. Dexheimer, Q. Wang, L.A. Peteanu, W.T. Pollard, R.A. Mathies, andC.V. Shank. Femtosecond impulsive excitation of nonstationary vibrationalstates in bacteriorhodopsin. Chem. Phys. Lett., 188:61–66, 1992. 36
[89] W. Zinth, A. Sieg, P. Huppmann, T. Blankenhorn, D. Oesterhelt, andM. Nonella. Femtosecond spectroscopy and model calculations for an under-standing of the primary reaction in bacteriorhodopsin. Ultrafast PhenomenaXII, Springer Series in Chem. Physics 66, pages 680 – 682, 2000. 36, 41, 42,48
[90] M. Du and G. Fleming. Femtosecond time-resolved fluorescence spectroscopy ofbacteriorhodopsin: Direct observation of excited state dynamics in the primarystep of the proton pump cycle. Biophys. Chem., 48:101–111, 1993. 37, 40
[91] S. Haacke, S. Schenkl, S. Vinzani, and M. Chergui. Femtosecond and Picosec-ond Fluorescence of Native Bacteriorhodopsin and a Nonisomerizing Analog.Biopolymers (Biospectroscopy), 67:306–309, 2002. 37, 39, 40, 50
[92] S. Haacke, S. Vinzani, S. Schenkl, and M. Chergui. Spectral and Kinet-ic Fluorescence Properties of Native and Nonisomerizing Retinal in Bacteri-orhodopsin. Chem. Phys. Chem., 2:310–315, 2001. 39, 50
[93] T. Ye, B. Hou, E. Gershgoren, M Ottolenghi, N. Friedman, M. Sheves, andS. Ruhman. Resolving the primary dynamics of bacteriorhodopsin, and Lockedanalogs in the reactive excited state. Ultrafast Phenomena XII, Springer Seriesin Chem. Physics 66, pages 683–685, 2000. 40
[94] M. Garavelli, F. Negri, and M Olivucci. Initial Excited-State Relaxation ofthe Isolated 11-cis Protonated Schiff Base of Retinal: Evidence for in-PlaneMotion from ab Initio Quantum Chemical Simulation of the Resonance RamanSpectrum. J. Am. Chem. Soc., 121:1023–1029, 1999. 41, 42, 48
64
Literaturverzeichnis
[95] H. Abramczyk. Femtosecond primary events in bacteriorhodopsin and its reti-nal modified analogs: Revision of commonly accepted interpretation of elec-tronic spectra of transient intermediates in the bacteriorhodopsin photocycle.J. Chem. Phys., 120:11120–11132, 2004. 41, 42, 48
[96] R.R. Birge. Nature of the primary photochemical events in rhodopsin andbacteriorhodopsin. Biochim. Biophys. Acta, 1016:293–327, 1990. 41
[97] R. Gonzalez-Luque, M. Garavelli, F. Bernardi, M. Merchan, M.A. Robb, andM. Olivucci. Computational evidence in favor of a two-state, two-mode modelof the retinal chromophore photoisomerization. Proc. Natl. Acad. Sci. USA,97:9379–9384, 2000. 41, 42, 48
[98] F. Gai, K.C. Hasson, J.Cooper McDonald, and P. Anfinrud. Chemical Dy-namics in Proteins: The Photoisomerization of Retinal in Bacteriorhodopsin.Science, 279:1886–1891, 1998. 41, 42
[99] H. Polland, M. Franz, W. Zinth, W. Kaiser, and D. Oesterhelt. Energy transferfrom retinal to amino acids - a time-resolved study of the ultraviolet emissionof bacteriorhodopsin. Biochim. Biophys. Acta, 851:407–415, 1986. 43
[100] S.L. Logunov, V.V. Volkov, M. Braun, and M.A. El-Sayed. The relaxationdynamics of the excited electronic states of retinal in bacteriorhodopsin bytwo-pump-probe femtosecond studies. Proc. Natl. Acad. Sci. USA, 98:8475–8479, 2001. 43
[101] O. Beja, L. Aravind, E.V. Koonin, M.T. Suzuki, A. Hadd, L.P. Nguyen, S.B.Jovanovich, C.M. Gates, R.A. Feldman, J.L. Spudich, E.N. Spudich, and E.F.DeLong. Bacterial Rhodopsin: Evidence for a New Type of Phototrophy in theSea. Science, 289:1902–1906, 2000. 47
[102] O. Beja, E.N. Spudich, J.L. Spudich, M. Leclerc, and E.F. DeLong. Proteo-rhodopsin phototrophy in the ocean. Nature, 411:786–789, 2001. 47
[103] J.R. de la Torre, L.M. Christianson, O. Beja, M.T. Suzuki, D.M. Karl, J. Hei-delberg, , and E.F. DeLong. Proteorhodopsin genes are distributed among di-vergent marine bacterial taxa. Proc. Natl. Acad. Sci. USA, 100:12830–12835,2003. 47
[104] G. Sabehi, R. Massana, J.P. Bielawski, M. Rosenberg, E.F. Delong, and O. Be-ja. Novel proteorhodopsin variants from the Mediterranean and Red Seas.Environ. Microbiol., 5:842–849, 2003. 47
[105] J.C. Venter, K. Remington, J.F. Heidelberg, A.L. Halpern, D. Rusch, J.A.Eisen, D.Y. Wu, I. Paulsen, K.E. Nelson, W. Nelson, D.E. Fouts, S. Levy, A.H.
65

Literaturverzeichnis
Knap, M.W. Lomas, K. Nealson, O. White, J. Peterson, J. Hoffman, R. Par-sons, H. Baden-Tillson, C. Pfannkoch, Y.H. Rogers, and H.O. Smith. Environ-mental genome shotgun sequencing of the Sargasso Sea. Science, 302:66–74,2004. 47, 48
[106] R.A. Krebs, A.M. DeVita, R. Parthasarathy, U. Alexiev, D. Dunmire, and M.SBraiman. Purification and spectroscopic studies of proteorhodopsin. Biophys.J., 82:224A–224A, 2002. 47
[107] A.K. Dioumaev, L.S. Brown, J. Shih, E.N. Spudich, J.L. Spudich, and J.K.Lanyi. Proton transfers in the photochemical reaction cycle of proteorhodopsin.Biochemistry, 41:5348–5358, 2002. 47
[108] T. Friedrich, S. Geibel, R. Kalmbach, I. Chizhov, K. Ataka, J. Heberle, M. En-gelhard, and E. Bamberg. Proteorhodopsin is a light-driven proton pump withvariable vectoriality. J. Mol. Biol., 321:821–838, 2002. 47, 48, 49
[109] G. Varo, L.S. Brown, M. Lakatos, and J.K. Lanyi. Characterization of thephotochemical reaction cycle of proteorhodopsin. Biophys. J., 84:1202–1207,2003. 47
[110] M. Lakatos, J.K. Lanyi, J. Szakacs, and G. Varo. The photochemical reactioncycle of proteorhodopsin at low pH. Biophys. J., 84:3252–3256, 2003. 47
[111] A.K. Dioumaev, J.M. Wang, Z. Balint, G. Varo, and J.K. Lanyi. Proton Trans-port by Proteorhodopsin Requires that the Retinal Schiff Base CounterionAsp-97 Be Anionic. Biochemistry, 42:6582–6587, 2003. 47
[112] R. Huber, T. Kohler, M.O. Lenz, E. Bamberg, R. Kalmbach, M. Engelhard,and J. Wachtveitl. pH dependent Photoisomerization of Retinal in Proteorho-dopsin. Biochemistry, submitted, 2004. 48, 49, 52, 54
[113] T. Arlt, S. Schmidt, W. Zinth, U. Haupts, and D. Oesterhelt. The initialreaction dynamics of the light-driven chloride pump halorhodopsin. Chem.Phys. Lett., 241:559–565, 1995. 49
[114] H.G. Zachmann. Mathematik fur Chemiker. VCH Verlagsgesellschaft, Wein-heim, 1990. 53
66

Lebenslauf
Name Bernhard Schmidt
02.11.1974 Geboren in Blasendorf, Rumanien
1981 - 1985 Grundschule Traunreut
1985 - 1994 Gymnasium Traunreut
1994 - 1995 Zivildienst im Wilhelm-Lohe-Heim Traunreut des Diakonischen Werks
1995 - 2001 Studium der Physik an der Ludwig-Maximilians-Universitat Munchen
2001 Diplom der Physik, Titel der Diplomarbeit:’Femtosekundenfluoreszenzspektroskopie mit Hilfe des Kerr-Effekts -Entwicklung und Charakterisierung’
2001 - 2004 wissenschaftlicher Mitarbeiter der Ludwig-Maximilians-Universitat Munchen
67

Lebenslauf
68

Danksagung
Es haben viele Leute zum Gelingen dieser Arbeit beigetragen. Ihnen allen mochteich dafur herzlich danken, vor allem auch denen, die hier nicht namentlich genanntsind. Im Folgenden mochte ich gerne einigen wenigen Personen besonders danken:
Prof. Dr. Wolfgang Zinth fur die Moglichkeit, meine Arbeit an seinem Lehrstuhl er-stellen zu durfen, fur die Unterstutzung dieser Arbeit und die vielen guten Tips.
Meinem Betreuer Dr. Peter Gilch fur seine bestandige Unterstutzung, aufopfer-ungsvolle Hilfsbereitschaft und große Geduld bei allen Fragen und Problemen. Ohneihn hatte diese Arbeit nie den jetzigen Stand erreichen konnen.
Stefan Laimgruber, der maßgeblich am Aufbau und Erfolg der Experimente beteiligtwar.
Dr. Qingrui Nilsson und Bjorn Heinz fur die gute Zusammenarbeit im Labor und dieHilfe bei vielen Dingen.
Dr. Ingmar Hartl fur die vielen Tips und Tricks, auch nachdem er den Lehrstuhlbereits verlassen hatte.
Constanze Sobotta fur die gute Zusammenarbeit, vor allem bei den Messungen anNA und BR.
Birgit Bußmann, Rossana Reho, Dr. Kai Stock und Arne Sieg, die nicht nur Studien-und Arbeitskollegen waren, sondern auch zu Freunden geworden sind.
Allen ubrigen ehemaligen und aktuellen Mitarbeitern der Arbeitsgruppe von Prof.Dr. Zinth wahrend meiner Zeit an diesem Lehrstuhl: Dr. Erik Baigar, Dr. MarkusBraun, Regina Durr, Dr. Benno Fonrobert, Isabel Gruber, Dr. Robert Huber, FlorianKoller, Vladimir Konjaev, Dr. Ingo Lutz, Stephan Malkmus, Dr. Karl-Heinz Mantel,Jorg Neuhaus, Andre Peine, Dr. Horst Pulvermacher, Christopher Root, Dr. HelmutSatzger, Tobias Schrader, Wolfgang Schreier und Dr. Sebastian Sporlein fur die guteZusammenarbeit am Lehrstuhl und die vielen nutzlichen Tips.
Prof. Dr. Josef Wachtveitl und seinen Mitarbeitern Martin Lenz und Thomas Kohlerfur die gute Zusammenarbeit und die Bereitstellung der PR-Proben.
Jorg Tittor fur die gute Zusammenarbeit und die die Bereitstellung der BR-Proben.
Prof. Dr. Riedle und den Mitarbeitern seiner Arbeitsgruppe fur die gute Zusamme-narbeit und Hilfsbereitschaft.
Prof. Dr. Tavan und den Mitarbeitern seiner Arbeitsgruppe fur die gute Zusam-menarbeit und das ’Asyl’, welches mir wahrend meines ersten Jahres am Lehrstuhl
69

Danksagung
gewahrt wurde.
Rudi Schwarz, Alfons Stork und Christian Hausmann aus der Werkstatt fur diefreundliche und stets prompte Erledigung aller Arbeiten.
Jorg Krebs und Harald Hoppe fur die Unterstutzung bei chemischen bzw. optischenArbeiten.
Den ehemaligen und aktuellen Mitarbeiterinnen des Sekretariats: Barbara Podolski,Nicole Klemradt und Alexandra Michaelis fur die große Hilfsbereitschaft auch uberdas notwendige Maß hinaus.
Vor allem danken mochte ich meinen Eltern und meiner Freundin Bettina fur die im-merwahrende Unterstutzung in allen Dingen, ohne die ich es nie bis hierher geschaffthatte.
70

Anhang
Im Folgenden finden sich Nachdrucke von Originalarbeiten, in denen sich die in dieserArbeit dargestellten Ergebnisse weitestgehend wiederfinden.
71
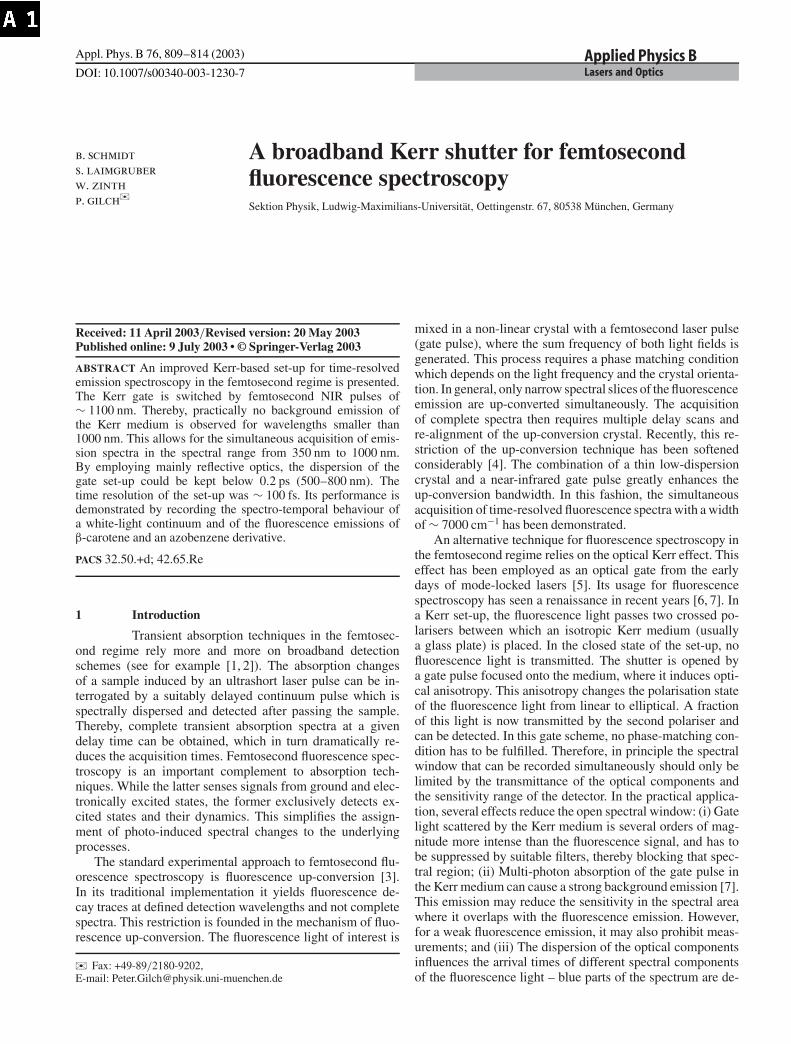
DOI: 10.1007/s00340-003-1230-7
Appl. Phys. B 76, 809–814 (2003)
Lasers and OpticsApplied Physics B
b. schmidts. laimgruberw. zinthp. gilch�
A broadband Kerr shutter for femtosecondfluorescence spectroscopySektion Physik, Ludwig-Maximilians-Universität, Oettingenstr. 67, 80538 München, Germany
Received: 11 April 2003/Revised version: 20 May 2003Published online: 9 July 2003 • © Springer-Verlag 2003
ABSTRACT An improved Kerr-based set-up for time-resolvedemission spectroscopy in the femtosecond regime is presented.The Kerr gate is switched by femtosecond NIR pulses of∼ 1100 nm. Thereby, practically no background emission ofthe Kerr medium is observed for wavelengths smaller than1000 nm. This allows for the simultaneous acquisition of emis-sion spectra in the spectral range from 350 nm to 1000 nm.By employing mainly reflective optics, the dispersion of thegate set-up could be kept below 0.2 ps (500–800 nm). Thetime resolution of the set-up was ∼ 100 fs. Its performance isdemonstrated by recording the spectro-temporal behaviour ofa white-light continuum and of the fluorescence emissions ofβ-carotene and an azobenzene derivative.
PACS 32.50.+d; 42.65.Re
1 Introduction
Transient absorption techniques in the femtosec-ond regime rely more and more on broadband detectionschemes (see for example [1, 2]). The absorption changesof a sample induced by an ultrashort laser pulse can be in-terrogated by a suitably delayed continuum pulse which isspectrally dispersed and detected after passing the sample.Thereby, complete transient absorption spectra at a givendelay time can be obtained, which in turn dramatically re-duces the acquisition times. Femtosecond fluorescence spec-troscopy is an important complement to absorption tech-niques. While the latter senses signals from ground and elec-tronically excited states, the former exclusively detects ex-cited states and their dynamics. This simplifies the assign-ment of photo-induced spectral changes to the underlyingprocesses.
The standard experimental approach to femtosecond flu-orescence spectroscopy is fluorescence up-conversion [3].In its traditional implementation it yields fluorescence de-cay traces at defined detection wavelengths and not completespectra. This restriction is founded in the mechanism of fluo-rescence up-conversion. The fluorescence light of interest is
� Fax: +49-89/2180-9202,E-mail: [email protected]
mixed in a non-linear crystal with a femtosecond laser pulse(gate pulse), where the sum frequency of both light fields isgenerated. This process requires a phase matching conditionwhich depends on the light frequency and the crystal orienta-tion. In general, only narrow spectral slices of the fluorescenceemission are up-converted simultaneously. The acquisitionof complete spectra then requires multiple delay scans andre-alignment of the up-conversion crystal. Recently, this re-striction of the up-conversion technique has been softenedconsiderably [4]. The combination of a thin low-dispersioncrystal and a near-infrared gate pulse greatly enhances theup-conversion bandwidth. In this fashion, the simultaneousacquisition of time-resolved fluorescence spectra with a widthof ∼ 7000 cm−1 has been demonstrated.
An alternative technique for fluorescence spectroscopy inthe femtosecond regime relies on the optical Kerr effect. Thiseffect has been employed as an optical gate from the earlydays of mode-locked lasers [5]. Its usage for fluorescencespectroscopy has seen a renaissance in recent years [6, 7]. Ina Kerr set-up, the fluorescence light passes two crossed po-larisers between which an isotropic Kerr medium (usuallya glass plate) is placed. In the closed state of the set-up, nofluorescence light is transmitted. The shutter is opened bya gate pulse focused onto the medium, where it induces opti-cal anisotropy. This anisotropy changes the polarisation stateof the fluorescence light from linear to elliptical. A fractionof this light is now transmitted by the second polariser andcan be detected. In this gate scheme, no phase-matching con-dition has to be fulfilled. Therefore, in principle the spectralwindow that can be recorded simultaneously should only belimited by the transmittance of the optical components andthe sensitivity range of the detector. In the practical applica-tion, several effects reduce the open spectral window: (i) Gatelight scattered by the Kerr medium is several orders of mag-nitude more intense than the fluorescence signal, and has tobe suppressed by suitable filters, thereby blocking that spec-tral region; (ii) Multi-photon absorption of the gate pulse inthe Kerr medium can cause a strong background emission [7].This emission may reduce the sensitivity in the spectral areawhere it overlaps with the fluorescence emission. However,for a weak fluorescence emission, it may also prohibit meas-urements; and (iii) The dispersion of the optical componentsinfluences the arrival times of different spectral componentsof the fluorescence light – blue parts of the spectrum are de-
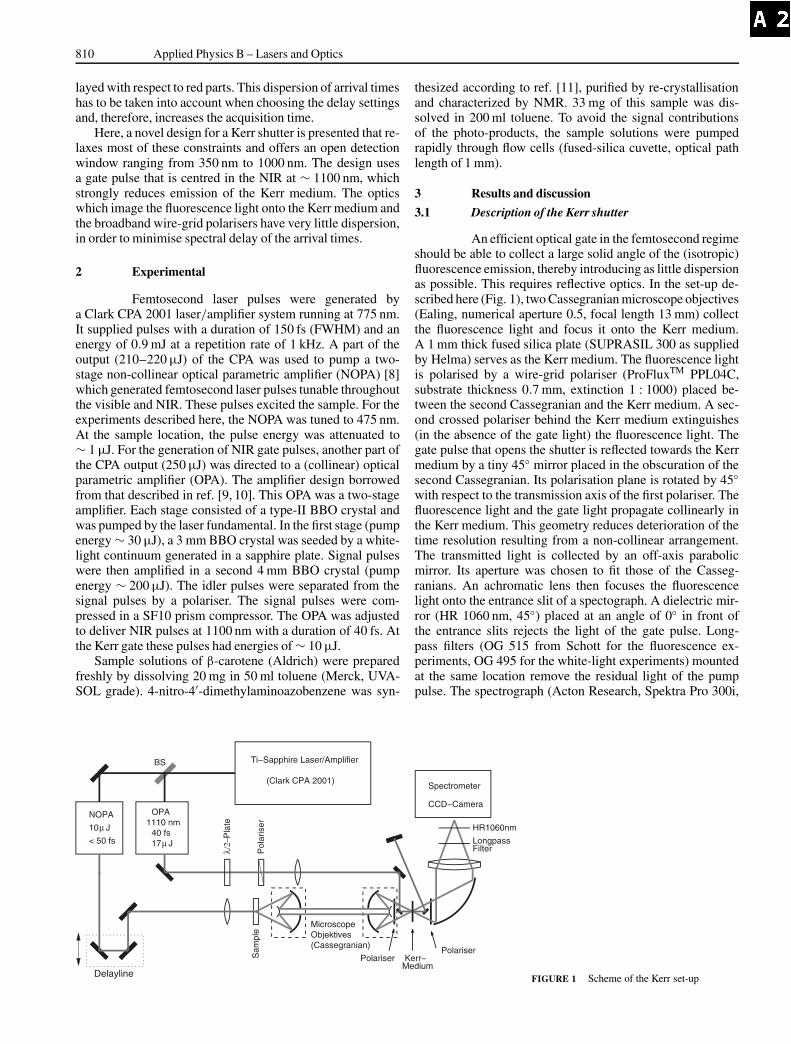
810 Applied Physics B – Lasers and Optics
layed with respect to red parts. This dispersion of arrival timeshas to be taken into account when choosing the delay settingsand, therefore, increases the acquisition time.
Here, a novel design for a Kerr shutter is presented that re-laxes most of these constraints and offers an open detectionwindow ranging from 350 nm to 1000 nm. The design usesa gate pulse that is centred in the NIR at ∼ 1100 nm, whichstrongly reduces emission of the Kerr medium. The opticswhich image the fluorescence light onto the Kerr medium andthe broadband wire-grid polarisers have very little dispersion,in order to minimise spectral delay of the arrival times.
2 Experimental
Femtosecond laser pulses were generated bya Clark CPA 2001 laser/amplifier system running at 775 nm.It supplied pulses with a duration of 150 fs (FWHM) and anenergy of 0.9 mJ at a repetition rate of 1 kHz. A part of theoutput (210–220 µJ) of the CPA was used to pump a two-stage non-collinear optical parametric amplifier (NOPA) [8]which generated femtosecond laser pulses tunable throughoutthe visible and NIR. These pulses excited the sample. For theexperiments described here, the NOPA was tuned to 475 nm.At the sample location, the pulse energy was attenuated to∼ 1 µJ. For the generation of NIR gate pulses, another part ofthe CPA output (250 µJ) was directed to a (collinear) opticalparametric amplifier (OPA). The amplifier design borrowedfrom that described in ref. [9, 10]. This OPA was a two-stageamplifier. Each stage consisted of a type-II BBO crystal andwas pumped by the laser fundamental. In the first stage (pumpenergy ∼ 30 µJ), a 3 mm BBO crystal was seeded by a white-light continuum generated in a sapphire plate. Signal pulseswere then amplified in a second 4 mm BBO crystal (pumpenergy ∼ 200 µJ). The idler pulses were separated from thesignal pulses by a polariser. The signal pulses were com-pressed in a SF10 prism compressor. The OPA was adjustedto deliver NIR pulses at 1100 nm with a duration of 40 fs. Atthe Kerr gate these pulses had energies of ∼ 10 µJ.
Sample solutions of β-carotene (Aldrich) were preparedfreshly by dissolving 20 mg in 50 ml toluene (Merck, UVA-SOL grade). 4-nitro-4′-dimethylaminoazobenzene was syn-
FIGURE 1 Scheme of the Kerr set-up
thesized according to ref. [11], purified by re-crystallisationand characterized by NMR. 33 mg of this sample was dis-solved in 200 ml toluene. To avoid the signal contributionsof the photo-products, the sample solutions were pumpedrapidly through flow cells (fused-silica cuvette, optical pathlength of 1 mm).
3 Results and discussion
3.1 Description of the Kerr shutter
An efficient optical gate in the femtosecond regimeshould be able to collect a large solid angle of the (isotropic)fluorescence emission, thereby introducing as little dispersionas possible. This requires reflective optics. In the set-up de-scribed here (Fig. 1), two Cassegranian microscope objectives(Ealing, numerical aperture 0.5, focal length 13 mm) collectthe fluorescence light and focus it onto the Kerr medium.A 1 mm thick fused silica plate (SUPRASIL 300 as suppliedby Helma) serves as the Kerr medium. The fluorescence lightis polarised by a wire-grid polariser (ProFluxTM PPL04C,substrate thickness 0.7 mm, extinction 1 : 1000) placed be-tween the second Cassegranian and the Kerr medium. A sec-ond crossed polariser behind the Kerr medium extinguishes(in the absence of the gate light) the fluorescence light. Thegate pulse that opens the shutter is reflected towards the Kerrmedium by a tiny 45◦ mirror placed in the obscuration of thesecond Cassegranian. Its polarisation plane is rotated by 45◦with respect to the transmission axis of the first polariser. Thefluorescence light and the gate light propagate collinearly inthe Kerr medium. This geometry reduces deterioration of thetime resolution resulting from a non-collinear arrangement.The transmitted light is collected by an off-axis parabolicmirror. Its aperture was chosen to fit those of the Casseg-ranians. An achromatic lens then focuses the fluorescencelight onto the entrance slit of a spectograph. A dielectric mir-ror (HR 1060 nm, 45◦) placed at an angle of 0◦ in front ofthe entrance slits rejects the light of the gate pulse. Long-pass filters (OG 515 from Schott for the fluorescence ex-periments, OG 495 for the white-light experiments) mountedat the same location remove the residual light of the pumppulse. The spectrograph (Acton Research, Spektra Pro 300i,

SCHMIDT et al. A broadband Kerr shutter for femtosecond fluorescence spectroscopy 811
f = 300 mm, aperture 0.25) is equipped with a 150 lines/mmgrating and images the dispersed fluorescence onto an liquid-nitrogen-cooled CCD-camera (Princeton Instruments, Spec-10 : 400B). The spectrograph/detector set-up covered a spec-tral range from 350 nm to 1000 nm.
3.2 Characterisation of the Kerr shutter
3.2.1 Background emission of the Kerr medium. In the fem-tosecond regime, only solid materials (mostly glasses) aresuitable as Kerr media, because in liquids orientational con-tributions to the Kerr non-linearity deteriorate the time reso-lution (for a comparison of the Kerr response of the liquid CS2and a glass see for example [12]). Among glasses suitable fora Kerr application, those with a high Kerr non-linearity seemto be the best candidates. Unfortunately, glasses with a highnon-linearity usually also show a large dispersion (see for ex-ample [13]). Such a dispersion reduces the time resolution dueto large differences of the group velocities of the gate pulseand the gated fluorescence light. Therefore, a material – fusedsilica – with a rather low Kerr non-linearity was chosen forthe set-up described here. Fused silica yielded the best timeresolution among the materials tested (SrTiO3, BK 7 glass,SF 5 glass). It offered the additional advantages that itsbandgap is far in the UV and emission following multi-photon absorption is rather weak. This applies already forgate pulses centered around 800 nm (the fundamental ofcommon titanium–sapphire systems) for which a weak un-structured emission is detected (data not shown). However,using laser fundamental pulses as gate pulses excludes the in-teresting spectral region around 800 nm from spectroscopicinvestigations (Fig. 2, grey area). NIR (1100 nm) pulses,as in the set-up described here, open this region for spec-troscopic investigation (see Fig. 2). In addition, the broadbackground due to multi-photon fluorescence emission isnow virtually missing. This applies not only to fused sil-ica glasses such as Kerr media, for which this emissionis generally weak, but also to other media like SF5 (data
FIGURE 2 Background emission of the Kerr medium (solid line) when ex-citing with the 1100 nm gate pulses. The grey area symbolizes the spectralregion blocked when employing 775 nm gate pulses. A time-resolved fluo-rescence spectrum of β-carotene (dashed line) at zero delay is depicted forcomparison
not shown). The only background emission observed isa rather sharp peak centred at 550 nm. This peak presum-ably stems from second-harmonic generation at the surfaceof the Kerr glass. Its magnitude varies somewhat betweendifferent fused silica samples; the smallest emission wasobserved for a SUPRASIL 300 plate which was the Kerrmedium used in the following. To illustrate the magnitude ofthe second harmonic background, the emission of this glassis compared with a time-resolved fluorescence spectrum inFig. 2.
3.2.2 Temporal resolution and dispersion. The ideal lightsource for the characterisation of a time-resolved fluorescencespectrograph can be switched on and off instantaneously andits emission spectrum should cover the whole spectral rangeof the detector. A femtosecond white-light continuum gen-erated when tightly focusing an ultrashort laser pulse intoa transparent medium approaches that ideal. The duration ofthis continuum in a given spectral region may be shorter thanthe laser pulses generating it, and it is therefore well suitedfor the determination of the temporal resolution of a par-ticular set-up. In the present experiment, the continuum was
FIGURE 3 Spectral and temporal characteristics of a white-light con-tinuum used to characterise the Kerr set-up. a Spectrum of the continuumgenerated by focussing 475 nm NOPA pulses into a 2 mm thick CaF2 plate.The spectrum is corrected for the spectral sensitivity of the set-up. The cut-offof the spectrum beyond 520 nm is due to a long-pass filter. b Gated intensityversus delay time and wavelength as recorded with the Kerr set-up

812 Applied Physics B – Lasers and Optics
produced by focusing the NOPA light (475 nm) into a ro-tating 2 mm thick CaF2 plate placed at the sample location.The white-light spectrum was recorded using the Kerr set-up(Fig. 3a). The apparent time dependence of this continuumpulse obtained with the Kerr shutter is depicted in Fig. 3b. Thecontour plot shows the emission intensity versus wavelengthand pump-gate delay. The banana shape of this emission isdue to the group velocity dispersion of the Kerr shutter. Toquantify this dispersion, the wavelength dependence of themaxima of the emission along the time axis was determined.Between 500 nm and 800 nm, the peak shift caused by the set-up amounted to only 0.2 ps. Three components in the Kerrshutter cause this delay: the CaF2 plate (2 mm), the wire-gridpolariser (0.7 mm of Corning 1737F industrial grade sub-strate) and the Kerr medium (1 mm of fused silica). In thecalculation of this delay, it was assumed that the continuumwas generated in the centre of the CaF2 plate, i.e. the effect-ive length is 1 mm, and that the whole length of Kerr mediumcontributed to the delay. This calculation yielded a value of209 fs, in good agreement with the experimental result. Thetime-resolved fluorescence spectra presented in the followingare corrected for this time zero dispersion. The correction pro-cedure relies on the white-light data presented above and addsthe contribution of the solvent. This contribution is calculatedfrom dispersion data (the values for the solvent toluene usedhere were taken from [14]).
The white-light experiment not only yielded the arrivaltimes of different wavelengths, but also a lower limit for theinstrumental response function of the set-up. This time reso-lution was ∼ 80 fs (FWHM).
3.3 Femtosecond fluorescence spectra
Before we turn to the acquisition of time-resolvedfluorescence spectra, the procedures used to correct for thespectral sensitivity of the set-up will be described. There aretwo contributions to this sensitivity: the “cw sensitivity” andthe wavelength dependence of the gate efficiency g(λ). The“cw sensitivity” stems from the reflectivity and the transmis-sion of the optical components and the quantum efficiencyof the CCD detector. This sensitivity is easily determinedand corrected for using a black-body radiator as a reference.The gate efficiency g(λ) is expected to decrease with increas-ing wavelength, since for a given Kerr anisotropy the phaseshift becomes smaller with increasing wavelength. This de-pendence was obtained experimentally by the following pro-cedure: The cw fluorescence spectrum Scw(λ) was recordedand compared with the temporal integral of the time-resolvedspectra S(λ, t), i.e.
g(λ) = 1
τcc
∫ ∞0 S(λ, t)dt
Scw(λ). (1)
Here, τcc is the opening time of the shutter (taken as theFWHM of the instrumental response function). Assumingthat the dispersion of the non-linear refractive index respon-sible for the Kerr effect can be neglected, the gate efficiencyg(λ) should be proportional to 1
λ2 [6], i.e. multiplication ofthe time-integrated spectrum with λ2 should recover the cwspectrum. This is indeed the case as the spectra depicted
FIGURE 4 Steady-state spectra of β-carotene in toluene. The sampleconcentrations were 1.5×10⁻⁴ M and 7.5×10⁻⁴ M for the absorption andthe emission spectra, respectively. The spectrum is corrected for the spectralsensitivity of the set-up. The cut-off of the spectrum beyond 510 nm is dueto a long-pass filter. The emission spectra were recorded with the Kerr set-up either with parallel polarisers (cw spectrum, solid line) or by numericallyintegrating the time-resolved fluorescence signal. These spectra are depictedwith (dashed line) and without (dotted line) λ2 correction (see text)
in Fig. 4 demonstrate. Therefore, in the following, all time-resolved spectra are presented with a λ2 correction factor.
The dynamics of two fluorophores were studied to demon-strate the performance of this Kerr shutter under real ex-perimental conditions. The first one, β-carotene, has a verylarge optical transition moment (the extinction coefficient incyclohexane is ε = 134 300 M−1cm−1 [15]) and was there-fore expected to exhibit a strong transient fluorescence signal.The time-resolved emission of this compound has alreadybeen subject to numerous studies [15–17] and therefore al-lows the checking of the consistency of the results. The otherone, 4-nitro-4′-dimethylaminoazobenzene is a weaker emit-ter (with an extinction coefficient of ε = 17 000 M−1cm−1 inbenzene). To our knowledge, its time-resolved emission hasnever been reported. Because of its photo-inducible trans-cis-isomerisation, many time-resolved experiments on the par-ent part of the molecule, the azobenzene, have been reported(e.g. [18, 19]).
β-carotene in toluene was excited with a NOPA (1 µJ),centred at 475 nm, close to the maximum of its absorptionspectrum (see Fig. 4). Time-resolved fluorescence spectra(Fig. 5) were recorded with a gate pulse energy of 10 µJ, andthe exposure time for each delay time was set to 3 s. Withthis setting, the acquisition of the complete fluorescence dy-namics depicted in Fig. 5 could be recorded in only 3 min,with a good signal-to-noise ratio. The time-resolved spectrapeak at 545 nm. Apart from a modest broadening, the shapeof the fluorescence emission does not change during the de-cay. This behaviour is in excellent agreement with the resultsof Macpherson and Gillbro [15], who report a maximum of542 nm and a shape invariance. The time dependence of thefluorescence emission close to the maximum at 545 nm iscompared with a model function in Fig. 5b. The trial func-tion is the sum of two decaying exponentials convoluted witha Gaussian to model the instrumental response function, anddescribes the data very well. The best fit parameters were135 fs for the response function (FWHM) and 103 fs for the

SCHMIDT et al. A broadband Kerr shutter for femtosecond fluorescence spectroscopy 813
FIGURE 5 Time-resolved fluorescence spectra of β-carotene in toluene.The data are corrected for the dispersion of time zero, the spectral sensitivityand the gate efficiency. a Time-resolved spectra. b Time trace at the max-imum of the fluorescence spectrum. The line describes the result of the fit asdescribed in the text
decay time with the dominant amplitude. The second timeconstant was determined to be 415 fs and carried an ampli-tude of only 3% as compared to the 103 fs component. Thevalue of 103 fs is close to the time constant of 144 fs de-termined by up-conversion measurements [15]. The slightlyshorter time constant reported here can at least partially beascribed to the bi-exponential fit function employed here ascompared to the single exponential trial function of ref. [15].The time resolution of 135 fs derived from the fit of the fluo-rescence decay does not reach the value of ∼ 80 fs obtainedby the white-light measurements. Presumably this is becausethe white-light emission originates from a smaller volumethan the fluorescence emission and the optical path length dif-ferences are, therefore, somewhat larger for the fluorescenceexperiments. With this response time, an absolute value ofthe gate efficiency g as defined by (1) can be determined. Atthe spectral maximum of the β-carotene emission, this effi-ciency is 3–4%, which is comparable to the values reported byTakeda et al. [6].
The acquisition of femtosecond fluorescence spectra ofthe azobenzene derivative is more challenging since its os-cillator strength is an order of magnitude smaller than thatof β-carotene and its fluorescence decay is bi-phasic, with
FIGURE 6 Time-resolved fluorescence spectra of 4-nitro-4′-dimethy-laminoazobenzene in toluene. The data are corrected for the dispersion oftime zero, the spectral sensitivity and the gate efficiency. a Time-resolvedspectra. b Time trace at the maximum of the fluorescence spectrum. The linedescribes the result of the fit as described in the text
one component carrying only a small amplitude (see be-low). This behaviour is already visible in a single acqui-sition scan (recording time ∼ 5 min, data not shown). Inorder to demonstrate the long-term stability of the set-upand to increase the signal-to-noise ratio, 50 scans were ac-cumulated (Fig. 6). By inspections of the single scan datait was assured that no long-term drifts deteriorated the sig-nal. The time-resolved emission spectra obtained in thisfashion show pronounced spectral dynamics during theirdecay (Fig. 6). Immediately after excitation, a structuredspectrum with a peak at 550 nm and a shoulder at 580 nmis observed. This spectrum decays rapidly to a broad un-structured emission (Fig. 6b). A bi-exponential fit withthe instrumental response function set to 135 fs producestime constants of 80 fs and 620 fs. The amplitude of the620 fs component amounts to 4.5% with respect to the80 fs component. A rapidly decaying strong component anda longer lived contribution carrying a weak amplitude hasalready been observed for the parent compound azoben-zene [20]. These up-conversion measurements yielded timeconstants of 200–300 fs and 1–2 ps for the two contributions,i.e. in the azobenzene derivative studied here, the photo-isomerization seems to be accelerated as compared to theparent compound.

814 Applied Physics B – Lasers and Optics
4 Conclusion
It has been demonstrated that the performance ofa Kerr shutter for femtosecond fluorescence is strongly im-proved by using gate pulses centred at 1100 nm. Apart froma very weak emission around 550 nm, the gate pulses generatevirtually no emission background in the spectral range from350 nm to 1000 nm. This allows simultaneous acquisition oftime-resolved emissions in this broad range. In addition, sincein a Kerr shutter the gated fluorescence light is not shifted infrequency, a direct comparison between the stationary fluores-cence spectrum and the time-resolved spectra is possible.
REFERENCES
1 S.A. Kovalenko, A.L. Dobryakov, J. Ruthmann, N.P. Ernsting: Phys.Rev. A 59, 2369 (1999)
2 M. Seel, E. Wildermuth, W. Zinth: Meas. Sci. Technol. 8, 449 (1997)3 D. Block, J. Shah, A.C. Gossard: Solid State Commun. 59, 527 (1986)4 R. Schanz, S.A. Kovalenko, V. Kharlanov, N.P. Ernsting: Appl. Phys.
Lett. 79, 566 (2001)5 M.A. Duguay: Prog. Opt. 14, 161 (1976)
6 J. Takeda, K. Nakajima, S. Kurita, S. Tomimoto, S. Saito, T. Suemoto:Phys. Rev. B 62, 10 083 (2000)
7 S. Kinoshita, H. Ozawa, Y. Kanematsu, I. Tanaka, N. Sugimoto, S. Fuji-wara: Rev. Sci. Instrum. 71, 3317 (2000)
8 T. Wilhelm, J. Piel, E. Riedle: Opt. Lett. 22, 1494 (1997)9 R.A. Kaindl, M. Wurm, K. Reimann, P. Hamm, A.M. Weiner, M. Wo-
erner: J. Opt. Soc. Am. B 17, 2086 (2000)10 P. Hamm, R.A. Kaindl, J. Stenger: Opt. Lett. 25, 1798 (2000)11 A. Ulman, C.S. Willand, W. Köhler, D.R. Robello, D.J. Williams,
L. Handley: J. Am. Chem. Soc. 112, 7083 (1990)12 N. Sugimoto, S. Ito, S. Fujiwara, T. Suzuki, H. Kanbara, K. Hirao: Opt.
Commun. 161, 47 (1999)13 J.E. Aber, M.C. Newstein, B.A. Garetz: J. Opt. Soc. Am. B 17, 120
(2000)14 D.R. Lide, H.P.R. Frederikse (Eds.): CRC Handbook of Chemistry and
Physics, 76th edition (CRC Press, Boca Raton, New York, London,Tokyo 1996)
15 A.N. Macpherson, T. Gillbro: J. Phys. Chem. A 102, 5049 (1998)16 H. Kandori, H. Sasabe, M. Mimuro: J. Am. Chem. Soc. 116, 2671 (1994)17 M. Mimuro, S. Akimoto, S. Takaichi, I. Yamazaki: J. Am. Chem. Soc.
119, 1452 (1997)18 T. Nägele, R. Hoche, W. Zinth, J. Wachtveitl: Chem. Phys. Lett. 272, 489
(1997)19 T. Fujino, S.Y. Arzhantsev, T. Tahara: J. Phys. Chem. A 105, 8123 (2001)20 Y.-C. Lu, C.W. Chang, E. W-G. Diau: J. Chin. Chem. Soc. Taip. 49, 693
(2002)
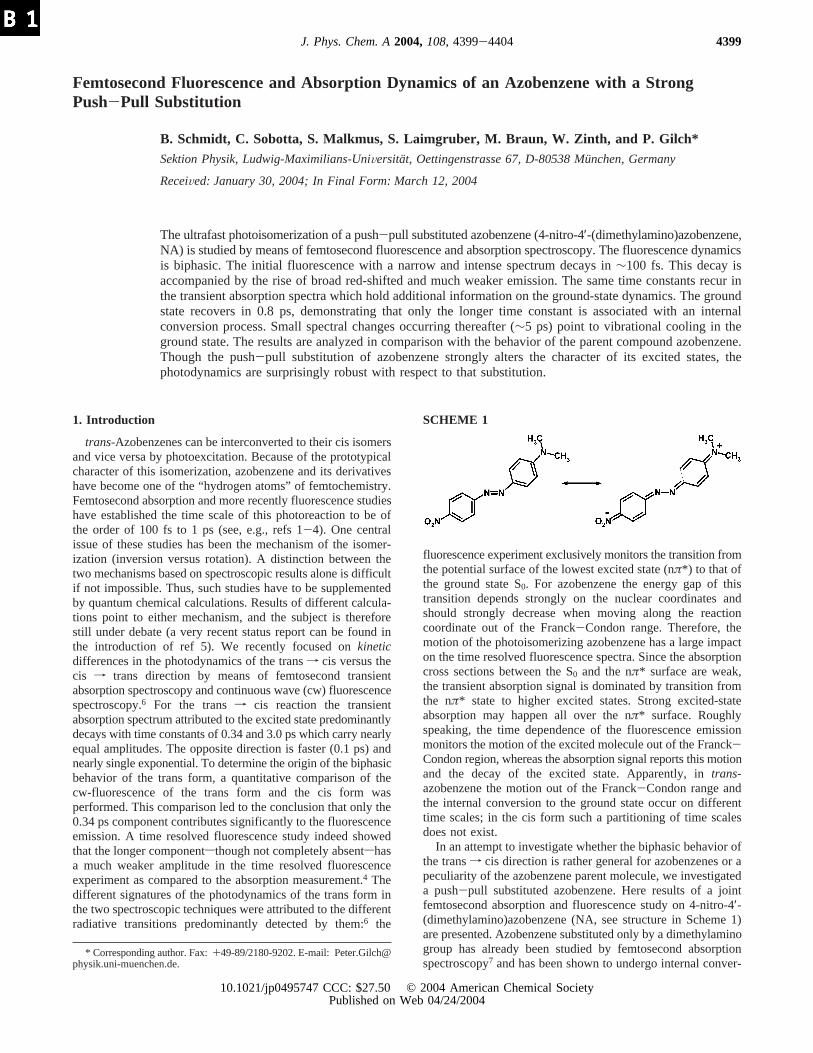
Femtosecond Fluorescence and Absorption Dynamics of an Azobenzene with a StrongPush-Pull Substitution
B. Schmidt, C. Sobotta, S. Malkmus, S. Laimgruber, M. Braun, W. Zinth, and P. Gilch*Sektion Physik, Ludwig-Maximilians-UniVersitat, Oettingenstrasse 67, D-80538 Mu¨nchen, Germany
ReceiVed: January 30, 2004; In Final Form: March 12, 2004
The ultrafast photoisomerization of a push-pull substituted azobenzene (4-nitro-4′-(dimethylamino)azobenzene,NA) is studied by means of femtosecond fluorescence and absorption spectroscopy. The fluorescence dynamicsis biphasic. The initial fluorescence with a narrow and intense spectrum decays in∼100 fs. This decay isaccompanied by the rise of broad red-shifted and much weaker emission. The same time constants recur inthe transient absorption spectra which hold additional information on the ground-state dynamics. The groundstate recovers in 0.8 ps, demonstrating that only the longer time constant is associated with an internalconversion process. Small spectral changes occurring thereafter (∼5 ps) point to vibrational cooling in theground state. The results are analyzed in comparison with the behavior of the parent compound azobenzene.Though the push-pull substitution of azobenzene strongly alters the character of its excited states, thephotodynamics are surprisingly robust with respect to that substitution.
1. Introduction
trans-Azobenzenes can be interconverted to their cis isomersand vice versa by photoexcitation. Because of the prototypicalcharacter of this isomerization, azobenzene and its derivativeshave become one of the “hydrogen atoms” of femtochemistry.Femtosecond absorption and more recently fluorescence studieshave established the time scale of this photoreaction to be ofthe order of 100 fs to 1 ps (see, e.g., refs 1-4). One centralissue of these studies has been the mechanism of the isomer-ization (inversion versus rotation). A distinction between thetwo mechanisms based on spectroscopic results alone is difficultif not impossible. Thus, such studies have to be supplementedby quantum chemical calculations. Results of different calcula-tions point to either mechanism, and the subject is thereforestill under debate (a very recent status report can be found inthe introduction of ref 5). We recently focused onkineticdifferences in the photodynamics of the transf cis versus thecis f trans direction by means of femtosecond transientabsorption spectroscopy and continuous wave (cw) fluorescencespectroscopy.6 For the transf cis reaction the transientabsorption spectrum attributed to the excited state predominantlydecays with time constants of 0.34 and 3.0 ps which carry nearlyequal amplitudes. The opposite direction is faster (0.1 ps) andnearly single exponential. To determine the origin of the biphasicbehavior of the trans form, a quantitative comparison of thecw-fluorescence of the trans form and the cis form wasperformed. This comparison led to the conclusion that only the0.34 ps component contributes significantly to the fluorescenceemission. A time resolved fluorescence study indeed showedthat the longer componentsthough not completely absentshasa much weaker amplitude in the time resolved fluorescenceexperiment as compared to the absorption measurement.4 Thedifferent signatures of the photodynamics of the trans form inthe two spectroscopic techniques were attributed to the differentradiative transitions predominantly detected by them:6 the
fluorescence experiment exclusively monitors the transition fromthe potential surface of the lowest excited state (nπ*) to that ofthe ground state S0. For azobenzene the energy gap of thistransition depends strongly on the nuclear coordinates andshould strongly decrease when moving along the reactioncoordinate out of the Franck-Condon range. Therefore, themotion of the photoisomerizing azobenzene has a large impacton the time resolved fluorescence spectra. Since the absorptioncross sections between the S0 and the nπ* surface are weak,the transient absorption signal is dominated by transition fromthe nπ* state to higher excited states. Strong excited-stateabsorption may happen all over the nπ* surface. Roughlyspeaking, the time dependence of the fluorescence emissionmonitors the motion of the excited molecule out of the Franck-Condon region, whereas the absorption signal reports this motionand the decay of the excited state. Apparently, intrans-azobenzene the motion out of the Franck-Condon range andthe internal conversion to the ground state occur on differenttime scales; in the cis form such a partitioning of time scalesdoes not exist.
In an attempt to investigate whether the biphasic behavior ofthe transf cis direction is rather general for azobenzenes or apeculiarity of the azobenzene parent molecule, we investigateda push-pull substituted azobenzene. Here results of a jointfemtosecond absorption and fluorescence study on 4-nitro-4′-(dimethylamino)azobenzene (NA, see structure in Scheme 1)are presented. Azobenzene substituted only by a dimethylaminogroup has already been studied by femtosecond absorptionspectroscopy7 and has been shown to undergo internal conver-
* Corresponding author. Fax:+49-89/2180-9202. E-mail: [email protected].
SCHEME 1
4399J. Phys. Chem. A2004,108,4399-4404
10.1021/jp0495747 CCC: $27.50 © 2004 American Chemical SocietyPublished on Web 04/24/2004

sion within ∼1 ps. The time resolution of this study did notsuffice to decide upon a biphasic behavior. The substitutionpattern chosen here is expected to alter the electronic characterand thereby the photodynamics more drastically than the abovemonosubstitution. The change of the electronic states becomesevident when comparing the absorption spectrum of NA withthat of azobenzene (see Figure 1). Azobenzene has one weakelectronic resonance in the visible at 440 nm which is attributedto an nπ* excitation and strongerππ* transition in the UVaround 310 nm (the spectroscopy of azobenzenes has beenreviewed in ref 8). In NA these transitions nearly coincide andoverlap with a charge transfer (CT) transition absent inazobenzene.9 Even in a solvent with a polarity as moderate asbenzene this CT transition dominates the visible spectrum.9 Thestrong CT character of the visible transition of NA was alsoinferred from its resonance Raman spectrum.10 A detailedanalysis of this spectrum yielded the initial structural distortionof NA upon photoexcitation which is in line with a transitionfrom a neutral to a zwitterionic form as shown in Scheme 1.The change of the electronic character also alters the ground-state kinetic properties. While the thermal isomerization ofazobenzene occurs within hours, nitroaminoazobenzenes reformtheir trans isomer on the time scale of minutes or evenmilliseconds depending on the solvent polarity.11
In this paper we will (i) demonstrate the importance of asimultaneous application of femtosecond absorption and fluo-rescence techniques for the separation of excited- and ground-state dynamics in photoactive systems, (ii) present the influenceof a strong push-pull substitution on the photoisomerizationdynamics of azobenzene, and (iii) show that the biphasic natureof the reaction dynamics oftrans-azobenzene is maintained alsoin push-pull substituted azobenzenes.
2. Experimental Section
The setup for femtosecond fluorescence experiments has beendescribed before in detail in ref 12. In brief: The experiment isbased on recording the fluorescence emission by a Kerr gatedriven by femtosecond NIR pulses. Excitation pulses weregenerated from the output (∼200 µJ) of a femtosecond laser/amplifier system (Clark CPA 2001 running at 775 nm with arepetition rate of 1 kHz) via a two-stage noncollinear opticalparametric amplifier (NOPA) tuned to 480 nm. CompressedNOPA pulses with an energy ofj1 µJ were focused onto thesample cell. The emission generated by this excitation wascollected with reflective optics and imaged onto the Kerrmedium (a fused silica plate) placed between two wire grid
polarizers. The Kerr gate is operated by a femtosecond NIRlaser pulse obtained from a two-stage optical parametricamplifier again pumped by a portion (250µJ) of the amplifieroutput. Employing the NIR pulses at 1100 nm instead of theamplifier output has the advantage of opening the spectral regionfrom 700 to 950 nm for fluorescence measurements andimproving the temporal resolution. After passing the Kerr gatethe fluorescence light is dispersed by af ) 300 nm spectrometer(Acton Research, Spectra Pro 300i) equipped with a 150 lines/mm grating blazed at 800 nm and detected with a liquid nitrogencooled CCD camera (Princeton Instruments, Spec-10:400B). Therecorded spectra were corrected for spectral sensitivity using ablackbody radiator as a reference. The duration of the instru-mental response function of the setup is 130-150 fs (fwhm).The spectral dependence of time zero induced by the groupvelocity dispersion of the optical components was derived byrecording the spectrotemporal behavior of a white light con-tinuum generated at the sample location. When correcting forthis dependence, the contribution of the solvent was added usingtabulated values of the linear dispersion of the solvent. For thedata presented here at every setting of the delay line the signalwas accumulated for 5 s or5000 laser shots; then signal tracesof 20 scans of the delay line were averaged. To record steady-state fluorescence spectra this same setup was used where thegate pulses were blocked and the analyzer of the Kerr shutterturned to a parallel alignment.
The absorption experiments were performed using a setupbased on a home-built Ti-sapphire laser chirped pulse amplifier(CPA) system operated at 800 nm.13 A single-stage NOPApumped by the Ti:Sa amplifier (1 kHz) provided excitationpulses at 490 nm. These pulses were compressed to a durationof 40 fs by a prism compressor and focused onto the samplecell (optical path length 1 mm). At the sample location theexcitation light had a diameter of 50µm and an energy of 0.5µJ. For the probing of the induced absorption changes, a whitelight continuum was generated by focusing a small portion ofthe amplifier output onto a 2 mmsapphire plate monitoring theabsorption changes. The white light was split into a probe anda reference beam which both crossed the excitation beam atthe sample location. The reference pulses arrived at the sampleprior to the excitation pulse; the arrival of the probe pulses wasadjusted by a delay stage. Probe and reference pulses weredetected by a multichannel setup allowing the simultaneousacquisition of the transient absorption in a spectral range from470 to 730 nm with a resolution of 6 nm. The time resolutionof the setup was determined by analyzing the coherent artifactof the neat solvents14 to be 100 fs. This artifact, which issomewhat smaller than the actual signal, was properly scaled(considering the absorption of the solute) and subtracted fromthe raw signal to to obtain the pure response of the solute. Forthe data presented here at every delay setting the signals of 100laser shots were accumulated and the results of three scans wereaveraged. For special absorption experiments with higher timeresolution the white light probe setup was replaced by a single-stage NOPA identical to the one used in the pump branch. ThatNOPA was tuned to 650 nm, and its output was compressed to28 fs (fwhm). For the NOPA/NOPA pump probe experiments100 laser shots were accumulated and five scans were averaged.The temporal resolution of this experiment was better than 40fs.
4-Nitro-4′-(dimethylamino)azobenzene was synthesized ac-cording to ref 15, purified by recrystallization, and characterizedby NMR. Concentrations of NA in the toluene solutions werechosen to reach an optical density (OD) in the 1 mm sample
Figure 1. Steady-state absorption and emission spectra oftrans-4-nitro-4′-(dimethylamino)azobenzene (NA) dissolved in toluene. Theabsorption spectrum oftrans-azobenzene (dotted line) is included forcomparison.
4400 J. Phys. Chem. A, Vol. 108, No. 20, 2004 Schmidt et al.

cell of ∼2 OD and ∼1 OD for the fluorescence and theabsorption experiments, respectively. Sample solutions werecirculated rapidly through the sample cell to ensure a replace-ment of the sample after each laser shot. Large volumes of thesample solutions of∼10-100 mL were chosen to avoidaccumulation of the cis photoproduct. (The cis isomer thermallyreforms the trans isomer in∼70 s; therefore, the photostationaryconcentration of the cis isomer is negligible here.)
3. Results
3.1. Steady-State Spectroscopy.When the visible absorptionband of NA in toluene peaking at 464 nm is excited with aNOPA pulse centered at 480 nm, a very weak fluorescenceemission is recorded (Figure 1). The emission spectrum featuresa rather sharp rise to a maximum at 590 nm and a long tailextending to the NIR. Illumination of NA in toluene leads to areduction of the absorption in the visible due to the cis formation(note that for azobenzene itself an increase of the visibleabsorption is observed). This reduction relaxes with a timeconstant of 70 s, the time constant of the cisf trans reaction(Figure 2).
3.2. Femtosecond Fluorescence Spectroscopy.An overviewof the fluorescence spectra recorded as a function of time isgiven in Figure 3a. As expected for a chromophore with a smallfluorescence quantum yield, the fluorescence of NA decays veryfast, within less than a few hundred femtoseconds (Figure 3).A closer inspection of this decay at two wavelengths (Figure3b) shows the emission dynamics depends on the detectionwavelength. At the blue edge of the emission spectrum (530nm) the time trace is nearly symmetric, indicating that thefluorescence decay time is on the order of or below theinstrumental response time which is equal to 150 fs (fwhm). Inthe red wing of the emission (800 nm) a significantly slowerdecay with a characteristic time of∼1 ps is observed. Thiswavelength dependence of the fluorescence lifetime is equivalentto a change of the emission spectra with time (Figure 3c).Immediately after photoexcitation the emission spectrum featuresthe sharp peak also present in the steady-state spectrum (brokencurve). However, the tail in the NIR is by far less pronounced.As the spectrum with the sharp peak decreases in amplitude, avery broad spectrum centered around 700 nm emerges whichthen decays in∼1 ps, thereby retaining its shape. This biphasicdecay of the fluorescence emission is the origin of the peculiarshape of the cw spectrum of NA (see Figure 3c). The peak stemsfrom a strongly emitting but very short lived species, and thetail is caused by the weak but longer lived emission centered at700 nm. Prior to a numerical analysis of these results, a note
concerning inner filter effects is in place. The fluorescence lightwhich is generated close to the front window of the samplecell has to pass that cell before it is detected. Thereby, it couldbe attenuated by either the static absorption of the sample (staticinner filter) or its transient absorption (dynamic inner filter).The shape of the fluorescence spectrum does not change upondilution; therefore, the static inner filter effect is not ofimportance here. As will be shown in the next section, thefluorescence emission overlaps spectrally with a transientabsorption band which might distort the fluorescence signal(dynamic inner filter). However, by normalizing the fluorescenceexperiments to the excitation conditions of the absorptionexperiments, it can be shown that this effect does not surmount10%. Therefore, considerations of dynamic inner filter effectswill be disregarded in the discussion of the fluorescence decay.
To extract dynamic parameters on the fluorescence decay,the data were fitted globally using a multiexponential trialfunction convoluted with a Gaussian. The Gaussian represents
Figure 2. Absorption spectra of NA in toluene recorded after steady-state illumination at time intervals of 10 s indicating the reformationof the trans isomer.
Figure 3. Time resolved fluorescence spectra of NA in toluene. (a)Overview. (b) Time traces at different wavelengths. (c) Time-dependentspectra at the delay times given in the figure. The steady-statefluorescence spectrum is plotted as a dashed line.
fs Fluorescence and Absorption Dynamics of NA J. Phys. Chem. A, Vol. 108, No. 20, 20044401
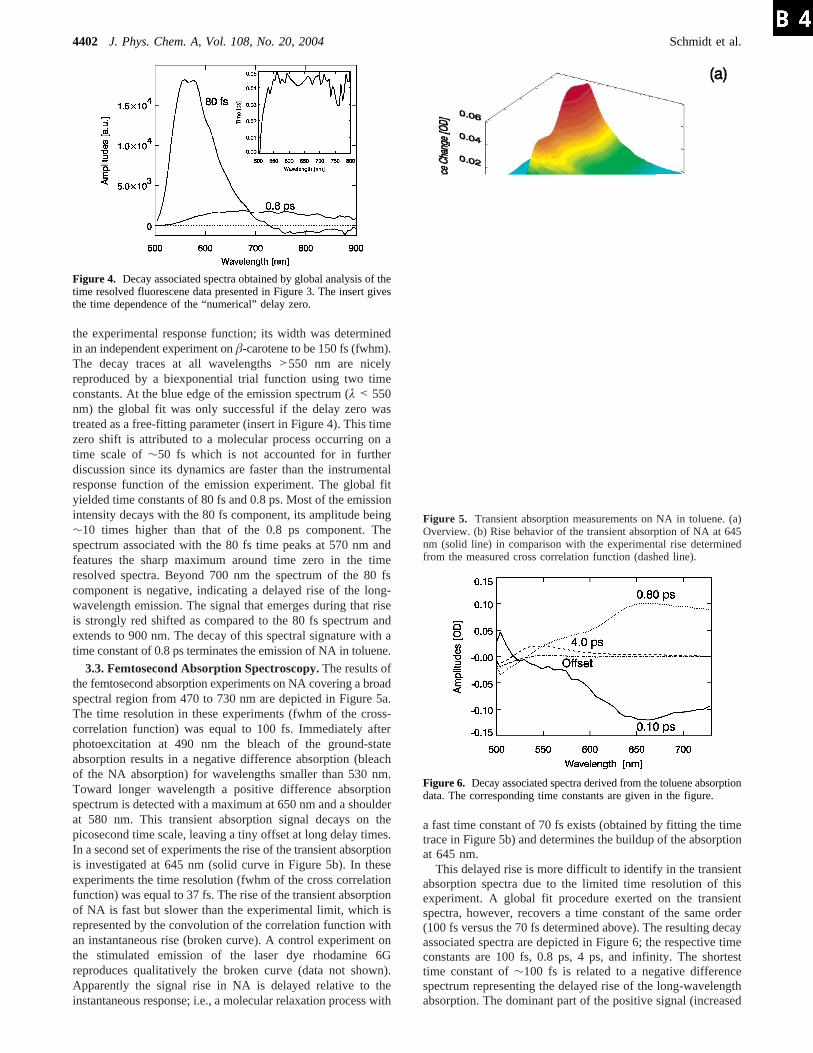
the experimental response function; its width was determinedin an independent experiment onâ-carotene to be 150 fs (fwhm).The decay traces at all wavelengths>550 nm are nicelyreproduced by a biexponential trial function using two timeconstants. At the blue edge of the emission spectrum (λ < 550nm) the global fit was only successful if the delay zero wastreated as a free-fitting parameter (insert in Figure 4). This timezero shift is attributed to a molecular process occurring on atime scale of∼50 fs which is not accounted for in furtherdiscussion since its dynamics are faster than the instrumentalresponse function of the emission experiment. The global fityielded time constants of 80 fs and 0.8 ps. Most of the emissionintensity decays with the 80 fs component, its amplitude being∼10 times higher than that of the 0.8 ps component. Thespectrum associated with the 80 fs time peaks at 570 nm andfeatures the sharp maximum around time zero in the timeresolved spectra. Beyond 700 nm the spectrum of the 80 fscomponent is negative, indicating a delayed rise of the long-wavelength emission. The signal that emerges during that riseis strongly red shifted as compared to the 80 fs spectrum andextends to 900 nm. The decay of this spectral signature with atime constant of 0.8 ps terminates the emission of NA in toluene.
3.3. Femtosecond Absorption Spectroscopy.The results ofthe femtosecond absorption experiments on NA covering a broadspectral region from 470 to 730 nm are depicted in Figure 5a.The time resolution in these experiments (fwhm of the cross-correlation function) was equal to 100 fs. Immediately afterphotoexcitation at 490 nm the bleach of the ground-stateabsorption results in a negative difference absorption (bleachof the NA absorption) for wavelengths smaller than 530 nm.Toward longer wavelength a positive difference absorptionspectrum is detected with a maximum at 650 nm and a shoulderat 580 nm. This transient absorption signal decays on thepicosecond time scale, leaving a tiny offset at long delay times.In a second set of experiments the rise of the transient absorptionis investigated at 645 nm (solid curve in Figure 5b). In theseexperiments the time resolution (fwhm of the cross correlationfunction) was equal to 37 fs. The rise of the transient absorptionof NA is fast but slower than the experimental limit, which isrepresented by the convolution of the correlation function withan instantaneous rise (broken curve). A control experiment onthe stimulated emission of the laser dye rhodamine 6Greproduces qualitatively the broken curve (data not shown).Apparently the signal rise in NA is delayed relative to theinstantaneous response; i.e., a molecular relaxation process with
a fast time constant of 70 fs exists (obtained by fitting the timetrace in Figure 5b) and determines the buildup of the absorptionat 645 nm.
This delayed rise is more difficult to identify in the transientabsorption spectra due to the limited time resolution of thisexperiment. A global fit procedure exerted on the transientspectra, however, recovers a time constant of the same order(100 fs versus the 70 fs determined above). The resulting decayassociated spectra are depicted in Figure 6; the respective timeconstants are 100 fs, 0.8 ps, 4 ps, and infinity. The shortesttime constant of∼100 fs is related to a negative differencespectrum representing the delayed rise of the long-wavelengthabsorption. The dominant part of the positive signal (increased
Figure 4. Decay associated spectra obtained by global analysis of thetime resolved fluorescene data presented in Figure 3. The insert givesthe time dependence of the “numerical” delay zero.
Figure 5. Transient absorption measurements on NA in toluene. (a)Overview. (b) Rise behavior of the transient absorption of NA at 645nm (solid line) in comparison with the experimental rise determinedfrom the measured cross correlation function (dashed line).
Figure 6. Decay associated spectra derived from the toluene absorptiondata. The corresponding time constants are given in the figure.
4402 J. Phys. Chem. A, Vol. 108, No. 20, 2004 Schmidt et al.

absorption) decays within∼0.8 ps. This decay is accompaniedby a partial recovery of the ground-state absorption spectrum.The remaining part of the signal decays in some picoseconds(4 ps) and changes sign around 520 nm. A very small offset(absorption changes at late times) follows the steady state cis-trans difference spectrum.
4. Discussion
The most prominent experimental observations are thefollowing: (i) Fluorescence emission has a strong contributiondecaying withτ ) 100 fs. (ii) This fluorescence emission isstrongly red shifted and shows a narrow peak at 575 nm. (iii)A weaker emission at still longer wavelengths (broad peak at700 nm) decays withτ ) 0.8 ps. (iv) The transient absorptionchanges display the same time constants. (v) The longer timeconstant is related to the decay of strong absorption changes.(vi) The short time constant is mainly connected with the riseof absorption changes.
We now want to present a molecular model which is able todescribe the experimental observations. The existence offluorescence emission decaying with the two time constants of100 fs and 0.8 ps indicates that these processes must beconnected to reactions in the excited electronic state or tointernal conversion to the ground state. A very striking featurewhich has to be explained first is the strong red shiftedfluorescence spectrum of NA observed immediately afterphotoexcitation (Figure 3) peaking at 575 nm. The peakwavelength corresponds to a Stokes shift∆νs of 4200 cm-1.This Stokes shift between absorption and fluorescence shouldbe related to the reorganization energyλ associated with theoptical transition. If the excited-state lifetime is longer than thevibrational and solvent relaxation times, the shift∆νs shouldbe equal to 2λ. A resonance Raman study on NA in benzene9
yielded a total reorganization energy of 2429 cm-1. This energywas partitioned into a high-frequency intramolecular contributionλv of 1004 cm-1 and a solvent portionλs of 1425 cm-1. Thesolvent reorganization energyλs was subdivided into a fastinertial partλi of 630 cm-1 and slow diffusive partλr of 795cm-1. The Stokes shift∆νs observed here corresponds to aneffective reorganization energy of 2100 cm-1, which indicatesthat the relaxation of the high-frequency contributionλv and ofa major part of the solvent contributionλs has occurred withinthe instrumental response time of the femtosecond experiment,i.e., within∼100 fs. A residual dynamic signature of the buildupof the Stokes shift is the time dependence of delay zero depictedin Figure 4, insert, which is equivalent to a red shift of the earlyemission spectrum with time. This red shift presumably stemsfrom the slower contributions to the solvent reorganizationenergy. An analysis of this dynamic Stokes shift is not possiblesince its initial parts are extremely fast and since the slowerparts are truncated by the decay of the emission after 100 fs.These observations are in line with the resonance Raman results.The distortions of NA upon photoexcitation derived from thisRaman study can be completely assigned to the transition fromthe neutral form of NA to the zwitterionic structure (see Scheme1); no signature of a distortion due to the transf cisisomerization was detected.
The onset of this isomerization may be connected to the∼100fs decay of the intense fluorescence signal centered around 575nm. This decay is most likely not associated with a transitionbetween different excited states. As shown by analysis of theabsorption spectrum of NA,9 the primarily excited state (theCT state) is lowest in energy; thus a transition between thisstate and for instance the nπ* state cannot occur. We, therefore,
assign this decay to a large amplitude motion on the excited-state surface along the isomerization coordinate. This motionbrings the excited molecule closer to a conical intersection withthe ground state. This 100 fs process is not associated with thedecay of the excited state: The disappearance of the intenseemission around 575 nm goes along with the rise of a weakand broad emission spectrum at 700 nm which demonstratesthat NA is still in its excited state after the 100 fs process. Apartial decay to the electronic ground state with 100 fs isexcluded by the absorption experiments. The time traces in thespectral region of the ground-state absorption lack the 100 fscontribution (see Figure 6); i.e., the ground state is not partiallyrecovered with 100 fs. The strong decrease of the emissionintensity within 100 fs is thus not a consequence of the depletionof the excited state but is due to the change (decrease) of theemission probability. The ground-state absorption only recoverswith a time constant of 0.8 ps as can be seen from the transientabsorption traces in Figure 5. The broad emission spectrumassociated with the 0.8 ps might be an indication that thelocalized vibrational wave packet generated by the photoexci-tation gets spread over the potential energy surface and doesnot immediately find the conical intersection to the ground state.
From the transient absorption data we learn that opticalexcitation initially populates a state, which shows very smallabsorption changes. It is only with the decay of this state (within80-100 fs) that the strong transient absorption of the excitedstate (see Figure 5) is built up. Apparently the molecularconfiguration of NA is changed with the 100 fs process in away to yield the broad increased absorption between 550 and750 nm. The molecule has moved along the reaction coordinateaway from the Franck-Condon region.
The strong excited-state absorption decays with the 0.8 pstime constant. Very little absorption change is left afterward.Thus the absorption of the ground-state NA molecules isessentially reformed. This observation together with the transientfluorescence emission signal clearly proves that the 0.8 psprocess is connected to the decay of the excited state and theformation of a ground-state molecule (in the cis or the initialtrans form). The subsequent 4 ps dynamic process has a spectralsignaturesabsorption decrease on the long-wavelength side ofthe NA absorption and an increase toward the absorption peaksindicative for vibrational cooling. This behavior is well expectedsince most of the excitation energy is still stored in the vibrationsof the NA molecule. The time scale for this cooling process istypical for molecules of that size16 and is comparable with valuesobtained for azobenzene (see below).2 The weak absorbancechange remaining at later delay times shows the signature forthe formation ofcis-NA and can be assigned to the isomerizedmolecules.
The absorption dynamics of NA are surprisingly similar tothose of the parent molecule azobenzene. Differences originatemainly from the changed character of the initially excitedstate: an nπ* character for azobenzene and a CT character forNA. Transient absorption measurements ontrans-azobenzenein ethanol yielded biphasic time traces for the excited-statedynamics with time constants of 0.32 and 2 ps.2 This compareswith the values of 0.1 and 0.8 ps reported here; i.e., a moderateacceleration is observed in NA. The femtosecond fluorescencesignatures are again very similar. Thetrans-azobenzene fluo-rescence decay (in hexane) can be described biexponentially.4
A fast 200 fs component carries most of the amplitude and ismost dominant in the blue part of the fluorescence spectrum.When moving to the red a longer lived contribution gains someamplitude. Thissapart from the numerical values of the time
fs Fluorescence and Absorption Dynamics of NA J. Phys. Chem. A, Vol. 108, No. 20, 20044403

constantssexactly mirrors the temporal behavior found in NA.Thus the interpretation put forward for the behavior of fluo-rescence of azobenzene also seems to apply to NA. Afterphotoexcitation a steep slope of the excited-state surface drivesthe vibrational wave packet out of the Franck-Condon vicinity.This movement occurring in∼100 fs in NA reduces thefluorescence emission probability drastically. After that rapidinitial motion the wave packet “meanders” on the excited-statesurface searching of the conical intersection to the ground state,resulting in a strongly red shifted and broad emission. Theinternal conversion to the ground state in∼0.8 ps partiallyreplenishes the trans ground state and forms the cis isomer. Thecooling of these nascent ground states seems to be somewhatfaster in NA than in azobenzene, for which values of 12 ps inDMSO6 and ∼10 ps in ethanol2 were reported. The fastercooling rate can be attributed to the polar character of NA whichmight increase the solute solvent coupling and the larger numberof degrees of freedom due to the dimethylamino group and thenitro group.
In conclusion, the combination of femtosecond fluorescenceand absorption techniques allowed obtaining a detailed pictureof the excited-state dynamics of 4-nitro-4′-(dimethylamino)-azobenzene. Three stages could be separated: (i) Inter- andintramolecular modes adapt extremely rapidly (<100 fs) to thenew charge distribution caused by the CT excitation. (ii) Within100 fs a large amplitude motion on the excited-state potentialaway from the Franck-Condon region takes place. (iii) A“search” of the conical intersection to the ground state taking∼1 ps terminates the excited-state dynamics. The last two stagesare very similar to what is observed in the parent compoundazobenzene, indicating that a push-pull substitution of azoben-zene has little impact on the photoisomerization dynamics. Basedon the spectroscopic results presented here, a distinction between
an inversion or rotation mechanism is not possible yet. However,the detailed time resolved fluorescence data should be muchmore accessible to a comparison with quantum chemicalcalculations than absorption data, since only the ground-statesurface andoneexcited-state surface have to be determined.
References and Notes
(1) Lednev, I.; Ye, T.; Hester, R.; Moore, J.J. Phys. Chem.1996, 100,13338.
(2) Nagele, T.; Hoche, R.; Zinth, W.; Wachtveitl,J. Chem. Phys. Lett.1997, 272, 489.
(3) Fujino, T.; Arzhantsev, S.; Tahara, T.J. Phys. Chem. A2001, 105,8123-8129.
(4) Lu, Y.-C.; Chang, C.; Diau, E. W.-G.J. Chin. Chem. Soc. Taip.2002, 49, 693.
(5) Diau, E. W.-G.J. Phys. Chem. A2004, 108, 950.(6) Satzger, H.; Spo¨rlein, S.; Root, C.; Wachtveitl, J.; Zinth, W.; Gilch,
P. Chem. Phys. Lett.2003, 372, 216.(7) Mayer, S. G.; Thomsen, C. L.; Philpott, M. P.; Reid, P. J.Chem.
Phys. Lett.1999, 314, 246.(8) Rau, H. Azo Compounds. InStudies in Organic Chemistry,
Photochroism, Molecules and Systems; Durr, H., Bouas-Laurent, H., Eds.;Elsevier-Verlag: Amsterdam, 1990; Vol. 40.
(9) Biswas, N.; Umapathy, S.J. Raman Spectrosc.2001, 32, 471.(10) Biswas, N.; Umapathy, S.J. Chem. Phys.2003, 118, 5526.(11) Gille, K.; Knoll, H.; Quitzsch, K.Int. J. Chem. Kinet.1999, 31,
337.(12) Schmidt, B.; Laimgruber, S.; Zinth, W.; Gilch, P.Appl. Phys. B
2003, 76, 809.(13) Baigar, E.; Gilch, P.; Zinth, W.; Sto¨ckl, M.; Harter, P.; von
Feilitzsch, T.; Michel-Beyerle, M.Chem. Phys. Lett.2002, 352, 176.(14) Kovalenko, S.; Dobryakov, A.; J., R.; Ernsting, N.Phys. ReV. A
1999, 59, 2369.(15) Ulman, A.; Willand, C.; Ko¨hler, W.; Robello, D. R.; Williams, D.
J.; Handley, L.J. Am. Chem. Soc.1990, 112, 7083.(16) Seilmeier, A.; Kaiser, W. Ultrashort Intramolecular and Intermo-
lecular Vibrational Energy Transfer of Polyatomic Molecules in Liquids.In Topics in Applied Physics; Kaiser, W., Ed.; Elsevier-Verlag: Amsterdam,1993; Vol. 60.
4404 J. Phys. Chem. A, Vol. 108, No. 20, 2004 Schmidt et al.

http://www.elsevier.com/locate/bba
Biochimica et Biophysica Ac
Excited-state dynamics of bacteriorhodopsin probed by broadband
femtosecond fluorescence spectroscopy
B. Schmidt, C. Sobotta, B. Heinz, S. Laimgruber, M. Braun, P. Gilch*
Department fur Physik, Ludwig-Maximilians-Universitat, Oettingenstr. 67, D-80538 Munchen, Germany
Received 18 August 2004; received in revised form 4 October 2004; accepted 20 October 2004
Available online 13 November 2004
Abstract
The impact of varying excitation densities (~0.3 to ~40 photons per molecule) on the ultrafast fluorescence dynamics of
bacteriorhodopsin has been studied in a wide spectral range (630–900 nm). For low excitation densities, the fluorescence dynamics can
be approximated biexponentially with time constants of b0.15 and ~0.45 ps. The spectrum associated with the fastest time constant peaks at
650 nm, while the 0.45 ps component is most prominent at 750 nm. Superimposed on these kinetics is a shift of the fluorescence maximum
with time (dynamic Stokes shift). Higher excitation densities alter the time constants and their amplitudes. These changes are assigned to
multi-photon absorptions.
D 2004 Elsevier B.V. All rights reserved.
Keywords: Excited state; Bacteriorhodopsin; Femtosecond fluorescence
1. Introduction
Photosynthetic activity in halobacteria is based on the
membrane protein bacteriorhodopsin (BR), which acts as a
light-driven proton pump [1]. BR consists of 248 amino
acids and contains only one chromophore, a retinal
molecule, which is linked via a protonated Schiff base to
the lysine 216 of the sequence of the protein. In the
functionally active light-adapted form of BR, the retinal
molecule adopts the all-trans configuration. Its function is
initiated by the all-transY13-cis photoisomerisation of the
retinal molecule after photoexcitation. This primary step in
the photocycle proceeds on the picosecond time scale and is
very efficient (quantum yield ~0.6 [2–5]).
The dynamics of this primary step have been the topic of
many time-resolved transient absorption measurements
[2,6–12]. Early studies [2,6,7] have revealed a sub-pico-
second decay of the first excited state S1 after optical
0005-2728/$ - see front matter D 2004 Elsevier B.V. All rights reserved.
doi:10.1016/j.bbabio.2004.10.008
* Corresponding author. Tel.: +49 89 2180 9243; fax: +49 89 2180
9202.
E-mail address: [email protected] (P. Gilch).
excitation. Later transient absorption experiments have
shown the ultrafast dynamics of BR in more detail.
Immediately after excitation, a broad transient hole appears
in the absorption spectrum whose amplitude remains
constant for about 0.2 ps [9]. For the initial excited state
dynamics, a biphasic behaviour with time constants of
b0.15 and ~0.45 ps is observed [8,11]. Studies with high
time resolution also find an oscillatory behaviour of the
transient absorption signal due to wavepacket motion on the
excited state and the ground state surface [12–14].
Subsequent to the decay of the S1 state within ~0.45 ps, a
red-shifted absorption band is observed, which can be
associated with the buildup of the J intermediate [8,10,11].
This absorption decays within 3–5 ps, indicating the
transition of the J intermediate to the K ground state [2,5].
Transient absorption experiments probe processes in the
ground state and the excited states. Ground state bleaching,
stimulated emission, excited-state absorption, wavepacket
motions and absorbance changes due to the formation of
photoproducts overlap in the spectra and have to be
deconvoluted to distinguish ground state dynamics from
excited-state dynamics. This makes it difficult to assign
processes to excited states unambiguously. Here, time-
ta 1706 (2005) 165–173

B. Schmidt et al. / Biochimica et Biophysica Acta 1706 (2005) 165–173166
resolved fluorescence spectroscopy is superior since only
electronically excited states show fluorescence emission.
So far, only a few time-resolved fluorescence measure-
ments of the primary step of the photocycle of BR in the
femtosecond regime have been reported [15,16]. Du and
Fleming [15], using the up-conversion method, excited their
sample at 608 nm with 3 nJ pulse energy at a repetition rate
of 100 kHz. The pump-gate cross-correlation function of
these experiments had a FWHM of 0.06–0.07 ps. They
reported time constants of 0.09–0.24, 0.6–0.9 and 9.0–13.0
ps. The amplitude of the third time constant has been
specified with up to 25%. Haacke et al. [16], also using the
up-conversion method, excited their sample at 585 nm with
a repetition rate of 80 MHz. A time resolution of 0.25 ps
was achieved in these experiments. The data have been
treated biexponentially with a short time constant in the sub-
picosecond range and a longer time constant of 10 ps. The
short time constant varies with the detection wavelength and
values increasing from 0.15 to 0.4 ps when moving towards
longer wavelengths have been determined. The second time
constant of 10 ps carrying only a small amplitude of 4% was
found to be wavelength independent. Both experiments
draw a similar picture of the fluorescence dynamics of BR;
nevertheless, distinct deviations concerning especially the
sub-picosecond behaviour and the amplitude of the long
time constant are present. These deviations may be due to
different excitation conditions and could be clarified by
examining the fluorescence dynamics of BR as a function of
excitation density.
In this paper, we present results of time-resolved
fluorescence measurements with a Kerr gate set-up. The
BR sample has been excited from the ground state to the
first excited state with different excitation densities ranging
from ~0.3 to ~40 photons per molecule. These experiments
give new insight in the fluorescence dynamics of BR.
2. Experimental
The femtosecond fluorescence experiments used a set-up
based on a Kerr gate described in detail in Ref. [17]. Here
only the most important features are described. Briefly, a
part of the output (~200 AJ) of a femtosecond laser/amplifier
system (Clark CPA 2001 operated at 775 nm with a
repetition rate of 1 kHz) pumped a two-stage noncollinear
optical parametric amplifier (NOPA) tuned to 565 nm.
Compressed NOPA pulses of ~0.05 ps were used as
excitation source and were focused onto the sample cell.
The excitation pulses were polarised under an angle of 458with respect to the polarisation plane of the detection. The
emission generated by this excitation was collected with
reflective optics and imaged onto the Kerr medium (a fused
silica plate) placed between two wire grid polarisers.
The excitation density as used in the following is defined
as the product of the absorption cross section of BR and the
photon density (number of photons per area). It thus
represents the number of photons a BR molecule actually
dsees,T when excited with a laser pulse with a certain energy
(regardless of the duration of the laser pulse and the
concentration of BR molecules). The extinction coefficient
of BR of ~6�104 l mol�1 cm�1 [2,8] translates into an
absorption cross section of ~2.3�10�16 cm2. The photon
density is calculated by dividing the number of photons per
pulse by the focal area of the excitation spot. The excitation
spot diameter was varied between 80 and 160 Am by
adjusting an aperture in the beam path and measured by a
homebuilt beam profile analyser at the sample location. The
energy of the excitation pulses was varied between ~100
and ~3600 nJ per pulse. The excitation densities determined
from these parameters range from ~0.3 (pulse energy ~100
nJ at an excitation spot size of 160 Am) to ~40 (pulse energy
~3600 nJ at an excitation spot size of 80 Am) photons per
molecule.
An excitation density of 0.3 photons per molecule was
shown to be a good compromise between signal to noise
ratio and retaining a linear excitation regime. This was
verified by performing experiments with an excitation
density as low as 0.07 photons per molecule. No systematic
deviation between the 0.07 and the 0.3 run could be
detected. Trivially, the 0.3 run features a better signal-to-
noise ratio and it was thus used to extract the numerical
parameters for the linear regime.
Obviously, not only the excitation density but also the
light intensity has to be considered when discussing the
presence or absence of nonlinear signal contribution. The
light intensity of the 0.3 run was equal to ~1010 W cm�2,
which is of the same size or even lower than the intensities
commonly employed in transient absorption experiments on
BR [8,10,11,18–20].
The Kerr gate is operated by 0.045 ps NIR laser pulses at
1100 nm generated by a two-stage optical parametric
amplifier again pumped by a portion (250 AJ) of the CPA
output. The use of NIR pulses at 1100 nm from the OPA
instead of fundamental CPA pulses at ~800 nm has the
advantage that it opens the spectral region from 700 to 950
nm for fluorescence measurements and improves the
temporal resolution. After passing the Kerr gate, the
fluorescence light is dispersed by a f=300 mm spectrograph
(Acton Research, Spectra Pro 300i) equipped with a 150
lines/mm grating blazed at 800 nm and detected with a
liquid nitrogen cooled CCD camera (Princeton Instruments,
Spec-10:400B).
The spectra reported here are corrected for the spectral
sensitivity of the set-up and for the k2-dependence of the
gate efficiency (for details, see Ref. [17]). A dielectric
mirror placed in front of the spectrometer to reject the light
of the gate pulses introduces modulations of the spectra.
Though this measurement artefact has been corrected to the
best of our knowledge; slight modulations remain never-
theless. These modulations are the origin of the step-like
shape of the data in Fig. 2. The duration of the instrumental
response function of the set-up is ~0.15 ps (FWHM). Its

Fig. 1. Time-resolved fluorescence spectra of bacteriorhodopsin excited at
low excitation density (~0.3 photons per molecule). (a) Overview. (b)
Contour plot of the behaviour around time zero. The line represents the
peak of the fluorescence at a given wavelength.
B. Schmidt et al. / Biochimica et Biophysica Acta 1706 (2005) 165–173 167
width was determined in an independent experiment using
spontaneous Raman scattering of water as a reference.
The spectral dependence of time zero induced by the
group velocity dispersion of the optical components was
derived by the following procedure. The BR sample was
replaced by pure water and a white light continuum was
generated at an increased pump pulse energy in the water-
filled sample cell. The continuum is generated via a
nonlinear off-resonant process, which is assumed to be
instantaneous on the time scale of our experiment. There-
fore, in the sample cell, all spectral components of the
continuum are generated at the same instant. Due to
dispersion the spectral components then collect wavelength
dependent delays on their way to the Kerr medium. These
delays were determined by measuring the peak position of
the continuum pulse along the time axis at a given
wavelength. The resulting time zero dependence is in good
agreement with predictions based on the dispersion data of
the materials involved. The recorded fluorescence data were
corrected using these peak positions. The uncertainty of this
time zero correction is estimated to be about F0.02 ps and
stems mainly from the uncertainty of the exact position of
the white light generation in the 1.0-mm-thick sample cell.
For the data presented here at every setting of the delay
line the signal was accumulated for 3–6 s or 3000–6000
laser shots, then signal traces of 12–24 scans of the delay
line were averaged.
Isolation of bacteriorhodopsin from cells was carried out
according to the standard procedure [21]. After lysis of the
cells in the presence of DNAse I (Sigma, Steinheim,
Germany), the resultant membrane fragments were washed
with water and then purified by centrifugation on a sucrose
gradient (25–45% w/w). Membrane fractions of buoyant
density 1.18 g/ml were collected, washed repeatedly with
water and then resuspended in the appropriate buffer
solution (pH=7.5) for spectroscopic measurements. The
samples were circulated through fused silica flow cells with
an optical path length of 1.0 mm.
The absorbance of the sample was 2.0 OD at 568 nm. In
the experiments on the intensity effects, this high optical
density in combination with the cell length of 1.0 mm can
lead to intensity-dependent penetration depths. These in turn
might deteriorate the temporal resolution in the high-intensity
experiments due to group velocity differences between
excitation and fluorescence light. Calculations based on
water dispersion data predict maximal apparent shifts in the
temporal behaviour of the fluorescence of 0.04 ps. In this
prediction, it was assumed that fluorescence light stemming
from the whole length of the sample cell contributes to the
signal. Yet, the optics used to collect the fluorescence light
have a depth of field of 0.5 mm at best. Therefore, these shifts
are not expected to be higher than 0.02 ps, being smaller than
all other temporal effects discussed here.
Attention was paid to adjust the circulation speed, such
that the sample was replaced after each laser shot. BR was
light-adapted by continuous illumination with the light of a
cold light source (KL 2500 LCD, Schott), which passed OG
550 and KG 5 filters, which suppress the UV and NIR part
of the spectrum, respectively.
3. Results
3.1. Low excitation density
In order to investigate BR under conditions similar to
native, we performed experiments where the excitation
density was kept at 0.3 photons per BR molecule. Under
these conditions, nonlinear signal contributions are highly
unlikely (see bExperimentalQ and the next section). BR
excited with femtosecond pulses at 565 nm emits a broad
and very short lived fluorescence (Fig. 1a). In the spectral
range (630 nm–900 nm) covered by the Kerr gate set-up,
this emission decays on the sub-picosecond to picosecond
time scale. A qualitative analysis shows a predominant fast-
decay component in the blue part of the spectra and a
somewhat slower (~0.5 ps) decay component in the red part
of the spectra. Additionally, there is also a picosecond decay

Fig. 3. Normalised time traces of BR. Experimental data points are plotted
for 650 nm (crosses) and 800 nm (triangles). Simulated time traces at 650 nm
(solid line) and 800 nm (dashed line) are plotted with a common time zero.
The simulated shift of the maxima accounts only for one third of the
experimentally observed shift.
B. Schmidt et al. / Biochimica et Biophysica Acta 1706 (2005) 165–173168
component with a rather small amplitude that can be seen as
a small offset at later delay times.
In addition to these decay patterns, a spectral shift on the
time scale of a few 0.1 ps is observed. To illustrate this shift,
we first adopt the usual representation and plot the
fluorescence maxima at a given delay time versus that time
(Fig. 2). From this representation, it seems to be clearly
evident that the fluorescence emission red shifts with time.
Immediately after photoexcitation, the maximum of the
fluorescence is located at 650 nm. It then approaches the
steady state maximum of 750 nm in about 0.2 ps and
remains nearly constant thereafter. Assigning these features
to a dynamic Stokes shift seems to be close at hands.
However, the wavelength-dependent decay kinetics men-
tioned above could also mimic such a shift. An analysis of
this contribution is easier when using a different representa-
tion of the shift dynamics. In Fig. 1b, we mark the peak of
the fluorescence intensity along the time axis for a given
wavelength. Trivially, in that representation, a shift is also
present. The peak moves to longer delay times for increasing
wavelengths. This dependence could stem from the afore-
mentioned increasing decay times towards longer wave-
lengths. For a finite instrumental response time, an increased
decay time moves the peak of the fluorescence intensity to
later delay times. Simulations demonstrate that this effect is
indeed present but not sufficient to explain the experimen-
tally observed shift (see Fig. 3). Depicted is the emission as a
function of time (time traces in the following) recorded at
the blue (650 nm, crosses) and the red side (800 nm,
triangles) of the fluorescence spectrum. The peaks of these
time traces are ~0.08 ps apart. We tried to reproduce this
effect by fitting the data using a common time zero for the
650 and 800 nm time trace (Fig. 3, solid and dashed line). A
prolonged decay time at 800 nm indeed shifts the peak
towards longer delay times. However, this accounts for only
less than one third of the experimentally observed shift.
Thus, we are indeed dealing with a dynamic Stokes shift.
Fig. 2. Dynamic Stokes shift of the fluorescence spectra of bacteriorhodop-
sin (excitation with low excitation density, ~0.3 photons per molecule). The
step-like shape of the data results from the measurement artefact mentioned
in bExperimentalQ. The dashed line is inserted as a guide to the eye.
Dynamic parameters on the fluorescence decay were
extracted by a global fitting routine using a multiexponential
trial function convoluted with a Gaussian. The Gaussian
represents the experimental response function. In this fitting
routine, the time zero was treated as a free parameter for all
wavelengths to mimic the effects of the dynamic Stokes shift.
The decay traces at all wavelengths N630 nm are nicely
reproduced by a trial function using three time constants.
The global fit yielded time constants of s1~0.05 to 0.15 ps,
s2~0.45 ps and s3~3 to 10 ps. The amplitude related to the
fast time constant has its maximum around 650 nm and
decays towards the red part of the spectra. The presence of a
dynamic Stokes shift indicates that an exponential model
cannot handle the data properly in the first few 0.1 ps. Thus,
the value for the shortest time constant given above is an
approximation—not only numerically but also conceptually.
As the second (~0.45 ps) and third (~3 to 10 ps) time
constants are longer than the dynamic Stokes shift, a rate
model is better justified for the determination of their value.
The amplitude maximum of the second time constant peaks
around 750 nm, the maximum of the steady state
fluorescence (decay associated spectra not shown here).
The third time constant has a very broad spectrum with its
amplitude maximum shifted even further to longer wave-
lengths. Since the amplitude is relatively low (b5% of the
initial fluorescence emission), only a wide range of 3–10 ps
can be given for this time constant.
3.2. High excitation density
In a series of time-resolved fluorescence measurements,
the excitation density was raised in several steps from 0.3 to
40 photons per molecule. All experiments with excitation
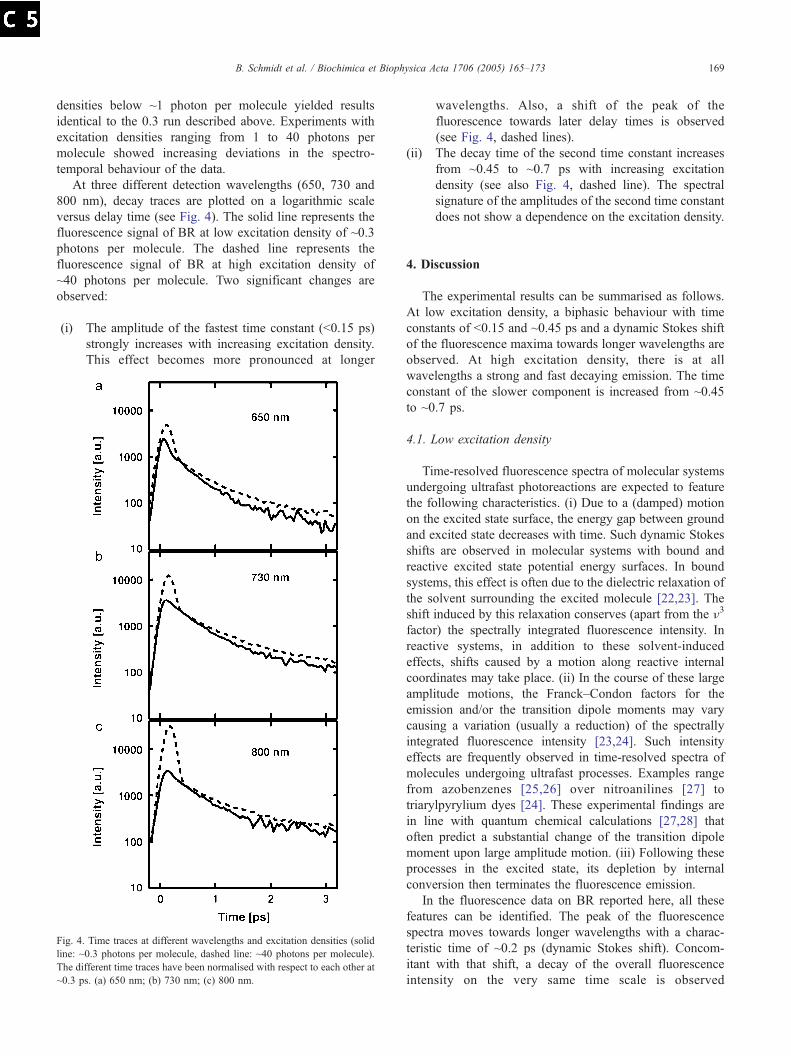
B. Schmidt et al. / Biochimica et Biophysica Acta 1706 (2005) 165–173 169
densities below ~1 photon per molecule yielded results
identical to the 0.3 run described above. Experiments with
excitation densities ranging from 1 to 40 photons per
molecule showed increasing deviations in the spectro-
temporal behaviour of the data.
At three different detection wavelengths (650, 730 and
800 nm), decay traces are plotted on a logarithmic scale
versus delay time (see Fig. 4). The solid line represents the
fluorescence signal of BR at low excitation density of ~0.3
photons per molecule. The dashed line represents the
fluorescence signal of BR at high excitation density of
~40 photons per molecule. Two significant changes are
observed:
(i) The amplitude of the fastest time constant (b0.15 ps)
strongly increases with increasing excitation density.
This effect becomes more pronounced at longer
Fig. 4. Time traces at different wavelengths and excitation densities (solid
line: ~0.3 photons per molecule, dashed line: ~40 photons per molecule).
The different time traces have been normalised with respect to each other at
~0.3 ps. (a) 650 nm; (b) 730 nm; (c) 800 nm.
wavelengths. Also, a shift of the peak of the
fluorescence towards later delay times is observed
(see Fig. 4, dashed lines).
(ii) The decay time of the second time constant increases
from ~0.45 to ~0.7 ps with increasing excitation
density (see also Fig. 4, dashed line). The spectral
signature of the amplitudes of the second time constant
does not show a dependence on the excitation density.
4. Discussion
The experimental results can be summarised as follows.
At low excitation density, a biphasic behaviour with time
constants of b0.15 and ~0.45 ps and a dynamic Stokes shift
of the fluorescence maxima towards longer wavelengths are
observed. At high excitation density, there is at all
wavelengths a strong and fast decaying emission. The time
constant of the slower component is increased from ~0.45
to ~0.7 ps.
4.1. Low excitation density
Time-resolved fluorescence spectra of molecular systems
undergoing ultrafast photoreactions are expected to feature
the following characteristics. (i) Due to a (damped) motion
on the excited state surface, the energy gap between ground
and excited state decreases with time. Such dynamic Stokes
shifts are observed in molecular systems with bound and
reactive excited state potential energy surfaces. In bound
systems, this effect is often due to the dielectric relaxation of
the solvent surrounding the excited molecule [22,23]. The
shift induced by this relaxation conserves (apart from the r3
factor) the spectrally integrated fluorescence intensity. In
reactive systems, in addition to these solvent-induced
effects, shifts caused by a motion along reactive internal
coordinates may take place. (ii) In the course of these large
amplitude motions, the Franck–Condon factors for the
emission and/or the transition dipole moments may vary
causing a variation (usually a reduction) of the spectrally
integrated fluorescence intensity [23,24]. Such intensity
effects are frequently observed in time-resolved spectra of
molecules undergoing ultrafast processes. Examples range
from azobenzenes [25,26] over nitroanilines [27] to
triarylpyrylium dyes [24]. These experimental findings are
in line with quantum chemical calculations [27,28] that
often predict a substantial change of the transition dipole
moment upon large amplitude motion. (iii) Following these
processes in the excited state, its depletion by internal
conversion then terminates the fluorescence emission.
In the fluorescence data on BR reported here, all these
features can be identified. The peak of the fluorescence
spectra moves towards longer wavelengths with a charac-
teristic time of ~0.2 ps (dynamic Stokes shift). Concom-
itant with that shift, a decay of the overall fluorescence
intensity on the very same time scale is observed
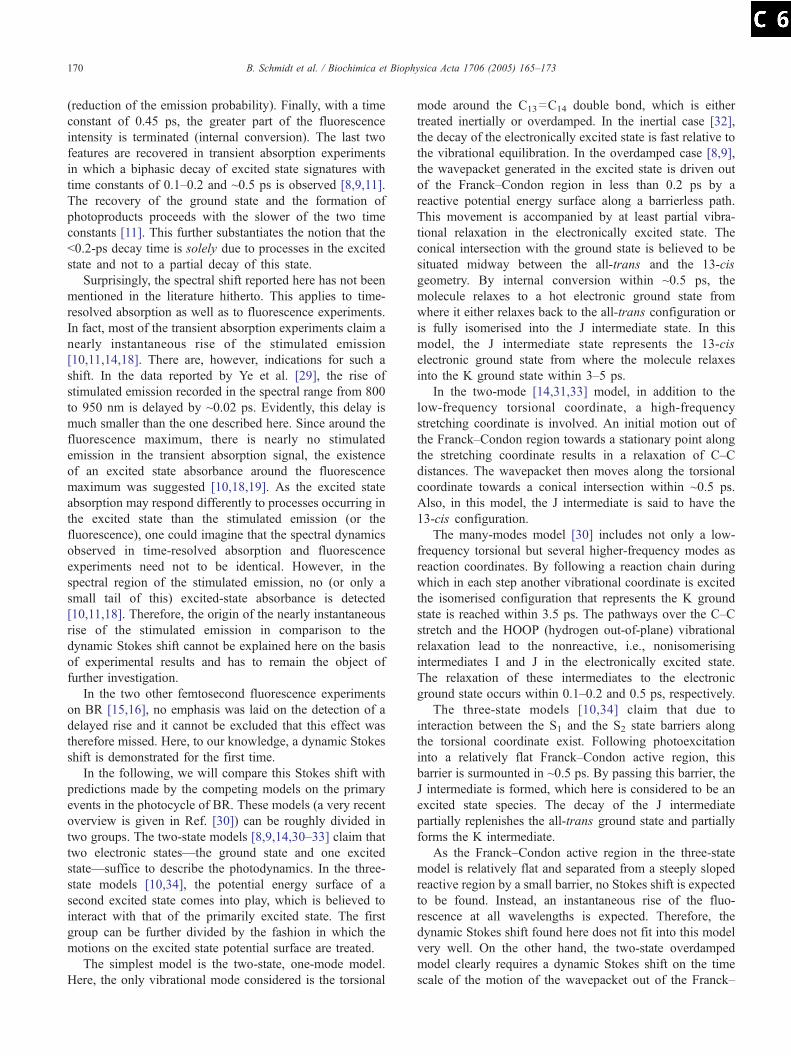
B. Schmidt et al. / Biochimica et Biophysica Acta 1706 (2005) 165–173170
(reduction of the emission probability). Finally, with a time
constant of 0.45 ps, the greater part of the fluorescence
intensity is terminated (internal conversion). The last two
features are recovered in transient absorption experiments
in which a biphasic decay of excited state signatures with
time constants of 0.1–0.2 and ~0.5 ps is observed [8,9,11].
The recovery of the ground state and the formation of
photoproducts proceeds with the slower of the two time
constants [11]. This further substantiates the notion that the
b0.2-ps decay time is solely due to processes in the excited
state and not to a partial decay of this state.
Surprisingly, the spectral shift reported here has not been
mentioned in the literature hitherto. This applies to time-
resolved absorption as well as to fluorescence experiments.
In fact, most of the transient absorption experiments claim a
nearly instantaneous rise of the stimulated emission
[10,11,14,18]. There are, however, indications for such a
shift. In the data reported by Ye et al. [29], the rise of
stimulated emission recorded in the spectral range from 800
to 950 nm is delayed by ~0.02 ps. Evidently, this delay is
much smaller than the one described here. Since around the
fluorescence maximum, there is nearly no stimulated
emission in the transient absorption signal, the existence
of an excited state absorbance around the fluorescence
maximum was suggested [10,18,19]. As the excited state
absorption may respond differently to processes occurring in
the excited state than the stimulated emission (or the
fluorescence), one could imagine that the spectral dynamics
observed in time-resolved absorption and fluorescence
experiments need not to be identical. However, in the
spectral region of the stimulated emission, no (or only a
small tail of this) excited-state absorbance is detected
[10,11,18]. Therefore, the origin of the nearly instantaneous
rise of the stimulated emission in comparison to the
dynamic Stokes shift cannot be explained here on the basis
of experimental results and has to remain the object of
further investigation.
In the two other femtosecond fluorescence experiments
on BR [15,16], no emphasis was laid on the detection of a
delayed rise and it cannot be excluded that this effect was
therefore missed. Here, to our knowledge, a dynamic Stokes
shift is demonstrated for the first time.
In the following, we will compare this Stokes shift with
predictions made by the competing models on the primary
events in the photocycle of BR. These models (a very recent
overview is given in Ref. [30]) can be roughly divided in
two groups. The two-state models [8,9,14,30–33] claim that
two electronic states—the ground state and one excited
state—suffice to describe the photodynamics. In the three-
state models [10,34], the potential energy surface of a
second excited state comes into play, which is believed to
interact with that of the primarily excited state. The first
group can be further divided by the fashion in which the
motions on the excited state potential surface are treated.
The simplest model is the two-state, one-mode model.
Here, the only vibrational mode considered is the torsional
mode around the C13MC14 double bond, which is either
treated inertially or overdamped. In the inertial case [32],
the decay of the electronically excited state is fast relative to
the vibrational equilibration. In the overdamped case [8,9],
the wavepacket generated in the excited state is driven out
of the Franck–Condon region in less than 0.2 ps by a
reactive potential energy surface along a barrierless path.
This movement is accompanied by at least partial vibra-
tional relaxation in the electronically excited state. The
conical intersection with the ground state is believed to be
situated midway between the all-trans and the 13-cis
geometry. By internal conversion within ~0.5 ps, the
molecule relaxes to a hot electronic ground state from
where it either relaxes back to the all-trans configuration or
is fully isomerised into the J intermediate state. In this
model, the J intermediate state represents the 13-cis
electronic ground state from where the molecule relaxes
into the K ground state within 3–5 ps.
In the two-mode [14,31,33] model, in addition to the
low-frequency torsional coordinate, a high-frequency
stretching coordinate is involved. An initial motion out of
the Franck–Condon region towards a stationary point along
the stretching coordinate results in a relaxation of C–C
distances. The wavepacket then moves along the torsional
coordinate towards a conical intersection within ~0.5 ps.
Also, in this model, the J intermediate is said to have the
13-cis configuration.
The many-modes model [30] includes not only a low-
frequency torsional but several higher-frequency modes as
reaction coordinates. By following a reaction chain during
which in each step another vibrational coordinate is excited
the isomerised configuration that represents the K ground
state is reached within 3.5 ps. The pathways over the C–C
stretch and the HOOP (hydrogen out-of-plane) vibrational
relaxation lead to the nonreactive, i.e., nonisomerising
intermediates I and J in the electronically excited state.
The relaxation of these intermediates to the electronic
ground state occurs within 0.1–0.2 and 0.5 ps, respectively.
The three-state models [10,34] claim that due to
interaction between the S1 and the S2 state barriers along
the torsional coordinate exist. Following photoexcitation
into a relatively flat Franck–Condon active region, this
barrier is surmounted in ~0.5 ps. By passing this barrier, the
J intermediate is formed, which here is considered to be an
excited state species. The decay of the J intermediate
partially replenishes the all-trans ground state and partially
forms the K intermediate.
As the Franck–Condon active region in the three-state
model is relatively flat and separated from a steeply sloped
reactive region by a small barrier, no Stokes shift is expected
to be found. Instead, an instantaneous rise of the fluo-
rescence at all wavelengths is expected. Therefore, the
dynamic Stokes shift found here does not fit into this model
very well. On the other hand, the two-state overdamped
model clearly requires a dynamic Stokes shift on the time
scale of the motion of the wavepacket out of the Franck–
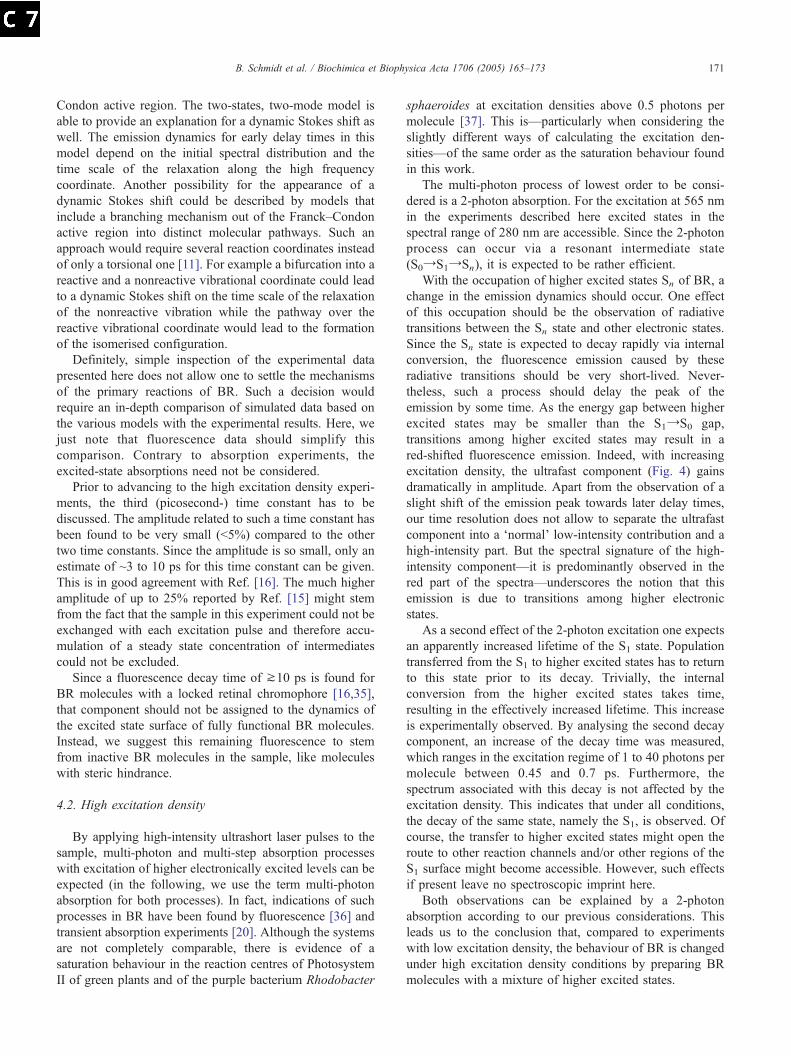
B. Schmidt et al. / Biochimica et Biophysica Acta 1706 (2005) 165–173 171
Condon active region. The two-states, two-mode model is
able to provide an explanation for a dynamic Stokes shift as
well. The emission dynamics for early delay times in this
model depend on the initial spectral distribution and the
time scale of the relaxation along the high frequency
coordinate. Another possibility for the appearance of a
dynamic Stokes shift could be described by models that
include a branching mechanism out of the Franck–Condon
active region into distinct molecular pathways. Such an
approach would require several reaction coordinates instead
of only a torsional one [11]. For example a bifurcation into a
reactive and a nonreactive vibrational coordinate could lead
to a dynamic Stokes shift on the time scale of the relaxation
of the nonreactive vibration while the pathway over the
reactive vibrational coordinate would lead to the formation
of the isomerised configuration.
Definitely, simple inspection of the experimental data
presented here does not allow one to settle the mechanisms
of the primary reactions of BR. Such a decision would
require an in-depth comparison of simulated data based on
the various models with the experimental results. Here, we
just note that fluorescence data should simplify this
comparison. Contrary to absorption experiments, the
excited-state absorptions need not be considered.
Prior to advancing to the high excitation density experi-
ments, the third (picosecond-) time constant has to be
discussed. The amplitude related to such a time constant has
been found to be very small (b5%) compared to the other
two time constants. Since the amplitude is so small, only an
estimate of ~3 to 10 ps for this time constant can be given.
This is in good agreement with Ref. [16]. The much higher
amplitude of up to 25% reported by Ref. [15] might stem
from the fact that the sample in this experiment could not be
exchanged with each excitation pulse and therefore accu-
mulation of a steady state concentration of intermediates
could not be excluded.
Since a fluorescence decay time of k10 ps is found for
BR molecules with a locked retinal chromophore [16,35],
that component should not be assigned to the dynamics of
the excited state surface of fully functional BR molecules.
Instead, we suggest this remaining fluorescence to stem
from inactive BR molecules in the sample, like molecules
with steric hindrance.
4.2. High excitation density
By applying high-intensity ultrashort laser pulses to the
sample, multi-photon and multi-step absorption processes
with excitation of higher electronically excited levels can be
expected (in the following, we use the term multi-photon
absorption for both processes). In fact, indications of such
processes in BR have been found by fluorescence [36] and
transient absorption experiments [20]. Although the systems
are not completely comparable, there is evidence of a
saturation behaviour in the reaction centres of Photosystem
II of green plants and of the purple bacterium Rhodobacter
sphaeroides at excitation densities above 0.5 photons per
molecule [37]. This is—particularly when considering the
slightly different ways of calculating the excitation den-
sities—of the same order as the saturation behaviour found
in this work.
The multi-photon process of lowest order to be consi-
dered is a 2-photon absorption. For the excitation at 565 nm
in the experiments described here excited states in the
spectral range of 280 nm are accessible. Since the 2-photon
process can occur via a resonant intermediate state
(S0YS1YSn), it is expected to be rather efficient.
With the occupation of higher excited states Sn of BR, a
change in the emission dynamics should occur. One effect
of this occupation should be the observation of radiative
transitions between the Sn state and other electronic states.
Since the Sn state is expected to decay rapidly via internal
conversion, the fluorescence emission caused by these
radiative transitions should be very short-lived. Never-
theless, such a process should delay the peak of the
emission by some time. As the energy gap between higher
excited states may be smaller than the S1YS0 gap,
transitions among higher excited states may result in a
red-shifted fluorescence emission. Indeed, with increasing
excitation density, the ultrafast component (Fig. 4) gains
dramatically in amplitude. Apart from the observation of a
slight shift of the emission peak towards later delay times,
our time resolution does not allow to separate the ultrafast
component into a dnormalT low-intensity contribution and a
high-intensity part. But the spectral signature of the high-
intensity component—it is predominantly observed in the
red part of the spectra—underscores the notion that this
emission is due to transitions among higher electronic
states.
As a second effect of the 2-photon excitation one expects
an apparently increased lifetime of the S1 state. Population
transferred from the S1 to higher excited states has to return
to this state prior to its decay. Trivially, the internal
conversion from the higher excited states takes time,
resulting in the effectively increased lifetime. This increase
is experimentally observed. By analysing the second decay
component, an increase of the decay time was measured,
which ranges in the excitation regime of 1 to 40 photons per
molecule between 0.45 and 0.7 ps. Furthermore, the
spectrum associated with this decay is not affected by the
excitation density. This indicates that under all conditions,
the decay of the same state, namely the S1, is observed. Of
course, the transfer to higher excited states might open the
route to other reaction channels and/or other regions of the
S1 surface might become accessible. However, such effects
if present leave no spectroscopic imprint here.
Both observations can be explained by a 2-photon
absorption according to our previous considerations. This
leads us to the conclusion that, compared to experiments
with low excitation density, the behaviour of BR is changed
under high excitation density conditions by preparing BR
molecules with a mixture of higher excited states.
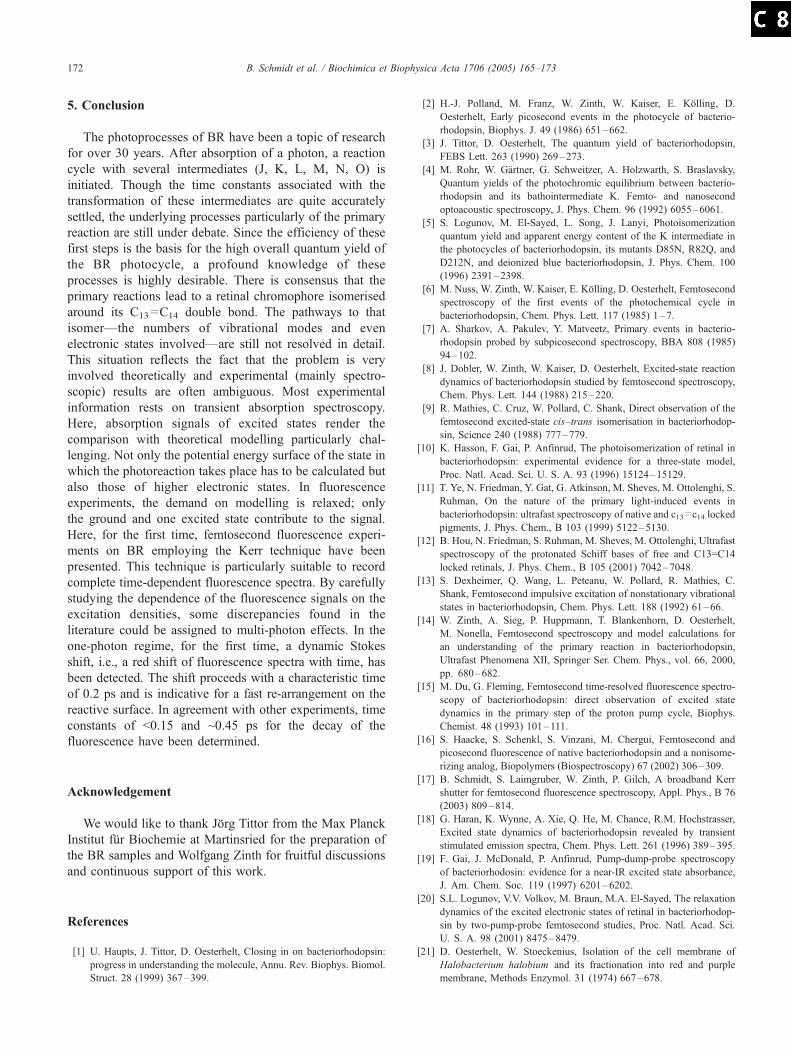
B. Schmidt et al. / Biochimica et Biophysica Acta 1706 (2005) 165–173172
5. Conclusion
The photoprocesses of BR have been a topic of research
for over 30 years. After absorption of a photon, a reaction
cycle with several intermediates (J, K, L, M, N, O) is
initiated. Though the time constants associated with the
transformation of these intermediates are quite accurately
settled, the underlying processes particularly of the primary
reaction are still under debate. Since the efficiency of these
first steps is the basis for the high overall quantum yield of
the BR photocycle, a profound knowledge of these
processes is highly desirable. There is consensus that the
primary reactions lead to a retinal chromophore isomerised
around its C13MC14 double bond. The pathways to that
isomer—the numbers of vibrational modes and even
electronic states involved—are still not resolved in detail.
This situation reflects the fact that the problem is very
involved theoretically and experimental (mainly spectro-
scopic) results are often ambiguous. Most experimental
information rests on transient absorption spectroscopy.
Here, absorption signals of excited states render the
comparison with theoretical modelling particularly chal-
lenging. Not only the potential energy surface of the state in
which the photoreaction takes place has to be calculated but
also those of higher electronic states. In fluorescence
experiments, the demand on modelling is relaxed; only
the ground and one excited state contribute to the signal.
Here, for the first time, femtosecond fluorescence experi-
ments on BR employing the Kerr technique have been
presented. This technique is particularly suitable to record
complete time-dependent fluorescence spectra. By carefully
studying the dependence of the fluorescence signals on the
excitation densities, some discrepancies found in the
literature could be assigned to multi-photon effects. In the
one-photon regime, for the first time, a dynamic Stokes
shift, i.e., a red shift of fluorescence spectra with time, has
been detected. The shift proceeds with a characteristic time
of 0.2 ps and is indicative for a fast re-arrangement on the
reactive surface. In agreement with other experiments, time
constants of b0.15 and ~0.45 ps for the decay of the
fluorescence have been determined.
Acknowledgement
We would like to thank Jfrg Tittor from the Max Planck
Institut fqr Biochemie at Martinsried for the preparation of
the BR samples and Wolfgang Zinth for fruitful discussions
and continuous support of this work.
References
[1] U. Haupts, J. Tittor, D. Oesterhelt, Closing in on bacteriorhodopsin:
progress in understanding the molecule, Annu. Rev. Biophys. Biomol.
Struct. 28 (1999) 367–399.
[2] H.-J. Polland, M. Franz, W. Zinth, W. Kaiser, E. Kflling, D.
Oesterhelt, Early picosecond events in the photocycle of bacterio-
rhodopsin, Biophys. J. 49 (1986) 651–662.
[3] J. Tittor, D. Oesterhelt, The quantum yield of bacteriorhodopsin,
FEBS Lett. 263 (1990) 269–273.
[4] M. Rohr, W. G7rtner, G. Schweitzer, A. Holzwarth, S. Braslavsky,Quantum yields of the photochromic equilibrium between bacterio-
rhodopsin and its bathointermediate K. Femto- and nanosecond
optoacoustic spectroscopy, J. Phys. Chem. 96 (1992) 6055–6061.
[5] S. Logunov, M. El-Sayed, L. Song, J. Lanyi, Photoisomerization
quantum yield and apparent energy content of the K intermediate in
the photocycles of bacteriorhodopsin, its mutants D85N, R82Q, and
D212N, and deionized blue bacteriorhodopsin, J. Phys. Chem. 100
(1996) 2391–2398.
[6] M. Nuss, W. Zinth, W. Kaiser, E. Kflling, D. Oesterhelt, Femtosecond
spectroscopy of the first events of the photochemical cycle in
bacteriorhodopsin, Chem. Phys. Lett. 117 (1985) 1–7.
[7] A. Sharkov, A. Pakulev, Y. Matveetz, Primary events in bacterio-
rhodopsin probed by subpicosecond spectroscopy, BBA 808 (1985)
94–102.
[8] J. Dobler, W. Zinth, W. Kaiser, D. Oesterhelt, Excited-state reaction
dynamics of bacteriorhodopsin studied by femtosecond spectroscopy,
Chem. Phys. Lett. 144 (1988) 215–220.
[9] R. Mathies, C. Cruz, W. Pollard, C. Shank, Direct observation of the
femtosecond excited-state cis–trans isomerisation in bacteriorhodop-
sin, Science 240 (1988) 777–779.
[10] K. Hasson, F. Gai, P. Anfinrud, The photoisomerization of retinal in
bacteriorhodopsin: experimental evidence for a three-state model,
Proc. Natl. Acad. Sci. U. S. A. 93 (1996) 15124–15129.
[11] T. Ye, N. Friedman, Y. Gat, G. Atkinson, M. Sheves, M. Ottolenghi, S.
Ruhman, On the nature of the primary light-induced events in
bacteriorhodopsin: ultrafast spectroscopy of native and c13Mc14 locked
pigments, J. Phys. Chem., B 103 (1999) 5122–5130.
[12] B. Hou, N. Friedman, S. Ruhman, M. Sheves, M. Ottolenghi, Ultrafast
spectroscopy of the protonated Schiff bases of free and C13=C14
locked retinals, J. Phys. Chem., B 105 (2001) 7042–7048.
[13] S. Dexheimer, Q. Wang, L. Peteanu, W. Pollard, R. Mathies, C.
Shank, Femtosecond impulsive excitation of nonstationary vibrational
states in bacteriorhodopsin, Chem. Phys. Lett. 188 (1992) 61–66.
[14] W. Zinth, A. Sieg, P. Huppmann, T. Blankenhorn, D. Oesterhelt,
M. Nonella, Femtosecond spectroscopy and model calculations for
an understanding of the primary reaction in bacteriorhodopsin,
Ultrafast Phenomena XII, Springer Ser. Chem. Phys., vol. 66, 2000,
pp. 680–682.
[15] M. Du, G. Fleming, Femtosecond time-resolved fluorescence spectro-
scopy of bacteriorhodopsin: direct observation of excited state
dynamics in the primary step of the proton pump cycle, Biophys.
Chemist. 48 (1993) 101–111.
[16] S. Haacke, S. Schenkl, S. Vinzani, M. Chergui, Femtosecond and
picosecond fluorescence of native bacteriorhodopsin and a nonisome-
rizing analog, Biopolymers (Biospectroscopy) 67 (2002) 306–309.
[17] B. Schmidt, S. Laimgruber, W. Zinth, P. Gilch, A broadband Kerr
shutter for femtosecond fluorescence spectroscopy, Appl. Phys., B 76
(2003) 809–814.
[18] G. Haran, K. Wynne, A. Xie, Q. He, M. Chance, R.M. Hochstrasser,
Excited state dynamics of bacteriorhodopsin revealed by transient
stimulated emission spectra, Chem. Phys. Lett. 261 (1996) 389–395.
[19] F. Gai, J. McDonald, P. Anfinrud, Pump-dump-probe spectroscopy
of bacteriorhodosin: evidence for a near-IR excited state absorbance,
J. Am. Chem. Soc. 119 (1997) 6201–6202.
[20] S.L. Logunov, V.V. Volkov, M. Braun, M.A. El-Sayed, The relaxation
dynamics of the excited electronic states of retinal in bacteriorhodop-
sin by two-pump-probe femtosecond studies, Proc. Natl. Acad. Sci.
U. S. A. 98 (2001) 8475–8479.
[21] D. Oesterhelt, W. Stoeckenius, Isolation of the cell membrane of
Halobacterium halobium and its fractionation into red and purple
membrane, Methods Enzymol. 31 (1974) 667–678.

B. Schmidt et al. / Biochimica et Biophysica Acta 1706 (2005) 165–173 173
[22] M.L. Horng, J.A. Gardecki, A. Papazyan, M. Maroncelli, Subpico-
second measurements of polar solvation dynamics: coumarin 153
revisited, J. Phys. Chem. 99 (1995) 17311–17337.
[23] M. Glasbeek, H. Zhang, Femtosecond studies of solvation and
intramolecular configurational dynamics of fluorophores in liquid
solution, Chem. Rev. 104 (2004) 1929–1954.
[24] D. Abramavicius, V. Gulbinas, L. Valkunas, Y.-J. Shiu, K. Liang, M.
Hayashi, S. Lin, Molecular twisting and relaxation in the excited state
of triarylpyrylium cations, J. Phys. Chem., A 106 (2002) 8864–8869.
[25] Y.-C. Lu, C. Chang, E.W.-G. Diau, Femtosecond fluorescence
dynamics of trans-azobenzene in hexane on excitation to the
S1(n,k*) state, J. Chin. Chem. Soc. (Taipei) 49 (2002) 693–701.
[26] B. Schmidt, C. Sobotta, S. Malkmus, S. Laimgruber, M. Braun, W.
Zinth, P. Gilch, Femtosecond fluorescence and absorption dynamics
of an azobenzene with a strong push–pull substitution, J. Phys. Chem.,
A 108 (2004) 4399–4404.
[27] S. Kovalenko, R. Schanz, V. Farztdinov, H. Hennig, N. Ernsting,
Femtosecond relaxation of photoexcited para-nitroaniline: solvation,
charge transfer, internal conversion and cooling, Chem. Phys. Lett.
323 (2000) 312–322.
[28] D. Markovitsi, H. Sigal, C. Ecoffet, P. Millie, F. Charra, C. Fiorini,
J.-M. Nunzi, H. Strzelecka, M. Veber, C. Jallabert, Charge transfer in
triaryl pyrylium cations. Theoretical and experimental study, Chem.
Phys. 182 (1994) 69–80.
[29] T. Ye, B. Hou, E. Gershgoren, M. Ottolenghi, N. Friedman, M.
Sheves, S. Ruhman, Resolving the primary dynamics of bacterio-
rhodopsin, and Locked analogs in the reactive excited state,
Ultrafast Phenomena XII, Springer Ser. Chem. Phys., vol. 66,
2000, pp. 683–685.
[30] H. Abramczyk, Femtosecond primary events in bacteriorhodopsin and
its retinal modified analogs: revision of commonly accepted interpre-
tation of electronic spectra of transient intermediates in the bacterio-
rhodopsin photocycle, J. Chem. Phys. 120 (2004) 11120–11132.
[31] M. Garavelli, F. Negri, M. Olivucci, Initial excited-state relaxation
of the isolated 11-cis protonated schiff base of retinal: evidence
for in-plane motion from ab initio quantum chemical simulation of
the resonance Raman spectrum, J. Am. Chem. Soc. 121 (1999)
1023–1029.
[32] R. Birge, Nature of the primary photochemical events in
rhodopsin and bacteriorhodopsin, Biochim. Biophys. Acta 1016
(1990) 293–327.
[33] R. Gonzalez-Luque, M. Garavelli, F. Bernardi, M. Merchan, M. Robb,
M. Olivucci, Computational evidence in favor of a two-state, two-
mode model of the retinal chromophore photoisomerization, Proc.
Natl. Acad. Sci. U. S. A. 97 (2000) 9379–9384.
[34] F. Gai, K. Hasson, J. McDonald, P. Anfinrud, Chemical dynamics in
proteins: the photoisomerization of retinal in bacteriorhodopsin,
Science 279 (1998) 1886–1891.
[35] S. Haacke, S. Vinzani, S. Schenkl, M. Chergui, Spectral and kinetic
fluorescence properties of native and nonisomerizing retinal in
bacteriorhodopsin, Chem. Phys. Chem. 2 (2001) 310–315.
[36] H. Polland, M. Franz, W. Zinth, W. Kaiser, D. Oesterhelt, Energy
transfer from retinal to amino acids—a time-resolved study of the
ultraviolet emission of bacteriorhodopsin, Biochim. Biophys. Acta
851 (1986) 407–415.
[37] M.-L. Groot, R. van Grondelle, J.-A. Leegwater, F. van Mourik,
Radical pair quantum yield in reaction centers of photosystem II of
green plants and of the bacterium Rhodobacter sphaeroides .
Saturation behavior with sub-picosecond pulses, J. Phys. Chem., B
101 (1997) 7869–7873.