feed-in tariffs blessing or curse for geothermal energy...
TRANSCRIPT
GRC Transactions, Vol. 36, 2012
81
KeywordsFeed-in tariff, FIT, renewable tariff, financing, bankability, cost plus profit, worldwide
ABSTRACT
Feed –in tariffs (FiT) are an important and successful steering instrument to facilitate the use of renewable energies. In many countries of the world feed-in tariffs play a fundamental part to rise the commercial interest of investors concerning geothermal electricity production. In 20 EU-countries, in USA, east africa, central america, overall more than 30 countries FitS for all kinds of renewable energy support the energy change. About 15 countries created a feed-in tariff for geothermal electricity. In Germany with its difficult geological situation feed-in tariff for geothermal electricity rose in 2012 to 25€Ct/kWh (30$Ct/kWh). Other FiT i.e. for photovoltaic are reduced by the government as they succeeded .
Introduction
Feed-in tariffs are simply payments per kilowatt-hour for elec-tricity generated by a renewable resource. They are the world’s most successful policy for the rapid development of significant amounts of renewable energy.
Feed-in tariffs are used in Germany, France, and Spain and have driven these countries to world leadership in renewable energy development. In so doing, feed-in tariffs have created hundreds of thousands of new jobs in Europe. But they are easily adaptable to all countries. There are no intrinsic limits on using them at either state, provincial, or federal level.
Feed-in tariffs work because they are more equitable than other policies. They enable everyone--including homeowners, farmers, cooperatives, and businesses large and small--to profit from renewable energy. They comprise a system of payments for each kilowatt-hour of electricity generated. The price that is paid is based on the cost of the electricity produced plus a reasonable profit for the producer. Feed-in tariffs can be implemented along-
side existing renewable energy programs, such as net metering and renewable energy standards.
Feed-in Tariffs
• Allow renewable energy generators to interconnect with the grid, and
• Specifies the amount that they are paid for their electricity,• And specifies how long they will be paid.
Origin of Feed-In Tariffs
The feed in tariff is an idea borrowed from Europe. Spain Italy and Germany all use it. In Germany there are enough wind mills and solar panel to match the capacity of the existing nuclear Powerstation and meet more than 20% of the German energy demand. On sunny and windy Sunday mornings there is more than 100% of renewable energy in Germany.
The payments are guaranteed for 20 - 25 years, they are Tax-free and index link. Feed-in tariffs are simply payments per kilowatt-hour for electricity generated by a renewable re-source. In North America this simple idea is known by many different names: Electricity Feed Laws, Feed-in Laws, Feed-in Tariffs (FITs), Advanced Renewable Tariffs (ARTs), Renew-able Tariffs, Renewable Energy Payments, and more recently CLEAN (for Clean Local Energy Accessible Now) contracts. Regardless of the name, they are the world’s most successful policy mechanism for stimulating the rapid development of renewable energy.
Feed-in tariffs are also the most egalitarian method for de-termining where, when, and how much renewable generating capacity will be installed. Renewable Tariffs enable homeowners, farmers, cooperatives, and First Nations (Native North Americans) to participate on an equal footing with large commercial develop-ers of renewable energy.
Electricity Feed Laws permit the interconnection of renewable sources of electricity with the electric-utility network and at the same time specify how much the renewable generator is paid for their electricity and over how long a period.
Feed-in Tariffs Blessing or Curse for Geothermal Energy?
Worldwide Background and Overview
Dr. Eckehard Büscher
IGO - The International Coordination Office of German Geothermics [email protected]
82
Büscher
Electricity Feed Laws are widely used in Europe, most notably in Germany, France, and Spain. Geothermal feed-in tariffs world-wide vary from as low as $0.10/kWh for a 20-year contract in Spain to as much $0.40/kWh for a 20-year contract in Switzerland.
The secret of German energy policy: It is market orientated! The price of energy that is needed by an investor is calculated; this is the so called “Feed-in-tariff”. To hinder this system becoming a bottomless pit and incalculable risk for the customers or an gold mine for the investor the prices are declining, i.e. the producers are forced to produce at lower level over the years. Nobody has to control whether the targets are reached. The market does not have to be regulated. Starting in 1991 until 2005 Germany did not need a regulator. If the calculation for the tariff was right the politicians just have to control from year to year whether the prices have to be changed. This had to be done concerning the feed in tariffs for PV due to reduced production costs of solar panels.
• Priortity access to the grid for all• Long contracts (20-25 years typical)• Prices differentiated by technology, size, application,
resource intensity • Prices determined by cost plus profit• Fair but not excessive profit• Inflation protection• Periodic Review (every 2-4 years)
Feed-in tariff (FIT) guarantees a minimum payment for each unit of electricity you generate from renewable sources. This means that anybody wishes to invest in buying and installing eligible technologies can be confident that the cost of their investment will be recovered.
Customer Becomes Producer
A feed in tariff (also often referred to as a “feed-in tariff”, “FiT,” or “advanced renewable tariff”) is a type of government policy that promotes renewable energy payments to entities that help generate renewable energy such as solar power, wind power, and geothermal power. The idea behind feed in tariffs is to eventually achieve “grid parity”, which means to break the monopoly that huge energy producing companies hold on the traditional power grid in order to allow for renewable energy producers.
Under a typical feed in tariff policy, regional or national electric grid utility companies are given a government-mandated obligation to purchase renewable electricity from all eligible participants. The UK’s new Feed-in Tariff Programme began in early April, 2010 and is often more well-known by the name “clean energy cash back.”
Feed in tariff policies have been enacted in more than 63 nations in the world, including the UK and most of the members of the European Union. In recent years, a number of detailed analyses by the European Commission, the Inter-national Energy Agency, and others concluded that feed-in tariff regimes are generally the most efficient and effective support schemes for promoting renewable electricity. (http://www.renewableenergyworld.com/rea/news/article/2011/06/geothermal-feed-in-tariffs-worldwide).
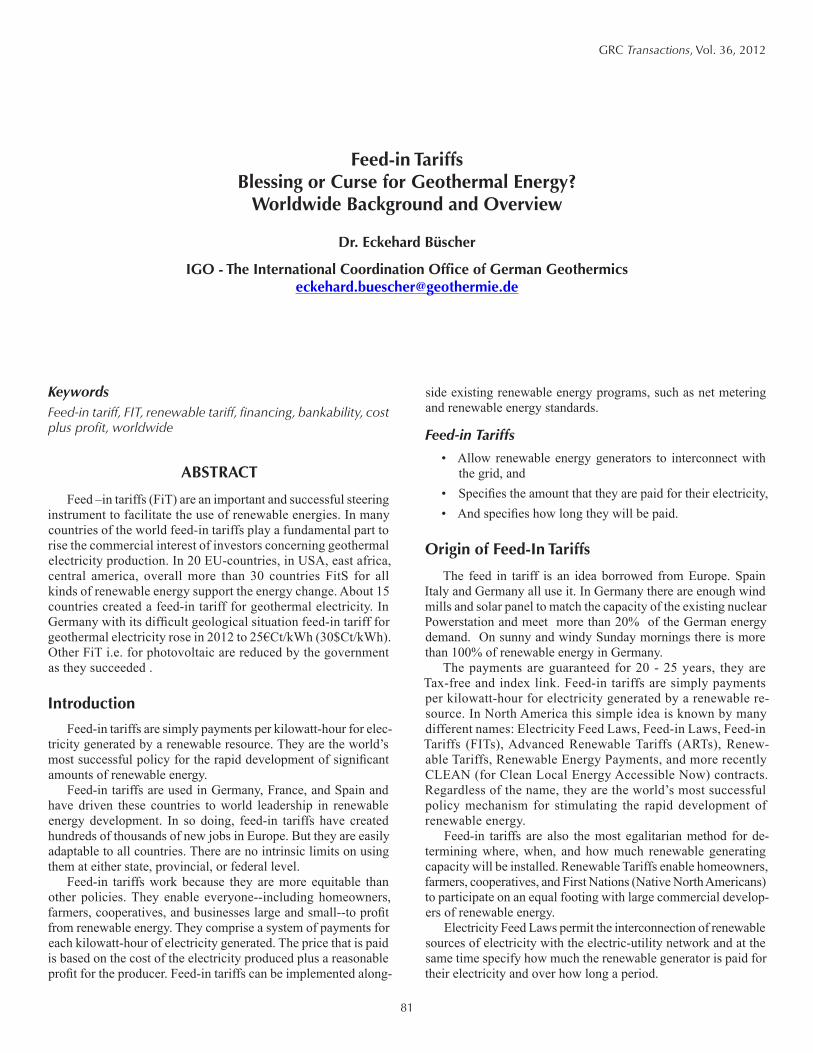
The following chapter describes countries worldwide which are increasingly turning to feed-in tariffs as a mechanism to develop geothermal energy. In the wake of the disaster at the Fukishima nuclear reactors, for example, Japan’s civil society has suggested expanding the countries limited feed-in tariff to include geothermal energy.
Similarly, renewable energy advocates have proposed ex-panding Great Britain’s new feed-in tariff program to include geothermal development. As with feed-in tariffs for solar and wind energy, most of the activity is taking place in Europe.
Italy with more than 800 MW in operation is fifth in geothermal capacity installed worldwide and its Larderello field in Tuscany is a “must see” on any renewable energy “grand tour” of Europe.
Italy has not chosen to emphasize new geothermal develop-ment. While Italy has an attractive feed-in tariff for geothermal, €0.20/kWh ($0.25/kWh), the tariff has been assigned to a small power ghetto along with small wind turbines. Italian policy limits the tariff for geothermal to projects less than 1 MW in size. This size limit is likely too small for any commercial projects.
On the other side of the Adriatic, Slovenia may be more at-tractive than Italy for generation. While Slovenia’s tariff is lower, €0.15/kWh ($0.19/kWh), projects can be larger than those in Italy, up to 10 MW. Similarly, both Slovakia and France limit project size to less than 12 MW, but their tariffs are also as good as Italy’s at €0.20/kWh.
Neither Switzerland nor Germany limits project size. Ger-many has one size tranche for geothermal: for less than 10 MW. Switzerland, on the other hand, uses four different size classes.
For projects less than 5 MW, Switzerland pays nearly €0.31/kWh ($0.39/kWh). This may be a typical project size for conti-nental Europe outside of “hot spots” like Italy’s Larderello field. For example, many of the geothermal projects under development in Germany are less than 5 MW each.
Outside of Europe, Africa and Asia has seen budding interest in using feed-in tariffs for geothermal. Taiwan recently revised its geothermal tariff to the equivalent of €0.12/kWh ($0.15/kWh).
Figure 1. Countries with feed-in tariffs in 2010.
83
Büscher
Kenya and Uganda both have tariffs for geothermal energy, though Kenya’s program doesn’t offer a true feed-in tariff. The tariff in Kenya is a price ceiling rather than a minimum price. The final payment per kilowatt-hour in Kenya is negotiated.
Uganda, on the other hand, places a cap on annual geothermal development to control program costs. Geothermal development in Uganda is limited to 75 MW by 2014.
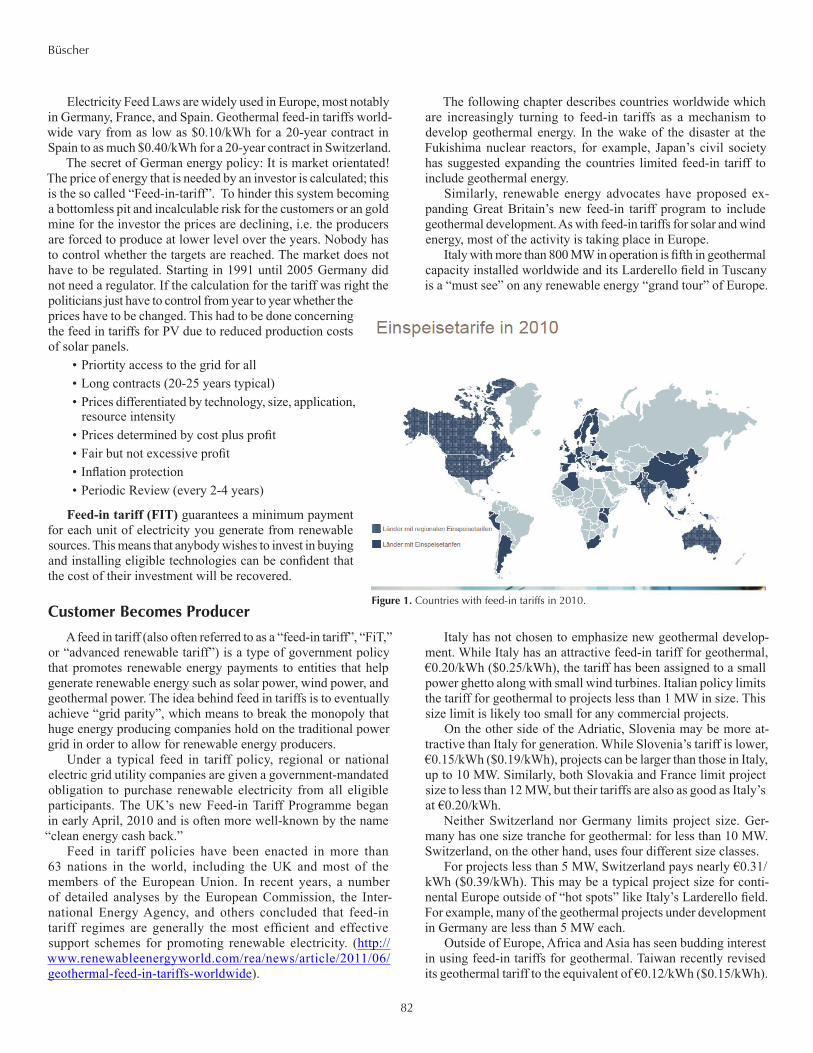
Table 1. Actual Geothermal Tariffs, worldwide examples.
Bonus Payments
Some countries, notably France and Germany, use a system of bonus payments or adders to encourage certain kinds of geo-thermal development, for example, district heating.
In France, geothermal projects receive a bonus payment for using the heat content in addition to the generation of electricity. The payment rate is on a sliding scale relative to the proportion of heat used. The maximum payment of €0.08/kWh ($0.10/kWh) is on top of the base rate.
Interestingly, France pays less for geothermal in its island terri-tories where the electricity is far more valuable than in continental France. Many of France’s overseas territories are volcanically ac-tive, for example Martinique, and the cost to develop geothermal energy is less as a high-temperature resource is close to the surface.
Successful feed-in tariffs are typically based on the “cost” to generate electricity and not on its “value”. Germany uses a multiple bonus system. There has been a bonus payment for project completion before 2016, another bonus for district heating, and a third for developing Enhanced Geothermal Systems, such as hot dry rock. Geothermal projects developed in Germany within the next five years can expect payments from a low of €0.14/kWh ($0.20/kWh) for those greater than 10 MW in size to as much as €0.27/kWh ($0.38/kWh) for a power plant that also provides district heating from a deep geothermal resource. Germany has been debating new tariffs beginning in 2012 and geothermal tariffs have in-creased substantially to €0.25 /kWh ($0.36/kWh).
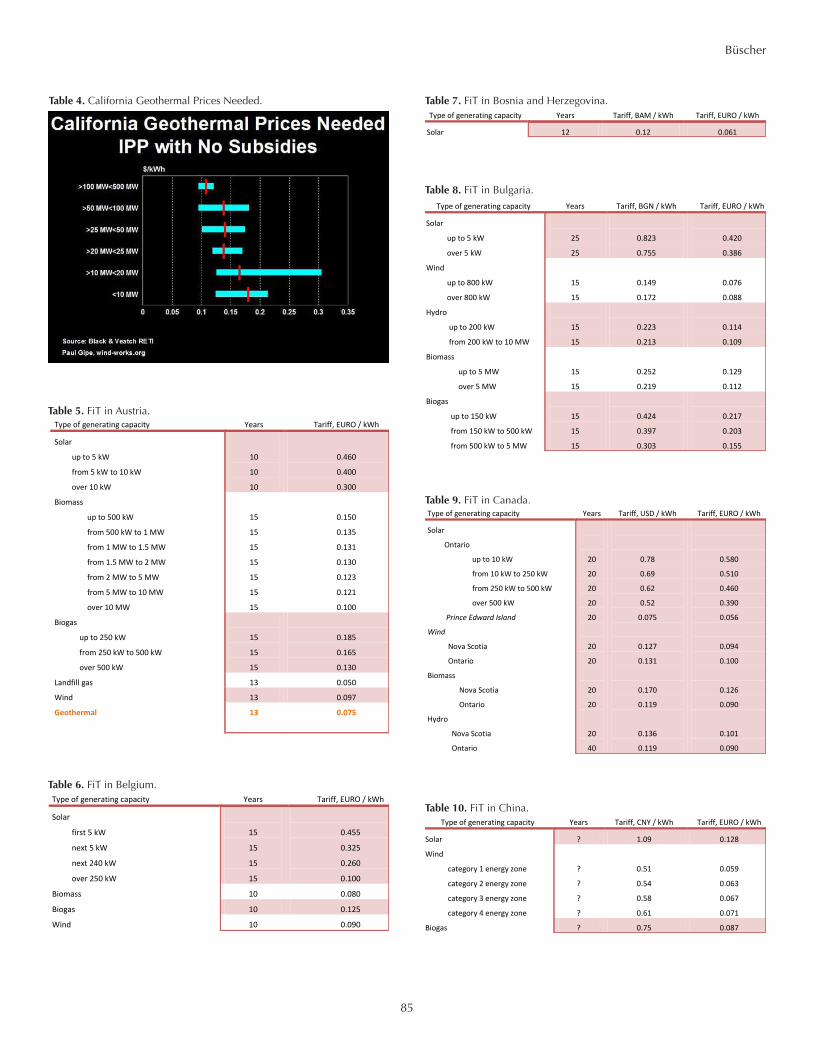
Current feed-in tariffs for geothermal generation worldwide are not too dissimilar to those proposed in a 2008 study for the California Energy Commission. For projects without federal or state subsidies, the tariffs necessary ranged from a low of $0.10/kWh (€0.08/kWh) to a high of $0.30/kWh (€0.24/kWh). See Distributed Geothermal in California Can Add 7% of Supply.
References 1. http://www.renewableenergyworld.com/rea/news/article/2011/06/
geothermal-feed-in-tariffs-worldwide.
2. http://www.geothermie.de/wissenswelt/geothermie/in-deutschland.html.
3. http://www.geothermie-nachrichten.de/japan-bekommt-einspeisetarif-fuer-strom-aus-erneuerbaren-quellen#more-4343.
4. http://www.e-control.at/de/industrie/oeko-energie/einspeisetarife.
5. http://www.wind-works.org/FeedLaws/EvolutionofFeed-inTariffs.html.
6. http://www.wind-works.org/FeedLaws/PrimersonFeed-inTariffsandAd-vancedRenewableTariffs.html.
7. http://www.wind-works.org/FeedLaws/USA/NewCaliforniaGovernor-JerryBrownCallsforFeed-inTariffs.html.
8. http://wind-works.org/FeedLaws/USA/DistributedGeothermalinCali-forniaCanAdd7percentofSupply.html.
9. http://geothermaldigest.net/blog/2010/03/24/feed-in-tariff-for-geother-mal-and-other-renewable-sources-proposes-in-japan/.
10. http://www.renewableenergyworld.com/rea/news/article/2011/06/germany-to-substantially-increase-geothermal-feed-in-tariffs.
11. “Actual and Future Use of Geothermal Potentials in Central America”, E. Buescher, IGC Freiburg May 2012, published in June 20212.
12. “Exportaktivitaeten der deutschen Geothermie”, E. Buescher, German Ministry of Economics, April 2012.
13. http://thinkgeoenergy.com/archives/3142 and /4625.
14. http://www.bnamericas.com/news/electricpower/Feed-in_tarriff,_tar-gets_essential_to_geothermal_development_-_consultant.
Appendix A: Tables and Figures
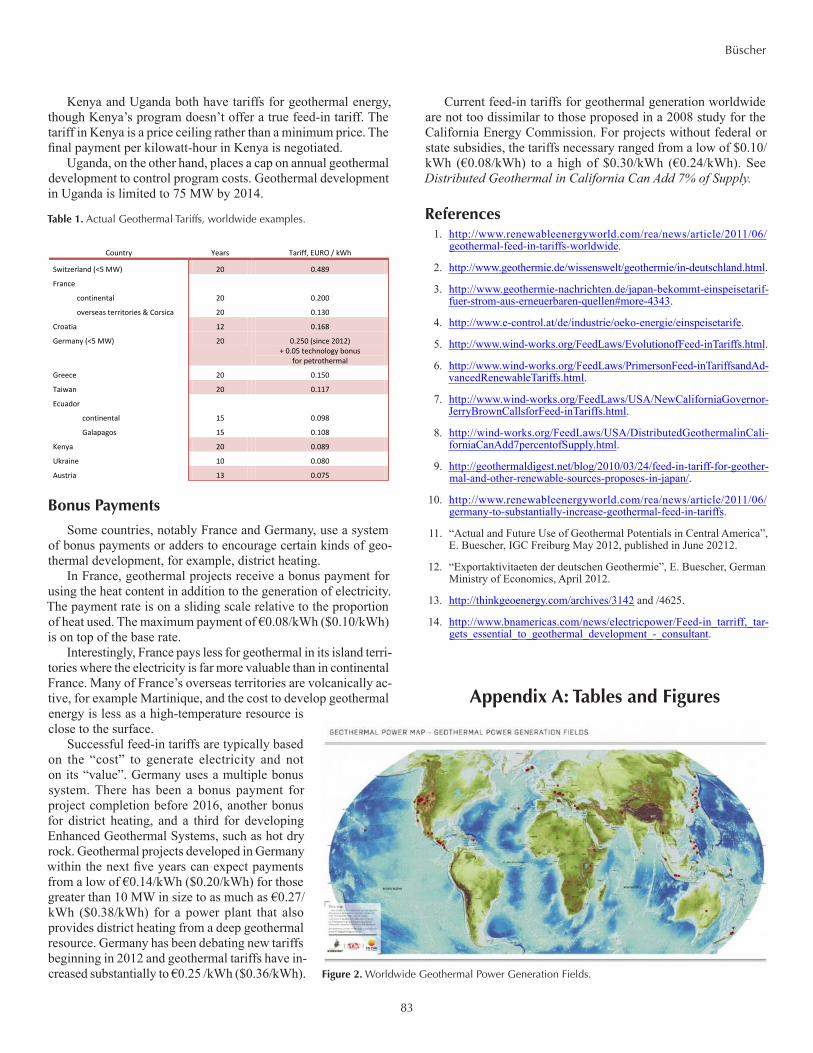
Figure 2. Worldwide Geothermal Power Generation Fields.
Country Years Tariff, EURO / kWh
Switzerland (<5 MW) 20 0.489
France
continental
overseas territories & Corsica
20
20
0.200
0.130
Croatia 12 0.168
Germany (<5 MW) 20 0.250 (since 2012) + 0.05 technology bonus
for petrothermal
Greece 20 0.150
Taiwan 20 0.117
Ecuador
continental
Galapagos
15
15
0.098
0.108
Kenya 20 0.089
Ukraine 10 0.080
Austria 13 0.075
Table 1: Actual Geothermal Tariffs, worldwide examples
84
Büscher
Figure 3. Countries with feed-in tariffs in 1990.
Figure 4. Countries with feed-in tariffs in 2000.
Figure 5. Countries with feed-in tariffs in 2010k, also for island-networks.
Years Tariff, EURO / kWh
Switzerland (<5 MW) 20 0.489
France
continental
overseas territories & Corsica
20
20
0.200
0.130
Croatia 12 0.168
Germany (<10 MW) 20 0.250 (since 2012) + 0.05 technology bonus
for petrothermal
Greece 20 0.150
Taiwan 20 0.117
Ecuador
continental
Galapagos
15
15
0.098
0.108
Kenya 20 0.089
Ukraine 10 0.080
Austria 13 0.075
Table 2: Examples for Geothermal FiTs
Table 3: Geothermal FiTs worldwide (Status 2011)
Table 3. Geothermal FiTs worldwide (Status 2011).
Table 2. Examples for Geothermal FiTs.
85
Büscher
Table 4: California Geothermal Prices Needed
Table 4. California Geothermal Prices Needed. Bosnia and Herzegovina
Type of generating capacity Years Tariff, BAM / kWh Tariff, EURO / kWh
Solar 12 0.12 0.061
Table 7: FiT in Bosnia and Herzegovina
Table 7. FiT in Bosnia and Herzegovina.
Bulgaria
Type of generating capacity Years Tariff, BGN / kWh Tariff, EURO / kWh
Solar
up to 5 kW
over 5 kW
25
25
0.823
0.755
0.420
0.386
Wind
up to 800 kW
over 800 kW
15
15
0.149
0.172
0.076
0.088
Hydro
up to 200 kW
from 200 kW to 10 MW
15
15
0.223
0.213
0.114
0.109
Biomass
up to 5 MW
over 5 MW
15
15
0.252
0.219
0.129
0.112
Biogas
up to 150 kW
from 150 kW to 500 kW
from 500 kW to 5 MW
15
15
15
0.424
0.397
0.303
0.217
0.203
0.155
Table 8: FiT in Bulgaria
Table 8. FiT in Bulgaria.
Table 9. FiT in Canada.Canada
Type of generating capacity Years Tariff, USD / kWh Tariff, EURO / kWh
Solar
Ontario
up to 10 kW
from 10 kW to 250 kW
from 250 kW to 500 kW
over 500 kW
Prince Edward Island
Wind
Nova Scotia
Ontario
Biomass
Nova Scotia
Ontario
Hydro
Nova Scotia
Ontario
20
20
20
20
20
20
20
20
20
20
40
0.78
0.69
0.62
0.52
0.075
0.127
0.131
0.170
0.119
0.136
0.119
0.580
0.510
0.460
0.390
0.056
0.094
0.100
0.126
0.090
0.101
0.090
Table 9: FiT in Canada
China
Type of generating capacity Years Tariff, CNY / kWh Tariff, EURO / kWh
Solar ? 1.09 0.128
Wind
category 1 energy zone
category 2 energy zone
category 3 energy zone
category 4 energy zone
?
?
?
?
0.51
0.54
0.58
0.61
0.059
0.063
0.067
0.071
Biogas ? 0.75 0.087
Table 10: FiT in China
Table 10. FiT in China.
Austria
Type of generating capacity Years Tariff, EURO / kWh
Solar
up to 5 kW
from 5 kW to 10 kW
over 10 kW
10
10
10
0.460
0.400
0.300
Biomass
up to 500 kW
from 500 kW to 1 MW
from 1 MW to 1.5 MW
from 1.5 MW to 2 MW
from 2 MW to 5 MW
from 5 MW to 10 MW
over 10 MW
15
15
15
15
15
15
15
0.150
0.135
0.131
0.130
0.123
0.121
0.100
Biogas
up to 250 kW
from 250 kW to 500 kW
over 500 kW
15
15
15
0.185
0.165
0.130
Landfill gas 13 0.050
Wind 13 0.097
Geothermal 13 0.075
Table 5: FiT in Austria
Table 5. FiT in Austria.
Belgium
Type of generating capacity Years Tariff, EURO / kWh
Solar
first 5 kW
next 5 kW
next 240 kW
over 250 kW
15
15
15
15
0.455
0.325
0.260
0.100
Biomass 10 0.080
Biogas 10 0.125
Wind 10 0.090
Table 6: FiT in Belgium
Table 6. FiT in Belgium.
86
Büscher
Cyprus
Type of generating capacity Years Tariff, EURO / kWh
Solar
up to 20 kW
from 20 kW to 150 kW
15
15
0.360
0.340
Biomass 20 0.135
Biogas 20 0.115
Wind 20 0.166
Table 12: FiT in Cyprus
Czech Republic
Type of generating capacity Years Tariff, CZK / kWh Tariff, EURO / kWh
Solar
up to 30 kW
over 30 kW
20
20
12.15
12.25
0.476
0.479
Biomass / biogas
01 category
02 category
03 category
15
15
15
4.49
3.46
2.57
0.175
0.135
0.100
Wind 15 2.34 0.091
Geothermal
4,50 0.18
Small hydropower plants (capacity <10 kW)
15 2.70 0.106
Table 13: FiT in Czech Republic
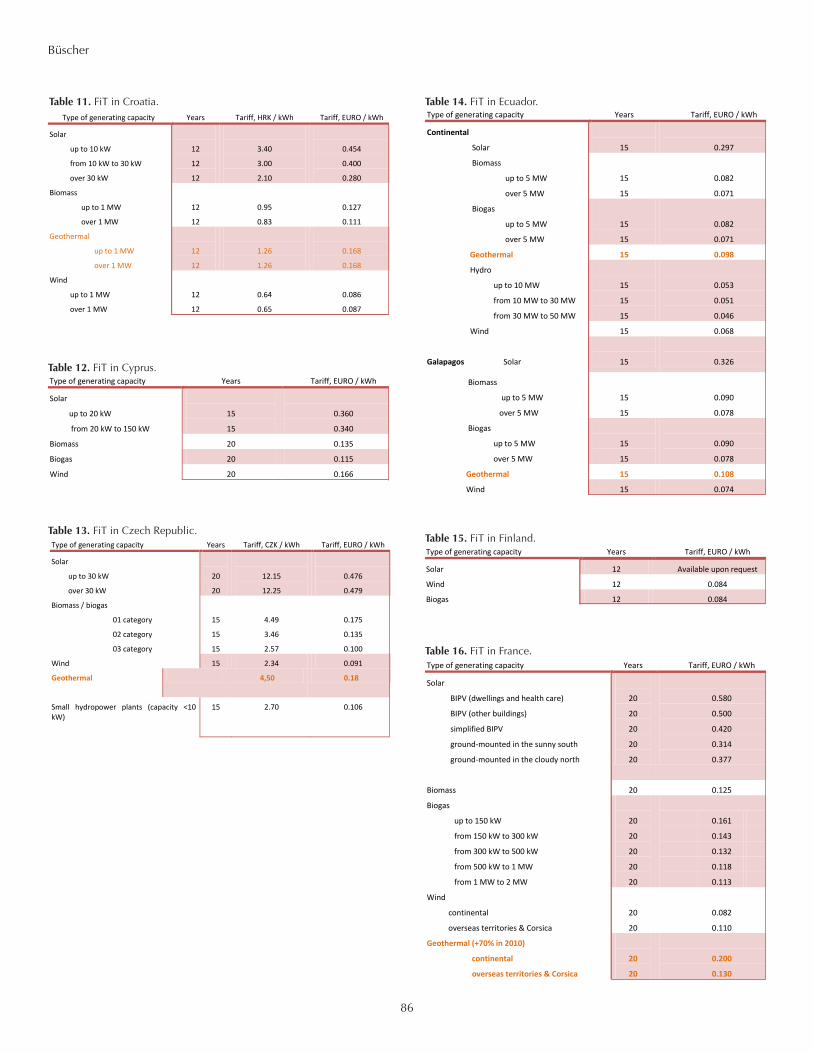
Table 12. FiT in Cyprus.
Table 13. FiT in Czech Republic.
Ecuador
Type of generating capacity Years Tariff, EURO / kWh
Continental
Solar
15
0.297
Biomass
up to 5 MW
over 5 MW
15
15
0.082
0.071
Biogas
up to 5 MW
over 5 MW
15
15
0.082
0.071
Geothermal 15 0.098
Hydro
up to 10 MW
from 10 MW to 30 MW
from 30 MW to 50 MW
15
15
15
0.053
0.051
0.046
Wind 15 0.068
Galapagos Solar
15
0.326
Biomass
up to 5 MW
over 5 MW
15
15
0.090
0.078
Biogas
up to 5 MW
over 5 MW
15
15
0.090
0.078
Geothermal 15 0.108
Wind 15 0.074
Table 14: FiT in Ecuador
Table 14. FiT in Ecuador.
Finland
Type of generating capacity Years Tariff, EURO / kWh
Solar 12 Available upon request
Wind 12 0.084
Biogas 12 0.084
Table 15: FiT in Finland
France
Type of generating capacity Years Tariff, EURO / kWh
Solar
BIPV (dwellings and health care)
BIPV (other buildings)
simplified BIPV
ground-mounted in the sunny south
ground-mounted in the cloudy north
20
20
20
20
20
0.580
0.500
0.420
0.314
0.377
Biomass 20 0.125
Biogas
up to 150 kW
from 150 kW to 300 kW
from 300 kW to 500 kW
from 500 kW to 1 MW
from 1 MW to 2 MW
20
20
20
20
20
0.161
0.143
0.132
0.118
0.113
Wind
continental
overseas territories & Corsica
20
20
0.082
0.110
Geothermal (+70% in 2010)
continental
overseas territories & Corsica
20
20
0.200
0.130
Table 16: FiT in France
Table 15. FiT in Finland.
Table 16. FiT in France.
Croatia
Type of generating capacity Years Tariff, HRK / kWh Tariff, EURO / kWh
Solar
up to 10 kW
from 10 kW to 30 kW
over 30 kW
12
12
12
3.40
3.00
2.10
0.454
0.400
0.280
Biomass
up to 1 MW
over 1 MW
12
12
0.95
0.83
0.127
0.111
Geothermal
up to 1 MW
over 1 MW
12
12
1.26
1.26
0.168
0.168
Wind
up to 1 MW
over 1 MW
12
12
0.64
0.65
0.086
0.087
Table 11: FiT in Croatia
Table 11. FiT in Croatia.
87
Büscher
Germany
Type of generating capacity Years Tariff, EURO / kWh
Solar
up to 30 kW
from 30 kW to 100 kW
from 100 kW to 1 MW
over 1 MW
20
20
20
20
0.287
0.273
0.259
0.216
Biomass
up to 150 kW
from 150 kW to 500 kW
from 500 kW to 5 MW
from 5 MW to 20 MW
20
20
20
20
0.114
0.090
0.080
0.076
Biogas
up to 150 kW
from 150 kW to 500 kW
from 500 kW to 5 MW
from 5 MW to 20 MW
20
20
20
20
0.114
0.090
0.080
0.076
Landfill gas
up to 500 kW
from 500 kW to 5 MW
20
20
0.087
0.059
Wind 20 0.090
Geothermal
up to 5 MW
from 5 MW to 10 MW
from 10 MW to 20 MW
over 20 MW
since 2012
0.25
0.156
0.102
0.102
0.250 + 0.04 Petrothermal
bonus
Hydro
up to 500 kW
from 500 kW to 2 MW
from 2 MW to 5 MW
20
20
20
0.126
0.086
0.076
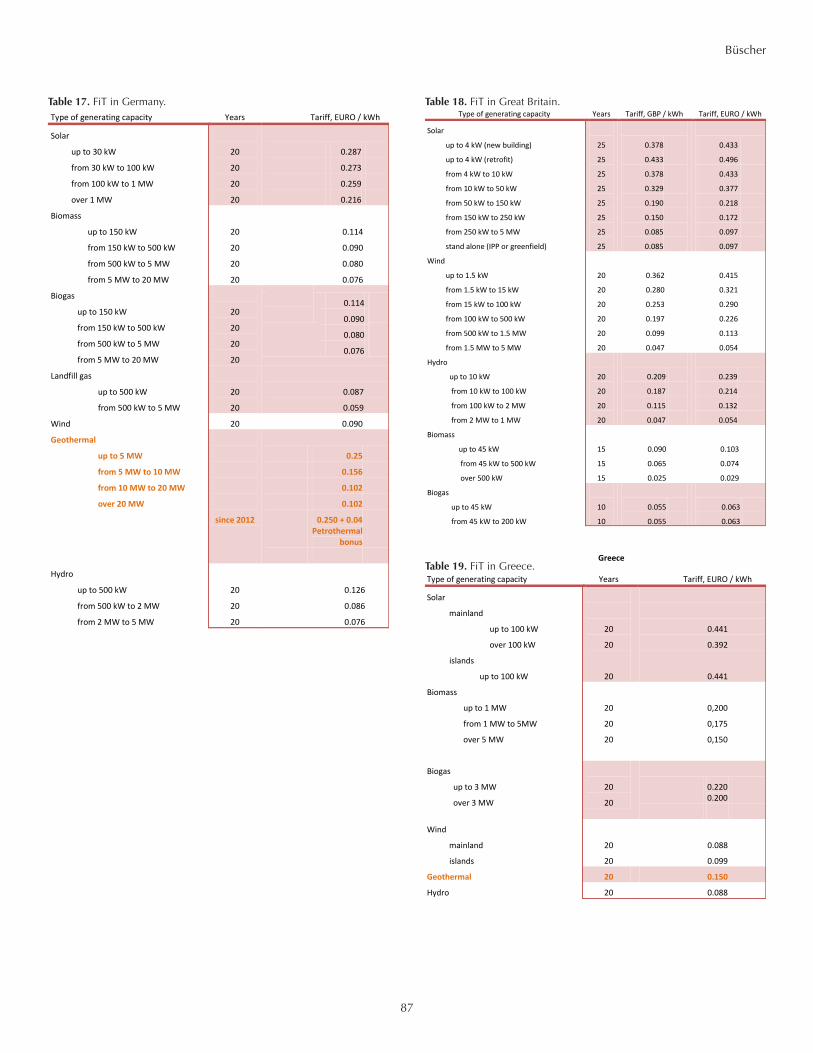
Table 17: FiT in Germany
Great Britain
Type of generating capacity Years Tariff, GBP / kWh Tariff, EURO / kWh
Solar
up to 4 kW (new building)
up to 4 kW (retrofit)
from 4 kW to 10 kW
from 10 kW to 50 kW
from 50 kW to 150 kW
from 150 kW to 250 kW
from 250 kW to 5 MW
stand alone (IPP or greenfield)
25
25
25
25
25
25
25
25
0.378
0.433
0.378
0.329
0.190
0.150
0.085
0.085
0.433
0.496
0.433
0.377
0.218
0.172
0.097
0.097
Wind
up to 1.5 kW
from 1.5 kW to 15 kW
from 15 kW to 100 kW
from 100 kW to 500 kW
from 500 kW to 1.5 MW
from 1.5 MW to 5 MW
20
20
20
20
20
20
0.362
0.280
0.253
0.197
0.099
0.047
0.415
0.321
0.290
0.226
0.113
0.054
Hydro
up to 10 kW
from 10 kW to 100 kW
from 100 kW to 2 MW
from 2 MW to 1 MW
20
20
20
20
0.209
0.187
0.115
0.047
0.239
0.214
0.132
0.054
Biomass
up to 45 kW
from 45 kW to 500 kW
over 500 kW
15
15
15
0.090
0.065
0.025
0.103
0.074
0.029
Biogas
up to 45 kW
from 45 kW to 200 kW
10
10
0.055
0.055
0.063
0.063
Table 18: FiT in Great Britain
Table 17. FiT in Germany. Table 18. FiT in Great Britain.
Greece
Type of generating capacity Years Tariff, EURO / kWh
Solar
mainland
up to 100 kW
over 100 kW
islands
up to 100 kW
20
20
20
0.441
0.392
0.441
Biomass
up to 1 MW
from 1 MW to 5MW
over 5 MW
20
20
20
0,200
0,175
0,150
Biogas
up to 3 MW
over 3 MW
20
20
0.220 0.200
Wind
mainland
islands
20
20
0.088
0.099
Geothermal 20 0.150
Hydro 20 0.088
Table 19: FiT in Greece
Table 19. FiT in Greece.
88
Büscher
Hungary
Type of generating capacity Years Tariff, HUF / kWh Tariff, EURO / kWh
Solar ? 26.5 0.086
Biomass ? 39.6 0.129
Geothermal projects approved
after 01.01.2008
< 20 MW
20 to 50 MW
>50 MW
33.4
Hauptzeit: 33,35 Nebenzeit: 29,84 Tiefzeit: 12,18
Hauptzeit: 26,67 Nebenzeit: 23,88 Tiefzeit: 9,74
Hauptzeit: 20,74 Nebenzeit: 13,27 Tiefzeit: 13,27
Table 20: FiT in Hungary
India
Type of generating capacity Years Tariff, INR / kWh Tariff, EURO / kWh
Solar
up to 20 kW
from 20 kW to 100 kW
Gujarat
proposed tariff (2012)
10
10
12
25
12.36
10.29
13.89
19.40
0.178
0.148
0.200
0.279
Biomass 10 4.36 0.063
Wind
from 50 kW to 100 kW
from 100 kW to 1 MW
from 1 MW to 100 MW
10
10
10
7.22
5.42
3.89
0.104
0.078
0.056
Table 21: FiT in India
Iran
Type of generating capacity Years Tariff, IRR / kWh Tariff, EURO / kWh
Solar
peak and medium load
20 hours per day
low load 4 hours per day
?
?
1300
900
0.089
0.061
Table 22: FiT in Iran
Ireland
Type of generating capacity Years Tariff, EURO / kWh
Solar 15 0.190
Biomass 15 0.083
Wind
onshore
up to 5 MW
over 5 MW
offshore
15
15
15
0.068
0.066
0.140
Landfill gas 15 0.081
Hydro 15 0.083
Table 23: FiT in Ireland
Israel
Type of generating capacity Years Tariff, NIS / kWh Tariff, EURO / kWh
Solar
up to 50 kW
over 50 kW
20
20
1.97
1.58
0.388
0.311
Renewable energy 20 0.45 0.088
Wind
up to 15 kW
from 15 kW to 50 kW
20
20
1.27
1.62
0.250
0.320
Table 24: FiT in Israel
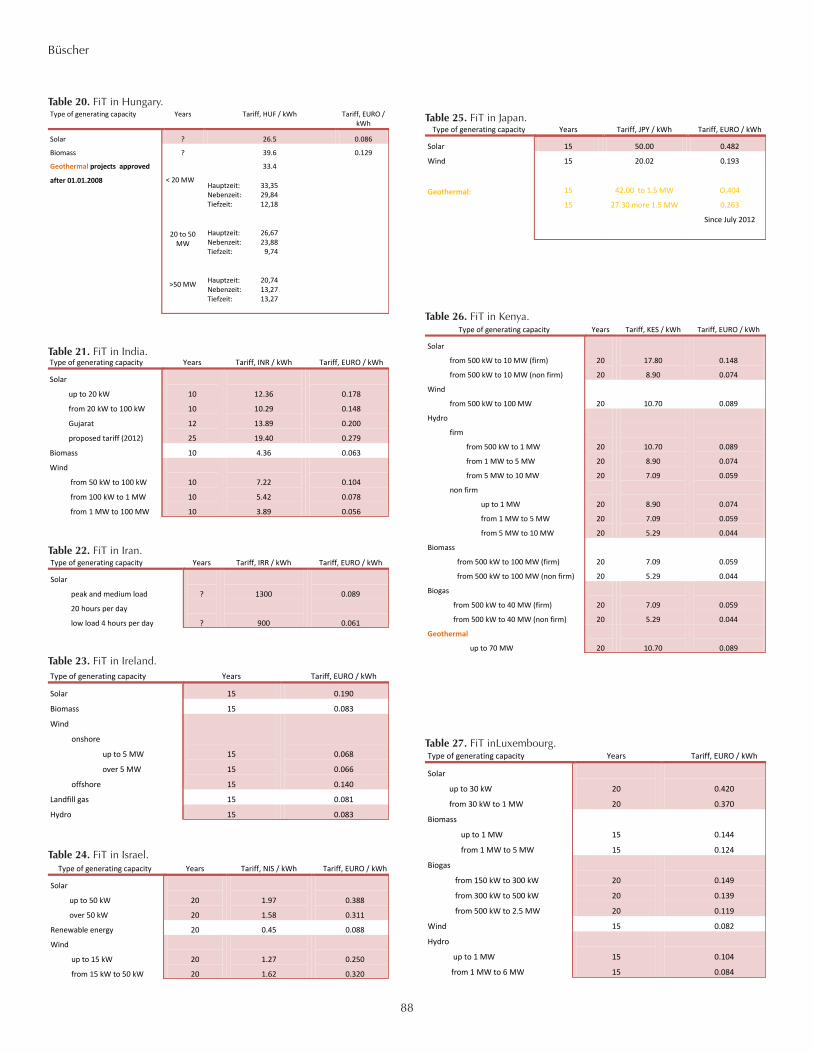
Table 20. FiT in Hungary.
Table 21. FiT in India.
Table 22. FiT in Iran.
Table 23. FiT in Ireland.
Table 24. FiT in Israel.
Japan
Type of generating capacity Years Tariff, JPY / kWh Tariff, EURO / kWh
Solar 15 50.00 0.482
Wind 15 20.02 0.193
Geothermal:
15
15
42.00 to 1.5 MW
27.30 more 1.5 MW
O,404
0,263
Since July 2012
Table 25: FiT in Japan
Table 25. FiT in Japan.
Kenya
Table 26: FiT in Kenia
Type of generating capacity Years Tariff, KES / kWh Tariff, EURO / kWh
Solar
from 500 kW to 10 MW (firm)
from 500 kW to 10 MW (non firm)
20
20
17.80
8.90
0.148
0.074
Wind
from 500 kW to 100 MW
20
10.70
0.089
Hydro
firm
from 500 kW to 1 MW
from 1 MW to 5 MW
from 5 MW to 10 MW
non firm
up to 1 MW
from 1 MW to 5 MW
from 5 MW to 10 MW
20
20
20
20
20
20
10.70
8.90
7.09
8.90
7.09
5.29
0.089
0.074
0.059
0.074
0.059
0.044
Biomass
from 500 kW to 100 MW (firm)
from 500 kW to 100 MW (non firm)
20
20
7.09
5.29
0.059
0.044
Biogas
from 500 kW to 40 MW (firm)
from 500 kW to 40 MW (non firm)
20
20
7.09
5.29
0.059
0.044
Geothermal
up to 70 MW
20
10.70
0.089
Table 26. FiT in Kenya.
Luxembourg
Type of generating capacity Years Tariff, EURO / kWh
Solar
up to 30 kW
from 30 kW to 1 MW
20
20
0.420
0.370
Biomass
up to 1 MW
from 1 MW to 5 MW
15
15
0.144
0.124
Biogas
from 150 kW to 300 kW
from 300 kW to 500 kW
from 500 kW to 2.5 MW
20
20
20
0.149
0.139
0.119
Wind 15 0.082
Hydro
up to 1 MW
from 1 MW to 6 MW
15
15
0.104
0.084
Table 27: FiT inLuxembourg
Table 27. FiT inLuxembourg.
89
Büscher
Malaysia
Type of generating capacity Years Tariff, MYR / kWh Tariff, EURO / kWh
Solar
up to 4 kW
from 4 kW to 24 kW
from 24 kW to 72 kW
from 72 kW to 1 MW
from 1 MW to 10 MW
from 10 MW to 30 MW
21
21
21
21
21
21
21
1.23
1.20
1.18
1.14
0.95
0.85
0.288
0.281
0.276
0.267
0.222
0.199
Biomass
up to 10 MW
from 10 MW to 20 MW
from 2 MW to 30 MW
16
16
16
0.31
0.29
0.27
0.073
0.068
0.063
Biogas
up to 4 MW
from 4 MW to 10 MW
from 10 MW to 30 MW
16
16
16
0.32
0.30
0.28
0.075
0.070
0.066
Hydro
up to 10 MW
from 10 MW to 30 MW
21
21
0.24
0.23
0.056
0.054
Table 28: FiT in Malysia
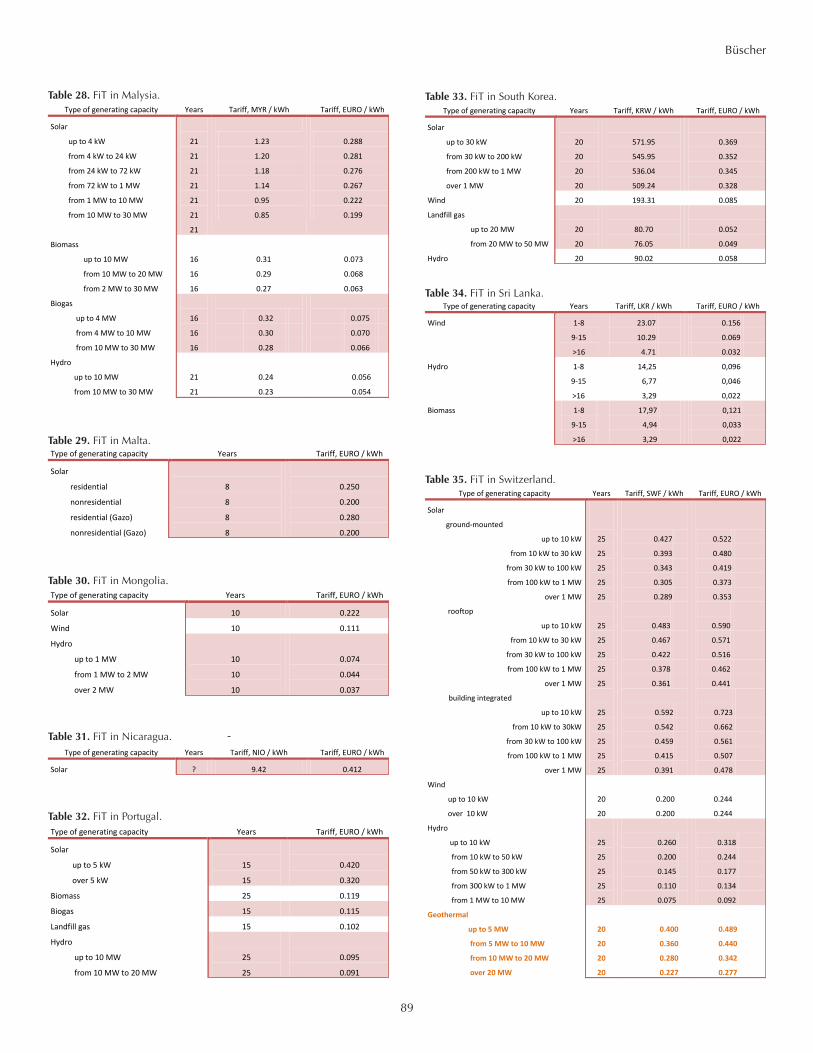
Table 28. FiT in Malysia.
Malta
Type of generating capacity Years Tariff, EURO / kWh
Solar
residential
nonresidential
residential (Gazo)
nonresidential (Gazo)
8
8
8
8
0.250
0.200
0.280
0.200
Table 29: FiT in Malta
Table 29. FiT in Malta.
Mongolia
Type of generating capacity Years Tariff, EURO / kWh
Solar 10 0.222
Wind 10 0.111
Hydro
up to 1 MW
from 1 MW to 2 MW
over 2 MW
10
10
10
0.074
0.044
0.037
Table 30: FiT in Mongolia
Table 30. FiT in Mongolia.
Nicaragua
Type of generating capacity Years Tariff, NIO / kWh Tariff, EURO / kWh
Solar ? 9.42 0.412
Table 31: FiT in Nicaragua
Table 31. FiT in Nicaragua.
Portugal
Type of generating capacity Years Tariff, EURO / kWh
Solar
up to 5 kW
over 5 kW
15
15
0.420
0.320
Biomass 25 0.119
Biogas 15 0.115
Landfill gas 15 0.102
Hydro
up to 10 MW
from 10 MW to 20 MW
25
25
0.095
0.091
Table 32: FiT in Portugal
Table 32. FiT in Portugal.
South Korea
Type of generating capacity Years Tariff, KRW / kWh Tariff, EURO / kWh
Solar
up to 30 kW
from 30 kW to 200 kW
from 200 kW to 1 MW
over 1 MW
20
20
20
20
571.95
545.95
536.04
509.24
0.369
0.352
0.345
0.328
Wind 20 193.31 0.085
Landfill gas
up to 20 MW
from 20 MW to 50 MW
20
20
80.70
76.05
0.052
0.049
Hydro 20 90.02 0.058
Table 33: FiT in South Korea
Table 33. FiT in South Korea.
Sri Lanka
Type of generating capacity Years Tariff, LKR / kWh Tariff, EURO / kWh
Wind 1-8
9-15
>16
23.07
10.29
4.71
0.156
0.069
0.032
Hydro 1-8
9-15
>16
14,25
6,77
3,29
0,096
0,046
0,022
Biomass 1-8
9-15
>16
17,97
4,94
3,29
0,121
0,033
0,022
Table 34: FiT in Sri Lanka
Table 34. FiT in Sri Lanka.
Switzerland
Type of generating capacity Years Tariff, SWF / kWh Tariff, EURO / kWh
Solar
ground-mounted
up to 10 kW
from 10 kW to 30 kW
from 30 kW to 100 kW
from 100 kW to 1 MW
over 1 MW
rooftop
up to 10 kW
from 10 kW to 30 kW
from 30 kW to 100 kW
from 100 kW to 1 MW
over 1 MW
building integrated
up to 10 kW
from 10 kW to 30kW
from 30 kW to 100 kW
from 100 kW to 1 MW
over 1 MW
25
25
25
25
25
25
25
25
25
25
25
25
25
25
25
0.427
0.393
0.343
0.305
0.289
0.483
0.467
0.422
0.378
0.361
0.592
0.542
0.459
0.415
0.391
0.522
0.480
0.419
0.373
0.353
0.590
0.571
0.516
0.462
0.441
0.723
0.662
0.561
0.507
0.478
Wind
up to 10 kW
over 10 kW
20
20
0.200
0.200
0.244
0.244
Hydro
up to 10 kW
from 10 kW to 50 kW
from 50 kW to 300 kW
from 300 kW to 1 MW
from 1 MW to 10 MW
25
25
25
25
25
0.260
0.200
0.145
0.110
0.075
0.318
0.244
0.177
0.134
0.092
Geothermal
up to 5 MW
from 5 MW to 10 MW
from 10 MW to 20 MW
over 20 MW
20
20
20
20
0.400
0.360
0.280
0.227
0.489
0.440
0.342
0.277
Table 35: FiT in Switzerland
Table 35. FiT in Switzerland.
90
Büscher
USA
Type of generating capacity Years Tariff, USD / kWh Tariff, EURO / kWh
Solar
California
Florida
up to 10 kW
from 10 kW to 25 kW
over 25 kW
Hawaii
Michigan
New Mexico
Rhode Island
from 10 kW to 150 kW
from 150 kW to 500 kW
from 500 kW to 5 MW
Texas
Tennessee
Vermont
Washington
Wisconsin
Wind
Hawaii
Minnesota
Rhode Island
Vermont
up to 50 kW
from 50 kW to 2.2 MW
Washington
Hydro
Hawaii
Vermont
Biomass
Vermont
Biogas
Washington
3
20
20
20
20
12
12
15
15
15
20
10
25
8
10
20
1-10
11-20
15
20
20
8
20
20
20
8
0.48
0.30
0.28
0.23
0.26
0.43
0.20
0.32
0.30
0.28
0.26
0.19
0.30
0.61
0.25
0.14
0.04
0.03
0.13
0.20
0.13
0.41
0.19
0.13
0.13
0.15
0.370
0.237
0.215
0.178
0.203
0.333
0.156
0.247
0.234
0.215
0.200
0.146
0.222
0.452
0.185
0.102
0.035
0.024
0.099
0.148
0.093
0.304
0.140
0.093
0.093
0.111
Table 39: FiT in USA
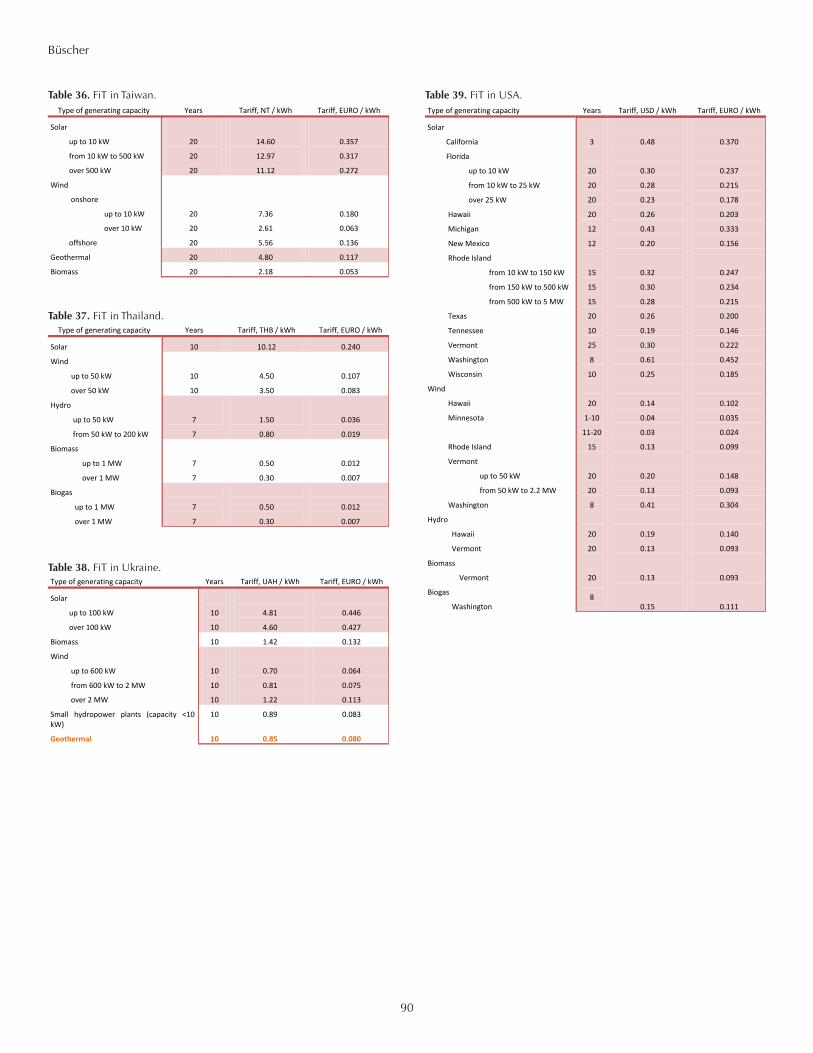
Table 39. FiT in USA.
Ukraine
Type of generating capacity Years Tariff, UAH / kWh Tariff, EURO / kWh
Solar
up to 100 kW
over 100 kW
10
10
4.81
4.60
0.446
0.427
Biomass 10 1.42 0.132
Wind
up to 600 kW
from 600 kW to 2 MW
over 2 MW
10
10
10
0.70
0.81
1.22
0.064
0.075
0.113
Small hydropower plants (capacity <10 kW)
10 0.89 0.083
Geothermal 10 0.85 0.080
Table 38: FiT in Ukraine
Table 38. FiT in Ukraine.
Thailand
Type of generating capacity Years Tariff, THB / kWh Tariff, EURO / kWh
Solar 10 10.12 0.240
Wind
up to 50 kW
over 50 kW
10
10
4.50
3.50
0.107
0.083
Hydro
up to 50 kW
from 50 kW to 200 kW
7
7
1.50
0.80
0.036
0.019
Biomass
up to 1 MW
over 1 MW
7
7
0.50
0.30
0.012
0.007
Biogas
up to 1 MW
over 1 MW
7
7
0.50
0.30
0.012
0.007
Table 37: FiT in Thailand
Table 37. FiT in Thailand.
Taiwan
Type of generating capacity Years Tariff, NT / kWh Tariff, EURO / kWh
Solar
up to 10 kW
from 10 kW to 500 kW
over 500 kW
20
20
20
14.60
12.97
11.12
0.357
0.317
0.272
Wind
onshore
up to 10 kW
over 10 kW
offshore
20
20
20
7.36
2.61
5.56
0.180
0.063
0.136
Geothermal 20 4.80 0.117
Biomass 20 2.18 0.053
Table 36: FiT in Taiwan
Table 36. FiT in Taiwan.