federal credit supplement · iii introduction the 2017 federal credit supplement (supplement)...
TRANSCRIPT

FEDERAL CREDIT SUPPLEMENTBUDGET OF THE U.S. GOVERNMENT
FISCAL YEAR 2017OFFICE OF MANAGEMENT AND BUDGET

i
TABLE OF CONTENTS
Page
Introduction .................................................................................................................................................................................................... iii
Credit Program Supplementary Tables
Table 1 - Direct Loans: Subsidy Rates, Obligations, and Average Loan Size ................................................................................................ 1
Table 2 - Loan Guarantees: Subsidy Rates, Commitments, and Average Loan Size .................................................................................... 5
Table 3 - Direct Loans: Assumptions Underlying the 2016 Subsidy Estimates ............................................................................................ 9
Table 4 - Loan Guarantees: Assumptions Underlying the 2016 Subsidy Estimates .................................................................................. 13
Table 5 - Direct Loans: Assumptions Underlying the 2017 Subsidy Estimates .......................................................................................... 17
Table 6 - Loan Guarantees: Assumptions Underlying the 2017 Subsidy Estimates .................................................................................. 21
Table 7 - Direct Loans: Subsidy Reestimates ................................................................................................................................................. 25
Table 8 - Loan Guarantees: Subsidy Reestimates ......................................................................................................................................... 65
Table 9 - Direct Loan Program Disbursement Rate Assumptions Underlying the 2017 Subsidy Estimates ........................................... 95
Table 10 - Loan Guarantee Program Disbursement Rate Assumptions Underlying the 2017 Subsidy Estimates .................................. 99


iii
INTRODUCTION
The 2017 Federal Credit Supplement (Supplement) provides summary information about Federal direct loan and loan guarantee programs subject to the Federal Credit Reform Act (FCRA) of 1990, as amended by the Balanced Budget Act of 1997. The credit activities of programs exempt from FCRA do not appear in the Supplement, such as the credit activities of certain agencies providing deposit insurance.
Tables 1 and 2 provide 2016 and 2017 subsidy rates, obligations, commitments, average loan size for direct loan and loan guarantee programs, and programs’ respective classification as discretionary or mandatory under the Balanced Budget and Emergency Deficit Control Act of 1985 (BBEDCA), as amended. Programs and risk categories with legislative proposals are displayed with one line showing program data under existing law and a second line showing program data under the legislative proposal. For more information on the BBEDCA and credit reform concepts, see Chapter 9, “Budget Concepts,” in the Analytical Perspectives volume of the 2017 Budget.
Tables 3 and 4 provide information about the major components of 2016 subsidy rates, including the characteristics of direct loans and loan guarantees, respectively. Tables 5 and 6 provide the same information for direct loans and loan guarantees included in the President’s 2017 Budget request. The subsidy rate reflects the net present value cost for each dollar of credit assistance. The subsidy rate is comprised of four components: defaults, net of recoveries; interest; fees; and all other. Loan characteristics describe the terms of the loan agreement between the borrower and the agency or lender, as well as the estimated nominal default and recovery rates. Loan maturity and grace period data are expressed in years; all other characteristics are expressed as a percentage. The grace period data may be for repayment of principal and/or interest.
Tables 7 and 8 provide information on the lifetime reestimates of direct loan and loan guarantee cohorts from 1992 through 2015 by agency, bureau, program, and risk category. The tables show the following for each cohort: the original subsidy rate at the point of obligation or commitment; the current reestimated subsidy rate; the change in subsidy rates due to interest and technical updates; dollar reestimates for the current year; net lifetime reestimate data; and lifetime disbursements through September 30, 2015. Some cohorts displayed in the 2017 Supplement have closed—there are no outstanding direct or guaranteed loans in the cohort and no further activity is expected. These cohorts are identified with a footnote and will not be displayed in future Federal Credit Supplement volumes.
Tables 9 and 10 show the rates at which the 2017 cohorts of direct loans and guaranteed loans are expected to disburse.
Electronic versions of the Supplement in both PDF and Excel formats are available at http://www.whitehouse.gov/omb/budget/Supplemental.


Table 1. DIRECT LOANS: SUBSIDY RATES, OBLIGATIONS, AND AVERAGE LOAN SIZE (Dollars in thousands)
Subsidy rate (percent) Obligations Average loan size Subsidy rate
(percent) Obligations Average loan size
Department of Agriculture
Farm Service Agency: Agricultural Credit Insurance Fund: Farm Ownership.............................................................................................. Discretionary -2.73 1,500,000 190 -1.62 1,500,000 179 Farm Operating............................................................................................... Discretionary 4.31 1,252,004 55 4.26 1,460,047 54 Emergency Disaster........................................................................................ Discretionary 3.64 54,683 97 5.59 22,576 99 Indian Tribe Land Acquisition.......................................................................... Discretionary -24.44 2,000 1,000 -21.54 20,000 6,667 Boll Weevil Eradication.................................................................................... Discretionary -0.81 60,000 3,483 -0.66 60,000 5,000 Indian Highly Fractionated Land...................................................................... Discretionary -4.58 10,000 1,000 25.50 10,000 985 Farm Storage Facility Loans: Farm Storage Facility Loans............................................................................ Mandatory -1.64 300,000 72 -1.30 300,000 72 Sugar Storage Facility Loans.......................................................................... Mandatory -1.59 20,000 4,000 -2.20 8,500 4,000
Rural Housing Service: Multi-Family Housing Revitalization: Multi-Family Housing Relending Demo........................................................... Discretionary 31.26 2,042 1,040 ...... ...... ...... Multi-Family Housing Revitalization Seconds.................................................. Discretionary 54.12 19,398 706 57.01 18,769 720 Multi-Family Revitalization Zero...................................................................... Discretionary 52.68 21,000 747 51.29 15,247 762 Rural Community Facilities: Community Facility Loans............................................................................... Discretionary -8.04 2,200,000 2,616 -2.56 2,200,000 3,290 Rural Housing Insurance Fund: Section 502 Single-Family Housing................................................................. Discretionary 6.75 900,000 133 6.77 900,000 138 Section 515 Multi-Family Housing................................................................... Discretionary 29.63 28,397 1,111 29.60 33,074 1,132 Section 504 Housing Repair............................................................................ Discretionary 13.03 26,000 6 13.94 26,277 6 Section 514 Farm Labor Housing.................................................................... Discretionary 28.46 41,279 1,646 29.56 38,000 1,677 Section 524 Site Development........................................................................ Discretionary -1.53 5,000 499 2.22 5,000 509 Section 523 Self-Help Housing........................................................................ Discretionary -0.30 5,000 430 8.34 5,000 430 Single-Family Housing Credit Sales................................................................ Discretionary -4.87 2,000 85 -2.36 10,000 89
Rural Business Cooperative Service: Rural Microenterprise Direct Loans................................................................. Discretionary 11.33 11,465 250 12.40 31,581 250 Intermediary Relending Program..................................................................... Mandatory 27.62 18,888 643 28.99 18,889 655 Rural Economic Development Loans.............................................................. Mandatory 13.39 37,386 500 14.23 89,000 500
Rural Utilities Service: Rural Water and Waste Disposal Loans: Water and Waste Disposal Loans................................................................... Discretionary 2.61 1,364,483 1,615 4.34 1,036,866 1,614
Agency, Bureau, Program and Risk Category BEA Category2016 2017
1
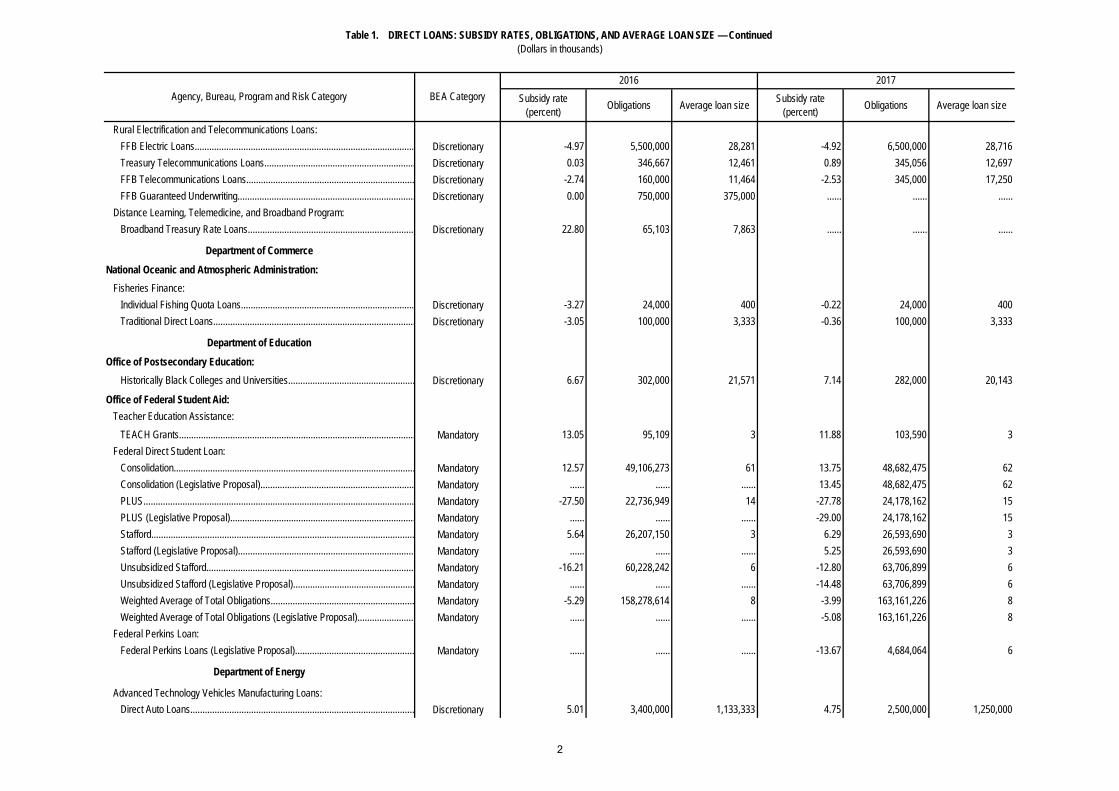
Table 1. DIRECT LOANS: SUBSIDY RATES, OBLIGATIONS, AND AVERAGE LOAN SIZE — Continued (Dollars in thousands)
Subsidy rate (percent) Obligations Average loan size Subsidy rate
(percent) Obligations Average loan sizeAgency, Bureau, Program and Risk Category BEA Category
2016 2017
Rural Electrification and Telecommunications Loans: FFB Electric Loans.......................................................................................... Discretionary -4.97 5,500,000 28,281 -4.92 6,500,000 28,716 Treasury Telecommunications Loans.............................................................. Discretionary 0.03 346,667 12,461 0.89 345,056 12,697 FFB Telecommunications Loans..................................................................... Discretionary -2.74 160,000 11,464 -2.53 345,000 17,250 FFB Guaranteed Underwriting......................................................................... Discretionary 0.00 750,000 375,000 ...... ...... ...... Distance Learning, Telemedicine, and Broadband Program: Broadband Treasury Rate Loans.................................................................... Discretionary 22.80 65,103 7,863 ...... ...... ......
Department of Commerce
National Oceanic and Atmospheric Administration: Fisheries Finance: Individual Fishing Quota Loans....................................................................... Discretionary -3.27 24,000 400 -0.22 24,000 400 Traditional Direct Loans................................................................................... Discretionary -3.05 100,000 3,333 -0.36 100,000 3,333
Department of Education
Office of Postsecondary Education: Historically Black Colleges and Universities.................................................... Discretionary 6.67 302,000 21,571 7.14 282,000 20,143
Office of Federal Student Aid: Teacher Education Assistance: TEACH Grants................................................................................................. Mandatory 13.05 95,109 3 11.88 103,590 3 Federal Direct Student Loan: Consolidation................................................................................................... Mandatory 12.57 49,106,273 61 13.75 48,682,475 62 Consolidation (Legislative Proposal)............................................................... Mandatory ...... ...... ...... 13.45 48,682,475 62 PLUS............................................................................................................... Mandatory -27.50 22,736,949 14 -27.78 24,178,162 15 PLUS (Legislative Proposal)............................................................................ Mandatory ...... ...... ...... -29.00 24,178,162 15 Stafford............................................................................................................ Mandatory 5.64 26,207,150 3 6.29 26,593,690 3 Stafford (Legislative Proposal)........................................................................ Mandatory ...... ...... ...... 5.25 26,593,690 3 Unsubsidized Stafford..................................................................................... Mandatory -16.21 60,228,242 6 -12.80 63,706,899 6 Unsubsidized Stafford (Legislative Proposal).................................................. Mandatory ...... ...... ...... -14.48 63,706,899 6 Weighted Average of Total Obligations........................................................... Mandatory -5.29 158,278,614 8 -3.99 163,161,226 8 Weighted Average of Total Obligations (Legislative Proposal)....................... Mandatory ...... ...... ...... -5.08 163,161,226 8 Federal Perkins Loan: Federal Perkins Loans (Legislative Proposal)................................................. Mandatory ...... ...... ...... -13.67 4,684,064 6
Department of Energy
Advanced Technology Vehicles Manufacturing Loans: Direct Auto Loans............................................................................................ Discretionary 5.01 3,400,000 1,133,333 4.75 2,500,000 1,250,000
2

Table 1. DIRECT LOANS: SUBSIDY RATES, OBLIGATIONS, AND AVERAGE LOAN SIZE — Continued (Dollars in thousands)
Subsidy rate (percent) Obligations Average loan size Subsidy rate
(percent) Obligations Average loan sizeAgency, Bureau, Program and Risk Category BEA Category
2016 2017
Title 17 Innovative Technology Loan Guarantee Program: Section 1703 FFB Loans (Self Pay)................................................................ Discretionary 0.00 8,000,000 1,600,000 0.00 2,900,000 322,222 Section 1703 FFB Loans (EERE).................................................................... Discretionary 14.06 200,000 200,000 13.55 200,000 200,000
Department of Homeland Security
Federal Emergency Management Agency: Community Disaster Loan Program................................................................ Discretionary 91.05 50,000 5,000 91.03 50,000 5,000
Department of Housing and Urban Development
Housing Programs: FFB Risk Sharing............................................................................................ Discretionary -10.91 250,000 6,944 -11.19 350,000 6,863
Department of State
Administration of Foreign Affairs: Repatriation Loans............................................................................................. Discretionary 53.18 2,000 2 53.42 2,000 2
International Assistance Programs
International Security Assistance: DSCA Loan Program....................................................................................... Discretionary 2.34 2,700,000 2,700,000 5.23 2,700,000 2,700,000
Overseas Private Investment Corporation: OPIC Direct Loans........................................................................................... Discretionary -5.80 1,000,000 25,000 -5.64 1,500,000 33,333
Department of Transportation
Federal Highway Administration:
Transportation, Infrastructure, Finance & Innovation (TIFIA) Direct Loans..................................................................................... Discretionary 6.85 3,672,993 306,083 6.73 3,735,795 466,974
Federal Railroad Administration: Railroad Rehabilitation and Improvement Financing Direct Loans.................. Discretionary 0.00 600,000 200,000 0.00 600,000 200,000
Department of the TreasuryDepartmental Offices: Community Development Financial Institutions Fund..................................... Discretionary 12.38 25,000 800 11.53 25,000 800 Bond Guarantee Program............................................................................... Discretionary 0.00 750,000 107,215 0.00 750,000 107,215
3

Table 1. DIRECT LOANS: SUBSIDY RATES, OBLIGATIONS, AND AVERAGE LOAN SIZE — Continued (Dollars in thousands)
Subsidy rate (percent) Obligations Average loan size Subsidy rate
(percent) Obligations Average loan sizeAgency, Bureau, Program and Risk Category BEA Category
2016 2017
Department of Veterans Affairs
Benefits Programs: Veterans Housing Benefit Program Fund: Acquired Direct Loans..................................................................................... Mandatory 1.71 7,414 195 1.92 9,134 199 Vendee Direct Loans....................................................................................... Mandatory -25.58 290,898 73 -23.58 392,119 74 Native American Veteran Housing Loan: Native American Direct Loans......................................................................... Mandatory -18.08 12,677 211 -18.62 12,905 215 Vocational Rehabilitation................................................................................. Mandatory 1.05 2,952 1 1.43 2,515 1
Small Business Administration
Business Loans: 7(m) Direct Microloans.................................................................................... Discretionary 8.87 35,000 742 9.08 44,431 574 Disaster Loans: Disaster Assistance Loans.............................................................................. Discretionary 12.10 1,100,000 40 14.42 1,100,000 38
National Infrastructure Bank
Infrastructure Direct Loans (Legislative Proposal)........................................... Mandatory ...... ...... ...... 12.26 1,000,000 250,000
4
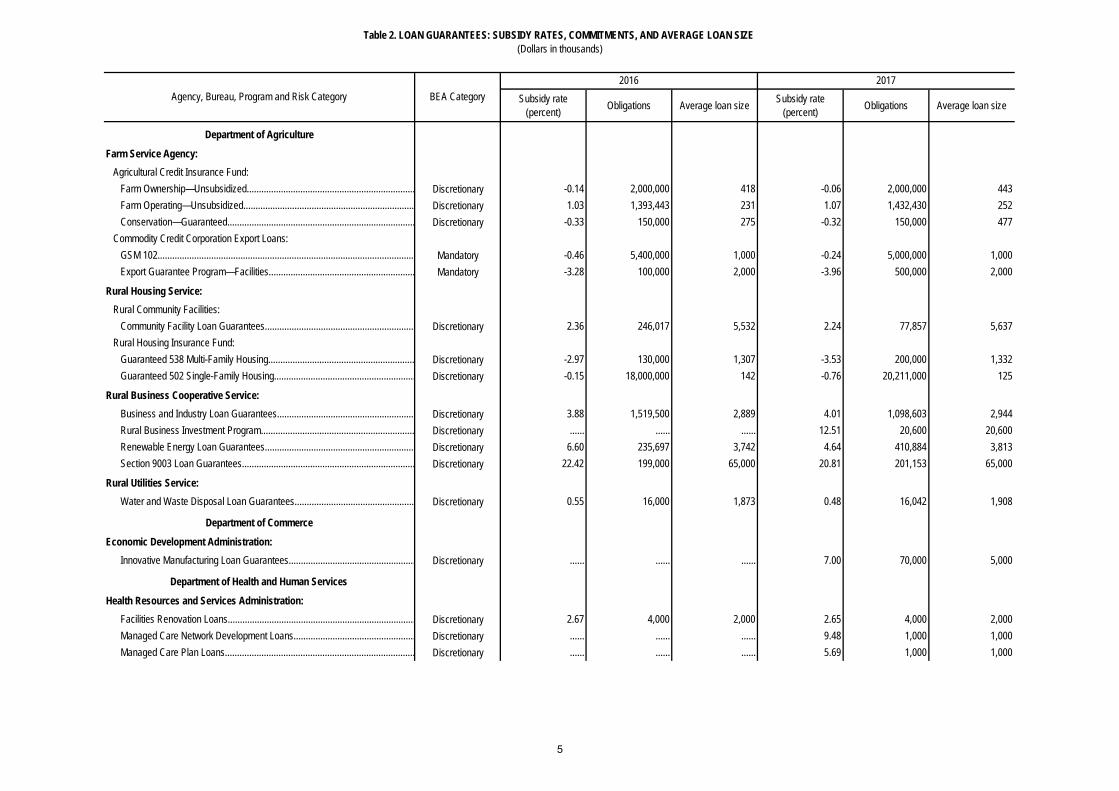
Table 2. LOAN GUARANTEES: SUBSIDY RATES, COMMITMENTS, AND AVERAGE LOAN SIZE (Dollars in thousands)
Subsidy rate (percent) Obligations Average loan size Subsidy rate
(percent) Obligations Average loan size
Department of Agriculture
Farm Service Agency: Agricultural Credit Insurance Fund: Farm Ownership—Unsubsidized..................................................................... Discretionary -0.14 2,000,000 418 -0.06 2,000,000 443 Farm Operating—Unsubsidized...................................................................... Discretionary 1.03 1,393,443 231 1.07 1,432,430 252 Conservation—Guaranteed............................................................................. Discretionary -0.33 150,000 275 -0.32 150,000 477 Commodity Credit Corporation Export Loans: GSM 102......................................................................................................... Mandatory -0.46 5,400,000 1,000 -0.24 5,000,000 1,000 Export Guarantee Program—Facilities............................................................ Mandatory -3.28 100,000 2,000 -3.96 500,000 2,000
Rural Housing Service: Rural Community Facilities: Community Facility Loan Guarantees............................................................. Discretionary 2.36 246,017 5,532 2.24 77,857 5,637 Rural Housing Insurance Fund: Guaranteed 538 Multi-Family Housing............................................................ Discretionary -2.97 130,000 1,307 -3.53 200,000 1,332 Guaranteed 502 Single-Family Housing.......................................................... Discretionary -0.15 18,000,000 142 -0.76 20,211,000 125
Rural Business Cooperative Service: Business and Industry Loan Guarantees........................................................ Discretionary 3.88 1,519,500 2,889 4.01 1,098,603 2,944 Rural Business Investment Program............................................................... Discretionary ...... ...... ...... 12.51 20,600 20,600 Renewable Energy Loan Guarantees............................................................. Discretionary 6.60 235,697 3,742 4.64 410,884 3,813 Section 9003 Loan Guarantees....................................................................... Discretionary 22.42 199,000 65,000 20.81 201,153 65,000
Rural Utilities Service: Water and Waste Disposal Loan Guarantees................................................. Discretionary 0.55 16,000 1,873 0.48 16,042 1,908
Department of Commerce
Economic Development Administration: Innovative Manufacturing Loan Guarantees.................................................... Discretionary ...... ...... ...... 7.00 70,000 5,000
Department of Health and Human Services
Health Resources and Services Administration: Facilities Renovation Loans............................................................................. Discretionary 2.67 4,000 2,000 2.65 4,000 2,000 Managed Care Network Development Loans.................................................. Discretionary ...... ...... ...... 9.48 1,000 1,000 Managed Care Plan Loans.............................................................................. Discretionary ...... ...... ...... 5.69 1,000 1,000
Agency, Bureau, Program and Risk Category BEA Category2016 2017
5

Table 2. LOAN GUARANTEES: SUBSIDY RATES, COMMITMENTS, AND AVERAGE LOAN SIZE — Continued (Dollars in thousands)
Subsidy rate (percent) Obligations Average loan size Subsidy rate
(percent) Obligations Average loan sizeAgency, Bureau, Program and Risk Category BEA Category
2016 2017
Department of Housing and Urban Development
Public and Indian Housing Programs: Title VI Indian Federal Guarantees Program................................................... Discretionary 11.46 27,000 3,250 11.20 27,000 4,500 Indian Housing Loan Guarantee...................................................................... Discretionary 0.63 1,150,793 175 0.41 1,200,000 175 Native Hawaiian Housing Loan Guarantees.................................................... Discretionary 0.51 25,000 235 -0.28 23,300 228
Community Planning and Development: Section 108 Community Development Loan Guarantee (Fee)........................ Discretionary 0.00 300,000 8,600 0.00 300,000 8,600
Housing Programs: FHA-Mutual Mortgage Insurance (MMI) Fund: Mutual Mortgage Insurance Program.............................................................. Discretionary -3.70 173,677,075 191 -4.42 204,163,423 203 MMI HECM...................................................................................................... Discretionary -0.69 15,138,000 289 -0.33 18,468,954 298 MMI Refi.......................................................................................................... Discretionary 0.00 300,000 147 0.00 200,000 147 FHA-General and Special Risk Insurance Fund: Apartment New Construction / Substantial Rehab.......................................... Discretionary -2.56 2,460,000 19,524 -2.76 2,630,000 19,481 Tax Credits...................................................................................................... Discretionary -1.27 2,360,000 9,112 -1.14 2,525,000 9,116 Apartment Refinances..................................................................................... Discretionary -4.14 4,980,000 9,486 -3.89 4,830,000 9,471 Housing Finance Agency Risk Sharing........................................................... Discretionary -0.93 105,000 7,500 -1.05 110,000 7,333 Qualified Participating Entity Risk Sharing...................................................... Discretionary -1.13 30,000 3,750 -0.31 55,000 6,111 Residential Care Facilities............................................................................... Discretionary -3.43 325,000 9,028 -5.85 325,000 9,028 Residential Care Facility Refinances............................................................... Discretionary -4.23 2,440,000 8,299 -5.14 2,440,000 7,974 Hospitals.......................................................................................................... Discretionary -3.22 665,000 166,250 -5.52 300,000 50,000 Other Rental.................................................................................................... Discretionary -1.17 70,000 17,500 -3.45 75,000 18,750 Title 1 Property Improvement.......................................................................... Discretionary -0.84 90,000 19 -1.07 90,000 21 Title 1 Manufactured Housing.......................................................................... Discretionary -4.20 30,000 49 -3.78 30,000 48
Government National Mortgage Association: Guarantees of Mortgage-backed Securities.................................................... Mandatory -0.29 330,200,000 159 -0.37 359,000,000 220
Department of the Interior
Bureau of Indian Affairs: Indian Guaranteed Loans................................................................................ Discretionary 5.90 112,766 3,442 6.31 104,869 3,442 Indian Insured Loans....................................................................................... Discretionary 3.28 1,000 114 6.89 1,000 114
6

Table 2. LOAN GUARANTEES: SUBSIDY RATES, COMMITMENTS, AND AVERAGE LOAN SIZE — Continued (Dollars in thousands)
Subsidy rate (percent) Obligations Average loan size Subsidy rate
(percent) Obligations Average loan sizeAgency, Bureau, Program and Risk Category BEA Category
2016 2017
International Assistance Programs
Agency for International Development: Loan Guarantees to Ukraine........................................................................... Discretionary 29.93 1,000,000 1,000,000 ...... ...... ...... Loan Guarantees to Iraq.................................................................................. Discretionary ...... ...... ...... 26.08 1,000,000 1,000,000 Loan Guarantees to Israel............................................................................... Discretionary 0.00 1,000,000 1,000,000 0.00 1,000,000 1,000,000 Loan Guarantees to Tunisia............................................................................ Discretionary 5.81 500,000 500,000 ...... ...... ...... Development Credit Authority—Loan Guarantees.......................................... Discretionary 4.53 1,106,200 21,273 4.95 1,798,000 29,967
Overseas Private Investment Corporation: OPIC Loan Guarantees................................................................................... Discretionary -5.93 2,400,000 100,000 -5.81 2,500,000 73,529 OPIC Investment Funds.................................................................................. Discretionary -10.91 300,000 60,000 -2.85 400,000 80,000 Limited Arbitral Award Coverage..................................................................... Discretionary -2.54 150,000 50,000 -2.35 150,000 50,000 Non-Honoring of Sovereign Guarantees......................................................... Discretionary -6.04 150,000 75,000 -6.00 150,000 75,000
Department of Transportation
Office of the Secretary: Minority Business Resource Center Loan Guarantees................................... Discretionary 2.50 13,440 500 2.36 14,364 500
Maritime Administration: Federal Ship Financing Loan Guarantees....................................................... Discretionary 8.11 514,400 257,200 ...... ...... ......
Department of Veterans Affairs
Benefits Programs: Housing Guaranteed Loans............................................................................. Mandatory 0.25 138,274,832 255 0.51 114,492,673 267
Small Business Administration
Business Loans: 7(a) General Business Loan Guarantees........................................................ Discretionary 0.00 26,500,000 368 0.00 27,000,000 384 Section 504 Certified Development Companies Debentures.......................... Discretionary 0.00 7,500,000 714 0.00 7,500,000 744 SBIC Debentures............................................................................................. Discretionary 0.00 4,000,000 33,538 0.00 4,000,000 37,726 Secondary Market Guarantee......................................................................... Discretionary 0.00 12,000,000 21,491 0.00 12,000,000 21,358 504 Commercial Real Estate (CRE) Refinance Program................................ Discretionary 0.00 7,500,000 822 0.00 7,500,000 866 Scale-Up Manufacturing Investment Company (Legislative Proposal)........... Mandatory ...... ...... ...... 25.00 5,000,000 100,000 Disaster Loans: Immediate Disaster Assistance....................................................................... Discretionary ...... ...... ...... 1.91 18,448 20 Expedited Disaster Assistance........................................................................ Discretionary ...... ...... ...... 2.25 59,451 74
7

Table 2. LOAN GUARANTEES: SUBSIDY RATES, COMMITMENTS, AND AVERAGE LOAN SIZE — Continued (Dollars in thousands)
Subsidy rate (percent) Obligations Average loan size Subsidy rate
(percent) Obligations Average loan sizeAgency, Bureau, Program and Risk Category BEA Category
2016 2017
Export-Import Bank of the United States
Long Term Guarantees................................................................................... Discretionary -6.61 9,670,000 138,143 -8.47 13,880,000 201,159 Medium Term Guarantees............................................................................... Discretionary 0.00 150,000 2,419 -1.14 250,000 2,907 Short Term Insurance...................................................................................... Discretionary 0.00 3,800,000 1,700 0.00 4,575,000 1,568 Medium Term Insurance.................................................................................. Discretionary -0.67 50,000 1,316 -3.38 100,000 1,639 Working Capital Fund...................................................................................... Discretionary 0.00 1,470,000 5,611 0.00 1,620,000 4,894
National Infrastructure Bank
Infrastructure Loan Guarantees (Legislative Proposal)................................... Mandatory ...... ...... ...... 14.83 200,000 200,000
8

Table 3. DIRECT LOANS: ASSUMPTIONS UNDERLYING THE 2016 SUBSIDY ESTIMATES (In percentages, unless noted otherwise)
Defaults, net of
recoveriesInterest Fees All other
Loan maturity (years)
Borrower rate
Grace period (years)
Upfront fees
Annual fees Other fees
Default rate 1
Recovery rate 2
Department of Agriculture
Farm Service Agency: Agricultural Credit Insurance Fund: Farm Ownership.......................................................................... -2.73 0.92 -2.92 ...... -0.74 32 3.56 ...... ...... ...... ...... 3.03 24.11 Farm Operating............................................................................ 4.31 6.91 -2.86 ...... 0.25 4 3.43 ...... ...... ...... ...... 11.40 3.92 Emergency Disaster.................................................................... 3.64 13.05 -10.48 ...... 1.07 9 4.43 ...... ...... ...... ...... 20.87 6.41 Indian Tribe Land Acquisition...................................................... -24.44 ...... -24.44 ...... ...... 40 5.00 ...... ...... ...... ...... ...... ...... Boll Weevil Eradication................................................................ -0.81 ...... -0.63 ...... -0.18 8 2.72 ...... ...... ...... ...... ...... ...... Indian Highly Fractionated Land................................................. -4.58 1.32 -5.79 ...... -0.11 40 3.76 ...... ...... ...... ...... 3.43 11.81 Farm Storage Facility Loans: Farm Storage Facility Loans....................................................... -1.64 0.01 -1.25 -0.27 -0.14 9 2.84 ...... 0.27 ...... ...... 0.03 50.00 Sugar Storage Facility Loans...................................................... -1.59 0.02 -1.43 ...... -0.17 15 3.10 ...... ...... ...... ...... 0.04 50.00
Rural Housing Service: Multi-Family Housing Revitalization:
Multi-Family Housing Relending Demo....................................... 31.26 ...... 31.27 ...... -0.01 30 1.00 3 ...... ...... ...... 0.03 100 (3) Multi-Family Housing Revitalization Seconds............................. 54.12 0.53 53.64 ...... -0.05 28 1.00 25 ...... ...... ...... 1.36 ...... Multi-Family Revitalization Zero.................................................. 52.68 0.39 52.46 ...... -0.17 30 ...... ...... ...... ...... ...... 1.24 ...... Rural Community Facilities:
Community Facility Loans........................................................... -8.04 3.67 -12.68 ...... 0.96 33 4.15 1 ...... ...... ...... 9.22 24.99 (3) Rural Housing Insurance Fund: Section 502 Single-Family Housing............................................ 6.75 4.90 1.54 ...... 0.31 34 4.07 ...... ...... ...... ...... 21.86 40.89 Section 515 Multi-Family Housing............................................... 29.63 0.75 28.81 ...... 0.07 30 1.00 ...... ...... ...... ...... 2.01 4.39 Section 504 Housing Repair........................................................ 13.03 -0.04 16.91 ...... -3.84 19 1.00 ...... ...... ...... ...... 0.23 112.12 Section 514 Farm Labor Housing............................................... 28.46 0.37 28.77 ...... -0.68 33 1.00 ...... ...... ...... ...... 0.81 ...... Section 524 Site Development.................................................... -1.53 ...... -2.46 ...... 0.93 2 4.07 ...... ...... ...... ...... ...... ...... Section 523 Self-Help Housing................................................... -0.30 ...... -0.35 ...... 0.05 2 3.00 3 ...... ...... ...... ...... ...... Single-Family Housing Credit Sales............................................ -4.87 2.29 -9.83 ...... 2.67 22 4.07 ...... ...... ...... ...... 13.21 61.04
Rural Business Cooperative Service: Rural Microenterprise Direct Loans............................................. 11.33 3.09 8.24 ...... ...... 19 2.00 1 ...... ...... ...... 4.70 3.97
Composition of Subsidy Loan Characteristics
Agency, Bureau, Program and Risk Category Subsidy rate
9

Table 3. DIRECT LOANS: ASSUMPTIONS UNDERLYING THE 2016 SUBSIDY ESTIMATES — Continued (In percentages, unless noted otherwise)
Defaults, net of
recoveriesInterest Fees All other
Loan maturity (years)
Borrower rate
Grace period (years)
Upfront fees
Annual fees Other fees
Default rate 1
Recovery rate 2
Composition of Subsidy Loan Characteristics
Agency, Bureau, Program and Risk Category Subsidy rate
Intermediary Relending Program................................................ 27.62 1.34 27.90 ...... -1.63 30 1.00 3 ...... ...... ...... 3.92 29.26 (3)
Rural Economic Development Loans.......................................... 13.39 ...... 13.42 ...... -0.04 10 ...... 1 ...... ...... ...... 0.26 100.00 (3)
Rural Utilities Service: Rural Water and Waste Disposal Loans:
Water and Waste Disposal Loans............................................... 2.61 0.14 4.80 ...... -2.33 38 3.00 1 ...... ...... ...... 0.56 72.32 (3) Rural Electrification and Telecommunications Loans:
FFB Electric Loans...................................................................... -4.97 0.06 -4.30 ...... -0.72 29 3.53 1 ...... ...... ...... 0.82 91.40 (3)
Treasury Telecommunications Loans......................................... 0.03 0.68 0.16 ...... -0.81 16 2.98 2 ...... ...... ...... 8.67 92.27 (3)
FFB Telecommunications Loans................................................. -2.74 0.36 0.17 ...... -3.27 16 3.03 ...... ...... ...... ...... 4.36 87.49 (3)
FFB Guaranteed Underwriting 4.................................................. 0.00 5.21 0.01 -5.23 ...... 22 3.39 ...... ...... 0.28 ...... 22.01 56.57 Rural Energy Savings Program 4................................................ 13.34 1.42 12.83 ...... -0.91 10 ...... ...... ...... ...... ...... 2.04 15.39 Distance Learning, Telemedicine, and Broadband Program: Broadband Treasury Rate Loans................................................ 22.80 25.02 0.17 ...... -2.40 17 2.97 3 ...... ...... ...... 75.04 59.59 (3)
Department of Commerce
National Oceanic and Atmospheric Administration: Fisheries Finance: Individual Fishing Quota Loans................................................... -3.27 0.14 -18.29 -0.41 15.29 24 5.80 ...... 0.50 ...... ...... 1.66 86.73 Traditional Direct Loans............................................................... -3.05 1.06 -11.71 -0.49 8.09 15 5.35 ...... 0.50 ...... ...... 2.07 35.75
Department of Education
Office of Postsecondary Education: Historically Black Colleges and Universities............................... 6.67 8.09 -0.03 -1.39 ...... 30 3.57 ...... ...... 0.13 ...... 15.65 ......
Office of Federal Student Aid: Teacher Education Assistance: TEACH Grants............................................................................. 13.05 0.21 6.23 ...... 6.61 10 5.47 ...... ...... ...... ...... 6.09 98.06 Federal Direct Student Loan: Consolidation............................................................................... 12.57 -0.98 3.10 ...... 10.45 20 5.97 ...... ...... ...... ...... 15.42 116.50 PLUS............................................................................................ -27.50 0.43 -29.86 -4.27 6.20 11 7.54 ...... 4.27 ...... ...... 9.65 108.36 Stafford......................................................................................... 5.64 0.29 1.35 -1.68 5.68 11 4.91 ...... 1.07 ...... ...... 23.63 112.87 Unsubsidized Stafford................................................................. -16.21 0.30 -21.63 -1.68 6.80 13 5.48 ...... 1.07 ...... ...... 15.88 109.95 Weighted Average of Total Obligations...................................... -5.29 -0.08 -11.33 -1.53 7.66 15 5.84 ...... 1.20 ...... ...... 16.12 112.24
10

Table 3. DIRECT LOANS: ASSUMPTIONS UNDERLYING THE 2016 SUBSIDY ESTIMATES — Continued (In percentages, unless noted otherwise)
Defaults, net of
recoveriesInterest Fees All other
Loan maturity (years)
Borrower rate
Grace period (years)
Upfront fees
Annual fees Other fees
Default rate 1
Recovery rate 2
Composition of Subsidy Loan Characteristics
Agency, Bureau, Program and Risk Category Subsidy rate
Department of Energy 4
Advanced Technology Vehicles Manufacturing Loans: Direct Auto Loans........................................................................ 5.01 5.11 ...... -0.10 ...... 10 2.48 3 0.10 ...... ...... 10.14 45.00 Title 17 Innovative Technology Loan Guarantee Program: Section 1703 FFB Loans (Self Pay)............................................ 0.00 10.12 -1.48 -8.64 ...... 27 3.25 4 8.64 ...... ...... 34.48 54.06 Section 1703 FFB Loans (EERE)............................................... 14.06 15.17 -1.11 ...... ...... 20 3.09 2 ...... ...... ...... 39.67 47.50
Department of Homeland SecurityFederal Emergency Management Agency: Community Disaster Loan Program............................................ 91.05 0.15 2.50 ...... 88.40 5 2.43 ...... ...... ...... ...... 0.19 ......
Department of Housing and Urban DevelopmentHousing Programs: FFB Risk Sharing......................................................................... -10.91 0.94 -14.92 -1.60 4.67 40 4.25 ...... 0.38 0.38 ...... 5.69 80.73
Department of State
Administration of Foreign Affairs: Repatriation Loans...................................................................... 53.18 37.51 0.18 ...... 15.49 ...... ...... * ...... ...... ...... 94.00 61.62
International Assistance Programs 4
Overseas Private Investment Corporation: OPIC Direct Loans....................................................................... -5.80 9.78 ...... -15.59 ...... 9 2.51 1 ...... 3.20 ...... 19.30 45.00
Department of Transportation 4
Federal Highway Administration: Transportation, Infrastructure, Finance & Innovation (TIFIA) Direct Loans................................................................. 6.85 7.04 -0.20 ...... ...... 40 3.44 5 ...... ...... ...... 37.67 50.00Federal Railroad Administration: Railroad Rehabilitation and Improvement Financing Direct Loans.............................................................................. 0.00 8.62 -2.59 -6.03 ...... 25 3.37 6 ...... ...... 6.03 42.81 51.84
Department of the TreasuryDepartmental Offices: Community Development Financial Institutions Fund................ 12.38 10.72 1.66 ...... ...... 13 2.94 ...... ...... ...... ...... 14.67 ...... Bond Guarantee Program 4......................................................... 0.00 4.45 -4.45 ...... ...... 27 3.95 ...... ...... ...... ...... 15.97 53.00
11

Table 3. DIRECT LOANS: ASSUMPTIONS UNDERLYING THE 2016 SUBSIDY ESTIMATES — Continued (In percentages, unless noted otherwise)
Defaults, net of
recoveriesInterest Fees All other
Loan maturity (years)
Borrower rate
Grace period (years)
Upfront fees
Annual fees Other fees
Default rate 1
Recovery rate 2
Composition of Subsidy Loan Characteristics
Agency, Bureau, Program and Risk Category Subsidy rate
Department of Veterans AffairsBenefits Programs: Veterans Housing Benefit Program Fund: Acquired Direct Loans................................................................. 1.71 14.50 -13.36 ...... 0.57 30 4.28 ...... ...... ...... ...... 55.33 36.96 Vendee Direct Loans................................................................... -25.58 1.11 -24.80 -2.00 0.11 30 5.09 ...... 2.01 ...... ...... 7.02 58.39 Native American Veteran Housing Loan: Native American Direct Loans..................................................... -18.08 ...... -25.99 -0.54 8.45 30 5.09 ...... 0.46 ...... 0.16 ...... ...... Vocational Rehabilitation............................................................. 1.05 ...... 1.05 ...... ...... 1 ...... ...... ...... ...... ...... ...... ......
Small Business Administration Business Loans: 7(m) Direct Microloans................................................................. 8.87 1.60 7.41 ...... -0.13 10 1.07 1 ...... ...... ...... 4.92 60.10 Disaster Loans: Disaster Assistance Loans.......................................................... 12.10 13.64 2.56 ...... -4.11 23 2.90 ...... ...... ...... ...... 27.88 18.13
4 Data reflect notional estimates. Estimates will be determined at the time of execution and will reflect the terms of the contracts and other characteristics.
3 Recovery rate estimate includes collection of delinquent payments.
1 Lifetime defaults as a percentage of disbursements.2 Recoveries as a percentage of lifetime defaults.
12

Table 4. LOAN GUARANTEES: ASSUMPTIONS UNDERLYING THE 2016 SUBSIDY ESTIMATES (In percentages, unless noted otherwise)
Defaults, net of
recoveriesInterest Fees All other
Loan maturity (years)
Borrower rate
Grace period (years)
Upfront fees
Annual fees Other fees
Default rate 1
Recovery rate 2
Percent guaranteed
Department of AgricultureFarm Service Agency: Agricultural Credit Insurance Fund: Farm Ownership—Unsubsidized....................................... -0.14 1.17 ...... -1.30 ...... 18 6.50 ...... 1.50 ...... ...... 1.44 10.04 90.00 Farm Operating—Unsubsidized......................................... 1.03 2.36 ...... -1.33 ...... 5 5.20 ...... 1.50 ...... ...... 2.70 5.71 90.00 Conservation—Guaranteed............................................... -0.33 0.97 ...... -1.30 ...... 6 6.50 ...... 1.50 ...... ...... 1.20 10.04 75.00 Commodity Credit Corporation Export Loans: GSM 102............................................................................ -0.46 0.26 ...... -0.72 ...... 2 2.00 ...... 0.91 ...... ...... 0.61 69.29 98.00 Export Guarantee Program—Facilities.............................. -3.28 0.39 ...... -3.68 ...... 6 2.00 ...... 3.85 ...... ...... 0.86 63.88 95.00
Rural Housing Service: Rural Community Facilities: Community Facility Loan Guarantees................................ 2.36 3.24 ...... -0.88 ...... 24 4.15 ...... 0.88 ...... ...... 3.80 3.52 88.18 Rural Housing Insurance Fund: Guaranteed 538 Multi-Family Housing............................... -2.97 5.41 ...... -8.38 ...... 36 5.09 ...... 1.17 0.50 ...... 7.77 24.73 89.87 Guaranteed 502 Single-Family Housing............................ -0.15 6.49 ...... -6.64 ...... 30 5.09 ...... 2.75 0.50 ...... 8.03 2.03 90.00
Rural Business Cooperative Service: Business and Industry Loan Guarantees........................... 3.88 7.93 ...... -4.06 ...... 20 5.30 ...... 2.92 0.50 ...... 10.99 19.24 78.42 Renewable Energy Loan Guarantees................................ 6.60 7.91 ...... -1.32 ...... 9 5.88 ...... 1.00 0.25 ...... 10.41 17.67 79.90 Section 9003 Loan Guarantees 3....................................... 22.42 26.39 ...... -5.58 1.61 19 7.34 3 1.97 0.83 ...... 41.41 30.00 69.50
Rural Utilities Service: Water and Waste Disposal Loan Guarantees.................... 0.55 1.41 ...... -0.86 ...... 20 4.15 ...... 0.86 ...... ...... 1.66 ...... 86.00
Department of Health and Human ServicesHealth Resources and Services Administration: Facilities Renovation Loans............................................... 2.67 2.67 ...... ...... ...... 20 8.25 ...... ...... ...... ...... 13.60 77.44 80.00
Department of Housing and Urban Development
Public and Indian Housing Programs: Title VI Indian Federal Guarantees Program..................... 11.46 11.46 ...... ...... ...... 20 6.00 ...... ...... ...... ...... 14.96 ...... 95.00 Indian Housing Loan Guarantee........................................ 0.63 2.97 ...... -2.93 0.59 30 5.00 ...... 1.50 0.15 ...... 5.87 40.00 100.00 Native Hawaiian Housing Loan Guarantees...................... 0.51 1.51 ...... -1.00 ...... 30 5.00 ...... 1.00 ...... ...... 5.15 69.51 100.00
Agency, Bureau, Program and Risk Category Subsidy rate
Composition of Subsidy Loan Characteristics
13

Table 4. LOAN GUARANTEES: ASSUMPTIONS UNDERLYING THE 2016 SUBSIDY ESTIMATES — Continued (In percentages, unless noted otherwise)
Defaults, net of
recoveriesInterest Fees All other
Loan maturity (years)
Borrower rate
Grace period (years)
Upfront fees
Annual fees Other fees
Default rate 1
Recovery rate 2
Percent guaranteed
Agency, Bureau, Program and Risk Category Subsidy rate
Composition of Subsidy Loan Characteristics
Community Planning and Development: Section 108 Community Development Loan Guarantee (Fee).............................................................. 0.00 2.58 ...... -2.58 ...... 10 3.20 ...... 2.58 ...... ...... 13.14 78.64 100.00
Housing Programs: FHA-Mutual Mortgage Insurance (MMI) Fund: Mutual Mortgage Insurance Program................................. -3.70 2.27 ...... -6.70 0.73 28 5.10 ...... 1.75 0.85 ...... 4.44 38.74 100.00 MMI HECM......................................................................... -0.69 5.76 ...... -6.45 ...... 35 5.46 ...... 1.23 1.25 ...... 44.68 104.65 100.00 MMI Refi............................................................................. 0.00 7.43 ...... -7.43 ...... 30 5.10 ...... 1.75 0.85 ...... 21.14 56.40 100.00 FHA-General and Special Risk Insurance Fund: Apartment New Construction / Substantial Rehab............. -2.56 2.16 ...... -4.72 ...... 40 5.68 ...... 0.50 0.50 0.80 8.15 69.45 100.00 Tax Credits......................................................................... -1.27 1.07 ...... -2.34 ...... 40 5.63 ...... 0.42 0.42 0.20 3.66 70.38 100.00 Apartment Refinances........................................................ -4.14 0.30 ...... -4.44 ...... 35 5.26 ...... 0.61 0.45 0.23 0.93 66.41 100.00 Housing Finance Agency Risk Sharing.............................. -0.93 0.91 ...... -1.84 ...... 40 5.65 ...... 0.38 0.38 ...... 7.68 82.79 72.00 Qualified Participating Entity Risk Sharing......................... -1.13 0.45 ...... -1.58 ...... 18 5.52 ...... 0.38 0.38 ...... 0.54 1.24 50.00 Residential Care Facilities.................................................. -3.43 4.00 ...... -7.43 ...... 40 5.71 ...... 0.67 0.67 0.80 8.83 51.95 100.00 Residential Care Facility Refinances................................. -4.23 2.31 ...... -6.54 ...... 35 5.25 ...... 0.76 0.55 0.30 4.67 41.36 100.00 Hospitals............................................................................ -3.22 3.23 ...... -6.45 ...... 25 5.52 ...... 0.71 0.57 0.55 11.07 64.22 100.00 Other Rental....................................................................... -1.17 4.10 ...... -5.27 ...... 40 5.68 ...... 0.54 0.54 0.80 13.49 68.14 100.00 Title 1 Property Improvement............................................. -0.84 3.89 ...... -4.73 ...... 20 13.00 ...... ...... 1.00 ...... 6.67 34.90 90.00 Title 1 Manufactured Housing............................................ -4.20 5.92 ...... -10.12 ...... 20 13.00 ...... 2.25 1.00 ...... 8.69 19.09 90.00Government National Mortgage Association: Guarantees of Mortgage-backed Securities....................... -0.29 0.08 ...... -0.38 0.01 29 4.31 ...... ...... 0.06 0.02 0.40 78.86 100.00
Department of the Interior
Bureau of Indian Affairs: Indian Guaranteed Loans................................................... 5.90 4.18 3.52 -1.80 ...... 12 6.87 ...... 2.00 ...... ...... 9.63 50.46 90.00 Indian Insured Loans.......................................................... 3.28 4.18 ...... -0.90 ...... 16 6.87 ...... 1.00 ...... ...... 9.63 50.46 90.00
International Assistance Programs 3
Agency for International Development: Development Credit Authority—Loan Guarantees............. 4.53 6.98 ...... -2.45 ...... 9 4.90 2 1.03 1.20 ...... 15.91 ...... 50.00
Overseas Private Investment Corporation: OPIC Loan Guarantees...................................................... -5.93 5.40 ...... -11.33 ...... 9 2.20 5 ...... 2.20 ...... 10.18 48.28 100.00 OPIC Investment Funds..................................................... -10.91 ...... ...... -10.91 ...... 10 10.00 10 ...... 1.50 3.50 ...... ...... 100.00
14

Table 4. LOAN GUARANTEES: ASSUMPTIONS UNDERLYING THE 2016 SUBSIDY ESTIMATES — Continued (In percentages, unless noted otherwise)
Defaults, net of
recoveriesInterest Fees All other
Loan maturity (years)
Borrower rate
Grace period (years)
Upfront fees
Annual fees Other fees
Default rate 1
Recovery rate 2
Percent guaranteed
Agency, Bureau, Program and Risk Category Subsidy rate
Composition of Subsidy Loan Characteristics
Limited Arbitral Award Coverage....................................... -2.54 3.45 ...... -5.99 ...... 20 5.50 2 6.00 ...... ...... 34.04 85.00 100.00 Non-Honoring of Sovereign Guarantees............................ -6.04 2.51 ...... -8.56 ...... 14 4.73 3 ...... ...... 1.30 5.89 53.40 100.00
Department of Transportation
Office of the Secretary: Minority Business Resource Center Loan Guarantees...... 2.50 2.50 ...... ...... ...... 2 6.50 ...... ...... ...... ...... 2.58 ...... 75.00
Maritime Administration:
Federal Ship Financing Loan Guarantees 3....................... 8.11 13.54 ...... -5.43 ...... 25 2.20 ...... 5.43 ...... ...... 22.06 28.00 100.00
Department of Veterans Affairs
Benefits Programs: Housing Guaranteed Loans............................................... 0.25 1.65 ...... -1.40 ...... 30 5.09 ...... 1.24 ...... 0.02 4.52 57.95 25.00
Small Business Administration
Business Loans: 7(a) General Business Loan Guarantees........................... 0.00 4.21 ...... -4.21 ...... 16 5.38 ...... 2.68 0.47 ...... 6.98 37.76 73.10 Section 504 Certified Development Companies Debentures...................................................................... 0.00 7.32 ...... -8.05 0.72 19 4.40 ...... 0.85 1.10 ...... 10.29 23.60 100.00 SBIC Debentures............................................................... 0.00 6.68 ...... -6.76 0.07 10 4.04 ...... 3.00 0.67 ...... 24.29 73.81 100.00 Secondary Market Guarantee............................................ 0.00 ...... ...... ...... ...... 20 2.81 ...... ...... ...... ...... ...... ...... 100.00 504 Commercial Real Estate (CRE) Refinance Program.......................................................................... 0.00 7.62 ...... -8.34 0.72 19 4.26 ...... 0.85 1.14 ...... 10.66 23.12 100.00
Export-Import Bank of the United States
Long Term Guarantees...................................................... -6.61 1.69 ...... -8.30 ...... 11 3.00 ...... 8.68 ...... 0.12 5.11 64.21 100.00 Medium Term Guarantees................................................. 0.00 6.54 ...... -6.54 ...... 5 5.57 ...... 6.45 ...... 0.12 12.04 44.21 100.00 Short Term Insurance........................................................ 0.00 1.99 ...... -1.99 ...... 1 6.50 ...... 1.99 ...... ...... 2.47 18.76 100.00 Medium Term Insurance.................................................... -0.67 4.18 ...... -4.85 ...... 5 5.50 ...... 4.85 ...... ...... 7.02 38.87 100.00 Working Capital Fund......................................................... 0.00 0.49 ...... -0.49 ...... 1 0.67 ...... 0.49 ...... ...... 0.61 18.76 100.001 Lifetime defaults as a percentage of disbursements.2 Recoveries as a percentage of lifetime defaults.3 Data reflect notional estimates. Estimates will be determined at the time of execution and will reflect the terms of the contracts and other characteristics.
15


Table 5. DIRECT LOANS: ASSUMPTIONS UNDERLYING THE 2017 SUBSIDY ESTIMATES (In percentages, unless noted otherwise)
Defaults, net of
recoveriesInterest Fees All other
Loan maturity (years)
Borrower rate
Grace period (years)
Upfront fees
Annual fees Other fees
Default rate 1
Recovery rate 2
Department of Agriculture
Farm Service Agency: Agricultural Credit Insurance Fund: Farm Ownership......................................................................... -1.62 0.14 -1.11 ...... -0.64 40 3.51 ...... ...... ...... ...... 0.45 28.65 Farm Operating.......................................................................... 4.26 6.97 -3.00 ...... 0.29 22 3.65 ...... ...... ...... ...... 9.59 4.21 Emergency Disaster................................................................... 5.59 9.27 -3.87 ...... 0.20 40 3.65 ...... ...... ...... ...... 14.48 7.45 Indian Tribe Land Acquisition..................................................... -21.54 ...... -21.54 ...... ...... 40 5.00 ...... ...... ...... ...... ...... ...... Boll Weevil Eradication............................................................... -0.66 ...... -0.52 ...... -0.14 10 2.89 ...... ...... ...... ...... ...... ...... Indian Highly Fractionated Land................................................. 25.50 0.04 26.85 ...... -1.38 30 1.00 ...... ...... ...... ...... 0.09 14.33 Farm Storage Facility Loans: Farm Storage Facility Loans....................................................... -1.30 0.02 -1.01 -0.27 -0.05 9 2.99 ...... 0.27 ...... ...... 0.05 50.00 Sugar Storage Facility Loans..................................................... -2.20 0.03 -2.22 ...... -0.01 15 3.21 ...... ...... ...... ...... 0.07 50.00
Rural Housing Service: Multi-Family Housing Revitalization: Multi-Family Housing Revitalization Seconds............................. 57.01 0.43 56.65 ...... -0.06 29 1.00 26 ...... ...... ...... 1.17 ...... Multi-Family Revitalization Zero................................................. 51.29 0.34 51.14 ...... -0.19 30 ...... ...... ...... ...... ...... 1.06 ...... Rural Community Facilities: Community Facility Loans.......................................................... -2.56 3.44 -5.65 ...... -0.34 33 3.78 1 ...... ...... ...... 7.13 2.86 Rural Housing Insurance Fund: Section 502 Single-Family Housing............................................ 6.77 4.71 1.83 ...... 0.23 34 4.16 ...... ...... ...... ...... 22.21 41.46 Section 515 Multi-Family Housing.............................................. 29.60 0.66 30.03 ...... -1.08 30 1.00 ...... ...... ...... ...... 1.78 4.02 Section 504 Housing Repair....................................................... 13.94 -0.03 17.73 ...... -3.76 19 1.00 ...... ...... ...... ...... 0.24 102.58 Section 514 Farm Labor Housing............................................... 29.56 0.26 29.96 ...... -0.65 32 1.00 ...... ...... ...... ...... 0.68 18.88 Section 524 Site Development................................................... 2.22 ...... 1.38 ...... 0.84 2 4.16 4 ...... ...... ...... ...... ...... Section 523 Self-Help Housing................................................... 8.34 4.69 3.60 ...... 0.05 2 3.00 4 ...... ...... ...... 5.17 ...... Single-Family Housing Credit Sales........................................... -2.36 2.27 -9.42 ...... 4.79 22 4.16 ...... ...... ...... ...... 13.16 61.20
Rural Business Cooperative Service: Rural Microenterprise Direct Loans............................................ 12.40 2.68 9.72 ...... ...... 19 2.00 1 ...... ...... ...... 4.19 4.45 Intermediary Relending Program................................................ 28.99 1.61 29.09 ...... -1.70 30 1.00 3 ...... ...... ...... 3.49 0.05 Rural Economic Development Loans......................................... 14.23 0.02 14.24 ...... -0.03 10 ...... 1 ...... ...... ...... 0.04 ......
Rural Utilities Service: Rural Water and Waste Disposal Loans: Water and Waste Disposal Loans.............................................. 4.34 0.08 9.40 ...... -5.14 39 2.82 1 ...... ...... ...... 0.17 ......
Agency, Bureau, Program and Risk Category Subsidy rate
Composition of Subsidy Loan Characteristics
17

Table 5. DIRECT LOANS: ASSUMPTIONS UNDERLYING THE 2017 SUBSIDY ESTIMATES — Continued (In percentages, unless noted otherwise)
Defaults, net of
recoveriesInterest Fees All other
Loan maturity (years)
Borrower rate
Grace period (years)
Upfront fees
Annual fees Other fees
Default rate 1
Recovery rate 2
Agency, Bureau, Program and Risk Category Subsidy rate
Composition of Subsidy Loan Characteristics
Rural Electrification and Telecommunications Loans: FFB Electric Loans..................................................................... -4.92 0.02 -4.34 ...... -0.61 29 3.66 1 ...... ...... ...... 0.05 ...... Treasury Telecommunications Loans......................................... 0.89 0.40 0.18 ...... 0.32 16 3.11 1 ...... ...... ...... 0.58 ...... FFB Telecommunications Loans................................................ -2.53 0.28 0.03 ...... -2.85 15 3.19 1 ...... ...... ...... 0.46 ......
Department of Commerce
National Oceanic and Atmospheric Administration: Fisheries Finance: Individual Fishing Quota Loans.................................................. -0.22 0.08 -21.74 -0.69 22.13 24 5.80 ...... 0.50 ...... ...... 1.39 89.25 Traditional Direct Loans.............................................................. -0.36 0.94 -14.32 -0.52 13.54 15 5.35 ...... 0.50 ...... ...... 2.10 43.08
Department of EducationOffice of Postsecondary Education: Historically Black Colleges and Universities............................... 7.14 8.01 0.50 -1.38 ...... 30 3.66 ...... ...... 0.13 ...... 15.81 ......
Office of Federal Student Aid: Teacher Education Assistance: TEACH Grants............................................................................ 11.88 0.25 4.60 ...... 7.04 10 5.74 ...... ...... ...... ...... 6.14 97.22 Federal Direct Student Loan: Consolidation.............................................................................. 13.75 -0.75 4.43 ...... 10.06 20 5.99 ...... ...... ...... ...... 17.70 114.42 Consolidation (Legislative Proposal).......................................... 13.45 -0.67 4.26 ...... 9.85 19 5.99 ...... ...... ...... ...... 17.61 114.19 PLUS.......................................................................................... -27.78 0.35 -30.81 -4.00 6.67 11 7.79 ...... 4.00 ...... ...... 8.25 109.08 PLUS (Legislative Proposal)....................................................... -29.00 0.41 -31.82 -4.00 6.41 11 7.79 ...... 4.00 ...... ...... 8.27 108.18 Stafford....................................................................................... 6.29 0.46 1.25 -1.00 5.59 11 5.21 ...... 1.00 ...... ...... 24.14 112.40 Stafford (Legislative Proposal)................................................... 5.25 0.51 0.38 -1.00 5.37 11 5.21 ...... 1.00 ...... ...... 24.16 112.13 Unsubsidized Stafford................................................................ -12.80 0.38 -19.65 -1.00 7.47 13 5.75 ...... 1.00 ...... ...... 16.65 109.83 Unsubsidized Stafford (Legislative Proposal)............................. -14.48 0.46 -21.05 -1.00 7.11 13 5.75 ...... 1.00 ...... ...... 16.67 109.21 Weighted Average of Total Obligations...................................... -3.99 0.05 -10.71 -1.15 7.82 14 5.83 ...... 1.09 ...... ...... 16.94 111.51 Weighted Average of Total Obligations (Legislative Proposal).............................................................. -5.08 0.12 -11.60 -1.15 7.54 14 5.83 ...... 1.09 ...... ...... 16.93 111.02 Federal Perkins Loan: Federal Perkins Loans (Legislative Proposal)............................ -13.67 0.51 -20.50 -1.00 7.32 12 5.69 ...... 1.00 ...... ...... 19.52 109.74
Department of Energy 3
Advanced Technology Vehicles Manufacturing Loans: Direct Auto Loans....................................................................... 4.75 4.85 ...... -0.10 ...... 10 2.68 3 0.10 ...... ...... 9.73 45.00
18

Table 5. DIRECT LOANS: ASSUMPTIONS UNDERLYING THE 2017 SUBSIDY ESTIMATES — Continued (In percentages, unless noted otherwise)
Defaults, net of
recoveriesInterest Fees All other
Loan maturity (years)
Borrower rate
Grace period (years)
Upfront fees
Annual fees Other fees
Default rate 1
Recovery rate 2
Agency, Bureau, Program and Risk Category Subsidy rate
Composition of Subsidy Loan Characteristics
Title 17 Innovative Technology Loan Guarantee Program: Section 1703 FFB Loans (Self Pay)........................................... 0.00 10.40 -1.37 -9.02 ...... 25 3.32 3 9.02 ...... ...... 33.67 53.19 Section 1703 FFB Loans (EERE)............................................... 13.55 14.65 -1.10 ...... ...... 20 3.22 2 ...... ...... ...... 38.71 47.50
Department of Homeland Security
Federal Emergency Management Agency: Community Disaster Loan Program........................................... 91.03 0.17 2.62 ...... 88.24 5 2.65 ...... ...... ...... ...... 0.21 ......
Department of Housing and Urban Development
Housing Programs: FFB Risk Sharing....................................................................... -11.19 0.01 -13.92 -0.97 3.69 40 5.15 ...... 0.25 0.25 ...... 0.10 84.86
Department of State
Administration of Foreign Affairs: Repatriation Loans..................................................................... 53.42 37.74 0.26 ...... 15.42 ...... ...... * ...... ...... ...... 94.00 61.62
International Assistance Programs 3
Overseas Private Investment Corporation: OPIC Direct Loans...................................................................... -5.64 9.83 ...... -15.48 ...... 9 2.72 1 ...... 3.20 ...... 19.55 45.00
Department of Transportation 3
Federal Highway Administration: Transportation, Infrastructure, Finance & Innovation (TIFIA) Direct Loans................................................................ 6.73 6.67 0.06 ...... ...... 40 3.48 5 ...... ...... ...... 31.81 50.00
Federal Railroad Administration: Railroad Rehabilitation and Improvement Financing Direct Loans............................................................................ 0.00 8.18 -2.53 -5.66 ...... 25 3.49 6 ...... ...... 5.66 39.99 50.55
Department of the Treasury
Departmental Offices: Community Development Financial Institutions Fund................ 11.53 9.97 1.56 ...... ...... 13 3.06 ...... ...... ...... ...... 13.77 ...... Bond Guarantee Program 3........................................................ 0.00 4.46 -4.46 ...... ...... 27 3.68 ...... ...... ...... ...... 8.04 7.53
Department of Veterans Affairs
Benefits Programs: Veterans Housing Benefit Program Fund: Acquired Direct Loans................................................................ 1.92 13.91 -12.61 ...... 0.62 30 4.35 ...... ...... ...... ...... 47.30 32.87
19

Table 5. DIRECT LOANS: ASSUMPTIONS UNDERLYING THE 2017 SUBSIDY ESTIMATES — Continued (In percentages, unless noted otherwise)
Defaults, net of
recoveriesInterest Fees All other
Loan maturity (years)
Borrower rate
Grace period (years)
Upfront fees
Annual fees Other fees
Default rate 1
Recovery rate 2
Agency, Bureau, Program and Risk Category Subsidy rate
Composition of Subsidy Loan Characteristics
Vendee Direct Loans.................................................................. -23.58 1.51 -25.20 ...... 0.11 30 5.25 ...... ...... ...... ...... 6.25 52.91 Native American Veteran Housing Loan: Native American Direct Loans.................................................... -18.62 ...... -26.37 -0.53 8.28 30 5.25 ...... 0.45 ...... 0.15 ...... ...... Vocational Rehabilitation............................................................ 1.43 ...... 1.43 ...... ...... 1 ...... ...... ...... ...... ...... ...... ......
Environmental Protection Agency
Water Infrastructure Direct Loans 3............................................ 1.53 1.53 ...... ...... ...... 33 3.58 5 ...... ...... ...... 9.75 66.64
Small Business Administration
Business Loans: 7(m) Direct Microloans............................................................... 9.08 2.26 7.26 ...... -0.44 10 1.68 1 ...... ...... ...... 10.31 71.68 Disaster Loans: Disaster Assistance Loans......................................................... 14.42 13.30 5.62 ...... -4.49 25 2.81 ...... ...... ...... ...... 29.65 19.81
National Infrastructure Bank
Infrastructure Direct Loans (Legislative Proposal) 3................... 12.26 16.08 -2.93 -0.89 ...... ...... ...... ...... 0.89 ...... ...... 60.09 45.00
3 Data reflect notional estimates. Estimates will be determined at the time of execution and will reflect the terms of the contracts and other characteristics.
2 Recoveries as a percentage of lifetime defaults.
1 Lifetime defaults as a percentage of disbursements.* Nonzero amounts round to zero based on units for this column.
20

Table 6. LOAN GUARANTEES: ASSUMPTIONS UNDERLYING THE 2017 SUBSIDY ESTIMATES (In percentages, unless noted otherwise)
Defaults, net of
recoveriesInterest Fees All other
Loan maturity (years)
Borrower rate
Grace period (years)
Upfront fees
Annual fees Other fees
Default rate 1
Recovery rate 2
Percent guaranteed
Department of Agriculture
Farm Service Agency: Agricultural Credit Insurance Fund: Farm Ownership—Unsubsidized....................................... -0.06 1.17 ...... -1.24 ...... 18 6.30 ...... 1.50 ...... ...... 1.46 10.04 90.00 Farm Operating—Unsubsidized......................................... 1.07 2.34 ...... -1.27 ...... 5 5.20 ...... 1.50 ...... ...... 2.70 5.71 90.00 Conservation—Guaranteed............................................... -0.32 0.98 ...... -1.30 ...... 6 6.30 ...... 1.50 ...... ...... 1.22 10.04 75.00 Commodity Credit Corporation Export Loans: GSM 102............................................................................ -0.24 0.39 ...... -0.63 ...... 2 2.00 ...... 0.91 ...... ...... 0.88 67.12 98.00 Export Guarantee Program—Facilities.............................. -3.96 0.65 ...... -4.61 ...... 7 2.00 ...... 4.60 ...... ...... 1.53 69.88 95.00
Rural Housing Service: Rural Community Facilities: Community Facility Loan Guarantees................................ 2.24 3.12 ...... -0.88 ...... 24 3.78 ...... 0.88 ...... ...... 3.91 8.47 88.22 Rural Housing Insurance Fund: Guaranteed 538 Multi-Family Housing............................... -3.53 3.99 ...... -7.52 ...... 36 4.16 ...... 1.15 0.50 ...... 5.86 26.29 89.88 Guaranteed 502 Single-Family Housing............................ -0.76 3.49 ...... -4.25 ...... 30 4.56 ...... 1.00 0.35 ...... 4.34 0.74 90.00
Rural Business Cooperative Service: Business and Industry Loan Guarantees........................... 4.01 8.04 ...... -4.03 ...... 20 5.22 ...... 2.92 0.50 ...... 11.42 24.09 75.98 Rural Business Investment Program.................................. 12.51 19.39 ...... -6.87 ...... 10 4.56 ...... 3.00 1.00 ...... 44.84 54.98 100.00 Renewable Energy Loan Guarantees................................ 4.64 5.91 ...... -1.27 ...... 10 6.12 ...... 1.00 0.25 ...... 7.80 16.75 79.14 Section 9003 Loan Guarantees 3....................................... 20.81 24.09 ...... -3.72 0.44 15 4.75 2 1.36 0.66 ...... 35.41 24.98 68.28
Rural Utilities Service: Water and Waste Disposal Loan Guarantees.................... 0.48 1.35 ...... -0.87 ...... 20 3.78 ...... 0.87 ...... ...... 1.59 ...... 86.00
Department of Commerce
Economic Development Administration: Innovative Manufacturing Loan Guarantees...................... 7.00 9.40 ...... -2.40 ...... 13 7.50 ...... 2.00 0.25 ...... 14.38 29.93 80.00
Department of Health and Human Services
Health Resources and Services Administration: Facilities Renovation Loans............................................... 2.65 2.65 ...... ...... ...... 20 8.25 ...... ...... ...... ...... 13.60 77.44 80.00 Managed Care Network Development Loans.................... 9.48 10.47 ...... -0.98 ...... 10 10.00 ...... 1.00 ...... ...... 19.78 40.00 90.00 Managed Care Plan Loans................................................ 5.69 6.68 ...... -0.98 ...... 5 10.00 ...... ...... ...... 1.00 17.10 60.00 90.00
Agency, Bureau, Program and Risk Category Subsidy rate
Composition of Subsidy Loan Characteristics
21

Table 6. LOAN GUARANTEES: ASSUMPTIONS UNDERLYING THE 2017 SUBSIDY ESTIMATES — Continued (In percentages, unless noted otherwise)
Defaults, net of
recoveriesInterest Fees All other
Loan maturity (years)
Borrower rate
Grace period (years)
Upfront fees
Annual fees Other fees
Default rate 1
Recovery rate 2
Percent guaranteed
Agency, Bureau, Program and Risk Category Subsidy rate
Composition of Subsidy Loan Characteristics
Department of Housing and Urban Development
Public and Indian Housing Programs: Title VI Indian Federal Guarantees Program..................... 11.20 11.20 ...... ...... ...... 20 6.00 ...... ...... ...... ...... 14.96 ...... 95.00 Indian Housing Loan Guarantee........................................ 0.41 3.82 ...... -3.87 0.45 30 5.00 ...... 1.50 0.25 ...... 6.85 33.00 100.00 Native Hawaiian Housing Loan Guarantees...................... -0.28 0.72 ...... -1.00 ...... 30 5.00 ...... 1.00 ...... ...... 5.15 89.84 100.00
Community Planning and Development: Section 108 Community Development Loan Guarantee (Fee).............................................................. 0.00 2.59 ...... -2.59 ...... 10 2.85 ...... 2.59 ...... ...... 13.29 78.64 100.00
Housing Programs: FHA-Mutual Mortgage Insurance (MMI) Fund: Mutual Mortgage Insurance Program................................. -4.42 2.42 ...... -7.79 0.94 30 5.24 ...... 1.75 0.80 ...... 6.77 57.08 100.00 MMI HECM......................................................................... -0.33 7.06 ...... -7.38 ...... 35 6.11 ...... 1.23 1.25 ...... 75.58 132.98 100.00 MMI Refi............................................................................. 0.00 8.27 ...... -8.27 ...... 30 5.24 ...... 1.75 0.85 ...... 25.02 58.76 100.00 FHA-General and Special Risk Insurance Fund: Apartment New Construction / Substantial Rehab............. -2.76 1.49 ...... -4.24 ...... 40 5.45 ...... 0.45 0.45 0.80 4.83 68.68 100.00 Tax Credits......................................................................... -1.14 0.95 ...... -2.09 ...... 40 5.39 ...... 0.31 0.31 0.20 3.04 67.87 100.00 Apartment Refinances........................................................ -3.89 0.28 ...... -4.17 ...... 35 5.00 ...... 0.50 0.40 0.23 0.83 63.99 100.00 Housing Finance Agency Risk Sharing.............................. -1.05 0.03 ...... -1.08 ...... 40 5.17 ...... 0.25 0.25 ...... 0.17 85.12 72.00 Qualified Participating Entity Risk Sharing......................... -0.31 0.35 ...... -0.67 ...... 18 5.23 ...... 0.25 0.25 ...... 0.39 0.02 50.00 Residential Care Facilities.................................................. -5.85 2.52 ...... -8.37 ...... 40 5.47 ...... 0.67 0.67 0.80 5.53 51.16 100.00 Residential Care Facility Refinances................................. -5.14 1.54 ...... -6.68 ...... 35 5.02 ...... 0.76 0.55 0.30 3.06 40.33 100.00 Hospitals............................................................................ -5.52 1.14 ...... -6.66 ...... 25 5.10 ...... 0.71 0.57 0.55 3.50 56.48 100.00 Other Rental....................................................................... -3.45 1.51 ...... -4.97 ...... 40 5.46 ...... 0.48 0.48 0.80 5.15 69.85 100.00 Title 1 Property Improvement............................................. -1.07 4.66 ...... -5.72 ...... 20 8.66 ...... ...... 1.00 ...... 6.47 15.86 90.00 Title 1 Manufactured Housing............................................ -3.78 6.18 ...... -9.97 ...... 20 8.66 ...... 2.25 1.00 ...... 9.56 18.31 90.00Government National Mortgage Association: Guarantees of Mortgage-backed Securities....................... -0.37 0.03 ...... -0.41 0.01 29 3.87 ...... ...... 0.06 0.02 0.38 95.99 100.00
Department of the Interior
Bureau of Indian Affairs: Indian Guaranteed Loans................................................... 6.31 4.39 3.71 -1.80 ...... 12 6.87 ...... 2.00 ...... ...... 9.88 32.78 90.00 Indian Insured Loans.......................................................... 6.89 7.57 0.22 -0.90 ...... 16 6.87 ...... 1.00 ...... ...... 9.88 5.00 90.00
22

Table 6. LOAN GUARANTEES: ASSUMPTIONS UNDERLYING THE 2017 SUBSIDY ESTIMATES — Continued (In percentages, unless noted otherwise)
Defaults, net of
recoveriesInterest Fees All other
Loan maturity (years)
Borrower rate
Grace period (years)
Upfront fees
Annual fees Other fees
Default rate 1
Recovery rate 2
Percent guaranteed
Agency, Bureau, Program and Risk Category Subsidy rate
Composition of Subsidy Loan Characteristics
International Assistance Programs
Agency for International Development: Development Credit Authority—Loan Guarantees............. 4.95 6.66 ...... -1.71 ...... 9 4.90 2 0.63 0.84 ...... 9.79 ...... 50.00
Overseas Private Investment Corporation: OPIC Loan Guarantees...................................................... -5.81 5.43 ...... -11.24 ...... 9 2.20 1 ...... 2.20 ...... 10.32 48.27 100.00 OPIC Investment Funds..................................................... -2.85 13.18 ...... -16.03 ...... 12 4.00 5 ...... 2.00 2.00 18.59 ...... 100.00 Limited Arbitral Award Coverage....................................... -2.35 3.64 ...... -5.99 ...... 10 5.50 1 6.00 ...... ...... 36.19 85.00 100.00 Non-Honoring of Sovereign Guarantees............................ -6.00 2.49 ...... -8.48 ...... 14 4.86 3 ...... ...... 1.30 5.88 53.39 100.00
Department of Transportation
Office of the Secretary: Minority Business Resource Center Loan Guarantees............................................................ 2.36 2.36 ...... ...... ...... 2 6.50 ...... ...... ...... ...... 2.45 ...... 75.00
Department of Veterans Affairs
Benefits Programs: Housing Guaranteed Loans............................................... 0.51 1.72 ...... -1.21 ...... 30 5.25 ...... 1.23 ...... 0.02 4.71 57.35 25.00
Small Business Administration
Business Loans: 7(a) General Business Loan Guarantees........................... 0.00 4.48 ...... -4.48 ...... 16 5.35 ...... 2.66 0.54 ...... 7.44 37.31 73.31 Section 504 Certified Development Companies Debentures...................................................................... 0.00 5.96 ...... -6.60 0.64 19 4.56 ...... 0.85 0.88 ...... 9.00 29.39 100.00 SBIC Debentures............................................................... 0.00 4.97 ...... -5.04 0.07 10 4.35 ...... 3.00 0.34 ...... 19.16 75.38 100.00 Secondary Market Guarantee............................................ 0.00 ...... ...... ...... ...... 19 2.84 ...... ...... ...... ...... ...... ...... 100.00 504 Commercial Real Estate (CRE) Refinance Program.......................................................................... 0.00 6.18 ...... -6.82 0.64 19 4.42 ...... 0.85 0.92 ...... 9.31 29.14 100.00 Scale-Up Manufacturing Investment Company (Legislative Proposal) 3,4................................................. 25.00 ...... ...... ...... ...... ...... ...... ...... ...... ...... ...... ...... ...... 100.00 Disaster Loans: Immediate Disaster Assistance.......................................... 1.91 1.91 ...... ...... ...... 10 5.63 ...... ...... ...... ...... 2.40 14.95 85.00 Expedited Disaster Assistance........................................... 2.25 2.25 ...... ...... ...... 2 4.63 ...... ...... ...... ...... 3.37 25.00 80.00
23

Table 6. LOAN GUARANTEES: ASSUMPTIONS UNDERLYING THE 2017 SUBSIDY ESTIMATES — Continued (In percentages, unless noted otherwise)
Defaults, net of
recoveriesInterest Fees All other
Loan maturity (years)
Borrower rate
Grace period (years)
Upfront fees
Annual fees Other fees
Default rate 1
Recovery rate 2
Percent guaranteed
Agency, Bureau, Program and Risk Category Subsidy rate
Composition of Subsidy Loan Characteristics
Export-Import Bank of the United States
Long Term Guarantees...................................................... -8.47 2.13 ...... -10.60 ...... 11 2.50 ...... 10.50 ...... 0.20 7.32 68.44 100.00 Medium Term Guarantees................................................. -1.14 3.85 ...... -4.99 ...... 5 3.15 ...... 4.47 ...... 0.20 8.96 55.17 100.00 Short Term Insurance........................................................ 0.00 1.70 ...... -1.70 ...... 1 2.45 ...... 1.70 ...... ...... 2.12 18.70 100.00 Medium Term Insurance.................................................... -3.38 3.47 ...... -6.85 ...... 5 3.43 ...... 6.85 ...... ...... 7.29 50.27 100.00 Working Capital Fund......................................................... 0.00 0.51 ...... -0.51 ...... 1 0.67 ...... 0.51 ...... ...... 0.51 ...... 100.00
National Infrastructure Bank
Infrastructure Loan Guarantees (Legislative Proposal) 3... 14.83 15.72 ...... -0.89 ...... ...... ...... ...... 0.89 ...... ...... 60.09 45.00 80.001 Lifetime defaults as a percentage of disbursements.2 Recoveries as a percentage of lifetime defaults.3 Data reflect notional estimates. Estimates will be determined at the time of execution and will reflect the terms of the contracts and other characteristics.4 Composition of subsidy and some detailed characteristics are not available for this notional estimate.
24

Table 7. DIRECT LOANS: SUBSIDY REESTIMATES ¹ (In percentages, unless noted otherwise)
Original Subsidy Rate
Current Reestimated
Rate
Percentage point change due to interest rates
Percentage point change due to
technical assumptions
Current reestimate amount 2
($ thousands)
Net lifetime reestimate amount 3
($ thousands)
Net lifetime reestimate
amount excluding interest
($ thousands)
Total disbursements to
date($ thousands)
Department of Agriculture
Farm Service Agency: Agricultural Credit Insurance Fund: Farm Ownership FY 1992....................................................................................................... 22.64 18.32 -2.27 -2.05 630 -8,076 3,773 65,611 FY 1993....................................................................................................... 8.50 12.99 6.38 -1.89 495 -8,444 -4,359 66,128 FY 1994....................................................................................................... 9.81 16.06 7.95 -1.70 221 -2,128 -14 80,218 FY 1995....................................................................................................... 22.31 16.81 1.17 -6.67 153 -3,609 184 55,033 FY 1996....................................................................................................... 19.04 14.80 1.16 -5.40 210 -4,331 727 86,955 FY 1997....................................................................................................... 21.03 12.17 2.14 -11.00 -119 -10,676 -5,252 78,529 FY 1998....................................................................................................... 13.04 11.13 8.09 -10.00 480 -2,150 796 80,585 FY 1999....................................................................................................... 14.97 8.10 5.73 -12.60 775 -18,420 3,474 160,245 FY 2000....................................................................................................... 3.77 8.71 10.20 -5.26 2,418 12,352 -7,669 225,954 FY 2001....................................................................................................... 10.77 2.98 -6.80 -0.99 1,268 -14,308 -11,118 160,440 FY 2002....................................................................................................... 2.63 -0.17 -1.91 -0.89 2,007 -5,028 -4,219 173,368 FY 2003....................................................................................................... 11.61 -1.03 -8.04 -4.60 1,505 -22,147 -5,403 164,246 FY 2004....................................................................................................... 22.08 -0.34 -0.57 -21.85 1,737 -33,903 -17,576 140,024 FY 2005....................................................................................................... 5.35 -0.14 -4.40 -1.09 2,813 -13,144 -2,086 263,980 FY 2006....................................................................................................... 5.12 0.87 -0.91 -3.34 2,261 -10,212 -6,369 269,837 FY 2007....................................................................................................... 4.19 -1.11 -2.47 -2.83 3,687 -14,513 -11,749 297,394 FY 2008....................................................................................................... 4.45 -2.73 -8.75 1.57 4,674 -31,179 -20,986 373,842 FY 2009....................................................................................................... 6.35 3.16 -13.00 9.81 2,406 -22,128 -6,184 546,318 FY 2010....................................................................................................... 4.08 1.47 4.98 -7.59 11,057 -21,267 -7,581 689,487 FY 2011....................................................................................................... 6.92 0.62 -8.78 2.48 6,386 -37,742 -34,714 566,251 FY 2012....................................................................................................... 4.80 -3.42 -12.39 4.17 7,155 -44,039 -41,702 517,692 FY 2013....................................................................................................... 4.24 0.95 -8.56 5.27 -3,637 -15,464 -13,633 436,296 FY 2014....................................................................................................... 0.77 2.97 3.61 -1.41 39,356 19,859 20,536 962,503 FY 2015....................................................................................................... -1.37 8.52 ...... 9.89 59,809 59,809 57,783 594,478
Agency, Bureau, Program, Risk Category and Cohort Year
Characteristics of Subsidy Reestimates
25

Table 7. DIRECT LOANS: SUBSIDY REESTIMATES ¹ — Continued (In percentages, unless noted otherwise)
Original Subsidy Rate
Current Reestimated
Rate
Percentage point change due to interest rates
Percentage point change due to
technical assumptions
Current reestimate amount 2
($ thousands)
Net lifetime reestimate amount 3
($ thousands)
Net lifetime reestimate
amount excluding interest
($ thousands)
Total disbursements to
date($ thousands)
Agency, Bureau, Program, Risk Category and Cohort Year
Characteristics of Subsidy Reestimates
Farm Operating FY 1992....................................................................................................... 15.71 7.84 -15.12 7.25 324 -59,224 -45,755 561,497 FY 1993....................................................................................................... 12.75 7.43 -2.02 -3.30 468 -60,929 -55,021 538,014 FY 1994....................................................................................................... 12.36 11.21 1.84 -2.99 908 -21,151 -65,337 643,367 FY 1995....................................................................................................... 12.63 15.35 0.39 2.33 908 3,541 3,511 433,220 FY 1996....................................................................................................... 12.98 11.22 -5.67 3.91 1,507 -22,505 26,090 560,669 FY 1997....................................................................................................... 12.59 11.53 0.99 -2.05 2,262 -16,576 14,270 510,320 FY 1998....................................................................................................... 6.57 10.18 12.40 -8.79 1,712 8,169 18,213 553,109 FY 1999....................................................................................................... 6.83 8.89 11.61 -9.55 3,910 -12,969 55,887 780,474 FY 2000....................................................................................................... 5.86 11.16 3.65 1.65 2,694 22,227 800 662,049 FY 2001....................................................................................................... 9.02 7.71 -1.04 -0.27 2,391 -21,442 -19,281 685,221 FY 2002....................................................................................................... 8.93 5.84 -3.81 0.72 1,569 -31,865 -17,641 662,483 FY 2003....................................................................................................... 17.25 3.37 -2.94 -10.94 825 -99,201 -102,738 685,178 FY 2004....................................................................................................... 14.42 3.55 -1.10 -9.77 1,117 -68,281 -61,374 605,320 FY 2005....................................................................................................... 10.09 4.71 -0.18 -5.20 2,091 -33,158 -22,066 551,503 FY 2006....................................................................................................... 9.95 5.54 0.88 -5.29 4,943 -31,219 -14,234 625,078 FY 2007....................................................................................................... 11.69 5.77 -0.44 -5.48 5,926 -32,862 -36,863 582,335 FY 2008....................................................................................................... 12.69 5.60 -3.29 -3.80 5,896 -41,802 -41,246 609,705 FY 2009....................................................................................................... 11.79 4.14 -5.07 -2.58 -2,084 -78,139 -80,546 1,015,068 FY 2010....................................................................................................... 4.74 3.50 0.10 -1.34 15,813 -12,288 -22,620 1,170,870 FY 2011....................................................................................................... 6.06 3.83 -4.36 2.13 9,014 -19,455 -31,604 1,004,049 FY 2012....................................................................................................... 5.63 4.29 -3.66 2.32 4,002 -13,213 -18,849 1,112,573 FY 2013....................................................................................................... 5.57 5.61 -2.69 2.73 -4,019 347 -165 1,001,353 FY 2014....................................................................................................... 5.48 2.64 1.05 -3.89 1,550 -32,480 -31,941 1,126,791 FY 2015....................................................................................................... 5.04 1.41 ...... -3.63 -34,217 -34,217 -33,383 931,400 Emergency Disaster FY 1992....................................................................................................... 20.26 22.01 11.59 -9.84 -26 -4,292 12,630 73,854 FY 1993....................................................................................................... 24.27 23.79 2.87 -3.35 91 -6,261 11,069 57,939 FY 1994....................................................................................................... 28.00 21.12 5.52 -12.40 64 -9,726 11,076 144,191 FY 1995....................................................................................................... 31.90 26.29 -0.59 -5.02 416 -3,247 1,143 66,875 FY 1996....................................................................................................... 29.34 24.83 -1.24 -3.27 703 -5,441 -413 172,884 FY 1997....................................................................................................... 30.41 25.11 -0.07 -5.23 1,369 -7,592 -5,124 142,781
26

Table 7. DIRECT LOANS: SUBSIDY REESTIMATES ¹ — Continued (In percentages, unless noted otherwise)
Original Subsidy Rate
Current Reestimated
Rate
Percentage point change due to interest rates
Percentage point change due to
technical assumptions
Current reestimate amount 2
($ thousands)
Net lifetime reestimate amount 3
($ thousands)
Net lifetime reestimate
amount excluding interest
($ thousands)
Total disbursements to
date($ thousands)
Agency, Bureau, Program, Risk Category and Cohort Year
Characteristics of Subsidy Reestimates
FY 1998....................................................................................................... 24.03 18.71 10.61 -15.93 771 -6,115 -2,643 95,639 FY 1999....................................................................................................... 23.60 25.25 11.83 -10.18 5,828 18,320 5,825 308,461 FY 2000....................................................................................................... 15.53 21.77 5.08 1.16 426 15,600 -4,185 149,299 FY 2001....................................................................................................... 24.53 18.07 -3.80 -2.66 -126 -3,221 -4,727 89,270 FY 2002....................................................................................................... 13.45 13.39 -4.52 4.46 -249 1,231 -1,974 57,800 FY 2003....................................................................................................... 20.39 4.98 -9.42 -5.99 70 -9,170 -29,380 94,815 FY 2004....................................................................................................... 13.83 7.09 -1.02 -5.72 -33 -1,324 -2,784 29,743 FY 2005....................................................................................................... 12.94 11.23 -1.88 0.17 -105 121 -130 23,050 FY 2006....................................................................................................... 10.94 11.93 0.30 0.69 -89 605 1,588 51,051 FY 2007....................................................................................................... 11.77 8.55 -1.69 -1.53 -3 -2,198 -2,359 73,870 FY 2008....................................................................................................... 11.15 5.82 -6.16 0.83 -453 -2,832 -1,683 44,694 FY 2009....................................................................................................... 14.22 6.30 -8.54 0.62 506 -2,700 -1,543 29,656 FY 2010....................................................................................................... 3.69 6.31 1.96 0.66 451 594 1,708 35,338 FY 2011....................................................................................................... 10.49 4.78 -6.10 0.39 576 -2,065 -1,288 31,943 FY 2012....................................................................................................... 5.01 0.02 -7.36 2.37 339 -1,465 -1,614 30,449 FY 2013....................................................................................................... 5.62 6.25 -5.31 5.94 317 245 169 32,763 FY 2014....................................................................................................... 4.90 4.66 2.25 -2.49 374 -41 -44 18,042 FY 2015....................................................................................................... 2.47 -1.76 -5.18 0.95 -483 -483 -474 11,297 Indian Tribe Land Acquisition FY 1992....................................................................................................... 25.25 22.19 -1.25 -1.81 -2 -142 7 988 FY 1993....................................................................................................... 21.17 17.40 -2.04 -1.73 -* -33 -12 859 FY 1994....................................................................................................... 8.20 15.76 5.39 2.17 ...... -65 -10 649 FY 1996....................................................................................................... 23.28 21.40 -0.37 -1.51 24 -26 -14 641 FY 1997....................................................................................................... 24.10 21.10 -1.19 -1.81 -1 -18 -9 224 FY 1998....................................................................................................... 13.18 10.01 -1.45 -1.72 -2 -37 -20 500 FY 2000....................................................................................................... 2.00 14.95 14.15 -1.20 1 100 46 822 FY 2001....................................................................................................... 16.11 -2.03 -3.12 -15.02 1 -63 -191 590 FY 2003....................................................................................................... 8.95 -9.78 -10.37 -8.36 ...... -10 -71 110 FY 2004....................................................................................................... -0.78 ...... -0.82 1.60 2 14 -65 1,586 FY 2006....................................................................................................... 4.01 -1.03 -4.34 -0.70 -* -17 -19 360
27
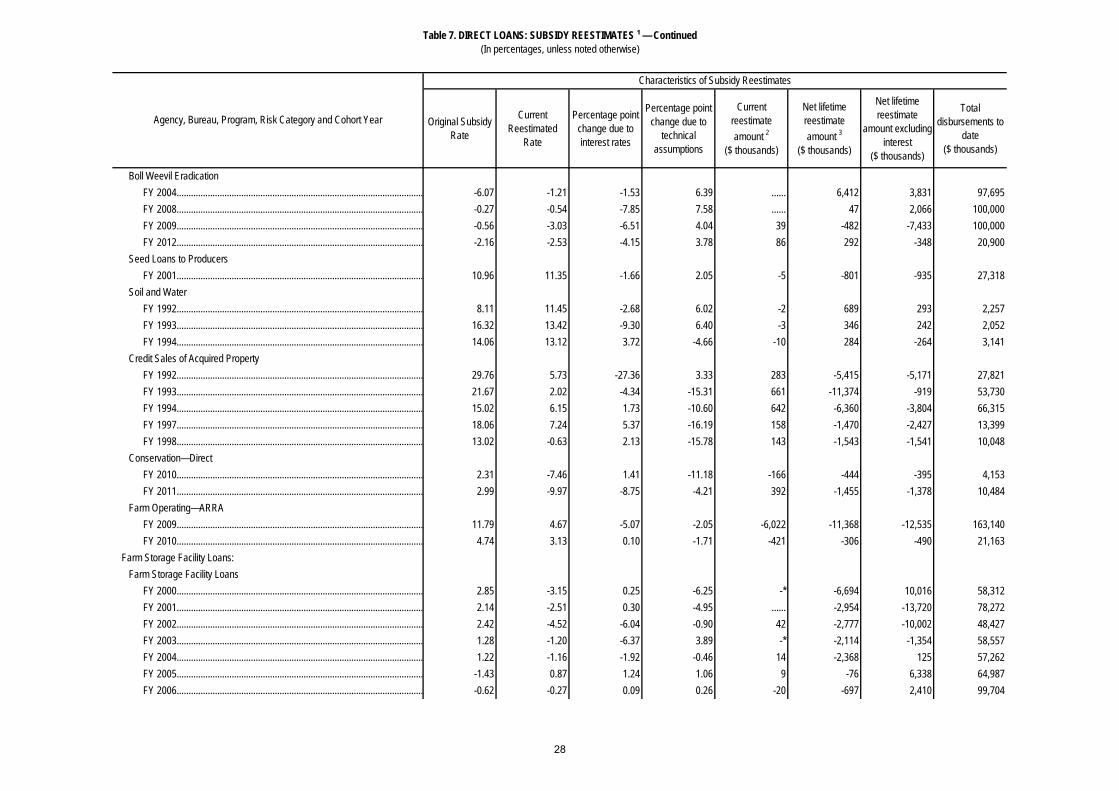
Table 7. DIRECT LOANS: SUBSIDY REESTIMATES ¹ — Continued (In percentages, unless noted otherwise)
Original Subsidy Rate
Current Reestimated
Rate
Percentage point change due to interest rates
Percentage point change due to
technical assumptions
Current reestimate amount 2
($ thousands)
Net lifetime reestimate amount 3
($ thousands)
Net lifetime reestimate
amount excluding interest
($ thousands)
Total disbursements to
date($ thousands)
Agency, Bureau, Program, Risk Category and Cohort Year
Characteristics of Subsidy Reestimates
Boll Weevil Eradication FY 2004....................................................................................................... -6.07 -1.21 -1.53 6.39 ...... 6,412 3,831 97,695 FY 2008....................................................................................................... -0.27 -0.54 -7.85 7.58 ...... 47 2,066 100,000 FY 2009....................................................................................................... -0.56 -3.03 -6.51 4.04 39 -482 -7,433 100,000 FY 2012....................................................................................................... -2.16 -2.53 -4.15 3.78 86 292 -348 20,900 Seed Loans to Producers FY 2001....................................................................................................... 10.96 11.35 -1.66 2.05 -5 -801 -935 27,318 Soil and Water FY 1992....................................................................................................... 8.11 11.45 -2.68 6.02 -2 689 293 2,257 FY 1993....................................................................................................... 16.32 13.42 -9.30 6.40 -3 346 242 2,052 FY 1994....................................................................................................... 14.06 13.12 3.72 -4.66 -10 284 -264 3,141 Credit Sales of Acquired Property FY 1992....................................................................................................... 29.76 5.73 -27.36 3.33 283 -5,415 -5,171 27,821 FY 1993....................................................................................................... 21.67 2.02 -4.34 -15.31 661 -11,374 -919 53,730 FY 1994....................................................................................................... 15.02 6.15 1.73 -10.60 642 -6,360 -3,804 66,315 FY 1997....................................................................................................... 18.06 7.24 5.37 -16.19 158 -1,470 -2,427 13,399 FY 1998....................................................................................................... 13.02 -0.63 2.13 -15.78 143 -1,543 -1,541 10,048 Conservation—Direct FY 2010....................................................................................................... 2.31 -7.46 1.41 -11.18 -166 -444 -395 4,153 FY 2011....................................................................................................... 2.99 -9.97 -8.75 -4.21 392 -1,455 -1,378 10,484 Farm Operating—ARRA FY 2009....................................................................................................... 11.79 4.67 -5.07 -2.05 -6,022 -11,368 -12,535 163,140 FY 2010....................................................................................................... 4.74 3.13 0.10 -1.71 -421 -306 -490 21,163 Farm Storage Facility Loans: Farm Storage Facility Loans FY 2000....................................................................................................... 2.85 -3.15 0.25 -6.25 -* -6,694 10,016 58,312 FY 2001....................................................................................................... 2.14 -2.51 0.30 -4.95 ...... -2,954 -13,720 78,272 FY 2002....................................................................................................... 2.42 -4.52 -6.04 -0.90 42 -2,777 -10,002 48,427 FY 2003....................................................................................................... 1.28 -1.20 -6.37 3.89 -* -2,114 -1,354 58,557 FY 2004....................................................................................................... 1.22 -1.16 -1.92 -0.46 14 -2,368 125 57,262 FY 2005....................................................................................................... -1.43 0.87 1.24 1.06 9 -76 6,338 64,987 FY 2006....................................................................................................... -0.62 -0.27 0.09 0.26 -20 -697 2,410 99,704
28

Table 7. DIRECT LOANS: SUBSIDY REESTIMATES ¹ — Continued (In percentages, unless noted otherwise)
Original Subsidy Rate
Current Reestimated
Rate
Percentage point change due to interest rates
Percentage point change due to
technical assumptions
Current reestimate amount 2
($ thousands)
Net lifetime reestimate amount 3
($ thousands)
Net lifetime reestimate
amount excluding interest
($ thousands)
Total disbursements to
date($ thousands)
Agency, Bureau, Program, Risk Category and Cohort Year
Characteristics of Subsidy Reestimates
FY 2007....................................................................................................... 0.38 -3.31 -4.02 0.33 2,600 -5,653 -5,274 140,291 FY 2008....................................................................................................... 1.01 -3.40 -7.88 3.47 1,643 -6,220 -10,101 132,676 FY 2009....................................................................................................... 6.25 -3.41 -7.18 -2.48 673 -16,723 -18,589 176,277 FY 2010....................................................................................................... -1.01 -3.51 -1.51 -0.99 6,946 -5,766 -9,877 286,732 FY 2011....................................................................................................... -2.01 -3.81 -9.76 7.96 6,017 -3,277 -5,258 218,044 FY 2012....................................................................................................... -2.30 -1.59 -5.70 6.41 1,727 1,474 962 183,547 FY 2013....................................................................................................... -2.46 -0.82 -2.58 4.22 1,058 3,179 3,216 191,806 FY 2014....................................................................................................... -2.52 -3.32 1.35 -2.15 -385 -1,100 -1,080 134,191 FY 2015....................................................................................................... -3.00 0.58 ...... 3.58 1,477 1,477 1,444 40,934 Sugar Storage Facility Loans FY 2013....................................................................................................... -3.30 -4.51 -4.64 3.43 5 -46 -45 3,900 Emergency Boll Weevil Loan: Apple Loans FY 2001....................................................................................................... 5.01 0.62 0.44 -4.83 -1 -251 -1,935 11,423 Emergency Boll Weevil Loans FY 2001....................................................................................................... 60.00 53.19 ...... -6.81 ...... -3,615 -1,312 10,000
Rural Housing Service: Multi-Family Housing Revitalization: Multi-Family Housing Relending Demo FY 2005....................................................................................................... 46.76 34.63 -4.86 -7.27 86 -755 -655 6,250 FY 2006....................................................................................................... 46.76 30.47 -2.31 -13.98 -23 -688 -579 3,746 FY 2007....................................................................................................... 47.82 24.79 -3.43 -19.60 -2 -478 -394 2,000 FY 2008....................................................................................................... 46.39 28.74 -5.38 -12.27 -77 -206 -189 1,141 FY 2009....................................................................................................... 44.98 23.25 -9.95 -11.78 -1,153 -1,391 -1,190 6,422 FY 2011....................................................................................................... 41.34 37.35 ...... -3.99 23 -124 -102 2,215 FY 2012....................................................................................................... 36.84 32.95 ...... -3.89 -105 -179 -158 2,874
FY 2013....................................................................................................... 36.18 (4) ...... ...... ...... ...... ...... ......
FY 2015....................................................................................................... 35.41 (4) ...... ...... ...... ...... ...... ...... Multi-Family Housing Revitalization Seconds FY 2006....................................................................................................... 87.52 48.79 -11.19 -27.54 195 -1,570 -1,379 3,989 FY 2007....................................................................................................... 87.08 60.41 -2.21 -24.46 -14 -752 -671 2,587
29

Table 7. DIRECT LOANS: SUBSIDY REESTIMATES ¹ — Continued (In percentages, unless noted otherwise)
Original Subsidy Rate
Current Reestimated
Rate
Percentage point change due to interest rates
Percentage point change due to
technical assumptions
Current reestimate amount 2
($ thousands)
Net lifetime reestimate amount 3
($ thousands)
Net lifetime reestimate
amount excluding interest
($ thousands)
Total disbursements to
date($ thousands)
Agency, Bureau, Program, Risk Category and Cohort Year
Characteristics of Subsidy Reestimates
FY 2008....................................................................................................... 86.17 60.12 -2.21 -23.84 -250 -3,642 -3,102 12,223 FY 2009....................................................................................................... 85.51 58.26 -4.45 -22.80 5 -1,446 -1,269 4,894 FY 2010....................................................................................................... 72.86 55.79 10.96 -28.03 -552 -4,133 -3,692 20,692 FY 2011....................................................................................................... 62.71 69.44 -1.73 8.46 -180 395 366 7,273 FY 2012....................................................................................................... 61.74 64.15 -9.75 12.16 -302 30 40 3,767 FY 2013....................................................................................................... 61.44 56.99 -9.78 5.33 -168 -175 -157 3,092
FY 2014....................................................................................................... 51.25 (4) ...... ...... ...... ...... ...... ......
FY 2015....................................................................................................... 60.71 (4) ...... ...... ...... ...... ...... ...... Multi-Family Revitalization Zero FY 2006....................................................................................................... 54.37 41.80 -5.86 -6.71 -5 -28 -28 230 FY 2007....................................................................................................... 54.11 42.13 -8.70 -3.28 -3 -316 -294 2,443 FY 2008....................................................................................................... 51.26 58.76 -7.42 14.92 -15 867 712 12,650 FY 2009....................................................................................................... 60.59 58.23 -4.89 2.53 -11 -554 -504 15,004 FY 2010....................................................................................................... 38.16 48.88 11.37 -0.65 -6 387 358 3,581 FY 2011....................................................................................................... 45.18 57.40 ...... 12.22 14 437 389 3,427 FY 2012....................................................................................................... 54.29 43.35 -7.04 -3.90 68 -666 -618 5,613 FY 2013....................................................................................................... 58.28 44.13 ...... -14.15 -278 -398 -357 1,895 FY 2014....................................................................................................... 48.86 36.02 ...... -12.84 -206 -206 -194 1,491
FY 2015....................................................................................................... 56.22 (4) ...... ...... ...... ...... ...... ...... Multi-Family Housing Revitalization Modifications
FY 2006....................................................................................................... 29.37 27.24 (6) 27.24 -170 9,310 7,162 44,272
FY 2007....................................................................................................... 28.90 25.64 (6) 25.64 -79 10,344 8,236 51,045
FY 2008....................................................................................................... 17.72 15.11 (6) 15.11 -253 4,244 3,002 87,165
FY 2009....................................................................................................... 23.41 17.56 (6) 17.56 -132 2,431 2,042 45,210
FY 2010....................................................................................................... 12.04 26.04 (6) 26.04 394 15,846 13,364 88,211
FY 2011....................................................................................................... 17.17 0.52 (6) 0.52 -12 -839 -1,439 24,811
FY 2012....................................................................................................... 66.71 10.70 (6) 10.70 -681 2,220 2,085 38,105
FY 2013....................................................................................................... 11.22 11.08 (6) 11.08 -23 70 92 6,002
FY 2014....................................................................................................... 8.33 6.50 (6) 6.50 107 126 136 38,923
30

Table 7. DIRECT LOANS: SUBSIDY REESTIMATES ¹ — Continued (In percentages, unless noted otherwise)
Original Subsidy Rate
Current Reestimated
Rate
Percentage point change due to interest rates
Percentage point change due to
technical assumptions
Current reestimate amount 2
($ thousands)
Net lifetime reestimate amount 3
($ thousands)
Net lifetime reestimate
amount excluding interest
($ thousands)
Total disbursements to
date($ thousands)
Agency, Bureau, Program, Risk Category and Cohort Year
Characteristics of Subsidy Reestimates
Rural Community Facilities: Community Facility Loans FY 1992....................................................................................................... 10.60 11.33 3.12 -2.39 89 1,152 42 81,704 FY 1993....................................................................................................... 8.14 13.06 6.84 -1.92 42 6,377 3,447 92,568 FY 1994....................................................................................................... 12.57 16.63 4.43 -0.37 -72 8,034 4,410 152,543 FY 1995....................................................................................................... 12.14 13.65 3.35 -1.84 -1,185 3,145 1,149 161,053 FY 1996....................................................................................................... 16.80 11.77 -2.62 -2.41 -979 -9,429 -9,749 180,711 FY 1997....................................................................................................... 8.73 11.52 3.47 -0.68 -410 5,462 2,784 121,345 FY 1998....................................................................................................... 8.38 14.44 4.22 1.84 2,033 15,452 9,455 177,941 FY 1999....................................................................................................... 13.74 12.58 -0.75 -0.41 1,123 1,713 -2,264 142,758 FY 2000....................................................................................................... 6.06 10.03 1.58 2.39 805 11,003 5,755 167,151 FY 2001....................................................................................................... 11.69 6.02 -7.77 2.10 1,366 -6,569 -15,236 270,685 FY 2002....................................................................................................... 5.43 5.49 -2.67 2.73 198 5,256 -514 345,374 FY 2003....................................................................................................... 6.24 6.54 -3.60 3.90 372 4,000 233 232,047 FY 2004....................................................................................................... -0.71 5.11 2.77 3.05 152 30,812 22,234 435,068 FY 2005....................................................................................................... 4.05 7.72 0.09 3.58 5,237 32,845 19,514 631,640 FY 2006....................................................................................................... 3.35 5.01 -3.05 4.71 -272 9,387 4,833 337,846 FY 2007....................................................................................................... 6.41 2.87 -8.90 5.36 1,518 -7,716 -10,225 304,744 FY 2008....................................................................................................... 5.55 -2.54 -12.02 3.93 1,619 -20,356 -22,513 301,022 FY 2009....................................................................................................... 5.72 -2.79 -8.50 -0.01 2,338 -29,975 -35,576 444,153 FY 2010....................................................................................................... 1.31 -4.93 -6.11 -0.13 1,397 -91,777 -90,439 1,573,722 FY 2011....................................................................................................... 1.33 7.72 1.90 4.49 -1,112 22,202 19,174 297,914 FY 2012....................................................................................................... -3.03 7.29 ...... 10.32 34,717 107,873 94,849 780,420 FY 2013....................................................................................................... -2.08 6.51 ...... 8.59 34,169 56,474 51,514 490,015 FY 2014....................................................................................................... -13.21 -11.84 ...... 1.37 4,990 4,072 3,665 284,990 FY 2015....................................................................................................... -12.41 1.65 ...... 14.06 3,380 3,380 3,263 23,258 Rural Housing Insurance Fund: Section 502 Single-Family Housing FY 1992....................................................................................................... 22.64 19.07 -0.48 -3.09 -564 -133,788 -53,003 1,238,296 FY 1993....................................................................................................... 18.75 14.93 5.12 -8.94 -1,909 -88,898 -54,631 1,269,332 FY 1994....................................................................................................... 20.10 18.88 2.62 -3.84 221 -58,435 -30,693 1,636,599 FY 1995....................................................................................................... 24.36 20.52 -0.47 -3.37 1,704 -31,831 -42,567 919,860 FY 1996....................................................................................................... 14.30 17.36 2.14 0.92 -1,368 41,580 24,504 993,988
31

Table 7. DIRECT LOANS: SUBSIDY REESTIMATES ¹ — Continued (In percentages, unless noted otherwise)
Original Subsidy Rate
Current Reestimated
Rate
Percentage point change due to interest rates
Percentage point change due to
technical assumptions
Current reestimate amount 2
($ thousands)
Net lifetime reestimate amount 3
($ thousands)
Net lifetime reestimate
amount excluding interest
($ thousands)
Total disbursements to
date($ thousands)
Agency, Bureau, Program, Risk Category and Cohort Year
Characteristics of Subsidy Reestimates
FY 1997....................................................................................................... 14.18 16.59 1.58 0.83 -182 50,253 12,591 670,284 FY 1998....................................................................................................... 12.81 14.54 1.22 0.51 -924 48,662 12,872 965,417 FY 1999....................................................................................................... 11.82 14.88 3.60 -0.54 -413 66,845 23,355 929,245 FY 2000....................................................................................................... 8.53 15.52 7.13 -0.14 1,552 116,471 68,075 1,103,112 FY 2001....................................................................................................... 16.06 11.38 -6.26 1.58 2,024 -13,513 -51,983 1,034,090 FY 2002....................................................................................................... 13.16 9.46 -3.63 -0.07 2,359 -11,615 -40,264 1,032,791 FY 2003....................................................................................................... 19.37 9.94 -1.65 -7.78 1,353 -86,815 -95,848 989,993 FY 2004....................................................................................................... 9.27 11.80 1.00 1.53 5,717 49,958 28,624 1,275,373 FY 2005....................................................................................................... 11.58 13.63 -1.23 3.28 5,356 44,830 19,079 1,103,402 FY 2006....................................................................................................... 11.39 16.55 2.74 2.42 7,010 92,000 58,156 1,178,652 FY 2007....................................................................................................... 10.03 16.55 1.32 5.20 13,342 109,598 79,663 1,183,000 FY 2008....................................................................................................... 9.37 10.97 -5.01 6.61 2,527 30,667 18,487 1,111,686 FY 2009....................................................................................................... 6.72 6.89 -3.60 3.77 -9,842 2,121 1,899 1,434,500 FY 2010....................................................................................................... 3.63 8.72 1.52 3.57 -5,544 109,376 103,042 2,104,327 FY 2011....................................................................................................... 6.26 7.17 2.00 -1.09 -7,040 6,658 8,534 1,101,903 FY 2012....................................................................................................... 4.73 2.02 5.07 -7.78 -13,098 -20,339 -24,289 890,105 FY 2013....................................................................................................... 5.97 5.33 4.37 -5.01 -10,861 -6,564 -5,579 788,677 FY 2014....................................................................................................... 2.72 4.14 3.93 -2.51 -4,427 10,265 10,535 752,678 FY 2015....................................................................................................... 7.38 5.43 3.78 -5.73 -10,612 -10,612 -10,340 511,661 Section 515 Multi-Family Housing FY 1992....................................................................................................... 43.30 59.11 -3.17 18.98 950 118,851 77,237 564,262 FY 1993....................................................................................................... 49.55 59.70 6.16 3.99 1,362 76,770 42,225 565,371 FY 1994....................................................................................................... 58.06 61.73 2.40 1.27 -310 25,486 4,911 505,323 FY 1995....................................................................................................... 54.55 56.37 2.99 -1.17 -203 4,720 -948 179,792 FY 1996....................................................................................................... 53.80 56.73 -2.57 5.50 116 2,596 1,124 146,926 FY 1997....................................................................................................... 51.24 53.41 7.42 -5.25 119 4,933 -103 145,232 FY 1998....................................................................................................... 45.85 47.89 7.36 -5.32 -49 1,607 675 144,645 FY 1999....................................................................................................... 48.25 47.27 -1.19 0.21 55 -1,087 -2,514 111,420 FY 2000....................................................................................................... 39.68 44.60 4.83 0.09 176 4,728 3,909 107,430 FY 2001....................................................................................................... 49.27 42.25 -7.03 0.01 -197 -9,321 -8,959 115,567 FY 2002....................................................................................................... 42.32 40.12 -1.69 -0.51 46 -2,425 -2,510 109,449
32
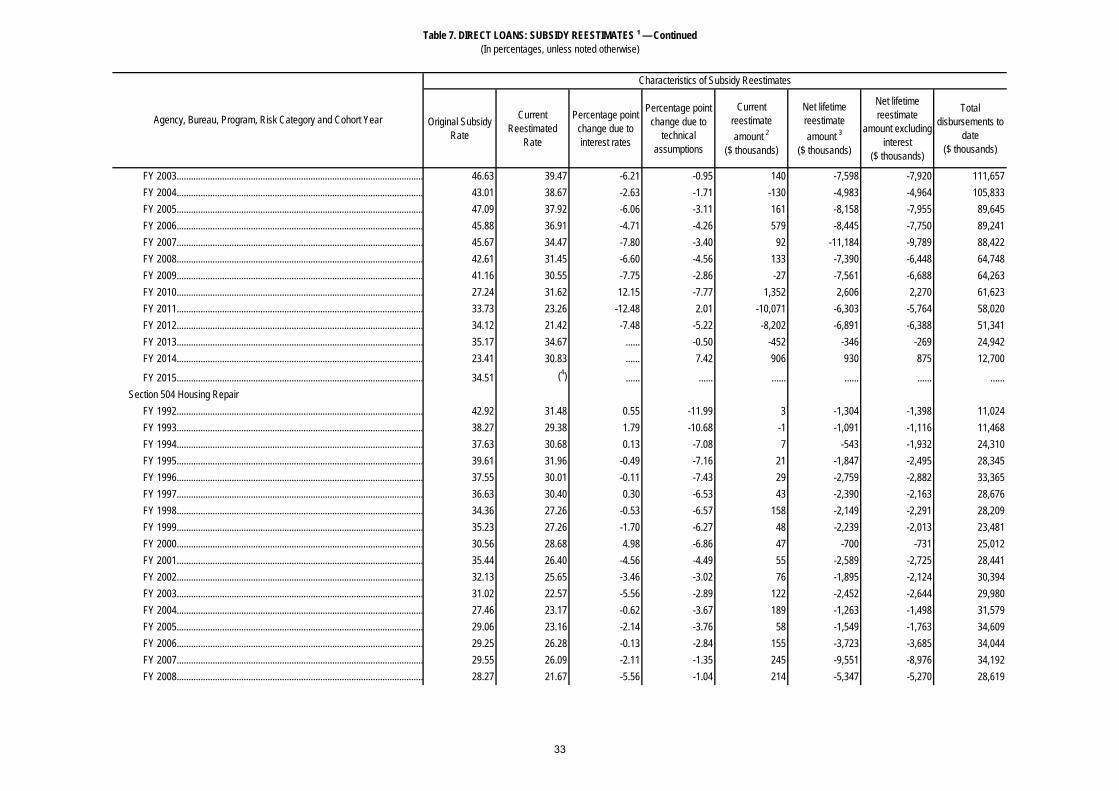
Table 7. DIRECT LOANS: SUBSIDY REESTIMATES ¹ — Continued (In percentages, unless noted otherwise)
Original Subsidy Rate
Current Reestimated
Rate
Percentage point change due to interest rates
Percentage point change due to
technical assumptions
Current reestimate amount 2
($ thousands)
Net lifetime reestimate amount 3
($ thousands)
Net lifetime reestimate
amount excluding interest
($ thousands)
Total disbursements to
date($ thousands)
Agency, Bureau, Program, Risk Category and Cohort Year
Characteristics of Subsidy Reestimates
FY 2003....................................................................................................... 46.63 39.47 -6.21 -0.95 140 -7,598 -7,920 111,657 FY 2004....................................................................................................... 43.01 38.67 -2.63 -1.71 -130 -4,983 -4,964 105,833 FY 2005....................................................................................................... 47.09 37.92 -6.06 -3.11 161 -8,158 -7,955 89,645 FY 2006....................................................................................................... 45.88 36.91 -4.71 -4.26 579 -8,445 -7,750 89,241 FY 2007....................................................................................................... 45.67 34.47 -7.80 -3.40 92 -11,184 -9,789 88,422 FY 2008....................................................................................................... 42.61 31.45 -6.60 -4.56 133 -7,390 -6,448 64,748 FY 2009....................................................................................................... 41.16 30.55 -7.75 -2.86 -27 -7,561 -6,688 64,263 FY 2010....................................................................................................... 27.24 31.62 12.15 -7.77 1,352 2,606 2,270 61,623 FY 2011....................................................................................................... 33.73 23.26 -12.48 2.01 -10,071 -6,303 -5,764 58,020 FY 2012....................................................................................................... 34.12 21.42 -7.48 -5.22 -8,202 -6,891 -6,388 51,341 FY 2013....................................................................................................... 35.17 34.67 ...... -0.50 -452 -346 -269 24,942 FY 2014....................................................................................................... 23.41 30.83 ...... 7.42 906 930 875 12,700
FY 2015....................................................................................................... 34.51 (4) ...... ...... ...... ...... ...... ...... Section 504 Housing Repair FY 1992....................................................................................................... 42.92 31.48 0.55 -11.99 3 -1,304 -1,398 11,024 FY 1993....................................................................................................... 38.27 29.38 1.79 -10.68 -1 -1,091 -1,116 11,468 FY 1994....................................................................................................... 37.63 30.68 0.13 -7.08 7 -543 -1,932 24,310 FY 1995....................................................................................................... 39.61 31.96 -0.49 -7.16 21 -1,847 -2,495 28,345 FY 1996....................................................................................................... 37.55 30.01 -0.11 -7.43 29 -2,759 -2,882 33,365 FY 1997....................................................................................................... 36.63 30.40 0.30 -6.53 43 -2,390 -2,163 28,676 FY 1998....................................................................................................... 34.36 27.26 -0.53 -6.57 158 -2,149 -2,291 28,209 FY 1999....................................................................................................... 35.23 27.26 -1.70 -6.27 48 -2,239 -2,013 23,481 FY 2000....................................................................................................... 30.56 28.68 4.98 -6.86 47 -700 -731 25,012 FY 2001....................................................................................................... 35.44 26.40 -4.56 -4.49 55 -2,589 -2,725 28,441 FY 2002....................................................................................................... 32.13 25.65 -3.46 -3.02 76 -1,895 -2,124 30,394 FY 2003....................................................................................................... 31.02 22.57 -5.56 -2.89 122 -2,452 -2,644 29,980 FY 2004....................................................................................................... 27.46 23.17 -0.62 -3.67 189 -1,263 -1,498 31,579 FY 2005....................................................................................................... 29.06 23.16 -2.14 -3.76 58 -1,549 -1,763 34,609 FY 2006....................................................................................................... 29.25 26.28 -0.13 -2.84 155 -3,723 -3,685 34,044 FY 2007....................................................................................................... 29.55 26.09 -2.11 -1.35 245 -9,551 -8,976 34,192 FY 2008....................................................................................................... 28.27 21.67 -5.56 -1.04 214 -5,347 -5,270 28,619
33

Table 7. DIRECT LOANS: SUBSIDY REESTIMATES ¹ — Continued (In percentages, unless noted otherwise)
Original Subsidy Rate
Current Reestimated
Rate
Percentage point change due to interest rates
Percentage point change due to
technical assumptions
Current reestimate amount 2
($ thousands)
Net lifetime reestimate amount 3
($ thousands)
Net lifetime reestimate
amount excluding interest
($ thousands)
Total disbursements to
date($ thousands)
Agency, Bureau, Program, Risk Category and Cohort Year
Characteristics of Subsidy Reestimates
FY 2009....................................................................................................... 26.87 17.52 -8.14 -1.21 207 -3,710 -3,696 26,084 FY 2010....................................................................................................... 12.85 17.47 6.73 -2.11 195 1,144 1,090 25,126 FY 2011....................................................................................................... 18.93 13.90 -6.79 1.76 162 -1,128 -1,093 21,099 FY 2012....................................................................................................... 14.21 7.37 -7.79 0.95 83 -589 -676 9,691 FY 2013....................................................................................................... 13.67 8.29 -5.54 0.16 158 -654 -737 13,538 FY 2014....................................................................................................... 8.28 10.51 2.51 -0.28 124 298 275 12,908 FY 2015....................................................................................................... 14.03 14.74 ...... 0.71 52 52 51 10,427 Section 514 Farm Labor Housing FY 1992....................................................................................................... 55.21 52.39 -0.37 -2.45 4 -629 -701 15,804 FY 1993....................................................................................................... 45.48 54.40 8.63 0.29 12 1,522 1,139 16,112 FY 1994....................................................................................................... 50.00 54.97 4.11 0.86 -2 2,135 500 15,627 FY 1995....................................................................................................... 52.48 52.25 2.19 -2.42 38 -857 -414 15,052 FY 1996....................................................................................................... 56.80 52.13 -3.20 -1.47 -103 921 -1,093 14,830 FY 1997....................................................................................................... 47.77 48.91 3.68 -2.54 14 -506 -466 15,090 FY 1998....................................................................................................... 49.25 48.33 0.96 -1.88 -123 -1,118 -279 14,515 FY 1999....................................................................................................... 52.03 46.73 -5.43 0.13 -39 -1,246 -1,036 18,122 FY 2000....................................................................................................... 45.23 44.26 3.85 -4.82 -63 -621 -674 27,327 FY 2001....................................................................................................... 52.59 42.29 -21.74 11.44 -5 -3,200 -3,136 29,522 FY 2002....................................................................................................... 47.31 40.22 -11.20 4.11 9 -3,052 -2,770 33,304 FY 2003....................................................................................................... 49.02 37.35 -12.53 0.86 -8 -5,168 -4,292 40,837 FY 2004....................................................................................................... 42.73 40.97 -1.33 -0.43 -42 -331 -663 26,374 FY 2005....................................................................................................... 47.06 39.49 -4.67 -2.90 -16 -1,689 -1,688 22,933 FY 2006....................................................................................................... 44.59 37.82 -4.19 -2.58 -6 -1,312 -1,193 15,450 FY 2007....................................................................................................... 47.95 39.97 -6.44 -1.54 -17 -2,785 -2,349 26,130 FY 2008....................................................................................................... 43.26 28.89 -8.32 -6.05 -8 -4,748 -4,019 26,564 FY 2009....................................................................................................... 42.14 26.69 -9.54 -5.91 -95 -5,340 -4,736 27,920 FY 2010....................................................................................................... 36.14 24.76 3.90 -15.28 -207 -1,452 -1,323 12,031 FY 2011....................................................................................................... 38.38 38.45 -1.01 1.08 -183 -540 -527 27,049 FY 2012....................................................................................................... 34.15 33.63 ...... -0.52 -3 -30 -29 1,462 FY 2013....................................................................................................... 33.34 33.86 ...... 0.52 -14 -18 -12 9,701 FY 2014....................................................................................................... 23.71 24.33 ...... 0.62 2 3 2 497
34

Table 7. DIRECT LOANS: SUBSIDY REESTIMATES ¹ — Continued (In percentages, unless noted otherwise)
Original Subsidy Rate
Current Reestimated
Rate
Percentage point change due to interest rates
Percentage point change due to
technical assumptions
Current reestimate amount 2
($ thousands)
Net lifetime reestimate amount 3
($ thousands)
Net lifetime reestimate
amount excluding interest
($ thousands)
Total disbursements to
date($ thousands)
Agency, Bureau, Program, Risk Category and Cohort Year
Characteristics of Subsidy Reestimates
FY 2015....................................................................................................... 32.20 32.95 ...... 0.75 * * * 74 Section 524 Site Development FY 2001....................................................................................................... 0.12 47.61 -3.04 50.53 27 1,940 1,341 2,960
FY 2003....................................................................................................... 1.09 1.93 ...... 0.84 ...... -40 -2 1,165
FY 2004....................................................................................................... -0.03 3.22 ...... 3.25 ...... -171 94 3,218
FY 2005....................................................................................................... -4.94 -4.82 1.09 -0.97 ...... -23 1 435 FY 2006....................................................................................................... -3.51 -3.67 2.48 -2.64 6 -3 -1 740 FY 2007....................................................................................................... -1.66 -1.73 -1.17 1.10 7 123 37 2,192
FY 2008....................................................................................................... -0.79 -14.37 -3.11 -10.47 ...... -100 -93 700 FY 2009....................................................................................................... -1.84 5.46 -3.19 10.49 17 36 32 380 FY 2010....................................................................................................... -4.22 -9.99 0.53 -6.30 -78 -27 -29 530
FY 2015....................................................................................................... -4.82 (4) ...... ...... ...... ...... ...... ...... Section 523 Self-Help Housing FY 2001....................................................................................................... 5.57 32.22 -4.00 30.65 ...... 1,503 974 3,874 FY 2004....................................................................................................... 3.08 0.45 4.70 -7.33 ...... -159 -63 2,421 FY 2005....................................................................................................... -0.47 27.57 0.40 27.64 3 686 632 2,295 FY 2006....................................................................................................... 1.03 -0.92 1.04 -2.99 -* -72 -66 3,591 FY 2007....................................................................................................... 2.47 4.62 -2.20 4.35 29 20 9 436 Single-Family Housing Credit Sales FY 1992....................................................................................................... 14.69 10.95 -0.13 -3.61 -1,126 -28,941 -7,941 185,105 FY 1993....................................................................................................... 11.51 7.29 0.47 -4.69 -728 -24,724 -7,566 163,610 FY 1994....................................................................................................... 16.26 10.22 -0.32 -5.72 -279 -14,881 -8,260 116,716 FY 1997....................................................................................................... 8.87 9.21 1.21 -0.87 -2,852 -2,791 -2,040 19,069 FY 1998....................................................................................................... 13.97 7.50 -1.31 -5.16 46 -1,281 -1,461 21,116 FY 1999....................................................................................................... 9.02 6.71 1.60 -3.91 49 -2,804 -1,817 15,636 FY 2000....................................................................................................... 6.08 12.54 3.59 2.87 55 493 389 6,464 FY 2001....................................................................................................... -3.23 -7.00 -2.16 -1.61 49 -25 -106 2,979 FY 2002....................................................................................................... -4.82 -3.85 -4.77 5.74 -13 42 23 2,321 FY 2003....................................................................................................... -9.58 -10.24 -8.32 7.66 -8 -14 -1 737 FY 2004....................................................................................................... -17.46 -6.79 -5.61 16.28 -3 102 97 862 FY 2005....................................................................................................... -16.23 -10.73 -6.52 12.02 1 -83 -79 645
35

Table 7. DIRECT LOANS: SUBSIDY REESTIMATES ¹ — Continued (In percentages, unless noted otherwise)
Original Subsidy Rate
Current Reestimated
Rate
Percentage point change due to interest rates
Percentage point change due to
technical assumptions
Current reestimate amount 2
($ thousands)
Net lifetime reestimate amount 3
($ thousands)
Net lifetime reestimate
amount excluding interest
($ thousands)
Total disbursements to
date($ thousands)
Agency, Bureau, Program, Risk Category and Cohort Year
Characteristics of Subsidy Reestimates
FY 2006....................................................................................................... -14.53 -6.94 4.12 3.47 4 -30 -28 413 FY 2007....................................................................................................... 0.48 -8.69 0.94 -10.11 -2 -13 -14 153 FY 2008....................................................................................................... -1.15 -8.74 -4.61 -2.98 2 -15 -24 321 FY 2009....................................................................................................... -2.59 -7.87 -8.84 3.56 5 -52 -53 1,032 FY 2010....................................................................................................... -15.63 -7.24 3.73 4.66 19 95 94 1,104 FY 2011....................................................................................................... -11.12 -11.63 1.85 -2.36 12 -2 -2 663 FY 2012....................................................................................................... -16.85 -6.14 5.59 5.12 37 115 105 974 FY 2013....................................................................................................... -8.97 -12.13 0.76 -3.92 2 -20 -20 653 FY 2014....................................................................................................... -8.97 4.73 -2.17 15.87 -67 123 131 960 FY 2015....................................................................................................... -6.41 -2.28 ...... 4.13 61 61 59 1,419 Multi-Family Housing Credit Sales FY 1992....................................................................................................... 17.71 46.56 -0.13 28.98 -48 -657 638 2,070 FY 1993....................................................................................................... 10.92 49.78 0.47 38.39 7 568 552 1,477 FY 1994....................................................................................................... 18.64 61.28 -0.32 42.96 -16 2,040 2,339 6,055 FY 1997....................................................................................................... 50.55 59.15 9.49 -0.89 -6 457 301 4,234 FY 1998....................................................................................................... 13.97 49.06 18.25 16.84 1 -719 345 989 FY 1999....................................................................................................... 48.31 46.30 -2.19 0.18 6 -2,259 -132 3,961 FY 2000....................................................................................................... 39.54 55.29 12.44 3.31 4 234 133 958 FY 2001....................................................................................................... 49.03 44.25 -5.14 0.36 -* -126 -105 1,779 FY 2002....................................................................................................... 42.17 47.18 1.19 3.82 13 40 64 1,775 FY 2003....................................................................................................... 46.68 41.15 -3.07 -2.46 16 -128 -127 1,988 FY 2004....................................................................................................... 44.20 42.49 1.35 -3.06 3 -19 -15 401 FY 2005....................................................................................................... 48.44 37.36 -6.87 -4.21 10 -167 -163 1,368 FY 2006....................................................................................................... 45.40 47.66 -4.43 6.69 10 50 17 1,485 FY 2007....................................................................................................... 45.33 44.44 -4.66 3.77 21 26 -29 1,485 FY 2008....................................................................................................... 37.14 36.22 -6.01 5.09 25 -15 -24 1,476 FY 2009....................................................................................................... 36.12 34.20 -9.94 8.02 2 -33 -37 1,448 FY 2010....................................................................................................... 38.40 40.69 14.09 -11.80 9 20 16 1,110 FY 2011....................................................................................................... 38.37 36.93 -0.99 -0.45 1 -4 -4 175 Section 502 Manufactured Home Disaster Demo FY 2001....................................................................................................... 20.07 16.58 -5.32 1.83 21 -13 -11 256
36

Table 7. DIRECT LOANS: SUBSIDY REESTIMATES ¹ — Continued (In percentages, unless noted otherwise)
Original Subsidy Rate
Current Reestimated
Rate
Percentage point change due to interest rates
Percentage point change due to
technical assumptions
Current reestimate amount 2
($ thousands)
Net lifetime reestimate amount 3
($ thousands)
Net lifetime reestimate
amount excluding interest
($ thousands)
Total disbursements to
date($ thousands)
Agency, Bureau, Program, Risk Category and Cohort Year
Characteristics of Subsidy Reestimates
FY 2002....................................................................................................... 17.68 14.07 -3.93 0.32 24 -6 -17 416 FY 2003....................................................................................................... 17.92 13.26 -7.33 2.67 7 11 -9 191
Rural Business Cooperative Service: Rural Microenterprise Direct Loans FY 2010....................................................................................................... 21.13 8.02 -4.61 -8.50 -44 -534 -555 17,137 FY 2011....................................................................................................... 21.39 19.24 -6.57 4.42 -212 -343 -273 11,185 FY 2014....................................................................................................... 6.26 6.31 ...... 0.05 -1 -1 -1 5,073
FY 2015....................................................................................................... 12.81 (4) ...... ...... ...... ...... ...... ...... Business and Industry Loans FY 1997....................................................................................................... 0.51 46.05 -16.21 61.75 -5 4,827 4,644 10,554 FY 1998....................................................................................................... -7.16 41.84 -10.90 59.90 -143 11,063 9,299 19,552 FY 1999....................................................................................................... -14.64 16.26 3.61 27.29 222 4,948 7,593 24,851 FY 2000....................................................................................................... -14.16 30.45 -4.66 49.27 913 11,594 12,158 28,828 FY 2001....................................................................................................... 5.82 31.94 3.94 22.18 8,262 14,795 11,833 45,377 Intermediary Relending Program FY 1992....................................................................................................... 50.03 49.26 8.38 -9.15 -9 -1,233 -746 32,500 FY 1993....................................................................................................... 54.22 51.39 1.03 -3.86 -208 -266 -1,258 32,390 FY 1994....................................................................................................... 57.54 51.36 -3.81 -2.37 23 -5,626 -5,798 76,267 FY 1995....................................................................................................... 54.02 47.54 -1.83 -4.65 62 -7,221 -6,334 82,559 FY 1996....................................................................................................... 59.50 46.40 -6.83 -6.27 -367 -4,779 -4,576 33,262 FY 1997....................................................................................................... 46.48 46.79 4.84 -4.53 -86 -532 -350 33,893 FY 1998....................................................................................................... 48.25 44.47 1.64 -5.42 -336 -1,771 -1,325 28,042 FY 1999....................................................................................................... 50.35 47.69 -2.61 -0.05 204 -590 -1,128 28,745 FY 2000....................................................................................................... 43.43 44.02 2.38 -1.79 -107 -281 -192 34,928 FY 2001....................................................................................................... 50.91 38.65 -8.29 -3.97 176 -4,129 -3,870 32,414 FY 2002....................................................................................................... 43.21 38.74 -4.09 -0.38 -11 -1,403 -1,388 28,621 FY 2003....................................................................................................... 48.26 40.11 -6.12 -2.03 -40 -2,967 -2,881 35,081 FY 2004....................................................................................................... 43.27 38.54 -2.21 -2.52 456 -1,444 -1,492 29,290 FY 2005....................................................................................................... 46.38 37.53 -6.54 -2.31 70 -2,792 -2,503 28,525 FY 2006....................................................................................................... 43.02 37.03 -6.51 0.52 -40 -2,501 -1,872 30,095 FY 2007....................................................................................................... 44.07 33.95 -11.38 1.26 -114 -3,186 -2,929 29,088
37

Table 7. DIRECT LOANS: SUBSIDY REESTIMATES ¹ — Continued (In percentages, unless noted otherwise)
Original Subsidy Rate
Current Reestimated
Rate
Percentage point change due to interest rates
Percentage point change due to
technical assumptions
Current reestimate amount 2
($ thousands)
Net lifetime reestimate amount 3
($ thousands)
Net lifetime reestimate
amount excluding interest
($ thousands)
Total disbursements to
date($ thousands)
Agency, Bureau, Program, Risk Category and Cohort Year
Characteristics of Subsidy Reestimates
FY 2008....................................................................................................... 42.89 31.42 -12.44 0.97 87 -3,469 -3,272 28,763 FY 2009....................................................................................................... 41.85 37.72 -4.58 0.45 21 -1,375 -1,233 24,244 FY 2010....................................................................................................... 25.24 26.94 3.32 -1.62 -200 390 336 24,305 FY 2011....................................................................................................... 38.58 38.17 -0.27 -0.14 -94 -200 -156 12,243 FY 2012....................................................................................................... 33.88 34.60 ...... 0.72 43 4 -5 11,086 FY 2013....................................................................................................... 32.04 33.41 ...... 1.37 56 99 85 9,908 FY 2014....................................................................................................... 21.61 23.43 ...... 1.82 73 81 73 4,579 FY 2015....................................................................................................... 30.80 32.61 ...... 1.81 3 3 3 233 Rural Economic Development Loans
FY 1992....................................................................................................... 30.29 27.07 -1.74 -1.48 ...... -294 -316 6,936
FY 1993....................................................................................................... 25.82 27.67 1.50 0.35 ...... 538 76 12,189 FY 1994....................................................................................................... 25.42 27.99 3.15 -0.58 ...... 489 165 13,068
FY 1995....................................................................................................... 24.92 27.60 2.44 0.24 ...... 714 160 11,318
FY 1996....................................................................................................... 28.48 24.02 -0.13 -4.33 ...... -659 -726 12,260
FY 1997....................................................................................................... 22.93 23.51 3.29 -2.71 ...... 174 -10 11,142
FY 1998....................................................................................................... 23.91 24.69 1.93 -1.15 ...... 164 7 22,912
FY 1999....................................................................................................... 25.22 24.31 0.93 -1.84 ...... 66 -222 12,590
FY 2000....................................................................................................... 23.02 24.34 3.45 -2.13 ...... 93 76 13,155
FY 2001....................................................................................................... 26.07 19.02 -1.52 -5.53 ...... -1,022 -1,365 18,652
FY 2002....................................................................................................... 24.16 17.13 -6.92 -0.11 ...... -1,134 -953 13,257 FY 2003....................................................................................................... 21.36 16.87 -4.15 -0.34 1 -313 -621 13,320 FY 2004....................................................................................................... 18.61 17.77 -0.19 -0.65 1 -161 -151 13,029 FY 2005....................................................................................................... 18.79 20.34 1.58 -0.03 -25 104 252 23,884 FY 2006....................................................................................................... 19.97 19.15 -0.23 -0.59 -9 -208 -263 21,998 FY 2007....................................................................................................... 21.84 17.47 -5.46 1.09 -* -1,209 -1,110 24,299 FY 2008....................................................................................................... 22.59 12.49 -8.97 -1.13 -4 -2,293 -2,502 25,347 FY 2009....................................................................................................... 20.89 11.93 -8.21 -0.75 -63 -2,285 -2,427 27,594 FY 2010....................................................................................................... 13.05 9.96 -1.58 -1.51 -15 -571 -616 19,754 FY 2011....................................................................................................... 17.91 6.71 -9.76 -1.44 -26 -2,603 -2,719 24,606 FY 2012....................................................................................................... 12.98 6.94 -5.29 -0.75 -1,436 -1,619 -1,989 32,970 FY 2013....................................................................................................... 12.39 8.82 -2.55 -1.02 -1,232 -1,567 -1,591 44,374
38
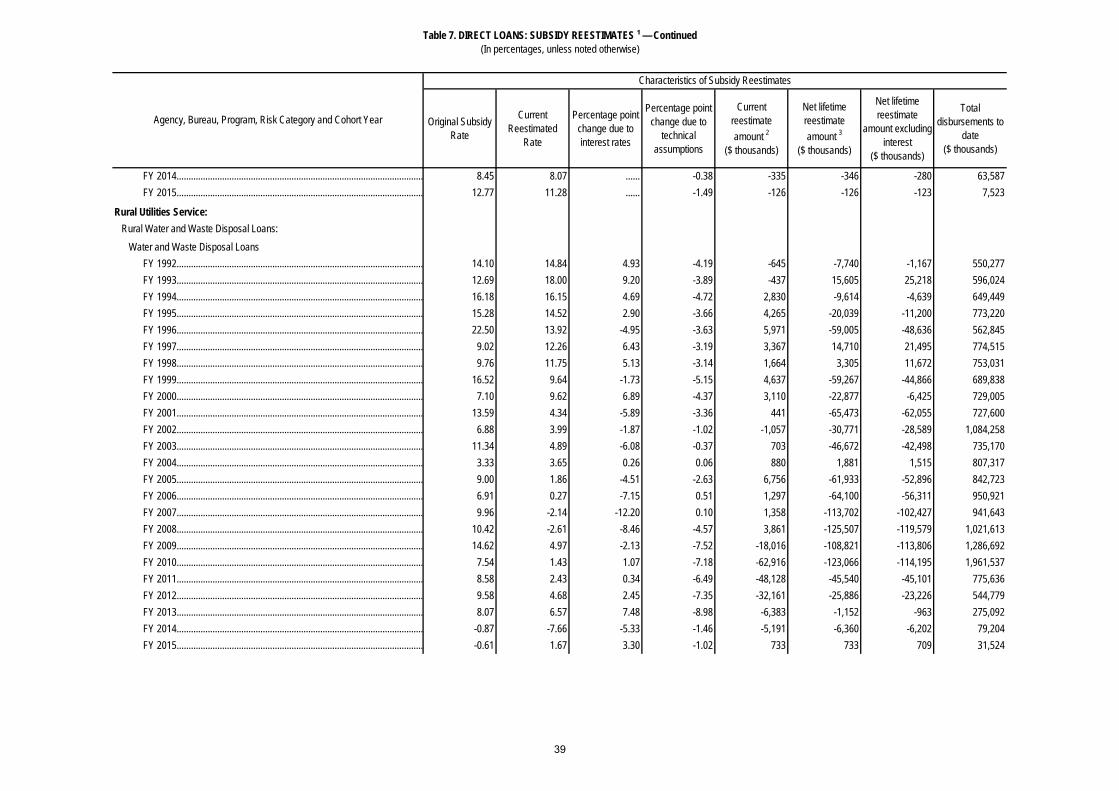
Table 7. DIRECT LOANS: SUBSIDY REESTIMATES ¹ — Continued (In percentages, unless noted otherwise)
Original Subsidy Rate
Current Reestimated
Rate
Percentage point change due to interest rates
Percentage point change due to
technical assumptions
Current reestimate amount 2
($ thousands)
Net lifetime reestimate amount 3
($ thousands)
Net lifetime reestimate
amount excluding interest
($ thousands)
Total disbursements to
date($ thousands)
Agency, Bureau, Program, Risk Category and Cohort Year
Characteristics of Subsidy Reestimates
FY 2014....................................................................................................... 8.45 8.07 ...... -0.38 -335 -346 -280 63,587 FY 2015....................................................................................................... 12.77 11.28 ...... -1.49 -126 -126 -123 7,523
Rural Utilities Service: Rural Water and Waste Disposal Loans: Water and Waste Disposal Loans FY 1992....................................................................................................... 14.10 14.84 4.93 -4.19 -645 -7,740 -1,167 550,277 FY 1993....................................................................................................... 12.69 18.00 9.20 -3.89 -437 15,605 25,218 596,024 FY 1994....................................................................................................... 16.18 16.15 4.69 -4.72 2,830 -9,614 -4,639 649,449 FY 1995....................................................................................................... 15.28 14.52 2.90 -3.66 4,265 -20,039 -11,200 773,220 FY 1996....................................................................................................... 22.50 13.92 -4.95 -3.63 5,971 -59,005 -48,636 562,845 FY 1997....................................................................................................... 9.02 12.26 6.43 -3.19 3,367 14,710 21,495 774,515 FY 1998....................................................................................................... 9.76 11.75 5.13 -3.14 1,664 3,305 11,672 753,031 FY 1999....................................................................................................... 16.52 9.64 -1.73 -5.15 4,637 -59,267 -44,866 689,838 FY 2000....................................................................................................... 7.10 9.62 6.89 -4.37 3,110 -22,877 -6,425 729,005 FY 2001....................................................................................................... 13.59 4.34 -5.89 -3.36 441 -65,473 -62,055 727,600 FY 2002....................................................................................................... 6.88 3.99 -1.87 -1.02 -1,057 -30,771 -28,589 1,084,258 FY 2003....................................................................................................... 11.34 4.89 -6.08 -0.37 703 -46,672 -42,498 735,170 FY 2004....................................................................................................... 3.33 3.65 0.26 0.06 880 1,881 1,515 807,317 FY 2005....................................................................................................... 9.00 1.86 -4.51 -2.63 6,756 -61,933 -52,896 842,723 FY 2006....................................................................................................... 6.91 0.27 -7.15 0.51 1,297 -64,100 -56,311 950,921 FY 2007....................................................................................................... 9.96 -2.14 -12.20 0.10 1,358 -113,702 -102,427 941,643 FY 2008....................................................................................................... 10.42 -2.61 -8.46 -4.57 3,861 -125,507 -119,579 1,021,613 FY 2009....................................................................................................... 14.62 4.97 -2.13 -7.52 -18,016 -108,821 -113,806 1,286,692 FY 2010....................................................................................................... 7.54 1.43 1.07 -7.18 -62,916 -123,066 -114,195 1,961,537 FY 2011....................................................................................................... 8.58 2.43 0.34 -6.49 -48,128 -45,540 -45,101 775,636 FY 2012....................................................................................................... 9.58 4.68 2.45 -7.35 -32,161 -25,886 -23,226 544,779 FY 2013....................................................................................................... 8.07 6.57 7.48 -8.98 -6,383 -1,152 -963 275,092 FY 2014....................................................................................................... -0.87 -7.66 -5.33 -1.46 -5,191 -6,360 -6,202 79,204 FY 2015....................................................................................................... -0.61 1.67 3.30 -1.02 733 733 709 31,524
39

Table 7. DIRECT LOANS: SUBSIDY REESTIMATES ¹ — Continued (In percentages, unless noted otherwise)
Original Subsidy Rate
Current Reestimated
Rate
Percentage point change due to interest rates
Percentage point change due to
technical assumptions
Current reestimate amount 2
($ thousands)
Net lifetime reestimate amount 3
($ thousands)
Net lifetime reestimate
amount excluding interest
($ thousands)
Total disbursements to
date($ thousands)
Agency, Bureau, Program, Risk Category and Cohort Year
Characteristics of Subsidy Reestimates
Rural Electrification and Telecommunications Loans: Electric Hardship Loans FY 1992....................................................................................................... 18.82 15.67 2.46 -5.61 -406 -46,969 -26,023 564,555 FY 1993....................................................................................................... 12.84 15.31 7.63 -5.16 302 -20,504 3,936 834,525 FY 1994....................................................................................................... 17.11 15.79 3.21 -4.53 53 -4,684 -3,387 102,780 FY 1995....................................................................................................... 13.09 11.44 5.91 -7.56 10 -5,075 -1,914 73,973 FY 1996....................................................................................................... 23.37 10.85 -9.73 -2.79 306 -13,983 -11,668 86,299 FY 1997....................................................................................................... 5.27 6.54 8.56 -7.29 8 -139 573 64,708 FY 1998....................................................................................................... 7.46 6.36 3.95 -5.05 138 -3,360 -1,883 124,414 FY 1999....................................................................................................... 13.04 5.88 -2.07 -5.09 11 -6,326 -5,214 70,270 FY 2000....................................................................................................... 0.90 4.69 7.19 -3.40 318 2,701 4,289 117,796 FY 2001....................................................................................................... 9.96 -0.43 -10.08 -0.31 33 -9,489 -12,834 111,889 FY 2002....................................................................................................... 2.98 -3.16 -6.65 0.51 -2 -4,804 -7,093 123,792 FY 2003....................................................................................................... 5.71 -1.90 -9.95 2.34 632 -7,198 -8,245 120,316 FY 2004....................................................................................................... -2.33 -1.35 -3.03 4.01 145 6,271 2,298 239,688 FY 2005....................................................................................................... 3.04 -2.48 -8.88 3.36 -9 -4,262 -5,860 119,037 FY 2006....................................................................................................... 0.92 -3.23 -8.80 4.65 -2 -1,517 -3,242 86,440 FY 2007....................................................................................................... 2.14 -6.66 -14.74 5.94 -272 -4,544 -7,282 92,360 FY 2008....................................................................................................... 0.12 -12.72 -18.48 5.64 -178 -7,692 -11,579 97,594 FY 2009....................................................................................................... -2.38 -6.36 -18.44 14.46 366 820 -2,164 54,031 FY 2010....................................................................................................... -27.73 -8.78 5.96 12.99 8,837 12,873 10,970 56,336 FY 2011....................................................................................................... -7.38 -5.08 -0.66 2.96 257 541 432 13,217 Municipal Electric Loans FY 1994....................................................................................................... 11.26 14.63 9.73 -6.36 -563 17,578 7,045 374,439 FY 1995....................................................................................................... 8.58 13.14 10.90 -6.34 -2,077 27,583 13,437 472,329 FY 1996....................................................................................................... 10.44 14.13 6.35 -2.66 -5,578 16,026 12,928 512,985 FY 1997....................................................................................................... 6.20 13.24 14.10 -7.06 -5,719 27,668 27,781 439,744 FY 1998....................................................................................................... 4.22 11.62 12.59 -5.19 696 34,967 31,852 487,787 FY 1999....................................................................................................... 8.76 9.91 8.81 -7.66 -3,243 -2,841 2,221 294,990 FY 2000....................................................................................................... 3.67 18.44 13.35 1.42 1,229 44,484 37,294 294,870 FY 2001....................................................................................................... 6.95 19.54 10.11 2.48 -779 42,910 25,285 293,670 FY 2002....................................................................................................... -0.09 6.46 10.07 -3.52 1,286 36,078 28,682 499,862 FY 2003....................................................................................................... 4.03 11.64 9.74 -2.13 -112 12,893 1,064 101,322
40

Table 7. DIRECT LOANS: SUBSIDY REESTIMATES ¹ — Continued (In percentages, unless noted otherwise)
Original Subsidy Rate
Current Reestimated
Rate
Percentage point change due to interest rates
Percentage point change due to
technical assumptions
Current reestimate amount 2
($ thousands)
Net lifetime reestimate amount 3
($ thousands)
Net lifetime reestimate
amount excluding interest
($ thousands)
Total disbursements to
date($ thousands)
Agency, Bureau, Program, Risk Category and Cohort Year
Characteristics of Subsidy Reestimates
FY 2004....................................................................................................... -2.42 5.35 10.76 -2.99 -3,319 49,467 42,863 617,551 FY 2005....................................................................................................... 1.35 9.19 13.94 -6.10 636 8,708 6,750 100,075 FY 2006....................................................................................................... 5.05 5.68 4.56 -3.93 -834 256 430 100,764 FY 2007....................................................................................................... 1.51 3.21 3.13 -1.43 -108 1,393 1,443 100,764 Treasury Electric Loans FY 2001....................................................................................................... 0.00 -0.60 0.51 -1.11 -741 3,197 -8,059 500,000 FY 2002....................................................................................................... -0.04 1.44 0.43 1.05 -487 17,774 6,113 746,035 FY 2003....................................................................................................... -0.04 -0.76 -0.71 -0.01 1,816 -3,246 -5,141 1,150,000 FY 2004....................................................................................................... -0.06 -0.45 0.43 -0.82 -220 548 -4,437 1,173,054 FY 2005....................................................................................................... -0.05 0.48 2.16 -1.63 -3,518 10,091 4,229 994,894 FY 2006....................................................................................................... 0.01 0.16 2.28 -2.13 -5,847 7,201 1,231 984,693 FY 2007....................................................................................................... 0.00 -1.09 -2.77 1.68 -2,017 -5,735 -9,730 958,165 FFB Electric Loans FY 1992....................................................................................................... 1.80 4.43 1.30 1.33 -416 21,694 18,462 715,687 FY 1993....................................................................................................... 4.51 -0.64 5.07 -10.22 -7,592 -22,457 -37,220 772,252 FY 1994....................................................................................................... 0.96 0.39 16.00 -16.57 -381 -5,156 -1,308 243,999 FY 1995....................................................................................................... -0.03 -1.03 8.71 -9.71 -7,476 -10,449 -3,046 296,148 FY 1996....................................................................................................... 0.84 -0.29 6.79 -7.92 -337 -2,042 -2,220 179,858 FY 1997....................................................................................................... 0.93 -2.52 2.12 -5.57 -10,724 -11,278 -9,491 284,765 FY 1998....................................................................................................... 0.92 0.66 3.70 -3.96 -593 -2,276 -1,046 254,799 FY 1999....................................................................................................... -0.38 4.05 3.07 1.36 -2,210 -25,699 42,821 1,030,133 FY 2000....................................................................................................... -1.18 0.41 5.44 -3.85 -36,334 -44,459 26,141 1,628,863 FY 2001....................................................................................................... -3.09 -1.38 5.11 -3.40 -7,329 9,589 27,708 1,619,572 FY 2002....................................................................................................... -1.13 -1.83 -1.35 0.65 -12,943 -46,104 -15,702 2,650,356 FY 2003....................................................................................................... -1.82 -3.07 -1.82 0.57 -40,517 -59,652 -25,828 2,473,489 FY 2004....................................................................................................... -1.99 -3.90 -2.06 0.15 -41,282 -48,280 -26,174 1,585,876 FY 2005....................................................................................................... -2.23 -2.98 -3.92 3.17 -16,057 -31,056 -12,584 2,035,590 FY 2006....................................................................................................... -0.48 -1.43 1.09 -2.04 -37,486 -92,567 -19,763 2,333,454 FY 2007....................................................................................................... -1.19 0.01 3.19 -1.99 -4,078 -57,633 26,137 2,611,096 FY 2008....................................................................................................... -0.70 2.17 3.95 -1.08 -59,599 -77,182 152,083 6,109,665 FY 2009....................................................................................................... -2.28 -1.44 2.97 -2.13 -151,283 -99,117 38,862 5,476,590
41
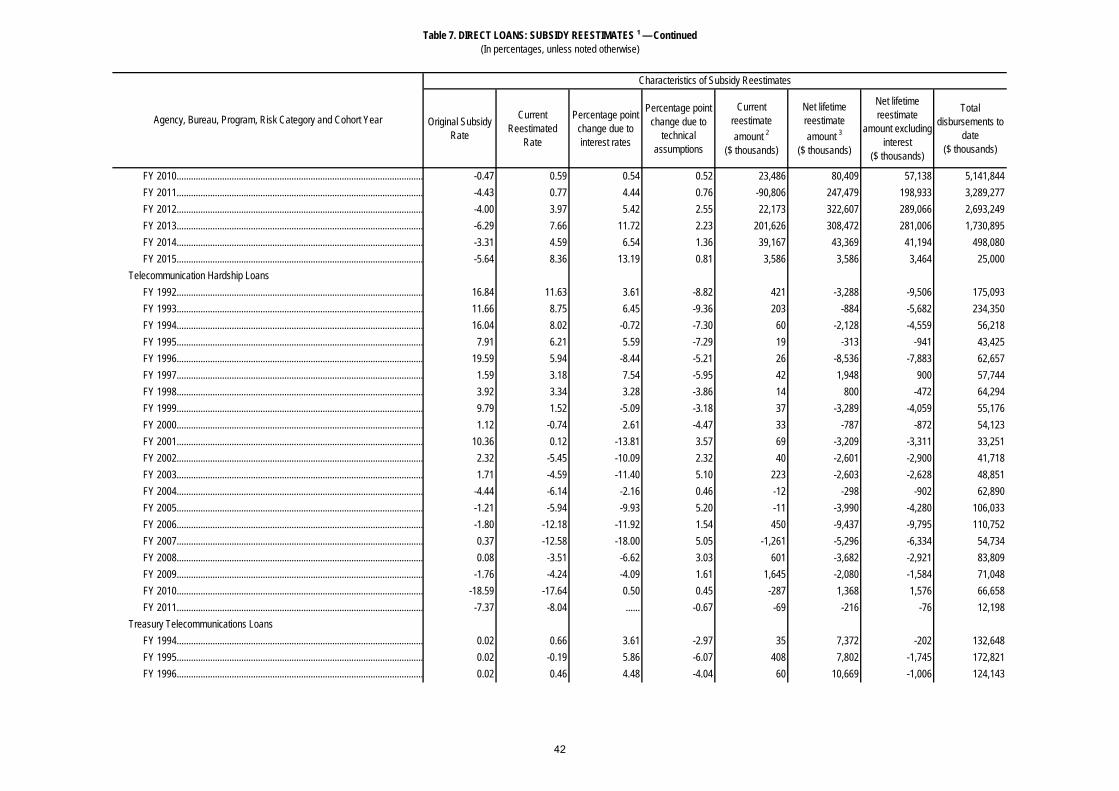
Table 7. DIRECT LOANS: SUBSIDY REESTIMATES ¹ — Continued (In percentages, unless noted otherwise)
Original Subsidy Rate
Current Reestimated
Rate
Percentage point change due to interest rates
Percentage point change due to
technical assumptions
Current reestimate amount 2
($ thousands)
Net lifetime reestimate amount 3
($ thousands)
Net lifetime reestimate
amount excluding interest
($ thousands)
Total disbursements to
date($ thousands)
Agency, Bureau, Program, Risk Category and Cohort Year
Characteristics of Subsidy Reestimates
FY 2010....................................................................................................... -0.47 0.59 0.54 0.52 23,486 80,409 57,138 5,141,844 FY 2011....................................................................................................... -4.43 0.77 4.44 0.76 -90,806 247,479 198,933 3,289,277 FY 2012....................................................................................................... -4.00 3.97 5.42 2.55 22,173 322,607 289,066 2,693,249 FY 2013....................................................................................................... -6.29 7.66 11.72 2.23 201,626 308,472 281,006 1,730,895 FY 2014....................................................................................................... -3.31 4.59 6.54 1.36 39,167 43,369 41,194 498,080 FY 2015....................................................................................................... -5.64 8.36 13.19 0.81 3,586 3,586 3,464 25,000 Telecommunication Hardship Loans FY 1992....................................................................................................... 16.84 11.63 3.61 -8.82 421 -3,288 -9,506 175,093 FY 1993....................................................................................................... 11.66 8.75 6.45 -9.36 203 -884 -5,682 234,350 FY 1994....................................................................................................... 16.04 8.02 -0.72 -7.30 60 -2,128 -4,559 56,218 FY 1995....................................................................................................... 7.91 6.21 5.59 -7.29 19 -313 -941 43,425 FY 1996....................................................................................................... 19.59 5.94 -8.44 -5.21 26 -8,536 -7,883 62,657 FY 1997....................................................................................................... 1.59 3.18 7.54 -5.95 42 1,948 900 57,744 FY 1998....................................................................................................... 3.92 3.34 3.28 -3.86 14 800 -472 64,294 FY 1999....................................................................................................... 9.79 1.52 -5.09 -3.18 37 -3,289 -4,059 55,176 FY 2000....................................................................................................... 1.12 -0.74 2.61 -4.47 33 -787 -872 54,123 FY 2001....................................................................................................... 10.36 0.12 -13.81 3.57 69 -3,209 -3,311 33,251 FY 2002....................................................................................................... 2.32 -5.45 -10.09 2.32 40 -2,601 -2,900 41,718 FY 2003....................................................................................................... 1.71 -4.59 -11.40 5.10 223 -2,603 -2,628 48,851 FY 2004....................................................................................................... -4.44 -6.14 -2.16 0.46 -12 -298 -902 62,890 FY 2005....................................................................................................... -1.21 -5.94 -9.93 5.20 -11 -3,990 -4,280 106,033 FY 2006....................................................................................................... -1.80 -12.18 -11.92 1.54 450 -9,437 -9,795 110,752 FY 2007....................................................................................................... 0.37 -12.58 -18.00 5.05 -1,261 -5,296 -6,334 54,734 FY 2008....................................................................................................... 0.08 -3.51 -6.62 3.03 601 -3,682 -2,921 83,809 FY 2009....................................................................................................... -1.76 -4.24 -4.09 1.61 1,645 -2,080 -1,584 71,048 FY 2010....................................................................................................... -18.59 -17.64 0.50 0.45 -287 1,368 1,576 66,658 FY 2011....................................................................................................... -7.37 -8.04 ...... -0.67 -69 -216 -76 12,198 Treasury Telecommunications Loans FY 1994....................................................................................................... 0.02 0.66 3.61 -2.97 35 7,372 -202 132,648 FY 1995....................................................................................................... 0.02 -0.19 5.86 -6.07 408 7,802 -1,745 172,821 FY 1996....................................................................................................... 0.02 0.46 4.48 -4.04 60 10,669 -1,006 124,143
42

Table 7. DIRECT LOANS: SUBSIDY REESTIMATES ¹ — Continued (In percentages, unless noted otherwise)
Original Subsidy Rate
Current Reestimated
Rate
Percentage point change due to interest rates
Percentage point change due to
technical assumptions
Current reestimate amount 2
($ thousands)
Net lifetime reestimate amount 3
($ thousands)
Net lifetime reestimate
amount excluding interest
($ thousands)
Total disbursements to
date($ thousands)
Agency, Bureau, Program, Risk Category and Cohort Year
Characteristics of Subsidy Reestimates
FY 1997....................................................................................................... 0.02 -0.02 5.25 -5.29 -108 3,884 14 114,785 FY 1998....................................................................................................... 0.02 0.45 3.76 -3.33 166 7,547 126 179,842 FY 1999....................................................................................................... 0.27 0.90 3.20 -2.57 -809 4,970 801 140,365 FY 2000....................................................................................................... 0.79 2.16 2.59 -1.22 3,500 7,913 2,193 185,451 FY 2001....................................................................................................... -1.00 -1.02 2.55 -2.57 100 16,479 -650 221,654 FY 2002....................................................................................................... 0.10 0.47 -0.29 0.66 849 4,152 623 180,026 FY 2003....................................................................................................... 0.05 -0.84 -1.90 1.01 580 2,130 -1,184 157,176 FY 2004....................................................................................................... 0.05 -2.21 -1.93 -0.33 124 -1,133 -973 43,451 FY 2005....................................................................................................... 0.04 -0.14 -6.85 6.67 1,274 515 -295 193,416 FY 2006....................................................................................................... 0.05 -1.44 -8.58 7.09 1,625 1,124 -3,639 273,954 FY 2007....................................................................................................... 0.03 -3.64 -2.18 -1.49 -9,317 760 -6,657 183,043 FY 2008....................................................................................................... 0.67 0.58 1.68 -1.77 1,680 1,593 -313 262,835 FY 2009....................................................................................................... 0.21 6.39 2.49 3.69 478 12,253 10,346 188,224 FY 2010....................................................................................................... -0.43 -1.75 -5.73 4.41 2,185 -3,156 -3,406 168,377 FY 2011....................................................................................................... -0.32 10.56 2.32 8.56 7,205 33,587 29,634 231,717 FY 2012....................................................................................................... -1.19 2.07 ...... 3.26 619 528 435 15,022 FY 2013....................................................................................................... -1.14 2.27 ...... 3.41 3,245 3,087 2,896 91,188 FY 2014....................................................................................................... -1.19 -3.58 ...... -2.39 -708 -708 -679 29,514
FY 2015....................................................................................................... -1.17 (4) ...... ...... ...... ...... ...... ...... FFB Telecommunications Loans FY 1992....................................................................................................... 0.00 3.92 8.13 -4.21 -41 -1,328 1,126 32,628 FY 1993....................................................................................................... 0.08 -1.08 2.10 -3.26 6 2,230 -720 48,978 FY 1994....................................................................................................... -4.01 6.86 34.50 -23.63 -308 2,448 4,379 46,234 FY 1995....................................................................................................... -3.91 -3.92 15.20 -15.21 53 3,989 -636 58,795 FY 1996....................................................................................................... -0.05 1.47 10.87 -9.35 25 -228 498 40,621 FY 1997....................................................................................................... -0.07 11.21 25.24 -13.96 -93 -1,230 3,691 36,156 FY 1998....................................................................................................... -0.07 1.40 8.64 -7.17 44 -273 372 33,455 FY 1999....................................................................................................... -0.81 2.63 12.78 -9.34 -71 -212 668 22,981 FY 2000....................................................................................................... -0.46 4.48 13.88 -8.94 29 -1,272 3,493 84,014 FY 2001....................................................................................................... -2.04 3.32 12.61 -7.25 94 1,922 3,748 89,558 FY 2002....................................................................................................... -0.85 0.86 4.49 -2.78 -228 -1,647 1,128 71,753
43

Table 7. DIRECT LOANS: SUBSIDY REESTIMATES ¹ — Continued (In percentages, unless noted otherwise)
Original Subsidy Rate
Current Reestimated
Rate
Percentage point change due to interest rates
Percentage point change due to
technical assumptions
Current reestimate amount 2
($ thousands)
Net lifetime reestimate amount 3
($ thousands)
Net lifetime reestimate
amount excluding interest
($ thousands)
Total disbursements to
date($ thousands)
Agency, Bureau, Program, Risk Category and Cohort Year
Characteristics of Subsidy Reestimates
FY 2003....................................................................................................... -2.36 4.89 22.30 -15.05 -256 536 7,795 111,867 FY 2004....................................................................................................... -1.85 1.95 4.32 -0.52 -742 1,167 7,420 207,487 FY 2005....................................................................................................... -1.95 -0.20 -3.75 5.50 -108 893 1,229 73,380 FY 2006....................................................................................................... -1.57 -0.58 0.52 0.47 -185 -1,093 822 98,851 FY 2007....................................................................................................... -1.49 -2.87 3.33 -4.71 -2,183 -1,101 -611 35,176 FY 2008....................................................................................................... 0.62 7.68 7.98 -0.92 -165 2,646 8,935 130,881 FY 2009....................................................................................................... -0.94 13.28 14.49 -0.27 -4,974 18,519 36,174 245,666 FY 2010....................................................................................................... -0.65 7.19 3.08 4.76 2,384 20,629 18,383 203,332 FY 2011....................................................................................................... -4.65 12.11 5.90 10.86 10,094 36,683 31,697 142,620 FY 2012....................................................................................................... -3.64 16.87 ...... 20.51 3,823 11,143 10,123 43,790 FY 2014....................................................................................................... -2.99 -3.54 ...... -0.55 -99 -99 -95 18,735 FFB Guaranteed Underwriting FY 2005....................................................................................................... 0.00 13.77 4.92 8.85 21,248 83,188 131,164 1,000,000 FY 2006....................................................................................................... -1.26 10.64 7.59 4.31 20,781 123,929 172,020 1,500,000 FY 2008....................................................................................................... -0.94 20.74 -5.76 27.44 8,091 37,314 103,942 500,000 FY 2010....................................................................................................... -1.85 -1.75 13.90 -13.80 23,201 4,572 586 500,000 FY 2011....................................................................................................... 0.14 -4.76 -6.83 1.93 20,714 -17,812 -23,396 499,000 FY 2012....................................................................................................... -6.32 -2.39 -26.36 30.29 -18,241 16,088 15,291 424,286
FY 2013....................................................................................................... -8.00 (4) ...... ...... ...... ...... ...... ...... FY 2014....................................................................................................... -4.32 -3.01 9.81 -8.50 2,830 2,830 2,697 205,000 Electric Loan Modifications FY 2006....................................................................................................... 2.41 4.52 -0.83 2.94 -71 991 608 20,299
FY 2007....................................................................................................... -3.82 -4.19 (6) -4.19 6,216 9,419 -43,655 1,161,184
FY 2009....................................................................................................... -28.99 -34.69 (6) -34.69 -5,359 -13,917 -31,484 127,843
FY 2014....................................................................................................... -9.92 -5.09 (6) -5.09 1,274 501 490 26,047 Rural Telephone Bank FY 1992....................................................................................................... 2.05 -4.17 2.95 -9.17 8 -10,018 -4,892 96,833 FY 1993....................................................................................................... 0.02 -4.79 2.59 -7.40 8 -6,919 -4,200 81,553 FY 1994....................................................................................................... 0.39 -5.79 5.44 -11.62 46 -3,615 -5,593 99,764 FY 1995....................................................................................................... 0.44 -5.96 7.12 -13.52 44 -2,404 -4,363 83,346 FY 1996....................................................................................................... 2.87 -6.40 1.18 -10.45 1 -1,792 -2,533 42,119
44

Table 7. DIRECT LOANS: SUBSIDY REESTIMATES ¹ — Continued (In percentages, unless noted otherwise)
Original Subsidy Rate
Current Reestimated
Rate
Percentage point change due to interest rates
Percentage point change due to
technical assumptions
Current reestimate amount 2
($ thousands)
Net lifetime reestimate amount 3
($ thousands)
Net lifetime reestimate
amount excluding interest
($ thousands)
Total disbursements to
date($ thousands)
Agency, Bureau, Program, Risk Category and Cohort Year
Characteristics of Subsidy Reestimates
FY 1997....................................................................................................... 1.32 -6.70 2.64 -10.66 14 -1,445 -2,940 41,660 FY 1998....................................................................................................... 2.12 -7.58 0.44 -10.14 230 -4,220 -5,851 71,713 FY 1999....................................................................................................... 2.65 -6.75 0.31 -9.71 721 -2,996 -3,478 51,939 FY 2000....................................................................................................... 1.88 -6.97 -7.16 -1.69 1,723 -4,102 -4,438 58,894 FY 2001....................................................................................................... 1.48 -8.21 -16.24 6.55 13 502 -4,018 45,488 FY 2002....................................................................................................... 2.14 -4.04 -15.51 9.33 421 -4,040 -3,336 42,251 FY 2003....................................................................................................... 1.38 -12.32 -18.16 4.46 -185 -5,435 -5,239 47,060 FY 2004....................................................................................................... -4.32 -10.18 -3.68 -2.18 -115 -3,262 -3,348 66,027 FY 2005....................................................................................................... -1.83 -8.94 -16.90 9.79 -180 -4,986 -5,720 91,732 Distance Learning and Telemedicine Loans FY 2001....................................................................................................... -0.61 10.59 2.67 8.53 2 15,363 7,829 73,591 FY 2002....................................................................................................... -0.07 37.39 -0.02 37.48 7 5,472 3,209 10,160 FY 2003....................................................................................................... -1.15 32.85 -0.34 34.34 144 8,648 5,182 17,082 FY 2004....................................................................................................... 0.00 11.06 -5.08 16.14 2,962 4,411 2,410 23,959 FY 2005....................................................................................................... 1.42 -0.99 -0.15 -2.26 ...... -24 -58 2,682 FY 2006....................................................................................................... 1.50 3.62 -3.27 5.39 ...... 74 82 4,124 FY 2007....................................................................................................... 0.63 0.29 1.53 -1.87 -210 894 -106 19,492 FY 2008....................................................................................................... 2.14 -2.22 -3.00 -1.36 31 -6 -233 5,765 FY 2009....................................................................................................... 2.46 7.10 0.37 4.27 562 512 315 6,587 Broadband 4% Loans FY 2004....................................................................................................... 4.94 -1.05 -0.39 -5.60 -25 -200 -206 4,138 Broadband Treasury Rate Loans FY 2002....................................................................................................... -0.07 29.93 -1.26 31.26 -251 21,493 14,794 52,767 FY 2003....................................................................................................... 2.22 -0.89 1.13 -4.24 -293 -1,027 -1,528 54,784 FY 2004....................................................................................................... 2.18 6.78 -0.37 4.97 858 12,067 5,940 146,544 FY 2005....................................................................................................... 2.13 1.86 6.84 -7.11 3,701 2,042 -193 71,454 FY 2006....................................................................................................... 2.15 3.81 2.79 -1.13 -859 4,706 1,323 100,787 FY 2007....................................................................................................... 2.15 18.86 0.49 16.22 352 15,400 10,059 70,973 FY 2008....................................................................................................... 2.15 46.56 17.71 26.70 -767 87,691 69,255 170,093 FY 2009....................................................................................................... 3.90 2.43 0.69 -2.16 -43 33 -76 5,221 FY 2010....................................................................................................... 7.24 8.26 -5.40 6.42 -124,457 14,272 15,880 1,084,868
45
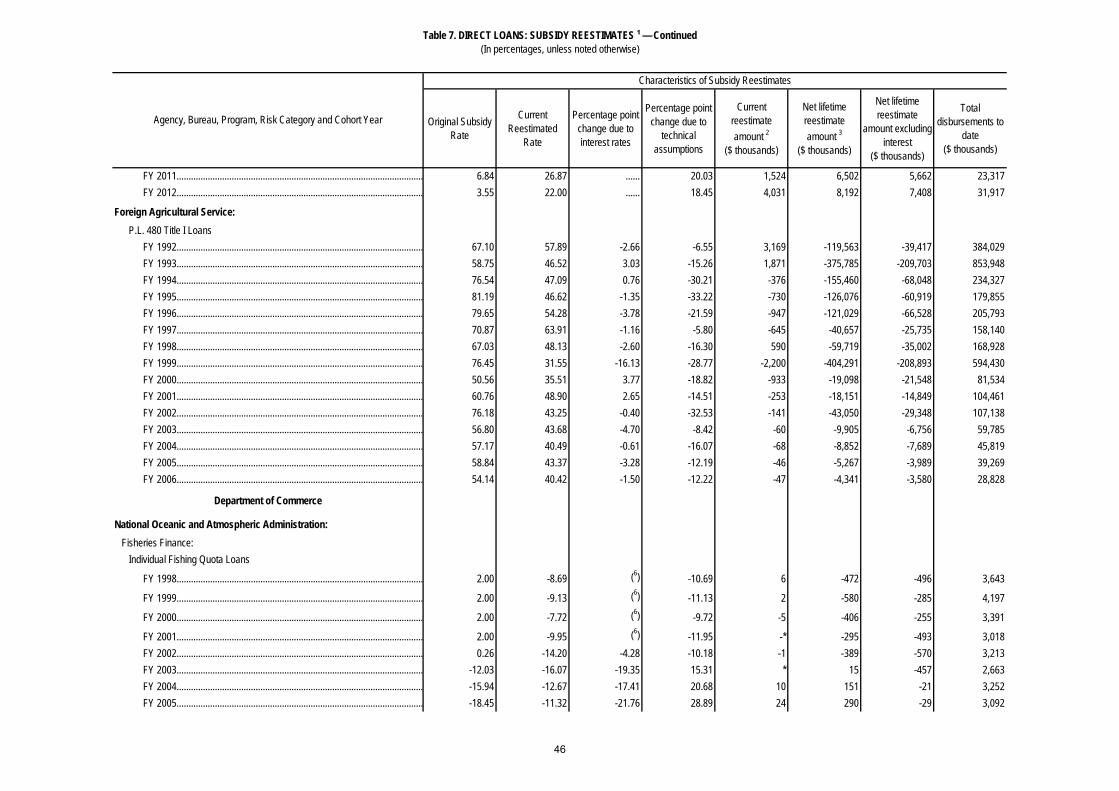
Table 7. DIRECT LOANS: SUBSIDY REESTIMATES ¹ — Continued (In percentages, unless noted otherwise)
Original Subsidy Rate
Current Reestimated
Rate
Percentage point change due to interest rates
Percentage point change due to
technical assumptions
Current reestimate amount 2
($ thousands)
Net lifetime reestimate amount 3
($ thousands)
Net lifetime reestimate
amount excluding interest
($ thousands)
Total disbursements to
date($ thousands)
Agency, Bureau, Program, Risk Category and Cohort Year
Characteristics of Subsidy Reestimates
FY 2011....................................................................................................... 6.84 26.87 ...... 20.03 1,524 6,502 5,662 23,317 FY 2012....................................................................................................... 3.55 22.00 ...... 18.45 4,031 8,192 7,408 31,917
Foreign Agricultural Service: P.L. 480 Title I Loans FY 1992....................................................................................................... 67.10 57.89 -2.66 -6.55 3,169 -119,563 -39,417 384,029 FY 1993....................................................................................................... 58.75 46.52 3.03 -15.26 1,871 -375,785 -209,703 853,948 FY 1994....................................................................................................... 76.54 47.09 0.76 -30.21 -376 -155,460 -68,048 234,327 FY 1995....................................................................................................... 81.19 46.62 -1.35 -33.22 -730 -126,076 -60,919 179,855 FY 1996....................................................................................................... 79.65 54.28 -3.78 -21.59 -947 -121,029 -66,528 205,793 FY 1997....................................................................................................... 70.87 63.91 -1.16 -5.80 -645 -40,657 -25,735 158,140 FY 1998....................................................................................................... 67.03 48.13 -2.60 -16.30 590 -59,719 -35,002 168,928 FY 1999....................................................................................................... 76.45 31.55 -16.13 -28.77 -2,200 -404,291 -208,893 594,430 FY 2000....................................................................................................... 50.56 35.51 3.77 -18.82 -933 -19,098 -21,548 81,534 FY 2001....................................................................................................... 60.76 48.90 2.65 -14.51 -253 -18,151 -14,849 104,461 FY 2002....................................................................................................... 76.18 43.25 -0.40 -32.53 -141 -43,050 -29,348 107,138 FY 2003....................................................................................................... 56.80 43.68 -4.70 -8.42 -60 -9,905 -6,756 59,785 FY 2004....................................................................................................... 57.17 40.49 -0.61 -16.07 -68 -8,852 -7,689 45,819 FY 2005....................................................................................................... 58.84 43.37 -3.28 -12.19 -46 -5,267 -3,989 39,269 FY 2006....................................................................................................... 54.14 40.42 -1.50 -12.22 -47 -4,341 -3,580 28,828
Department of Commerce
National Oceanic and Atmospheric Administration: Fisheries Finance: Individual Fishing Quota Loans
FY 1998....................................................................................................... 2.00 -8.69 (6) -10.69 6 -472 -496 3,643
FY 1999....................................................................................................... 2.00 -9.13 (6) -11.13 2 -580 -285 4,197
FY 2000....................................................................................................... 2.00 -7.72 (6) -9.72 -5 -406 -255 3,391
FY 2001....................................................................................................... 2.00 -9.95 (6) -11.95 -* -295 -493 3,018 FY 2002....................................................................................................... 0.26 -14.20 -4.28 -10.18 -1 -389 -570 3,213 FY 2003....................................................................................................... -12.03 -16.07 -19.35 15.31 * 15 -457 2,663 FY 2004....................................................................................................... -15.94 -12.67 -17.41 20.68 10 151 -21 3,252 FY 2005....................................................................................................... -18.45 -11.32 -21.76 28.89 24 290 -29 3,092
46

Table 7. DIRECT LOANS: SUBSIDY REESTIMATES ¹ — Continued (In percentages, unless noted otherwise)
Original Subsidy Rate
Current Reestimated
Rate
Percentage point change due to interest rates
Percentage point change due to
technical assumptions
Current reestimate amount 2
($ thousands)
Net lifetime reestimate amount 3
($ thousands)
Net lifetime reestimate
amount excluding interest
($ thousands)
Total disbursements to
date($ thousands)
Agency, Bureau, Program, Risk Category and Cohort Year
Characteristics of Subsidy Reestimates
FY 2006....................................................................................................... -11.88 -10.34 -15.84 17.38 115 126 -30 3,469 FY 2007....................................................................................................... -8.08 -13.60 -17.48 11.96 75 -7 -317 2,355 FY 2008....................................................................................................... -10.58 -16.21 -15.47 9.84 167 -52 -391 3,765 FY 2009....................................................................................................... -12.78 -19.20 -3.26 -3.16 52 -81 -322 4,961 FY 2010....................................................................................................... -12.00 -20.63 0.77 -9.40 409 -590 -463 5,557 FY 2011....................................................................................................... -15.25 -3.46 ...... 11.79 129 488 431 3,776 FY 2012....................................................................................................... -12.80 -7.80 ...... 5.00 -7 242 227 4,476 FY 2013....................................................................................................... -2.70 -18.01 ...... -15.31 -52 -117 -108 689 FY 2014....................................................................................................... -8.06 -20.32 ...... -12.26 -114 -114 -108 906
FY 2015....................................................................................................... -2.37 (4) ...... ...... ...... ...... ...... ...... Traditional Direct Loans
FY 1999....................................................................................................... 1.00 (5) ...... ...... ...... ...... ...... 20,288
FY 2000....................................................................................................... 1.00 (5) ...... ...... ...... ...... ...... 12,150 FY 2001....................................................................................................... 1.00 -4.63 ...... -5.63 2 -875 -1,310 16,517
FY 2002....................................................................................................... 1.00 (5) ...... ...... ...... ...... ...... 19,000 FY 2003....................................................................................................... -11.89 -15.38 -18.61 15.12 77 -568 -550 13,230 FY 2004....................................................................................................... -5.49 -8.53 -6.71 3.67 296 -3,337 -1,260 59,000 FY 2005....................................................................................................... -13.71 4.52 -14.48 32.71 267 12,882 7,146 52,092 FY 2006....................................................................................................... -8.07 -4.92 -9.57 12.72 420 2,353 2,732 46,275 FY 2007....................................................................................................... -8.01 -4.83 -14.25 17.43 732 2,493 -851 33,118 FY 2008....................................................................................................... -4.63 -7.61 -14.80 11.82 2,502 771 -3,194 29,116 FY 2009....................................................................................................... -6.43 -8.41 -16.04 14.06 538 1,776 -5,611 54,760 FY 2010....................................................................................................... -8.49 -15.87 -8.81 1.43 188 -5,164 -1,721 56,500 FY 2011....................................................................................................... -10.46 -4.76 ...... 5.70 196 2,921 2,664 46,671 FY 2012....................................................................................................... -13.77 -8.67 -8.86 13.96 3,410 2,040 1,686 34,521 FY 2013....................................................................................................... -4.83 -20.96 ...... -16.13 -660 -5,418 -5,095 30,694 FY 2014....................................................................................................... -7.36 -24.67 ...... -17.31 -11,853 -11,853 -11,369 67,047
FY 2015....................................................................................................... -4.87 (4) ...... ...... ...... ...... ...... ...... Pacific Ground Fish FY 2003....................................................................................................... 1.08 -22.00 -7.23 -15.85 663 -10,605 -7,853 35,662
47

Table 7. DIRECT LOANS: SUBSIDY REESTIMATES ¹ — Continued (In percentages, unless noted otherwise)
Original Subsidy Rate
Current Reestimated
Rate
Percentage point change due to interest rates
Percentage point change due to
technical assumptions
Current reestimate amount 2
($ thousands)
Net lifetime reestimate amount 3
($ thousands)
Net lifetime reestimate
amount excluding interest
($ thousands)
Total disbursements to
date($ thousands)
Agency, Bureau, Program, Risk Category and Cohort Year
Characteristics of Subsidy Reestimates
Non-Pollock Buyback FY 2006....................................................................................................... 1.00 -17.76 ...... -18.76 -225 -7,431 -6,606 37,700 Pollock Buyback FY 1999....................................................................................................... 1.00 -10.86 -4.69 -7.17 -175 -12,693 -9,227 75,000 Crab Buyback FY 2002....................................................................................................... -4.60 -24.55 -7.30 -12.65 1,104 -21,079 -19,383 97,399 Seine Buyback FY 2012....................................................................................................... 1.00 -5.01 -1.00 -5.01 -4 -865 -790 13,133
Department of Defense—Military Programs
Family Housing: Department of Defense Family Housing Improvement Fund: Family Housing Improvement Fund Direct Loans FY 2000....................................................................................................... 53.48 53.00 -0.88 0.40 -82 -2,670 205 51,149 FY 2001....................................................................................................... 52.63 40.79 -1.26 -10.59 -141 -14,909 -9,245 79,899 FY 2002....................................................................................................... 37.97 20.05 -4.90 -13.02 -339 -3,637 -2,579 21,950 FY 2003....................................................................................................... 34.92 10.15 -15.33 -9.44 -1,353 -18,362 -12,098 58,550 FY 2004....................................................................................................... 34.41 25.12 -3.02 -6.28 -1,903 -15,499 -9,739 118,125 FY 2005....................................................................................................... 19.13 -7.27 -19.47 -6.93 -4,452 -58,402 -46,543 207,505 FY 2006....................................................................................................... 1.63 -15.36 -12.76 -4.24 -501 -12,855 -11,330 74,700 FY 2007....................................................................................................... 14.56 -10.74 -19.35 -5.95 -4,205 -96,849 -86,241 405,833 FY 2008....................................................................................................... 20.64 16.63 -16.12 12.11 -5,128 -7,666 -4,568 136,593 FY 2009....................................................................................................... 32.06 18.93 -15.78 2.65 -1,551 -16,384 -14,057 117,000 FY 2011....................................................................................................... 24.20 5.65 -14.85 -3.70 -470 -31,201 -31,315 209,474 FY 2012....................................................................................................... 14.07 18.97 ...... 4.89 1,103 11,435 9,968 108,300
Department of Education
Office of Postsecondary Education: College Housing and Academic Facilities: College Housing and Academic Facilities Loans FY 1992....................................................................................................... 25.13 12.35 -10.84 -1.94 88 -1,833 -1,187 9,344 FY 1993....................................................................................................... 10.09 10.73 3.77 -3.13 -236 -1,135 229 17,871 Historically Black Colleges and Universities FY 1996....................................................................................................... 0.00 1.61 ...... 1.61 -92 -382 48 3,389
48
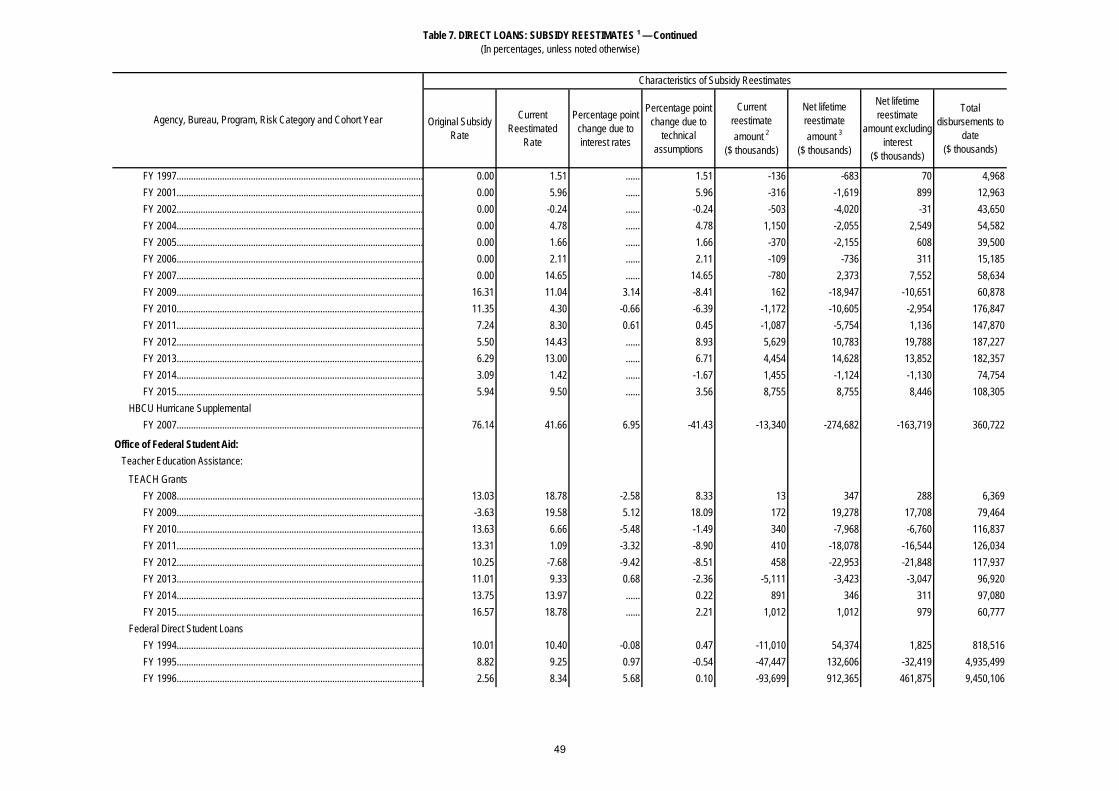
Table 7. DIRECT LOANS: SUBSIDY REESTIMATES ¹ — Continued (In percentages, unless noted otherwise)
Original Subsidy Rate
Current Reestimated
Rate
Percentage point change due to interest rates
Percentage point change due to
technical assumptions
Current reestimate amount 2
($ thousands)
Net lifetime reestimate amount 3
($ thousands)
Net lifetime reestimate
amount excluding interest
($ thousands)
Total disbursements to
date($ thousands)
Agency, Bureau, Program, Risk Category and Cohort Year
Characteristics of Subsidy Reestimates
FY 1997....................................................................................................... 0.00 1.51 ...... 1.51 -136 -683 70 4,968 FY 2001....................................................................................................... 0.00 5.96 ...... 5.96 -316 -1,619 899 12,963 FY 2002....................................................................................................... 0.00 -0.24 ...... -0.24 -503 -4,020 -31 43,650 FY 2004....................................................................................................... 0.00 4.78 ...... 4.78 1,150 -2,055 2,549 54,582 FY 2005....................................................................................................... 0.00 1.66 ...... 1.66 -370 -2,155 608 39,500 FY 2006....................................................................................................... 0.00 2.11 ...... 2.11 -109 -736 311 15,185 FY 2007....................................................................................................... 0.00 14.65 ...... 14.65 -780 2,373 7,552 58,634 FY 2009....................................................................................................... 16.31 11.04 3.14 -8.41 162 -18,947 -10,651 60,878 FY 2010....................................................................................................... 11.35 4.30 -0.66 -6.39 -1,172 -10,605 -2,954 176,847 FY 2011....................................................................................................... 7.24 8.30 0.61 0.45 -1,087 -5,754 1,136 147,870 FY 2012....................................................................................................... 5.50 14.43 ...... 8.93 5,629 10,783 19,788 187,227 FY 2013....................................................................................................... 6.29 13.00 ...... 6.71 4,454 14,628 13,852 182,357 FY 2014....................................................................................................... 3.09 1.42 ...... -1.67 1,455 -1,124 -1,130 74,754 FY 2015....................................................................................................... 5.94 9.50 ...... 3.56 8,755 8,755 8,446 108,305 HBCU Hurricane Supplemental FY 2007....................................................................................................... 76.14 41.66 6.95 -41.43 -13,340 -274,682 -163,719 360,722
Office of Federal Student Aid: Teacher Education Assistance: TEACH Grants FY 2008....................................................................................................... 13.03 18.78 -2.58 8.33 13 347 288 6,369 FY 2009....................................................................................................... -3.63 19.58 5.12 18.09 172 19,278 17,708 79,464 FY 2010....................................................................................................... 13.63 6.66 -5.48 -1.49 340 -7,968 -6,760 116,837 FY 2011....................................................................................................... 13.31 1.09 -3.32 -8.90 410 -18,078 -16,544 126,034 FY 2012....................................................................................................... 10.25 -7.68 -9.42 -8.51 458 -22,953 -21,848 117,937 FY 2013....................................................................................................... 11.01 9.33 0.68 -2.36 -5,111 -3,423 -3,047 96,920 FY 2014....................................................................................................... 13.75 13.97 ...... 0.22 891 346 311 97,080 FY 2015....................................................................................................... 16.57 18.78 ...... 2.21 1,012 1,012 979 60,777 Federal Direct Student Loans FY 1994....................................................................................................... 10.01 10.40 -0.08 0.47 -11,010 54,374 1,825 818,516 FY 1995....................................................................................................... 8.82 9.25 0.97 -0.54 -47,447 132,606 -32,419 4,935,499 FY 1996....................................................................................................... 2.56 8.34 5.68 0.10 -93,699 912,365 461,875 9,450,106
49

Table 7. DIRECT LOANS: SUBSIDY REESTIMATES ¹ — Continued (In percentages, unless noted otherwise)
Original Subsidy Rate
Current Reestimated
Rate
Percentage point change due to interest rates
Percentage point change due to
technical assumptions
Current reestimate amount 2
($ thousands)
Net lifetime reestimate amount 3
($ thousands)
Net lifetime reestimate
amount excluding interest
($ thousands)
Total disbursements to
date($ thousands)
Agency, Bureau, Program, Risk Category and Cohort Year
Characteristics of Subsidy Reestimates
FY 1997....................................................................................................... 3.09 8.20 4.42 0.69 -53,425 1,094,931 527,703 11,127,845 FY 1998....................................................................................................... 1.70 7.02 3.97 1.35 -71,864 1,217,500 524,893 12,515,172 FY 1999....................................................................................................... -2.11 7.53 8.12 1.52 195,481 2,410,892 1,508,623 17,778,845 FY 2000....................................................................................................... -8.96 10.93 19.95 -0.06 -246,828 3,316,537 2,829,792 15,995,721 FY 2001....................................................................................................... -4.46 7.12 11.71 -0.13 -286,062 2,088,877 1,838,595 18,096,861 FY 2002....................................................................................................... -3.88 7.12 8.11 2.89 -63,597 2,149,406 1,813,634 20,019,898 FY 2003....................................................................................................... -1.46 4.87 2.89 3.44 386,654 999,113 778,611 18,421,515 FY 2004....................................................................................................... -0.62 7.79 4.16 4.25 370,606 1,571,488 1,241,623 20,161,330 FY 2005....................................................................................................... 3.47 8.87 0.34 5.06 -50,130 866,825 665,691 28,334,647 FY 2006....................................................................................................... 5.12 4.04 -2.69 1.61 -364,625 -1,667,239 -1,474,715 31,560,305 FY 2007....................................................................................................... 1.48 2.83 -2.63 3.98 92,880 21,897 -133,027 16,014,618 FY 2008....................................................................................................... -0.80 3.68 -4.99 9.47 173,750 1,491,987 1,051,492 23,716,861 FY 2009....................................................................................................... -14.96 -10.90 2.95 1.11 449,802 269,900 237,544 41,427,241 FY 2010....................................................................................................... -7.66 -9.52 -6.32 4.46 881,389 -2,644,780 -2,953,025 97,910,335 FY 2011....................................................................................................... -13.91 -13.02 -3.64 4.53 752,528 511,744 385,934 133,904,427 FY 2012....................................................................................................... -16.49 -20.42 -9.02 5.09 1,254,609 -5,651,224 -5,467,870 140,689,910 FY 2013....................................................................................................... -19.73 -10.97 1.68 7.08 1,256,890 11,741,318 11,376,459 129,297,452 FY 2014....................................................................................................... -15.14 -6.21 ...... 8.93 4,063,527 10,993,011 10,615,966 133,756,182 FY 2015....................................................................................................... -2.67 -2.94 ...... -0.27 -896,140 -896,140 -870,800 112,616,460 Federal Family Education Loan: Direct Participation Agreement Reestimates FY 2008....................................................................................................... 1.54 -10.90 -9.26 -3.18 -159,631 -1,756,459 -1,560,016 18,000,976 FY 2009....................................................................................................... 0.88 -15.29 -11.29 -4.88 519,202 -2,130,130 -1,854,463 38,820,367 FY 2010....................................................................................................... -4.10 -12.22 -5.58 -2.54 130,013 -744,535 -765,176 12,989,955 Direct Standard Put Reestimates FY 2008....................................................................................................... -3.84 -14.60 -11.61 0.85 86,069 -1,271,238 -1,211,037 9,240,321 FY 2009....................................................................................................... -15.13 -12.48 6.42 -3.77 388,636 -115,569 -51,318 24,903,205 FY 2010....................................................................................................... -7.76 -11.18 -2.94 -0.48 90,337 -79,353 -79,003 6,859,750
Department of Energy
Advanced Technology Vehicles Manufacturing Loans: Direct Auto Loans FY 2009....................................................................................................... 38.28 2.96 -1.59 -33.73 -11,573 -2,794,698 -2,684,677 7,231,342
50

Table 7. DIRECT LOANS: SUBSIDY REESTIMATES ¹ — Continued (In percentages, unless noted otherwise)
Original Subsidy Rate
Current Reestimated
Rate
Percentage point change due to interest rates
Percentage point change due to
technical assumptions
Current reestimate amount 2
($ thousands)
Net lifetime reestimate amount 3
($ thousands)
Net lifetime reestimate
amount excluding interest
($ thousands)
Total disbursements to
date($ thousands)
Agency, Bureau, Program, Risk Category and Cohort Year
Characteristics of Subsidy Reestimates
FY 2011....................................................................................................... 22.93 81.89 -0.11 59.07 ...... 24,530 23,664 49,485 Title 17 Innovative Technology Loan Guarantee Program: Section 1703 FFB Loans (Self Pay) FY 2014....................................................................................................... -4.20 -4.11 ...... 0.09 -2,358 2,350 8,839 2,795,000 FY 2015....................................................................................................... -1.24 -3.20 -7.39 5.43 -12,201 -12,201 -19,789 1,136,841 Section 1705 FFB Loans FY 2009....................................................................................................... 7.57 98.57 -0.34 91.34 ...... 495,206 467,349 527,809 FY 2010....................................................................................................... 10.16 15.06 -1.54 6.44 -8,313 6,079 7,136 148,996 FY 2011....................................................................................................... 14.98 12.03 -9.77 6.82 23,214 -6,744 -160,280 8,389,917
Department of Health and Human Services
Centers for Medicare and Medicaid Services: Consumer Operated and Oriented Plan Program Contingency Fund: Startup Loans FY 2013....................................................................................................... 37.66 53.26 -1.84 17.44 1,262 1,086 1,039 6,836 FY 2014....................................................................................................... 35.66 43.48 1.24 6.58 3,121 2,798 2,769 36,160 Solvency Loans FY 2014....................................................................................................... 42.08 68.17 ...... 26.09 56,396 56,307 53,534 212,917 FY 2015....................................................................................................... 48.22 84.13 -6.12 42.03 31,851 31,851 31,123 87,668 Consumer Operated and Oriented Plan: Startup Loans FY 2012....................................................................................................... 37.51 54.70 -3.94 21.13 60,095 53,009 50,592 279,176 FY 2013....................................................................................................... 37.66 27.19 -1.84 -8.63 -2,818 -3,962 -3,891 37,359 Solvency Loans FY 2012....................................................................................................... 43.99 76.73 -4.93 37.67 399,381 434,983 389,629 1,274,221 FY 2013....................................................................................................... 41.90 55.82 ...... 13.92 16,765 25,362 23,298 150,421
Department of Homeland Security
Federal Emergency Management Agency: Disaster Assistance Direct Loan: Community Disaster Loan Program
FY 2009....................................................................................................... 93.95 71.78 ...... -22.17 281 -14,282 -11,274 53,578
51

Table 7. DIRECT LOANS: SUBSIDY REESTIMATES ¹ — Continued (In percentages, unless noted otherwise)
Original Subsidy Rate
Current Reestimated
Rate
Percentage point change due to interest rates
Percentage point change due to
technical assumptions
Current reestimate amount 2
($ thousands)
Net lifetime reestimate amount 3
($ thousands)
Net lifetime reestimate
amount excluding interest
($ thousands)
Total disbursements to
date($ thousands)
Agency, Bureau, Program, Risk Category and Cohort Year
Characteristics of Subsidy Reestimates
FY 2012....................................................................................................... 86.06 98.83 0.37 12.40 -268 643 630 4,684
FY 2013....................................................................................................... 91.63 98.57 ...... 6.94 -30,997 29,024 29,097 106,546
FY 2015....................................................................................................... 96.35 98.60 ...... 2.25 9 9 9 413 Special Community Disaster Loans FY 2006....................................................................................................... 75.00 98.01 -4.35 27.36 614 -258,252 -301,448 1,040,741
Department of Housing and Urban Development
Housing Programs: Energy Retrofit Loans FY 2010....................................................................................................... 82.30 66.88 6.24 -21.66 -13,373 -17,879 -12,653 83,265 FFB Risk Sharing FY 2015....................................................................................................... -10.83 -15.86 ...... -5.03 -4,877 -4,877 -5,215 102,891
Department of the Interior
Bureau of Reclamation: Reclamation Loans FY 1995....................................................................................................... 69.55 64.21 -2.59 -2.75 -2 -139 325 3,225 FY 1996....................................................................................................... 54.20 62.87 6.93 1.75 -3 -124 112 6,574 FY 1997....................................................................................................... 54.84 55.58 9.95 -9.22 -5 930 1,189 7,188 FY 1998....................................................................................................... 50.63 45.09 0.01 -5.55 -4 521 258 6,816 FY 1999....................................................................................................... 44.31 40.24 8.78 -12.84 -6 719 101 9,129 FY 2000....................................................................................................... 48.31 41.59 -2.64 -4.08 -7 2,101 1,523 11,795 FY 2001....................................................................................................... 41.37 32.07 3.32 -12.62 -9 624 77 5,670 FY 2002....................................................................................................... 37.80 25.71 -2.15 -9.94 -2 60 -218 4,317
Bureau of Indian Affairs: Indian Direct Loans
FY 1992....................................................................................................... 19.30 61.95 (6) 42.65 33 1,136 3,385 11,223
FY 1993....................................................................................................... 19.80 8.02 (6) -11.78 179 -4,774 -1,010 11,230
FY 1994....................................................................................................... 22.81 43.75 (6) 20.94 78 3,748 4,316 10,873
FY 1995....................................................................................................... 22.81 40.61 (6) 17.80 -3 1,008 1,114 3,273
52
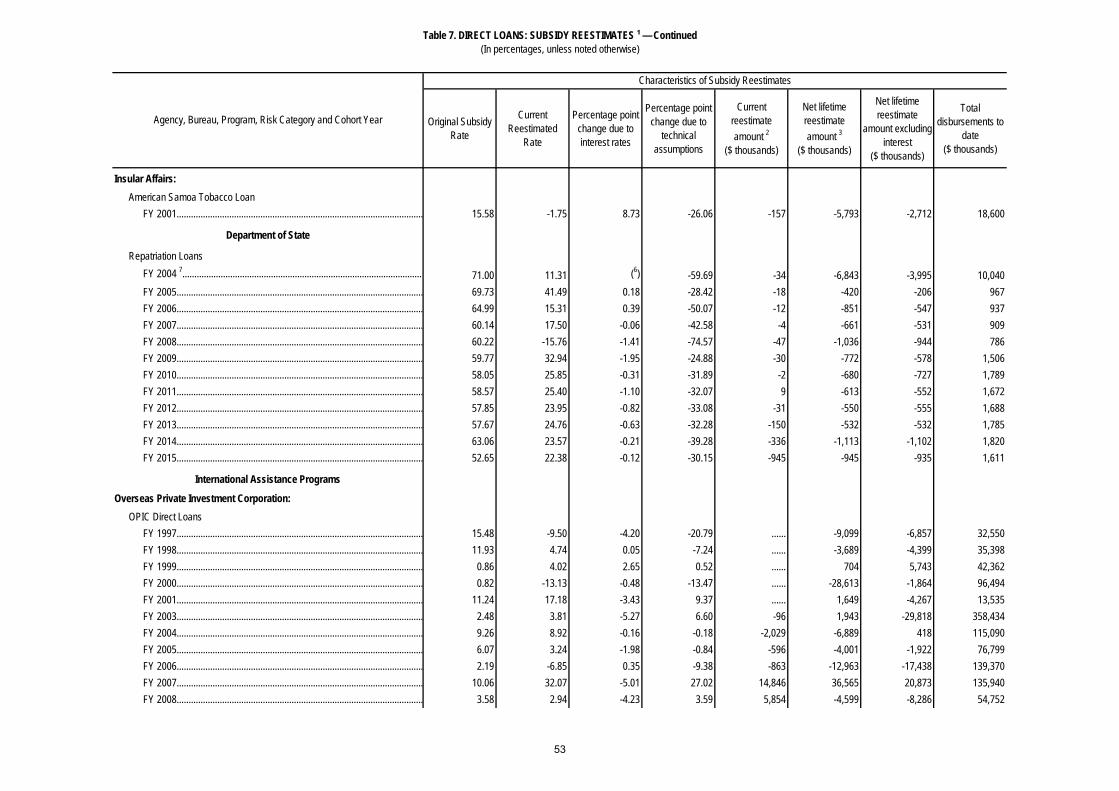
Table 7. DIRECT LOANS: SUBSIDY REESTIMATES ¹ — Continued (In percentages, unless noted otherwise)
Original Subsidy Rate
Current Reestimated
Rate
Percentage point change due to interest rates
Percentage point change due to
technical assumptions
Current reestimate amount 2
($ thousands)
Net lifetime reestimate amount 3
($ thousands)
Net lifetime reestimate
amount excluding interest
($ thousands)
Total disbursements to
date($ thousands)
Agency, Bureau, Program, Risk Category and Cohort Year
Characteristics of Subsidy Reestimates
Insular Affairs: American Samoa Tobacco Loan FY 2001....................................................................................................... 15.58 -1.75 8.73 -26.06 -157 -5,793 -2,712 18,600
Department of State
Repatriation Loans FY 2004 7.................................................................................................... 71.00 11.31 (6) -59.69 -34 -6,843 -3,995 10,040 FY 2005....................................................................................................... 69.73 41.49 0.18 -28.42 -18 -420 -206 967 FY 2006....................................................................................................... 64.99 15.31 0.39 -50.07 -12 -851 -547 937 FY 2007....................................................................................................... 60.14 17.50 -0.06 -42.58 -4 -661 -531 909 FY 2008....................................................................................................... 60.22 -15.76 -1.41 -74.57 -47 -1,036 -944 786 FY 2009....................................................................................................... 59.77 32.94 -1.95 -24.88 -30 -772 -578 1,506 FY 2010....................................................................................................... 58.05 25.85 -0.31 -31.89 -2 -680 -727 1,789 FY 2011....................................................................................................... 58.57 25.40 -1.10 -32.07 9 -613 -552 1,672 FY 2012....................................................................................................... 57.85 23.95 -0.82 -33.08 -31 -550 -555 1,688 FY 2013....................................................................................................... 57.67 24.76 -0.63 -32.28 -150 -532 -532 1,785 FY 2014....................................................................................................... 63.06 23.57 -0.21 -39.28 -336 -1,113 -1,102 1,820 FY 2015....................................................................................................... 52.65 22.38 -0.12 -30.15 -945 -945 -935 1,611
International Assistance Programs
Overseas Private Investment Corporation: OPIC Direct Loans FY 1997....................................................................................................... 15.48 -9.50 -4.20 -20.79 ...... -9,099 -6,857 32,550 FY 1998....................................................................................................... 11.93 4.74 0.05 -7.24 ...... -3,689 -4,399 35,398 FY 1999....................................................................................................... 0.86 4.02 2.65 0.52 ...... 704 5,743 42,362 FY 2000....................................................................................................... 0.82 -13.13 -0.48 -13.47 ...... -28,613 -1,864 96,494 FY 2001....................................................................................................... 11.24 17.18 -3.43 9.37 ...... 1,649 -4,267 13,535 FY 2003....................................................................................................... 2.48 3.81 -5.27 6.60 -96 1,943 -29,818 358,434 FY 2004....................................................................................................... 9.26 8.92 -0.16 -0.18 -2,029 -6,889 418 115,090 FY 2005....................................................................................................... 6.07 3.24 -1.98 -0.84 -596 -4,001 -1,922 76,799 FY 2006....................................................................................................... 2.19 -6.85 0.35 -9.38 -863 -12,963 -17,438 139,370 FY 2007....................................................................................................... 10.06 32.07 -5.01 27.02 14,846 36,565 20,873 135,940 FY 2008....................................................................................................... 3.58 2.94 -4.23 3.59 5,854 -4,599 -8,286 54,752
53

Table 7. DIRECT LOANS: SUBSIDY REESTIMATES ¹ — Continued (In percentages, unless noted otherwise)
Original Subsidy Rate
Current Reestimated
Rate
Percentage point change due to interest rates
Percentage point change due to
technical assumptions
Current reestimate amount 2
($ thousands)
Net lifetime reestimate amount 3
($ thousands)
Net lifetime reestimate
amount excluding interest
($ thousands)
Total disbursements to
date($ thousands)
Agency, Bureau, Program, Risk Category and Cohort Year
Characteristics of Subsidy Reestimates
FY 2009....................................................................................................... -2.02 -7.14 -12.10 6.97 599 12,925 -80,593 657,797 FY 2010....................................................................................................... -4.60 -7.05 0.26 -2.71 -115 -8,180 -6,732 469,390 FY 2011....................................................................................................... -2.23 2.44 -2.50 7.17 19,660 36,377 4,174 300,259 FY 2012....................................................................................................... -3.72 -5.93 -4.55 2.35 -8,736 -2,198 -5,411 232,459 FY 2013....................................................................................................... -6.72 -9.38 -2.89 0.22 1,444 -6,348 -8,277 223,685 FY 2014....................................................................................................... -9.73 -10.65 0.42 -1.35 590 -942 -891 133,626 FY 2015....................................................................................................... -5.61 3.81 -0.50 9.92 3,106 3,106 2,994 32,283 NIS Direct Loans FY 1994....................................................................................................... 0.94 1.97 1.96 -0.93 ...... -2,654 503 13,000 FY 1996....................................................................................................... 10.24 -5.35 -5.19 -10.40 ...... -5,055 503 11,000 FY 2000....................................................................................................... 8.03 17.44 0.82 8.59 ...... -108 115 555 FY 2001....................................................................................................... 11.21 -14.45 -7.28 -18.38 ...... -574 -1,160 2,500 FY 2002....................................................................................................... 11.90 -7.48 -8.85 -10.53 -164 -3,250 -10,281 31,200 FY 2003....................................................................................................... 10.17 43.00 -5.10 37.93 -282 7,026 2,871 12,706 FY 2004....................................................................................................... 10.74 -10.30 0.09 -21.13 ...... -2,055 -11,590 36,180 FY 2005....................................................................................................... 20.87 64.88 -0.14 44.15 -60 2,910 2,164 5,000 FY 2006....................................................................................................... 3.28 -15.53 1.44 -20.26 -11 -702 -6,208 11,400 FY 2007....................................................................................................... 6.54 -1.28 -1.14 -6.68 -4 121 -1,726 5,850 Direct Loan Investment Funds FY 2011....................................................................................................... 6.99 9.22 ...... 2.23 239 558 472 20,000
Department of Transportation
Federal Highway Administration: Federal-Aid Highways: Transportation, Infrastructure, Finance & Innovation (TIFIA) Direct Loans FY 1999....................................................................................................... 3.36 -4.40 -7.86 0.10 -322 -8,270 -8,755 170,000 FY 2001....................................................................................................... 11.26 -7.21 -28.83 10.36 67,674 -167,018 -124,867 900,000 FY 2003....................................................................................................... 7.10 8.69 14.38 -12.79 -281 -4,918 3,372 140,000
FY 2005....................................................................................................... 13.81 (5) ...... ...... ...... ...... ...... 132,000 FY 2006....................................................................................................... 8.50 -7.33 -13.17 -2.66 -163 -6,075 -5,082 40,059 FY 2007....................................................................................................... 3.39 11.43 15.32 -7.28 74,486 55,541 49,183 616,000
54

Table 7. DIRECT LOANS: SUBSIDY REESTIMATES ¹ — Continued (In percentages, unless noted otherwise)
Original Subsidy Rate
Current Reestimated
Rate
Percentage point change due to interest rates
Percentage point change due to
technical assumptions
Current reestimate amount 2
($ thousands)
Net lifetime reestimate amount 3
($ thousands)
Net lifetime reestimate
amount excluding interest
($ thousands)
Total disbursements to
date($ thousands)
Agency, Bureau, Program, Risk Category and Cohort Year
Characteristics of Subsidy Reestimates
FY 2008....................................................................................................... 15.16 48.00 -5.25 38.09 -1,997 361,967 309,957 1,018,923 FY 2009....................................................................................................... 8.69 2.04 -0.08 -6.57 -14,253 -60,124 -67,991 972,716 FY 2010....................................................................................................... 7.74 -6.35 -16.77 2.68 -156,164 -264,049 -282,791 1,986,638 FY 2012....................................................................................................... 5.50 11.02 2.46 3.06 43,180 43,598 44,863 838,249 FY 2013....................................................................................................... 8.87 0.83 -7.87 -0.17 460 460 148 35,318 FY 2014....................................................................................................... 6.05 7.55 2.01 -0.51 -3,212 -8,640 -7,223 249,291
FY 2015....................................................................................................... 7.48 (4) ...... ...... ...... ...... ...... ...... Highway Infrastructure Investment, Recovery Act: TIFIA TIGER Direct Loans (ARRA) FY 2011....................................................................................................... 2.58 -21.99 -27.24 2.67 -1,666 -111,586 -103,397 453,968 Transportation Infrastructure Finance and Innovation, TIGER: TIFIA TIGER Direct Loans FY 2013....................................................................................................... 7.41 25.24 16.25 1.58 39,984 39,984 38,684 300,000
Federal Railroad Administration: Railroad Rehabilitation and Improvement Financing Direct Loans FY 2002....................................................................................................... 0.00 -7.11 -6.22 -0.89 -9 -167 -10 1,921 FY 2003....................................................................................................... 0.00 -12.78 -8.84 -3.94 -18 -1,776 -1,216 13,300 FY 2005....................................................................................................... 0.00 14.18 3.25 10.93 -1,534 29,813 15,055 129,746 FY 2006....................................................................................................... 0.00 -7.55 -1.87 -5.67 -29 5,765 -42,374 78,304 FY 2007....................................................................................................... 0.00 -6.31 1.90 -8.21 40 -1,033 -3,516 29,873 FY 2009....................................................................................................... 0.00 0.42 0.68 -0.26 -225 678 -86 31,000 FY 2010....................................................................................................... 0.00 -20.17 -7.84 -12.33 -5,009 -40,396 -31,802 170,563 FY 2011....................................................................................................... 0.00 -12.25 2.29 -14.54 -29 -280 -504 3,233 FY 2012....................................................................................................... -2.12 -1.80 3.72 -3.41 -275 4,260 -8,779 138,358 FY 2015....................................................................................................... -2.72 -5.31 0.21 -2.80 -233 -233 -355 6,809
Department of the Treasury
Departmental Offices: Community Development Financial Institutions (CDFI) Fund: CDFI Financial Assistance Program FY 1996....................................................................................................... 44.95 34.56 -8.55 -1.84 -14 -1,526 114 6,623 FY 1997....................................................................................................... 32.14 34.38 -2.41 4.65 -5 50 80 1,100
55

Table 7. DIRECT LOANS: SUBSIDY REESTIMATES ¹ — Continued (In percentages, unless noted otherwise)
Original Subsidy Rate
Current Reestimated
Rate
Percentage point change due to interest rates
Percentage point change due to
technical assumptions
Current reestimate amount 2
($ thousands)
Net lifetime reestimate amount 3
($ thousands)
Net lifetime reestimate
amount excluding interest
($ thousands)
Total disbursements to
date($ thousands)
Agency, Bureau, Program, Risk Category and Cohort Year
Characteristics of Subsidy Reestimates
FY 1998....................................................................................................... 40.93 40.12 6.03 -6.84 -59 -270 -419 6,150 FY 1999....................................................................................................... 46.30 30.43 -10.95 -4.92 651 -1,450 -878 12,395 FY 2000....................................................................................................... 38.13 39.44 -2.45 3.76 110 273 83 12,105 FY 2001....................................................................................................... 37.46 27.70 -2.19 -7.57 -90 -1,370 -1,126 12,877 FY 2002....................................................................................................... 38.49 24.94 -1.34 -12.21 -166 -1,401 -1,043 8,260 FY 2003....................................................................................................... 32.85 15.52 -3.44 -13.89 -156 -454 -424 2,615 FY 2004....................................................................................................... 32.90 19.54 -3.27 -10.09 -160 -869 -662 4,994 FY 2005....................................................................................................... 37.04 34.18 5.60 -8.46 -139 -475 63 7,038 FY 2006....................................................................................................... 38.38 19.67 -7.95 -10.76 -6 -231 -184 1,040 FY 2007....................................................................................................... 36.88 14.39 -14.37 -8.12 -41 -284 -245 1,147 FY 2008....................................................................................................... 34.60 16.27 1.37 -19.70 -25 -664 -649 3,556 FY 2012....................................................................................................... 40.26 10.50 -32.15 2.39 486 -4,237 -4,096 14,161 FY 2013....................................................................................................... 32.15 13.76 -10.17 -8.22 -196 -2,207 -2,097 11,829 FY 2014....................................................................................................... 8.89 13.07 0.88 3.30 614 677 648 15,968 FY 2015....................................................................................................... 12.41 17.66 ...... 5.25 97 97 94 1,821 Bond Guarantee Program FY 2013....................................................................................................... -2.18 0.75 ...... 2.93 3,026 3,026 2,724 101,636 FY 2014....................................................................................................... -2.72 -4.33 ...... -1.61 -405 -405 -385 25,062
FY 2015....................................................................................................... -1.35 (4) ...... ...... ...... ...... ...... ...... Troubled Asset Relief Program: Automotive Industry Financing Program FY 2009....................................................................................................... 58.75 21.70 -1.06 -35.99 -108,745 -24,148,666 -19,864,069 63,402,469 Term-Asset Backed Securities Loan Facility (TALF) FY 2009....................................................................................................... -104.23 -605.59 -46.25 -455.11 ...... -454,739 -409,891 100,000 Troubled Asset Relief Program Equity Purchase Program: Capital Purchase Program FY 2009....................................................................................................... 26.99 -6.82 -9.39 -24.42 -83,416 -73,567,346 -65,724,726 204,617,573 FY 2010....................................................................................................... 5.77 0.47 17.02 -22.32 -6,835 -40,181 -23,923 277,153 Automotive Industry Financing Program (Equity) FY 2009....................................................................................................... 54.52 6.48 -12.56 -35.48 19,997 -8,234,956 -4,947,929 12,500,000
FY 2010....................................................................................................... 30.25 (5) ...... ...... ...... ...... ...... 3,790,000
56

Table 7. DIRECT LOANS: SUBSIDY REESTIMATES ¹ — Continued (In percentages, unless noted otherwise)
Original Subsidy Rate
Current Reestimated
Rate
Percentage point change due to interest rates
Percentage point change due to
technical assumptions
Current reestimate amount 2
($ thousands)
Net lifetime reestimate amount 3
($ thousands)
Net lifetime reestimate
amount excluding interest
($ thousands)
Total disbursements to
date($ thousands)
Agency, Bureau, Program, Risk Category and Cohort Year
Characteristics of Subsidy Reestimates
Legacy Securities Public-Private Investment Program FY 2010....................................................................................................... 22.97 -51.02 -66.46 -7.53 -65 -4,199,240 -3,716,239 5,510,246 Community Development Capital Initiative FY 2010....................................................................................................... 48.06 17.61 3.86 -34.31 -25,671 -187,234 -154,138 570,073 Small Business Lending Fund: Small Business Lending Fund Investments FY 2011....................................................................................................... 7.24 -1.27 -1.44 -7.07 -43,808 -343,412 -335,663 4,027,704 GSE Mortgage-backed Securities Purchase: New Issue Bond Program SF FY 2010....................................................................................................... -0.05 11.07 2.62 8.50 -15,446 1,562,186 1,474,536 12,432,648 New Issue Bond Program MF FY 2010....................................................................................................... -2.55 23.94 16.36 10.13 -1,259 822,142 812,261 2,875,950
Department of Veterans Affairs
Benefits Programs: Veterans Housing Benefit Program Fund: Acquired Direct Loans FY 2007....................................................................................................... 10.43 29.32 -2.69 21.58 4,011 17,714 15,234 77,972 FY 2008....................................................................................................... 8.84 20.18 -7.31 18.65 3,540 7,429 6,172 52,025 FY 2009....................................................................................................... 3.04 14.60 -12.62 24.18 845 1,389 1,164 9,775 FY 2010....................................................................................................... -10.15 2.21 7.22 5.14 518 867 713 7,005 FY 2011....................................................................................................... -0.13 4.38 -7.03 11.54 542 491 421 9,382 FY 2012....................................................................................................... 4.09 -4.65 -10.90 2.16 363 -349 -410 4,762 FY 2013....................................................................................................... -2.29 3.50 -9.56 15.35 69 140 132 2,230 FY 2014....................................................................................................... -5.00 7.90 4.81 8.09 -63 534 591 4,992 FY 2015....................................................................................................... -5.06 12.07 -12.19 29.32 848 848 742 6,145 Transitional Housing Direct Loan FY 2005....................................................................................................... 99.24 59.42 0.14 -39.96 -289 -2,336 -1,507 5,062 Vendee Direct Loans FY 2007....................................................................................................... -3.46 -2.01 -0.38 1.83 -191 143 591 47,745 FY 2008....................................................................................................... -1.59 -1.79 -4.66 4.46 442 410 -292 79,539 FY 2009....................................................................................................... -3.29 -3.70 -5.60 5.19 -67 -1,041 -939 78,555 FY 2010....................................................................................................... -4.45 -0.21 0.82 3.42 3 7,580 9,224 222,474
57
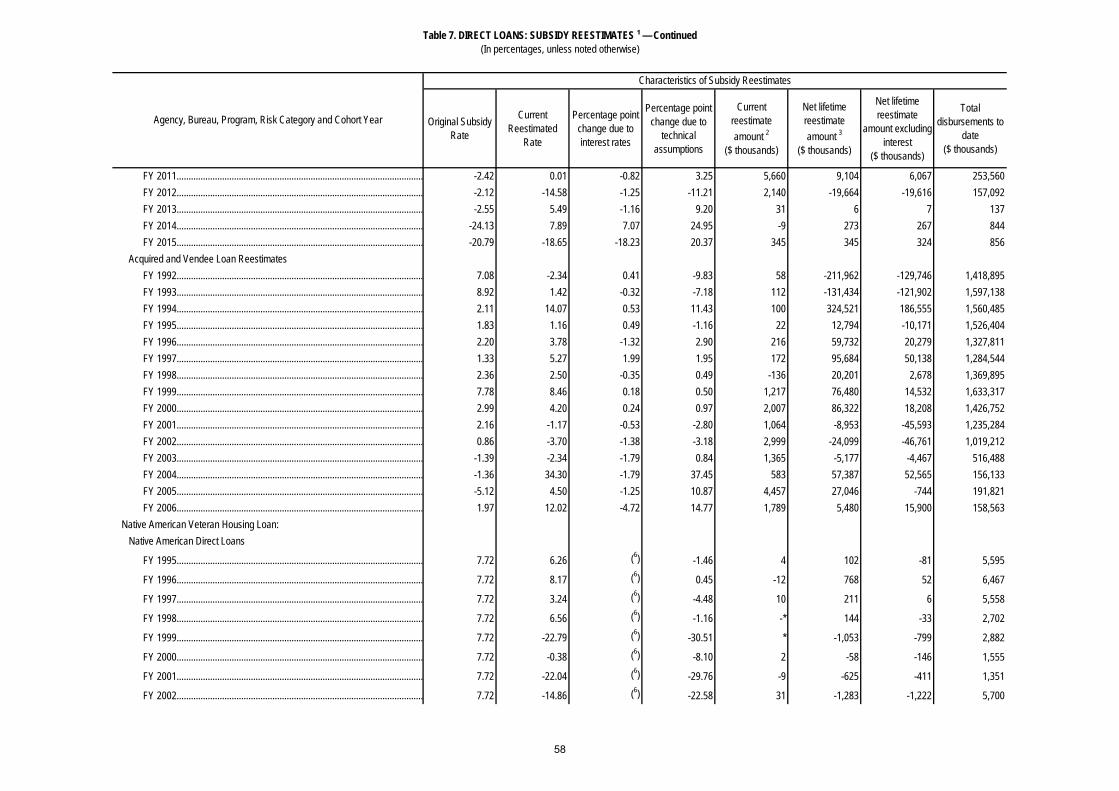
Table 7. DIRECT LOANS: SUBSIDY REESTIMATES ¹ — Continued (In percentages, unless noted otherwise)
Original Subsidy Rate
Current Reestimated
Rate
Percentage point change due to interest rates
Percentage point change due to
technical assumptions
Current reestimate amount 2
($ thousands)
Net lifetime reestimate amount 3
($ thousands)
Net lifetime reestimate
amount excluding interest
($ thousands)
Total disbursements to
date($ thousands)
Agency, Bureau, Program, Risk Category and Cohort Year
Characteristics of Subsidy Reestimates
FY 2011....................................................................................................... -2.42 0.01 -0.82 3.25 5,660 9,104 6,067 253,560 FY 2012....................................................................................................... -2.12 -14.58 -1.25 -11.21 2,140 -19,664 -19,616 157,092 FY 2013....................................................................................................... -2.55 5.49 -1.16 9.20 31 6 7 137 FY 2014....................................................................................................... -24.13 7.89 7.07 24.95 -9 273 267 844 FY 2015....................................................................................................... -20.79 -18.65 -18.23 20.37 345 345 324 856 Acquired and Vendee Loan Reestimates FY 1992....................................................................................................... 7.08 -2.34 0.41 -9.83 58 -211,962 -129,746 1,418,895 FY 1993....................................................................................................... 8.92 1.42 -0.32 -7.18 112 -131,434 -121,902 1,597,138 FY 1994....................................................................................................... 2.11 14.07 0.53 11.43 100 324,521 186,555 1,560,485 FY 1995....................................................................................................... 1.83 1.16 0.49 -1.16 22 12,794 -10,171 1,526,404 FY 1996....................................................................................................... 2.20 3.78 -1.32 2.90 216 59,732 20,279 1,327,811 FY 1997....................................................................................................... 1.33 5.27 1.99 1.95 172 95,684 50,138 1,284,544 FY 1998....................................................................................................... 2.36 2.50 -0.35 0.49 -136 20,201 2,678 1,369,895 FY 1999....................................................................................................... 7.78 8.46 0.18 0.50 1,217 76,480 14,532 1,633,317 FY 2000....................................................................................................... 2.99 4.20 0.24 0.97 2,007 86,322 18,208 1,426,752 FY 2001....................................................................................................... 2.16 -1.17 -0.53 -2.80 1,064 -8,953 -45,593 1,235,284 FY 2002....................................................................................................... 0.86 -3.70 -1.38 -3.18 2,999 -24,099 -46,761 1,019,212 FY 2003....................................................................................................... -1.39 -2.34 -1.79 0.84 1,365 -5,177 -4,467 516,488 FY 2004....................................................................................................... -1.36 34.30 -1.79 37.45 583 57,387 52,565 156,133 FY 2005....................................................................................................... -5.12 4.50 -1.25 10.87 4,457 27,046 -744 191,821 FY 2006....................................................................................................... 1.97 12.02 -4.72 14.77 1,789 5,480 15,900 158,563 Native American Veteran Housing Loan: Native American Direct Loans
FY 1995....................................................................................................... 7.72 6.26 (6) -1.46 4 102 -81 5,595
FY 1996....................................................................................................... 7.72 8.17 (6) 0.45 -12 768 52 6,467
FY 1997....................................................................................................... 7.72 3.24 (6) -4.48 10 211 6 5,558
FY 1998....................................................................................................... 7.72 6.56 (6) -1.16 -* 144 -33 2,702
FY 1999....................................................................................................... 7.72 -22.79 (6) -30.51 * -1,053 -799 2,882
FY 2000....................................................................................................... 7.72 -0.38 (6) -8.10 2 -58 -146 1,555
FY 2001....................................................................................................... 7.72 -22.04 (6) -29.76 -9 -625 -411 1,351
FY 2002....................................................................................................... 7.72 -14.86 (6) -22.58 31 -1,283 -1,222 5,700
58
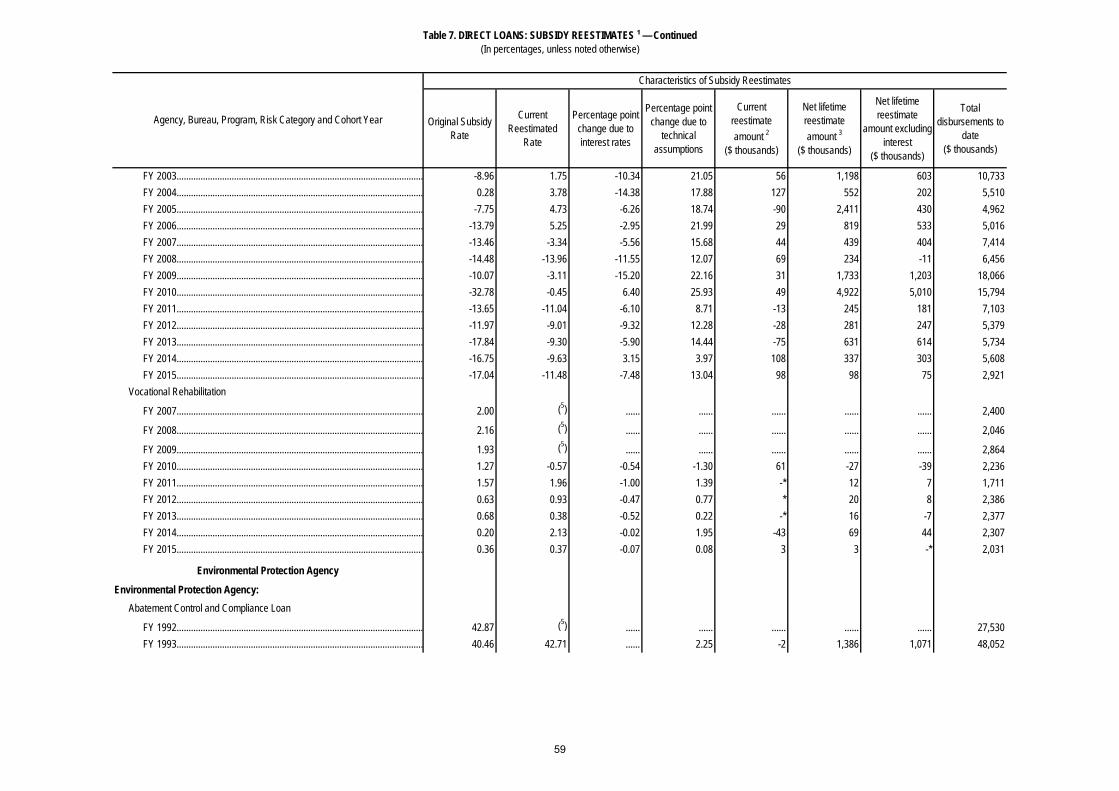
Table 7. DIRECT LOANS: SUBSIDY REESTIMATES ¹ — Continued (In percentages, unless noted otherwise)
Original Subsidy Rate
Current Reestimated
Rate
Percentage point change due to interest rates
Percentage point change due to
technical assumptions
Current reestimate amount 2
($ thousands)
Net lifetime reestimate amount 3
($ thousands)
Net lifetime reestimate
amount excluding interest
($ thousands)
Total disbursements to
date($ thousands)
Agency, Bureau, Program, Risk Category and Cohort Year
Characteristics of Subsidy Reestimates
FY 2003....................................................................................................... -8.96 1.75 -10.34 21.05 56 1,198 603 10,733 FY 2004....................................................................................................... 0.28 3.78 -14.38 17.88 127 552 202 5,510 FY 2005....................................................................................................... -7.75 4.73 -6.26 18.74 -90 2,411 430 4,962 FY 2006....................................................................................................... -13.79 5.25 -2.95 21.99 29 819 533 5,016 FY 2007....................................................................................................... -13.46 -3.34 -5.56 15.68 44 439 404 7,414 FY 2008....................................................................................................... -14.48 -13.96 -11.55 12.07 69 234 -11 6,456 FY 2009....................................................................................................... -10.07 -3.11 -15.20 22.16 31 1,733 1,203 18,066 FY 2010....................................................................................................... -32.78 -0.45 6.40 25.93 49 4,922 5,010 15,794 FY 2011....................................................................................................... -13.65 -11.04 -6.10 8.71 -13 245 181 7,103 FY 2012....................................................................................................... -11.97 -9.01 -9.32 12.28 -28 281 247 5,379 FY 2013....................................................................................................... -17.84 -9.30 -5.90 14.44 -75 631 614 5,734 FY 2014....................................................................................................... -16.75 -9.63 3.15 3.97 108 337 303 5,608 FY 2015....................................................................................................... -17.04 -11.48 -7.48 13.04 98 98 75 2,921 Vocational Rehabilitation
FY 2007....................................................................................................... 2.00 (5) ...... ...... ...... ...... ...... 2,400
FY 2008....................................................................................................... 2.16 (5) ...... ...... ...... ...... ...... 2,046
FY 2009....................................................................................................... 1.93 (5) ...... ...... ...... ...... ...... 2,864 FY 2010....................................................................................................... 1.27 -0.57 -0.54 -1.30 61 -27 -39 2,236 FY 2011....................................................................................................... 1.57 1.96 -1.00 1.39 -* 12 7 1,711 FY 2012....................................................................................................... 0.63 0.93 -0.47 0.77 * 20 8 2,386 FY 2013....................................................................................................... 0.68 0.38 -0.52 0.22 -* 16 -7 2,377 FY 2014....................................................................................................... 0.20 2.13 -0.02 1.95 -43 69 44 2,307 FY 2015....................................................................................................... 0.36 0.37 -0.07 0.08 3 3 -* 2,031
Environmental Protection Agency
Environmental Protection Agency: Abatement Control and Compliance Loan
FY 1992....................................................................................................... 42.87 (5) ...... ...... ...... ...... ...... 27,530 FY 1993....................................................................................................... 40.46 42.71 ...... 2.25 -2 1,386 1,071 48,052
59

Table 7. DIRECT LOANS: SUBSIDY REESTIMATES ¹ — Continued (In percentages, unless noted otherwise)
Original Subsidy Rate
Current Reestimated
Rate
Percentage point change due to interest rates
Percentage point change due to
technical assumptions
Current reestimate amount 2
($ thousands)
Net lifetime reestimate amount 3
($ thousands)
Net lifetime reestimate
amount excluding interest
($ thousands)
Total disbursements to
date($ thousands)
Agency, Bureau, Program, Risk Category and Cohort Year
Characteristics of Subsidy Reestimates
Small Business Administration
Business Loans: 7(m) Direct Microloans FY 1992....................................................................................................... 17.00 -6.18 -6.60 -16.58 * -5,533 -2,487 11,118 FY 1993....................................................................................................... 15.95 18.48 -4.73 7.26 1 1,219 547 21,973 FY 1994....................................................................................................... 10.15 43.52 0.75 32.62 ...... 4,947 2,291 7,260 FY 1995....................................................................................................... 19.61 7.62 -9.37 -2.62 1 -1,854 -1,446 12,430 FY 1996....................................................................................................... 15.69 15.75 -5.75 5.81 1 110 10 7,998 FY 1997....................................................................................................... 8.86 20.89 1.13 10.90 -3 1,459 878 7,941 FY 1998....................................................................................................... 10.31 -218.47 -0.30 -228.48 * -30,822 -21,244 9,551 FY 1999....................................................................................................... 9.54 16.96 -3.46 10.88 11 1,130 967 13,355 FY 2000....................................................................................................... 8.54 4.29 5.66 -9.91 -18 -1,865 -1,057 25,622 FY 2001....................................................................................................... 8.95 6.28 3.20 -5.87 -22 -234 -711 26,871 FY 2002....................................................................................................... 6.78 4.07 -9.30 6.59 16 -126 -340 12,875 FY 2003....................................................................................................... 13.05 18.38 -5.29 10.62 -6 1,120 1,400 27,396 FY 2004....................................................................................................... 9.55 12.32 0.64 2.13 119 311 470 17,729 FY 2005....................................................................................................... 10.25 9.52 0.51 -1.24 142 -476 -120 16,279 FY 2006....................................................................................................... 7.17 7.44 -2.22 2.49 516 207 37 16,718 FY 2007....................................................................................................... 10.21 3.78 -6.64 0.21 701 -597 -1,164 17,810 FY 2008....................................................................................................... 10.12 7.06 -10.13 7.07 1,434 245 -620 18,597 FY 2009....................................................................................................... 11.66 11.79 -10.03 10.15 3 1,000 -110 17,576 FY 2010....................................................................................................... 12.04 11.78 -2.67 2.41 173 98 -20 5,944 FY 2011....................................................................................................... 15.06 7.89 -9.08 1.91 1,084 -846 -2,237 32,185 FY 2012....................................................................................................... 14.71 8.30 -4.42 -1.99 -53 -975 -1,291 20,817 FY 2013....................................................................................................... 15.71 11.57 ...... -4.14 866 -1,655 -1,506 35,776 FY 2014....................................................................................................... 18.64 5.74 ...... -12.90 -1,336 -2,419 -2,338 16,613 FY 2015....................................................................................................... 10.12 7.91 ...... -2.21 -177 -177 -172 7,884 Economic Opportunity Loans
FY 1992....................................................................................................... 30.30 26.07 (6) -4.23 -3 -1,247 -584 15,650
FY 1993....................................................................................................... 17.83 29.05 (6) 11.22 -19 1,955 1,096 7,912
FY 1994....................................................................................................... 21.89 48.73 (6) 26.84 -2 4,296 2,411 7,604
60

Table 7. DIRECT LOANS: SUBSIDY REESTIMATES ¹ — Continued (In percentages, unless noted otherwise)
Original Subsidy Rate
Current Reestimated
Rate
Percentage point change due to interest rates
Percentage point change due to
technical assumptions
Current reestimate amount 2
($ thousands)
Net lifetime reestimate amount 3
($ thousands)
Net lifetime reestimate
amount excluding interest
($ thousands)
Total disbursements to
date($ thousands)
Agency, Bureau, Program, Risk Category and Cohort Year
Characteristics of Subsidy Reestimates
Handicapped Assistance Loans
FY 1992....................................................................................................... 36.36 46.68 (6) 10.32 ...... 3,127 1,530 11,078
FY 1993....................................................................................................... 25.71 45.44 (6) 19.73 ...... 4,645 2,550 10,625
FY 1994....................................................................................................... 34.04 56.59 (6) 22.55 -1 4,249 2,389 8,866
FY 1995....................................................................................................... 41.82 67.17 (6) 25.35 -* 1,881 1,094 3,295 SBIC Direct Preferred Stock and Fee Loans
FY 1992....................................................................................................... 44.33 26.86 (6) -17.47 ...... -6,270 -1,900 12,050
FY 1993....................................................................................................... 38.06 33.33 (6) -4.73 ...... -2,669 -314 12,356
FY 1994....................................................................................................... 31.64 41.27 (6) 9.63 ...... 4,300 1,578 15,029
FY 1995....................................................................................................... 43.10 29.53 (6) -13.57 ...... -1,583 -679 5,594 7(m) Direct Microloans — ARRA FY 2009....................................................................................................... 11.66 7.68 -10.03 6.04 876 266 -581 13,835 FY 2010....................................................................................................... 12.04 7.99 -2.67 -1.38 729 -732 -1,130 28,242 Intermediary Lending Program FY 2011....................................................................................................... 30.58 15.29 -12.22 -3.07 -277 -2,402 -2,664 18,215 FY 2012....................................................................................................... 25.73 20.55 ...... -5.18 -289 -985 -852 15,061 Disaster Loans: Disaster Assistance Loans FY 1992....................................................................................................... 33.93 35.51 -0.79 2.37 -57 54,059 13,159 577,587 FY 1993....................................................................................................... 20.58 32.81 7.62 4.61 -158 261,061 143,425 1,213,651 FY 1994....................................................................................................... 22.99 26.78 10.50 -6.71 -346 260,561 98,735 3,143,906 FY 1995....................................................................................................... 31.54 26.57 0.51 -5.48 -668 12,416 -26,985 955,620 FY 1996....................................................................................................... 28.08 28.11 1.78 -1.75 -190 49,501 3,807 664,528 FY 1997....................................................................................................... 20.02 29.71 6.17 3.52 -227 139,001 77,464 832,786 FY 1998....................................................................................................... 23.46 27.18 -1.46 5.18 -301 55,007 20,655 550,917 FY 1999....................................................................................................... 22.36 25.14 -7.23 10.01 -706 45,002 19,689 688,195 FY 2000....................................................................................................... 22.20 25.60 ...... 3.40 -2,747 51,109 26,737 726,791 FY 2001....................................................................................................... 17.46 21.31 0.18 3.67 -3,190 42,941 27,216 687,314 FY 2002....................................................................................................... 14.67 26.04 ...... 11.37 -2,983 135,291 64,986 782,288 FY 2003....................................................................................................... 13.98 20.04 ...... 6.06 -3,223 45,678 33,293 549,462 FY 2004....................................................................................................... 11.72 22.06 -0.98 11.32 -675 54,059 48,107 484,473
61

Table 7. DIRECT LOANS: SUBSIDY REESTIMATES ¹ — Continued (In percentages, unless noted otherwise)
Original Subsidy Rate
Current Reestimated
Rate
Percentage point change due to interest rates
Percentage point change due to
technical assumptions
Current reestimate amount 2
($ thousands)
Net lifetime reestimate amount 3
($ thousands)
Net lifetime reestimate
amount excluding interest
($ thousands)
Total disbursements to
date($ thousands)
Agency, Bureau, Program, Risk Category and Cohort Year
Characteristics of Subsidy Reestimates
FY 2005....................................................................................................... 12.86 19.82 -1.79 8.75 -9,029 91,128 78,408 1,179,909 FY 2006....................................................................................................... 14.64 23.13 0.27 8.22 -51,953 560,865 496,742 6,234,775 FY 2007....................................................................................................... 17.73 21.41 -3.61 7.29 -7,349 43,287 33,161 951,596 FY 2008....................................................................................................... 16.27 16.52 -7.16 7.41 -4,939 5,201 1,047 519,309 FY 2009....................................................................................................... 14.92 10.99 -8.82 4.89 -7,636 -15,865 -22,121 570,858 FY 2010....................................................................................................... 10.77 11.67 1.91 -1.01 -3,517 -241 3,226 368,767 FY 2011....................................................................................................... 13.53 9.61 -7.67 3.75 -5,841 -13,913 -15,072 391,091 FY 2012....................................................................................................... 11.03 6.48 -7.14 2.59 -3,485 -14,497 -17,753 384,133 FY 2013....................................................................................................... 11.11 11.77 -4.44 5.10 -11,090 11,953 6,304 1,008,139 FY 2014....................................................................................................... 8.50 12.91 1.74 2.67 4,515 9,120 9,688 222,998 FY 2015....................................................................................................... 12.43 14.52 ...... 2.09 4,208 4,208 4,179 202,474 Economic Injury Disaster Loans—Terrorist Attack FY 2001....................................................................................................... 17.46 35.05 0.18 17.41 347 1,875 1,773 10,674 FY 2002....................................................................................................... 22.67 27.92 -3.49 8.74 -2,337 6,197 23,766 427,952 FY 2003....................................................................................................... 23.20 25.25 -6.16 8.21 -73 2,617 2,293 89,542 FY 2004....................................................................................................... 23.20 23.76 -6.16 6.72 -4 32 10 1,788
Export-Import Bank of the United States
Export-Import Bank of the United States: Direct Loans: Export Financing
FY 1992....................................................................................................... -1.84 -78.80 1.84 -78.80 -57,462 (8) (8) 25,340
FY 1993....................................................................................................... -3.50 -0.01 3.50 -0.01 -8 (8) (8) 685,009
FY 1994....................................................................................................... 11.05 -0.63 -11.05 -0.63 -13,088 (8) (8) 2,106,097
FY 1995....................................................................................................... 2.88 -0.77 -2.88 -0.77 -1,088 (8) (8) 2,302,596
FY 1996....................................................................................................... 1.08 -0.71 -1.08 -0.71 -15,408 (8) (8) 1,522,291
FY 1997....................................................................................................... -0.53 -0.28 0.53 -0.28 8,650 (8) (8) 1,345,561
FY 1998....................................................................................................... 8.32 ...... -8.32 ...... * (8) (8) 68,403
FY 1999....................................................................................................... 3.54 -0.03 -3.54 -0.03 573 (8) (8) 807,029
FY 2000....................................................................................................... -3.64 -2.27 3.64 -2.27 -28,589 (8) (8) 544,253
FY 2001....................................................................................................... 11.41 -0.70 -11.41 -0.70 -193 (8) (8) 407,750
62
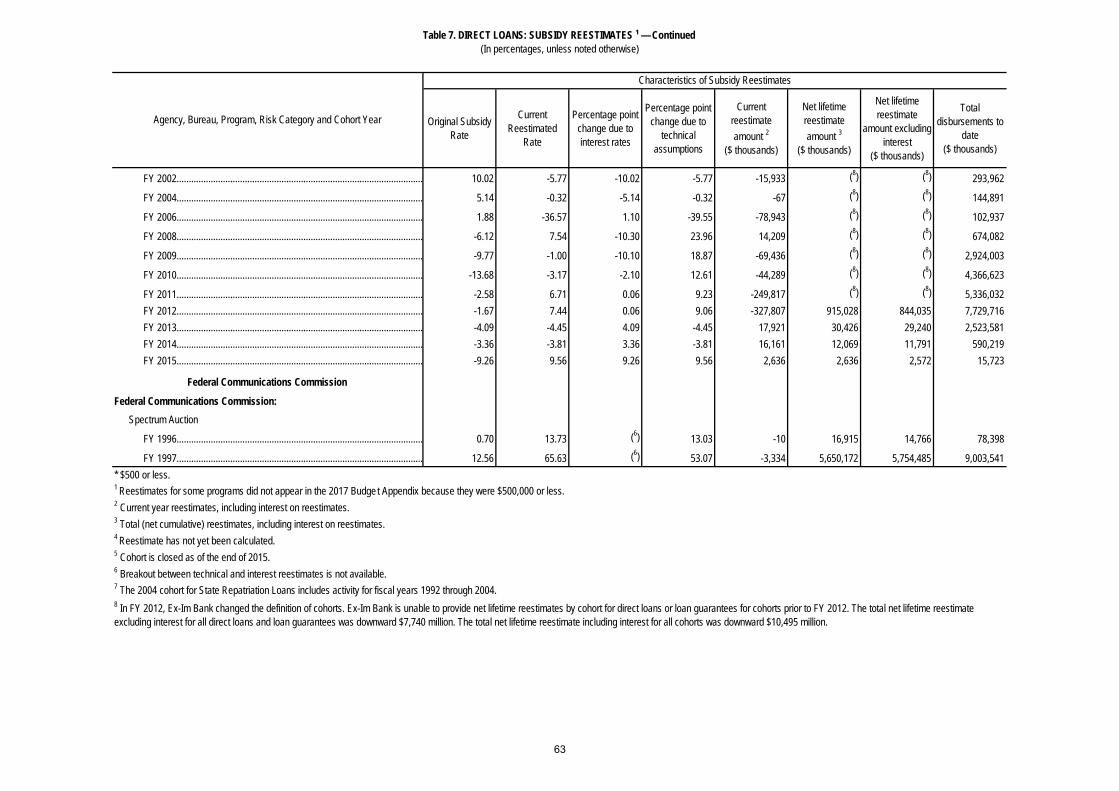
Table 7. DIRECT LOANS: SUBSIDY REESTIMATES ¹ — Continued (In percentages, unless noted otherwise)
Original Subsidy Rate
Current Reestimated
Rate
Percentage point change due to interest rates
Percentage point change due to
technical assumptions
Current reestimate amount 2
($ thousands)
Net lifetime reestimate amount 3
($ thousands)
Net lifetime reestimate
amount excluding interest
($ thousands)
Total disbursements to
date($ thousands)
Agency, Bureau, Program, Risk Category and Cohort Year
Characteristics of Subsidy Reestimates
FY 2002..................................................................................................... 10.02 -5.77 -10.02 -5.77 -15,933 (8) (8) 293,962
FY 2004..................................................................................................... 5.14 -0.32 -5.14 -0.32 -67 (8) (8) 144,891
FY 2006..................................................................................................... 1.88 -36.57 1.10 -39.55 -78,943 (8) (8) 102,937
FY 2008..................................................................................................... -6.12 7.54 -10.30 23.96 14,209 (8) (8) 674,082
FY 2009..................................................................................................... -9.77 -1.00 -10.10 18.87 -69,436 (8) (8) 2,924,003
FY 2010..................................................................................................... -13.68 -3.17 -2.10 12.61 -44,289 (8) (8) 4,366,623
FY 2011..................................................................................................... -2.58 6.71 0.06 9.23 -249,817 (8) (8) 5,336,032 FY 2012..................................................................................................... -1.67 7.44 0.06 9.06 -327,807 915,028 844,035 7,729,716 FY 2013..................................................................................................... -4.09 -4.45 4.09 -4.45 17,921 30,426 29,240 2,523,581 FY 2014..................................................................................................... -3.36 -3.81 3.36 -3.81 16,161 12,069 11,791 590,219 FY 2015..................................................................................................... -9.26 9.56 9.26 9.56 2,636 2,636 2,572 15,723
Federal Communications Commission
Federal Communications Commission: Spectrum Auction
FY 1996..................................................................................................... 0.70 13.73 (6) 13.03 -10 16,915 14,766 78,398
FY 1997..................................................................................................... 12.56 65.63 (6) 53.07 -3,334 5,650,172 5,754,485 9,003,541* $500 or less.1 Reestimates for some programs did not appear in the 2017 Budge t Appendix because they were $500,000 or less.
6 Breakout between technical and interest reestimates is not available.
2 Current year reestimates, including interest on reestimates.
8 In FY 2012, Ex-Im Bank changed the definition of cohorts. Ex-Im Bank is unable to provide net lifetime reestimates by cohort for direct loans or loan guarantees for cohorts prior to FY 2012. The total net lifetime reestimate excluding interest for all direct loans and loan guarantees was downward $7,740 million. The total net lifetime reestimate including interest for all cohorts was downward $10,495 million.
7 The 2004 cohort for State Repatriation Loans includes activity for fiscal years 1992 through 2004.
3 Total (net cumulative) reestimates, including interest on reestimates.4 Reestimate has not yet been calculated.5 Cohort is closed as of the end of 2015.
63


Table 8. LOAN GUARANTEES: SUBSIDY REESTIMATES ¹ (In percentages, unless noted otherwise)
Original Subsidy Rate
Current Reestimated
Rate
Percentage point change due to interest rates
Percentage point change due to
technical assumptions
Current reestimate amount 2
($ thousands)
Net lifetime reestimate amount 3
($ thousands)
Net lifetime reestimate
amount excluding interest
($ thousands)
Total disbursements to
date ($ thousands)
Department of Agriculture
Farm Service Agency: Agricultural Credit Insurance Fund: Farm Ownership—Unsubsidized FY 1992....................................................................................................... 4.89 0.38 -4.45 -0.06 12 -28,440 -11,997 440,842 FY 1993....................................................................................................... 4.58 0.35 -4.38 0.15 13 -25,089 -9,886 436,497 FY 1994....................................................................................................... 3.82 0.53 -3.35 0.06 12 -24,013 -10,325 532,104 FY 1995....................................................................................................... 3.71 0.83 -2.96 0.08 11 -16,241 406 543,561 FY 1996....................................................................................................... 3.74 0.61 -3.32 0.19 9 -21,884 -14,786 521,502 FY 1997....................................................................................................... 3.69 0.40 -3.42 0.13 122 -20,783 -15,606 513,989 FY 1998....................................................................................................... 3.86 0.57 -3.42 0.13 34 -15,360 -13,076 415,760 FY 1999....................................................................................................... 1.59 0.34 -1.14 -0.11 31 -10,131 -9,551 749,207 FY 2000....................................................................................................... 0.56 0.25 -0.11 -0.20 659 -3,061 -1,702 850,064 FY 2001....................................................................................................... 0.51 0.23 -0.03 -0.25 118 -2,421 -2,406 833,986 FY 2002....................................................................................................... 0.45 -0.04 0.08 -0.57 513 -6,042 -6,064 1,069,330 FY 2003....................................................................................................... 0.75 -0.09 -0.05 -0.79 504 -10,234 -9,788 1,193,556 FY 2004....................................................................................................... 0.54 0.52 -0.03 0.01 595 769 586 1,073,125 FY 2005....................................................................................................... 0.53 0.55 ...... 0.02 300 1,231 597 998,176 FY 2006....................................................................................................... 0.48 0.50 -0.02 0.04 143 890 262 917,635 FY 2007....................................................................................................... 0.58 0.97 0.04 0.35 98 5,368 3,756 925,787 FY 2008....................................................................................................... 0.40 0.25 0.09 -0.24 -492 -1,719 -1,388 1,137,792 FY 2009....................................................................................................... 0.33 -0.01 0.13 -0.47 68 -4,475 -4,140 1,237,821 FY 2010....................................................................................................... 0.37 -0.16 0.02 -0.55 -1,675 -8,802 -8,429 1,582,589 FY 2011....................................................................................................... 0.38 -0.10 0.10 -0.58 -2,886 -9,342 -8,891 1,862,453 FY 2012....................................................................................................... -0.01 -0.36 0.07 -0.42 -2,609 -5,342 -5,188 1,477,310 FY 2013....................................................................................................... -0.07 -0.13 0.04 -0.10 -1,279 -887 -842 1,475,758 FY 2014....................................................................................................... -0.16 -0.07 -0.02 0.11 -32 1,729 1,678 1,964,104 FY 2015....................................................................................................... -0.12 -0.05 ...... 0.07 833 833 816 1,476,168
Agency, Bureau, Program, Risk Category and Cohort Year
Characteristics of Subsidy Reestimates
65

Table 8. LOAN GUARANTEES: SUBSIDY REESTIMATES ¹ — Continued (In percentages, unless noted otherwise)
Original Subsidy Rate
Current Reestimated
Rate
Percentage point change due to interest rates
Percentage point change due to
technical assumptions
Current reestimate amount 2
($ thousands)
Net lifetime reestimate amount 3
($ thousands)
Net lifetime reestimate
amount excluding interest
($ thousands)
Total disbursements to
date ($ thousands)
Agency, Bureau, Program, Risk Category and Cohort Year
Characteristics of Subsidy Reestimates
Farm Operating—Unsubsidized FY 1992....................................................................................................... 1.55 1.75 0.94 -0.74 54 7,599 -9,749 943,920 FY 1993....................................................................................................... 1.31 2.08 1.83 -1.06 -2 9,023 -9,562 861,863 FY 1994....................................................................................................... 0.48 2.70 3.35 -1.13 -14 27,963 -8,179 1,054,565 FY 1995....................................................................................................... 0.49 3.18 3.47 -0.78 4 33,260 -19,691 1,170,902 FY 1996....................................................................................................... 1.11 2.71 2.50 -0.90 18 20,700 18,068 1,103,702 FY 1997....................................................................................................... 1.10 2.45 2.32 -0.97 17 12,300 3,083 809,779 FY 1998....................................................................................................... 1.17 2.46 2.60 -1.31 30 9,691 3,707 740,124 FY 1999....................................................................................................... 1.16 1.43 2.35 -2.08 53 482 -7,428 1,228,124 FY 2000....................................................................................................... 1.41 2.12 2.11 -1.40 86 6,604 -9,948 981,962 FY 2001....................................................................................................... 1.37 1.71 2.16 -1.82 79 642 -1,182 988,695 FY 2002....................................................................................................... 3.51 1.48 0.25 -2.28 64 -24,529 -26,326 1,038,717 FY 2003....................................................................................................... 3.17 0.54 -0.04 -2.59 24 -29,043 -29,098 999,187 FY 2004....................................................................................................... 3.33 0.44 -0.06 -2.83 -3 -30,725 -25,592 940,931 FY 2005....................................................................................................... 3.23 0.69 0.02 -2.56 200 -24,972 -21,673 873,987 FY 2006....................................................................................................... 3.03 0.83 -0.04 -2.16 -99 -22,783 -20,789 927,600 FY 2007....................................................................................................... 2.47 1.26 0.05 -1.26 -199 -12,340 -8,479 906,793 FY 2008....................................................................................................... 2.42 1.21 0.23 -1.44 -432 -12,647 -10,572 940,026 FY 2009....................................................................................................... 2.49 0.42 0.30 -2.37 -1,444 -26,968 -24,972 1,224,159 FY 2010....................................................................................................... 2.34 0.35 0.05 -2.04 -2,819 -31,283 -29,782 1,500,624 FY 2011....................................................................................................... 2.33 0.43 0.20 -2.10 -2,767 -22,772 -22,022 1,165,189 FY 2012....................................................................................................... 1.74 0.47 0.14 -1.41 -2,335 -12,134 -11,742 929,789 FY 2013....................................................................................................... 1.19 0.83 0.07 -0.43 -2,505 -3,311 -3,174 888,724 FY 2014....................................................................................................... 1.22 1.18 -0.03 -0.01 -1,387 -442 -416 992,374 FY 2015....................................................................................................... 1.06 1.16 0.03 0.07 1,212 1,212 1,197 1,258,121 Farm Operating—Subsidized FY 1992....................................................................................................... 7.82 10.33 3.74 -1.23 2 2,993 2,991 149,638 FY 1993....................................................................................................... 9.12 11.27 3.80 -1.65 1 5,647 4,980 137,570 FY 1994....................................................................................................... 11.95 11.70 1.58 -1.83 1 1,192 8,439 230,826 FY 1995....................................................................................................... 12.47 11.64 0.63 -1.46 1 -1,452 2,172 188,550 FY 1996....................................................................................................... 9.12 11.49 4.00 -1.63 2 3,999 3,993 189,682 FY 1997....................................................................................................... 9.08 11.72 4.19 -1.55 1 4,250 8,043 214,367
66

Table 8. LOAN GUARANTEES: SUBSIDY REESTIMATES ¹ — Continued (In percentages, unless noted otherwise)
Original Subsidy Rate
Current Reestimated
Rate
Percentage point change due to interest rates
Percentage point change due to
technical assumptions
Current reestimate amount 2
($ thousands)
Net lifetime reestimate amount 3
($ thousands)
Net lifetime reestimate
amount excluding interest
($ thousands)
Total disbursements to
date ($ thousands)
Agency, Bureau, Program, Risk Category and Cohort Year
Characteristics of Subsidy Reestimates
FY 1998....................................................................................................... 9.64 11.64 4.08 -2.08 5 3,441 5,789 255,963 FY 1999....................................................................................................... 8.74 11.12 4.97 -2.59 9 7,784 17,379 521,298 FY 2000....................................................................................................... 8.81 10.50 4.36 -2.67 20 3,660 26,870 794,754 FY 2001....................................................................................................... 8.16 10.45 5.65 -3.36 20 6,388 17,962 463,317 FY 2002....................................................................................................... 13.56 10.93 0.70 -3.33 14 -19,878 15,335 492,571 FY 2003....................................................................................................... 11.80 11.34 -0.09 -0.37 13 -5,606 16,200 412,240 FY 2004....................................................................................................... 12.77 11.15 -0.47 -1.15 19 -5,801 1,154 269,098 FY 2005....................................................................................................... 13.31 9.66 0.02 -3.67 -232 -12,076 -8,464 281,956 FY 2006....................................................................................................... 12.50 8.59 -0.16 -3.75 -293 -12,562 -11,861 269,753 FY 2007....................................................................................................... 10.07 9.37 0.13 -0.83 -562 -3,467 -4,005 271,135 FY 2008....................................................................................................... 13.34 12.88 0.79 -1.25 -15 -590 -263 133,503 FY 2009....................................................................................................... 13.79 14.13 1.02 -0.68 199 634 1,113 148,713 FY 2010....................................................................................................... 14.06 13.32 0.22 -0.96 3,400 -1,179 -1,048 179,973 FY 2011....................................................................................................... 13.83 10.67 0.68 -3.84 223 -1,974 -1,926 61,482 Conservation—Guaranteed FY 2010....................................................................................................... 0.37 -0.62 0.02 -1.01 -* -2 -2 154 FY 2011....................................................................................................... 0.38 -0.56 0.10 -1.04 -* -2 -2 175 FY 2013....................................................................................................... -0.28 -0.20 0.04 0.04 * * * 75 FY 2015....................................................................................................... -0.32 -0.38 ...... -0.06 -1 -1 -1 1,355 Commodity Credit Corporation Export Loans: GSM 102 FY 1992....................................................................................................... 4.61 0.26 -3.38 -0.97 ...... -473,128 -233,922 5,393,167
FY 1993....................................................................................................... 4.67 -1.30 -4.64 -1.33 ...... -252,366 -169,457 3,414,926 FY 1996....................................................................................................... 10.59 3.80 -10.56 3.77 -3 -234,898 -173,841 2,827,774 FY 1997....................................................................................................... 10.23 2.23 -10.18 2.18 2 -285,204 -190,401 2,581,481 FY 1998....................................................................................................... 7.71 0.95 -7.73 0.97 92 -286,840 -232,323 3,658,828 FY 1999....................................................................................................... 5.29 -0.53 -5.37 -0.45 734 -182,143 -146,224 2,736,683 FY 2000....................................................................................................... 5.83 -1.74 -5.97 -1.60 * -211,297 -184,544 2,767,034 FY 2001....................................................................................................... 7.21 0.17 -7.06 0.02 -244 -244,892 -187,570 2,758,061 FY 2002....................................................................................................... 2.48 -0.98 ...... -3.46 -323 -114,577 -95,831 2,744,525 FY 2003....................................................................................................... 4.41 -0.11 -2.34 -2.18 -4 -122,833 -115,429 2,381,689
67

Table 8. LOAN GUARANTEES: SUBSIDY REESTIMATES ¹ — Continued (In percentages, unless noted otherwise)
Original Subsidy Rate
Current Reestimated
Rate
Percentage point change due to interest rates
Percentage point change due to
technical assumptions
Current reestimate amount 2
($ thousands)
Net lifetime reestimate amount 3
($ thousands)
Net lifetime reestimate
amount excluding interest
($ thousands)
Total disbursements to
date ($ thousands)
Agency, Bureau, Program, Risk Category and Cohort Year
Characteristics of Subsidy Reestimates
FY 2004....................................................................................................... 7.81 -0.31 -5.19 -2.93 84 -216,908 -195,770 2,618,604 FY 2005....................................................................................................... 6.09 -0.61 -1.98 -4.72 -1 -145,350 -140,277 2,100,379 FY 2006....................................................................................................... 5.05 -0.73 -2.13 -3.65 -28 -70,754 -53,396 1,288,058 FY 2007....................................................................................................... 4.48 -0.29 0.09 -4.86 1,256 -51,882 -43,514 1,428,247 FY 2008....................................................................................................... 2.39 2.85 0.10 0.36 10,242 25,440 18,048 2,982,805 FY 2009....................................................................................................... 0.87 -0.04 0.10 -1.01 1,519 -29,220 -31,965 4,993,171 FY 2010....................................................................................................... -1.21 2.46 0.35 3.32 3,156 113,507 111,983 2,887,112 FY 2011....................................................................................................... -0.86 -0.79 -0.42 0.49 -1 7,402 7,404 3,984,026 FY 2012....................................................................................................... -0.69 -0.99 -0.01 -0.29 -80 -11,814 -11,812 3,933,629 FY 2013....................................................................................................... -1.10 -1.20 -0.01 -0.09 -12,845 1,193 1,226 3,007,643 FY 2014....................................................................................................... -1.11 -1.10 ...... 0.01 -4,080 498 455 2,034,302 FY 2015....................................................................................................... -0.69 -0.35 ...... 0.34 4,258 4,258 4,243 1,678,770 Supplier Credit
FY 1997....................................................................................................... 1.49 0.73 ...... -0.76 ...... 13 4 4,508 FY 1998....................................................................................................... 1.57 0.02 ...... -1.55 -86 -161 -132 19,746
FY 1999....................................................................................................... 2.87 -0.08 -2.85 -0.10 ...... -709 -168 49,509 FY 2000....................................................................................................... 0.53 2.62 -0.54 2.63 3 2,943 2,429 107,545 FY 2001....................................................................................................... 0.26 2.89 -0.25 2.88 226 7,582 6,945 254,130 FY 2002....................................................................................................... 0.95 3.41 0.01 2.45 -104 13,516 13,529 475,318 FY 2003....................................................................................................... -0.15 0.53 1.36 -0.68 20 5,075 5,225 786,657 FY 2004....................................................................................................... 14.24 5.30 -12.27 3.33 -544 -39,846 -30,475 1,048,400 FY 2005....................................................................................................... 1.54 8.35 2.13 4.68 30 25,661 54,548 577,928
Rural Housing Service: Rural Community Facilities: Community Facility Loan Guarantees FY 1992....................................................................................................... -0.19 -0.80 0.17 -0.78 ...... -129 -64 21,251 FY 1993....................................................................................................... -0.42 -0.79 -0.26 -0.11 ...... -339 -175 45,691 FY 1994....................................................................................................... 4.98 4.19 -5.02 4.23 ...... 49 -342 27,237 FY 1995....................................................................................................... 4.94 -0.80 0.05 -5.79 ...... -3,409 -2,760 43,088 FY 1996....................................................................................................... 4.76 -0.23 -2.92 -2.07 ...... -2,698 -2,176 36,832 FY 1997....................................................................................................... 0.41 8.21 -1.02 8.82 ...... 4,872 3,256 43,111
68

Table 8. LOAN GUARANTEES: SUBSIDY REESTIMATES ¹ — Continued (In percentages, unless noted otherwise)
Original Subsidy Rate
Current Reestimated
Rate
Percentage point change due to interest rates
Percentage point change due to
technical assumptions
Current reestimate amount 2
($ thousands)
Net lifetime reestimate amount 3
($ thousands)
Net lifetime reestimate
amount excluding interest
($ thousands)
Total disbursements to
date ($ thousands)
Agency, Bureau, Program, Risk Category and Cohort Year
Characteristics of Subsidy Reestimates
FY 1998....................................................................................................... 0.40 4.00 -1.01 4.61 ...... 2,477 2,058 56,536 FY 1999....................................................................................................... -0.54 0.20 -0.10 0.84 -5 754 806 76,665 FY 2000....................................................................................................... -0.54 1.15 -0.10 1.79 -135 1,283 1,303 71,089 FY 2001....................................................................................................... -0.54 19.08 -0.28 19.90 8,594 25,893 19,088 103,072 FY 2002....................................................................................................... -0.68 2.34 0.01 3.01 -59 2,922 2,747 91,207 FY 2003....................................................................................................... -0.54 10.05 0.01 10.58 -2,978 17,127 14,361 142,630 FY 2004....................................................................................................... -0.60 4.90 ...... 5.50 -757 9,313 8,089 159,360 FY 2005....................................................................................................... 0.09 10.31 -0.01 10.23 -756 16,270 13,873 150,451 FY 2006....................................................................................................... 0.36 2.59 0.02 2.21 -189 2,470 2,892 141,902 FY 2007....................................................................................................... 3.66 3.59 0.48 -0.55 1,502 -1,310 -536 148,504 FY 2008....................................................................................................... 3.68 3.34 0.58 -0.92 2,154 -2,079 -1,118 195,245 FY 2009....................................................................................................... 3.08 1.53 0.48 -2.03 103 -5,430 -4,137 244,844 FY 2010....................................................................................................... 3.21 1.58 0.14 -1.77 1,219 -4,697 -3,785 219,884 FY 2011....................................................................................................... 3.95 4.05 0.50 -0.40 2,678 -638 330 177,186 FY 2012....................................................................................................... 4.73 2.17 ...... -2.56 -1,311 -3,996 -3,473 103,483 FY 2013....................................................................................................... 6.75 2.30 ...... -4.45 -856 -2,867 -2,713 39,740 FY 2014....................................................................................................... 4.97 2.46 ...... -2.51 -1,474 -1,560 -1,524 58,282 FY 2015....................................................................................................... 4.78 2.35 ...... -2.43 -9 -9 -9 358 Rural Housing Insurance Fund: Guaranteed 502 Single-Family Housing, Purchase FY 1992....................................................................................................... 1.13 0.53 0.01 -0.61 110 -2,047 -1,177 200,567 FY 1993....................................................................................................... 1.85 0.76 0.02 -1.11 414 -7,342 -5,472 508,495 FY 1994....................................................................................................... 1.68 1.38 -0.40 0.10 732 -2,201 -2,155 706,124 FY 1995....................................................................................................... 1.64 3.00 -0.01 1.37 902 21,949 13,313 1,007,286 FY 1996....................................................................................................... 0.20 2.97 0.01 2.76 1,595 60,693 44,761 1,624,552 FY 1997....................................................................................................... 0.23 2.87 -0.01 2.65 2,426 65,544 50,014 1,908,242 FY 1998....................................................................................................... 0.23 2.55 0.03 2.29 4,429 80,978 61,644 2,699,310 FY 1999....................................................................................................... 0.09 2.69 0.02 2.58 6,076 97,869 73,603 2,861,933 FY 2000....................................................................................................... 0.61 3.43 0.01 2.81 4,971 78,889 56,585 2,088,684 FY 2001....................................................................................................... 0.20 2.62 0.23 2.19 7,740 75,367 52,725 2,303,114 FY 2002....................................................................................................... 1.28 2.62 0.21 1.13 7,405 45,171 28,769 2,262,447
69

Table 8. LOAN GUARANTEES: SUBSIDY REESTIMATES ¹ — Continued (In percentages, unless noted otherwise)
Original Subsidy Rate
Current Reestimated
Rate
Percentage point change due to interest rates
Percentage point change due to
technical assumptions
Current reestimate amount 2
($ thousands)
Net lifetime reestimate amount 3
($ thousands)
Net lifetime reestimate
amount excluding interest
($ thousands)
Total disbursements to
date ($ thousands)
Agency, Bureau, Program, Risk Category and Cohort Year
Characteristics of Subsidy Reestimates
FY 2003....................................................................................................... 1.22 3.17 0.21 1.74 11,126 72,252 52,980 2,805,251 FY 2004....................................................................................................... 1.32 3.92 0.04 2.56 17,250 105,699 73,815 3,131,137 FY 2005....................................................................................................... 1.07 5.71 0.02 4.62 16,021 183,163 133,147 2,976,427 FY 2006....................................................................................................... 1.16 7.21 -0.03 6.08 19,727 245,806 176,281 3,012,167 FY 2007....................................................................................................... 1.21 9.39 0.10 8.08 20,572 375,530 285,158 3,600,277 FY 2008....................................................................................................... 1.20 9.08 0.29 7.59 63,402 627,575 522,104 6,789,985 FY 2009....................................................................................................... 1.27 5.50 0.34 3.89 297,521 734,815 638,093 15,392,276 FY 2010....................................................................................................... 1.44 4.50 0.03 3.03 335,797 600,098 527,703 16,367,185 Guaranteed 502, Refinance FY 2001....................................................................................................... 0.20 2.36 0.23 1.93 -131 388 196 9,760 FY 2002....................................................................................................... 1.28 2.57 0.20 1.09 -1,126 601 212 72,953 FY 2003....................................................................................................... 0.18 3.81 0.13 3.50 -3,779 10,386 8,179 230,605 FY 2004....................................................................................................... 0.29 4.55 0.01 4.25 -710 2,672 2,084 49,128 FY 2005....................................................................................................... 0.27 6.46 ...... 6.19 -185 1,787 1,377 22,773 FY 2006....................................................................................................... 0.29 9.47 ...... 9.18 -13 450 331 3,574 FY 2007....................................................................................................... 0.50 13.31 0.03 12.78 -124 1,001 815 6,539 FY 2008....................................................................................................... 0.81 9.90 0.11 8.98 -312 7,932 6,737 75,840 FY 2009....................................................................................................... 0.98 5.96 0.14 4.84 -3,679 27,139 24,653 503,358 FY 2010....................................................................................................... 1.72 5.80 0.03 4.05 -1,788 11,473 10,964 272,282 Guaranteed 538 Multi-Family Housing FY 1996....................................................................................................... 6.10 25.91 -0.34 20.15 -127 317 493 3,177 FY 1997....................................................................................................... 3.09 -9.24 -2.62 -9.71 -10 -1,453 -541 4,100 FY 1998....................................................................................................... 3.00 -7.11 -2.35 -7.76 1 -710 -343 700 FY 1999....................................................................................................... 3.10 17.66 0.48 14.08 -139 1,772 1,038 11,835 FY 2000....................................................................................................... 0.48 7.76 2.94 4.34 -82 1,075 784 12,965 FY 2002....................................................................................................... 3.93 4.39 -1.85 2.31 237 -1,425 223 78,171 FY 2003....................................................................................................... 4.50 27.47 0.18 22.79 -250 10,042 7,939 41,181 FY 2004....................................................................................................... 5.95 27.51 -0.16 21.72 -465 17,044 15,468 77,023 FY 2005....................................................................................................... 3.49 14.85 -0.74 12.10 -559 6,236 5,600 59,243 FY 2006....................................................................................................... 5.42 20.50 0.20 14.88 -2,025 11,753 10,319 81,834 FY 2007....................................................................................................... 7.74 22.56 -5.35 20.17 -1,086 9,410 8,603 69,673
70

Table 8. LOAN GUARANTEES: SUBSIDY REESTIMATES ¹ — Continued (In percentages, unless noted otherwise)
Original Subsidy Rate
Current Reestimated
Rate
Percentage point change due to interest rates
Percentage point change due to
technical assumptions
Current reestimate amount 2
($ thousands)
Net lifetime reestimate amount 3
($ thousands)
Net lifetime reestimate
amount excluding interest
($ thousands)
Total disbursements to
date ($ thousands)
Agency, Bureau, Program, Risk Category and Cohort Year
Characteristics of Subsidy Reestimates
FY 2008....................................................................................................... 9.40 24.21 -7.56 22.37 -627 12,789 11,412 93,336 FY 2009....................................................................................................... 15.68 9.23 -8.48 2.03 -2,455 3,061 2,918 104,369 FY 2010....................................................................................................... 1.15 3.17 17.07 -15.05 -1,687 1,189 2,449 114,411 FY 2011....................................................................................................... 9.69 3.00 ...... -6.69 -1,188 -2,348 -1,962 29,301 FY 2012....................................................................................................... -0.06 -2.77 ...... -2.71 -846 -2,330 -2,053 75,252 FY 2013....................................................................................................... -0.04 -2.17 ...... -2.13 -593 -797 -696 31,999 FY 2014....................................................................................................... -0.19 -0.08 ...... 0.11 300 -67 -73 75,272 FY 2015....................................................................................................... -1.27 -0.28 ...... 0.99 47 47 45 4,496 Guaranteed 502 Single-Family Housing FY 2011....................................................................................................... -0.19 3.11 0.28 3.02 313,288 586,715 542,782 16,671,052 FY 2012....................................................................................................... -0.04 2.75 0.20 2.59 371,475 545,445 526,509 19,004,929 FY 2013....................................................................................................... -0.25 2.39 0.15 2.49 607,421 592,064 578,777 22,082,855 FY 2014....................................................................................................... -0.14 2.31 -0.03 2.48 503,045 478,607 457,195 18,907,130 FY 2015....................................................................................................... -0.61 2.38 ...... 2.99 458,766 458,766 448,413 15,165,086
Rural Business Cooperative Service: Rural Business: North American Development Bank Loan Guarantees FY 1998....................................................................................................... 1.04 7.96 -0.20 7.12 3 1,976 4,459 66,629 FY 1999....................................................................................................... 0.96 20.69 -0.31 20.04 7 12,166 11,214 59,284 FY 2000....................................................................................................... 3.28 19.28 -0.66 16.66 6 5,882 6,848 45,113 FY 2001....................................................................................................... 0.82 23.41 -0.68 23.27 3 6,257 6,033 27,956 FY 2002....................................................................................................... 3.68 -1.60 0.59 -5.87 -42 -18 -112 2,130 FY 2003....................................................................................................... 4.56 -1.60 0.17 -6.33 -88 -341 -277 4,560 FY 2004....................................................................................................... 2.94 6.49 0.03 3.52 -18 354 225 7,187 FY 2005....................................................................................................... 8.30 -1.60 2.04 -11.94 -53 -379 -292 3,000 FY 2007....................................................................................................... 9.15 20.49 0.24 11.10 -1,134 499 364 3,490 Guaranteed Business and Industry Loans—ARRA FY 2009....................................................................................................... 7.34 2.69 0.56 -5.21 -750 -2,183 -1,993 43,282 FY 2010....................................................................................................... 8.04 9.47 0.24 1.19 -5,532 18,513 18,344 1,396,270 Business and Industry Loan Guarantees FY 1992....................................................................................................... 5.87 4.47 -0.54 -0.86 -1 765 -1,674 82,995
71
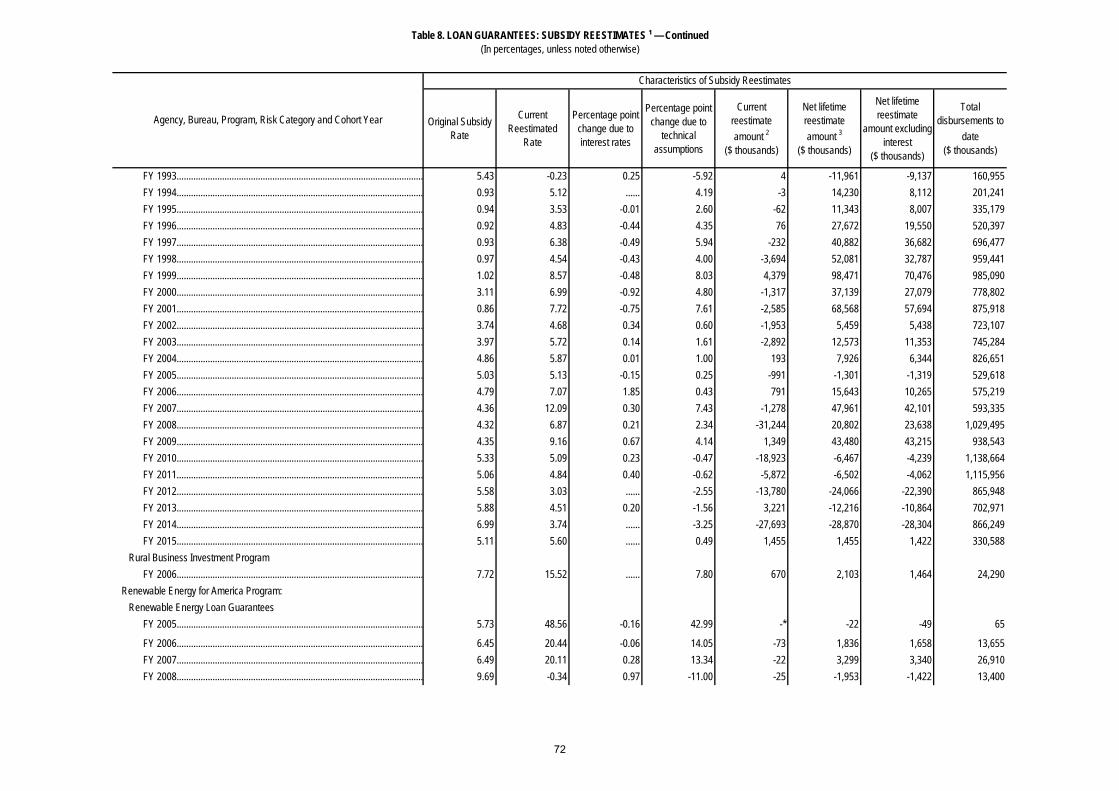
Table 8. LOAN GUARANTEES: SUBSIDY REESTIMATES ¹ — Continued (In percentages, unless noted otherwise)
Original Subsidy Rate
Current Reestimated
Rate
Percentage point change due to interest rates
Percentage point change due to
technical assumptions
Current reestimate amount 2
($ thousands)
Net lifetime reestimate amount 3
($ thousands)
Net lifetime reestimate
amount excluding interest
($ thousands)
Total disbursements to
date ($ thousands)
Agency, Bureau, Program, Risk Category and Cohort Year
Characteristics of Subsidy Reestimates
FY 1993....................................................................................................... 5.43 -0.23 0.25 -5.92 4 -11,961 -9,137 160,955 FY 1994....................................................................................................... 0.93 5.12 ...... 4.19 -3 14,230 8,112 201,241 FY 1995....................................................................................................... 0.94 3.53 -0.01 2.60 -62 11,343 8,007 335,179 FY 1996....................................................................................................... 0.92 4.83 -0.44 4.35 76 27,672 19,550 520,397 FY 1997....................................................................................................... 0.93 6.38 -0.49 5.94 -232 40,882 36,682 696,477 FY 1998....................................................................................................... 0.97 4.54 -0.43 4.00 -3,694 52,081 32,787 959,441 FY 1999....................................................................................................... 1.02 8.57 -0.48 8.03 4,379 98,471 70,476 985,090 FY 2000....................................................................................................... 3.11 6.99 -0.92 4.80 -1,317 37,139 27,079 778,802 FY 2001....................................................................................................... 0.86 7.72 -0.75 7.61 -2,585 68,568 57,694 875,918 FY 2002....................................................................................................... 3.74 4.68 0.34 0.60 -1,953 5,459 5,438 723,107 FY 2003....................................................................................................... 3.97 5.72 0.14 1.61 -2,892 12,573 11,353 745,284 FY 2004....................................................................................................... 4.86 5.87 0.01 1.00 193 7,926 6,344 826,651 FY 2005....................................................................................................... 5.03 5.13 -0.15 0.25 -991 -1,301 -1,319 529,618 FY 2006....................................................................................................... 4.79 7.07 1.85 0.43 791 15,643 10,265 575,219 FY 2007....................................................................................................... 4.36 12.09 0.30 7.43 -1,278 47,961 42,101 593,335 FY 2008....................................................................................................... 4.32 6.87 0.21 2.34 -31,244 20,802 23,638 1,029,495 FY 2009....................................................................................................... 4.35 9.16 0.67 4.14 1,349 43,480 43,215 938,543 FY 2010....................................................................................................... 5.33 5.09 0.23 -0.47 -18,923 -6,467 -4,239 1,138,664 FY 2011....................................................................................................... 5.06 4.84 0.40 -0.62 -5,872 -6,502 -4,062 1,115,956 FY 2012....................................................................................................... 5.58 3.03 ...... -2.55 -13,780 -24,066 -22,390 865,948 FY 2013....................................................................................................... 5.88 4.51 0.20 -1.56 3,221 -12,216 -10,864 702,971 FY 2014....................................................................................................... 6.99 3.74 ...... -3.25 -27,693 -28,870 -28,304 866,249 FY 2015....................................................................................................... 5.11 5.60 ...... 0.49 1,455 1,455 1,422 330,588 Rural Business Investment Program FY 2006....................................................................................................... 7.72 15.52 ...... 7.80 670 2,103 1,464 24,290 Renewable Energy for America Program: Renewable Energy Loan Guarantees FY 2005....................................................................................................... 5.73 48.56 -0.16 42.99 -* -22 -49 65
FY 2006....................................................................................................... 6.45 20.44 -0.06 14.05 -73 1,836 1,658 13,655 FY 2007....................................................................................................... 6.49 20.11 0.28 13.34 -22 3,299 3,340 26,910 FY 2008....................................................................................................... 9.69 -0.34 0.97 -11.00 -25 -1,953 -1,422 13,400
72

Table 8. LOAN GUARANTEES: SUBSIDY REESTIMATES ¹ — Continued (In percentages, unless noted otherwise)
Original Subsidy Rate
Current Reestimated
Rate
Percentage point change due to interest rates
Percentage point change due to
technical assumptions
Current reestimate amount 2
($ thousands)
Net lifetime reestimate amount 3
($ thousands)
Net lifetime reestimate
amount excluding interest
($ thousands)
Total disbursements to
date ($ thousands)
Agency, Bureau, Program, Risk Category and Cohort Year
Characteristics of Subsidy Reestimates
FY 2009....................................................................................................... 9.69 -0.28 0.41 -10.38 -97 -5,683 -5,055 49,541 FY 2010....................................................................................................... 13.64 -0.07 0.39 -14.10 -1,562 -8,399 -7,514 55,001 FY 2011....................................................................................................... 46.36 0.90 2.99 -48.45 -760 -8,641 -7,707 17,667 FY 2012....................................................................................................... 26.19 1.04 ...... -25.15 -446 -2,216 -2,137 8,591 FY 2013....................................................................................................... 24.01 4.64 ...... -19.37 -1,642 -6,136 -6,039 29,434 Biorefinery Assistance: Section 9003 Loan Guarantees FY 2011....................................................................................................... 26.02 16.80 1.20 -10.42 -10,050 -17,942 -15,219 87,825
FY 2015....................................................................................................... 40.32 (4) ...... ...... ...... ...... ...... ......
Rural Utilities Service: Water and Waste Disposal Loan Guarantees
FY 1992....................................................................................................... -0.61 -0.80 (6) -0.19 ...... -16 1 3,843
FY 1993....................................................................................................... -0.72 -0.80 (6) -0.08 ...... * 1 809 FY 1994....................................................................................................... -1.15 -0.79 -0.21 0.57 ...... 29 15 3,591 FY 1996....................................................................................................... -1.18 -0.80 -2.25 2.63 ...... 53 32 8,460 FY 1997....................................................................................................... -1.09 -0.80 -2.32 2.61 ...... 10 6 2,188 FY 1998....................................................................................................... -1.90 -0.80 -1.29 2.39 ...... 167 152 14,019 FY 1999....................................................................................................... -1.08 -0.83 -3.31 3.56 ...... 11 16 5,864 FY 2000....................................................................................................... -0.83 -0.80 2.47 -2.44 ...... 6 4 9,013 FY 2001....................................................................................................... -1.50 -0.81 -0.45 1.14 ...... 34 31 4,747 FY 2002....................................................................................................... -0.80 -0.83 ...... -0.03 ...... -1 -* 2,247 FY 2003....................................................................................................... -0.81 43.83 ...... 44.64 ...... 1,737 1,532 3,542 FY 2004....................................................................................................... -0.90 -0.88 ...... 0.02 ...... 13 11 41,183 FY 2005....................................................................................................... -0.90 -0.90 ...... ...... ...... -4 1 2,650 FY 2007....................................................................................................... -0.90 -0.89 ...... 0.01 -27 -2 -4 2,951 FY 2008....................................................................................................... -0.82 -0.90 ...... -0.08 -4 -21 -8 4,796 FY 2009....................................................................................................... -0.82 -0.33 ...... 0.49 -21 5 8 1,983 FY 2010....................................................................................................... -0.82 0.62 ...... 1.44 -7 131 124 9,018 FY 2011....................................................................................................... -0.85 0.48 ...... 1.33 19 285 253 17,036 FY 2012....................................................................................................... 1.59 0.53 ...... -1.06 -34 -81 -77 6,774 FY 2013....................................................................................................... 1.06 0.52 ...... -0.54 -11 -101 -96 16,990
73

Table 8. LOAN GUARANTEES: SUBSIDY REESTIMATES ¹ — Continued (In percentages, unless noted otherwise)
Original Subsidy Rate
Current Reestimated
Rate
Percentage point change due to interest rates
Percentage point change due to
technical assumptions
Current reestimate amount 2
($ thousands)
Net lifetime reestimate amount 3
($ thousands)
Net lifetime reestimate
amount excluding interest
($ thousands)
Total disbursements to
date ($ thousands)
Agency, Bureau, Program, Risk Category and Cohort Year
Characteristics of Subsidy Reestimates
FY 2014....................................................................................................... 0.71 0.58 ...... -0.13 -6 -6 -6 4,538
FY 2015....................................................................................................... 0.71 (4) ...... ...... ...... ...... ...... ...... Rural Electrification and Telecommunications Loans: Guaranteed Electric FY 1999....................................................................................................... 0.00 0.01 0.01 ...... -3 -12 24 145,911 FY 2000....................................................................................................... 0.01 0.02 ...... 0.01 -1 -5 6 52,259 FY 2001....................................................................................................... 0.01 0.03 ...... 0.02 -1 -1 10 51,717
Department of Defense—Military Programs
Family Housing: Family Housing Improvement Fund Guaranteed Loans FY 2000....................................................................................................... 6.76 0.32 -0.21 -6.23 -335 -15,378 -9,463 172,635 FY 2002....................................................................................................... 5.55 0.58 0.24 -5.21 -141 -4,220 -3,064 64,600 FY 2003....................................................................................................... 5.63 0.76 0.09 -4.96 -157 -4,034 -3,212 74,000 FY 2005....................................................................................................... 6.27 1.36 -0.07 -4.84 -1,140 -10,467 -8,095 165,000 FY 2010....................................................................................................... 6.02 7.14 ...... 1.13 1,078 3,579 3,126 82,000 FY 2013....................................................................................................... 15.30 12.78 0.93 -3.45 -210 1,558 1,396 299,831
Department of Education
Office of Federal Student Aid: Federal Family Education Loan: FFEL Guarantees FY 1992....................................................................................................... 14.66 13.01 ...... -1.65 -14,570 -1,117,946 -425,472 14,467,721 FY 1993....................................................................................................... 13.48 11.17 ...... -2.31 -2,663 -1,097,845 -473,993 17,436,504 FY 1994....................................................................................................... 11.93 11.53 ...... -0.40 2,584 -679,970 -209,031 22,599,343 FY 1995....................................................................................................... 15.03 11.08 ...... -3.95 11,246 -791,052 -285,763 21,963,895 FY 1996....................................................................................................... 12.83 9.70 ...... -3.13 21,285 -842,600 -603,730 21,854,875 FY 1997....................................................................................................... 12.71 9.10 ...... -3.61 16,618 -1,080,613 -832,398 23,226,779 FY 1998....................................................................................................... 8.83 9.02 ...... 0.19 8,931 -178,574 19,631 23,289,359 FY 1999....................................................................................................... 12.34 8.37 0.04 -4.01 15,517 -1,304,878 -1,010,891 25,455,019 FY 2000....................................................................................................... 14.20 6.55 -0.10 -7.55 -5,058 -2,348,353 -1,924,232 29,250,329 FY 2001....................................................................................................... 8.68 4.52 0.29 -4.45 4,758 -1,484,028 -1,238,426 34,219,185 FY 2002....................................................................................................... 8.84 3.89 -0.31 -4.64 -3,304 -2,408,103 -1,946,974 51,516,933
74

Table 8. LOAN GUARANTEES: SUBSIDY REESTIMATES ¹ — Continued (In percentages, unless noted otherwise)
Original Subsidy Rate
Current Reestimated
Rate
Percentage point change due to interest rates
Percentage point change due to
technical assumptions
Current reestimate amount 2
($ thousands)
Net lifetime reestimate amount 3
($ thousands)
Net lifetime reestimate
amount excluding interest
($ thousands)
Total disbursements to
date ($ thousands)
Agency, Bureau, Program, Risk Category and Cohort Year
Characteristics of Subsidy Reestimates
FY 2003....................................................................................................... 9.58 5.73 -0.04 -3.81 -66,519 -2,701,350 -1,827,257 69,052,514 FY 2004....................................................................................................... 11.61 7.80 0.09 -3.90 -99,966 -4,102,649 -3,098,491 75,325,872 FY 2005....................................................................................................... 11.26 8.06 0.25 -3.45 -235,833 -4,542,199 -2,536,946 97,813,465 FY 2006....................................................................................................... 12.98 0.76 -0.95 -11.27 -510,441 -17,742,637 -14,200,042 119,224,489 FY 2007....................................................................................................... 6.27 -10.38 0.07 -16.72 -805,047 -17,694,140 -14,621,757 99,119,814 FY 2008....................................................................................................... -3.67 -12.82 3.96 -13.11 -462,380 -8,491,784 -7,275,705 67,070,636 FY 2009....................................................................................................... -2.98 -5.89 0.09 -3.00 -139,518 -2,074,552 -1,848,261 66,778,650 FY 2010....................................................................................................... -0.15 -3.38 -0.01 -3.22 -16,544 -645,313 -615,442 20,021,252 Health Education Assistance Loans: HEAL Loan Guarantee FY 1992....................................................................................................... 10.32 -4.15 ...... -14.47 -591 -110,730 -42,276 290,675 FY 1993....................................................................................................... 9.06 -3.85 -13.43 0.52 -752 -92,889 -43,369 340,752 FY 1994....................................................................................................... 8.87 1.42 -3.18 -4.27 -1,779 -44,975 -15,242 587,951 FY 1995....................................................................................................... 7.78 1.20 -1.02 -5.56 -2,940 -26,508 -14,265 616,250 FY 1996....................................................................................................... 0.06 0.58 1.62 -1.10 -2,228 372 2,812 464,112 FY 1997....................................................................................................... 0.34 0.83 1.27 -0.78 -1,488 2,017 2,572 350,542 FY 1998....................................................................................................... 1.20 0.18 1.98 -3.00 -1,696 -2,978 -192 331,270 FY 1999....................................................................................................... 0.00 3.07 5.45 -2.38 -1,237 5,713 8,239 252,495 FY 2000....................................................................................................... 0.00 4.18 ...... 4.18 -1,052 4,360 5,129 116,608 FY 2001....................................................................................................... 0.00 4.37 4.35 0.02 -1,876 5,086 6,614 150,489 FY 2002....................................................................................................... 10.67 4.97 -4.54 -1.16 -3,115 -12,153 -10,048 174,733 FY 2003....................................................................................................... 15.76 5.98 -7.47 -2.31 -1,379 -13,202 -11,029 78,857 FY 2004....................................................................................................... 16.48 8.55 2.99 -10.92 -1,042 -22,696 -20,502 45,693
Department of Energy
Title 17 Innovative Technology Loan Guarantee Program: Section 1705 Loan Guarantees FY 2010....................................................................................................... 3.78 15.63 -0.18 12.03 -2,567 12,295 11,285 98,500 FY 2011....................................................................................................... 7.56 3.06 0.49 -4.99 -68,898 -86,578 -76,370 3,964,267
Department of Health and Human Services
Health Resources and Services Administration: Facilities Renovation Loans FY 2003....................................................................................................... 3.49 0.87 -2.14 -0.48 -13 -150 -129 4,422
75

Table 8. LOAN GUARANTEES: SUBSIDY REESTIMATES ¹ — Continued (In percentages, unless noted otherwise)
Original Subsidy Rate
Current Reestimated
Rate
Percentage point change due to interest rates
Percentage point change due to
technical assumptions
Current reestimate amount 2
($ thousands)
Net lifetime reestimate amount 3
($ thousands)
Net lifetime reestimate
amount excluding interest
($ thousands)
Total disbursements to
date ($ thousands)
Agency, Bureau, Program, Risk Category and Cohort Year
Characteristics of Subsidy Reestimates
FY 2004....................................................................................................... 3.52 0.19 -2.63 -0.70 -28 -149 -128 3,680 FY 2005....................................................................................................... 3.57 1.67 -1.60 -0.30 -1 -344 -294 16,442 FY 2006....................................................................................................... 3.50 0.78 -2.13 -0.59 -23 -205 -196 6,125 FY 2007....................................................................................................... 3.42 0.59 -1.86 -0.97 -193 -1,014 -806 28,925 FY 2008....................................................................................................... 3.41 1.10 -1.69 -0.62 -31 -294 -186 10,000 FY 2011....................................................................................................... 2.72 1.99 0.41 -1.14 -63 -248 -236 31,630 FY 2012....................................................................................................... 2.67 1.96 0.82 -1.53 -64 -80 -72 10,000 FY 2014....................................................................................................... 2.81 2.63 -0.07 -0.11 -6 -6 -6 3,300
Department of Housing and Urban Development
Public and Indian Housing Programs: Title VI Indian Federal Guarantees Program
FY 2000....................................................................................................... 11.07 0.94 (6) -10.13 -192 -1,151 -674 6,996
FY 2001....................................................................................................... 11.07 0.25 (6) -10.82 -144 -1,217 -845 7,696
FY 2002....................................................................................................... 11.07 0.40 (6) -10.67 -913 -8,104 -6,875 51,792
FY 2003....................................................................................................... 11.07 0.43 (6) -10.64 -307 -1,354 -786 8,107
FY 2004....................................................................................................... 10.56 0.83 (6) -9.73 -402 -1,529 -938 10,203
FY 2005....................................................................................................... 10.32 4.50 (6) -5.82 -118 -556 -328 4,493
FY 2006....................................................................................................... 12.26 0.87 (6) -11.39 -341 -1,954 -1,372 13,338
FY 2007....................................................................................................... 11.99 3.98 (6) -8.01 -914 -1,230 -952 12,457 FY 2008....................................................................................................... 12.12 2.63 0.19 -9.68 -650 -1,502 -1,213 13,351 FY 2009....................................................................................................... 12.34 4.84 0.32 -7.82 1 -663 -586 7,922 FY 2010....................................................................................................... 11.18 10.19 -0.36 -0.63 -66 -32 -33 3,153 FY 2011....................................................................................................... 10.20 10.31 -0.55 0.66 -490 64 99 20,373 FY 2012....................................................................................................... 10.80 16.43 0.96 4.67 1,213 306 240 20,267 FY 2013....................................................................................................... 10.91 19.93 0.74 8.28 1,568 1,568 1,467 16,466 FY 2014....................................................................................................... 12.10 22.06 -0.24 10.20 1,234 1,234 1,169 11,900 FY 2015....................................................................................................... 11.21 10.62 0.59 -1.18 -80 -80 -78 13,354 Indian Housing Loan Guarantee
FY 1994....................................................................................................... 8.13 -28.49 (6) -36.62 ...... -196 -67 192
FY 1995....................................................................................................... 8.13 -8.77 (6) -16.90 -* -672 -527 1,965
76

Table 8. LOAN GUARANTEES: SUBSIDY REESTIMATES ¹ — Continued (In percentages, unless noted otherwise)
Original Subsidy Rate
Current Reestimated
Rate
Percentage point change due to interest rates
Percentage point change due to
technical assumptions
Current reestimate amount 2
($ thousands)
Net lifetime reestimate amount 3
($ thousands)
Net lifetime reestimate
amount excluding interest
($ thousands)
Total disbursements to
date ($ thousands)
Agency, Bureau, Program, Risk Category and Cohort Year
Characteristics of Subsidy Reestimates
FY 1996....................................................................................................... 8.13 -3.86 (6) -11.99 119 -2,842 -2,854 14,491
FY 1997....................................................................................................... 8.13 -2.02 (6) -10.15 2 -3,209 -3,765 22,455
FY 1998....................................................................................................... 8.13 -3.67 (6) -11.80 2 -2,142 -2,474 13,458
FY 1999....................................................................................................... 8.13 0.36 (6) -7.77 10 -1,046 -1,640 11,886
FY 2000....................................................................................................... 8.13 -2.12 (6) -10.25 -12 -1,870 -2,266 14,341
FY 2001....................................................................................................... 8.13 -0.14 (6) -8.27 7 -1,124 -1,472 11,814 FY 2002....................................................................................................... 2.47 -1.22 0.15 -3.84 -* -1,205 -1,022 25,969 FY 2003....................................................................................................... 2.43 0.28 0.30 -2.45 -48 -889 -844 39,223 FY 2004....................................................................................................... 2.73 0.43 0.05 -2.35 4 -1,222 -1,321 60,434
FY 2005....................................................................................................... 2.58 3.27 (6) 0.69 449 1,914 646 98,520
FY 2006....................................................................................................... 2.42 4.88 (6) 2.46 814 7,061 4,310 182,138
FY 2007....................................................................................................... 2.35 5.46 (6) 3.11 1,353 10,479 6,769 226,394 FY 2008....................................................................................................... 2.42 6.85 0.36 4.07 2,158 17,138 12,759 297,292 FY 2009....................................................................................................... 2.52 2.99 0.40 0.07 1,253 3,422 2,145 479,865 FY 2010....................................................................................................... 0.68 2.72 0.04 2.00 4,037 12,414 10,619 533,198 FY 2011....................................................................................................... 0.83 2.47 0.10 1.54 -726 7,875 8,163 508,646 FY 2012....................................................................................................... 1.46 3.80 0.11 2.23 3,253 17,327 17,921 766,354 FY 2013....................................................................................................... 1.35 3.51 0.07 2.09 3,214 11,851 12,122 561,962
FY 2014....................................................................................................... 0.57 3.40 (6) 2.83 11,287 19,797 19,157 676,217 FY 2015....................................................................................................... 1.16 2.47 ...... 1.31 4,463 4,463 4,546 392,323 Native Hawaiian Housing Loan Guarantees
FY 2005....................................................................................................... 2.58 -1.00 (6) -3.58 -8 -7 -32 1,674
FY 2008....................................................................................................... 2.42 -0.84 (6) -3.26 -22 -239 -139 4,342 FY 2009....................................................................................................... 2.52 -0.91 0.40 -3.83 -2 -1,351 -445 13,049 FY 2010....................................................................................................... 2.52 -0.73 0.08 -3.33 -239 -1,984 -1,356 35,919 FY 2011....................................................................................................... 0.83 -0.58 1.28 -2.69 -66 -483 -170 12,286 FY 2012....................................................................................................... 0.93 -0.53 0.07 -1.53 7 -64 -56 3,812 FY 2013....................................................................................................... 0.50 -0.39 0.03 -0.92 90 -233 -216 24,999 FY 2014....................................................................................................... 0.53 -0.40 0.01 -0.94 14 -98 -92 11,155 FY 2015....................................................................................................... 0.62 -0.51 ...... -1.13 -44 -44 -41 8,035
77

Table 8. LOAN GUARANTEES: SUBSIDY REESTIMATES ¹ — Continued (In percentages, unless noted otherwise)
Original Subsidy Rate
Current Reestimated
Rate
Percentage point change due to interest rates
Percentage point change due to
technical assumptions
Current reestimate amount 2
($ thousands)
Net lifetime reestimate amount 3
($ thousands)
Net lifetime reestimate
amount excluding interest
($ thousands)
Total disbursements to
date ($ thousands)
Agency, Bureau, Program, Risk Category and Cohort Year
Characteristics of Subsidy Reestimates
Community Planning and Development: Section 108 Community Development Loan Guarantee
FY 1996....................................................................................................... 2.10 0.04 (6) -2.06 -1,194 -9,163 -4,401 273,405
FY 1997....................................................................................................... 2.30 0.04 (6) -2.26 -841 -8,065 -4,155 211,118
FY 1998....................................................................................................... 2.30 0.21 (6) -2.09 -3,014 -10,755 -5,154 277,198
FY 1999....................................................................................................... 2.30 0.36 (6) -1.94 -4,431 -11,103 -4,941 293,147
FY 2000....................................................................................................... 2.30 0.45 (6) -1.85 -4,217 -10,079 -5,346 300,048
FY 2001....................................................................................................... 2.30 0.33 (6) -1.97 -2,068 -6,305 -3,427 188,973
FY 2002....................................................................................................... 2.30 0.83 (6) -1.47 -5,124 -9,337 -3,624 259,968
FY 2003....................................................................................................... 2.30 0.78 (6) -1.52 -5,075 -8,657 -4,147 281,379
FY 2004....................................................................................................... 2.30 1.16 (6) -1.14 -4,152 -5,588 -2,679 238,735
FY 2005....................................................................................................... 2.30 0.97 (6) -1.33 -4,994 -7,018 -2,908 262,554 FY 2006....................................................................................................... 2.20 2.09 0.06 -0.17 -4,491 -2,184 -54 181,890 FY 2007....................................................................................................... 2.17 2.14 0.17 -0.20 -3,871 -1,453 81 158,020 FY 2008....................................................................................................... 2.25 1.64 0.22 -0.83 -4,239 -1,716 -624 123,481 FY 2009....................................................................................................... 2.26 1.70 0.16 -0.72 -6,202 -1,596 -594 148,676 FY 2010....................................................................................................... 2.40 2.89 ...... 0.49 -2,637 1,232 1,399 128,212 FY 2011....................................................................................................... 2.34 2.90 ...... 0.56 -2,576 1,992 2,022 176,423 FY 2012....................................................................................................... 2.48 3.25 ...... 0.77 -44 1,029 1,179 76,721 FY 2013....................................................................................................... 2.46 3.44 ...... 0.98 -599 -202 -193 41,967 FY 2014....................................................................................................... 2.56 3.49 ...... 0.93 147 147 138 15,330 FY 2015....................................................................................................... 2.42 3.66 ...... 1.24 202 202 196 15,951
Housing Programs: FHA-Mutual Mortgage Insurance (MMI) Fund: Mutual Mortgage Insurance Program FY 1992....................................................................................................... -2.60 -3.23 -0.82 0.19 -9,281 -229,094 -264,646 43,436,966 FY 1993....................................................................................................... -2.70 -2.66 -0.16 0.20 -4,751 227,602 12,905 71,620,338 FY 1994....................................................................................................... -2.79 -1.80 0.76 0.23 -4,493 1,559,833 939,503 82,367,121 FY 1995....................................................................................................... -1.95 -0.73 0.99 0.23 -927 925,048 604,759 40,997,968 FY 1996....................................................................................................... -2.77 -1.05 1.42 0.30 -2,122 1,902,842 1,497,237 64,199,785 FY 1997....................................................................................................... -2.88 -1.01 1.34 0.53 -2,257 2,171,193 1,630,112 67,016,474
78

Table 8. LOAN GUARANTEES: SUBSIDY REESTIMATES ¹ — Continued (In percentages, unless noted otherwise)
Original Subsidy Rate
Current Reestimated
Rate
Percentage point change due to interest rates
Percentage point change due to
technical assumptions
Current reestimate amount 2
($ thousands)
Net lifetime reestimate amount 3
($ thousands)
Net lifetime reestimate
amount excluding interest
($ thousands)
Total disbursements to
date ($ thousands)
Agency, Bureau, Program, Risk Category and Cohort Year
Characteristics of Subsidy Reestimates
FY 1998....................................................................................................... -2.99 -1.43 1.18 0.38 -13,430 1,908,005 1,358,411 93,255,810 FY 1999....................................................................................................... -2.62 -1.25 0.91 0.46 -21,187 2,121,041 1,450,497 111,807,782 FY 2000....................................................................................................... -1.99 0.22 1.69 0.52 -13,487 2,492,137 1,769,579 84,858,576 FY 2001....................................................................................................... -2.15 0.11 1.54 0.72 -27,251 3,549,072 2,596,133 121,642,414 FY 2002....................................................................................................... -2.07 0.41 1.41 1.07 -66,571 4,085,747 3,137,828 131,415,258 FY 2003....................................................................................................... -2.53 -0.14 1.53 0.86 -168,690 2,612,507 2,692,789 115,979,735 FY 2004....................................................................................................... -2.47 2.74 0.98 4.23 -288,654 6,785,487 5,540,034 107,616,910 FY 2005....................................................................................................... -1.80 6.42 0.97 7.25 -249,187 5,285,616 4,770,379 57,971,792 FY 2006....................................................................................................... -1.70 7.68 1.52 7.86 -294,767 5,746,591 4,865,368 51,765,426 FY 2007....................................................................................................... -0.37 9.63 ...... 10.00 -372,231 6,385,125 5,683,030 56,509,219 FY 2008....................................................................................................... -0.25 6.87 0.04 7.08 -1,105,985 13,681,624 12,333,933 171,825,322 FY 2009....................................................................................................... -0.05 1.66 0.09 1.62 -1,978,568 6,274,635 5,706,100 330,458,853 FY 2010....................................................................................................... -0.86 -1.05 0.04 -0.23 -1,934,850 -689,444 -615,484 297,614,083 FY 2011....................................................................................................... -3.10 -2.59 -0.22 0.73 -1,199,777 1,096,696 858,383 217,747,580 FY 2012....................................................................................................... -2.53 -4.04 -0.03 -1.48 -1,158,908 -3,358,639 -3,341,411 213,166,997 FY 2013....................................................................................................... -7.22 -4.48 -0.24 2.98 -1,207,276 6,125,814 5,920,118 239,975,097 FY 2014....................................................................................................... -7.25 -5.12 0.23 1.90 2,136,545 2,735,664 2,596,463 135,032,745 FY 2015....................................................................................................... -9.03 -5.35 2.49 1.19 1,371,588 1,371,588 1,340,700 212,917,636 MMI HECM FY 2009....................................................................................................... -1.37 3.13 -1.01 5.51 -1,531,554 1,080,182 1,336,634 30,188,777 FY 2010....................................................................................................... -0.50 -2.22 4.01 -5.73 -1,957,731 -612,240 -377,497 21,732,179 FY 2011....................................................................................................... -0.01 2.34 0.01 2.34 -419,120 390,304 427,952 18,224,410 FY 2012....................................................................................................... -1.52 2.56 -2.02 6.10 -234,660 508,308 528,540 13,170,788 FY 2013....................................................................................................... -2.29 2.80 -0.39 4.70 -500,084 746,244 746,171 14,775,707 FY 2014....................................................................................................... -0.41 -0.92 0.82 -1.33 -436,013 -85,230 -65,872 13,533,612 FY 2015....................................................................................................... -0.40 -2.01 -1.93 0.32 -256,758 -256,758 -248,652 15,988,470 FHA-General and Special Risk Insurance Fund: FHA-General and Special Risk Insurance FY 1992....................................................................................................... 0.46 ...... ...... ...... 87,275 -116,929 ...... 7,448,316 FY 1993....................................................................................................... 1.65 ...... ...... ...... 14,697 -191,871 ...... 9,516,025 FY 1994....................................................................................................... 0.11 ...... ...... ...... 24,036 -456,888 ...... 13,260,764 FY 1995....................................................................................................... -0.39 ...... ...... ...... 23,994 69,118 ...... 9,909,556
79
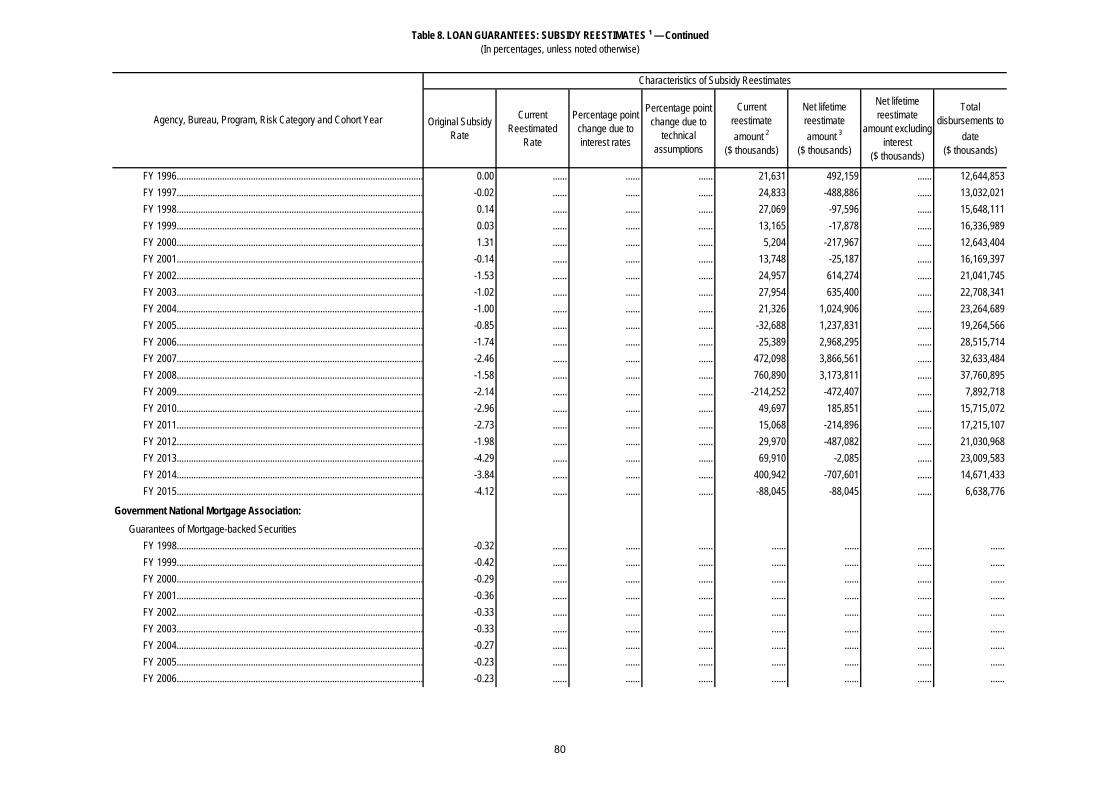
Table 8. LOAN GUARANTEES: SUBSIDY REESTIMATES ¹ — Continued (In percentages, unless noted otherwise)
Original Subsidy Rate
Current Reestimated
Rate
Percentage point change due to interest rates
Percentage point change due to
technical assumptions
Current reestimate amount 2
($ thousands)
Net lifetime reestimate amount 3
($ thousands)
Net lifetime reestimate
amount excluding interest
($ thousands)
Total disbursements to
date ($ thousands)
Agency, Bureau, Program, Risk Category and Cohort Year
Characteristics of Subsidy Reestimates
FY 1996....................................................................................................... 0.00 ...... ...... ...... 21,631 492,159 ...... 12,644,853 FY 1997....................................................................................................... -0.02 ...... ...... ...... 24,833 -488,886 ...... 13,032,021 FY 1998....................................................................................................... 0.14 ...... ...... ...... 27,069 -97,596 ...... 15,648,111 FY 1999....................................................................................................... 0.03 ...... ...... ...... 13,165 -17,878 ...... 16,336,989 FY 2000....................................................................................................... 1.31 ...... ...... ...... 5,204 -217,967 ...... 12,643,404 FY 2001....................................................................................................... -0.14 ...... ...... ...... 13,748 -25,187 ...... 16,169,397 FY 2002....................................................................................................... -1.53 ...... ...... ...... 24,957 614,274 ...... 21,041,745 FY 2003....................................................................................................... -1.02 ...... ...... ...... 27,954 635,400 ...... 22,708,341 FY 2004....................................................................................................... -1.00 ...... ...... ...... 21,326 1,024,906 ...... 23,264,689 FY 2005....................................................................................................... -0.85 ...... ...... ...... -32,688 1,237,831 ...... 19,264,566 FY 2006....................................................................................................... -1.74 ...... ...... ...... 25,389 2,968,295 ...... 28,515,714 FY 2007....................................................................................................... -2.46 ...... ...... ...... 472,098 3,866,561 ...... 32,633,484 FY 2008....................................................................................................... -1.58 ...... ...... ...... 760,890 3,173,811 ...... 37,760,895 FY 2009....................................................................................................... -2.14 ...... ...... ...... -214,252 -472,407 ...... 7,892,718 FY 2010....................................................................................................... -2.96 ...... ...... ...... 49,697 185,851 ...... 15,715,072 FY 2011....................................................................................................... -2.73 ...... ...... ...... 15,068 -214,896 ...... 17,215,107 FY 2012....................................................................................................... -1.98 ...... ...... ...... 29,970 -487,082 ...... 21,030,968 FY 2013....................................................................................................... -4.29 ...... ...... ...... 69,910 -2,085 ...... 23,009,583 FY 2014....................................................................................................... -3.84 ...... ...... ...... 400,942 -707,601 ...... 14,671,433 FY 2015....................................................................................................... -4.12 ...... ...... ...... -88,045 -88,045 ...... 6,638,776
Government National Mortgage Association: Guarantees of Mortgage-backed Securities FY 1998....................................................................................................... -0.32 ...... ...... ...... ...... ...... ...... ...... FY 1999....................................................................................................... -0.42 ...... ...... ...... ...... ...... ...... ...... FY 2000....................................................................................................... -0.29 ...... ...... ...... ...... ...... ...... ...... FY 2001....................................................................................................... -0.36 ...... ...... ...... ...... ...... ...... ...... FY 2002....................................................................................................... -0.33 ...... ...... ...... ...... ...... ...... ...... FY 2003....................................................................................................... -0.33 ...... ...... ...... ...... ...... ...... ...... FY 2004....................................................................................................... -0.27 ...... ...... ...... ...... ...... ...... ...... FY 2005....................................................................................................... -0.23 ...... ...... ...... ...... ...... ...... ...... FY 2006....................................................................................................... -0.23 ...... ...... ...... ...... ...... ...... ......
80

Table 8. LOAN GUARANTEES: SUBSIDY REESTIMATES ¹ — Continued (In percentages, unless noted otherwise)
Original Subsidy Rate
Current Reestimated
Rate
Percentage point change due to interest rates
Percentage point change due to
technical assumptions
Current reestimate amount 2
($ thousands)
Net lifetime reestimate amount 3
($ thousands)
Net lifetime reestimate
amount excluding interest
($ thousands)
Total disbursements to
date ($ thousands)
Agency, Bureau, Program, Risk Category and Cohort Year
Characteristics of Subsidy Reestimates
FY 2007....................................................................................................... -0.21 ...... ...... ...... ...... ...... ...... ...... FY 2008....................................................................................................... -0.21 ...... ...... ...... ...... ...... ...... ...... FY 2009....................................................................................................... -0.21 ...... ...... ...... ...... ...... ...... ...... FY 2010....................................................................................................... -0.22 ...... ...... ...... ...... ...... ...... ...... FY 2011....................................................................................................... -0.24 ...... ...... ...... ...... ...... ...... ...... FY 2012....................................................................................................... -0.19 ...... ...... ...... ...... ...... ...... ...... FY 2013....................................................................................................... -0.23 ...... ...... ...... ...... ...... ...... ...... FY 2014....................................................................................................... -0.22 ...... ...... ...... ...... ...... ...... ...... FY 2015 7.................................................................................................... -0.28 -0.30 ...... -0.02 -1,795,932 -3,769,006 -3,658,750 4,936,061,208
Department of the Interior
Bureau of Indian Affairs: Indian Guaranteed Loans
FY 1992....................................................................................................... 6.73 4.28 (6) -2.45 -454 -2,846 -601 48,990
FY 1994....................................................................................................... 12.73 1.61 (6) -11.12 -797 -16,502 -8,791 59,090
FY 1995....................................................................................................... 18.73 3.05 (6) -15.68 -656 -14,288 -7,895 38,085
FY 1996....................................................................................................... 12.53 6.00 (6) -6.53 ...... -1,929 -1,271 15,818
FY 1997....................................................................................................... 13.00 8.16 (6) -4.84 -252 -1,139 -590 13,447
FY 1998....................................................................................................... 13.00 0.72 (6) -12.28 -382 -2,780 -1,857 17,019
FY 1999....................................................................................................... 7.54 4.82 (6) -2.72 -1,149 -2,491 -1,101 46,810 FY 2000....................................................................................................... 7.54 5.11 8.72 -11.15 212 -2,646 -1,477 53,928 FY 2001....................................................................................................... 6.73 2.00 0.51 -5.24 -278 -2,731 -1,638 44,247 FY 2002....................................................................................................... 6.00 3.81 0.29 -2.48 -76 -2,327 -970 53,034 FY 2003....................................................................................................... 6.91 8.25 0.37 0.97 -220 685 1,274 56,745 FY 2004....................................................................................................... 6.13 5.50 -0.02 -0.61 186 -1,614 130 75,193 FY 2005....................................................................................................... 6.76 5.29 -0.15 -1.32 878 -1,371 -383 68,054 FY 2006....................................................................................................... 4.75 6.53 -0.01 1.79 207 1,383 1,771 102,933 FY 2007....................................................................................................... 6.45 12.07 0.49 5.13 -391 3,621 3,531 66,327 FY 2008....................................................................................................... 6.56 2.61 0.75 -4.70 934 -3,529 -2,540 69,642 FY 2009....................................................................................................... 7.73 2.57 -0.41 -4.75 574 -4,490 -3,414 69,592 FY 2010....................................................................................................... 7.29 3.48 0.13 -3.94 895 -2,661 -2,271 61,491 FY 2011....................................................................................................... 8.16 5.30 ...... -2.86 1,352 -2,587 -2,153 78,239
81
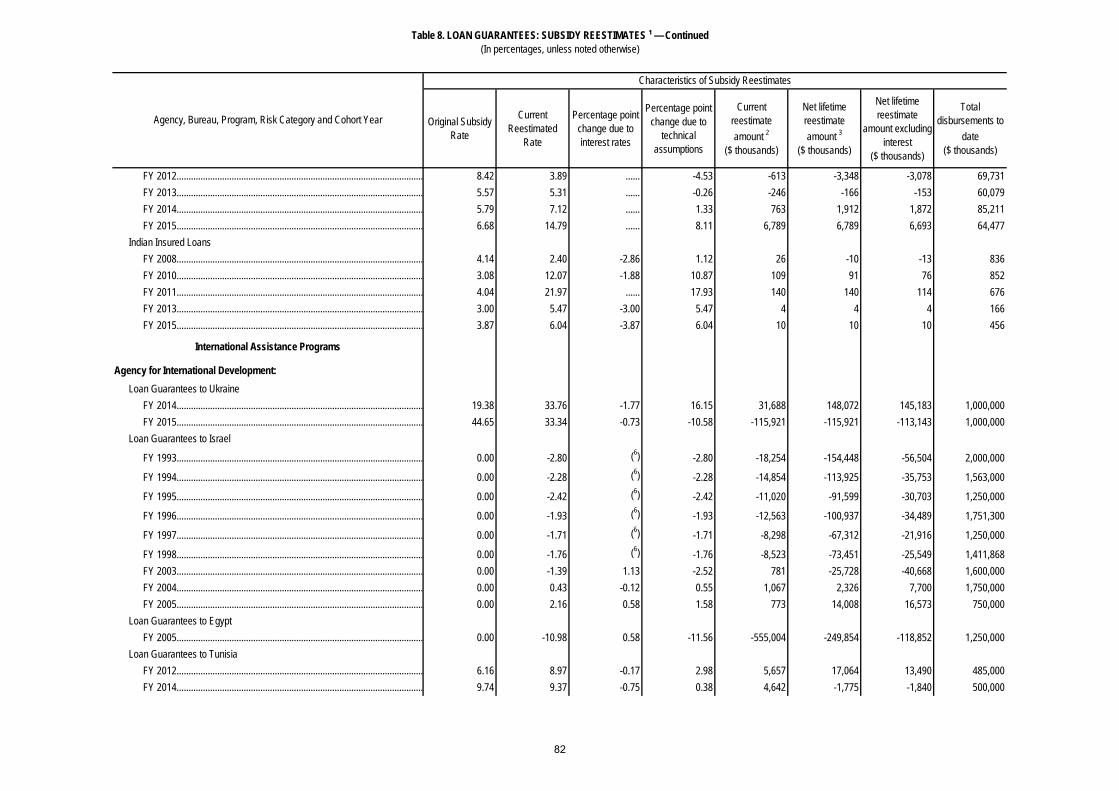
Table 8. LOAN GUARANTEES: SUBSIDY REESTIMATES ¹ — Continued (In percentages, unless noted otherwise)
Original Subsidy Rate
Current Reestimated
Rate
Percentage point change due to interest rates
Percentage point change due to
technical assumptions
Current reestimate amount 2
($ thousands)
Net lifetime reestimate amount 3
($ thousands)
Net lifetime reestimate
amount excluding interest
($ thousands)
Total disbursements to
date ($ thousands)
Agency, Bureau, Program, Risk Category and Cohort Year
Characteristics of Subsidy Reestimates
FY 2012....................................................................................................... 8.42 3.89 ...... -4.53 -613 -3,348 -3,078 69,731 FY 2013....................................................................................................... 5.57 5.31 ...... -0.26 -246 -166 -153 60,079 FY 2014....................................................................................................... 5.79 7.12 ...... 1.33 763 1,912 1,872 85,211 FY 2015....................................................................................................... 6.68 14.79 ...... 8.11 6,789 6,789 6,693 64,477 Indian Insured Loans FY 2008....................................................................................................... 4.14 2.40 -2.86 1.12 26 -10 -13 836 FY 2010....................................................................................................... 3.08 12.07 -1.88 10.87 109 91 76 852 FY 2011....................................................................................................... 4.04 21.97 ...... 17.93 140 140 114 676 FY 2013....................................................................................................... 3.00 5.47 -3.00 5.47 4 4 4 166 FY 2015....................................................................................................... 3.87 6.04 -3.87 6.04 10 10 10 456
International Assistance Programs
Agency for International Development: Loan Guarantees to Ukraine FY 2014....................................................................................................... 19.38 33.76 -1.77 16.15 31,688 148,072 145,183 1,000,000 FY 2015....................................................................................................... 44.65 33.34 -0.73 -10.58 -115,921 -115,921 -113,143 1,000,000 Loan Guarantees to Israel
FY 1993....................................................................................................... 0.00 -2.80 (6) -2.80 -18,254 -154,448 -56,504 2,000,000
FY 1994....................................................................................................... 0.00 -2.28 (6) -2.28 -14,854 -113,925 -35,753 1,563,000
FY 1995....................................................................................................... 0.00 -2.42 (6) -2.42 -11,020 -91,599 -30,703 1,250,000
FY 1996....................................................................................................... 0.00 -1.93 (6) -1.93 -12,563 -100,937 -34,489 1,751,300
FY 1997....................................................................................................... 0.00 -1.71 (6) -1.71 -8,298 -67,312 -21,916 1,250,000
FY 1998....................................................................................................... 0.00 -1.76 (6) -1.76 -8,523 -73,451 -25,549 1,411,868 FY 2003....................................................................................................... 0.00 -1.39 1.13 -2.52 781 -25,728 -40,668 1,600,000 FY 2004....................................................................................................... 0.00 0.43 -0.12 0.55 1,067 2,326 7,700 1,750,000 FY 2005....................................................................................................... 0.00 2.16 0.58 1.58 773 14,008 16,573 750,000 Loan Guarantees to Egypt FY 2005....................................................................................................... 0.00 -10.98 0.58 -11.56 -555,004 -249,854 -118,852 1,250,000 Loan Guarantees to Tunisia FY 2012....................................................................................................... 6.16 8.97 -0.17 2.98 5,657 17,064 13,490 485,000 FY 2014....................................................................................................... 9.74 9.37 -0.75 0.38 4,642 -1,775 -1,840 500,000
82
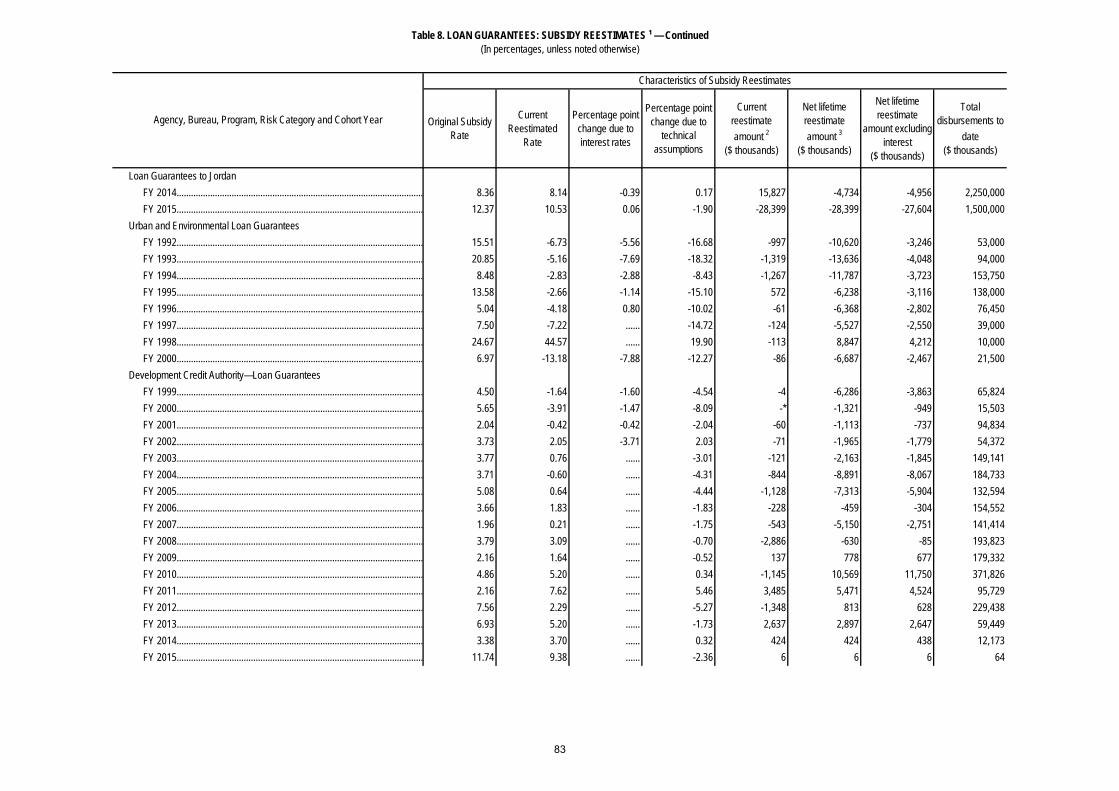
Table 8. LOAN GUARANTEES: SUBSIDY REESTIMATES ¹ — Continued (In percentages, unless noted otherwise)
Original Subsidy Rate
Current Reestimated
Rate
Percentage point change due to interest rates
Percentage point change due to
technical assumptions
Current reestimate amount 2
($ thousands)
Net lifetime reestimate amount 3
($ thousands)
Net lifetime reestimate
amount excluding interest
($ thousands)
Total disbursements to
date ($ thousands)
Agency, Bureau, Program, Risk Category and Cohort Year
Characteristics of Subsidy Reestimates
Loan Guarantees to Jordan FY 2014....................................................................................................... 8.36 8.14 -0.39 0.17 15,827 -4,734 -4,956 2,250,000 FY 2015....................................................................................................... 12.37 10.53 0.06 -1.90 -28,399 -28,399 -27,604 1,500,000 Urban and Environmental Loan Guarantees FY 1992....................................................................................................... 15.51 -6.73 -5.56 -16.68 -997 -10,620 -3,246 53,000 FY 1993....................................................................................................... 20.85 -5.16 -7.69 -18.32 -1,319 -13,636 -4,048 94,000 FY 1994....................................................................................................... 8.48 -2.83 -2.88 -8.43 -1,267 -11,787 -3,723 153,750 FY 1995....................................................................................................... 13.58 -2.66 -1.14 -15.10 572 -6,238 -3,116 138,000 FY 1996....................................................................................................... 5.04 -4.18 0.80 -10.02 -61 -6,368 -2,802 76,450 FY 1997....................................................................................................... 7.50 -7.22 ...... -14.72 -124 -5,527 -2,550 39,000 FY 1998....................................................................................................... 24.67 44.57 ...... 19.90 -113 8,847 4,212 10,000 FY 2000....................................................................................................... 6.97 -13.18 -7.88 -12.27 -86 -6,687 -2,467 21,500 Development Credit Authority—Loan Guarantees FY 1999....................................................................................................... 4.50 -1.64 -1.60 -4.54 -4 -6,286 -3,863 65,824 FY 2000....................................................................................................... 5.65 -3.91 -1.47 -8.09 -* -1,321 -949 15,503 FY 2001....................................................................................................... 2.04 -0.42 -0.42 -2.04 -60 -1,113 -737 94,834 FY 2002....................................................................................................... 3.73 2.05 -3.71 2.03 -71 -1,965 -1,779 54,372 FY 2003....................................................................................................... 3.77 0.76 ...... -3.01 -121 -2,163 -1,845 149,141 FY 2004....................................................................................................... 3.71 -0.60 ...... -4.31 -844 -8,891 -8,067 184,733 FY 2005....................................................................................................... 5.08 0.64 ...... -4.44 -1,128 -7,313 -5,904 132,594 FY 2006....................................................................................................... 3.66 1.83 ...... -1.83 -228 -459 -304 154,552 FY 2007....................................................................................................... 1.96 0.21 ...... -1.75 -543 -5,150 -2,751 141,414 FY 2008....................................................................................................... 3.79 3.09 ...... -0.70 -2,886 -630 -85 193,823 FY 2009....................................................................................................... 2.16 1.64 ...... -0.52 137 778 677 179,332 FY 2010....................................................................................................... 4.86 5.20 ...... 0.34 -1,145 10,569 11,750 371,826 FY 2011....................................................................................................... 2.16 7.62 ...... 5.46 3,485 5,471 4,524 95,729 FY 2012....................................................................................................... 7.56 2.29 ...... -5.27 -1,348 813 628 229,438 FY 2013....................................................................................................... 6.93 5.20 ...... -1.73 2,637 2,897 2,647 59,449 FY 2014....................................................................................................... 3.38 3.70 ...... 0.32 424 424 438 12,173 FY 2015....................................................................................................... 11.74 9.38 ...... -2.36 6 6 6 64
83

Table 8. LOAN GUARANTEES: SUBSIDY REESTIMATES ¹ — Continued (In percentages, unless noted otherwise)
Original Subsidy Rate
Current Reestimated
Rate
Percentage point change due to interest rates
Percentage point change due to
technical assumptions
Current reestimate amount 2
($ thousands)
Net lifetime reestimate amount 3
($ thousands)
Net lifetime reestimate
amount excluding interest
($ thousands)
Total disbursements to
date ($ thousands)
Agency, Bureau, Program, Risk Category and Cohort Year
Characteristics of Subsidy Reestimates
Overseas Private Investment Corporation: OPIC Loan Guarantees FY 1992....................................................................................................... -0.64 -9.17 -0.03 -8.50 -7 -46,826 -22,166 274,102 FY 1993....................................................................................................... 1.83 -9.94 -0.01 -11.76 -34 -85,048 -25,929 308,878 FY 1995....................................................................................................... 1.24 -2.49 0.22 -3.95 -251 -165,333 -1,142 1,011,636 FY 1996....................................................................................................... 2.06 -14.56 0.61 -17.24 -274 -187,719 -88,541 643,884 FY 1997....................................................................................................... -2.17 -8.23 0.06 -6.12 ...... -106,226 -64,921 654,387 FY 1999....................................................................................................... -7.33 -19.05 0.23 -11.95 -5,099 -143,912 -84,526 564,865 FY 2000....................................................................................................... -6.04 -14.16 -0.70 -7.42 ...... -38,303 -28,090 214,000 FY 2001....................................................................................................... -0.25 -4.09 -0.05 -3.79 -1,350 -25,317 -16,479 390,000 FY 2003....................................................................................................... -7.27 -17.16 -0.04 -9.85 1,190 -75,135 -62,049 659,441 FY 2004....................................................................................................... -5.17 -9.17 0.18 -4.18 -376 -42,864 -34,165 888,238 FY 2005....................................................................................................... 2.24 -2.00 0.03 -4.27 -2,158 -28,271 -15,198 485,586 FY 2006....................................................................................................... -2.42 -3.83 0.01 -1.42 553 -7,175 -6,643 409,992 FY 2007....................................................................................................... 0.05 2.79 -0.19 2.93 -5,226 20,253 21,512 712,977 FY 2008....................................................................................................... 0.11 -2.02 0.01 -2.13 19 -10,606 -8,608 411,005 FY 2009....................................................................................................... -6.12 -10.18 -0.57 -3.49 -23,440 -47,473 -40,055 1,139,017 FY 2010....................................................................................................... -1.25 -5.98 -0.02 -4.72 -1,071 -32,089 -29,952 655,253 FY 2011....................................................................................................... -11.20 -13.92 -1.22 -1.50 -8,799 -19,007 -18,793 723,570 FY 2012....................................................................................................... -9.99 -10.88 -0.55 -0.33 5,297 -12,260 -15,786 1,650,943 FY 2013....................................................................................................... -11.52 -15.63 -0.24 -3.87 -1,519 -56,024 -55,277 1,232,263 FY 2014....................................................................................................... -8.31 -9.70 -0.30 -1.08 -3,120 -19,236 -18,886 1,315,576 FY 2015....................................................................................................... -9.42 -8.11 -0.09 1.40 1,137 1,137 1,090 113,799 OPIC Investment Funds
FY 1996....................................................................................................... 1.50 -4.74 (6) -6.24 ...... -14,099 4,872 148,500 FY 2000....................................................................................................... 4.41 33.84 1.98 27.45 10,807 37,291 24,605 102,500 FY 2004....................................................................................................... -9.31 -8.01 0.08 1.22 -525 175 2,444 104,000 FY 2005....................................................................................................... -10.70 -10.42 0.05 0.24 860 804 3,070 358,300 FY 2006....................................................................................................... -4.70 -0.77 0.40 3.54 355 3,563 2,653 93,321 FY 2007....................................................................................................... -8.63 -10.55 0.06 -1.98 -1,150 -1,924 -3,768 134,420 FY 2008....................................................................................................... -2.98 -5.88 0.35 -3.26 -1,735 -2,033 -908 126,200 FY 2009....................................................................................................... -8.64 -7.24 -0.43 1.83 -379 959 1,624 135,200
84

Table 8. LOAN GUARANTEES: SUBSIDY REESTIMATES ¹ — Continued (In percentages, unless noted otherwise)
Original Subsidy Rate
Current Reestimated
Rate
Percentage point change due to interest rates
Percentage point change due to
technical assumptions
Current reestimate amount 2
($ thousands)
Net lifetime reestimate amount 3
($ thousands)
Net lifetime reestimate
amount excluding interest
($ thousands)
Total disbursements to
date ($ thousands)
Agency, Bureau, Program, Risk Category and Cohort Year
Characteristics of Subsidy Reestimates
FY 2010....................................................................................................... -10.99 -6.30 -0.08 4.77 -178 11,547 11,155 96,580 FY 2011....................................................................................................... -6.50 -3.72 1.32 1.46 2,439 6,893 6,442 232,500 FY 2012....................................................................................................... 1.01 -4.06 ...... -5.06 -1,232 -2,451 -2,162 36,500 FY 2014....................................................................................................... -16.30 -4.39 ...... 11.91 2,801 4,403 4,291 30,000
FY 2015....................................................................................................... -7.92 (4) ...... ...... ...... ...... ...... ...... NIS—Guaranteed Loans FY 1994....................................................................................................... 1.89 -1.53 -0.04 -3.38 ...... -43,390 -20,626 393,842 FY 1995....................................................................................................... 0.22 -5.79 -0.01 -6.00 ...... -42,351 -22,560 215,994
FY 1996....................................................................................................... 9.60 -21.99 (6) -31.59 ...... -7,600 -6,467 15,000
FY 1997....................................................................................................... 5.10 -12.96 (6) -18.06 ...... -33,322 -21,401 116,000
FY 2002....................................................................................................... 0.00 -6.17 (6) -6.17 ...... -18,845 2,604 104,150 FY 2003....................................................................................................... -5.95 -0.87 0.18 4.90 15,358 5,139 10,899 100,000 FY 2004....................................................................................................... -15.01 -9.13 -0.14 6.02 -13 -629 7,051 100,000 FY 2006....................................................................................................... 13.22 -7.50 -0.29 -20.43 -29 -4,637 -131 17,063 FY 2007....................................................................................................... -2.12 -8.75 -0.02 -6.60 29 -5,488 2,381 46,920 FY 2008....................................................................................................... 0.76 5.50 0.09 4.66 -22 1,219 882 22,340 FY 2010....................................................................................................... 7.70 -5.00 0.26 -12.95 3 -1,177 -1,132 8,775 FY 2011....................................................................................................... 5.43 -4.74 0.71 -10.88 102 -503 -533 4,875 FY 2012....................................................................................................... 7.20 -1.20 0.07 -8.46 -113 -996 -930 11,700 FY 2013....................................................................................................... 6.57 3.97 0.01 -2.61 1,141 -829 -811 27,272 Non-Honoring of Sovereign Guarantees FY 2004....................................................................................................... 0.00 -4.60 0.05 -4.65 -1,815 -16,502 -10,835 250,000 FY 2005....................................................................................................... -0.35 -5.28 0.23 -5.16 -17,155 -32,213 -28,898 532,796
Department of Transportation
Office of the Secretary: Minority Business Resource Center Loan Guarantees FY 2010....................................................................................................... 1.86 1.15 0.04 -0.75 -7 -16 -15 2,175 FY 2011....................................................................................................... 1.79 13.99 0.05 12.15 -123 456 453 3,730 FY 2012....................................................................................................... 1.81 1.54 0.04 -0.31 -40 -12 -11 3,924 FY 2013....................................................................................................... 1.73 0.46 0.03 -1.30 -32 -32 -31 2,470
85

Table 8. LOAN GUARANTEES: SUBSIDY REESTIMATES ¹ — Continued (In percentages, unless noted otherwise)
Original Subsidy Rate
Current Reestimated
Rate
Percentage point change due to interest rates
Percentage point change due to
technical assumptions
Current reestimate amount 2
($ thousands)
Net lifetime reestimate amount 3
($ thousands)
Net lifetime reestimate
amount excluding interest
($ thousands)
Total disbursements to
date ($ thousands)
Agency, Bureau, Program, Risk Category and Cohort Year
Characteristics of Subsidy Reestimates
FY 2014....................................................................................................... 1.76 0.05 -0.01 -1.70 -58 -44 -43 2,545 FY 2015....................................................................................................... 2.27 2.28 ...... 0.01 * * * 650
Maritime Administration: Federal Ship Financing Loan Guarantees FY 1993....................................................................................................... 1.69 -3.45 -0.03 -5.11 -4 -3,436 -2,046 47,394 FY 1994....................................................................................................... 9.88 -3.82 ...... -13.70 ...... -34,378 -16,615 148,643 FY 1995....................................................................................................... 9.88 9.95 ...... 0.07 ...... 36,799 6,642 312,401 FY 1996....................................................................................................... 6.76 5.37 ...... -1.39 -75 -35,844 9,380 713,592 FY 1997....................................................................................................... 8.66 22.58 0.59 13.33 -17 27,293 35,681 170,657 FY 1998....................................................................................................... 5.47 -4.05 0.17 -9.69 -11,335 -75,653 -44,177 502,434 FY 1999....................................................................................................... 4.26 14.75 0.28 10.21 -1,893 74,909 87,391 869,610 FY 2000....................................................................................................... 6.47 4.19 -1.29 -0.99 -7,044 -44,427 -17,219 797,809 FY 2001....................................................................................................... 4.60 1.86 0.65 -3.39 -1,434 -35,705 -13,152 690,771 FY 2002....................................................................................................... 5.62 7.67 0.36 1.69 -165 4,403 3,292 225,347 FY 2003....................................................................................................... 6.20 -2.58 1.20 -9.98 -695 -33,244 -25,364 305,356 FY 2004....................................................................................................... 6.06 -3.42 -0.03 -9.45 -985 -18,725 -15,355 173,654 FY 2005....................................................................................................... 26.06 67.36 10.68 30.62 ...... 65,094 51,480 139,731 FY 2009....................................................................................................... 4.83 0.33 1.72 -6.22 -4,481 -18,970 -15,815 310,029 FY 2010....................................................................................................... 6.21 0.15 ...... -6.06 -283 -1,636 -1,069 22,544 FY 2011....................................................................................................... 8.16 30.87 1.07 21.64 135,628 138,848 132,090 587,066
FY 2014....................................................................................................... 9.33 (4) ...... ...... ...... ...... ...... ......
FY 2015....................................................................................................... 6.09 (4) ...... ...... ...... ...... ...... ......
Department of the Treasury
Departmental Offices: Troubled Asset Relief Program: FHA Refi Letter of Credit FY 2011....................................................................................................... 1.26 0.37 ...... -0.89 -147 -690 -681 73,075 FY 2012....................................................................................................... 4.00 1.41 ...... -2.59 -1,434 -6,176 -6,173 233,132 FY 2013....................................................................................................... 2.48 1.32 ...... -1.16 -994 -2,164 -2,164 183,211 FY 2015....................................................................................................... 1.64 1.82 ...... 0.18 225 225 225 122,023
86

Table 8. LOAN GUARANTEES: SUBSIDY REESTIMATES ¹ — Continued (In percentages, unless noted otherwise)
Original Subsidy Rate
Current Reestimated
Rate
Percentage point change due to interest rates
Percentage point change due to
technical assumptions
Current reestimate amount 2
($ thousands)
Net lifetime reestimate amount 3
($ thousands)
Net lifetime reestimate
amount excluding interest
($ thousands)
Total disbursements to
date ($ thousands)
Agency, Bureau, Program, Risk Category and Cohort Year
Characteristics of Subsidy Reestimates
Department of Veterans Affairs
Benefits Programs: Veterans Housing Benefit Program Fund: Housing Guaranteed Loans FY 1992....................................................................................................... 2.19 1.66 0.21 -0.74 -2,847 -58,471 -91,689 26,473,457
FY 1993....................................................................................................... 2.33 0.04 (6) -2.29 -2,704 -1,172,764 -767,920 44,040,055 FY 1994....................................................................................................... 1.36 -0.30 -0.02 -1.64 -3,100 -1,120,064 -708,619 44,630,046 FY 1995....................................................................................................... 1.18 -0.51 -0.21 -1.48 -1,530 -611,927 -370,907 24,514,642 FY 1996....................................................................................................... 1.56 -0.46 0.16 -2.18 567 -884,260 -594,967 32,082,686 FY 1997....................................................................................................... 0.74 -0.87 -0.30 -1.31 -95 -661,997 -402,190 27,191,137 FY 1998....................................................................................................... 0.49 -0.40 0.01 -0.90 -6,583 -600,842 -361,477 44,709,106 FY 1999....................................................................................................... 0.45 -0.19 -0.03 -0.61 -2,441 -416,823 -281,668 47,235,321 FY 2000....................................................................................................... 0.68 -1.02 -0.05 -1.65 -3,732 -490,744 -349,841 21,799,649 FY 2001....................................................................................................... 0.29 -0.47 0.01 -0.77 76 -385,974 -245,147 34,064,438 FY 2002....................................................................................................... 0.39 -0.57 0.05 -1.01 5,438 -451,470 -358,689 38,871,184 FY 2003....................................................................................................... 0.81 0.14 0.19 -0.86 -201 -451,624 -428,648 66,656,165 FY 2004....................................................................................................... 0.50 0.40 -0.05 -0.05 21,143 -5,673 -40,163 35,693,154 FY 2005....................................................................................................... -0.32 1.40 0.03 1.69 42,308 556,534 404,339 24,135,638
FY 2006....................................................................................................... -0.32 1.73 (6) 2.05 39,669 620,897 476,303 23,922,505 FY 2007....................................................................................................... -0.36 1.90 0.03 2.23 53,724 688,726 550,962 25,109,088 FY 2008....................................................................................................... -0.37 1.35 0.08 1.64 58,156 721,600 631,564 37,568,735 FY 2009....................................................................................................... -0.66 1.07 0.11 1.62 53,904 1,265,461 1,180,894 69,821,793 FY 2010....................................................................................................... -0.17 0.39 -0.01 0.57 20,367 393,030 362,735 65,894,530 FY 2011....................................................................................................... -0.31 0.25 0.10 0.46 -37,765 413,822 406,907 75,214,249 FY 2012....................................................................................................... -0.13 0.39 0.02 0.50 -125,085 646,139 646,250 124,092,024 FY 2013....................................................................................................... -0.10 0.38 0.07 0.41 -87,674 661,784 658,689 137,607,669 FY 2014....................................................................................................... -0.02 0.22 -0.02 0.26 82,731 248,227 239,158 102,683,268 FY 2015....................................................................................................... 0.27 0.33 0.06 ...... 81,501 81,501 87,245 149,822,478 Guaranteed Loan Sale Securities—Vendee
FY 1992....................................................................................................... 0.00 1.58 (6) 1.58 -1,432 31,710 19,483 1,234,037
FY 1993....................................................................................................... 0.00 3.60 (6) 3.60 -15,080 91,512 57,131 1,591,309
87

Table 8. LOAN GUARANTEES: SUBSIDY REESTIMATES ¹ — Continued (In percentages, unless noted otherwise)
Original Subsidy Rate
Current Reestimated
Rate
Percentage point change due to interest rates
Percentage point change due to
technical assumptions
Current reestimate amount 2
($ thousands)
Net lifetime reestimate amount 3
($ thousands)
Net lifetime reestimate
amount excluding interest
($ thousands)
Total disbursements to
date ($ thousands)
Agency, Bureau, Program, Risk Category and Cohort Year
Characteristics of Subsidy Reestimates
FY 1994....................................................................................................... 0.00 5.99 (6) 5.99 -7,597 124,387 84,691 1,407,246
FY 1995....................................................................................................... 0.00 5.17 (6) 5.17 -886 106,520 69,583 1,351,043
FY 1996....................................................................................................... 0.00 5.27 (6) 5.27 -1,038 82,840 66,485 1,262,970
FY 1997....................................................................................................... 0.00 1.33 (6) 1.33 -695 12,477 12,525 979,856
FY 1998....................................................................................................... 0.00 -0.23 (6) -0.23 -782 -9,286 -2,057 1,127,250
FY 1999....................................................................................................... 5.69 2.13 (6) -3.56 320 -39,410 -32,922 967,977 FY 2000....................................................................................................... 5.45 2.25 -0.08 -3.12 706 -55,288 -45,087 1,487,972 FY 2001....................................................................................................... 5.21 0.13 0.02 -5.10 -103 -44,510 -40,050 808,091 FY 2002....................................................................................................... 5.05 0.64 0.28 -4.69 1,982 -38,996 -41,789 967,494 FY 2003....................................................................................................... 5.06 0.11 0.30 -5.25 1,156 -12,743 -13,662 282,669 FY 2004....................................................................................................... 5.65 3.13 0.11 -2.63 1,426 -4,038 -7,183 297,104 FY 2008....................................................................................................... 2.14 6.15 0.20 3.81 1,819 9,983 7,796 192,616 FY 2010....................................................................................................... 2.42 3.61 -0.02 1.21 -1,524 2,826 2,770 226,696 FY 2011....................................................................................................... 2.00 4.45 0.15 2.30 -445 4,613 4,600 185,975 FY 2012....................................................................................................... 10.75 0.89 0.23 -10.09 -1,111 -19,003 -18,514 189,735
Small Business Administration
Business Loans: 7(a) General Business Loan Guarantees FY 1992....................................................................................................... 4.85 2.38 0.53 -3.00 -100 -159,145 -127,909 5,229,734 FY 1993....................................................................................................... 5.21 1.73 0.22 -3.70 -347 -234,628 -201,658 5,928,192 FY 1994....................................................................................................... 2.15 0.52 0.04 -1.67 -45 -177,102 -114,082 7,192,207 FY 1995....................................................................................................... 2.74 2.38 0.23 -0.59 -705 -891 -9,365 7,143,848
FY 1996....................................................................................................... 1.06 1.04 (6) -0.02 -1,028 11,832 -4,030 6,611,189 FY 1997....................................................................................................... 1.93 0.66 0.30 -1.57 -2,705 -84,216 -99,698 7,888,766 FY 1998....................................................................................................... 2.14 1.02 -0.91 -0.21 -1,629 -66,514 -84,957 7,646,582 FY 1999....................................................................................................... 1.39 1.50 -0.50 0.61 -388 41,909 7,196 8,624,170 FY 2000....................................................................................................... 1.16 2.28 -0.07 1.19 -2,404 168,457 93,510 8,956,852 FY 2001....................................................................................................... 1.16 2.41 0.05 1.20 1,934 149,717 101,795 8,521,537 FY 2002....................................................................................................... 1.07 1.22 0.14 0.01 1,472 35,972 11,801 8,898,408
FY 2003....................................................................................................... 1.04 2.45 (6) 1.41 -176 136,037 110,968 8,317,046
88

Table 8. LOAN GUARANTEES: SUBSIDY REESTIMATES ¹ — Continued (In percentages, unless noted otherwise)
Original Subsidy Rate
Current Reestimated
Rate
Percentage point change due to interest rates
Percentage point change due to
technical assumptions
Current reestimate amount 2
($ thousands)
Net lifetime reestimate amount 3
($ thousands)
Net lifetime reestimate
amount excluding interest
($ thousands)
Total disbursements to
date ($ thousands)
Agency, Bureau, Program, Risk Category and Cohort Year
Characteristics of Subsidy Reestimates
FY 2004....................................................................................................... 0.78 2.84 -0.17 2.23 1,944 293,752 230,280 11,800,564 FY 2005....................................................................................................... 0.00 4.83 -0.06 4.89 11,456 776,366 618,567 13,236,196 FY 2006....................................................................................................... 0.00 8.73 -0.05 8.78 7,264 1,332,029 1,072,693 12,767,062 FY 2007....................................................................................................... 0.00 11.54 ...... 11.54 34,784 1,644,132 1,404,097 12,577,690 FY 2008....................................................................................................... 0.00 8.96 0.08 8.88 38,957 1,047,976 970,274 11,072,541 FY 2009....................................................................................................... 0.00 3.28 ...... 3.28 5,427 80,721 79,788 2,456,580 FY 2010....................................................................................................... 0.46 -0.18 0.11 -0.75 7,992 -15,425 -13,180 2,060,112 FY 2011....................................................................................................... 0.97 -1.91 0.09 -2.97 -10,523 -262,209 -245,995 8,560,717 FY 2012....................................................................................................... 1.05 -2.20 0.01 -3.26 -43,074 -444,077 -420,665 13,203,723 FY 2013....................................................................................................... 1.64 -2.09 0.01 -3.74 -61,552 -587,221 -570,838 15,424,732 FY 2014....................................................................................................... 0.01 -1.16 -0.01 -1.16 -100,787 -194,867 -193,402 16,549,742 FY 2015....................................................................................................... 0.00 -0.35 ...... -0.35 -50,499 -50,499 -49,750 14,221,813 7(a) General Business Loan Guarantees—STAR
FY 2002....................................................................................................... 1.67 1.94 (6) 0.27 -1,131 13,000 5,081 1,637,736
FY 2003....................................................................................................... 1.04 2.01 (6) 0.97 782 17,570 13,147 1,378,686 Section 504 Certified Development Companies Debentures
FY 1992....................................................................................................... 0.49 3.40 (6) 2.91 -318 9,935 15,878 562,596
FY 1993....................................................................................................... 0.54 1.67 (6) 1.13 -84 -7,577 7,640 723,343 FY 1994....................................................................................................... 0.51 6.09 1.68 3.90 -306 82,668 64,423 1,135,379 FY 1995....................................................................................................... 0.57 4.02 2.40 1.05 -770 39,324 39,038 1,314,744 FY 1996....................................................................................................... 0.00 2.19 -0.01 2.20 -2,581 29,366 40,424 2,076,040 FY 1997....................................................................................................... 0.00 -1.88 -0.07 -1.81 -938 -17,634 -22,311 1,203,911 FY 1998....................................................................................................... 0.00 -1.30 -1.35 0.05 -3,301 -14,780 -18,941 1,464,717 FY 1999....................................................................................................... 0.00 -0.06 0.30 -0.36 -4,272 7,669 -1,255 1,596,446 FY 2000....................................................................................................... 0.00 0.71 0.05 0.66 -3,532 15,485 8,560 1,492,097 FY 2001....................................................................................................... 0.00 2.03 0.06 1.97 -7,955 57,147 34,583 1,910,784 FY 2002....................................................................................................... 0.00 1.06 0.06 1.00 -9,333 34,995 18,871 2,065,244 FY 2003....................................................................................................... 0.00 1.94 0.06 1.88 -16,042 75,216 44,817 2,680,491 FY 2004....................................................................................................... 0.00 4.75 -0.01 4.76 -28,232 203,733 140,218 3,257,047 FY 2005....................................................................................................... 0.00 10.47 -0.07 10.54 -52,785 530,412 408,717 4,216,905 FY 2006....................................................................................................... 0.00 17.16 -0.04 17.20 -57,837 917,511 773,304 4,769,779
89

Table 8. LOAN GUARANTEES: SUBSIDY REESTIMATES ¹ — Continued (In percentages, unless noted otherwise)
Original Subsidy Rate
Current Reestimated
Rate
Percentage point change due to interest rates
Percentage point change due to
technical assumptions
Current reestimate amount 2
($ thousands)
Net lifetime reestimate amount 3
($ thousands)
Net lifetime reestimate
amount excluding interest
($ thousands)
Total disbursements to
date ($ thousands)
Agency, Bureau, Program, Risk Category and Cohort Year
Characteristics of Subsidy Reestimates
FY 2007....................................................................................................... 0.00 21.33 0.05 21.28 -68,296 1,170,940 1,050,378 5,216,577 FY 2008....................................................................................................... 0.00 16.79 0.06 16.73 -65,236 699,770 646,838 4,251,306 FY 2009....................................................................................................... -0.07 10.05 0.05 10.07 -8,214 82,202 80,963 886,516 FY 2010....................................................................................................... 0.00 -0.53 0.07 -0.60 -14,001 -8,136 -5,678 772,157 FY 2011....................................................................................................... 0.00 -2.73 -0.17 -2.56 -57,981 -91,971 -63,680 2,678,577 FY 2012....................................................................................................... 1.09 -3.99 -0.01 -5.07 -79,484 -197,827 -183,984 3,701,438 FY 2013....................................................................................................... 2.02 -3.72 ...... -5.74 -113,449 -241,460 -231,758 4,045,006 FY 2014....................................................................................................... 1.71 -2.91 ...... -4.62 -94,438 -121,300 -119,231 2,484,476 FY 2015....................................................................................................... 0.60 -2.51 ...... -3.11 -32,987 -32,987 -32,363 1,053,590 Section 504 Certified Development Companies Debentures—Delta
FY 1996....................................................................................................... 0.57 -1.10 (6) -1.67 -* -251 -134 8,463
FY 1997....................................................................................................... 1.01 -169.93 (6) -170.94 114 -4,771 -2,829 1,727
FY 1998....................................................................................................... 0.72 -161.75 (6) -162.47 -2 -12,434 -8,252 5,278
FY 1999....................................................................................................... 1.29 -3.06 (6) -4.35 ...... -105 -72 1,725 SBIC Debentures FY 1992....................................................................................................... 14.29 16.22 0.19 1.74 -24 -5,072 1,044 60,060 FY 1993....................................................................................................... 15.40 1.76 0.07 -13.71 ...... -18,593 -8,510 63,350 FY 1994....................................................................................................... 16.25 -3.75 -0.46 -19.54 ...... -33,324 -19,526 100,000 FY 1995....................................................................................................... 14.65 -17.88 0.41 -32.94 ...... -59,579 -32,732 104,430 FY 1996....................................................................................................... 15.46 -27.22 -0.02 -42.66 ...... -75,663 -44,351 108,570 FY 1997....................................................................................................... 3.19 -20.63 -0.01 -23.81 558 -54,221 -31,680 138,725 FY 1998....................................................................................................... 1.94 0.22 -2.89 1.17 -2,663 -21,585 -4,514 382,035 FY 1999....................................................................................................... 1.38 6.68 -2.36 7.66 1,612 21,458 14,577 292,750
FY 2000....................................................................................................... 0.00 0.44 (6) 0.44 544 5,133 1,440 296,155
FY 2001....................................................................................................... 0.00 -1.64 (6) -1.64 1,073 -5,438 -6,580 391,360
FY 2002....................................................................................................... 0.00 5.62 (6) 5.62 2,745 29,595 19,978 376,940 FY 2003....................................................................................................... 0.00 -1.13 0.03 -1.16 -15,668 -11,984 -4,153 403,750 FY 2004....................................................................................................... 0.00 -4.61 -0.06 -4.55 -5,757 -26,188 -20,299 460,780 FY 2005....................................................................................................... 0.00 -6.43 -0.20 -6.23 -3,746 -23,415 -18,229 301,420 FY 2006....................................................................................................... 0.00 -4.29 ...... -4.29 -1,010 -18,442 -16,428 419,705 FY 2007....................................................................................................... 0.00 -5.72 0.15 -5.87 -4,067 -40,868 -34,430 649,525
90

Table 8. LOAN GUARANTEES: SUBSIDY REESTIMATES ¹ — Continued (In percentages, unless noted otherwise)
Original Subsidy Rate
Current Reestimated
Rate
Percentage point change due to interest rates
Percentage point change due to
technical assumptions
Current reestimate amount 2
($ thousands)
Net lifetime reestimate amount 3
($ thousands)
Net lifetime reestimate
amount excluding interest
($ thousands)
Total disbursements to
date ($ thousands)
Agency, Bureau, Program, Risk Category and Cohort Year
Characteristics of Subsidy Reestimates
FY 2008....................................................................................................... 0.00 0.55 0.32 0.24 -20,264 4,483 5,007 971,370 FY 2009....................................................................................................... 0.00 2.63 0.11 2.52 -6,019 16,647 14,558 671,095 FY 2010....................................................................................................... 0.00 1.08 0.39 0.69 -5,143 10,951 10,982 1,067,455 FY 2011....................................................................................................... 0.00 -2.42 0.09 -2.51 -21,262 -46,717 -40,503 1,738,050 FY 2012....................................................................................................... 0.00 -3.40 -0.09 -3.31 -18,674 -62,957 -58,949 1,756,870 FY 2013....................................................................................................... 0.00 -2.72 ...... -2.72 -23,257 -52,856 -49,861 1,771,450 FY 2014....................................................................................................... 0.00 -1.07 ...... -1.07 -16,913 -18,846 -18,341 1,689,300 FY 2015....................................................................................................... 0.00 -2.58 ...... -2.58 -17,261 -17,261 -16,911 663,635 SBIC Participating Securities FY 1994....................................................................................................... 9.00 -4.77 -0.41 -13.36 ...... -24,051 -20,738 149,660 FY 1995....................................................................................................... 8.90 24.64 0.18 15.56 -1,223 73,871 32,709 219,940 FY 1996....................................................................................................... 9.00 10.87 -0.02 1.89 -1,018 17,368 3,588 231,230 FY 1997....................................................................................................... 3.29 25.97 -0.10 22.78 -7,887 64,480 51,302 232,830 FY 1998....................................................................................................... 2.20 6.30 -0.93 5.03 -7,998 10,106 29,227 677,825 FY 1999....................................................................................................... 2.19 55.80 -1.03 54.64 -10,013 603,381 480,502 930,450 FY 2000....................................................................................................... 1.80 33.83 0.26 31.77 -4,315 334,167 351,310 1,089,560 FY 2001....................................................................................................... 1.31 23.08 -0.24 22.01 -10,526 349,193 308,150 1,677,425 FY 2002....................................................................................................... 0.00 24.15 -0.22 24.37 -37,721 292,949 240,045 1,107,935 FY 2003....................................................................................................... 0.00 20.76 -0.36 21.12 15,225 210,558 205,024 1,057,225 FY 2004....................................................................................................... 0.00 26.37 -0.07 26.44 -10,912 826,803 686,455 2,910,155 SBIC New Market Venture Capital FY 2002....................................................................................................... 14.47 52.51 1.16 36.88 3,178 9,953 6,092 18,750 FY 2003....................................................................................................... 15.46 22.76 1.23 6.07 4,557 5,825 1,049 53,250 7(a) General Business—Delta
FY 1995....................................................................................................... 4.86 1.07 (6) -3.79 ...... -91 -47 1,220
FY 1996....................................................................................................... 3.15 9.50 (6) 6.35 ...... 2,415 1,283 21,115
FY 1997....................................................................................................... 3.47 0.88 (6) -2.59 -* -1,182 -685 27,309
FY 1998....................................................................................................... 3.36 5.16 (6) 1.80 4 491 477 27,296
FY 1999....................................................................................................... 2.08 9.58 (6) 7.50 -73 3,734 2,546 35,028
FY 2000....................................................................................................... 1.83 7.06 (6) 5.23 3 965 668 13,508
FY 2001....................................................................................................... 1.87 22.59 (6) 20.72 1 649 498 2,470
91

Table 8. LOAN GUARANTEES: SUBSIDY REESTIMATES ¹ — Continued (In percentages, unless noted otherwise)
Original Subsidy Rate
Current Reestimated
Rate
Percentage point change due to interest rates
Percentage point change due to
technical assumptions
Current reestimate amount 2
($ thousands)
Net lifetime reestimate amount 3
($ thousands)
Net lifetime reestimate
amount excluding interest
($ thousands)
Total disbursements to
date ($ thousands)
Agency, Bureau, Program, Risk Category and Cohort Year
Characteristics of Subsidy Reestimates
FY 2002....................................................................................................... 1.73 -3.18 (6) -4.91 * -57 -48 1,003
FY 2003....................................................................................................... 1.51 -1.48 (6) -2.99 ...... -5 -4 150 Secondary Market Guarantee
FY 2004....................................................................................................... 0.00 0.28 (6) 0.28 -16,770 67,525 104,509 38,008,032 FY 2005....................................................................................................... 0.00 0.29 ...... 0.29 -6,746 10,479 12,161 4,224,301 FY 2006....................................................................................................... 0.00 0.07 ...... 0.07 -9,229 2,148 2,305 3,633,474 FY 2007....................................................................................................... 0.00 0.06 ...... 0.06 -8,213 1,410 2,234 3,678,115 FY 2008....................................................................................................... 0.00 -0.12 ...... -0.12 -12,093 -7,845 -4,930 4,137,912 FY 2009....................................................................................................... 0.00 0.35 ...... 0.35 -6,140 9,303 8,097 2,381,185 FY 2010....................................................................................................... 0.00 1.03 0.05 0.98 7,940 39,588 34,203 3,379,396 FY 2011....................................................................................................... 0.00 0.73 0.01 0.72 11,252 34,603 30,589 4,299,164 FY 2012....................................................................................................... 0.00 0.78 -0.02 0.80 24,654 32,606 30,123 3,925,573 FY 2013....................................................................................................... 0.00 0.30 -0.02 0.32 -6,795 13,242 13,186 4,489,916 FY 2014....................................................................................................... 0.00 0.14 0.02 0.12 -12,457 7,163 7,306 5,394,207 FY 2015....................................................................................................... 0.00 0.27 -0.05 0.32 17,082 17,082 16,679 6,236,502 502 Local Development Companies
FY 1992....................................................................................................... 5.95 5.87 (6) -0.08 ...... -17 -7 28,070
FY 1993....................................................................................................... 5.58 1.06 (6) -4.52 ...... -3,339 -1,476 34,301
FY 1994....................................................................................................... 1.60 1.96 (6) 0.36 ...... 350 129 36,626
FY 1995....................................................................................................... 1.50 0.24 (6) -1.26 * -945 -443 36,985 Secondary Market 504 First Mortgage Guarantees—ARRA FY 2010....................................................................................................... 0.00 6.04 0.01 6.03 845 2,462 2,387 40,035 FY 2011....................................................................................................... 0.00 2.77 -0.07 2.84 -694 5,092 4,950 183,767 FY 2012....................................................................................................... 0.00 -1.44 -0.09 -1.35 -7,404 -10,641 -10,046 709,570 ARC Loan Guarantees—ARRA FY 2009....................................................................................................... 75.77 26.19 3.83 -53.41 -2,986 -46,278 -43,019 88,321 FY 2010....................................................................................................... 76.15 25.03 0.87 -51.99 -5,873 -94,989 -90,833 179,548 7(a) General Business Loan Guarantees—ARRA FY 2009....................................................................................................... 3.10 3.38 0.17 0.11 24,223 2,909 13,694 5,632,868 FY 2010....................................................................................................... 4.23 1.92 0.17 -2.48 9,428 -62,766 -57,457 2,521,556 Section 504 Certified Development Companies—ARRA
92

Table 8. LOAN GUARANTEES: SUBSIDY REESTIMATES ¹ — Continued (In percentages, unless noted otherwise)
Original Subsidy Rate
Current Reestimated
Rate
Percentage point change due to interest rates
Percentage point change due to
technical assumptions
Current reestimate amount 2
($ thousands)
Net lifetime reestimate amount 3
($ thousands)
Net lifetime reestimate
amount excluding interest
($ thousands)
Total disbursements to
date ($ thousands)
Agency, Bureau, Program, Risk Category and Cohort Year
Characteristics of Subsidy Reestimates
FY 2009....................................................................................................... 2.14 5.83 0.03 3.66 -37,964 52,414 67,775 2,200,292 FY 2010....................................................................................................... 2.05 2.08 0.05 -0.02 -21,620 -7,868 640 1,150,955 7(a) Dealer Floor Plan FY 2011....................................................................................................... 0.56 -3.33 0.01 -3.90 -84 -622 -544 14,575 FY 2012....................................................................................................... 0.49 -3.43 ...... -3.92 -98 -566 -515 13,600 FY 2013....................................................................................................... 0.67 -2.36 -0.01 -3.02 -56 -148 -141 4,500 7(a) Dealer Floor Plan—ARRA FY 2009....................................................................................................... 3.14 -0.98 0.19 -4.31 -3 -561 -466 12,450 FY 2010....................................................................................................... 3.29 -0.22 0.05 -3.56 -187 -2,450 -2,265 67,386 Section 504 Certified Development Companies Debentures—ARRA FY 2010....................................................................................................... 2.05 1.52 0.05 -0.58 -31,836 -19,599 -11,588 1,725,867 FY 2011....................................................................................................... 2.18 -1.26 -0.19 -3.25 -22,237 -45,897 -36,184 1,098,694 504 Commercial Real Estate (CRE) Refinance Program FY 2011....................................................................................................... 0.00 -2.72 -0.13 -2.59 -2,599 -6,774 -6,205 226,013 FY 2012....................................................................................................... 0.00 -5.82 -0.07 -5.75 -59,471 -122,012 -116,777 2,007,211 7(a) Business Loan Guarantees—ARRA FY 2010....................................................................................................... 4.23 1.40 0.17 -3.00 18,617 -163,984 -151,108 5,410,729 FY 2011....................................................................................................... 5.48 0.10 0.15 -5.53 -765 -427,100 -399,298 7,487,795
Export-Import Bank of the United States
Guarantee and Insurance Reestimates
FY 1992....................................................................................................... 5.91 -0.32 -5.91 -0.32 -3,993 (8) (8) 423,870
FY 1993....................................................................................................... 4.36 -0.93 -4.36 -0.93 -1,733 (8) (8) 1,187,974
FY 1994....................................................................................................... 5.14 -0.03 -5.14 -0.03 -105 (8) (8) 2,314,604
FY 1995....................................................................................................... 9.53 ...... -9.53 ...... -23 (8) (8) 4,339,205
FY 1996....................................................................................................... 7.17 -0.59 -7.17 -0.59 -4,148 (8) (8) 5,696,952
FY 1997....................................................................................................... 7.24 -0.16 -7.24 -0.16 -1,179 (8) (8) 7,172,588
FY 1998....................................................................................................... 8.24 -0.06 -8.24 -0.06 -560 (8) (8) 7,568,884
FY 1999....................................................................................................... 6.06 -0.01 -6.06 -0.01 -459 (8) (8) 9,688,691
FY 2000....................................................................................................... 7.56 -0.12 -7.56 -0.12 -21,456 (8) (8) 9,216,153
FY 2001....................................................................................................... 6.84 -0.07 -6.84 -0.07 -1,681 (8) (8) 7,037,916
93

Table 8. LOAN GUARANTEES: SUBSIDY REESTIMATES ¹ — Continued (In percentages, unless noted otherwise)
Original Subsidy Rate
Current Reestimated
Rate
Percentage point change due to interest rates
Percentage point change due to
technical assumptions
Current reestimate amount 2
($ thousands)
Net lifetime reestimate amount 3
($ thousands)
Net lifetime reestimate
amount excluding interest
($ thousands)
Total disbursements to
date ($ thousands)
Agency, Bureau, Program, Risk Category and Cohort Year
Characteristics of Subsidy Reestimates
FY 2002..................................................................................................... 5.09 -0.10 -5.09 -0.10 -26,288 (8) (8) 8,524,480
FY 2003..................................................................................................... 0.56 -0.13 -0.56 -0.13 -17,318 (8) (8) 9,125,069
FY 2004..................................................................................................... 1.22 -0.12 -1.22 -0.12 -8,307 (8) (8) 9,622,227
FY 2005..................................................................................................... -0.10 -0.03 0.10 -0.03 -27,942 (8) (8) 12,342,315
FY 2006..................................................................................................... 1.92 -0.31 -0.29 -1.95 -37,827 (8) (8) 10,135,424
FY 2007..................................................................................................... 1.56 -0.06 -1.24 -0.38 -71,011 (8) (8) 12,600,203
FY 2008..................................................................................................... -1.22 -0.24 -0.45 1.44 -34,801 (8) (8) 13,870,551
FY 2009..................................................................................................... -1.89 -0.04 -0.04 1.89 -32,908 (8) (8) 14,379,345
FY 2010..................................................................................................... -0.58 0.13 0.02 0.69 -58,266 (8) (8) 16,223,320
FY 2011..................................................................................................... -0.20 0.01 0.06 0.15 -31,422 (8) (8) 22,762,564 FY 2012..................................................................................................... -0.15 -1.17 0.05 -1.07 -13,646 -194,385 -180,539 22,486,323 FY 2013..................................................................................................... -1.71 -0.95 0.01 0.75 -117,295 -241,019 -230,309 18,108,197 FY 2014..................................................................................................... -2.13 -0.58 2.13 -0.58 73,291 12,587 11,720 14,621,010 FY 2015..................................................................................................... -3.46 -2.45 3.46 -2.45 130 130 348 6,035,378* $500 or less.1 Reestimates for some programs did not appear in the 2017 Budget Appendix because they were $500,000 or less.
5 Cohort is closed as of the end of 2015.
8 In FY 2012, Ex-Im Bank changed the definition of cohorts. Ex-Im Bank is unable to provide net lifetime reestimates by cohort for direct loans or loan guarantees for cohorts prior to FY 2012. The total net lifetime reestimate excluding interest for all direct loans and loan guarantees was downward $7,740 million. The total net lifetime reestimate including interest for all cohorts was downward $10,495 million.
2 Current year reestimates, including interest on reestimates.3 Total (net cumulative) reestimates, including interest on reestimates.4 Reestimate has not yet been calculated.
7 The 2015 cohort for Guarantees of Mortgage-backed Securities includes activity for fiscal years 1998 through 2015.
6 Breakout between technical and interest reestimates is not available.
94

Table 9. DIRECT LOAN PROGRAM DISBURSEMENT RATE ASSUMPTIONS UNDERLYING THE 2017 SUBSIDY ESTIMATES ¹
One Two Three Four Five Six Seven Eight Nine Ten and Later
Department of Agriculture
Farm Service Agency: Agricultural Credit Insurance Fund: Farm Ownership........................................................................ 81 16 ...... ...... ...... ...... ...... ...... ...... ...... Farm Operating......................................................................... 87 8 ...... ...... ...... ...... ...... ...... ...... ...... Emergency Disaster.................................................................. 92 6 ...... ...... ...... ...... ...... ...... ...... ...... Indian Tribe Land Acquisition.................................................... 72 26 2 ...... ...... ...... ...... ...... ...... ...... Boll Weevil Eradication.............................................................. 99 1 ...... ...... ...... ...... ...... ...... ...... ...... Indian Highly Fractionated Land................................................ 81 16 ...... ...... ...... ...... ...... ...... ...... ...... Farm Storage Facility Loans: Farm Storage Facility Loans...................................................... 29 71 ...... ...... ...... ...... ...... ...... ...... ...... Sugar Storage Facility Loans.................................................... 29 71 ...... ...... ...... ...... ...... ...... ...... ......
Rural Housing Service: Multi-Family Housing Revitalization: Multi-Family Housing Revitalization Seconds............................ 10 33 27 16 5 2 4 3 ...... ...... Multi-Family Revitalization Zero................................................ 5 40 45 9 1 ...... ...... ...... ...... ...... Rural Community Facilities: Community Facility Loans......................................................... 11 30 29 16 7 2 1 1 1 2 Rural Housing Insurance Fund: Section 502 Single-Family Housing........................................... 80 19 1 ...... ...... ...... ...... ...... ...... ...... Section 515 Multi-Family Housing............................................. 7 36 28 13 6 4 2 1 1 2 Section 504 Housing Repair...................................................... 87 12 ...... ...... ...... ...... ...... ...... ...... ...... Section 514 Farm Labor Housing.............................................. 11 18 21 20 11 10 5 3 1 ...... Section 524 Site Development.................................................. 28 26 20 17 9 ...... ...... ...... ...... ...... Section 523 Self-Help Housing.................................................. 39 56 5 ...... ...... ...... ...... ...... ...... ...... Single-Family Housing Credit Sales.......................................... 100 ...... ...... ...... ...... ...... ...... ...... ...... ......
Rural Business Cooperative Service: Rural Microenterprise Direct Loans........................................... 1 33 23 20 11 12 ...... ...... ...... ...... Intermediary Relending Program............................................... 6 32 24 15 10 6 3 2 1 1 Rural Economic Development Loans........................................ 23 60 13 1 1 1 1 ...... ...... ......
Rural Utilities Service: Rural Water and Waste Disposal Loans: Water and Waste Disposal Loans............................................. 3 20 29 21 12 7 3 2 1 2
Agency, Bureau, Program, and Risk CategoryPercentage total disbursements made in year:
95

Table 9. DIRECT LOAN PROGRAM DISBURSEMENT RATE ASSUMPTIONS UNDERLYING THE 2017 SUBSIDY ESTIMATES ¹ — Continued
One Two Three Four Five Six Seven Eight Nine Ten and LaterAgency, Bureau, Program, and Risk Category
Percentage total disbursements made in year:
Rural Electrification and Telecommunications Loans: FFB Electric Loans.................................................................... 6 25 29 19 10 7 4 ...... ...... ...... Treasury Telecommunications Loans........................................ 3 21 19 16 11 10 10 4 4 2 FFB Telecommunications Loans............................................... 6 19 14 14 13 9 9 7 3 6
Department of Commerce
National Oceanic and Atmospheric Administration: Fisheries Finance: Individual Fishing Quota Loans................................................. 20 31 4 3 1 1 ...... ...... ...... ...... Traditional Direct Loans............................................................. 17 51 13 2 2 3 ...... ...... ...... ......
Department of Education
Office of Postsecondary Education: Historically Black Colleges and Universities.............................. 100 ...... ...... ...... ...... ...... ...... ...... ...... ......
Office of Federal Student Aid: Teacher Education Assistance: TEACH Grants........................................................................... 65 28 ...... ...... ...... ...... ...... ...... ...... ...... Federal Direct Student Loan: Consolidation............................................................................. 99 ...... ...... ...... ...... ...... ...... ...... ...... ...... Consolidation (Legislative Proposal)......................................... 99 ...... ...... ...... ...... ...... ...... ...... ...... ...... PLUS.......................................................................................... 61 33 ...... ...... ...... ...... ...... ...... ...... ...... PLUS (Legislative Proposal)...................................................... 61 33 ...... ...... ...... ...... ...... ...... ...... ...... Stafford...................................................................................... 62 26 ...... ...... ...... ...... ...... ...... ...... ...... Stafford (Legislative Proposal).................................................. 62 26 ...... ...... ...... ...... ...... ...... ...... ...... Unsubsidized Stafford............................................................... 61 26 ...... ...... ...... ...... ...... ...... ...... ...... Unsubsidized Stafford (Legislative Proposal)............................ 61 26 ...... ...... ...... ...... ...... ...... ...... ...... Weighted Average of Total Obligations..................................... 73 19 ...... ...... ...... ...... ...... ...... ...... ...... Weighted Average of Total Obligations (Legislative Proposal). 73 19 ...... ...... ...... ...... ...... ...... ...... ...... Federal Perkins Loan: Federal Perkins Loans (Legislative Proposal)........................... 48 40 ...... ...... ...... ...... ...... ...... ...... ......
Department of Energy
Advanced Technology Vehicles Manufacturing Loans: Direct Auto Loans...................................................................... 14 24 35 27 ...... ...... ...... ...... ...... ...... Title 17 Innovative Technology Loan Guarantee Program: Section 1703 FFB Loans (Self Pay).......................................... 15 51 28 6 ...... ...... ...... ...... ...... ...... Section 1703 FFB Loans (EERE).............................................. 15 85 ...... ...... ...... ...... ...... ...... ...... ......
96

Table 9. DIRECT LOAN PROGRAM DISBURSEMENT RATE ASSUMPTIONS UNDERLYING THE 2017 SUBSIDY ESTIMATES ¹ — Continued
One Two Three Four Five Six Seven Eight Nine Ten and LaterAgency, Bureau, Program, and Risk Category
Percentage total disbursements made in year:
Department of Homeland Security
Federal Emergency Management Agency: Community Disaster Loan Program.......................................... 42 24 7 12 12 1 ...... ...... ...... ......
Department of Housing and Urban Development
Housing Programs: FFB Risk Sharing...................................................................... 70 30 ...... ...... ...... ...... ...... ...... ...... ......
Department of State
Administration of Foreign Affairs: Repatriation Loans.................................................................... 100 ...... ...... ...... ...... ...... ...... ...... ...... ......
International Assistance Programs
Overseas Private Investment Corporation: OPIC Direct Loans..................................................................... 17 67 17 ...... ...... ...... ...... ...... ...... ......
Department of Transportation
Federal Highway Administration: Transportation, Infrastructure, Finance & Innovation (TIFIA) Direct Loans............................................................................ 5 10 10 10 35 30 ...... ...... ...... ......
Federal Railroad Administration:
Railroad Rehabilitation and Improvement Financing Direct Loans........................................................................... 58 20 11 3 3 1 ...... 4 ...... ......
Department of the Treasury
Departmental Offices: Community Development Financial Institutions Fund............... ...... 100 ...... ...... ...... ...... ...... ...... ...... ...... Bond Guarantee Program......................................................... 23 25 25 20 7 ...... ...... ...... ...... ......
Department of Veterans Affairs
Benefits Programs: Veterans Housing Benefit Program Fund: Acquired Direct Loans............................................................... 100 ...... ...... ...... ...... ...... ...... ...... ...... ...... Vendee Direct Loans................................................................. 100 ...... ...... ...... ...... ...... ...... ...... ...... ...... Native American Veteran Housing Loan: Native American Direct Loans................................................... 86 11 2 ...... ...... ...... ...... ...... ...... ...... Vocational Rehabilitation........................................................... 100 ...... ...... ...... ...... ...... ...... ...... ...... ......
97

Table 9. DIRECT LOAN PROGRAM DISBURSEMENT RATE ASSUMPTIONS UNDERLYING THE 2017 SUBSIDY ESTIMATES ¹ — Continued
One Two Three Four Five Six Seven Eight Nine Ten and LaterAgency, Bureau, Program, and Risk Category
Percentage total disbursements made in year:
Environmental Protection Agency
Water Infrastructure Direct Loans.............................................. 14 11 73 2 ...... ...... ...... ...... ...... ......
Small Business Administration
Business Loans: 7(m) Direct Microloans.............................................................. 26 49 19 5 1 ...... ...... ...... ...... ...... Disaster Loans: Disaster Assistance Loans........................................................ 65 30 6 ...... ...... ...... ...... ...... ...... ......
National Infrastructure Bank
Infrastructure Direct Loans (Legislative Proposal)..................... 11 22 22 22 22 ...... ...... ...... ...... ......1 In some cases, disbursement rates may not add to 100 percent due to cancellations between the time of obligation and disbursement.
98

Table 10. LOAN GUARANTEE PROGRAM DISBURSEMENT RATE ASSUMPTIONS UNDERLYING THE 2017 SUBSIDY ESTIMATES ¹
One Two Three Four Five Six Seven Eight Nine Ten and Later
Department of Agriculture
Farm Service Agency: Agricultural Credit Insurance Fund: Farm Ownership—Unsubsidized............................................... 78 18 1 ...... ...... ...... ...... ...... ...... ...... Farm Operating—Unsubsidized................................................ 90 8 1 ...... ...... ...... ...... ...... ...... ...... Conservation—Guaranteed....................................................... 78 18 1 ...... ...... ...... ...... ...... ...... ...... Commodity Credit Corporation Export Loans: GSM 102................................................................................... 85 15 ...... ...... ...... ...... ...... ...... ...... ...... Export Guarantee Program—Facilities...................................... 85 15 ...... ...... ...... ...... ...... ...... ...... ......
Rural Housing Service: Rural Community Facilities: Community Facility Loan Guarantees....................................... 10 31 32 18 8 1 ...... ...... ...... ...... Rural Housing Insurance Fund: Guaranteed 538 Multi-Family Housing...................................... 10 33 30 19 5 3 ...... ...... ...... ...... Guaranteed 502 Single-Family Housing.................................... 97 3 ...... ...... ...... ...... ...... ...... ...... ......
Rural Business Cooperative Service: Business and Industry Loan Guarantees.................................. 43 40 12 4 1 ...... ...... ...... ...... ...... Rural Business Investment Program......................................... 14 26 18 13 12 ...... ...... ...... ...... ...... Renewable Energy Loan Guarantees....................................... 3 44 34 12 6 1 ...... ...... ...... ...... Section 9003 Loan Guarantees................................................. 18 44 27 11 ...... ...... ...... ...... ...... ......
Rural Utilities Service: Water and Waste Disposal Loan Guarantees........................... 5 30 32 20 13 ...... ...... ...... ...... ......
Department of Commerce
Economic Development Administration: Innovative Manufacturing Loan Guarantees.............................. 69 29 2 ...... ...... ...... ...... ...... ...... ......
Department of Health and Human Services
Facilities Renovation Loans....................................................... 100 ...... ...... ...... ...... ...... ...... ...... ...... ...... Managed Care Network Development Loans............................ 100 ...... ...... ...... ...... ...... ...... ...... ...... ...... Managed Care Plan Loans........................................................ 100 ...... ...... ...... ...... ...... ...... ...... ...... ......
Department of Housing and Urban Development
Public and Indian Housing Programs: Title VI Indian Federal Guarantees Program............................. 83 16 ...... 1 ...... ...... ...... ...... ...... ...... Indian Housing Loan Guarantee................................................ 63 28 3 1 5 ...... ...... ...... ...... ......
Agency, Bureau, Program, and Risk CategoryPercentage total disbursements made in year:
99

Table 10. LOAN GUARANTEE PROGRAM DISBURSEMENT RATE ASSUMPTIONS UNDERLYING THE 2017 SUBSIDY ESTIMATES ¹ — Continued
One Two Three Four Five Six Seven Eight Nine Ten and LaterAgency, Bureau, Program, and Risk Category
Percentage total disbursements made in year:
Native Hawaiian Housing Loan Guarantees.............................. 84 14 1 1 ...... ...... ...... ...... ...... ......
Community Planning and Development: Section 108 Community Development Loan Guarantee (Fee)..................................................................... 10 35 20 15 10 8 2 ...... ...... ......
Housing Programs: FHA-Mutual Mortgage Insurance (MMI) Fund: Mutual Mortgage Insurance Fund.............................................. 100 ...... ...... ...... ...... ...... ...... ...... ...... ...... MMI HECM................................................................................ 100 ...... ...... ...... ...... ...... ...... ...... ...... ...... MMI Refi.................................................................................... 100 ...... ...... ...... ...... ...... ...... ...... ...... ...... FHA-General and Special Risk Insurance Fund: Apartment New Construction / Substantial Rehab.................... 100 ...... ...... ...... ...... ...... ...... ...... ...... ...... Tax Credits................................................................................ 100 ...... ...... ...... ...... ...... ...... ...... ...... ...... Apartment Refinances............................................................... 100 ...... ...... ...... ...... ...... ...... ...... ...... ...... Housing Finance Agency Risk Sharing..................................... 100 ...... ...... ...... ...... ...... ...... ...... ...... ...... Qualified Participating Entity Risk Sharing................................ 100 ...... ...... ...... ...... ...... ...... ...... ...... ...... Residential Care Facilities......................................................... 100 ...... ...... ...... ...... ...... ...... ...... ...... ...... Residential Care Facility Refinances......................................... 100 ...... ...... ...... ...... ...... ...... ...... ...... ...... Hospitals..................................................................................... 100 ...... ...... ...... ...... ...... ...... ...... ...... ...... Other Rental.............................................................................. 100 ...... ...... ...... ...... ...... ...... ...... ...... ...... Title 1 Property Improvement.................................................... 100 ...... ...... ...... ...... ...... ...... ...... ...... ...... Title 1 Manufactured Housing.................................................... 100 ...... ...... ...... ...... ...... ...... ...... ...... ......
Government National Mortgage Association: Guarantees of Mortgage-backed Securities.............................. 100 ...... ...... ...... ...... ...... ...... ...... ...... ......
Department of the Interior
Bureau of Indian Affairs: Indian Guaranteed Loans.......................................................... 51 49 ...... ...... ...... ...... ...... ...... ...... ...... Indian Insured Loans................................................................. 100 ...... ...... ...... ...... ...... ...... ...... ...... ......
International Assistance Programs
Agency for International Development: Development Credit Authority—Loan Guarantees.................... 16 26 26 32 ...... ...... ...... ...... ...... ......
Overseas Private Investment Corporation: OPIC Loan Guarantees............................................................. 100 ...... ...... ...... ...... ...... ...... ...... ...... ...... OPIC Investment Funds............................................................ 23 24 19 14 7 7 7 ...... ...... ...... Limited Arbitral Award Coverage............................................... 100 ...... ...... ...... ...... ...... ...... ...... ...... ......
100

Table 10. LOAN GUARANTEE PROGRAM DISBURSEMENT RATE ASSUMPTIONS UNDERLYING THE 2017 SUBSIDY ESTIMATES ¹ — Continued
One Two Three Four Five Six Seven Eight Nine Ten and LaterAgency, Bureau, Program, and Risk Category
Percentage total disbursements made in year:
Non-Honoring of Sovereign Guarantees................................... 23 31 31 15 ...... ...... ...... ...... ...... ......
Department of Transportation
Office of the Secretary: Minority Business Resource Center Loan Guarantees............. 100 ...... ...... ...... ...... ...... ...... ...... ...... ......
Department of Veterans Affairs
Benefits Programs: Housing Guaranteed Loans....................................................... 100 ...... ...... ...... ...... ...... ...... ...... ...... ......
Small Business Administration
Business Loans: 7(a) General Business Loan Guarantees.................................. 60 24 1 ...... ...... ...... ...... ...... ...... ...... Section 504 Certified Development Companies Debentures............................................................................. 30 49 16 4 1 ...... ...... ...... ...... ...... SBIC Debentures....................................................................... 22 39 18 7 5 ...... ...... ...... ...... ...... Secondary Market Guarantee................................................... 100 ...... ...... ...... ...... ...... ...... ...... ...... ...... 504 Commercial Real Estate (CRE) Refinance Program.......... 43 56 1 ...... ...... ...... ...... ...... ...... ...... Scale-Up Manufacturing Investment Company (Legislative Proposal)............................................................. 13 29 29 29 ...... ...... ...... ...... ...... ...... Disaster Loans: Immediate Disaster Assistance................................................. 50 50 ...... ...... ...... ...... ...... ...... ...... ...... Expedited Disaster Assistance.................................................. 100 ...... ...... ...... ...... ...... ...... ...... ...... ......
Export-Import Bank of the United States
Long Term Guarantees............................................................. 90 10 ...... ...... ...... ...... ...... ...... ...... ...... Medium Term Guarantees......................................................... 95 5 ...... ...... ...... ...... ...... ...... ...... ...... Short Term Insurance................................................................ 95 5 ...... ...... ...... ...... ...... ...... ...... ...... Medium Term Insurance............................................................ 100 ...... ...... ...... ...... ...... ...... ...... ...... ...... Working Capital Fund................................................................ 100 ...... ...... ...... ...... ...... ...... ...... ...... ......
National Infrastructure Bank
Infrastructure Loan Guarantees (Legislative Proposal)............. 11 22 22 22 22 ...... ...... ...... ...... ......1 In some cases, disbursement rates may not add to 100 percent due to cancellations between the time of obligation and disbursement.
101


EXECUTIVE OFFICE OF THE PRESIDENT BUDGET.GOV