features of successful inclining block water conservation rate structures
TRANSCRIPT

Features of Successful Inclining
Block Water Conservation Rate
Structures
Presented by:
Andrew Burnham, Senior Vice President
March 6, 2015 @ 9:00 – 9:30AM
TEXAS WATER CONSERVATION ASSOCIATION
71ST ANNUAL CONVENTION
SHERATON AUSTIN HOTEL @ THE CAPITOL (AUSTIN, TEXAS)
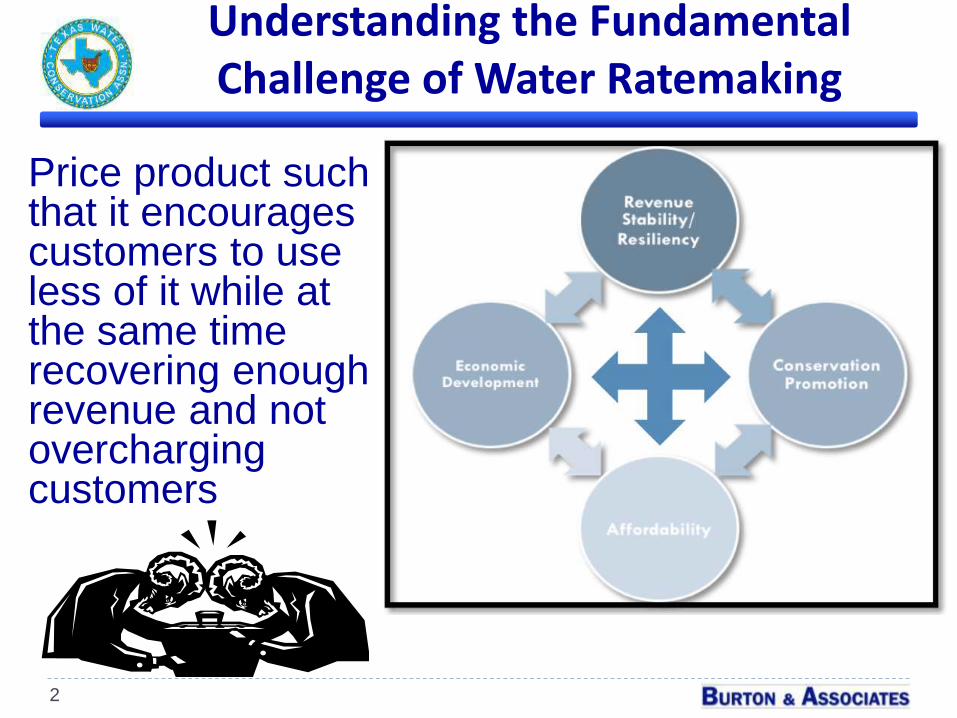
Understanding the Fundamental Challenge of Water Ratemaking
Price product such that it encourages customers to use less of it while at the same time recovering enough revenue and not overcharging customers
2
3
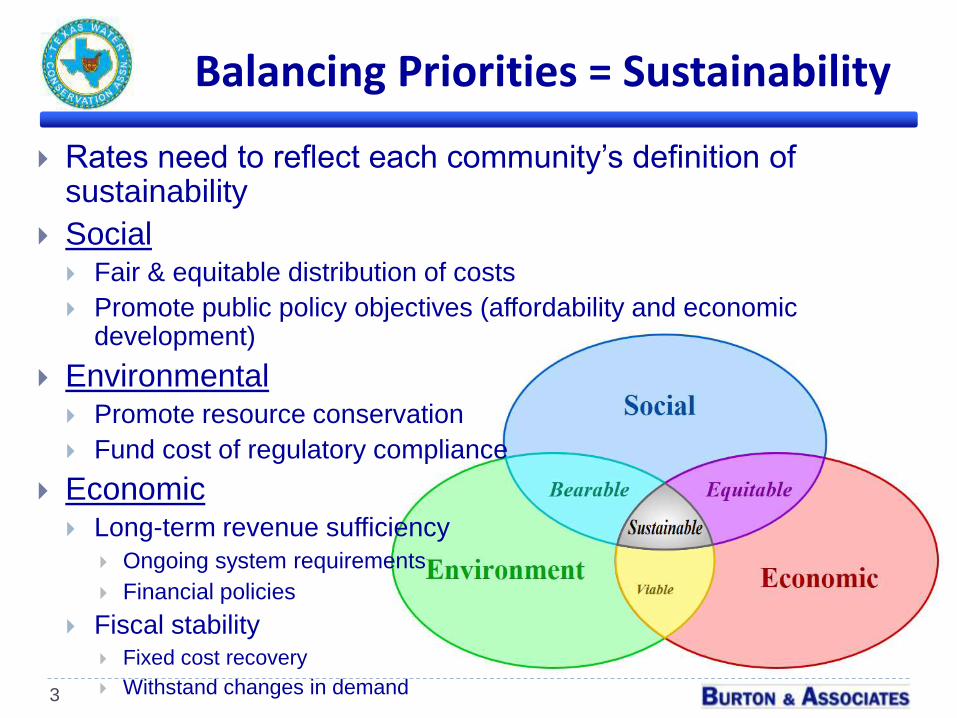
Balancing Priorities = Sustainability
Rates need to reflect each community’s definition of sustainability
Social Fair & equitable distribution of costs
Promote public policy objectives (affordability and economic development)
Environmental Promote resource conservation
Fund cost of regulatory compliance
Economic Long-term revenue sufficiency
Ongoing system requirements
Financial policies
Fiscal stability Fixed cost recovery
Withstand changes in demand
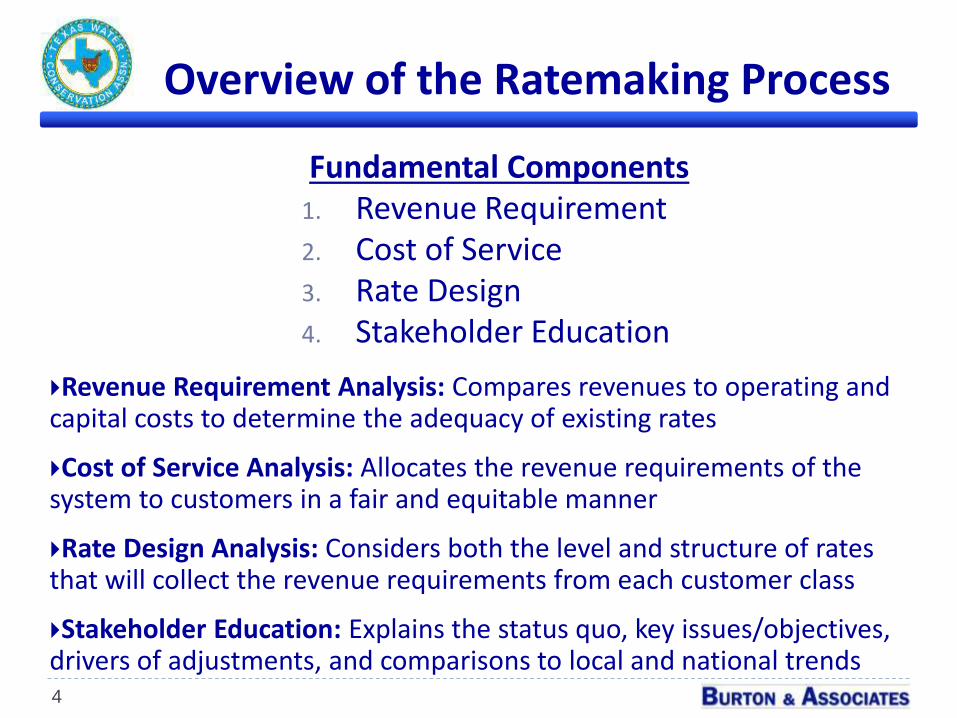
Overview of the Ratemaking Process
Fundamental Components1. Revenue Requirement2. Cost of Service3. Rate Design4. Stakeholder Education
4
Revenue Requirement Analysis: Compares revenues to operating and capital costs to determine the adequacy of existing rates
Cost of Service Analysis: Allocates the revenue requirements of the system to customers in a fair and equitable manner
Rate Design Analysis: Considers both the level and structure of rates that will collect the revenue requirements from each customer class
Stakeholder Education: Explains the status quo, key issues/objectives, drivers of adjustments, and comparisons to local and national trends

Before Developing Conservation Rates, Understand the Cost of Service
5
Distribute costs using methods best suited for data, circumstances & goals Allocate costs to functions Review/define customer classes
Identifies allocations of various costs (max day, peak hour, etc.) to different users based upon their characteristics
Water Cost of Service Wastewater Cost of Service
→ Source of Supply → Treatment & Disposal
→ Treatment → Collection
→ Transmission → Reclaimed Water
→ Distribution → Chemical Oxygen Demand
→ Meters & Services → Suspended Solids
→ Billing & Collection → Phosphorus
→ Residential → Ammonia
→ General Service → Residential
→ Residential Irrigation → General Service
→ General Irrigation → Reclaimed Water
→ Wholesale → High-Strength/Industrial
→ Wholesale
Co
st F
un
ctio
ns
Co
st F
un
ctio
ns
Cu
sto
me
r C
lass
es
Cu
sto
me
r C
lass
es

Cost of Service Analysis Establishes Guideposts for Developing Rates
Compare cost allocation to revenue generation under various scenarios
Identify what types of costs are recovered in fixed vs. variable charges
6
Single-Family Multi-Family Commercial Res. Irrigation Com. Irrigation Totals
Rev (000's) Rev (000's) Rev (000's) Rev (000's) Rev (000's) Rev (000's)
Water 5,057$ 4,059$ 7,573$ 283$ 1,761$ 18,734$
Sewer 10,135$ 8,977$ 9,744$ N/A N/A 28,856$
Total 15,192$ 13,036$ 17,317$ 283$ 1,761$ 47,590$
Single-Family Multi-Family Commercial Res. Irrigation Com. Irrigation Totals
Rev (000's) Rev (000's) Rev (000's) Rev (000's) Rev (000's) Rev (000's)
Water 5,336$ 5,097$ 6,829$ 216$ 1,252$ 18,730$
Sewer 9,869$ 8,518$ 10,473$ N/A N/A 28,860$
Total 15,205$ 13,615$ 17,302$ 216$ 1,252$ 47,590$
$ Variance (13)$ (579)$ 15$ 67$ 510$ (0)$
% Variance -0.1% -4.3% 0.1% 31.1% 40.7% 0.0%
REVENUE REQUIREMENT ALLOCATION PER COST OF SERVICE ANALYSIS
REVENUE GENERATION PER CURRENT RATE STRUCTURE

Approach to Rate Structure Analysis
7
Incorporate the data/allocations per cost of service analysis
Review/evaluate existing fee structure and identify alternatives
Goal is to ensure appropriate and sustainable rate structures for each class of customer that:
Reflect a fair and equitable distribution of the cost of service
Conform to industry practice and legal precedent
Are technically sound and easy to administer
Are consistent with objectives (affordability, conservation, etc.)
To succeed, you need to communicate clearly with stakeholders
The advantages and disadvantages of each option, and
The full range of customer impacts of any potential changes
Integrate critical financial considerations
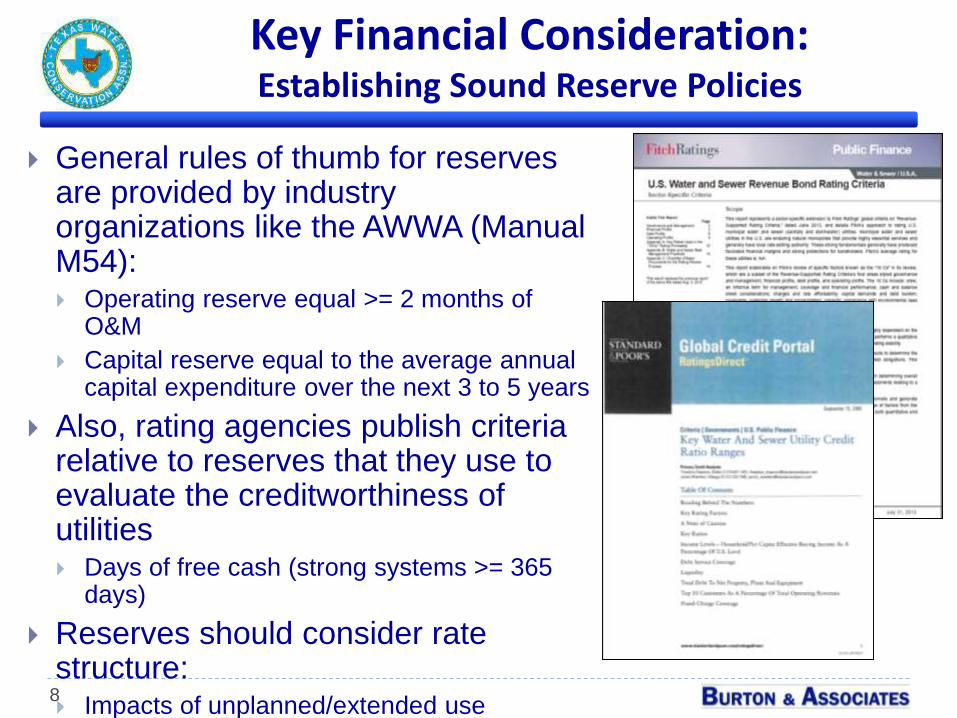
Key Financial Consideration: Establishing Sound Reserve Policies
8
General rules of thumb for reserves are provided by industry organizations like the AWWA (Manual M54): Operating reserve equal >= 2 months of
O&M
Capital reserve equal to the average annual capital expenditure over the next 3 to 5 years
Also, rating agencies publish criteria relative to reserves that they use to evaluate the creditworthiness of utilities Days of free cash (strong systems >= 365
days)
Reserves should consider rate structure: Impacts of unplanned/extended use
reductions

Key Financial Consideration:Defining Level of Fixed Cost Recovery
9
Higher fixed charges provide stability in environments of unstable/declining demands…. However, reduces cost allocation and level of conservation
rates to high volume users
Critical to understand and evaluate: Fixed versus variable cost distribution Current recovery of fixed costs via existing rates Practices of other local/comparable systems
Rating agencies starting to publish criteria about level of revenue generation desired in fixed charges Due to industry wide declines in demand and increasing
fixed cost awareness Fitch Ratings – strong system will recover >=30% of
revenue in fixed charges

10
Example Cost Recovery Analysis
Components of FY 2015 Utility Costs Amount % of Total Amount % of Total
Personnel Services $995,072 10.7% $694,494 9.4%
Variable Operating Costs $1,260,136 13.5% $380,458 5.2%
Fixed Operating Costs $868,506 9.3% $1,005,760 13.7%
Capital Outlay $165,000 1.8% $134,000 1.8%
Transfer Out $1,583,055 17.0% $1,351,196 18.4%
O & M ALLOCATION $2,797,327 30.0% $3,793,458 51.5%
Debt Service $1,645,931 17.7% $0 0.0%
Total Annual Costs $9,315,027 100.0% $7,359,366 100.0%
Fixed $8,054,891 86.5% 0.0% $6,978,908 94.8% 0.0%
Variable $1,260,136 13.5% 100.0% $380,458 5.2% 100.0%
$9,315,027 100.0% 100.0% $7,359,366 100.0% 100.0%
W ater System Fixed Variable
Expenses 86% 14%
Revenue 0% 100%
Avg. Fixed/Usage Fee Split of JCSA Rate Survey
Entities (based on 5,000 gal/month residential bill)30% 70%
Sewer System Fixed Variable
Expenses 95% 5%
Revenue 0% 100%
Avg. Fixed/Usage Fee Split of JCSA Rate Survey
Entities (based on 5,000 gal/month residential bill)21% 79%
Variable Operating Costs generally
increase or decrease as system
demand increases/decreases, and
include utilities, operating supplies/
materials and chemicals. All other
costs are generally fixed and
independent of system demand.
Water Cost Water
Rev
Sewer Cost Sewer
Rev
0.0%
25.0%
50.0%
75.0%
100.0%
Water Cost Water Rev Sewer Cost Sewer Rev
Allocation of Annual Utility Costs And Revenues
Fixed Variable

INCLINING BLOCK SIZING AND PRICING EXAMPLES
11

Examples of Sizing of Inclining BlocksTier 1 - Typical Indoor Usage Amount Tier Range
People per Household 2.57
Typical Indoor Use (Gallons per Capital per Day) 70
Typical Essential Domestic Use (Tgal/month) 5,472
First Tier Usage Amount (Total) 5,000 Up to 5,000 gal.
Tier 2 - Larger Family Indoor Usage Amount Tier Range
Large Family - People per Household 5.00
Typical Essential Domestic Use (Tgal/month) 10,646
Second Tier Usage Amount (Total) 10,000 5,001 - 10,000 gal.
Tier 3 - Irrigation for Typical Property Amount Tier Range
Square inches of area in 1/4 acre 1,568,160
% of area that is irrigable 33%
Number of inches per watering 0.50
Gallons per cubic inch 0.0043290
Number of gallons per watering 1,131
Number of waterings per week 2.0
Gallons of irrigation per month 9,802
Third Tier Usage Amount 10,000 10,001 - 20,000 gal.
Fourth Tier Usage Amount All Add. Use > 20,000 gal.
12
Use available data/resources US Census EPA (indoor
use) Local Property
Data/GIS TWDB, TCEG,
Save Water, etc.
Review all customer usage profiles and property types
Consider local ordinances
Evaluate options w/understanding of impacts

Pricing Metrics of Inclining Block Rates
Evaluate upon setting level of revenue recovered in usage rates & size/number of tiers
Example: 4 Block System Rate for 1st Block
Affordability Rate: % of 2nd
Block Local policy/objective
Rate for 2nd Block Uniform Cost / TGAL
Rate for 3rd Block Between 2nd and 4th Block
rates (equidistant or other)
Rate for 4th Block Equal to full cost of new water
supply, plus transmission
Review w/understanding of customer impacts13
Table 2-3 – Top Block Water Cost Details
Cost Component
Unit Cost
(per 1,000 gal)
CAP Water $0.45
Water Purchase Rights $0.61
Plant Expansion $0.75
Debt Service Coverage $1.66
Credit for SDF Paid -$1.05
Total Marginal Unit Cost of Water $2.71
Unit Cost of Water Transmission $0.56
Total Top Block Rate $3.27
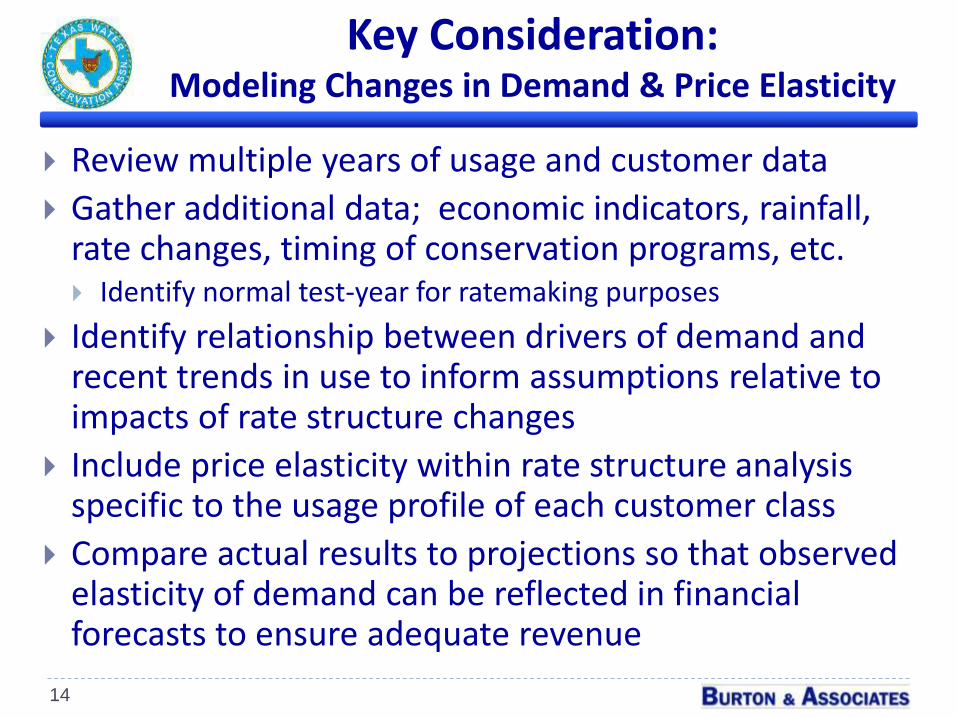
Key Consideration: Modeling Changes in Demand & Price Elasticity
14
Review multiple years of usage and customer data
Gather additional data; economic indicators, rainfall, rate changes, timing of conservation programs, etc. Identify normal test-year for ratemaking purposes
Identify relationship between drivers of demand and recent trends in use to inform assumptions relative to impacts of rate structure changes
Include price elasticity within rate structure analysis specific to the usage profile of each customer class
Compare actual results to projections so that observed elasticity of demand can be reflected in financial forecasts to ensure adequate revenue

Additional Conservation Rate-Related Considerations:
15
Consider carefully crafted temporary adjustments Drought/water use restriction surcharges to ensure adequate rev.
Model alternative levels of demand reductions and revenue impacts
Consider designating “highest tier” revenues for incremental spending only once realized Don’t plan on revenue for any current year required costs
Consider using a meaningful rate stabilization fund Can offset unforeseen and/or extended demand reductions
Use conservative budgeting as a hedge Particularly in regards to revenue (i.e. @ 95% of forecast)
Include allowances for contingencies on expense side that could be used to offset revenue shortfalls

STAKEHOLDER
COMMUNICATION STRATEGIES
16
17
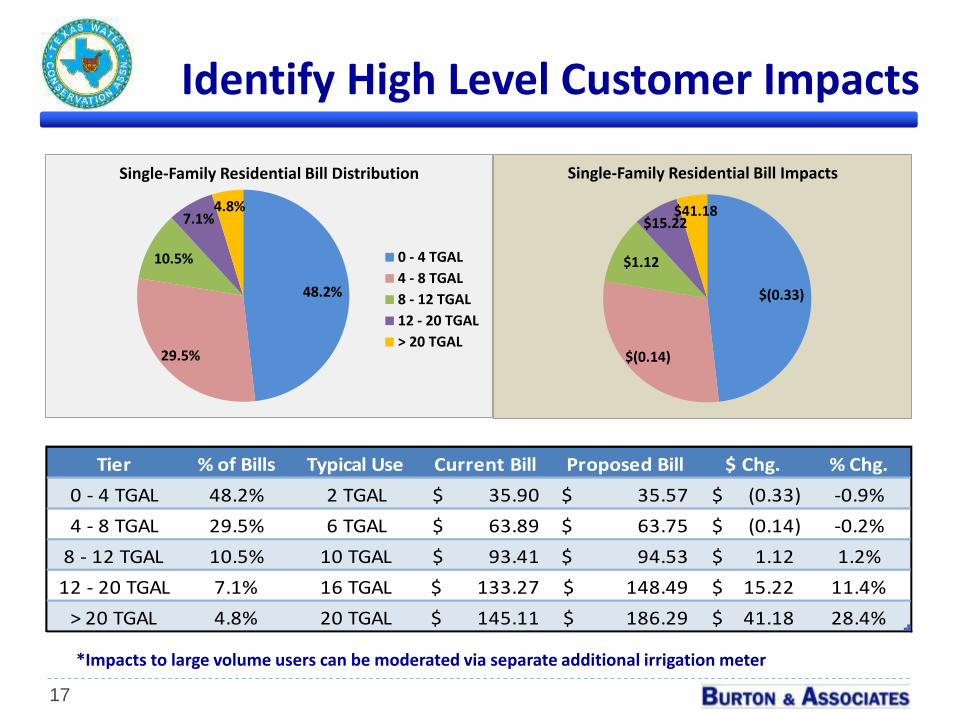
Tier % of Bills Typical Use Current Bill Proposed Bill $ Chg. % Chg.
0 - 4 TGAL 48.2% 2 TGAL 35.90$ 35.57$ (0.33)$ -0.9%
4 - 8 TGAL 29.5% 6 TGAL 63.89$ 63.75$ (0.14)$ -0.2%
8 - 12 TGAL 10.5% 10 TGAL 93.41$ 94.53$ 1.12$ 1.2%
12 - 20 TGAL 7.1% 16 TGAL 133.27$ 148.49$ 15.22$ 11.4%
> 20 TGAL 4.8% 20 TGAL 145.11$ 186.29$ 41.18$ 28.4%
*Impacts to large volume users can be moderated via separate additional irrigation meter
48.2%
29.5%
10.5%
7.1%4.8%
Single-Family Residential Bill Distribution
0 - 4 TGAL
4 - 8 TGAL
8 - 12 TGAL
12 - 20 TGAL
> 20 TGAL
$(0.33)
$(0.14)
$1.12
$15.22 $41.18
Single-Family Residential Bill Impacts
Identify High Level Customer Impacts

Monthly
Use (Gal) % of Bills Agg. % Current (FY 13) Proposed (FY 14) $ Chg % Chg
- 9.7% 9.7% 22.16$ 22.01$ (0.15)$ -0.7%
1,000 5.7% 15.4% 29.03$ 28.79$ (0.24)$ -0.8%
2,000 9.4% 24.7% 35.90$ 35.57$ (0.33)$ -0.9%
3,000 11.6% 36.3% 42.77$ 42.35$ (0.42)$ -1.0%
4,000 11.9% 48.2% 49.64$ 49.13$ (0.51)$ -1.0%
5,000 10.3% 58.5% 56.51$ 56.44$ (0.07)$ -0.1%
6,000 8.2% 66.7% 63.89$ 63.75$ (0.14)$ -0.2%
7,000 6.2% 72.9% 71.27$ 71.06$ (0.21)$ -0.3%
8,000 4.8% 77.7% 78.65$ 78.37$ (0.28)$ -0.4%
9,000 3.6% 81.3% 86.03$ 86.45$ 0.42$ 0.5%
10,000 2.7% 84.0% 93.41$ 94.53$ 1.12$ 1.2%
11,000 2.3% 86.3% 100.79$ 102.61$ 1.82$ 1.8%
12,000 1.8% 88.2% 108.17$ 110.69$ 2.52$ 2.3%
13,000 1.4% 89.6% 115.55$ 120.14$ 4.59$ 4.0%
14,000 1.2% 90.8% 122.93$ 129.59$ 6.66$ 5.4%
15,000 1.1% 91.9% 130.31$ 139.04$ 8.73$ 6.7%
16,000 0.9% 92.8% 133.27$ 148.49$ 15.22$ 11.4%
17,000 0.8% 93.5% 136.23$ 157.94$ 21.71$ 15.9%
18,000 0.6% 94.2% 139.19$ 167.39$ 28.20$ 20.3%
19,000 0.6% 94.8% 142.15$ 176.84$ 34.69$ 24.4%
20,000 0.5% 95.2% 145.11$ 186.29$ 41.18$ 28.4%
Inside City Single Family 3/4" Meter Monthly Water & Sewer Bill Calculations
Have Detailed Customer Impacts Ready
18
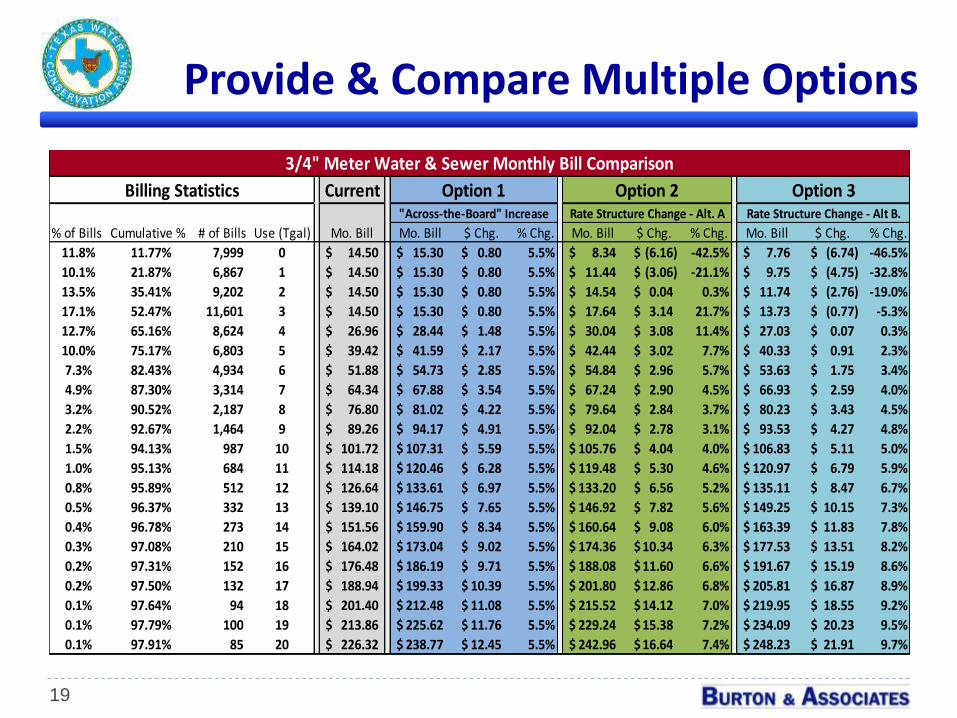
Provide & Compare Multiple Options
19
Current
% of Bills Cumulative % # of Bills Use (Tgal) Mo. Bill Mo. Bill $ Chg. % Chg. Mo. Bill $ Chg. % Chg. Mo. Bill $ Chg. % Chg.
11.8% 11.77% 7,999 0 14.50$ 15.30$ 0.80$ 5.5% 8.34$ (6.16)$ -42.5% 7.76$ (6.74)$ -46.5%
10.1% 21.87% 6,867 1 14.50$ 15.30$ 0.80$ 5.5% 11.44$ (3.06)$ -21.1% 9.75$ (4.75)$ -32.8%
13.5% 35.41% 9,202 2 14.50$ 15.30$ 0.80$ 5.5% 14.54$ 0.04$ 0.3% 11.74$ (2.76)$ -19.0%
17.1% 52.47% 11,601 3 14.50$ 15.30$ 0.80$ 5.5% 17.64$ 3.14$ 21.7% 13.73$ (0.77)$ -5.3%
12.7% 65.16% 8,624 4 26.96$ 28.44$ 1.48$ 5.5% 30.04$ 3.08$ 11.4% 27.03$ 0.07$ 0.3%
10.0% 75.17% 6,803 5 39.42$ 41.59$ 2.17$ 5.5% 42.44$ 3.02$ 7.7% 40.33$ 0.91$ 2.3%
7.3% 82.43% 4,934 6 51.88$ 54.73$ 2.85$ 5.5% 54.84$ 2.96$ 5.7% 53.63$ 1.75$ 3.4%
4.9% 87.30% 3,314 7 64.34$ 67.88$ 3.54$ 5.5% 67.24$ 2.90$ 4.5% 66.93$ 2.59$ 4.0%
3.2% 90.52% 2,187 8 76.80$ 81.02$ 4.22$ 5.5% 79.64$ 2.84$ 3.7% 80.23$ 3.43$ 4.5%
2.2% 92.67% 1,464 9 89.26$ 94.17$ 4.91$ 5.5% 92.04$ 2.78$ 3.1% 93.53$ 4.27$ 4.8%
1.5% 94.13% 987 10 101.72$ 107.31$ 5.59$ 5.5% 105.76$ 4.04$ 4.0% 106.83$ 5.11$ 5.0%
1.0% 95.13% 684 11 114.18$ 120.46$ 6.28$ 5.5% 119.48$ 5.30$ 4.6% 120.97$ 6.79$ 5.9%
0.8% 95.89% 512 12 126.64$ 133.61$ 6.97$ 5.5% 133.20$ 6.56$ 5.2% 135.11$ 8.47$ 6.7%
0.5% 96.37% 332 13 139.10$ 146.75$ 7.65$ 5.5% 146.92$ 7.82$ 5.6% 149.25$ 10.15$ 7.3%
0.4% 96.78% 273 14 151.56$ 159.90$ 8.34$ 5.5% 160.64$ 9.08$ 6.0% 163.39$ 11.83$ 7.8%
0.3% 97.08% 210 15 164.02$ 173.04$ 9.02$ 5.5% 174.36$ 10.34$ 6.3% 177.53$ 13.51$ 8.2%
0.2% 97.31% 152 16 176.48$ 186.19$ 9.71$ 5.5% 188.08$ 11.60$ 6.6% 191.67$ 15.19$ 8.6%
0.2% 97.50% 132 17 188.94$ 199.33$ 10.39$ 5.5% 201.80$ 12.86$ 6.8% 205.81$ 16.87$ 8.9%
0.1% 97.64% 94 18 201.40$ 212.48$ 11.08$ 5.5% 215.52$ 14.12$ 7.0% 219.95$ 18.55$ 9.2%
0.1% 97.79% 100 19 213.86$ 225.62$ 11.76$ 5.5% 229.24$ 15.38$ 7.2% 234.09$ 20.23$ 9.5%
0.1% 97.91% 85 20 226.32$ 238.77$ 12.45$ 5.5% 242.96$ 16.64$ 7.4% 248.23$ 21.91$ 9.7%
Note: All options reflect a 5.5% water and sewer revenue increase.
Note: 95% of all customers are served with a 3/4" meter.
"Across-the-Board" Increase Rate Structure Change - Alt. A Rate Structure Change - Alt B.
3/4" Meter Water & Sewer Monthly Bill Comparison
Billing Statistics Option 1 Option 2 Option 3
$-
$20
$40
$60
$80
$100
$120
$140
3 5 8 12
Monthly Bill
Monthly Consumption (Tgal)
Selected 3/4" Water & Sewer Monthly Bill Comparisons
Current
Option 1
Option 2
Option 3
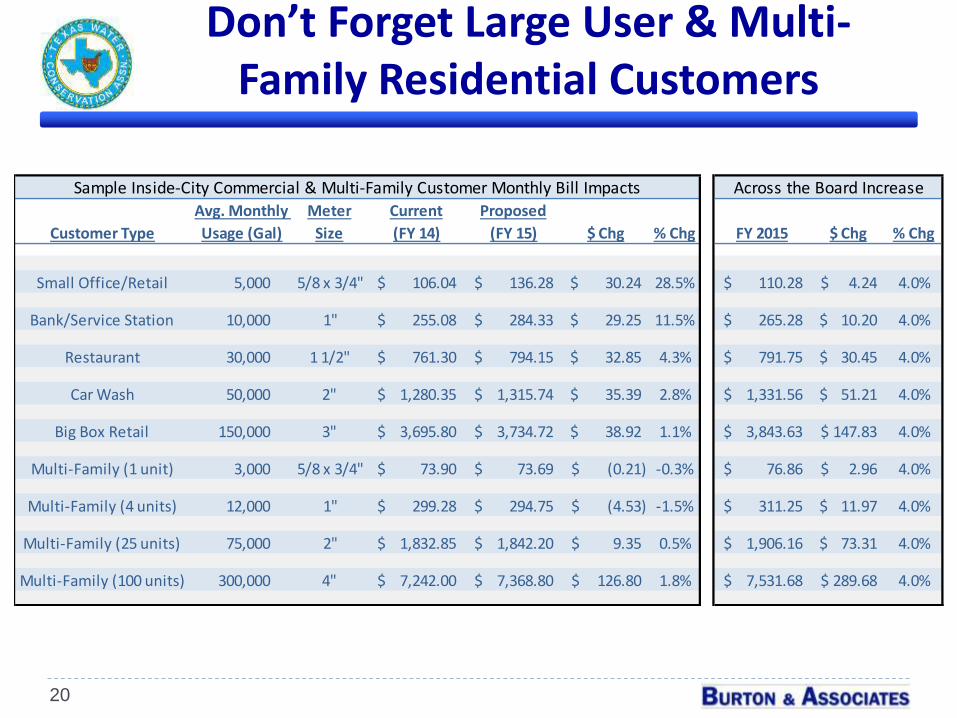
Don’t Forget Large User & Multi-Family Residential Customers
20
Customer Type
Avg. Monthly
Usage (Gal)
Meter
Size
Current
(FY 14)
Proposed
(FY 15) $ Chg % Chg FY 2015 $ Chg % Chg
Small Office/Retail 5,000 5/8 x 3/4" 106.04$ 136.28$ 30.24$ 28.5% 110.28$ 4.24$ 4.0%
Bank/Service Station 10,000 1" 255.08$ 284.33$ 29.25$ 11.5% 265.28$ 10.20$ 4.0%
Restaurant 30,000 1 1/2" 761.30$ 794.15$ 32.85$ 4.3% 791.75$ 30.45$ 4.0%
Car Wash 50,000 2" 1,280.35$ 1,315.74$ 35.39$ 2.8% 1,331.56$ 51.21$ 4.0%
Big Box Retail 150,000 3" 3,695.80$ 3,734.72$ 38.92$ 1.1% 3,843.63$ 147.83$ 4.0%
Multi-Family (1 unit) 3,000 5/8 x 3/4" 73.90$ 73.69$ (0.21)$ -0.3% 76.86$ 2.96$ 4.0%
Multi-Family (4 units) 12,000 1" 299.28$ 294.75$ (4.53)$ -1.5% 311.25$ 11.97$ 4.0%
Multi-Family (25 units) 75,000 2" 1,832.85$ 1,842.20$ 9.35$ 0.5% 1,906.16$ 73.31$ 4.0%
Multi-Family (100 units) 300,000 4" 7,242.00$ 7,368.80$ 126.80$ 1.8% 7,531.68$ 289.68$ 4.0%
Sample Inside-City Commercial & Multi-Family Customer Monthly Bill Impacts Across the Board Increase

Deltona $77.35
Flagler County $65.82
Bunnell $56.85
Putnam County $54.00
DeLand $49.44
Orange Park $44.55
Volusia County $43.30
Palatka (Current) $41.12
JEA $39.92
Palm Coast $39.68
Clay County Utility Authority $39.38
St. Augustine $39.15
Palatka (New) $38.90
Flagler Beach $37.69
St. Johns County $36.62
Nassau County $35.94
Starke $35.65
Holly Hill $32.75
Macclenny $31.16
Green Cove Springs $27.60
Baldwin $26.20
Combined Water & Sewer Bill Survey at 2,000 Gallons per Month
Provide Local Bill Comparisons
21
Putnam County $223.00
Flagler County $212.20
Flagler Beach $209.47
Bunnell $206.87
Holly Hill $196.29
Deltona $169.22
JEA $145.11
Volusia County $139.14
St. Augustine $134.26
St. Johns County $125.34
Palm Coast $119.56
DeLand $118.68
Orange Park $117.44
Clay County Utility Authority $96.88
Macclenny $89.61
Palatka (New) $89.36
Green Cove Springs $84.35
Nassau County $81.58
Starke $79.55
Palatka (Current) $74.72
Baldwin $50.50
Combined Water & Sewer Bill Survey at 15,000 Gallons per Month

Consider Summary Communication Materials/FAQ Documents…..
22

Along With Key Issue Materials and…(Provided by Payne Communications)
23
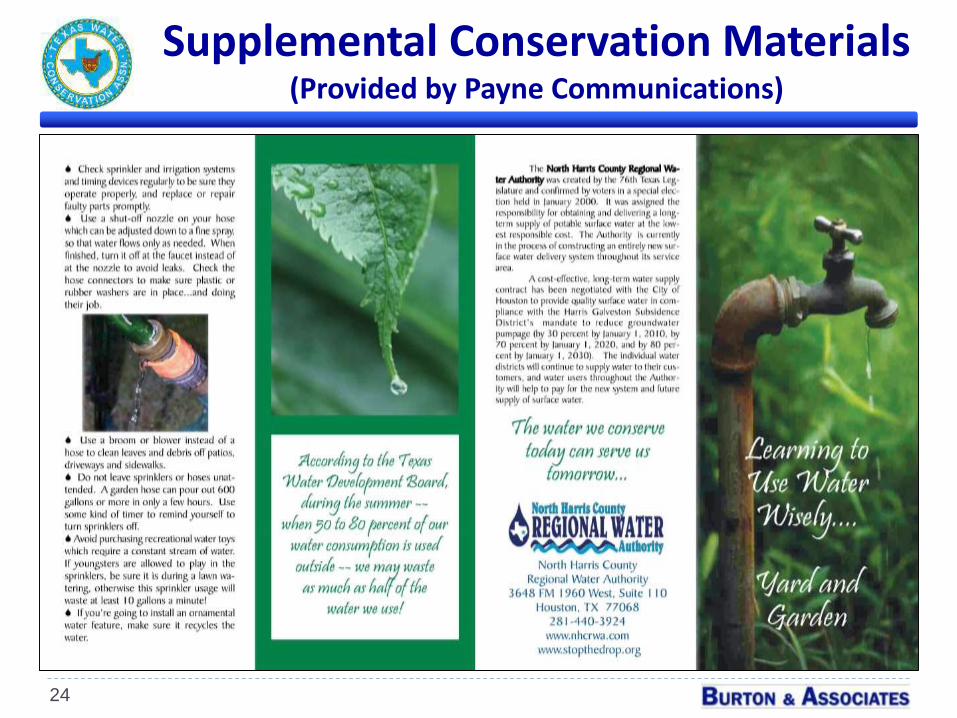
Supplemental Conservation Materials (Provided by Payne Communications)
24

In Summary, Sustainable Inclining Block Rate Solutions Are Possible
What it Requires:
Explicit and reality-based assumptions
Inclusion of relevant staff/experts Consider all impacts
Use of available industry resources
Real stakeholder communication Involving key groups
early and often
Dedicating time to educate elected officials
25

26
Questions & Discussion
PROVIDING SOLUTIONS
THROUGH CLEAR VISION
Presentation By:Andrew Burnham
Senior Vice PresidentOffice: 813-443-5138
Mobile: 904-631-5109Email: [email protected]