feasibility study of tio2 intermediate coating...
TRANSCRIPT

FEASIBILITY STUDY OF TiO2 INTERMEDIATE COATING LAYER FOR ADHESIVE STRENGTH
IMPROVEMENT
MUHAMMAD FIRDAUS BIN OTHMAN
FACULTY OF ENGINEERING
UNIVERSITY OF MALAYA
KUALA LUMPUR
2013

FEASIBILITY STUDY OF TiO2 INTERMEDIATE
COATING LAYER FOR ADHESIVE STRENGTH
IMPROVEMENT
MUHAMMAD FIRDAUS BIN OTHMAN
DISSERTATION SUBMITTED IN FULFILMENT
OF THE REQUIREMENTS FOR THE DEGREE
OF MASTER OF ENGINEERING
FACULTY OF ENGINEERING
UNIVERSITY OF MALAYA
KUALA LUMPUR
2013

ii
UNIVERSITY OF MALAYA
ORIGINAL LITERARY WORK DECLARATION
Name of Candidate: Muhammad Firdaus bin Othman
Registration/Matric No: KGG110002
Name of Degree: Master of Engineering (Material Engineering and Technology)
Title Thesis: FEASIBILITY STUDY OF TiO2 INTERMEDIATE COATING LAYER FOR ADHESIVE STRENGTH IMPROVEMENT
Field of Study: Coating Technology
I do solemnly and sincerely declare that:
(1) I am the sole author/writer of this Work; (2) This Work is original; (3) Any use of any work in which copyright exists was done by way of fair dealing and
for permitted purposes and any excerpt or extract from, or reference to or reproduction of any copyright work has been disclosed expressly and sufficiently and the title of the Work and its authorship have been acknowledged in this Work;
(4) I do not have any actual knowledge nor do I ought reasonably to know that the making of this work constitutes an infringement of any copyright work;
(5) I hereby assign all and every rights in the copyright to this Work to the University of Malaya (“UM”), who henceforth shall be owner of the copyright in this Work and that any reproduction or use in any form or by any means whatsoever is prohibited without the written consent of UM having been first had and obtained;
(6) I am fully aware that if in the course of making this Work I have infringed any copyright whether intentionally or otherwise, I may be subject to legal action or any other action as may be determined by UM.
Candidate’s Signature Date
Subscribed and solemnly declared before,
Witness’s Signature Date Name: Designation:
iii
ABSTRACT
The effects of intermediate TiO2 coating layer on the adhesion strength improvement of TiN
coating were studied. Ti/TiO2/TiN coatings were deposited by D.C magnetron sputtering on
high speed steel (HSS) and stainless steel (SS) substrates. A series of dense and uniform
coating films, 844.1 – 926.4 nm thickness, were deposited at discharge power of 150 W and
substrate temperature ranging from 50 to 250 °C. The duration time for depositing Ti coating
layer was 2400 s and for TiN and TiO2 coating layer were 3600 s each. The as-deposited
coating films were heat treated (annealed) for 1 hour at 400, 500 and 600 °C. The adhesion
strength of Ti/TiO2/TiN coatings were evaluated by scratch testing and the coating hardness
values were measured using micro-hardness tester. X-ray diffraction (XRD) analysis revealed
anatase TiO2 phase. The results from the scratch test discovered that Ti/TiO2/TiN coating
exhibits higher adhesion strength compared to Ti/TiN and single layer TiN coating. The
maximum adhesion strength of 1417.19 mN was observed for Ti/TiO2/TiN coating deposited
on HSS substrate. It is also observed that Ti/TiO2/TiN coatings deposited at higher deposition
temperature exhibits higher values of critical load. The adhesion strength of Ti/TiO2/TiN
coating also increases as the TiO2 coating thickness increases. The adhesion strength of
Ti/TiO2/TiN coating deposited on HSS decreases with the increases of substrate surface
roughness. It was also observed that annealing Ti/TiO2/TiN coating at 500 °C yielded highest
adhesion strength and coating hardness. The annealed coating at 600 °C revealed film
delamination and exhibited lowest adhesion strength.
iv
ABSTRAK
Kajian terhadap kesan penambahan lapisan salutan TiO2 keatas peningkatan kekuatan lekatan
lapisan TiN telah dijalankan. Lapisan Ti/TiO2/TiN dideposit keatas permukaan keluli
berkelajuan tinggi (HSS) dan keluli tahan karat (SS) dengan menggunakan kaedah “DC
magnetron sputtering”. Lapisan Ti/TiO2/TiN berketebalan 844.1 – 926.4 nm dihasilkan pada
kuasa D.C 150 W dan suhu substrat antara 50 sehingga 250 °C. Tempoh masa untuk
penghasilan lapisan Ti adalah 2400 s dan untuk lapisan TiN dan lapisan TiO2 adalah 3600 s
setiap lapisan. Lapisan Ti/TiO2/TiN yang dihasilkan turut menjalani rawatan haba selama 1
jam pada suhu 400, 500 dan 600 °C. Kekuatan lekatan salutan Ti/TiO2/TiN telah dinilai
dengan ujian “scratch” dan kekerasan lapisan salutan diukur dengan menggunakan mesin
“micro-hardness”. Analisis Pembelauan sinar-X (XRD) menunjukkan lapisan Ti/TiO2/TiN
mengandungi ‘anatase’ TiO2. Keputusan daripada ujian ‘scratch’ mendapati bahawa lapisan
Ti/TiO2/TiN mempamerkan kekuatan lekatan yang lebih tinggi berbanding dengan lapisan Ti/
TiN dan lapisan salutan TiN. Kekuatan lekatan maksimum 1417.19 mN diperolehi untuk
lapisan Ti/TiO2/TiN keatas substrat HSS. Lapisan Ti/TiO2/TiN yang telah menjalani rawatan
haba juga didapati mempamerkan kekuatan lekatan yang lebih tinggi. Kekuatan lekatan
salutan Ti/TiO2/TiN juga menunjukkan peningkatan apabila ketebalan salutan TiO2
meningkat. Kekuatan lekatan salutan Ti/TiO2/TiN diatas permukaan HSS berkurangan dengan
peningkatan kekasaran permukaan HSS. Ia juga didapati bahawa rawatan haba keatas lapisan
Ti/TiO2/TiN pada suhu 500 °C menghasilkan kekuatan lekatan dan kekerasan lapisan yang
paling tinggi. Rawatan haba keatas lapisan Ti/TiO2/TiN pada suhu 600 °C menyebabkan
lapisan filem tertanggal dan mempamerkan kekuatan lekatan terendah.

v
ACKNOWLEDGEMENT
First of all, the author would like to express his gratefulness to Dr. Bushroa Binti Abdul
Razak for the supervision and guidance throughout the duration of the project. The author also
would like to thanks AMMP staffs for their helps and advices. The author would like to thank
IPPP UM for the necessary funds under project number PG121-2012B.
The author would like to thank lab technicians in Mechanical engineering department,
especially Mrs. Hartini and Mr. Zaman for their support and valuable inputs.
Finally, the author is most grateful to his beloved mother, Jamaliah Osman for her love and
care over the years. The author also thanks his lovely wife for the support and encouragement
to finish the project. Lastly, the author would like to thank to those who offered assistance and
help to him but unintentionally failed to mention.

vi
CONTENTS
ORIGINAL LITERARY WORK DECLARATION
ABSTRACT
ABSTRAK
ACKNOWLEDGEMENTS
CONTENTS
LIST OF FIGURES
LIST OF TABLES
CHAPTER 1: INTRODUCTION
1.1 Introduction
1.2 Research Objectives
1.3 Research Outline
CHAPTER 2: LITERATURE REVIEW
2.0 Introduction
2.1 Microstructures and adhesions of TiN coating
2.2 Mechanism of failure
2.3 Adhesion evaluation techniques
2.3.1 Indentation test
2.3.2 Laser spallation technique
ii
Page
iii
v
vi
ix
xiv
1
4
5
6
7
12
17
18
21
iv

vii
2.3.3 Scratch test
2.3.4 Energy description model
2.4 Improvement of TiN adhesion strength
CHAPTER 3: METHODOLOGY
3.0 Overview
3.1 Target preparation
3.2 Substrate preparation
3.3 Deposition process
3.3.1 The study of adhesion strength improvement of TiN coating by
implementing Ti and TiO2 as the interlayer.
3.3.2 The effect of deposition temperature on the adhesion strength of
Ti/TiO2/TiN coatings.
3.3.3 The effect of TiO2 coating thickness on the adhesion strength of
Ti/TiO2/TiN coatings.
3.3.4 The effect of substrate surface condition on the adhesion strength of
Ti/TiO2/TiN coatings.
3.3.5 The effect of annealing on the mechanical properties of the
substrate coating systems.
3.4 Evaluation and characterization
3.4.1 Film thickness
23
30
Page
32
36
36
37
38
41
43
43
44
44
45

viii
3.4.2 Adhesion strength evaluation
3.4.3 Coating hardness
3.4.4 Morphology and chemical composition evaluation
CHAPTER 4: RESULTS
4.1 The effect of implementing Ti and TiO2 as interlayer on adhesion strength
improvement of TiN coating.
4.1.1 Structure and composition
4.1.2 Film thickness, adhesion strength and coating hardness
4.2 The effect of sputtering parameter on the Ti/TiO2/TiN adhesion strength.
4.3 The effect of annealing on the mechanical properties of the substrate coating
systems.
CHAPTER 5: DISCUSSIONS
5.1 The effect of implementing Ti and TiO2 as interlayer on adhesion strength
improvement of TiN coating.
5.2 The effect of sputtering parameter on the Ti/TiO2/TiN adhesion strength.
5.3 The effect of annealing on the mechanical properties of the substrate coating
systems.
CHAPTER 6: CONCLUSIONS AND RECOMMENDATIONS
6.1 Conclusions
6.2 Recommendations
REFERENCES
49
50
Page
51
53
59
67
72
76
80
81
82
83
84

ix
LIST OF FIGURES
Figure 2.1: SEM micrograph of TiN coatings PVD TiN coating
Figure 2.2: Critical loads results against coating thickness for four different
substrates hardness.
Figure 2.3: SEM and sketch illustration of different mode of failure: (i) brittle
failure modes; (ii) ductile failure modes.
Figure 2.4: Schematic illustration of coating failures observed during scratch
testing.
Figure 2.5: Schematic representation of the indentation coating adhesion test.
Figure 2.6: Plot of crack size, a vs. load, kg of series of indents made at different
loads.
Figure 2.7: Fracture pattern of TiN coating as function of normal load, W and
coating thickness, t as observed during the indentation test
Figure 2.8: Basic laser spallation set up.
Figure 2.9: The three main scratch modes are constant load, progressive load,
and incremental load.
Figure 2.10: Typical scratch test data for a progressive load scratch on coated
steel sample, showing the critical failure points Lc1 and Lc2.
Figure 2.11: Plot of acoustic emission vs. scratch distance produced from the
scratch test.
8
Page
11
15
17
19
20
21
23
24
25
26

x
Figure 2.12: Schematic representation of scratch test apparatus used by Valli et
al. (1985).
Figure 2.13: Acoustic and tangential friction force results obtained from scratch
test of titanium nitride (TiN) coating on high speed steel substrate.
(a) thick coating (b) thinner coating.
Figure 2.14: Adhesion strength of TiO2, TiN, TiO2/TiN, TiO2/Ti/TiN and TiO2-
Ti-TiN coating deposited at room temperature, 3000C and 4000C.
Figure 3.1: Titanium target used during deposition.
Figure 3.2: Substrates used in the analysis (a) On the left SS and; (b) On the
right HSS.
Figure 3.3: Schematic view of TiN/TiO2/Ti coating system.
Figure 3.4: Schematic diagram of the positioning of the target and substrates
during sputtering process (a) Front view of the sputtering chamber
and (b) Top view of the sputtering chamber.
Figure 3.5: TF450 PVD magnetron sputtering system (SG Control Engineering
PTE LTD, Singapore) equipped with Protec Instruments PC-500
Flow Controller.
Figure 3.6: Heat treatment curve during annealing treatment of deposited
substrate.
Figure 3.7: HSS coated sample for coating thickness evaluation.
Figure 3.8: An image of a micro-scratch system
29
Page
29
35
37
38
38
39
40
45
46
46

xi
Figure 3.9: A schematic diagram of a typical scratch test.
Figure 3.10: Coating topography scan of Ti/TiO2/TiN coating on HSS substrate
Figure 3.11: Cross-section with 2 µm depth created using FiB.
Figure 3.12: Measured values of coating layer thickness of Ti/TiO2/TiN
coatings.
Figure 3.13: Scratch profile of TiN coating deposited onto HSS substrate and the
scratch track observed using optical microscope.
Figure 3.14: (a) Shimadzu Microhardness tester HMV-2; (b) Indentation image
using Vickers indenter at 1.961 N (HV0.2) on HSS substrate
Figure 4.1: X-ray diffraction pattern of Ti/TiO2/TiN samples deposited on HSS
and SS substrates.
Figure 4.2: EDX spectrum of Ti/TiO2/TiN coating deposited onto (a) HSS and;
(b) SS substrates.
Figure 4.3: Atomic percentage of Titanium (Ti), Nitrogen (N) and Oxygen (O)
along with Ferum (Fe) for both coated HSS and SS substrates.
Figure 4.4: Optical microscope image of coating films deposited on high speed
steel (HSS) (a) TiN coating; (b) Ti/TiN coating and; (c) Ti/TiO2/TiN
coating.
Figure 4.5: Field emission scanning electron microscope (FESEM) images of
Ti/TiO2/TiN coatings on high speed steel (HSS) and stainless steel
(SS) substrates at deposition temperature of 2000C and DC power of
47
Page
47
48
49
50
51
54
55
56
57
58
xii
150 kW; (a) and (b) Ti/TiO2/TiN deposited onto HSS substrate and;
(c) and (d) Ti/TiO2/TiN coatings deposited onto SS substrate.
Figure 4.6: FESEM cross section of Ti/TiO2/TiN coated HSS samples.
Figure 4.7: FiB images of samples cross-section and coating thickness measured
for (a) Ti coating; (b) Ti/TiN coating and; (c) TiO2 coating.
Figure 4.8: Adhesion strength of TiN, Ti/TiN and Ti/TiO2/TiN coatings
deposited onto HSS and SS at deposition temperature 2000C and D.C
power of 150 W.
Figure 4.9: Scratch tracks of as-deposited coatings on HSS and SS substrates; (a)
TiN-HSS coatings; (b) Ti/TiN-HSS coatings; (c) Ti/TiO2/TiN-HSS
coatings; (d) TiN-SS coatings; (e) Ti/TiN-SS coatings and; (f)
Ti/TiO2/TiN-SS coatings.
Figure 4.10: Scratch tracks of as-deposited Ti/TiN/TiO2 on HSS and SS
substrates at higher magnification; (a) Ti/TiO2/TiN on HSS and; (b)
Ti/TiO2/TiN on SS substrate.
Figure 4.11: Schematic illustration of coating failures observed during scratch
testing of Ti/TiO2/TiN coatings on HSS and SS substrate.
Figure 4.12: Hardness values of HSS and SS substrates and composite hardness
of coating deposited at deposition temperature of 2000C measured
using Shimadzu Microhardness tester HMV2
Figure 4.13: Adhesion strength of Ti/TiO2/TiN coating deposited on HSS and SS
substrate at substrate temperature of 500C, 2000C and 2500C.
58
Page
60
62
63
64
64
65
68
xiii
Figure 4.14: Hardness values of HSS and SS substrates and composite hardness
of coating deposited at different deposition temperature.
Figure 4.15: Critical loads and hardness of Ti/TiO2/TiN coating deposited at
2000C for different TiO2 coating thickness; (a) HSS substrate and;
(b) SS substrate.
Figure 4.16: Critical loads and hardness of Ti/TiO2/TiN coating deposited at
2000C on HSS substrate for different substrate surface condition
(surface roughness).
Figure 4.17: FESEM image (top view) of Ti/TiO2/TiN coatings deposited on
HSS substrate after annealing at; (a) as-deposited; (b) 4000C; (c)
5000C and; (d) 6000C.
Figure 4.18: XRD patterns of as-deposited and annealed Ti/TiO2/TiN coatings
deposited on HSS substrates.
Figure 4.19: Atomic percentages of Ti, N and O in the Ti/TiO2/TiN coatings
after annealing treatment at different anneal temperatures.
Figure 4.20: Critical loads and hardness values for as-deposited Ti/TiO2/TiN
coating and coating samples after annealing at 4000C, 5000C and
6000C.
69
Page
70
72
73
74
75
75
xiv
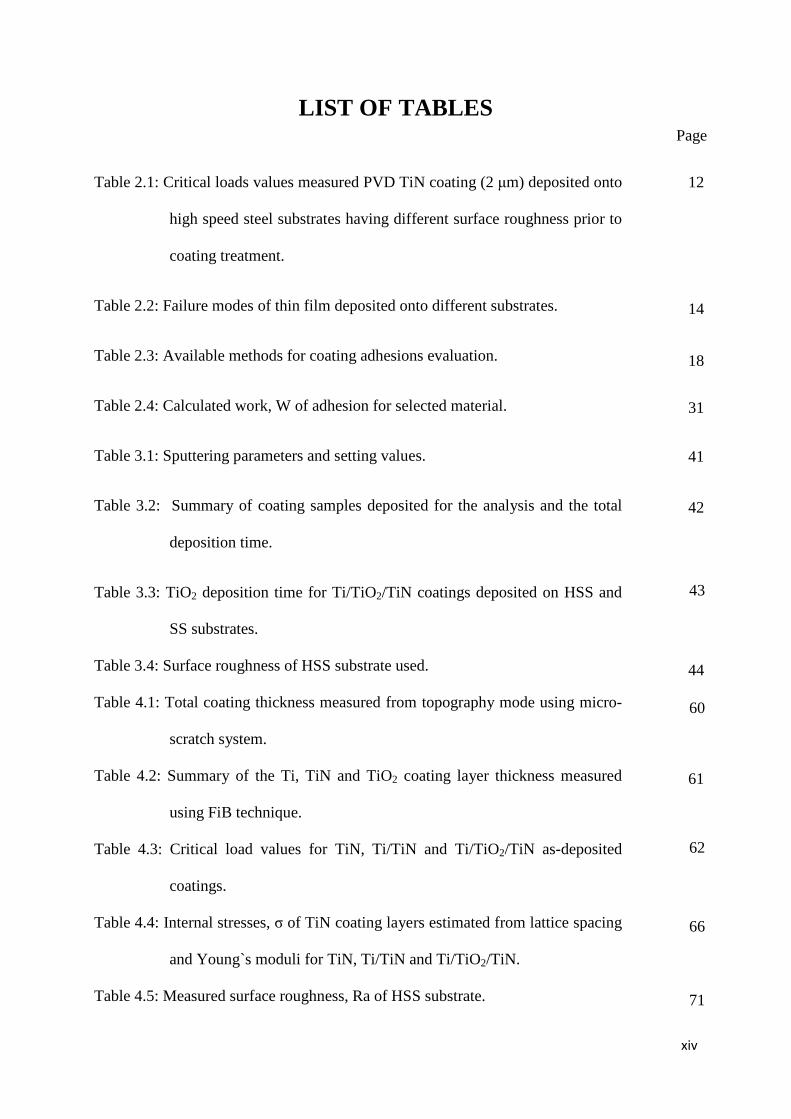
LIST OF TABLES
Table 2.1: Critical loads values measured PVD TiN coating (2 µm) deposited onto
high speed steel substrates having different surface roughness prior to
coating treatment.
Table 2.2: Failure modes of thin film deposited onto different substrates.
Table 2.3: Available methods for coating adhesions evaluation.
Table 2.4: Calculated work, W of adhesion for selected material.
Table 3.1: Sputtering parameters and setting values.
Table 3.2: Summary of coating samples deposited for the analysis and the total
deposition time.
Table 3.3: TiO2 deposition time for Ti/TiO2/TiN coatings deposited on HSS and
SS substrates.
Table 3.4: Surface roughness of HSS substrate used.
Table 4.1: Total coating thickness measured from topography mode using micro-
scratch system.
Table 4.2: Summary of the Ti, TiN and TiO2 coating layer thickness measured
using FiB technique.
Table 4.3: Critical load values for TiN, Ti/TiN and Ti/TiO2/TiN as-deposited
coatings.
Table 4.4: Internal stresses, σ of TiN coating layers estimated from lattice spacing
and Young`s moduli for TiN, Ti/TiN and Ti/TiO2/TiN.
Table 4.5: Measured surface roughness, Ra of HSS substrate.
12
Page
14
18
31
41
42
43
44
60
61
62
66
71

1
CHAPTER 1
INTRODUCTION
1.1 Introduction
In advance applications of engineering materials, coatings are implemented purposely to
improve the mechanical properties and durability of the materials. Such coating usually
applied to the surface of industrial materials which are subjected to severe working
conditions. Coatings are used to reduce the amount of friction between the materials, to
improve the hardness of the substrates, to minimize the wear and to increase the corrosion
resistance of the materials. Coatings are usually implemented on steel-metal working tools,
high speed steel drills and mills and also on machine parts such as ball bearings. Hard
coatings such as titanium (Ti) and titanium nitride (TiN) are deposited onto steels and glass
substrates purposely to introduce hardness and to improve the wear resistance of the
substrates.
TiN has been used as coating materials for tools steel due to its noble appearance, good
adhesion to substrates, high chemical inertness, resistance to elevated temperatures, hard
surfaces (2400 HV) to reduce abrasive wear, a low coefficient of friction with most work
piece materials which increases lubricity and results in excellent surface finish. The used of
TiN coatings onto cutting tool have increase the tool life. Study by Zhang and Zhu (1993) has
reported on the improvement over 1000% in tool life for TiN coated drill bit which are used
for stainless steel work pieces. Another study by Neimi et al. (1986) on the wear characteristic
and properties of TiN coated gear cutting hobs showed that TiN coating reduced the wear of
the hobs significantly, even though at 25% and 50% increased cutting speeds as compared to
the uncoated hobs were used.

2
Furthermore, TiN coatings also have been used for corrosion protection for steel mostly for
cutting tools. Due to its superior mechanical properties and corrosion resistance, TiN coating
often used on steel substrates to protect from deteriorating environment and hence increase
the service life and increase the commercial value of the products. The studies on corrosion
behavior of TiN coating have been done by Chou et al. (2001).
In general, coating materials can be deposited by various techniques including chemical vapor
deposition (CVD), physical vapor deposition (PVD), physical vapor chemical deposition
(PCVD), plasma sprayed, sol gel technique, electroplating and salt bath immersion. PVD
methods involved purely physical process to deposit materials onto a substrate by high
temperature vacuum evaporation and condensation, or plasma sputter bombardment. Other
type of PVD methods included electron beam physical vapor deposition, evaporative
deposition, pulse laser deposition and sputter deposition. CVD methods involved chemical
reactions to deposit materials onto a substrate.
TiN coating films are usually deposited onto cutting tools by physical vapor deposition (PVD)
method. During PVD process, the substrate to be coated is placed in a vacuum chamber and is
heated to a temperature between 4000C and 6000C. The coating material, Ti is vaporized and
the reactive gas is introduced and ionized. TiN compound is formed and deposited onto a
substrate resulting from the reaction of vaporized Ti atoms and the ionized nitrogen (Zhang
and Zhu, 1993).
The studies on the TiN coatings have been done intensively in last few decades.
Microstructures and mechanical properties of TiN coatings were studied for suitability for an
application and also for improvements. Failure modes and mechanisms of TiN coating were
also studied for better understanding of TiN coatings properties.
3
The expected performances or properties of the coated product can only be achieved provided
that the adhesive and the intrinsic cohesion of the coating are sufficient. The adhesion
strength between the substrate and coating must be sufficient enough to avoid failure at the
interface and to display the desired advantages. Adhesion strength is defined as a measure of
the resistance of a coating to debonding or spalling, which may result from abrasive contact
with small hard particles or asperities (Laugier, 1987).
The scratch test has been widely used as the technique to evaluate the adhesion of coating
since its introduction in 1950 by Heavens (Laugier, 1981). In this method, a loaded probe
with a smoothly rounded point (stylus) is drawn across the coating surface and the load is
progressively increased until the removal of the coating occurs. Since it’s introductory,
improvements have been done by previous researcher on the scratch testing for improve
accuracy in measuring adhesion strength.
Good adhesion properties can be achieved by one of the following three mechanisms; (i)
intermediate phase formation, (ii) new bonding configurations at the interface, (iii) lowering
off the interfacial energy between the material. The adhesion strength of TiN coating system
can be increases by the inclusion of other metallic coating layer such as Ti deposited in
between TiN coating layer and a substrate. Helmersson et al. (1985), in their study of
adhesion of titanium nitride coatings on high-speed steels have proved the beneficial effect of
Ti interlayer on the adhesion of coatings. The use of an intermediate layer of pure titanium
increases the adhesion for TiN films deposited. Gerth and Wiklund (2008) also performed a
study on the improvement of TiN adhesion strength by analyzing metallic coating as
interlayer. Their study claimed that adhesion of TiN coating improved with the used of Ti and
Cr interlayer.

4
To enhance the adhesion of coatings deposited by PVD process, it is a promising technique to
use an interface layer. An interface layer is considered as a mixing of transition layers. Both
chemical and mechanical bonding between coating layers are expected to be improved by
having composition change in the interface transition region (Kusano et al., 1998a).
There is also possibility of using oxide metal as the intermediate layer for adhesion strength
improvement. The metal oxide layer may enhance the adhesion strength by creating strong
intermediate or inter diffusion layer at coating layer interfaces. The adhesion strengths of TiN
coating are expected to increase with the presence of Ti and TiO2 interlayer coatings.
On the basis of this hypothesis, the present of both Ti and TiO2 coating layers in existing TiN
coating may improve the adhesion strength by forming strong bonds at the interface. For
example, by having Ti/TiO2/TiN compositional gradient coatings instead of Ti/TiN or TiN
coating alone are expected to provide better adhesion strength.
1.2 Research Objectives
The objective and aims of the study are as follows;
i. To improve the adhesion strength of TiN coating by implementing Ti and TiO2 as the
interlayer.
ii. To analyze the effects of substrate temperature on the adhesion strengths of the
coating systems.
iii. To investigate the contributions of TiO2 coating thickness on the adhesion strength of
the coating systems.
iv. To investigate the effects of different substrate pretreatment methods (surface
roughness) on the adhesion strength.

5
v. To analyze the effects of annealing on the mechanical properties of the substrate
coating systems.
1.3 Research Outline
In the present study, Ti/TiO2/TiN coatings were produced by using D.C magnetron sputtering
method. Each coating layers were deposited in sequences. Ti coating layer was deposited first
followed by TiO2 coating and lastly TiN coating layer. Substrates used for the study were
high speed steel (HSS) and stainless steel (SS). Investigations of the produced Ti/TiO2/TiN
coatings were conducted by several methods. The mechanical properties of the coating were
evaluated in terms of adhesion strength by applying micro-scratch test and coating hardness
by micro-hardness tester. Field emission scanning electron microscopy (FESEM), an optical
microscope and X-ray diffraction analysis were used to observe surface morphologies and to
determine phase composition of Ti/TiO2/TiN coatings, respectively. Energy dispersive X-ray
spectroscopy (EDX) was used for qualitative determination of the elements which are present
on the sample surface.

6
CHAPTER 2
LITERATURE REVIEW
2.0 Introduction
The studies on the coating/substrate systems have been performed and developed since 1950’s
with the works on single layer of coatings deposited onto numbers of different substrates such
as steels and glasses concentrating on the improvement of the mechanical properties and the
adhesion strength (Laugier, 1981). The trends were progressed with the study of multilayer
coating and the effect on the adhesion strength of the substrate-coating systems (Wang et al.,
1995; Helmersson et al., 1985; Valli et al., 1985; Gerth and Wiklund, 2008; Kusano et al.,
1998b). More recently, works on the new development of new coating materials and new
method of adhesion strength evaluations have been conducted (Jaworski et al., 2008; Gupta et
al., 1992; Wang et al., 2004). Studies on the effectiveness of the coatings on the substrates
have been done intensively to analyze the performance of the coatings and the problems that
might be associated with specific type of coating and substrate systems (Stebut et al., 1989;
Bull, 1991).
This particular study will concentrate on the adhesion strength improvement of titanium
nitride (TiN) coating by depositing titanium (Ti) and titanium dioxide (TiO2) interlayer for
adhesion enhancement. TiN coating are often employed for improving tribology performance
of tools and machine parts in industrial applications due to their mechanical properties
including high hardness and high wear resistance. The coatings must adhere well to the
substrates in order to achieve the desired performance.

7
The inclusion of Ti interlayer has proven to increase the adhesion strength of TiN coatings
system. Helmersson et al. (1985), in their study of adhesion of titanium nitride coatings on
high-speed steels proved the beneficial effect of Ti interlayer on the adhesion of TiN-HSS
coating substrate system. Perry (1983) also reported on the interlayer coating which can be
utilized on adhesion strength improvement. A metallic interlayer of titanium is most effective
on titanium alloy steel and oxide or nitrides containing interlayer are effective on steel or
super alloy.
This chapter will provide comprehensive review on the coating deposition techniques
available and method which will be used in this particular study. The methods used to
evaluate the adhesion strengths, namely; the indentation test, laser spallation technique and
scratch test are also reviewed. Adhesion strengths of TiN coatings as well as the failure modes
and mechanisms of coating failure will also be reviewed. Factors which affect the adhesion
strength of coating-substrate systems will also be discussed.
2.1 Microstructures and adhesions of TiN coating
For tooling applications, the most important properties of the coatings require are the coating
thickness, density, hardness, adhesion, temperature resistance, wear, corrosion and oxidation
resistance. TiN coatings are widely used in cutting tools and wear parts due to high hardness
and strength, high wear resistance a well as high temperature stability (Laugier, 1987).
The coating thickness of TiN film on tool steels is generally between 2 and 10 µm. The PVD
TiN coatings are thinner between 3 to 5 µm (Zhang and Zhu, 1993). The TiN coating
hardness apparently increases with increasing film thickness (Chou, 2002). Thus, thicker
coating thickness may provide longer tool life.

8
The microstructures of TiN coatings are depends on the deposition process. TiN films
deposited by the PVD method can be characterized as being entirely columnar, with grains
generally extending through the coating thickness (Laugier, 1987).
Figure 2.1: SEM micrograph of TiN coatings PVD TiN coating (Laugier, 1987).
Figure 2.1 shows the microstructure of TiN coating deposited on cemented carbide substrates
by PVD method showing the columnar structures of the coating with the grains extending
through the coating thickness.
The adhesion strength of the PVD coating was significantly poor compared to coating
deposited by other method such as CVD. The PVD coating tended to spall suddenly at critical
load of 1.2 kgf. The poorer adhesion strength of PVD TiN coating can be explained probably
due to columnar morphology which in turn resulting in low toughness and also no interfacial
bonding layer are observed in the coating. The adhesion strength of a coating depends on both
chemical and physical interaction between the coating and the substrate materials and also the
microstructure of the interface region. Poor adhesion of coatings may be attributed to the low
degree of chemical bonding and poor interfacial contact between the coating and substrates.
The adhesion strengths of coating-substrate system usually represented by the values of
critical load measured by scratch testing. The critical load depends on several parameters
9
related to the testing conditions and to the coating-substrate system. Juhani Valli and Mäkelä
(1987) discussed on the factors affecting scratch test results in their work on TiN coated HSS
which are surface roughness as well as friction between coating and indenter. For substrate
surface roughness, the surface roughness should not exceed 0.25 µm in order to eliminate the
effect on the scratch test results. Poor surface finish decrease the critical normal force,
showing worse adhesion value compared to polished surface. Their works also mentioned on
the influence of lubricants on the critical normal forces. The use of a thin ion-plated silver
overlay will increase the critical normal force remarkably and also enhance the repeatability
of the testing.
Perry (1993) reported on the effect of coating thickness and the substrate hardness of the TiN
coatings deposited onto steels and cemented carbides by ion-plating PVD method. Their
observations show that the critical load increases with both increasing coating thickness and
increasing substrate hardness. For hard coatings deposited onto steel, the critical value of TiN
coating increases with the coating thickness up to certain thickness value. At larger thickness,
the critical loads may become constant, independent of the coating thickness. In contrast, for
hard coating deposited onto cemented carbide, the critical loads are nearly independent of
coating thickness.
In contrast, Chopra (1969), in his work on the adhesive strengths of gold deposited onto glass
and other substrates by sputtering and evaporation observed that the critical loads applied
during scratch test increased rapidly with increasing coating thickness and with increasing
substrate hardness. The increases in the critical load as the substrate hardness increases can be
explained by the amount of load required to plastically deform tougher substrates increases
compare with soft substrate. Softer substrates can easily plastically deform and there is a
sharp change in the shear stress distribution at the coating substrate interface. As the substrate
become tougher, the shear stress at the interface is less at the same stylus load.

10
Helmersson et al. (1985) studied the effect of substrate temperature and pretreatment on the
adhesion of TiN coatings. The adhesion of the films increased with substrate temperature,
reaching a maximum between 400 and 500 °C. Substrate pretreatment such as sputter etching
prior to deposition also improves the film adhesion even though a complete removal of the
oxide layer is not achieved.
Steinmann and Hintermann (1985) also confirmed the work done in other studies on the
effects of hardness of the substrates and coating thickness on the critical load of the coating-
substrate system. Their work confirmed on the linear relationship between critical load and
substrate hardness as shown in Figure 2.2. From the figure, it can be seen that as the coating
thickness increases, the value of the critical load increases in linearly fashion. The hardened
and tempered samples show higher value of critical loads compared to annealed sample.
Higher adhesion strength between coating and substrate can be achieved by using substrate
with high hardness.
Schulz et al. (1991) demonstrated on the influence of alternating sequences of heating and
deposition on the coating adhesion. Using an electron beam, a localized heat treatment of the
sample can be applied whereby the heating rate and final temperature can be chosen over a
wide range. The growth and stoichiometry of the coatings can be influenced by alternating
sequences of heating and deposition. Preheating prior to deposition process might well
increase the adhesion of coating.

11
Figure 2.2: Critical loads results against coating thickness for four different substrates
hardness (Steinmann and Hintermann, 1985).
Other factor that might contribute on the adhesion strength of the coating is the influence of
the substrate roughness prior to coating deposition. Steinmann et al. (1987) suggested that the
critical load of the coating depends on the substrate roughness. Table 2.1 summarized the
values of critical load of TiN coating deposited onto HSS substrate with different surface
roughness prior to coating process. The critical values of TiN coating clearly dependence on
the substrate surface roughness. Substrates with smooth contact surface with average
roughness less than 0.1 µm tend to produce higher adhesion to the coating. It is believed that
although all the substrates were coated during the same treatment, the adhesive properties can
vary since the efficiency of the cleaning operation is influenced by the surface roughness.

12
Table 2.1: Critical loads values measured PVD TiN coating (2 µm) deposited onto high speed steel substrates having different surface roughness prior to coating treatment.(Steinmann et al., 1987).
Sample Surface preparation Average roughness, Ra (µm)
Total roughness Rt (µm)
Critical load (N)
1 Polishing (600 grit paper) 0.03 0.40 56
2 Rectification 0.05 1.00 56
3 Polishing (alumina) 0.07 0.60 54
4 Shot peenin 0.40 4.65 40
5 Milling 1.75 12.5 27
6 Shot blasting 7.00 70.0 13
2.2 Mechanism of failure
The study of the mechanisms and modes of failure are essential in order to understand the
behavior of the coating system under certain loading conditions. Brittle coatings behave in
different manner compared with ductile coating deposited on the same substrates when
subjected to a loading condition in scratch test. Perry (1983) reported on the mechanisms of
coating failure for brittle and ductile coatings where the brittle films can be remove
completely but ductile film subjected to gradually thinning (sideway extrusion).
Bull (1991) reported that TiN coatings deposited onto a range of different substrates from soft
nickel to hard cemented carbide, summarized that the failure of coating-substrate systems fall
into two general groups, depending on whether the substrates behave in brittle or ductile
manner during scratch test.
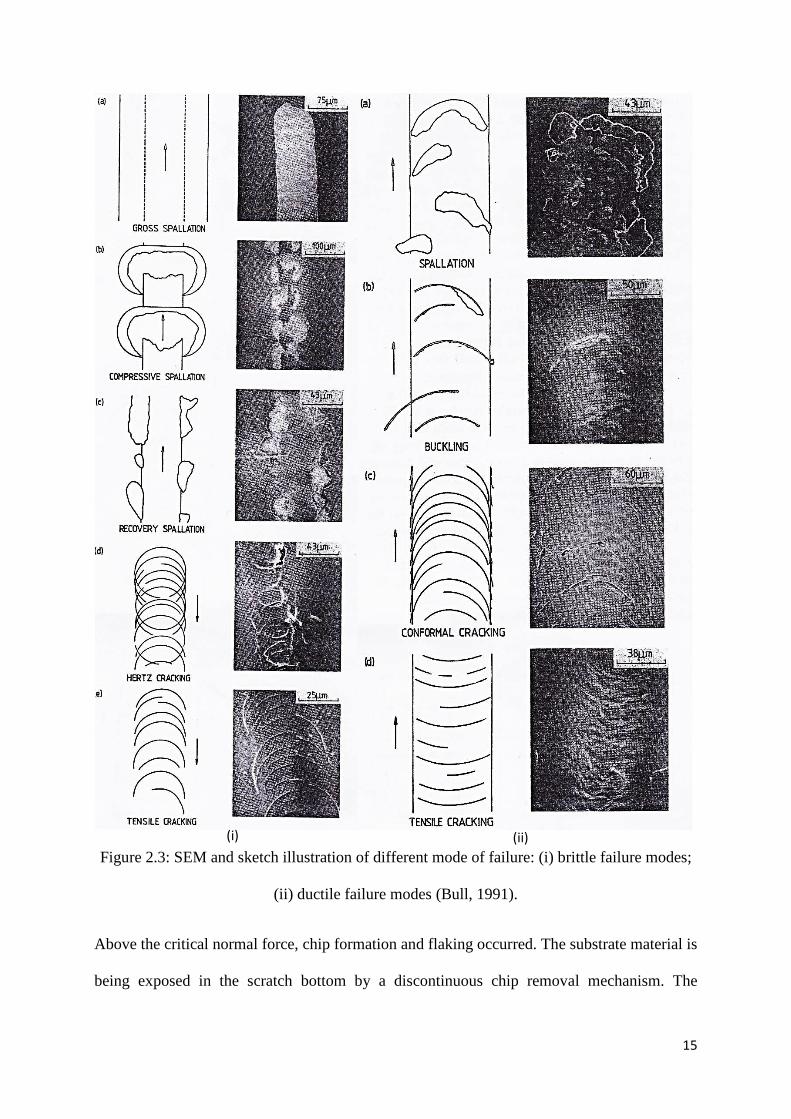
Brittle failure modes in scratch testing can be classified into: (1) gross spallation; (2)
spallation ahead of the indenter; (3) recovery spallation behind the indenter; (4) hertzian
cracking and; (5) tensile cracking. Large area spallation or gross spallation occur when the
adhesion is poor or if the residual stress level in the coating is high. Spallation is also another
common failure mode in which the coating is detached to minimize the amount of elastic
13
energy stored by the large compressive stresses ahead of the moving stylus during scratch
test. Hertzian ring cracks occur when the tensile radial stresses at the edge of the diamond
contact generate a ring crack which propagates from the surface through the coating into the
substrate. Several of these cracks intersect and cause a crack network along the edge of the
crack track. Tensile cracks form from the cracks which form at the rear of diamond contact.
Ductile failure modes in scratch testing can be classified into: (1) spallation; (2) buckling; (3)
conformal cracking and; (4) tensile cracking. The spallation and buckling modes are very
similar to the spallation mode for brittle failure except the magnitude of failure is smaller and
generally confined within scratch track. Conformal cracks occur when there is through-
thickness cracking at the front and sides of the indenter. This is due to the partial ring cracks
which occur ahead of the indenter and then passes over and pushed into scratch track. Tensile
cracking occurs at the rear of diamond contact due to the tensile stress generated on sliding as
observed for the brittle materials. Figure 2.3 shows the sketch and scanning electron
microscope details on the brittle and ductile failure modes in scratch testing.
For ductile failure, the area of uncovered substrate is small and within the scratch track. For
brittle failure the area is more extensive and often extends beyond the limit of the scratch
track. Table 2.2 shows the failure mode of thin film deposited onto different substrate (ductile
or brittle) depending whether the applied stresses are compressive or tensile. For ductile
substrates, interface failure can occurs for both tensile and compressive stress provided that
interfacial adhesion is poor. If adhesion is good, failure tends to occur within the coating. For
brittle substrates, interface failure again can occur for both tensile and compressive stress if
adhesion is poor and possibility of interfacial cracking for tensile stress.

14
Table 2.2: Failure modes of thin film deposited onto different substrates (Bull, 1991).
Stress Film Substrate Interface bonding Decohesion mechanism(s) Tensile Brittle Ductile Good Film cracking (no decohesion)
Poor Film cracking (interface decohesion)
Compressive Brittle Ductile Good Buckling propagation in film Poor Buckling propagation at
interface Tensile Brittle Brittle Good Film cracking and interface
decohesion Poor Edge decohesion at interface
Compressive Brittle Brittle Good Substrate splitting Poor Buckling propagation at
interface
There are also some other works conducted on thin film coating to study the failure mode of
thin coating. Hedenqvist et al. (1990) studied the failure mode of TiN coating on high speed
steel. Failure mode of TiN coatings were studied based on scratch tests performed on a TiN
coated on high speed steel substrates with various coating thickness and substrate hardness. In
their report, four groups of coating damage and detachment mechanisms were recognized: (1)
deformation; (2) crack formation; (3) chip formation and; (4) flaking. The scratch
mechanisms were observed on two different conditions: scratch mechanisms below the
critical normal force and above the critical normal force. At normal force value which is close
to zero, no visible surface damage observed due to elastic deformation of the coating substrate
system. With increasing normal force, the plastic deformation extends through the coating
into the substrate. The degree of plastic deformation increases with increasing normal force.
During scratching, transverse surface cracks were often observed due to tensile stresses
generated behind the moving diamond tips which then resulting in internal transverse
cracking. Internal transverse cracks increase with increasing normal force. External transverse
cracking may also appear at higher normal force values.
15
Figure 2.3: SEM and sketch illustration of different mode of failure: (i) brittle failure modes;
(ii) ductile failure modes (Bull, 1991).
Above the critical normal force, chip formation and flaking occurred. The substrate material is
being exposed in the scratch bottom by a discontinuous chip removal mechanism. The
(i) (ii)

16
detached chips consist of heavily deformed coating-substrate materials. Flaking
predominantly occurs outside the scratch track due to high frictional force values.
Similar work has been done by Stebut et al. (1989) on major damage mechanism during
scratch testing of TiN coated high speed steel substrate. Scratch testing damage starts by
tensile type cracking nucleation behind the trailing edge of diamond indenter. Tensile type
crack pattern include partial ring crack prior to spalling and envelope cracks parallel to sliding
direction. However, for hard coatings on hard substrates, no conformal cracking generated
ahead of the indenter leading edge are observed which is contradicted to Bull (1991) findings
where conformal cracking is the major spalling initiator.
Larsson et al. (2000) also studied the mechanism of coating failure as demonstrated by scratch
and indentation testing of TiN coated high speed steel. During scratch test, six different
coating failure mechanisms could be identified (see Figure 2.4): (1) cracks parallel with the
scratch channel; (2) semicircular cracks within the scratch channel; (3) external transverse
cracks; (4) cohesive chipping; (5) adhesive spalling and; (6) complete breakthrough of the
coating within the scratch channel. During indentation, there are four different type of coating
failures which have been distinguished: (1) circular crack within the indentation; (2) radial
cracks outside the indentation; (3) cohesive chipping and; (4) adhesive spalling. The
mechanism of parallel cracking in scratch testing is due to deflection of the coating into the
physically deformed underlying substrate material. External transverse cracking initiated
during or after unloading due to high residual stresses generated in the coating. The cohesive
and adhesive coating failures occur during unloading behind the diamond stylus.

17
Figure 2.4: Schematic illustration of coating failures observed during scratch testing: 1:
parallel cracks; 2: semicircular cracks; 3: external transverse cracks; 4: coating chipping; 5:
coating spalling; 6: coating breakthrough (Larsson et al. (2000).
2.3 Adhesion evaluation techniques
The adhesion between the coating and substrate is a measure value to quantify the
performance and reliability of coated materials for engineering applications. Methods which
have been developed for evaluating substrate-coating adhesion often have its own advantages
and disadvantages depending on the specific coating-substrate systems.
The measurement of experimental adhesion can be determined in two ways: (1) by defining
the force of adhesion as the maximum force per unit area exerted when two materials are
separated; (2) by defining the work of adhesion as the work done in separating two materials
from one another (Chalker et al., 1991).
Table 2.3 shows some of the methods developed to measure the adhesion of thin films that
have been reported in literatures. The methods can be classified into qualitative and
quantitative methods, mechanical and non-mechanical methods. The mechanical methods are

18
of more practical interests. Tape test is the simplest and most widely used method to evaluate
coating adhesion. The indentation, laser spallation and scratch adhesion test are the most
practical methods to be used and widely been used for the analysis of coating adhesions.
In this section, a compressive review on the indentation, laser spallation and scratch test are
presented. Details explanations on each technique are made and advantages as well as
limitations of each are also presented.
Table 2.3: Available methods for coating adhesions evaluation (Chalker et al., 1991).
Qualitative Quantitative Mechanical methods
Abrasion test Bend and scratch test Scotch tape test
Scratch test Laser spallation technique Indentation test Direct pull-off method
Non-mechanical methods
X-ray diffraction
Thermal method Nucleation test
2.3.1 Indentation test
The indentation adhesion test was done by introducing a stable crack into the coating-
substrate interface by the used of conventional indentation procedures using either Brale or
Vickers indenters (Chalker et al., 1991). In indentation test, it is assumed that the interface
within the vicinity of the plastic zone created during indentation has a lower toughness than
either the film or substrate materials and consequently will be area of preferential lateral crack
formations. Figure 2.5 shows the schematic view of indentation test showing the crack size
induced resulting from the indenter loads. The coating removal mechanisms obtained from
the indentation test were studied and the values of critical normal loads at the event of

19
complete removal of coating from the substrate usually refer as the adhesion of coating-
substrate systems.
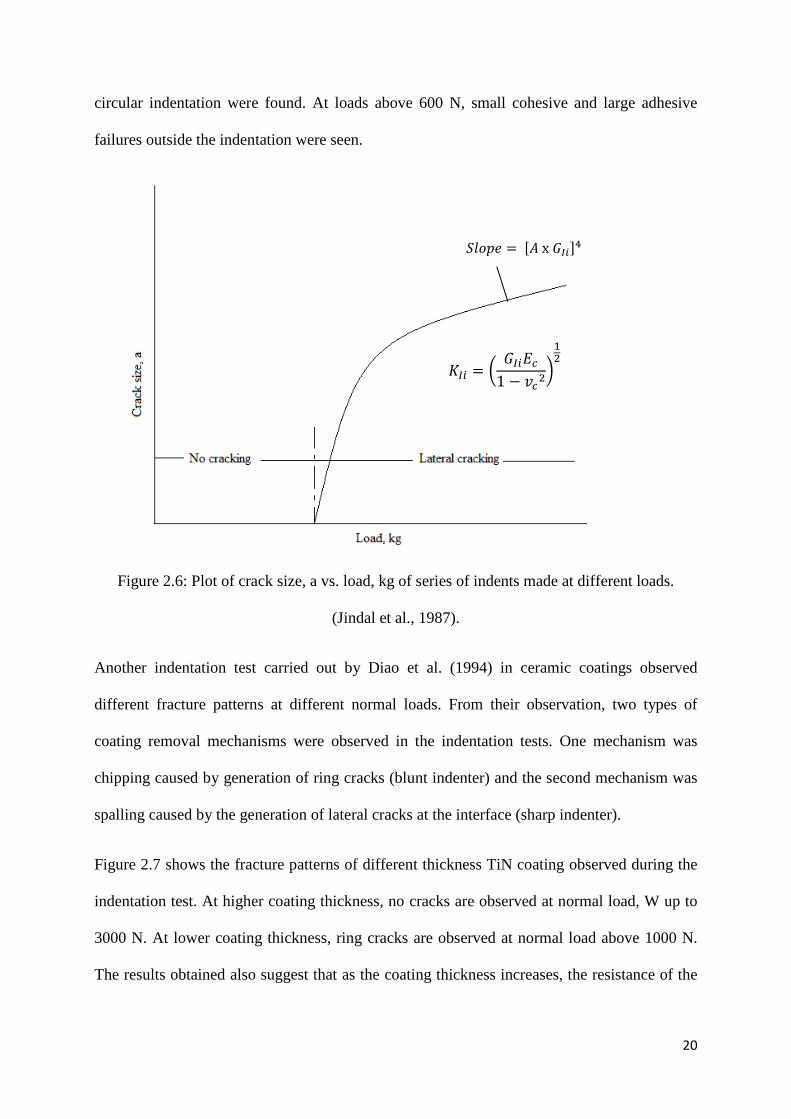
Figure 2.6 shows the results of a series of indents made at different loads in the indentation
test conducted by Jindal et al. (1987). During the test, the average change in lateral cracking is
monitored as a function of load and the interfacial fracture toughness KIi is derived from the
linear portion of the indentation load vs. lateral crack length plot according to
��� = � ����� ��
��
where, A is a constant and Ec and �c are Young`s modulus and Poisson`s ratio of the coating
respectively. It is also observed that in this technique, the indentation adhesion parameters Pc
and KIi are relatively insensitive to the substrate hardness.
Figure 2.5: Schematic representation of the indentation coating adhesion test.
In the indentation test, different types of coating failures were observed depend on the amount
of loads applied during the test. In the analysis of coating failure in TiN coated high speed
steels by Larsson et al. (2000), four different types of coating failure were observed. At
relatively low normal load (5-25 N), only circular cracks at the rim and inside the indentation
were found. At loads above 60-130 N, radial cracks propagating perpendicular to the rim of
(2.1)
20
circular indentation were found. At loads above 600 N, small cohesive and large adhesive
failures outside the indentation were seen.
Figure 2.6: Plot of crack size, a vs. load, kg of series of indents made at different loads.
(Jindal et al., 1987).
Another indentation test carried out by Diao et al. (1994) in ceramic coatings observed
different fracture patterns at different normal loads. From their observation, two types of
coating removal mechanisms were observed in the indentation tests. One mechanism was
chipping caused by generation of ring cracks (blunt indenter) and the second mechanism was
spalling caused by the generation of lateral cracks at the interface (sharp indenter).
Figure 2.7 shows the fracture patterns of different thickness TiN coating observed during the
indentation test. At higher coating thickness, no cracks are observed at normal load, W up to
3000 N. At lower coating thickness, ring cracks are observed at normal load above 1000 N.
The results obtained also suggest that as the coating thickness increases, the resistance of the
����� = ��x�����
��� = � ���� 1 − � #$
�#

21
coating to crack or fail also increases. Thus, the adhesions of the coating are increases with
the higher coating thickness
Figure 2.7: Fracture pattern of TiN coating as function of normal load, W and coating
thickness, t as observed during the indentation test by Diao (1994).
The limitation of this method for adhesion strength evaluation is that only fracture patterns of
the coating at specific indent loads can be determined. The mechanism or fracture patterns of
the coating prior to critical loads cannot be observed. The static indentation test should be
used to evaluate the fracture resistance and coating-substrate adhesion, while dynamic scratch
testing can preferably be used for evaluating the load carrying capacity of the coating-
substrate composite.
2.3.2 Laser spallation technique
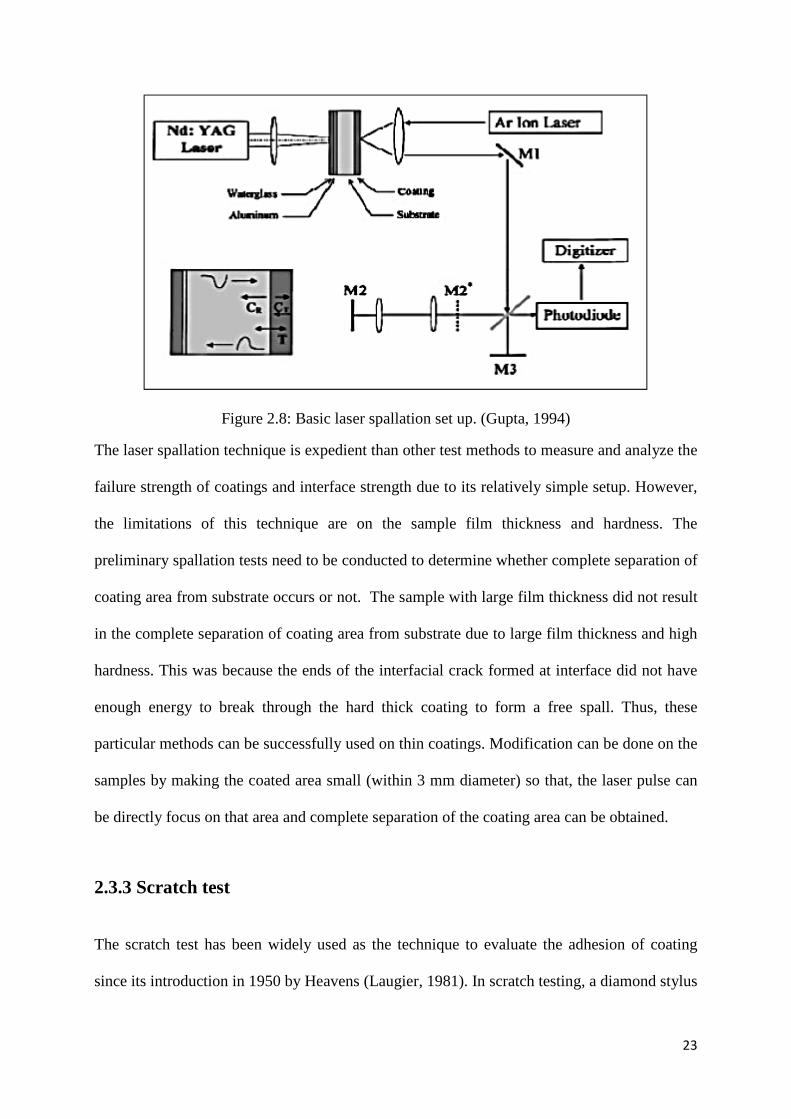
Laser spallation was established as a method to quantify the tensile strength of interface
between engineering substrates and thin ceramic, polymeric, or metallic coating. Gupta et al.

22
(1992) have developed laser spallation experiment to measure the strength of planar interfaces
between a substrate and a thin coating (in the thickness range of 0.3–3 µm).
In basic laser spallation test (see Figure 2.8), a 2.5 ns Nd:YAG laser pulse is focused to an
area 3 mm in diameter on a 0.5-mm thick aluminum film. The film is sandwiched between the
back surface of a substrate and a 50 to 100 mm thick layer of solid water glass. The induced
expansion of aluminum generates a compressive stress pulse (with 1 ns rise time) directed
toward the coating which is deposited on the substrate’s front surface. The compressive stress
wave reflects into a tensile pulse from the coating’s free surface and leads to its complete
removal at a sufficiently high amplitude which referred to as spallation.
The critical stress at the interface is calculated by measuring the transient displacement
history of the coating’s free surface (induced during pulse reflection) by using an optical
interferometer with a resolution of 0.2 ns in the single shot mode. The measured free surface
velocity (or displacements) is related to the maximum interfacial tensile stress that is
generated by the reflecting stress wave by using a wave mechanics based simulation. The
peak value of this interface tensile stress at the onset of interface separation is taken as the
interface strength (Hagerman et al., 2007).
23
Figure 2.8: Basic laser spallation set up. (Gupta, 1994)
The laser spallation technique is expedient than other test methods to measure and analyze the
failure strength of coatings and interface strength due to its relatively simple setup. However,
the limitations of this technique are on the sample film thickness and hardness. The
preliminary spallation tests need to be conducted to determine whether complete separation of
coating area from substrate occurs or not. The sample with large film thickness did not result
in the complete separation of coating area from substrate due to large film thickness and high
hardness. This was because the ends of the interfacial crack formed at interface did not have
enough energy to break through the hard thick coating to form a free spall. Thus, these
particular methods can be successfully used on thin coatings. Modification can be done on the
samples by making the coated area small (within 3 mm diameter) so that, the laser pulse can
be directly focus on that area and complete separation of the coating area can be obtained.
2.3.3 Scratch test
The scratch test has been widely used as the technique to evaluate the adhesion of coating
since its introduction in 1950 by Heavens (Laugier, 1981). In scratch testing, a diamond stylus
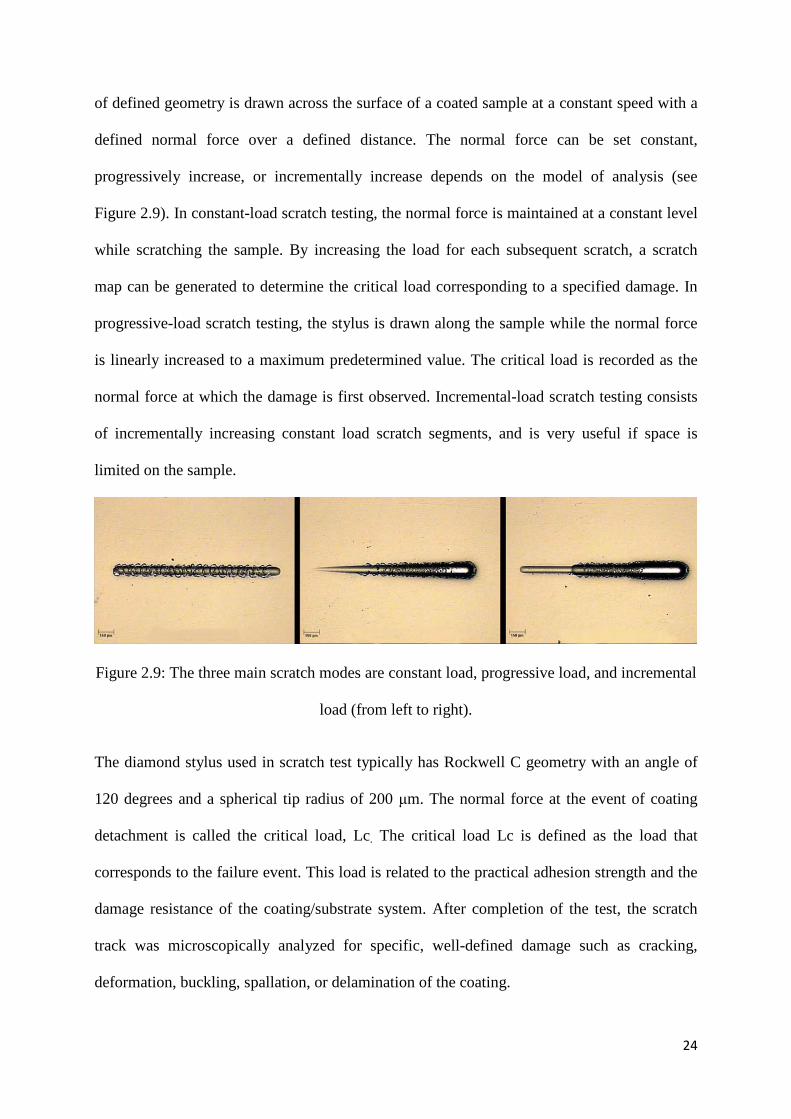
24
of defined geometry is drawn across the surface of a coated sample at a constant speed with a
defined normal force over a defined distance. The normal force can be set constant,
progressively increase, or incrementally increase depends on the model of analysis (see
Figure 2.9). In constant-load scratch testing, the normal force is maintained at a constant level
while scratching the sample. By increasing the load for each subsequent scratch, a scratch
map can be generated to determine the critical load corresponding to a specified damage. In
progressive-load scratch testing, the stylus is drawn along the sample while the normal force
is linearly increased to a maximum predetermined value. The critical load is recorded as the
normal force at which the damage is first observed. Incremental-load scratch testing consists
of incrementally increasing constant load scratch segments, and is very useful if space is
limited on the sample.
Figure 2.9: The three main scratch modes are constant load, progressive load, and incremental
load (from left to right).
The diamond stylus used in scratch test typically has Rockwell C geometry with an angle of
120 degrees and a spherical tip radius of 200 µm. The normal force at the event of coating
detachment is called the critical load, Lc. The critical load Lc is defined as the load that
corresponds to the failure event. This load is related to the practical adhesion strength and the
damage resistance of the coating/substrate system. After completion of the test, the scratch
track was microscopically analyzed for specific, well-defined damage such as cracking,
deformation, buckling, spallation, or delamination of the coating.

25
Figure 2.10 shows the typical scratch test data for a progressive load scratch test on high
speed steel sample coated with TiN. The loading rate is 4 mN/s and the scratch length of 900
µm. From the figure, the critical failure points Lc1 and Lc2 are 900 mN and 1050 mN
respectively. The first critical load (Lc1) is 900 mN, and it corresponds to the point at which
first damage is observed. This first damage has the shape of an interfacial shell-shaped
spallation. The second critical load (Lc2) is 1050 mN, and it is the point at which the damage
becomes continuous and complete delamination of the coating starts.
Figure 2.10: Typical scratch test data for a progressive load scratch on coated steel sample,
showing the critical failure points Lc1 and Lc2.
Since its inception, the developments of the scratch test technique for measuring coating
adhesion have been done. Instead of having only the data of normal force and penetration
depths from the scratch test results, acoustic emission equipment has been used to provide
secondary data for coating detachment analysis. The acoustic emission (AE) equipment or
sensor is used to provide traceable signals whenever coating detachments present during the
Lc1
Lc2

26
scratch tests. The signals can be used to compare results from different samples and may
avoid some subjectivity of measurement made by eyes.
Figure 2.11 represents the plot of acoustic emission vs. scratch distance obtained from typical
scratch test equipped with AE sensor. Figure 2.11 can be understood that the coating
detachment start to observe when there is a sudden jump in the AE signal. Lc1 represents the
first critical points of coating detachment which is referred to cohesive failure of the coating.
Lc2 represents the 2nd critical points of coating detachment where complete fails of the coating
starting to occur. Lc2 is the critical load of the coating failure and also represent the value of
coating adhesions.
Figure 2.11: Plot of acoustic emission vs. scratch distance produced from the scratch test.
Bull (1991) have carried out used scratch test analyses on the adhesion of titanium nitride
coatings deposited onto a range of different substrates from soft nickel to a hard cemented
carbide and to identify the failure modes which occur during the test with the assistance of AE
probe. The scratch test was performed using a Rockwell C diamond stylus with the tip radius
Lc1
Lc2

27
of 200 µm. The tester was equipped with acoustic emission monitoring equipment in order to
determine the coating failure.
Another work done by Je et al. (1986) also implemented the scratch testing with AE
equipment in their assay on the reactively sputtered TiN coatings on a soft substrate. From the
work, they found that the critical load of a thicker coating (approximately 1.5 µm), cracking
and also loss of the coating were observed with an increase in acoustic emission. However, at
the critical loads of thinner coatings (1.2 µm or less), coating loss was not observed even
though there is an increase in the emission and coating cracking did occurred. Their findings
suggested that the AE emission can provide accurate information on the occurrence of coating
failure but limited to certain level of coating thickness. For example in their work, coating
thickness of 1.2 µm or less, the AE emission still showing increases in the signal but
microscopic observation on the coating clearly do not indicated any failure.
Yamamoto et al. (1992) on their study of the acoustic emission behavior at scratch test for
TiN coating concentrated on the relationships between the AE behavior and the intrinsic
properties of deposited TiN films, and also to evaluate the mechanical strength of the coatings
by analyzing the AE intensity. They concluded that the AE intensity of the coatings measured
by the scratch test depends not only on the adhesion of a coating-substrate interface but also
on the intrinsic properties of a deposited film. The substrate hardness has little effect on AE
intensity. However, the internal stress and toughness of the coated film strongly affect the AE
intensity. The critical load correlates with AE intensity which is determined by the toughness
and the internal stress. AE intensity increases with decreasing the toughness and the internal
stress of coated films. They also suggested that an analysis of AE behavior at the scratch test
can qualitatively evaluate the toughness of coatings.
28
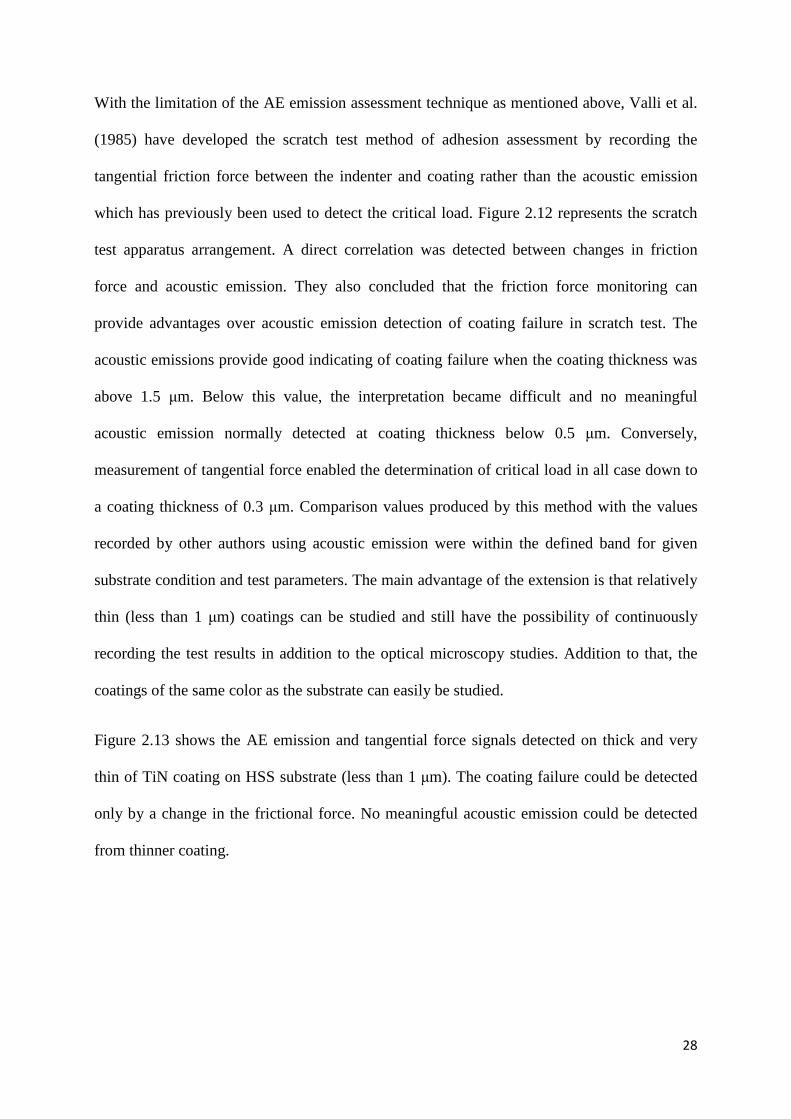
With the limitation of the AE emission assessment technique as mentioned above, Valli et al.
(1985) have developed the scratch test method of adhesion assessment by recording the
tangential friction force between the indenter and coating rather than the acoustic emission
which has previously been used to detect the critical load. Figure 2.12 represents the scratch
test apparatus arrangement. A direct correlation was detected between changes in friction
force and acoustic emission. They also concluded that the friction force monitoring can
provide advantages over acoustic emission detection of coating failure in scratch test. The
acoustic emissions provide good indicating of coating failure when the coating thickness was
above 1.5 µm. Below this value, the interpretation became difficult and no meaningful
acoustic emission normally detected at coating thickness below 0.5 µm. Conversely,
measurement of tangential force enabled the determination of critical load in all case down to
a coating thickness of 0.3 µm. Comparison values produced by this method with the values
recorded by other authors using acoustic emission were within the defined band for given
substrate condition and test parameters. The main advantage of the extension is that relatively
thin (less than 1 µm) coatings can be studied and still have the possibility of continuously
recording the test results in addition to the optical microscopy studies. Addition to that, the
coatings of the same color as the substrate can easily be studied.
Figure 2.13 shows the AE emission and tangential force signals detected on thick and very
thin of TiN coating on HSS substrate (less than 1 µm). The coating failure could be detected
only by a change in the frictional force. No meaningful acoustic emission could be detected
from thinner coating.

29
Figure 2.12: Schematic representation of scratch test apparatus used by Valli et al. (1985).
Figure 2.13: Acoustic and tangential friction force results obtained from scratch test of
titanium nitride (TiN) coating on high speed steel substrate. (a) thick coating (b) thinner
coating (Valli et al., 1985).

30
2.3.4 Energy description model
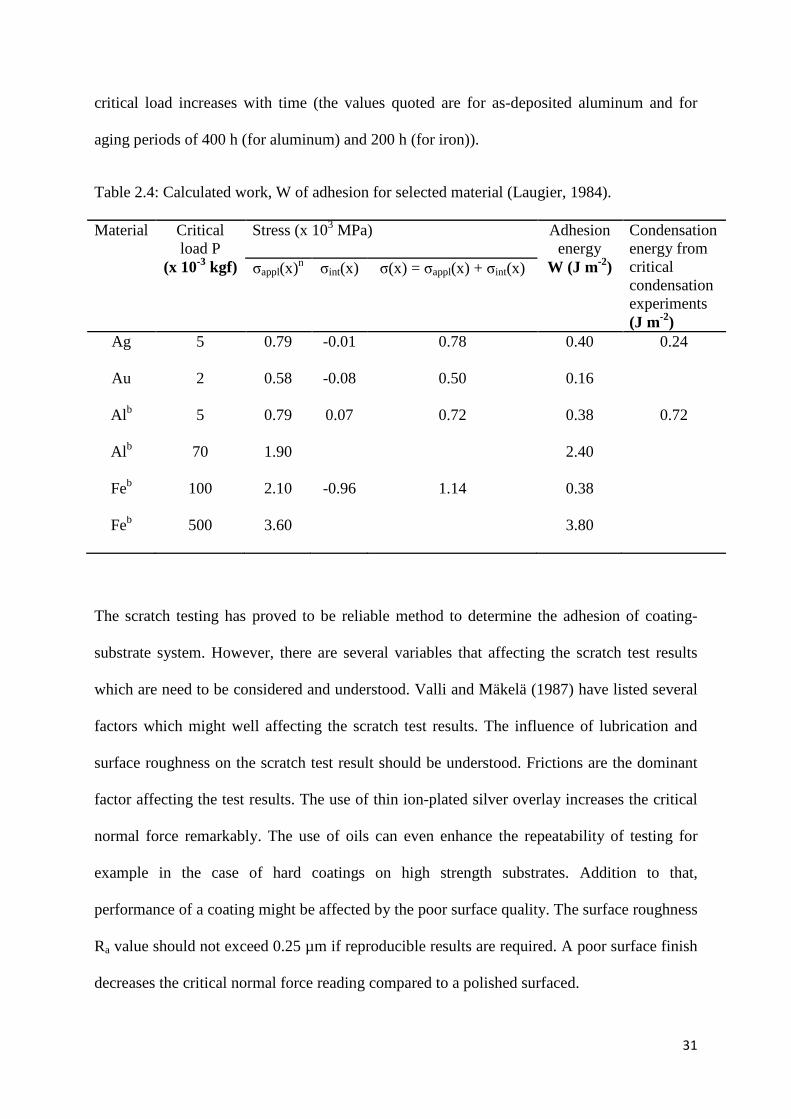
Another technique of scratch test assessment has been suggested by Laugier (1984). He has
introduced an energy description model of coating removal by scratch test. He suggested that
the adhesion behavior can be modeled in terms of the strain energy released during removal
of coating. In the model, the compressively stressed coating in the region ahead of the
indenter is considered to reduce its stored energy by peeling or spalling from the substrate at a
critical applied load. The approach is applicable to ductile and brittle coatings. The adhesion
force calculated from the basic scratch test typically in an order of magnitude lower than
estimate based on condensation energy measurement.
He suggested a simple energy balance criterion in which stored elastic energy in the coating
ahead of the indenter is considered to be released to form new surfaces when the critical
normal load is reached. Table 4 summarized the calculated work, W of adhesion for selected
material using the formula by Laugier (1984).
% = �&'()*+�# ℎ
where, E is the young`s modulus of the coating, h is the coating thickness and σ(x) is the
stress in the coating, which is considered to be constant throughout the thickness. The coating
stress, σ(x) is calculated from σ(x) = σappl(x) + σint(x), where σappl(x) is the applied stress and
σint(x) is the internal stress. The internal stress, σint(x) is found to be almost constant in all
materials. The applied stress, σappl(x) resulting from the sliding indenter is not decrease
significantly throughout the coating thickness if a > h, where a is the radius of contact circle
and h is the coating thickness.
From Table 2.4, the applied stress, σappl(x) has been used for the calculation of W when σint(x)
is not available. The values of σappl(x) have been calculated for f = 0.3. It is also noted that the
(2.2)
31
critical load increases with time (the values quoted are for as-deposited aluminum and for
aging periods of 400 h (for aluminum) and 200 h (for iron)).
Table 2.4: Calculated work, W of adhesion for selected material (Laugier, 1984).
Material Critical load P
(x 10-3 kgf)
Stress (x 103 MPa) Adhesion energy
W (J m-2)
Condensation energy from critical condensation experiments (J m-2)
σappl(x)n σint(x) σ(x) = σappl(x) + σint(x)
Ag 5 0.79 -0.01 0.78 0.40 0.24
Au 2 0.58 -0.08 0.50 0.16
Al b 5 0.79 0.07 0.72 0.38 0.72
Al b 70 1.90 2.40
Feb 100 2.10 -0.96 1.14 0.38
Feb 500 3.60 3.80
The scratch testing has proved to be reliable method to determine the adhesion of coating-
substrate system. However, there are several variables that affecting the scratch test results
which are need to be considered and understood. Valli and Mäkelä (1987) have listed several
factors which might well affecting the scratch test results. The influence of lubrication and
surface roughness on the scratch test result should be understood. Frictions are the dominant
factor affecting the test results. The use of thin ion-plated silver overlay increases the critical
normal force remarkably. The use of oils can even enhance the repeatability of testing for
example in the case of hard coatings on high strength substrates. Addition to that,
performance of a coating might be affected by the poor surface quality. The surface roughness
Ra value should not exceed 0.25 µm if reproducible results are required. A poor surface finish
decreases the critical normal force reading compared to a polished surfaced.
32
In addition to the extrinsic factors listed above, a number of intrinsic parameters also have an
importance influence on the derived value of critical loads. Some of the parameters are
loading rate, scratching speed, indenter tip radius and indenter wear which have been
reviewed by Steinmann et al. (1987).
The scratch adhesion test appears to be the only available practical methods to study the
adhesion of coatings. However, care is needed in performing the test and in the interpretation
of the results if reliable results are to be drawn on coating-substrate adhesions. The intrinsic
and extrinsic factors must be given full attention of their influence on the value of the critical
loads. Although scratch test is very quick test and simple to perform, an underestimate of the
practical adhesion in any application can still be occurs for example in the case where
catastrophic failure occurs at the first sufficiently large flaw.
2.4 Improvement of TiN adhesion strength
The improvements on the adhesion strengths of TiN coating are needed due to tribology
nature of the tooling applications. TiN coatings are proved to be useful in providing better
wear resistance and hence improving the tool life of the cutting tools. Good adhesion strength
are required for desired properties to be achieved. In tooling applications, current
development in TiN coating technology focusing on the lower temperature processes and
good adhesion strengths between coatings and substrates. However, lower deposition process
temperature tend to produce lower adhesion. The adhesion strengths of TiN coating can be
enhanced by method of processing, composition and the stucture of the coatings.
In order to enhance the adhesion strength of TiN coating, new methods of coating deposition
have been introduced by other reseacher. PVD methods are more prefered in toolong
applications due to environmental reasons, greater productivity and the possibility of multiple
coatings. Thus, previous researchers have been working on the deposition processes that
33
operate at low processing temperature but at the same time provide better adhesion. Plasma-
enhanced chemical vapor deposition (PECVD) or plasma assisted chemical vapor deposition
(PACVD) is a combinatation of CVD and PVD process (zhang & zhu, 1993). The working
principle of PECVD is that the CVD is operated with a plasma and the energy required for
reaction being supplied by electricity, raising the ions to high temperature and thus reducing
the need of thermal energy to be supplied. Hence, high working temperature are no longer
required. The advantages of this deposition process beside the low operating temperature are
the simplicity of the apparatus and good adhesion strength of the coatings.
Modification of the composition of the TiN coating is another solutions to the adhesion
strength and property improvement of TiN coatings. Wang et al. (1995) studied the effects of
aluminum (Al) inclusion on the microstructure and properties of (Ti,AL)N coating on high
speed steel (HSS). Analysis on the interface microsturcture between coating and substrate
showed that there was a transition layer between the (Ti,Al)N and the HSS substrate. The
treansition layer was composed of α-Ti phase and FeTi phase. The α-Ti phase was formed at
the beginning of deposition when Ti was first deposited on the surface of the substrate. The
FeTi phase was formed when the α-Ti phase diffused into the substrate with increasing
substrate temperature. The presents of these transition phase was believed to increase the
adhesion between coating and substrate. It is also observed that the wear of the substrate in
the form of adhesion abrasion also improved with (Ti,Al)N coating. The aluminium atoms are
small (r = 1.43A. ), thus, it has ability to fit into the TiN cystal structure at substitutional sites
or interstitial sites. As a results, more denser coating structure can be achieved.
In structure of the coatings, TiN adhesion strength can be improved by introducing a metallic
interlayer such as Ti between the TiN coating and the substrate. Helmersson et al. (1985)
reported on the adhesion of the films increased with the use of an intermediate layer of pure
titanium between TiN coating and substrates. The use of 0.1µm intermediate layer of pure

34
titanium increases the adhesion for films deposited at temperatures below 400 °C. Above this
temperature a thin TiC layer is formed in the titanium–steel interface result in reduction of the
adhesion. In contrast with Helmersson et al. findings, Valli et al. (1985) reported on the
decrease of the coating adhesion when 0.3 µm Ti interlayer deposited between TiN and HSS
substrate. The different in observations might indicate that an optimum should be determined
for such interlayers for maximum adhesion. Gerth and Wiklund (2008) also performed a study
on the improvement of TiN adhesion strength by analyzing metallic coating as interlayer. In
their study, W, Mo, Nb, Cr, Ti, Ag and Al, have been evaluated with respect to their influence
on the adhesion of PVD TiN coatings deposited onto polished high-speed steel. The results
showed that Tin coating with Ti and Cr interlayers both give the best adhesion compared to
other metallic interlayers.
The adhesion strength improvement with the presence of Ti interlayer can be explained on the
basis of better bonding between the titanium interlayer and the substrate and also better
bonding between the titanium layer and the TiN coating. It is suggested by some researcher
that the Ti interlayer acts as a graded interface that can evades the abrupt change in
composition at the sharp interface between a coating and metal substrate.
There is also possibility of adhesion strength enhancement by using multi-compositional
coatings has been done by Kusano et al. (1998b). In their assay, the adhesion of compositional
gradient TiO2/Ti/TiN, ZrO2/Zr/ZrN, and TiO2/Ti/Zr/ZrN coatings were studied. Figure 2.14
shows the adhesion strength of TiO2, TiN, TiO2/TiN, TiO2/Ti/TiN and TiO2-Ti-TiN coating
deposited at room temperature, 3000C and 4000C. The results showed that the adhesion
strength of TiN coating deposited at room temperature were increases with the present of
TiO2/Ti layer (TiO2/Ti/TiN coatings). At substrate temperature 3000C and 4000C, TiO2
/Ti/TiN and TiO2/TiN shows a good adhesion strengths while TiO2/Ti/TiN coatings show
superior adhesion compared to TiN coating at substrate temperature of 4000C. The good

35
adhesion strength observed can be explained by the basis that by making a compositional
change in the interface transition region gradient and smooth, both chemical and mechanical
bonding are expected to be improved.
Figure 2.14: Adhesion strength of TiO2, TiN, TiO2/TiN, TiO2/Ti/TiN and TiO2-Ti-TiN
coating deposited at room temperature, 3000C and 4000C.(Kusano et al., 1998b).
36
CHAPTER 3
METHODOLOGY
3.0 Overview
In the present study, two-interesting sets of studies were conducted separately. The first part is
to analyze the adhesion strength and hardness of Ti/TiO2/TiN coating deposited onto high
speed steel substrate and stainless steel substrate. The second part of the study is to analyze
the effect of substrate temperature, TiO2 coating thickness and the substrate surface condition
on the adhesion strength. The effects of annealing on the coating adhesion strength were also
studied. Details of target preparation, substrates preparation, experimental parameters,
characterization and evaluation of coated samples are detailed in the following sections.
3.1 Target preparation
A commercially available titanium target (purity 99.995%), 4 inch diameter x 3 mm
thickness, was used in this study. The target was ultrasonically clean in acetone for 20
minutes while being heated at 500C at the same time in ultrasonic bath to remove dirt, grease
and residues from machining processes. It was then rinsed in ethanol and distilled water to
ensure that the target was free from surface contaminants and acetone residues. After cleaning
process, the titanium target was sputtered in an argon atmosphere for an hour in order to
remove oxide layers.
37
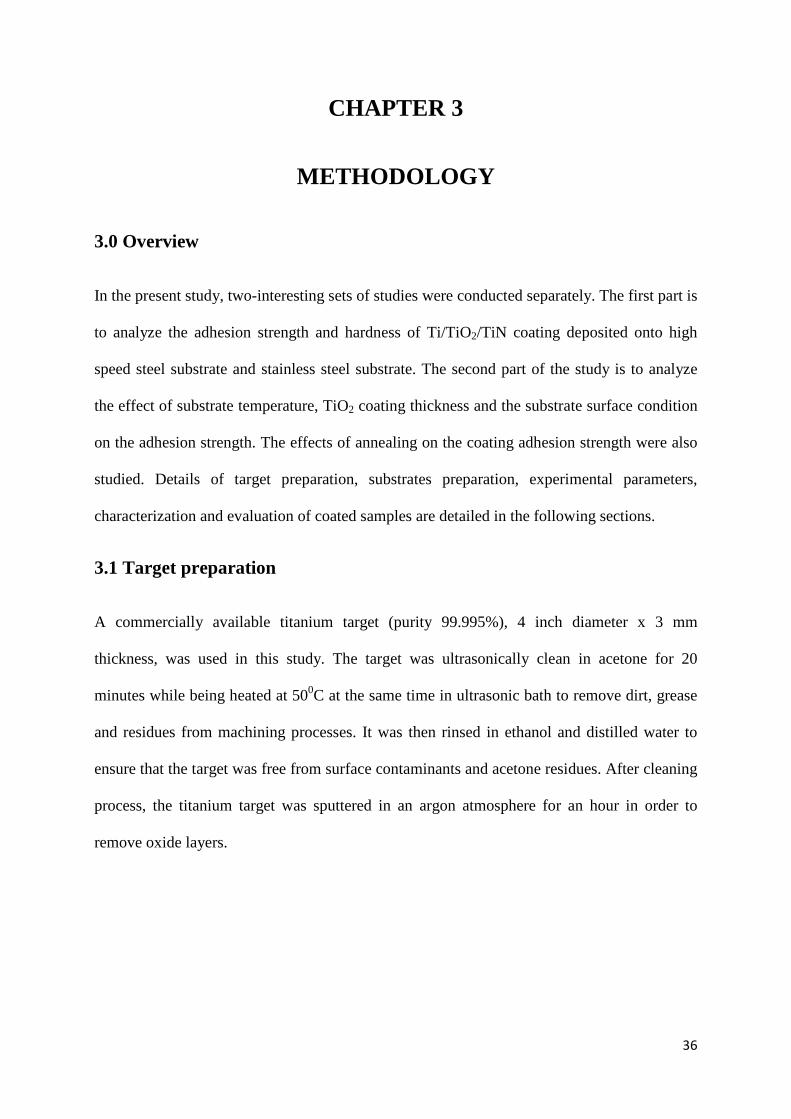
Figure 3.1: Titanium target used during deposition.
3.2 Substrate preparation
Two types of substrate materials were used in the experiments. The coatings were deposited
onto high speed steel (HSS) and stainless steel (SS) substrates. The HSS substrates used are
10 x 10 x 5 mm in dimension. Stainless steel substrates used were coupon shape SUS304
Stainless Steel with dimension 10mm (diameter) x 3mm (thickness) and clockwise polished
supplied by NovaScientific Resource (M) Sdn. Bhd.
Both type of substrates were abraded and polished using silica paper. The mean surface
roughness was measured at Ra = 0.02 µm and Ra = 0.03 µm for HSS and SS respectively. The
substrate materials were ultrasonically cleaned at 50 °C in acetone for 25 minutes to remove
residues followed by rinsing in ethanol to remove acetone and the remaining residues from
substrates. Eventually, the substrates were then rinsed with distilled water. Finally, the
substrates are dry by blowing dry nitrogen. Prior to deposition, both substrates were framed to

38
provide the formation of step in the coating for the purpose of the film thickness
measurement.
Figure 3.2: Substrates used in the analysis (a) On the left SS and; (b) On the right HSS.
3.3 Deposition process
The depositions of Ti/TiO2/TiN coating were performed using a TF450 PVD magnetron
sputtering system (SG Control Engineering PTE LTD, Singapore). Titanium, Ti layer was
first deposited onto substrates followed by Titanium dioxide, TiO2 layer and thin layer of
Titanium nitride, TiN (see Figure 3.3 for coating layer orientation).
Figure 3.3: Schematic view of TiN/TiO2/Ti coating system.
The Ti target was placed in parallel to substrate holder. The distance from the target to
substrate holder was about 150 mm. A schematic diagram of the positioning of the target and
the substrates during sputtering process is shown in Figure 3.4.
Substrate
Coating layers
TiN
TiO2 Ti

39
Figure 3.4: Schematic diagram of the positioning of the target and substrates during sputtering
process (a) Front view of the sputtering chamber and (b) Top view of the sputtering chamber.

40
With the shutter closed, the process was initiated by pre-sputtering the Ti target for 5 minutes
to clean and remove any contaminant from the target. The substrate holder was set to rotate at
4 rpm to ensure uniform deposition.
The coating layers were deposited using DC magnetron sputtering method. The deposition
apparatus used is shown in Figure 3.5. The deposit system is stainless-steel vacuum chamber.
The base pressure in process chamber was 2.5 x 10⁻⁵ Torr. The working gasses were Ar
(99.999%), O2 (99.995%), and N2 (99.99%) and were used as sputtering and reactive gases
respectively. Titanium target (purity 99.995%) was used and powered by DC generator. Prior
to each deposition, the titanium target was pre-sputtered in an argon atmosphere in order to
remove oxide layers. The substrate holder was rotated during the deposition process to
improve coating uniformity.
Figure 3.5: TF450 PVD magnetron sputtering system (SG Control Engineering PTE LTD,
Singapore) equipped with Protec Instruments PC-500 Flow Controller (enlarge picture).
41
To isolate and to study every single interface and also to analyse the effect of TiO2 inclusion
on the adhesion strength of TiN coating system, it is necessary to prepare base samples; TiN
coating and Ti/TiN coating for comparison purposes. Table 3.1 summarised the experimental
conditions of the sputtering process. The parameters for depositing TiN, TiO2 and Ti coating
layer were chosen based on literature review (Bushroa et al., 2011; Carradò et al., 2010;
Nsongo and Gillet, 1995). For Ti coating, the sputtering was carried out at an argon pressure
of 4.9 x 10⁻³ Torr with argon flow rate of 40 sccm for 40 minutes in order to obtain coating
layer of 500 nm. For TiN and TiO2 coating layer, the deposition was carried out for 60
minutes respectively to obtain coating thickness of 100 – 200 nm. For deposition of TiN, the
ratio of argon and nitrogen gasses used was 3:2 (Ar:N2) and for TiO2, the ration of argon and
oxygen gasses was 5:1 (Ar:O2).
Table 3.1: Sputtering parameters and setting values.
Parameters TiN deposition TiO2 deposition Ti deposition Pre-sputtering 10 minutes 10 minutes 10 minutes Flow gas (sccm*) 14:8.4(Ar:N2) 40:8(Ar:O2) 40 (Ar) P(Torr) x 10-3 8.4 5.8 4.9 P (W) 150 150 150 Deposition temperature (0C) 200 200 200 Deposition time (s) 3600 3600 2400 *sccm = standard cubic centimetre per minute
3.3.1 The study of adhesion strength improvement of TiN coating by
implementing Ti and TiO2 as the interlayer.
In this study, 4 sets of coated samples were prepared separately as summarized in Table 3.2.
All coatings were deposited on high speed steel (HSS) and stainless steel (SS) substrates
respectively at deposition temperature of 200 0C. The sputtering process was done at 150 W
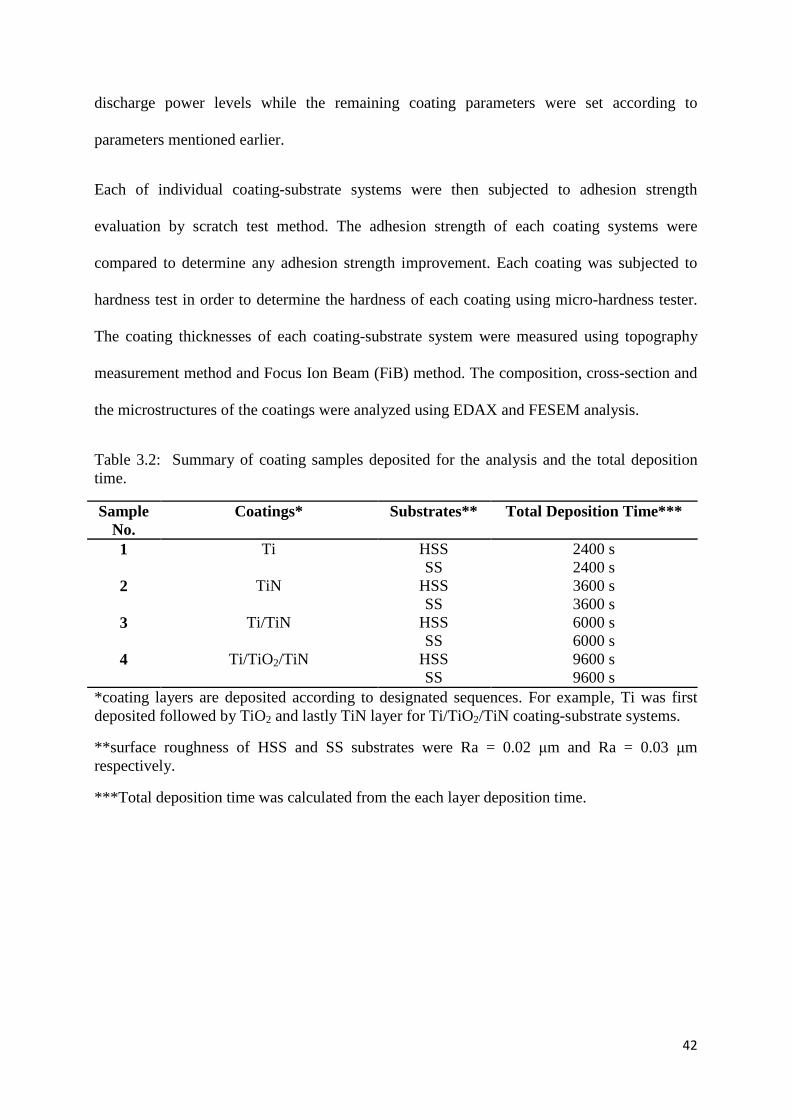
42
discharge power levels while the remaining coating parameters were set according to
parameters mentioned earlier.
Each of individual coating-substrate systems were then subjected to adhesion strength
evaluation by scratch test method. The adhesion strength of each coating systems were
compared to determine any adhesion strength improvement. Each coating was subjected to
hardness test in order to determine the hardness of each coating using micro-hardness tester.
The coating thicknesses of each coating-substrate system were measured using topography
measurement method and Focus Ion Beam (FiB) method. The composition, cross-section and
the microstructures of the coatings were analyzed using EDAX and FESEM analysis.
Table 3.2: Summary of coating samples deposited for the analysis and the total deposition time.
Sample No.
Coatings* Substrates** Total Deposition Time***
1 Ti HSS 2400 s SS 2400 s
2 TiN HSS 3600 s SS 3600 s
3 Ti/TiN HSS 6000 s SS 6000 s
4 Ti/TiO2/TiN HSS 9600 s SS 9600 s
*coating layers are deposited according to designated sequences. For example, Ti was first deposited followed by TiO2 and lastly TiN layer for Ti/TiO2/TiN coating-substrate systems.
**surface roughness of HSS and SS substrates were Ra = 0.02 µm and Ra = 0.03 µm respectively.
***Total deposition time was calculated from the each layer deposition time.

43
3.3.2 The effect of deposition temperature on the adhesion strength of
Ti/TiO2/TiN coatings.
To study the effect of substrate temperature on the adhesion of the coating systems, samples
with different substrate temperature are prepared while keeping the other parameters at same
values. The multilayer coating systems TiN/TiO2/Ti are deposited onto stainless steel and
HSS substrates at substrate temperature 50, 200 and 250 °C respectively. Scratch test and
hardness test were conducted on each sample.
3.3.3 The effect of TiO2 coating thickness on the adhesion strength of
Ti/TiO2/TiN coatings.
To study the effect of TiO2 coating thickness on the adhesion strength of the coating systems,
the thickness of the TiO2 coating layer was varied by varying the deposition time of TiO2
coating layer (see Table 3.3). 3 sets of sample were prepared with vary TiO2 coating layer
thickness at deposition temperature of 200 °C. Other parameters for deposition of TiN and Ti
and the coating thickness are kept constant. The coatings are deposited onto stainless steel and
HSS substrate.
Table 3.3: TiO2 deposition time for Ti/TiO2/TiN coatings deposited on HSS and SS substrates. Sample No.
Coatings Substrates TiO2 deposition time
1 Ti/TiO2/TiN HSS 1800 s SS
2 Ti/TiO2/TiN HSS 3600 s SS
3 Ti/TiO2/TiN HSS 5400 s SS

44
3.3.4 The effect of substrate surface condition on the adhesion strength of
Ti/TiO2/TiN coatings.
To study the effect of substrate surface condition on the adhesion strength of the coating
systems, different substrates with different surface roughness were used for coating
deposition. Different surface roughness values were achieved by using different grade of
silica paper during polishing process. Parameters for deposition of TiN, Ti and TiO2 coatings
are kept constant as in Table 3.1. Substrate used in this analysis was high speed steel (HSS).
Surface roughness of the substrate was summarized in Table 3.4.
Table 3.4: Surface roughness of HSS substrate used. No Sample Roughness (Ra)
Reading 1 (µm) Reading 2 (µm) Reading 3 (µm) Average (µm) 1 HSS-S1 0.02 0.03 0.03 0.03 2 HSS-S2 0.30 0.27 0.25 0.27 3 HSS-S3 1.13 1.21 1.25 1.20
3.3.5 The effect of annealing on the mechanical properties of the substrate
coating systems.
Three Ti/TiO2/TiN coated HSS substrates were put in the sputtering chamber. The sputtering
process was done at deposition temperature 200 °C at 150 W discharge power levels while the
remaining coating parameters were kept constant as in Table 3.1. The deposited substrates
were heated to 400, 500 and 600 °C annealed temperatures at heating rate of 7.5 °C/min. Each
substrate was annealed for an hour. The heating process was performed using Elite Thermal
System Limited chamber furnace. Figure 3.6 shows the heating curve for each substrate at
different anneal temperature.

45
The heat treated and unheated HSS substrates were then subjected to adhesion strength
evaluation and hardness test. The microstructures of the annealed samples were observed
using optical microscope.
Figure 3.6: Heat treatment curve during annealing treatment of deposited substrate.
3.4 Evaluation and characterization
3.4.1 Film thickness
The film thickness of the coating films on the HSS and SS substrates were measured using a
Micro Material Nano Test (Wrexam, UK) micro-scratch system with a diamond probe and
also using Focused Ion Beams (FiB) technique.
To measure the film thickness using micro-scratch system, each coating layer was deposited
individually onto HSS substrate in order to evaluate each coating layer. Before deposition,
tape was attached on the substrate surface to create framed surface in order to evaluate the
coating thickness (see Figure 3.7).
Time (min) 60 min
Anneal Temp. (400 °C, 500 °C, 600 °C)

46
Figure 3.7: HSS coated sample for coating thickness evaluation.
Three HSS substrates with polished surface were used with Ti, TiO2 and TiN coatings
deposited on each substrate. Figure 3.8 shows the set-up of a micro-scratch system while
Figure 3.9 is the schematic diagram.
Figure 3.8: An image of a micro-scratch system.
Framed surface (Un-coated)
Coated surface
Indenter
Sample
Sample stage
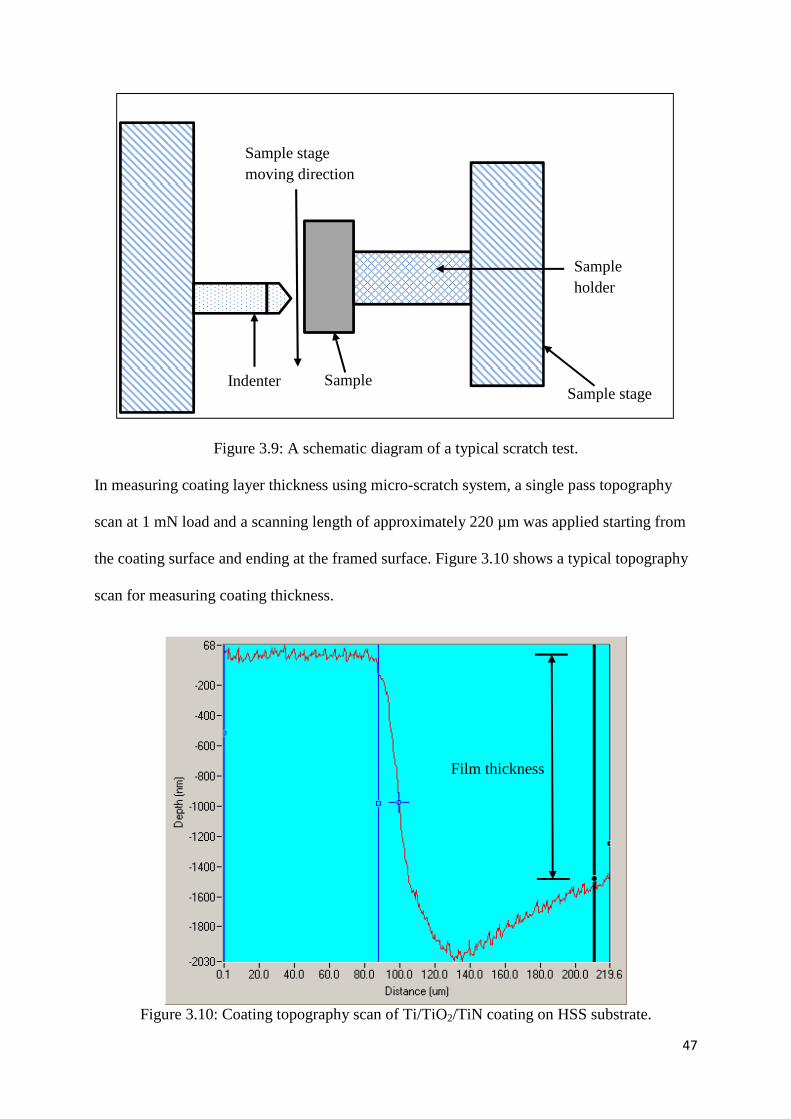
47
Figure 3.9: A schematic diagram of a typical scratch test.
In measuring coating layer thickness using micro-scratch system, a single pass topography
scan at 1 mN load and a scanning length of approximately 220 µm was applied starting from
the coating surface and ending at the framed surface. Figure 3.10 shows a typical topography
scan for measuring coating thickness.
Figure 3.10: Coating topography scan of Ti/TiO2/TiN coating on HSS substrate.
Sample stage moving direction
Indenter Sample
Sample holder
Sample stage
Film thickness
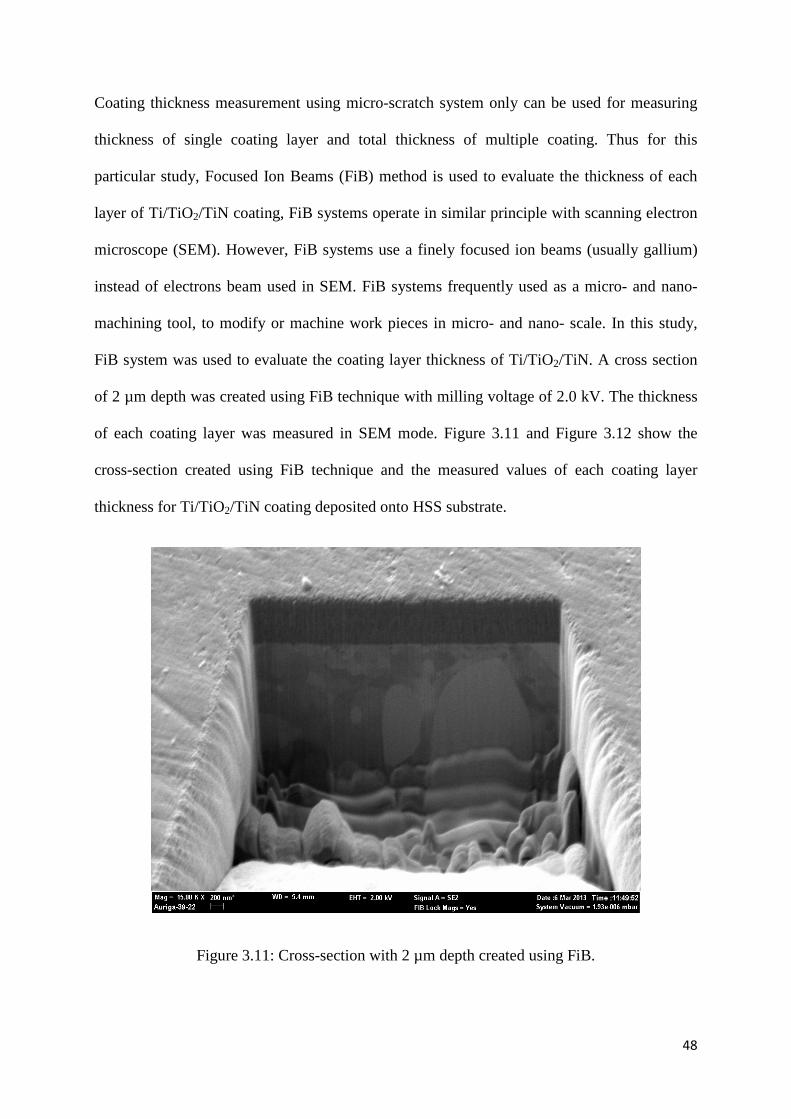
48
Coating thickness measurement using micro-scratch system only can be used for measuring
thickness of single coating layer and total thickness of multiple coating. Thus for this
particular study, Focused Ion Beams (FiB) method is used to evaluate the thickness of each
layer of Ti/TiO2/TiN coating, FiB systems operate in similar principle with scanning electron
microscope (SEM). However, FiB systems use a finely focused ion beams (usually gallium)
instead of electrons beam used in SEM. FiB systems frequently used as a micro- and nano-
machining tool, to modify or machine work pieces in micro- and nano- scale. In this study,
FiB system was used to evaluate the coating layer thickness of Ti/TiO2/TiN. A cross section
of 2 µm depth was created using FiB technique with milling voltage of 2.0 kV. The thickness
of each coating layer was measured in SEM mode. Figure 3.11 and Figure 3.12 show the
cross-section created using FiB technique and the measured values of each coating layer
thickness for Ti/TiO2/TiN coating deposited onto HSS substrate.
Figure 3.11: Cross-section with 2 µm depth created using FiB.

49
Figure 3.12: Measured values of coating layer thickness of Ti/TiO2/TiN coatings.
3.4.2 Adhesion strength evaluation
To evaluate the adhesion of coatings on HSS and SS substrates, the scratch test been used. In
this method a loaded spherical tip is drawn across the coating surface. The load is increased
step by step until coating failure occurs. The minimum load at which adhesive failure occurs
(critical load) is taken as a measure of the film adhesion.
In this work, Micro Material Nano Test (Wrexam, UK) micro-scratch system with a diamond
probe been used. Multi-pass wear experiment was performed on each sample to evaluate
topography of the coating before scratch, during scratch and after scratching. Each sample
were scratch at least 3 times using a scan speed, scanning length, loading rate and maximum
load of 2 µm/sec, 900 µm, 4.0 mN/sec and 1500 mN, respectively. The critical load was
recorded when a sign of failure either cohesion or adhesion was detected. The scratch paths
were then analyzed using optical microscope to conform the present of failure. Figure 3.13
(b)
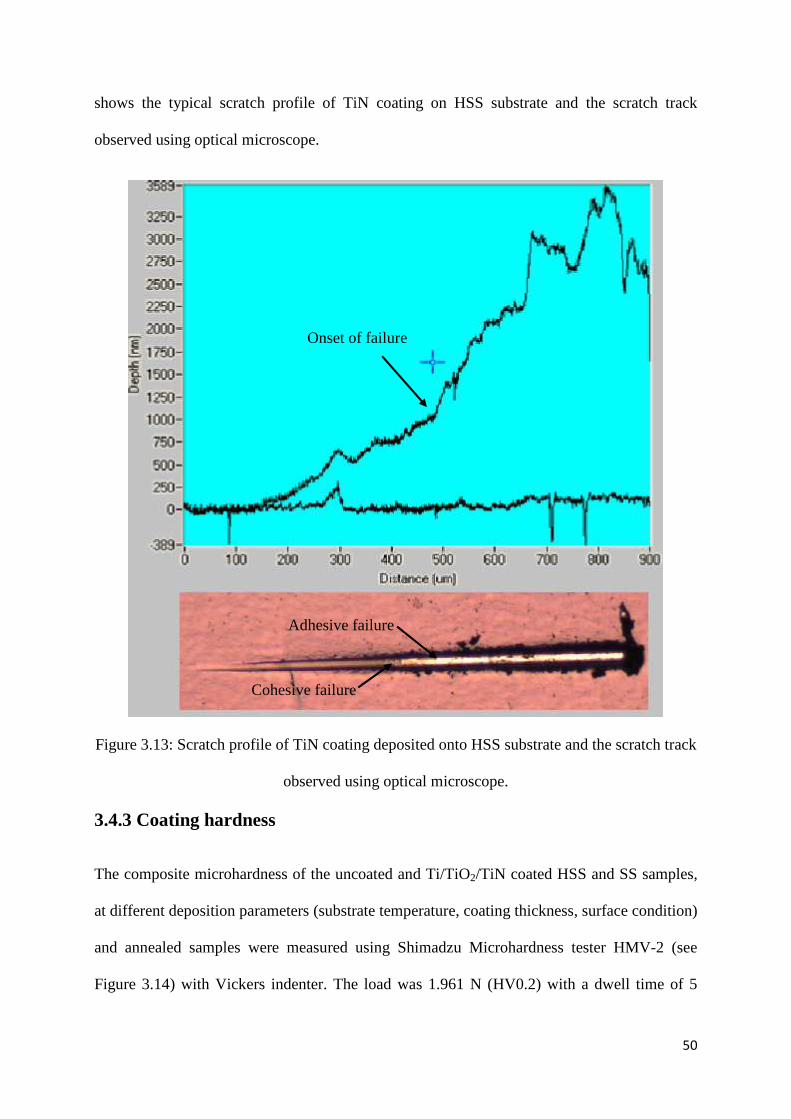
50
shows the typical scratch profile of TiN coating on HSS substrate and the scratch track
observed using optical microscope.
Figure 3.13: Scratch profile of TiN coating deposited onto HSS substrate and the scratch track
observed using optical microscope.
3.4.3 Coating hardness
The composite microhardness of the uncoated and Ti/TiO2/TiN coated HSS and SS samples,
at different deposition parameters (substrate temperature, coating thickness, surface condition)
and annealed samples were measured using Shimadzu Microhardness tester HMV-2 (see
Figure 3.14) with Vickers indenter. The load was 1.961 N (HV0.2) with a dwell time of 5
Onset of failure
Cohesive failure
Adhesive failure

51
seconds. The hardness of each samples were measured at least three times and the average
hardness values were calculated. The hardness values of coated samples were then compared
with uncoated samples to conclude any discrepancies.
Figure 3.14: (a) Shimadzu Microhardness tester HMV-2; (b) Indentation image using Vickers
indenter at 1.961 N (HV0.2) on HSS substrate.
3.4.4 Morphology and chemical composition evaluation
Surface morphologies of the coated samples were investigated using a field emission scanning
electron microscope (FESEM) Auriga Zeiss. The chemical compositions of the coatings were
assessed using SEM XL40 EDAX analysis, three spots in each sample. The hardness of the
coated and uncoated samples was measured using Shimadzu HMV-2 Micro-hardness tester.
In order to check the crystallinity of the as-deposited coatings, X-ray diffraction (XRD)
analysis was carried out with a Empyrean PANalytical diffractometer using Cu Kα1
52
(0.154060 nm) radiation at 40 mA and 45 kV. The coatings were scanned in the standard
0 − 20 geometry from 20 to 120 with a 0.0260 step size. Surface image after scratch test
were analyzed using a light optical microscope to the scratch pattern of coated samples.
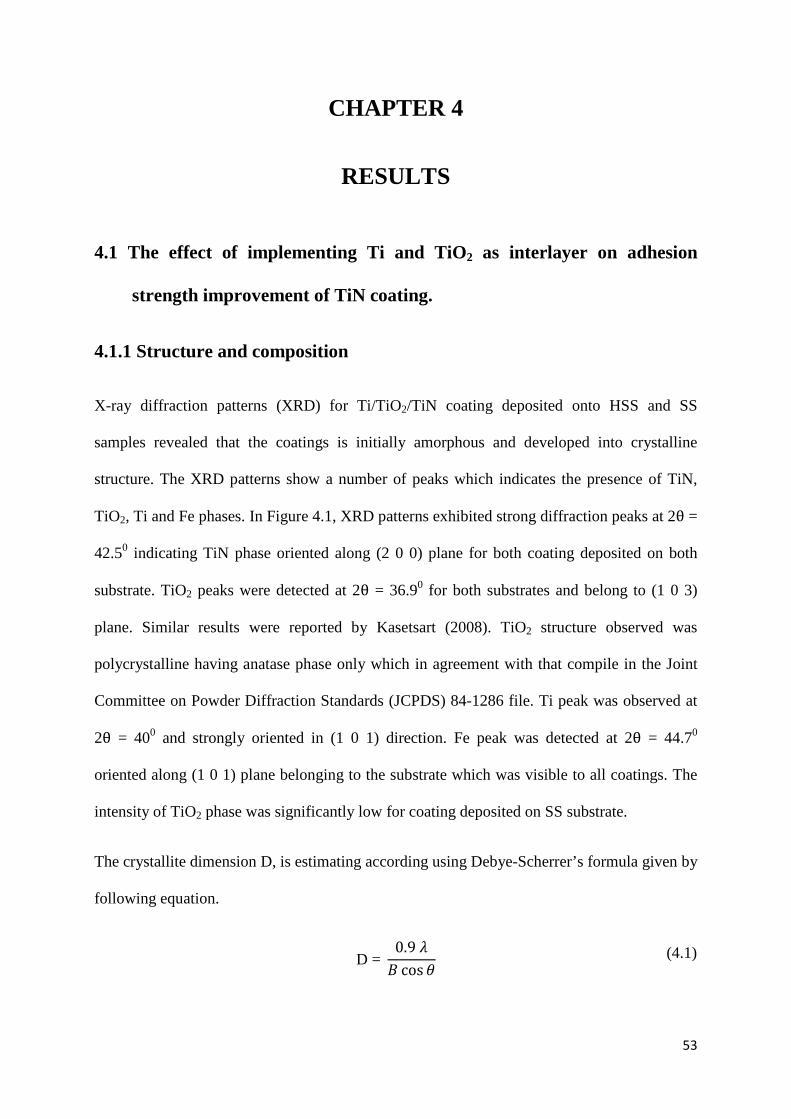
53
CHAPTER 4
RESULTS
4.1 The effect of implementing Ti and TiO2 as interlayer on adhesion
strength improvement of TiN coating.
4.1.1 Structure and composition
X-ray diffraction patterns (XRD) for Ti/TiO2/TiN coating deposited onto HSS and SS
samples revealed that the coatings is initially amorphous and developed into crystalline
structure. The XRD patterns show a number of peaks which indicates the presence of TiN,
TiO2, Ti and Fe phases. In Figure 4.1, XRD patterns exhibited strong diffraction peaks at 2θ =
42.50 indicating TiN phase oriented along (2 0 0) plane for both coating deposited on both
substrate. TiO2 peaks were detected at 2θ = 36.90 for both substrates and belong to (1 0 3)
plane. Similar results were reported by Kasetsart (2008). TiO2 structure observed was
polycrystalline having anatase phase only which in agreement with that compile in the Joint
Committee on Powder Diffraction Standards (JCPDS) 84-1286 file. Ti peak was observed at
2θ = 400 and strongly oriented in (1 0 1) direction. Fe peak was detected at 2θ = 44.70
oriented along (1 0 1) plane belonging to the substrate which was visible to all coatings. The
intensity of TiO2 phase was significantly low for coating deposited on SS substrate.
The crystallite dimension D, is estimating according using Debye-Scherrer’s formula given by
following equation.
D = 0.967 cos 0 (4.1)
54
Where λ is the X-ray (K;�) wavelength (6 = 1.5406?@*, 0 is the Bragg diffraction angle
and B is the line width at half-maximum height (FWHM). The crystallite size obtained using
this formula is 16.3 nm for anatase TiO2, 28.8 nm for Ti and 38.7 nm for TiN.
Figure 4.1: X-ray diffraction pattern of Ti/TiO2/TiN samples deposited on HSS and SS substrates.
The present of Ti, TiO2 and TiN phase in Ti/TiO2/TiN coating systems were confirmed with
energy dispersive X-ray spectroscopy (EDX) analysis on HSS and SS samples. Figure 4.2 (a)
and (b) show the EDX spectrum of the coatings deposited on HSS and SS coatings. The
analysis revealed the coating samples are comprised of Titanium (Ti), Oxygen (O), Nitrogen
(N), Ferum , Manganese (Mn), Copper and Zinc (Zn). Fe, Mn, Cu and Zn are the contribution
from the substrates. Ti phase in both samples show higher intensity compared to nitrogen and
oxygen due to higher thickness of Ti coating layer. The traces of nitrogen and oxygen in the
analysis confirmed the present of TiN and TiO2 coating layer in the coating-substrate systems.

55
The composition of Ti, oxygen and nitrogen on the coated film for both substrates can be
summarized in Figure 4.3. For HSS coated substrate, the composition of coating films were
Titanium (17.02 At%), Nitrogen (51.84 At%) and Oxygen (8.91 At%) along with the traces of
Fe (20.3 At%). For SS coated substrate, the composition of coating films were Titanium
(16.25 At%), Nitrogen (37.88 At%) and Oxygen (16.2 At%) along with the traces of Fe
(25.58 At%).
Figure 4.2: EDX spectrum of Ti/TiO2/TiN coating deposited onto (a) HSS and; (b) SS substrates.
Inte
nsit
y (A
.U.)
(a)
Inte
nsit
y (A
.U.)
(b)
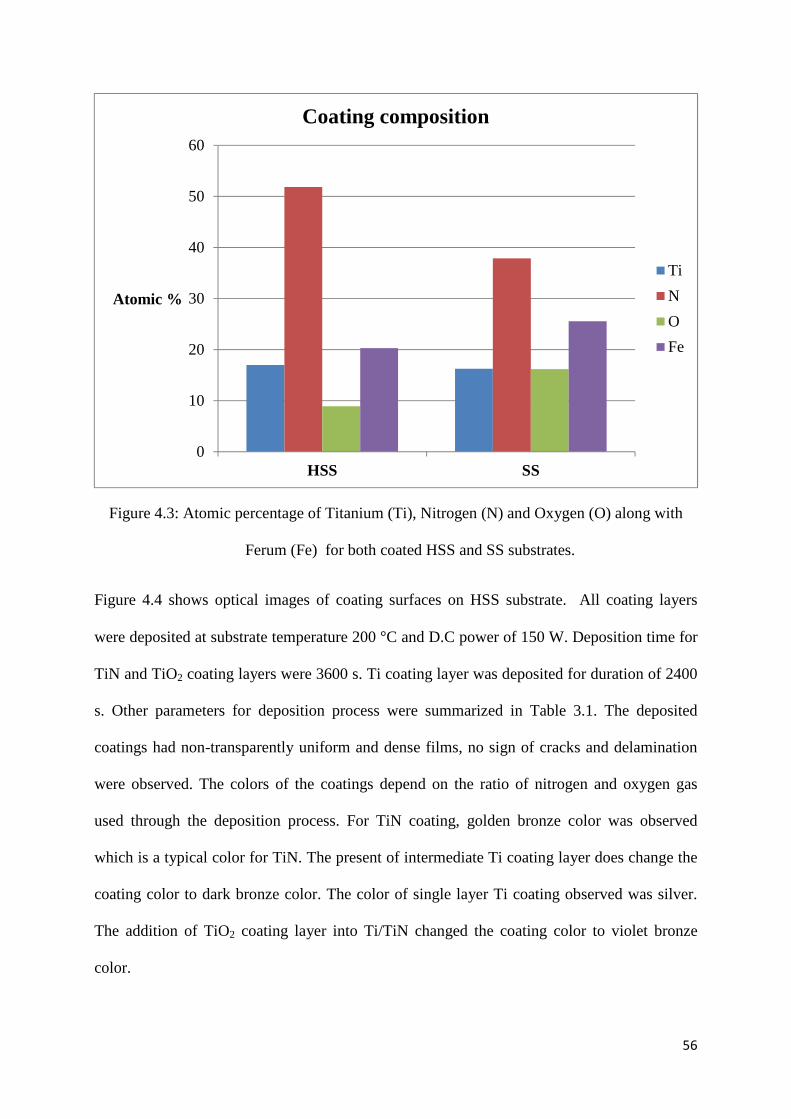
56
Figure 4.3: Atomic percentage of Titanium (Ti), Nitrogen (N) and Oxygen (O) along with
Ferum (Fe) for both coated HSS and SS substrates.
Figure 4.4 shows optical images of coating surfaces on HSS substrate. All coating layers
were deposited at substrate temperature 200 °C and D.C power of 150 W. Deposition time for
TiN and TiO2 coating layers were 3600 s. Ti coating layer was deposited for duration of 2400
s. Other parameters for deposition process were summarized in Table 3.1. The deposited
coatings had non-transparently uniform and dense films, no sign of cracks and delamination
were observed. The colors of the coatings depend on the ratio of nitrogen and oxygen gas
used through the deposition process. For TiN coating, golden bronze color was observed
which is a typical color for TiN. The present of intermediate Ti coating layer does change the
coating color to dark bronze color. The color of single layer Ti coating observed was silver.
The addition of TiO2 coating layer into Ti/TiN changed the coating color to violet bronze
color.
0
10
20
30
40
50
60
HSS SS
Atomic %
Coating composition
Ti
N
O
Fe

57
Similar optical microscope results were observed for coating deposited on SS substrate. The
coating also had non-transparently and dense film and no sign of cracks as well as
delamination observed. In terms of coating uniformity, coatings deposited on SS seem to be
varied in thickness. This may be due to rougher SS surface compared to HSS.
Figure 4.4: Optical microscope image of coating films deposited on high speed steel (HSS)
(a) TiN coating; (b) Ti/TiN coating and; (c) Ti/TiO2/TiN coating.
Figure 4.5 shows field emission scanning electron microscope (FESEM) images of
Ti/TiO2/TiN coatings on high speed steel (HSS) and stainless steel (SS) substrates. From the
figure, it can be observed that coatings were more uniformly distributed on HSS substrate as
compared to SS substrate. Figure 4.5 (a) and (b) show the microstructure (FESEM top view)
of Ti/TiO2/TiN coating on HSS substrate. It can be seen that the coating layer is made of
small grains of hexagonal crystallite of approximately 38.7 nm size which represent TiN
coating.
As shown in FESEM cross-section of Ti/TiO2/TiN coated samples (Figure 4.6), the complete
growth of coating-substrate system produced flakes that are overlapped, arranged as in
network which may contribute to enhancement of adhesion strength.
(a) (b) (c)

58
Figure 4.5: Field emission scanning electron microscope (FESEM) images of Ti/TiO2/TiN coatings on high speed steel (HSS) and stainless steel (SS) substrates at deposition
temperature of 2000C and DC power of 150 kW; (a) and (b) Ti/TiO2/TiN deposited onto HSS substrate and; (c) and (d) Ti/TiO2/TiN coatings deposited onto SS substrate.
Figure 4.6: FESEM cross section of Ti/TiO2/TiN coated HSS samples.
(a) (b)
(c) (d)
59
4.1.2 Film thickness, adhesion strength and coating hardness
The thickness of Ti/TiO2/TiN coatings was measured using micro-scratch system and focus
ion beam (FiB) method. Due to limitation of micro-scratch system in measuring each coating
layer thickness, FiB method was used to evaluate the each coating layers thickness. Micro-
scratch system was used to measure the total coating thickness for each coating-substrate
systems as summarized in Table 4.1. For single layer Ti coatings, the total thickness measured
was 511.15 nm and 532.25 nm for coated HSS and SS respectively. The result was confirmed
with FiB method (see Figure 4.7). The thickness of Ti coating layer found to be 504.7 nm.
The Ti coating deposition rate was 12.62 nm/min for deposition time of 2400 s, D.C power of
150 W and Argon (Ar) gas flow of 40 sccm. The Ti coating layer thickness was similar with
the Ti thickness found by Bushroa et al. (2011) for deposition Ti interlayer of Ti/TiSiN
coating system by D.C magnetron sputtering method at deposition time of 2400 s, D.C power
of 100 W and Ar gas flow of 40 sccm. The results obtained in this work suggested that the
increase of sputtering power from 100 W to 150 W has marginal effect on the deposition rate
of the coating.
The thickness of TiN coating measured by micro-scratch system was found to be 185.30 nm
and 178.45 nm for coated HSS and SS, respectively. The TiN coating thickness evaluated
using FiB method was 174.2 nm with the deposition rate of 2.90 nm/minute. The deposition
of TiN coating was done for duration of 3600 s, D.C power of 150 W and gas flow ratio of
14:8.4 (Ar:N2) sccm.
The thickness of TiO2 coating was measured as 165.2 nm using FiB method. The total
thickness of Ti/TiN coating system measured by micro-scratch system was found to be 712.10
nm and 686.20 nm for coated HSS and SS substrate, respectively. The total thickness of
Ti/TiO2/TiN coating was 852.50 nm and 825.45 nm for HSS and SS, respectively. The

60
deposition rate for each coating layers were calculated from the coating thickness and
deposition time. Deposition rate for TiO2 coating was 165.2 nm/min. The parameters used for
deposition and the coating thickness of Ti, TiN and TiO2 coating were summarized in Table
4.2.
Figure 4.7: FiB images of samples cross-section and coating thickness measured for (a) Ti
coating; (b) Ti/TiN coating and; (c) TiO2 coating.
Table 4.1: Total coating thickness measured from topography mode using micro-scratch system. Sample
No. Coatings* Substrates Total
Deposition Time Total thickness
(nm) 1 Ti HSS 2400 s 511.15 SS 2400 s 532.25
2 TiN HSS 3600 s 185.30 SS 3600 s 178.45
3 Ti/TiN HSS 6000 s 712.10 SS 6000 s 686.20
4 Ti/TiO2/TiN HSS 9600 s 852.50 SS 9600 s 825.45
(a) (b)
(c)
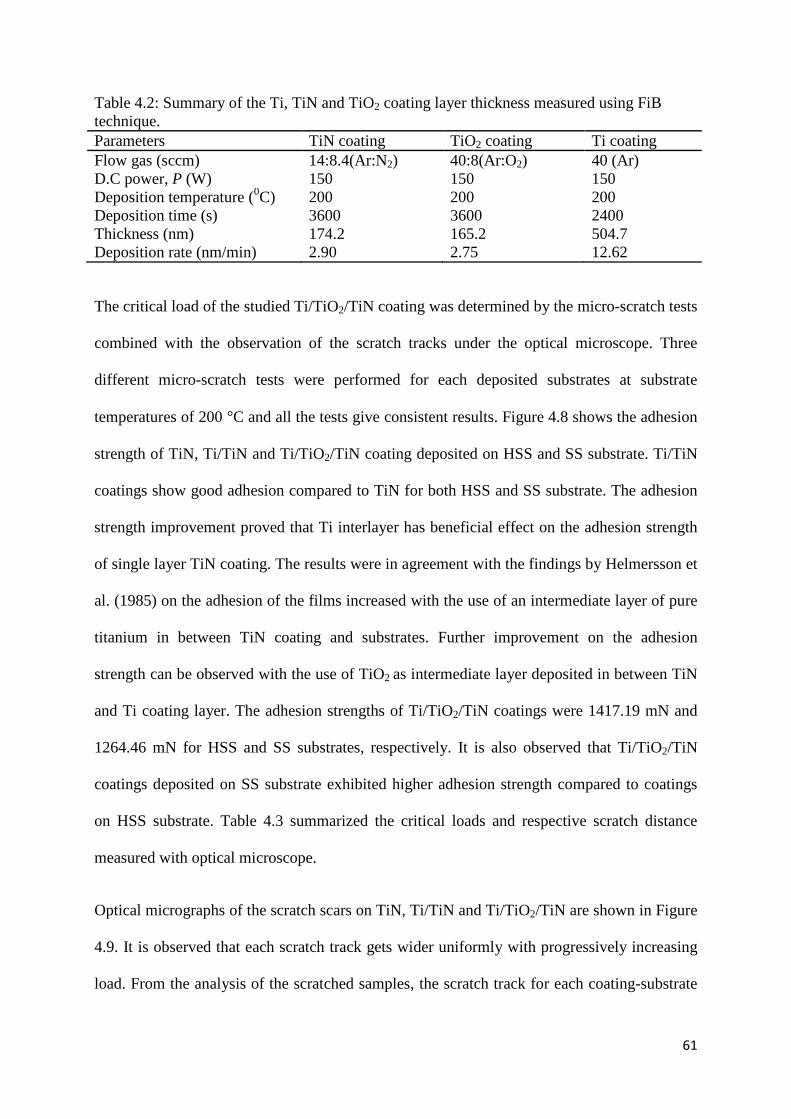
61
Table 4.2: Summary of the Ti, TiN and TiO2 coating layer thickness measured using FiB technique. Parameters TiN coating TiO2 coating Ti coating Flow gas (sccm) 14:8.4(Ar:N2) 40:8(Ar:O2) 40 (Ar) D.C power, P (W) 150 150 150 Deposition temperature (0C) 200 200 200 Deposition time (s) 3600 3600 2400 Thickness (nm) 174.2 165.2 504.7 Deposition rate (nm/min) 2.90 2.75 12.62
The critical load of the studied Ti/TiO2/TiN coating was determined by the micro-scratch tests
combined with the observation of the scratch tracks under the optical microscope. Three
different micro-scratch tests were performed for each deposited substrates at substrate
temperatures of 200 °C and all the tests give consistent results. Figure 4.8 shows the adhesion
strength of TiN, Ti/TiN and Ti/TiO2/TiN coating deposited on HSS and SS substrate. Ti/TiN
coatings show good adhesion compared to TiN for both HSS and SS substrate. The adhesion
strength improvement proved that Ti interlayer has beneficial effect on the adhesion strength
of single layer TiN coating. The results were in agreement with the findings by Helmersson et
al. (1985) on the adhesion of the films increased with the use of an intermediate layer of pure
titanium in between TiN coating and substrates. Further improvement on the adhesion
strength can be observed with the use of TiO2 as intermediate layer deposited in between TiN
and Ti coating layer. The adhesion strengths of Ti/TiO2/TiN coatings were 1417.19 mN and
1264.46 mN for HSS and SS substrates, respectively. It is also observed that Ti/TiO2/TiN
coatings deposited on SS substrate exhibited higher adhesion strength compared to coatings
on HSS substrate. Table 4.3 summarized the critical loads and respective scratch distance
measured with optical microscope.
Optical micrographs of the scratch scars on TiN, Ti/TiN and Ti/TiO2/TiN are shown in Figure
4.9. It is observed that each scratch track gets wider uniformly with progressively increasing
load. From the analysis of the scratched samples, the scratch track for each coating-substrate

62
systems revealed cohesive (coating is destroyed within the coating itself) and adhesive failure
(coating is removed from the substrate).
Figure 4.8: Adhesion strength of TiN, Ti/TiN and Ti/TiO2/TiN coatings deposited onto HSS
and SS at deposition temperature 2000C and D.C power of 150 W.
Table 4.3: Critical load values for TiN, Ti/TiN and Ti/TiO2/TiN as-deposited coatings.
No. Sample Name Substrate Coating Critical Load (mN)
Scratch distance (µm)
1 TiN-HSS HSS TiN 763.30 479.23 2 Ti/TiN-HSS HSS Ti/TiN 967.69 578.89 3 Ti/TiO2/TiN-HSS HSS Ti/TiO2/TiN 1417.19 797.92 4 TiN-SS SS TiN 662.21 420.50 5 Ti/TiN-SS SS Ti/TiN 879.94 533.70 6 Ti/TiO2/TiN-SS SS Ti/TiO2/TiN 1264.46 721.22
Figure 4.9 illustrates the coating failure for TiN, Ti/TiN and Ti/TiO2/TiN coating deposited
on HSS and SS substrates, respectively. From the figure, it is observed that the coatings
exhibit cohesive failure followed by complete delamination of the coating (adhesive failure).

63
The cohesive failure of a coating is mainly accompanied by partial conical cracks and some
debris at the side of the scratch tracks. The complete delamination of films is due to the
interfacial failure at the coating-substrate interface.
Figure 4.9: Scratch tracks of as-deposited coatings on HSS and SS substrates; (a) TiN-HSS
coatings; (b) Ti/TiN-HSS coatings; (c) Ti/TiO2/TiN-HSS coatings; (d) TiN-SS coatings; (e)
Ti/TiN-SS coatings and; (f) Ti/TiO2/TiN-SS coatings.
Figure 4.10 shows scratch track of as-deposited Ti/TiN/TiO2 coatings on HSS and SS
substrates. It can be seen from figure, both coated substrates undergone similar mechanism of
failure. As the normal load increases, parallel cracks starting to occur followed by
semicircular cracks. As normal load increases further, external transverse cracks and coating
chipping were observed. Prior to complete removal of coating (adhesive failure), coating
spalling was developed. Figure 4.11 shows the schematic illustration of coating failure
observed during scratch test on Ti/TiO2/TiN coating deposited onto HSS and SS substrate.
(a)
(b)
(c)
(d)
(e)
(f)
64
Figure 4.10: Scratch tracks of as-deposited Ti/TiN/TiO2 on HSS and SS substrates at higher
magnification; (a) Ti/TiO2/TiN on HSS and; (b) Ti/TiO2/TiN on SS substrate.
Figure 4.11: Schematic illustration of coating failures observed during scratch testing of
Ti/TiO2/TiN coatings on HSS and SS substrate.
The hardness of TiN, Ti/TiN, Ti/TiO2/TiN coatings and the substrate are shown in Figure
4.12. For HSS substrate, single layer TiN coating and Ti/TiN coating show high hardness
compared to the substrate. The highest hardness of 2790 MPa was obtained for single layer
(a) (b)

65
TiN coating. A slight decrease in hardness value was observed for Ti/TiN coatings. The
hardness value obtained for Ti/TiO2/TiN coating was 2628 MPa which is lower than TiN
coating.
For SS substrate, the hardness value for Ti/TiO2/TiN and TiN coating were 3401 MPa and
3464 MPa, respectively. A significant decrease in hardness value was observed for Ti/TiN
coating. The hardness value for Ti/TiN coating was 3164 MPa. The results show that the
inclusion of Ti and TiO2 interlayer coating deposited at 200 °C does not improve the hardness
of TiN coating-substrate systems.
Figure 4.12: Hardness values of HSS and SS substrates and composite hardness of coating
deposited at deposition temperature of 200 °C measured using Shimadzu Microhardness tester
HMV2.
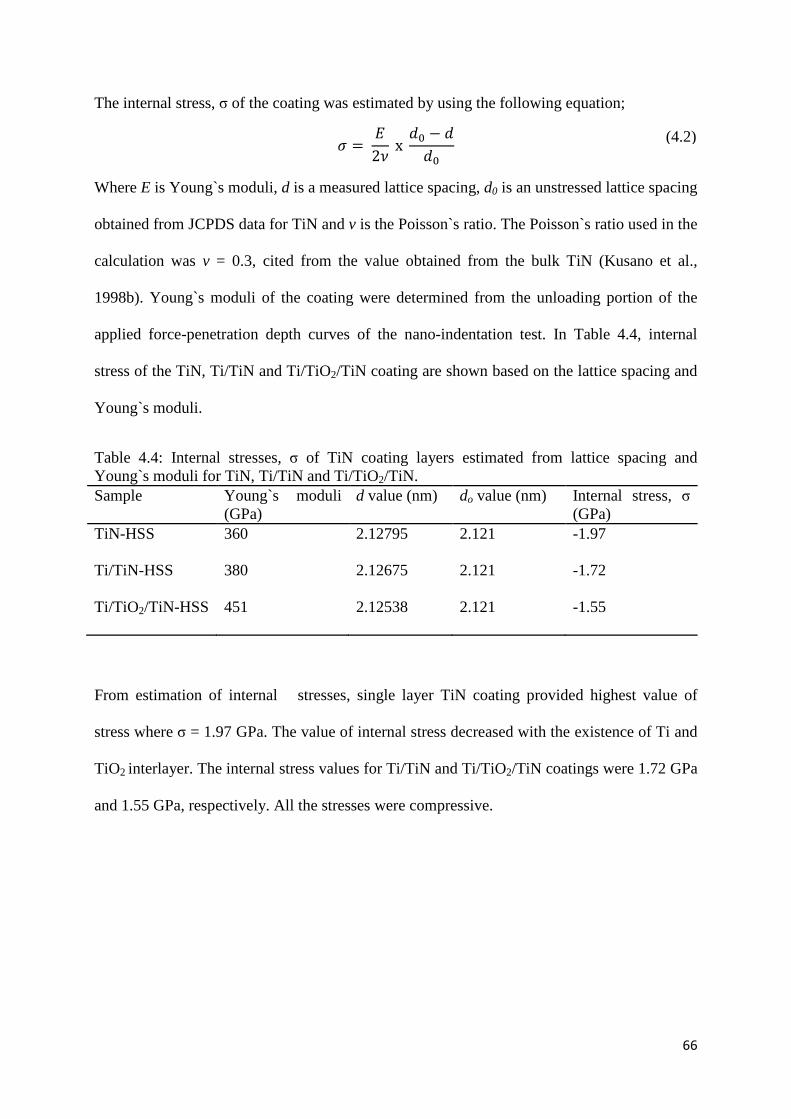
66
The internal stress, σ of the coating was estimated by using the following equation;
A = �2B xCD − CCD
Where E is Young`s moduli, d is a measured lattice spacing, d0 is an unstressed lattice spacing
obtained from JCPDS data for TiN and v is the Poisson`s ratio. The Poisson`s ratio used in the
calculation was v = 0.3, cited from the value obtained from the bulk TiN (Kusano et al.,
1998b). Young`s moduli of the coating were determined from the unloading portion of the
applied force-penetration depth curves of the nano-indentation test. In Table 4.4, internal
stress of the TiN, Ti/TiN and Ti/TiO2/TiN coating are shown based on the lattice spacing and
Young`s moduli.
Table 4.4: Internal stresses, σ of TiN coating layers estimated from lattice spacing and Young`s moduli for TiN, Ti/TiN and Ti/TiO2/TiN. Sample Young`s moduli
(GPa) d value (nm) do value (nm) Internal stress, σ
(GPa) TiN-HSS 360 2.12795 2.121 -1.97
Ti/TiN-HSS 380 2.12675 2.121 -1.72
Ti/TiO2/TiN-HSS 451 2.12538 2.121 -1.55
From estimation of internal stresses, single layer TiN coating provided highest value of
stress where σ = 1.97 GPa. The value of internal stress decreased with the existence of Ti and
TiO2 interlayer. The internal stress values for Ti/TiN and Ti/TiO2/TiN coatings were 1.72 GPa
and 1.55 GPa, respectively. All the stresses were compressive.
(4.2)

67
4.2 The effect of sputtering parameter on the Ti/TiO2/TiN adhesion
strength.
The adhesion strengths of coating-substrate system depend on some other parameters. Some
of the sputtering parameters were identified by previous researcher which effect the critical
loads of coating-substrate systems and hence the adhesion strength. The parameters included
sputtering power, substrate temperature, coating thickness and substrate surface condition. In
the present study, the effect of substrate temperature, coating thickness and substrate surface
condition on the adhesion strength of Ti/TiO2/TiN coatings were studied.
Figure 4.13 shows the adhesion strength of Ti/TiO2/TiN coating deposited on HSS and SS
substrate at deposition temperature of 50, 200 and 250 °C. From the figure, it can be seen that
Ti/TiO2/TiN coatings deposited at higher deposition temperature exhibit higher value of
critical load. Maximum adhesion strength of 1417.19 mN was observed for coating deposited
at 200 °C. Lowest adhesion strength of 1056.16 mN was evaluated for coating deposited at 50
°C. Similar observations were observed for coating deposited on SS substrate. Maximum
adhesion strength of 1264.46 mN was observed for coating deposited at temperature 200 °C.
Thus, it can be concluded that the optimum adhesion strength of Ti/TiO2/TiN coatings can be
obtained at temperature of 200 °C.
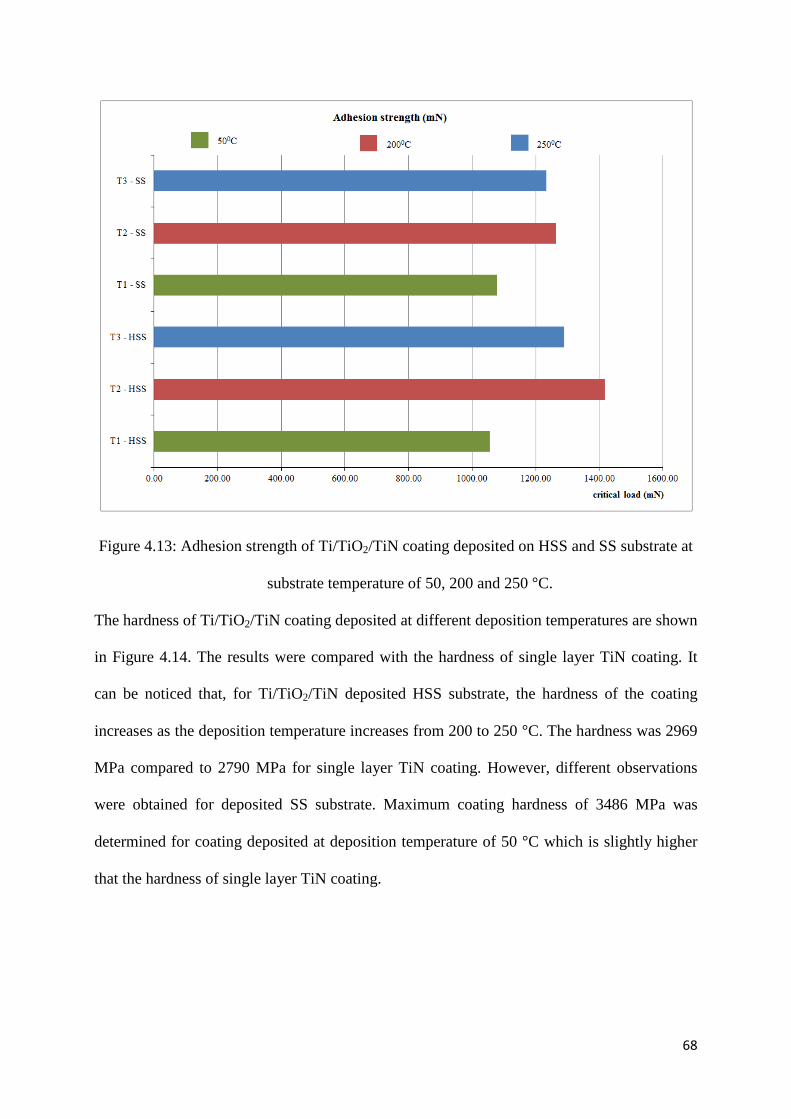
68
Figure 4.13: Adhesion strength of Ti/TiO2/TiN coating deposited on HSS and SS substrate at
substrate temperature of 50, 200 and 250 °C.
The hardness of Ti/TiO2/TiN coating deposited at different deposition temperatures are shown
in Figure 4.14. The results were compared with the hardness of single layer TiN coating. It
can be noticed that, for Ti/TiO2/TiN deposited HSS substrate, the hardness of the coating
increases as the deposition temperature increases from 200 to 250 °C. The hardness was 2969
MPa compared to 2790 MPa for single layer TiN coating. However, different observations
were obtained for deposited SS substrate. Maximum coating hardness of 3486 MPa was
determined for coating deposited at deposition temperature of 50 °C which is slightly higher
that the hardness of single layer TiN coating.

69
Figure 4.14: Hardness values of HSS and SS substrates and composite hardness of coating
deposited at different deposition temperature.
The effects of TiO2 coating thickness on the adhesion strength and hardness of Ti/TiO2/TiN
coating were illustrated in Figure 4.15. Three different thickness of TiO2 coating layer were
deposited on HSS and SS substrates. The thickness measured was 82.5, 165.2 and 247.5 nm.
The adhesion strength of Ti/TiO2/TiN coating increases as TiO2 coating thickness increases.
The values of critical load measured were 977.08, 1417.19 and 1539.78 mN for 82.5, 165.2
and 247.5 nm TiO2 coating thickness, respectively. A similar pattern was observed for coating
deposited on SS substrate. As the TiO2 increases, the measured critical load was increases.
The measured critical load for coating deposited on SS substrate were 1114.46, 1264.46 and
1366.51 mN for 82.5, 165.2 and 247.5 nm TiO2 coating thickness, respectively.
For measured coating hardness, the maximum hardness value of 2918 MPa was obtained for
coated HSS substrate with 247.5 nm TiO2 coating thickness. For SS substrate, a maximum
0
500
1000
1500
2000
2500
3000
3500
4000
Hardness (MPa)
Samples
2000C 2500C500 2000C 2500C
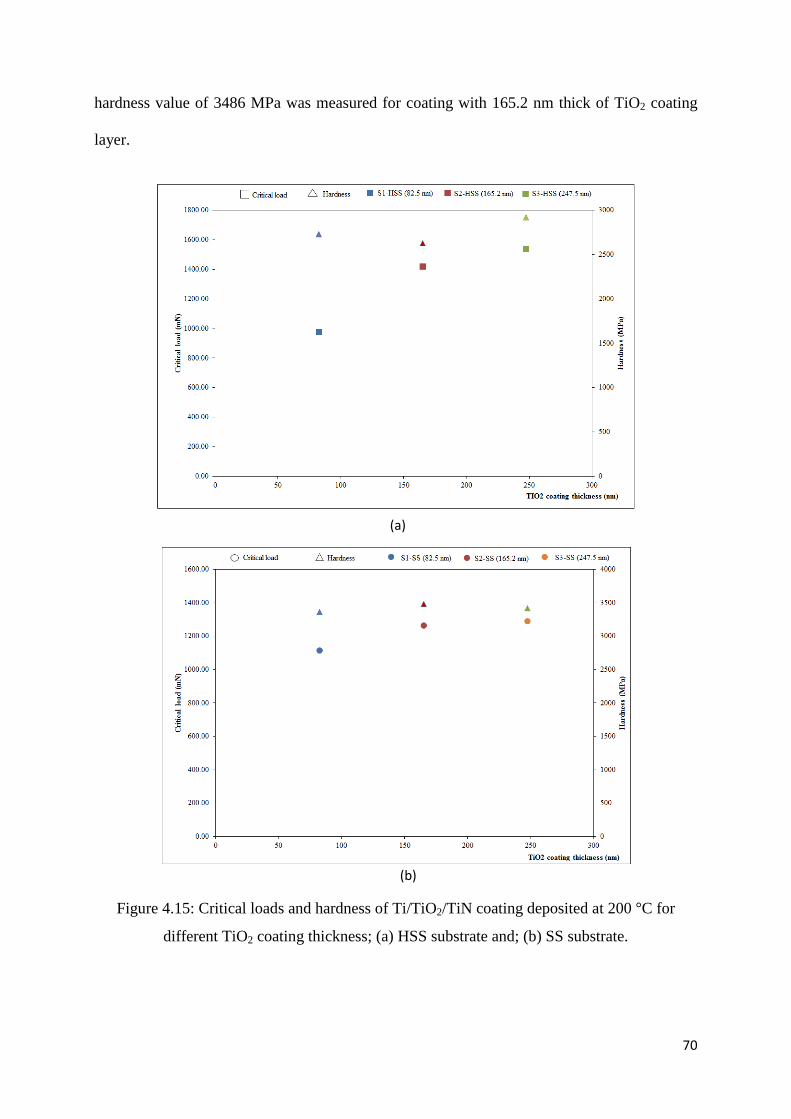
70
hardness value of 3486 MPa was measured for coating with 165.2 nm thick of TiO2 coating
layer.
Figure 4.15: Critical loads and hardness of Ti/TiO2/TiN coating deposited at 200 °C for
different TiO2 coating thickness; (a) HSS substrate and; (b) SS substrate.
(a)
(b)

71
The study on the substrate surface condition was conducted on HSS substrate with four
different surface roughnesses. The measured surface roughnesses, Ra for each sample were
summarized in Table 4.5.
Table 4.5: Measured surface roughness, Ra of HSS substrate. No Sample Roughness (Ra)
Reading 1 (µm) Reading 2 (µm) Reading 3 (µm) Average (µm) 1 R1-HSS 0.01 0.02 0.02 0.02 2 R2-HSS 0.02 0.03 0.03 0.03 3 R3-HSS 0.30 0.27 0.25 0.27 4 R4-HSS 1.13 1.21 1.25 1.20
Figure 4.16 shows the plot of critical load and coating hardness against substrate surface
roughness. The critical load of Ti/TiO2/TiN coating deposited on HSS decreases with the
increases of substrate surface roughness, Ra. Better coating adhesion was observed for
coating deposited on smooth substrate surface. The critical loads ranged from 1299.24 mN to
1417.19 mN were observed for substrate surface roughness less than 0.03 µm. For substrate
surface roughness more than 0.27 µm, the value of critical load measured was less than 1000
mN. For the coating hardness, no obvious changes were observed in term of coating hardness
values as the substrate surface roughness increases.
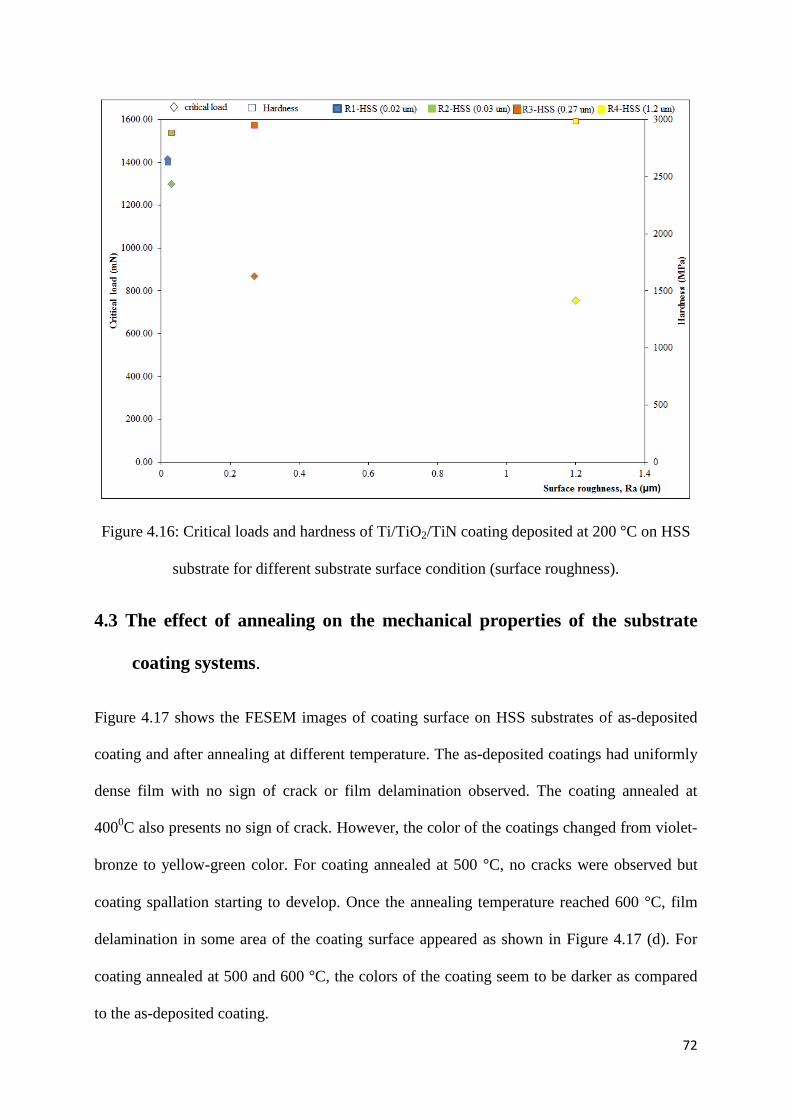
72
Figure 4.16: Critical loads and hardness of Ti/TiO2/TiN coating deposited at 200 °C on HSS
substrate for different substrate surface condition (surface roughness).
4.3 The effect of annealing on the mechanical properties of the substrate
coating systems.
Figure 4.17 shows the FESEM images of coating surface on HSS substrates of as-deposited
coating and after annealing at different temperature. The as-deposited coatings had uniformly
dense film with no sign of crack or film delamination observed. The coating annealed at
4000C also presents no sign of crack. However, the color of the coatings changed from violet-
bronze to yellow-green color. For coating annealed at 500 °C, no cracks were observed but
coating spallation starting to develop. Once the annealing temperature reached 600 °C, film
delamination in some area of the coating surface appeared as shown in Figure 4.17 (d). For
coating annealed at 500 and 600 °C, the colors of the coating seem to be darker as compared
to the as-deposited coating.
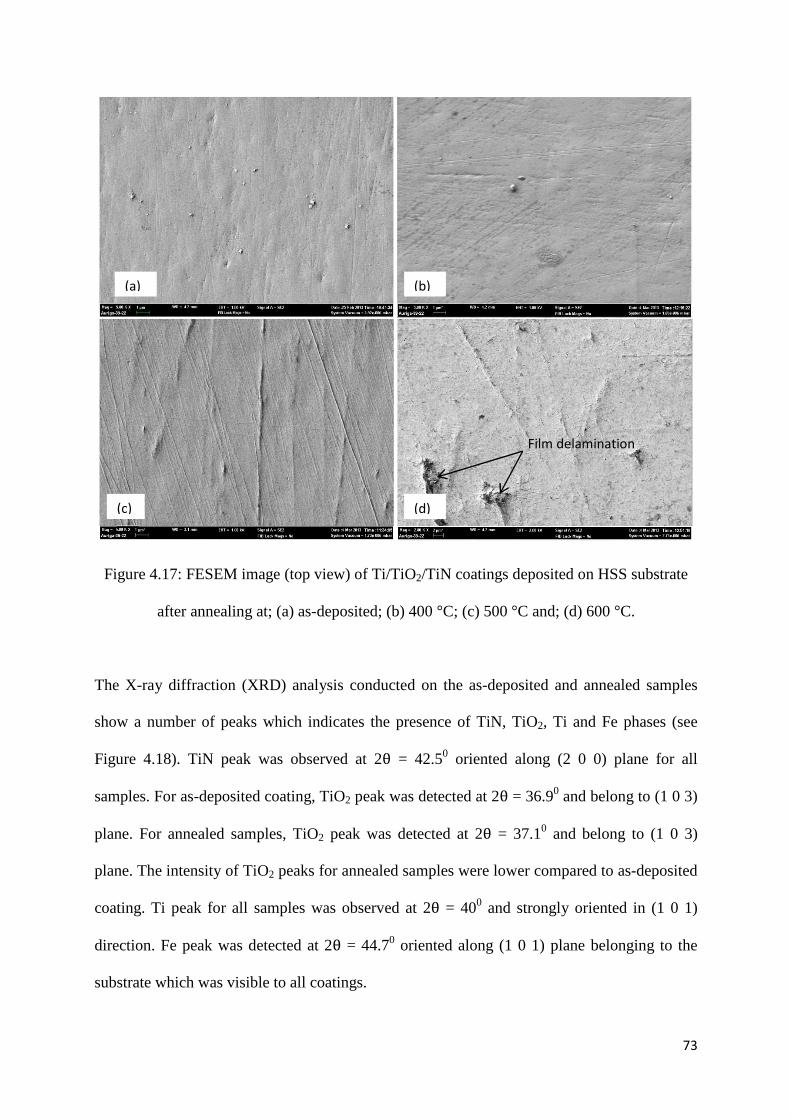
73
Figure 4.17: FESEM image (top view) of Ti/TiO2/TiN coatings deposited on HSS substrate
after annealing at; (a) as-deposited; (b) 400 °C; (c) 500 °C and; (d) 600 °C.
The X-ray diffraction (XRD) analysis conducted on the as-deposited and annealed samples
show a number of peaks which indicates the presence of TiN, TiO2, Ti and Fe phases (see
Figure 4.18). TiN peak was observed at 2θ = 42.50 oriented along (2 0 0) plane for all
samples. For as-deposited coating, TiO2 peak was detected at 2θ = 36.90 and belong to (1 0 3)
plane. For annealed samples, TiO2 peak was detected at 2θ = 37.10 and belong to (1 0 3)
plane. The intensity of TiO2 peaks for annealed samples were lower compared to as-deposited
coating. Ti peak for all samples was observed at 2θ = 400 and strongly oriented in (1 0 1)
direction. Fe peak was detected at 2θ = 44.70 oriented along (1 0 1) plane belonging to the
substrate which was visible to all coatings.
(a) (b)
(c) (d)
Film delamination

74
Figure 4.18: XRD patterns of as-deposited and annealed Ti/TiO2/TiN coatings deposited on
HSS substrates.
EDX analysis on the annealed samples revealed higher oxygen contents compared to as-
deposited coatings. The atomic-percentage of Ti and nitrogen decreased when the annealing
temperature increased. Figure 4.19 shows the summary atomic-percentage of Ti, oxygen and
nitrogen in the as-deposited and annealed Ti/TiO2/TiN coatings on HSS substrates.
Figure 4.20 summarized the critical load and coating hardness of as-deposited and annealed
Ti/TiO2/TiN coatings on HSS substrates. Maximum adhesion strength belonged to the
coatings annealed at 500 °C (2154.3 mN). The coatings annealed at 600 °C exhibited lowest
adhesion strength of 817.81 mN. The coating hardness increased for coatings annealed at 400
and 500 °C. The hardness values were 2730 MPa and 2700 MPa. Lowest coating hardness
value was observed for coating annealed at 600 °C (2586 MPa).

75
Figure 4.19: Atomic percentages of Ti, N and O in the Ti/TiO2/TiN coatings after annealing
treatment at different anneal temperatures.
Figure 4.20: Critical loads and hardness values for as-deposited Ti/TiO2/TiN coating and
coating samples after annealing at 400, 500 and 600 °C.
0.00
500.00
1000.00
1500.00
2000.00
2500.00
0
500
1000
1500
2000
2500
3000
as-deposited 400 500 600
Cri
tica
l Loa
d (m
N)
Har
dnes
s (M
Pa)
Annealing Temperature (0C)
Hardness critical load

76
CHAPTER 5
DISCUSSION
5.1 The effect of implementing Ti and TiO2 as interlayer on adhesion
strength improvement of TiN coating.
Many studies have been reported on the adhesion strength of single layer TiN (Larsson et al.,
2000; Laugier, 1987; Valli et al., 1985) and Ti/TiN coating systems (Simmonds et al., 1997).
In contrast, there have been a few reports on the adhesion strength of multilayer coating
particularly Ti/TiO2/TiN coating systems.
In this present study, TiO2 films were deposited together with Ti films as interlayer for TiN
coating to understand the effect of those interlayer coating on the adhesion strength
improvement of commercially used TiN coating. The XRD analysis on Ti/TiO2/TiN coating
proved the present of TiO2 on the coating. It is found that the TiO2 coating film deposited on
HSS and SS substrate at 2000C are polycrystalline having anatase phase only. The grown film
is found to be crystalline. In order for a crystalline phase to develop, the depositing atom
should have sufficient energy to obtain lower energy position which leading to the formation
of crystalline phases. High substrate temperature can provide the sufficient energy to develop
crystalline phase (Hasan et al., 2010). This may be the reason for the growth of anatase-TiO2
in the present study.
The results of EDX analysis indicated the present of Ti, TiN and TiO2 coating layer. The
EDX spectrum for all coatings show higher content of Ti compared to nitrogen and oxygen.
The lower content of nitrogen and oxygen in the coating may be due to lower working gas
pressure (gas flow rate).

77
The optical microscope analysis of the coating shows dense and uniform film for coating
deposited on HSS substrate. The morphologies of the coating deposited on SS substrate show
non-uniform film distribution. This may be due to substrate surface condition used during the
deposition. Smooth substrate surface may produce uniform film distribution as well as higher
adhesion between the coating and the substrate. Small surface features can only be seen at
very high magnification using FESEM. The coating layer is made of small grains of
hexagonal crystallite of approximately 38.7 nm size which represent TiN coating. The
observation was quite differ to results obtained by Carradò et al. (2010) and Gangopadhyay et
al. (2010), where the grains size of TiN was found to be 10 nm size.
Further analysis on the coating cross sections reveals compact and dense coating film. The
completed growth of coating film produced flakes that are overlapped, arranged as in network
which may contribute to enhancement of adhesion strength.
The average coating thickness layer of TiO2, Ti and TiN measured was 165.2, 504.7 and
174.2 nm, respectively. The coating thicknesses obtained from the deposition were differ to
thickness obtained from literature (Carradò et al., 2010; Kusano et al., 1998b) although the
deposition parameters were similar. The difference is thought to be due to different size of
deposition chamber used and variation in the working pressure during the deposition. Coating
thickness deposited on the substrate depends on the deposition parameters which may
contribute to variation in thickness for all coating samples. Working gas flow, D.C power,
working pressure as well as the ratio of the gas used during deposition were some of the
factors that may cause the variation in coating thickness. Higher D.C power will produce
thicker coating thickness. Substrates also need to be rotate during the deposition process to
ensure uniformity of the coating. In this present work, substrate holder was rotated during
deposition of all coating samples to ensure coating uniformity.

78
In term of adhesion strength, it is generally accepted as an important property in evaluating
coating integrity. In order for a coating to be functionality effective, sufficient adhesion are
required to avoid coating detachment and failure. TiN coatings have been used in tooling
applications to increase the mechanical properties such as wear resistance of the tools and
hence increase the tool life. Thus, study on the TiN coating deposited on tool steel materials
such as HSS and SS have done intensively. Most of the study concentrated on the adhesion of
the coating on the substrate. Adhesion strength of coating deposited by various techniques
such as plasma spraying and magnetron sputtering are well studied. Improvements on the
adhesion strength of TiN coating have been done by using metallic coating as an interlayer.
However, there is no standard value by which comparison can be made objectively. Different
studies report different value of adhesion strengths. Most of the study report on the adhesion
strength of single layer TiN coating and TiN coating with a metallic coating interlayer.
Laugier (1987) reported that single layer TiN coating produced by PVD technique with
thickness of 3 µm tended to spall at critical load of 1.2 kgf. Valli et al. (1985) claimed to
achieve a critical normal load of 31 N for 0.8 µm TiN coating. The adhesion strength
improvement of TiN coating has been reported by Helmersson et al. (1985) with the use of
titanium interlayer. However, Valli et al. reported an opposite result from Helmersson et al.
They reported that 0.3 µm titanium interlayer was found to decrease the coating adhesion.
In the present study, Ti/TiO2/TiN coatings were deposited on HSS and SS. Ti and TiO2
interlayer were deposited between TiN coating and the substrate to enhance the adhesion
strength. The adhesion strength of TiN, Ti/TiN and Ti/TiO2/TiN coating deposited on HSS
and SS substrate were determined by scratch test. Ti/TiN coatings show good adhesion
compared to single layer TiN for both HSS and SS substrate. The adhesion strength
improvement proved that Ti interlayer has beneficial effect on the adhesion strength of single
layer TiN coating. The results were in agreement with the findings by Helmersson et al.

79
(1985) on the adhesion of the films increased with the use of an intermediate layer of pure
titanium in between TiN coating and substrates.
Ti/TiO2/TiN coating exhibited higher adhesion compared to Ti/TiN and single layer TiN
coating, thus suggesting the beneficial effect of TiO2 intermediate coating layer on the
adhesion strength. Similar observation was obtained by Kusano et al. (1998b) where the
adhesion of TiO2 /Ti/TiN coating exhibit superior adhesion compared to TiN coating.
The improved of the adhesion strength with the presence of Ti interlayer can be explained on
the basis of better bonding between the titanium interlayer and the substrate and also better
bonding between the titanium layer and the TiN coating. It is also suggested that the Ti
interlayer acts as a graded interface that can evades the abrupt change in composition at the
sharp interface between a coating and metal substrate. Better adhesion strength of
Ti/TiO2/TiN can be explained by the basis that by making a compositional change in the
interface transition region gradient and smooth, both chemical and mechanical bonding are
expected to be improved.
Analysis on the internal stress of TiN, Ti/TiN and Ti/TiO2/TiN coating revealed compressive
internal stress for all coatings. The internal stress of Ti/TiO2/TiN was found to be smaller
compared to TiN and Ti/TiN coatings. A lower internal stress of Ti/TiO2/TiN coating is
thought to cause a better adhesion in addition to stronger chemical bonding.
Evaluation on the hardness of the Ti/TiO2/TiN coating shows a decrease in value compared to
hardness of TiN coating. The lower hardness of Ti/TiO2/TiN coating is thought to be due to
inter-diffusion between oxide and nitride layers.

80
5.2 The effect of sputtering parameter on the Ti/TiO2/TiN adhesion
strength.
The effects of sputtering parameters have been reported to influence the adhesion strength of
the coatings. The substrate temperature, coating thickness and substrate surface condition are
the parameters which affect the adhesion of the coating. Helmersson et al. (1985) reported on
the increased of TiN coating adhesion with increased in substrate temperature. Perry (1983)
reported on the critical load increased with increased coating thickness. Steinmann et al.
(1987) suggested that the critical load of the coating depends on the substrate roughness.
In this study, Ti/TiO2/TiN coatings deposited at higher deposition temperature exhibits higher
value of critical load. The critical load increases as the deposition temperature increases from
50 to 200 °C. At deposition temperature 250 °C, it is notice that the value of critical load
slightly decrease compared to deposition at 250 °C. The optimum adhesion strength of
Ti/TiO2/TiN coatings can be obtained at temperature of 200 °C. The reason for higher
adhesion strength at high deposition temperature is thought due to an increase in strength of
both chemical and mechanical bonding of coatings to substrate. The hardness of Ti/TiO2/TiN
coating increases as the deposition temperature increases from 200 to 250 °C. The hardness
was higher compared to single layer TiN coating.
The study on the effect of TiO2 coating thickness on the Ti/TiO2/TiN coating adhesion
strength shows an increase in the critical load as the TiO2 coating thickness increases. The
value of critical load kept increasing as the TiO2 coating thickness increase. No optimum
value of TiO2 coating thickness was observed. Thus, the study on the optimum TiO2 coating
thickness can be done in future to obtain the maximum adhesion strength of Ti/TiO2/TiN
coating systems. A similar pattern was also observed for the measured coating hardness. The
hardness of the coating increases as the TiO2 coating thickness increases.

81
The study on the substrate surface condition was conducted by varying the surface roughness
of the substrate used. The critical load of Ti/TiO2/TiN coating deposited on HSS decreases
with the increases of substrate surface roughness, Ra. Better coating adhesion was observed
for coating deposited on smooth substrate surface. The critical load clearly dependence on the
substrate surface roughness. It is believed that although all the substrates were coated during
the same treatment prior to deposition process, the adhesive properties can vary since the
efficiency of the cleaning operation is influence by the surface roughness.
5.3 The effect of annealing on the mechanical properties of the substrate
coating systems.
The results on the annealing treatment of Ti/TiO2/TiN coating show that the mechanical
properties of the coating improved significantly up to certain annealing temperature. It is
noticed that highest critical load and hardness were obtained for coatings annealed at 500 °C.
The lowest critical load was observed for coating annealed at 600 °C. It is believed that during
annealing, the coating interacted with oxygen in air environment and forming denser TiO2
coating films. It can be noticed that from the EDX analysis, the atomic percentages of oxygen
increase for annealed coating samples. However, annealing the coatings at higher temperature
(600 °C) yielded to partial film detachment which is the reason of decreasing in adhesion
strength. Therefore, the overall results in the present study suggest that 500 °C is probably the
optimum annealing temperature to achieve the best adhesion strength and coating hardness.

82
CHAPTER 6
CONCLUSIONS AND RECOMMENDATIONS
6.1 Conclusions
The introduction of TiO2 coating layer as an intermediate layer has great influence on the
adhesion strength of the TiN coating systems. Deposition temperature, coating thickness,
substrate surface condition and post-heat treatment of the coating does affect the adhesion
strength of the coating. The results and findings in this thesis are concluded as follows;
1. TiO2 coating film deposited D.C magnetron sputtering on HSS and SS substrate at 200
°C and discharge power of 150 W was polycrystalline having anatase phase.
2. Ti/TiO2/TiN coating exhibits higher adhesion strength compared to Ti/TiN and single
layer TiN coating, thus suggesting the beneficial effect of TiO2 intermediate coating
layer on the adhesion strength.
3. The hardness of the Ti/TiO2/TiN coating shows a decrease in value compared to
hardness of TiN coating.
4. Ti/TiO2/TiN coatings deposited at higher deposition temperature exhibits higher value
of critical load. The optimum adhesion strength of Ti/TiO2/TiN coatings can be
obtained at temperature of 200 °C.
5. The adhesion strength of Ti/TiO2/TiN coating increases as the TiO2 coating thickness
increases.
6. The adhesion strength of Ti/TiO2/TiN coating deposited on HSS decreases with the
increases of substrate surface roughness. Better coating adhesion was observed for
coating deposited on smooth substrate surface.

83
7. It was found that annealing Ti/TiO2/TiN coating at 500 °C yielded highest adhesion
strength and coating hardness. The annealed coating at 600 °C revealed film
delamination and exhibited lowest adhesion strength.
6.2 Recommendations
1. The mechanical properties of Ti/TiO2/TiN coating in the present study were defined in
terms of adhesion strength evaluation using scratch test and coating hardness using
micro-hardness tester. Investigation of the mechanical properties of the coating by
using other mechanical characterizations such as sliding tests may help in further
understanding of mechanical behavior of the coating systems.
2. The study on the effect of TiO2 coating thickness can be extended to evaluate the
optimum coating thickness for maximum adhesion strength.

84
REFERENCES A
Adachi, S., & Nakata, K. (2007). Improvement of adhesive strength of Ti–Al plasma sprayed coating. Surface and Coatings Technology, 201(9–11), 5617-5620.
al., V. G. e. (1994). Recent development in the laser spallation technique to measure the interface strength and its relationship to interface toughness with application to metal/ceramics, ceramic/ceramic and ceramic/polymer interface. Adhesion Measurement of Films and Coatings, 367 - 401.
Arai, T., Fujita, H., & Watanabe, M. (1987). Evaluation of adhesion strength of thin hard coatings. Thin Solid Films, 154(1–2), 387-401.
B
Bergmann, E., Vogel, J., & Simmen, L. (1987). Failure mode analysis of coated tools. Thin Solid Films, 153(1–3), 219-231.
Bishop, C. A. (2011). 9 - Adhesion and Adhesion Tests Vacuum Deposition onto Webs, Films and Foils (Second Edition) (pp. 177-185). Oxford: William Andrew Publishing.
Boustie, M., Auroux, E., & Romain, J.-P. (2000). Application of the laser spallation technique to the measurement of the adhesion strength of tungsten carbide coatings on superalloy substrates. The European Physical Journal - Applied Physics, 12(01), 47-53.
Bull, S. J. (1991). Failure modes in scratch adhesion testing. Surface and Coatings Technology, 50(1), 25-32.
Burnett, P. J., & Rickerby, D. S. (1988). The scratch adhesion test: An elastic-plastic indentation analysis. Thin Solid Films, 157(2), 233-254.
Bushroa, A. R., Masjuki, H. H., & Muhamad, M. R. (2011). Parameter Optimization of Sputtered Ti Interlayer Using Taguchi Method. International Journal of Mechanical and Materials Engineering (IJMME), Vol.6 (2011)(2), 140-146.
C Carradò, A., Schmerber, G., & Pelletier, H. (2010). Structural and mechanical investigations of magnetron sputtering TiO2/Ti/TiN multilayer films on Si(100) substrate. Journal of Coatings Technology and Research, 7(6), 821-829.
85
Chalker, P. R., Bull, S. J., & Rickerby, D. S. (1991). A review of the methods for the evaluation of coating-substrate adhesion. Materials Science and Engineering: A, 140(0), 583-592.
Chopra, K. L. (1969). Thin Film Phenomena (pp. 319): McGraw-Hill, New York.
D Diao, D. F., Kato, K., Hokkirigawa, K. (1994). Fracture mechanisms of ceramic coatings in indentation. Journal of Tribology, 116(4), 860-869.
F Fella, R., & Holleck, H. (1991). Preparation and properties of metastable TiC/SiC PVD coatings for wear protection. Materials Science and Engineering: A, 140(0), 676-681.
G Gangopadhyay, Acharya, S., Chattopadhyay, R., & Paul, S. (2010). Effect of Substrate Bias Voltage on Structural and Mechanical Properties of Pulse DC Magnetron Sputtered TiN-MoSx Composite Coatings. Vacuum, 84(6), 843-850. Gerth, J., & Wiklund, U. (2008). The influence of metallic interlayers on the adhesion of PVD TiN coatings on high-speed steel. Wear, 264, 885-892. Gupta, V., Argon, A. S., Parks, D. M., & Cornie, J. A. (1992). Measurement of interface strength by a laser spallation technique. Journal of the Mechanics and Physics of Solids, 40(1), 141-180.
H
Hagerman, E., Shim, J., Gupta, V., & Wu, B. (2007). Evaluation of laser spallation as a technique for measurement of cell adhesion strength. J Biomed Mater Res A 82(4), 852-860. Hasan, M. M., Haseeb, A. S. M. A., Masjuki, H. H., & Saidur, R. (2010). Adhesion and Wear Behavior Of Nanostructured Titanium Oxide Thin Films. International Journal of Mechanical and Materials Engineering (IJMME), 5(1), 5-10. Hedenqvist, P., Olsson, M., Jacobson, S., & Söderberg, S. (1990). Failure mode analysis of TiN-coated high speed steel: In situ scratch adhesion testing in the scanning electron microscope. Surface and Coatings Technology, 41(1), 31-49.
Helmersson, U., Johansson, B. O., Sundgren, J.-E., Hentzell, H. T. G., & Billgren, P. (1985). Adhesion of titanium nitride coatings on high-speed steels. Journal of Vacuum Science & Technology A: Vacuum, Surfaces, and Films, 3(2), 308-315.

86
I Ikeda, R., Uchiyama, T., Cho, H., Ogawa, T., & Takemoto, M. (2006). An advanced method for measuring the residual stress of deposited film utilizing laser spallation technique. Science and Technology of Advanced Materials, 7(1), 90.
J Jacobsson, R., & Kruse, B. (1973). Measurement of adhesion of thin evaporated films on glass substrates by means of the direct pull method. Thin Solid Films, 15(1), 71-77.
Jaworski, R., Pawlowski, L., Roudet, F., Kozerski, S., & Petit, F. (2008). Characterization of mechanical properties of suspension plasma sprayed TiO2 coatings using scratch test. Surface and Coatings Technology, 202(12), 2644-2653.
Je, J. H., Gyarmati, E., & Naoumidis, A. (1986). Scratch adhesion test of reactively sputtered TiN coatings on a soft substrate. Thin Solid Films, 136(1), 57-67.
Jindal, P. C., Quinto, D. T., & Wolfe, G. J. (1987). Adhesion measurements of chemically vapor deposited and physically vapor deposited hard coatings on WC-Co substrates. Thin Solid Films, 154(1–2), 361-375.
K
Kasetsart, J. (2008). Phase Characterization of TiO2 Powder by XRD and TEM. Nat. Sci. (42), 357-361. Kobayashi, A., Jain, A., Gupta, V., & Kireev, V. (2004). Study on the interface strength of zirconia coatings by a laser spallation technique. Vacuum, 73(3–4), 533-539.
Kusano, E., Kitagawa, M., Kuroda, Y., Nanto, H., & Kinbara, A. (1998a). Adhesion and hardness of compositionally gradient TiO2/Ti/TiN, ZrO2/Zr/ZrN, and TiO2/Ti/Zr/ZrN coatings. Thin Solid Films, 334, 151-155. Kusano, E., Kitagawa, M., Kuroda, Y., Nanto, H., & Kinbara, A. (1998b). Adhesion and hardness of compositionally gradient TiO2/Ti/TiN, ZrO2/Zr/ZrN, and TiO2/Ti/Zr/ZrN coatings. Thin Solid Films, 334(1–2), 151-155.
L
Larsson, M., Olsson, M., Hedenqvist, P., & Hogmark, S. (2000). Mechanisms of coating failure as demonstrated by scratch and indentation testing of TiN coated HSS. Surface Engineering, 16(5), 436-444.
Laugier, M. (1981). The development of the scratch test technique for the determination of the adhesion of coatings. Thin Solid Films, 76(3), 289-294.

87
Laugier, M. T. (1984). An energy approach to the adhesion of coatings using the scratch test. Thin Solid Films, 117(4), 243-249.
Laugier, M. T. (1987). Adhesion and toughness of protective coatings. Journal of Vacuum Science & Technology A: Vacuum, Surfaces, and Films, 5(1), 67-69.
M
Marco, J. F., Cuesta, A., Gracia, M., Gancedo, J. R., Panjan, P., & Hanžel, D. (2005). Influence of a deposited TiO2 thin layer on the corrosion behaviour of TiN-based coatings on iron. Thin Solid Films, 492(1–2), 158-165.
Marshall, D. B., & Evans, A. G. (1984). Measurement of adherence of residually stressed thin films by indentation. I. Mechanics of interface delamination. Journal of Applied Physics, 56(10), 2632-2638. Mattox, D. M. (2010). Handbook of Physical Vapor Deposition (PVD) Processing: William Andrew.
N
Niemi, E., Korhonen, A. S., Harju, E., & Kauppinen, V. (1986). Comparison of wear characteristics and properties of TiN-coated gear cutting hobs. Journal of Vacuum Science & Technology A: Vacuum, Surfaces, and Films, 4(6), 2763-2767. Nsongo, T., & Gillet, M. (1995). Adhesion characterization of titanium and titanium nitride thin coatings on metals using the scratch test. International Journal of Adhesion and Adhesives, 15(3), 191-196.
O
Ollendorf, H., Schneider, D., Schwarz, T., Kirchhoff, G., & Mucha, A. (1996). A comparative study of the mechanical properties of TiN coatings using the non-destructive surface acoustic wave method, scratch test and four-point bending test. Surface and Coatings Technology, 84(1–3), 458-464.
P
Park, J. H., & Sudarshan, T. S. (2001). Chemical Vapor Deposition: Asm International.
Perry, A. J. (1981). Adhesion studies of ion-plated TiN on steel. Thin Solid Films, 81(4), 357-366.
Perry, A. J. (1983). Scratch adhesion testing of hard coatings. Thin Solid Films, 107(2), 167-180.

88
S
Schulz, A., Stock, H. R., & Mayr, P. (1991). Physical vapour deposition of TiN hard coatings with additional electron beam heat treatment. Materials Science and Engineering: A, 140(0), 639-646.
Simmonds, M. C., Van Swygenhoven, H., Pflüger, E., Savan, A., Hauert, R., Knoblauch, L., & Mikhailov, S. (1997). Magnetron sputter deposition and characterisation of Ti/TiN, Au/TiN and MoSX/Pb multilayers. Surface and Coatings Technology, 94–95(0), 490-494.
Steinmann, P. A., & Hintermann, H. E. (1985). Adhesion of TiC and Ti(C,N) coatings on steel. Journal of Vacuum Science & Technology A: Vacuum, Surfaces, and Films, 3(6), 2394-2400.
Steinmann, P. A., Tardy, Y., & Hintermann, H. E. (1987). Adhesion testing by the scratch test method: The influence of intrinsic and extrinsic parameters on the critical load. Thin Solid Films, 154(1–2), 333-349.
Szalkowska, E., Gluszek, J., Masalski, J., & Tylus, W. (2001). Structure and protective properties of TiO2 coatings obtained using the sol-gel technique. Journal of Materials Science Letters, 20(6), 495-497.
V
Valli, J., & Mäkelä, U. (1987). Applications of the scratch test method for coating adhesion assessment. Wear, 115(1–2), 215-221.
Valli, J., Makela, U., Matthews, A., & Murawa, V. (1985). TiN coating adhesion studies using the scratch test method. Journal of Vacuum Science & Technology A: Vacuum, Surfaces, and Films, 3(6), 2411-2414.
von Stebut, J., Rezakhanlou, R., Anoun, K., Michel, H., & Gantois, M. (1989). Major damage mechanisms during scratch and wear testing of hard coatings on hard substrates. Thin Solid Films, 181(1–2), 555-564.
W
Wang J., Nancy R. Sottos and Richard L. Weaver. (2004). Tensile and mixed-mode strength of a thin film-substrate interface under laser induced pulse loading. Journal of the Mechanics and Physics of Solids, 52(5), 999-1022.
Wang, Y. K., Cheng, X. Y., Wang, W. M., Gu, X. H., Xia, L. F., Lei, T. C., & Liu, W. H. (1995). Microstructure and properties of (Ti, Al) N coating on high speed steel. Surface and Coatings Technology, 72(1–2), 71-77.
Weaver, C. (1975). Adhesion of thin films. Journal of Vacuum Science and Technology, 12(1), 18-25.

89
Wen Jun Chou, G. P. Y. a. J. H. H. (2002). Mechanical properties of TiN thin film coatings on 304 stainless steel substrates. Surface and Coatings Technology, 149, 7-13. Westergård, R., Axén, N., Wiklund, U., & Hogmark, S. (2000). An evaluation of plasma sprayed ceramic coatings by erosion, abrasion and bend testing. Wear, 246(1–2), 12-19.
Y
Yamamoto, Shuji, Ichimura, & Hiroshi. (1992). Effects of intrinsic properties of TiN coatings on acoustic emission behavior at scratch test. Journal of Materials Research, 7(8), 2240-2247.
Z Zhang, S., & Zhu, W. (1993). TiN coating of tool steels: A review. Journal of Materials Processing Technology, 39, 165-177.