feasibility study of a wind–pv–diesel hybrid power system for a village
TRANSCRIPT
lable at ScienceDirect
Renewable Energy 38 (2012) 258e268
Contents lists avai
Renewable Energy
journal homepage: www.elsevier .com/locate/renene
Technical Note
Feasibility study of a windepvediesel hybrid power system for a village
Shafiqur Rehman a,b,*, Md. Mahbub Alamb, J.P. Meyer b, Luai M. Al-Hadhrami a
aCenter for Engineering Research, Research Institute, King Fahd University for Petroleum and Minerals, Dhahran-31261, Saudi ArabiabMechanical and Aeronautical Engineering Department, University of Pretoria, Pretoria, South Africa
a r t i c l e i n f o
Article history:Received 2 December 2010Accepted 18 June 2011Available online 31 July 2011
Keywords:Renewable energyWindepvediesel hybrid systemSolar radiationWindSolarSaudi Arabia
* Corresponding author. KFUPM Box 767, DhTel.: þ966 3 8603802, þ966 502085496(mobile); fax
E-mail address: [email protected] (S. RehmaURL: http://faculty.kfupm.edu.sa/ri/srehman
0960-1481/$ e see front matter � 2011 Elsevier Ltd.doi:10.1016/j.renene.2011.06.028
a b s t r a c t
A windepvediesel hybrid power system has been designed for a village in Saudi Arabia which is pres-ently powered by a diesel power plant consisting of eight diesel generating sets of 1,120 kW each.The study found a windepvediesel hybrid power system with 35% renewable energy penetration (26%wind and 9% solar PV) to be the feasible system with cost of energy of 0.212 US$/kWh. The proposedsystem was comprised of 3 wind turbines each of 600 kW, 1000 kW of PV panels, and four dieselgenerating sets each of 1120 kW rated power. The system was able to meet the energy requirements(AC primary load of 17,043.4 MWh/y) of the village with 4.1% energy in excess. The annual contributionsof wind, solar pv and the diesel generating sets were 4713.7, 1653.5, and 11,542.6 MWh, respectively. Theproposed hybrid power system resulted in avoiding addition of 4976.8 tons of GHG equivalent of CO2 gasin to the local atmosphere of the village and conservation of 10,824 barrels of fossil fuel annually.
� 2011 Elsevier Ltd. All rights reserved.
1. Introduction
So for a safe globe and better life of all living beings on thisplanet new, clean and renewable sources of energy and relatedtechnologies are being sought, developed and implementedworldwide. These alternative sources of energy include wind, solar,geothermal, tidal, wave, and biofuels. The applications of thesesources include the very small to large isolated, grid connected andhybrid power systems. Moreover, the hybrid power systems exhibithigher reliability and lower cost of generation than those that useonly one source of energy [1,2]. A power generating system whichcombines two or more different sources of energy is called a hybridsystem. The hybrid energy generating systems (such as wind-ediesel, pvediesel, windepvediesel etc. with and without batterystorage options) are not new technologies or systems rather existedin practice for the last two decades as mentioned by Yang et al. [3].The authors have recommended an optimal design model forhybrid solarewind system which employed battery banks tocalculate the system’s optimum configurations in China. In anotherstudy, Yang et al. [4] recommended an optimal sizing method tooptimize the configurations of a hybrid solarewind system withbattery banks. The authors used a genetic algorithm (GA) to
ahran-31261, Saudi Arabia.: þ966 3 8603996.n).
All rights reserved.
calculate the optimum system configuration that could achieve thecustomers required loss of power supply probability (LPSP) withminimum annualized cost of system (ACS).
Furthermore, small off-grid standalone hybrid power systemsprovide an important option for decreasing the electricity gap inremote areas of the developing and developed world, whereprogress in grid extension remains slower than population growth[5,6]. According to Celik [7], these small-scale systems thoughgenerate relatively little power but can significantly improvequality of life in remote areas [7]. Cavello and Grubb [8] stated that1 kWh of electricity provides ten times more electricity services inIndia than in Indiana and further added that two small windgenerators, which would supply only two homes with electricheating in the United States, could pump water for 4000 people inMorocco [8].
Recently, Dihrab and Sopian [9] proposed a hybrid powersystem to generate power for grid connected applications in threecities in Iraq. Results showed that it is possible for Iraq to use thesolar and wind energy to generate enough power for villages in thedesert and rural areas. Ekren et al. [10] designed and developed anoptimum sizing procedure of windepvediesel hybrid system forsmall applications in Turkey. Saheb-Koussa [11] designed a wind/pv/diesel hybrid energy systemwith battery backup and conductedits techno-economical feasibility for remote applications in Algeria.Their simulation results indicated that the hybrid system is the bestoption for all the sites considered, provided higher system perfor-mance than photovoltaic or wind alone systems, the reliability of
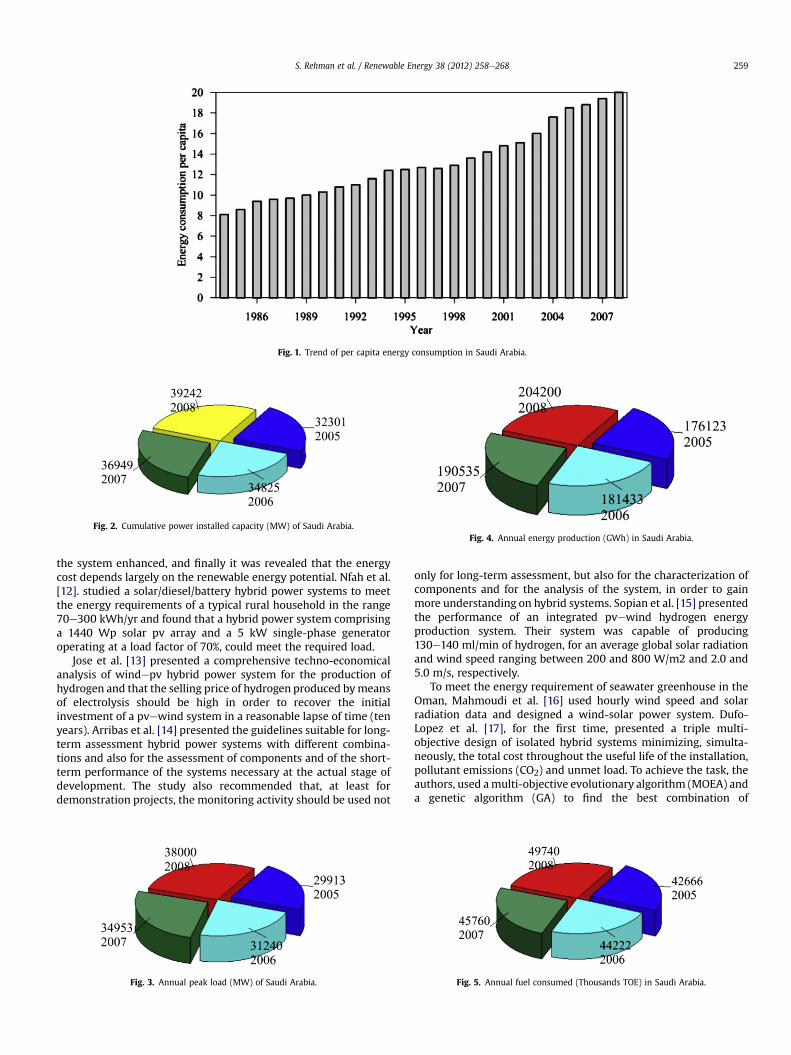
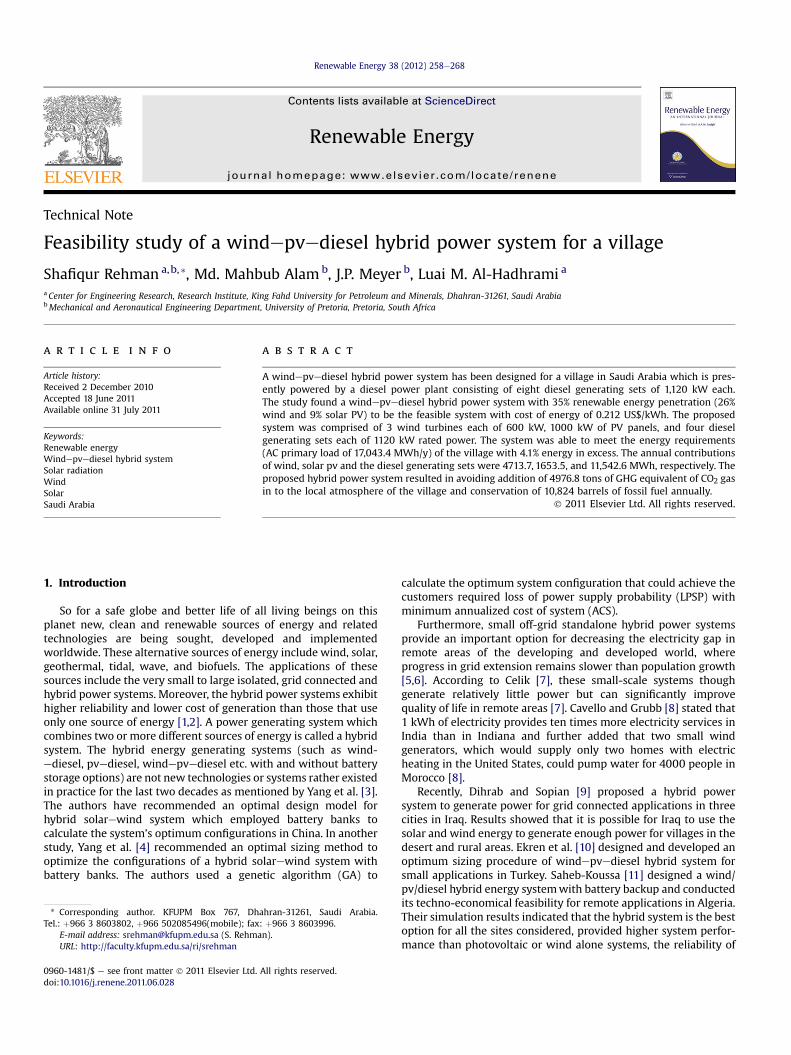
Fig. 1. Trend of per capita energy consumption in Saudi Arabia.
Fig. 2. Cumulative power installed capacity (MW) of Saudi Arabia.Fig. 4. Annual energy production (GWh) in Saudi Arabia.
S. Rehman et al. / Renewable Energy 38 (2012) 258e268 259
the system enhanced, and finally it was revealed that the energycost depends largely on the renewable energy potential. Nfah et al.[12]. studied a solar/diesel/battery hybrid power systems to meetthe energy requirements of a typical rural household in the range70e300 kWh/yr and found that a hybrid power system comprisinga 1440 Wp solar pv array and a 5 kW single-phase generatoroperating at a load factor of 70%, could meet the required load.
Jose et al. [13] presented a comprehensive techno-economicalanalysis of windepv hybrid power system for the production ofhydrogen and that the selling price of hydrogen produced bymeansof electrolysis should be high in order to recover the initialinvestment of a pvewind system in a reasonable lapse of time (tenyears). Arribas et al. [14] presented the guidelines suitable for long-term assessment hybrid power systems with different combina-tions and also for the assessment of components and of the short-term performance of the systems necessary at the actual stage ofdevelopment. The study also recommended that, at least fordemonstration projects, the monitoring activity should be used not
Fig. 3. Annual peak load (MW) of Saudi Arabia.
only for long-term assessment, but also for the characterization ofcomponents and for the analysis of the system, in order to gainmore understanding on hybrid systems. Sopian et al. [15] presentedthe performance of an integrated pvewind hydrogen energyproduction system. Their system was capable of producing130e140 ml/min of hydrogen, for an average global solar radiationand wind speed ranging between 200 and 800 W/m2 and 2.0 and5.0 m/s, respectively.
To meet the energy requirement of seawater greenhouse in theOman, Mahmoudi et al. [16] used hourly wind speed and solarradiation data and designed a wind-solar power system. Dufo-Lopez et al. [17], for the first time, presented a triple multi-objective design of isolated hybrid systems minimizing, simulta-neously, the total cost throughout the useful life of the installation,pollutant emissions (CO2) and unmet load. To achieve the task, theauthors, used amulti-objective evolutionary algorithm (MOEA) anda genetic algorithm (GA) to find the best combination of
Fig. 5. Annual fuel consumed (Thousands TOE) in Saudi Arabia.
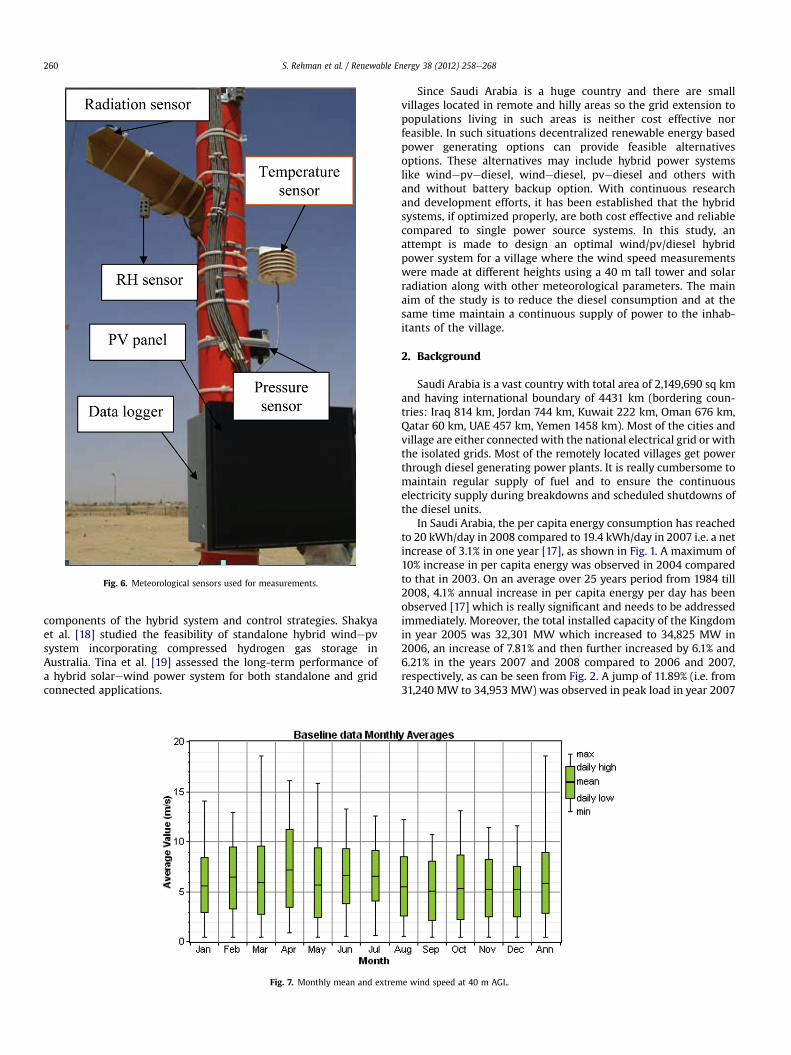
Fig. 6. Meteorological sensors used for measurements.
S. Rehman et al. / Renewable Energy 38 (2012) 258e268260
components of the hybrid system and control strategies. Shakyaet al. [18] studied the feasibility of standalone hybrid windepvsystem incorporating compressed hydrogen gas storage inAustralia. Tina et al. [19] assessed the long-term performance ofa hybrid solarewind power system for both standalone and gridconnected applications.
Fig. 7. Monthly mean and extrem
Since Saudi Arabia is a huge country and there are smallvillages located in remote and hilly areas so the grid extension topopulations living in such areas is neither cost effective norfeasible. In such situations decentralized renewable energy basedpower generating options can provide feasible alternativesoptions. These alternatives may include hybrid power systemslike windepvediesel, windediesel, pvediesel and others withand without battery backup option. With continuous researchand development efforts, it has been established that the hybridsystems, if optimized properly, are both cost effective and reliablecompared to single power source systems. In this study, anattempt is made to design an optimal wind/pv/diesel hybridpower system for a village where the wind speed measurementswere made at different heights using a 40 m tall tower and solarradiation along with other meteorological parameters. The mainaim of the study is to reduce the diesel consumption and at thesame time maintain a continuous supply of power to the inhab-itants of the village.
2. Background
Saudi Arabia is a vast country with total area of 2,149,690 sq kmand having international boundary of 4431 km (bordering coun-tries: Iraq 814 km, Jordan 744 km, Kuwait 222 km, Oman 676 km,Qatar 60 km, UAE 457 km, Yemen 1458 km). Most of the cities andvillage are either connected with the national electrical grid or withthe isolated grids. Most of the remotely located villages get powerthrough diesel generating power plants. It is really cumbersome tomaintain regular supply of fuel and to ensure the continuouselectricity supply during breakdowns and scheduled shutdowns ofthe diesel units.
In Saudi Arabia, the per capita energy consumption has reachedto 20 kWh/day in 2008 compared to 19.4 kWh/day in 2007 i.e. a netincrease of 3.1% in one year [17], as shown in Fig. 1. A maximum of10% increase in per capita energy was observed in 2004 comparedto that in 2003. On an average over 25 years period from 1984 till2008, 4.1% annual increase in per capita energy per day has beenobserved [17] which is really significant and needs to be addressedimmediately. Moreover, the total installed capacity of the Kingdomin year 2005 was 32,301 MW which increased to 34,825 MW in2006, an increase of 7.81% and then further increased by 6.1% and6.21% in the years 2007 and 2008 compared to 2006 and 2007,respectively, as can be seen from Fig. 2. A jump of 11.89% (i.e. from31,240 MW to 34,953 MW) was observed in peak load in year 2007
e wind speed at 40 m AGL.
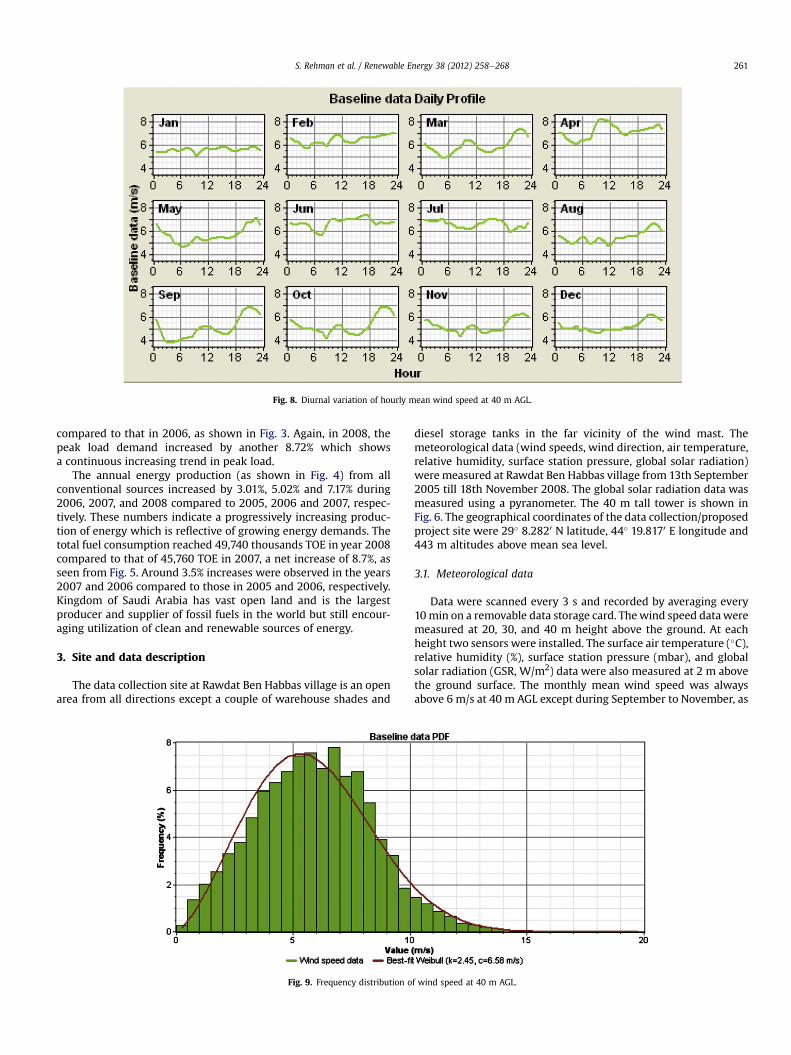
Fig. 8. Diurnal variation of hourly mean wind speed at 40 m AGL.
S. Rehman et al. / Renewable Energy 38 (2012) 258e268 261
compared to that in 2006, as shown in Fig. 3. Again, in 2008, thepeak load demand increased by another 8.72% which showsa continuous increasing trend in peak load.
The annual energy production (as shown in Fig. 4) from allconventional sources increased by 3.01%, 5.02% and 7.17% during2006, 2007, and 2008 compared to 2005, 2006 and 2007, respec-tively. These numbers indicate a progressively increasing produc-tion of energy which is reflective of growing energy demands. Thetotal fuel consumption reached 49,740 thousands TOE in year 2008compared to that of 45,760 TOE in 2007, a net increase of 8.7%, asseen from Fig. 5. Around 3.5% increases were observed in the years2007 and 2006 compared to those in 2005 and 2006, respectively.Kingdom of Saudi Arabia has vast open land and is the largestproducer and supplier of fossil fuels in the world but still encour-aging utilization of clean and renewable sources of energy.
3. Site and data description
The data collection site at Rawdat Ben Habbas village is an openarea from all directions except a couple of warehouse shades and
Fig. 9. Frequency distribution o
diesel storage tanks in the far vicinity of the wind mast. Themeteorological data (wind speeds, wind direction, air temperature,relative humidity, surface station pressure, global solar radiation)were measured at Rawdat Ben Habbas village from 13th September2005 till 18th November 2008. The global solar radiation data wasmeasured using a pyranometer. The 40 m tall tower is shown inFig. 6. The geographical coordinates of the data collection/proposedproject site were 29� 8.2820 N latitude, 44� 19.8170 E longitude and443 m altitudes above mean sea level.
3.1. Meteorological data
Data were scanned every 3 s and recorded by averaging every10min on a removable data storage card. Thewind speed dataweremeasured at 20, 30, and 40 m height above the ground. At eachheight two sensors were installed. The surface air temperature (�C),relative humidity (%), surface station pressure (mbar), and globalsolar radiation (GSR, W/m2) data were also measured at 2 m abovethe ground surface. The monthly mean wind speed was alwaysabove 6 m/s at 40 m AGL except during September to November, as
f wind speed at 40 m AGL.
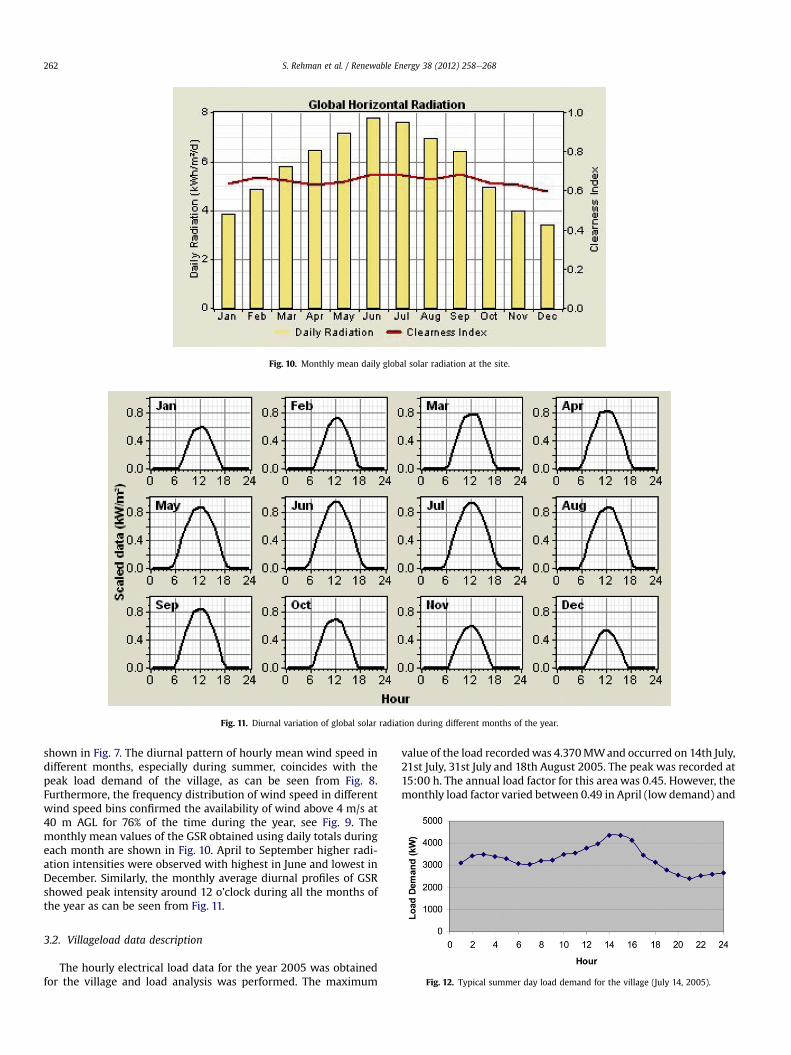
Fig. 10. Monthly mean daily global solar radiation at the site.
Fig. 11. Diurnal variation of global solar radiation during different months of the year.
S. Rehman et al. / Renewable Energy 38 (2012) 258e268262
shown in Fig. 7. The diurnal pattern of hourly mean wind speed indifferent months, especially during summer, coincides with thepeak load demand of the village, as can be seen from Fig. 8.Furthermore, the frequency distribution of wind speed in differentwind speed bins confirmed the availability of wind above 4 m/s at40 m AGL for 76% of the time during the year, see Fig. 9. Themonthly mean values of the GSR obtained using daily totals duringeach month are shown in Fig. 10. April to September higher radi-ation intensities were observed with highest in June and lowest inDecember. Similarly, the monthly average diurnal profiles of GSRshowed peak intensity around 12 o’clock during all the months ofthe year as can be seen from Fig. 11.
Fig. 12. Typical summer day load demand for the village (July 14, 2005).
3.2. Villageload data description
The hourly electrical load data for the year 2005 was obtainedfor the village and load analysis was performed. The maximum
value of the load recordedwas 4.370MWand occurred on 14th July,21st July, 31st July and 18th August 2005. The peak was recorded at15:00 h. The annual load factor for this area was 0.45. However, themonthly load factor varied between 0.49 in April (low demand) and
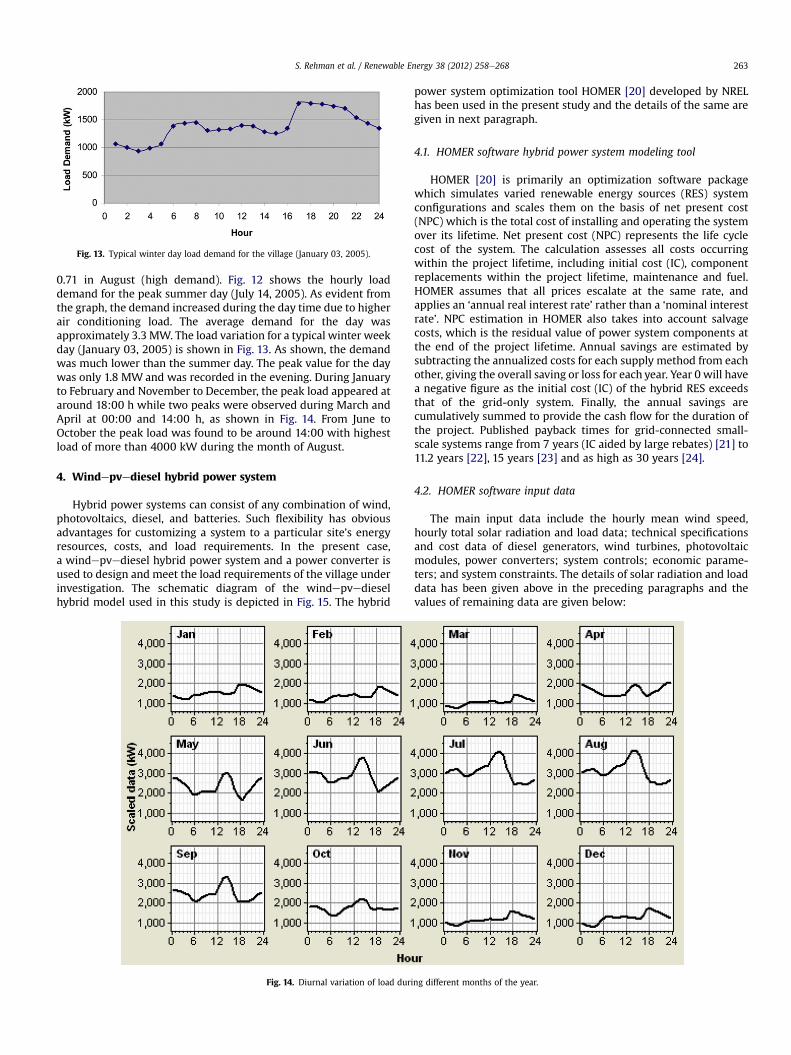
Fig. 13. Typical winter day load demand for the village (January 03, 2005).
S. Rehman et al. / Renewable Energy 38 (2012) 258e268 263
0.71 in August (high demand). Fig. 12 shows the hourly loaddemand for the peak summer day (July 14, 2005). As evident fromthe graph, the demand increased during the day time due to higherair conditioning load. The average demand for the day wasapproximately 3.3 MW. The load variation for a typical winter weekday (January 03, 2005) is shown in Fig. 13. As shown, the demandwas much lower than the summer day. The peak value for the daywas only 1.8 MW and was recorded in the evening. During Januaryto February and November to December, the peak load appeared ataround 18:00 h while two peaks were observed during March andApril at 00:00 and 14:00 h, as shown in Fig. 14. From June toOctober the peak load was found to be around 14:00 with highestload of more than 4000 kW during the month of August.
4. Windepvediesel hybrid power system
Hybrid power systems can consist of any combination of wind,photovoltaics, diesel, and batteries. Such flexibility has obviousadvantages for customizing a system to a particular site’s energyresources, costs, and load requirements. In the present case,a windepvediesel hybrid power system and a power converter isused to design and meet the load requirements of the village underinvestigation. The schematic diagram of the windepvedieselhybrid model used in this study is depicted in Fig. 15. The hybrid
Fig. 14. Diurnal variation of load duri
power system optimization tool HOMER [20] developed by NRELhas been used in the present study and the details of the same aregiven in next paragraph.
4.1. HOMER software hybrid power system modeling tool
HOMER [20] is primarily an optimization software packagewhich simulates varied renewable energy sources (RES) systemconfigurations and scales them on the basis of net present cost(NPC) which is the total cost of installing and operating the systemover its lifetime. Net present cost (NPC) represents the life cyclecost of the system. The calculation assesses all costs occurringwithin the project lifetime, including initial cost (IC), componentreplacements within the project lifetime, maintenance and fuel.HOMER assumes that all prices escalate at the same rate, andapplies an ‘annual real interest rate’ rather than a ‘nominal interestrate’. NPC estimation in HOMER also takes into account salvagecosts, which is the residual value of power system components atthe end of the project lifetime. Annual savings are estimated bysubtracting the annualized costs for each supply method from eachother, giving the overall saving or loss for each year. Year 0 will havea negative figure as the initial cost (IC) of the hybrid RES exceedsthat of the grid-only system. Finally, the annual savings arecumulatively summed to provide the cash flow for the duration ofthe project. Published payback times for grid-connected small-scale systems range from 7 years (IC aided by large rebates) [21] to11.2 years [22], 15 years [23] and as high as 30 years [24].
4.2. HOMER software input data
The main input data include the hourly mean wind speed,hourly total solar radiation and load data; technical specificationsand cost data of diesel generators, wind turbines, photovoltaicmodules, power converters; system controls; economic parame-ters; and system constraints. The details of solar radiation and loaddata has been given above in the preceding paragraphs and thevalues of remaining data are given below:
ng different months of the year.
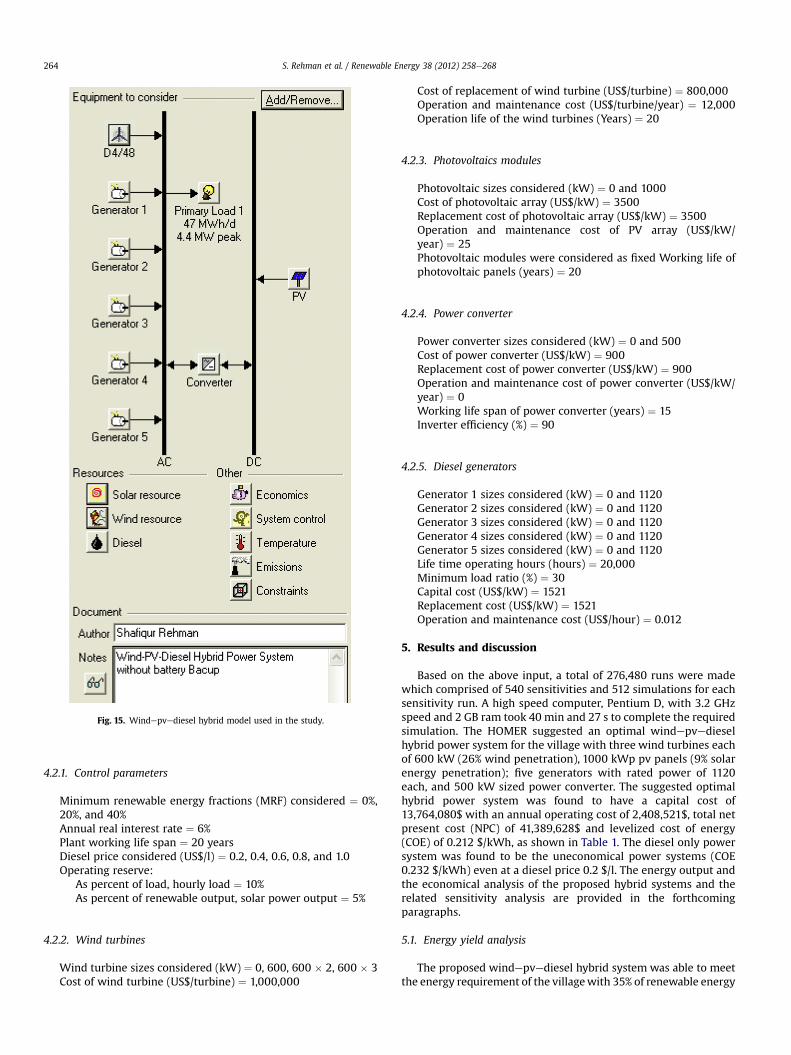
Fig. 15. Windepvediesel hybrid model used in the study.
S. Rehman et al. / Renewable Energy 38 (2012) 258e268264
4.2.1. Control parameters
Minimum renewable energy fractions (MRF) considered ¼ 0%,20%, and 40%Annual real interest rate ¼ 6%Plant working life span ¼ 20 yearsDiesel price considered (US$/l) ¼ 0.2, 0.4, 0.6, 0.8, and 1.0Operating reserve:
As percent of load, hourly load ¼ 10%As percent of renewable output, solar power output ¼ 5%
4.2.2. Wind turbines
Wind turbine sizes considered (kW) ¼ 0, 600, 600 � 2, 600 � 3Cost of wind turbine (US$/turbine) ¼ 1,000,000
Cost of replacement of wind turbine (US$/turbine) ¼ 800,000Operation and maintenance cost (US$/turbine/year) ¼ 12,000Operation life of the wind turbines (Years) ¼ 20
4.2.3. Photovoltaics modules
Photovoltaic sizes considered (kW) ¼ 0 and 1000Cost of photovoltaic array (US$/kW) ¼ 3500Replacement cost of photovoltaic array (US$/kW) ¼ 3500Operation and maintenance cost of PV array (US$/kW/year) ¼ 25Photovoltaic modules were considered as fixed Working life ofphotovoltaic panels (years) ¼ 20
4.2.4. Power converter
Power converter sizes considered (kW) ¼ 0 and 500Cost of power converter (US$/kW) ¼ 900Replacement cost of power converter (US$/kW) ¼ 900Operation and maintenance cost of power converter (US$/kW/year) ¼ 0Working life span of power converter (years) ¼ 15Inverter efficiency (%) ¼ 90
4.2.5. Diesel generators
Generator 1 sizes considered (kW) ¼ 0 and 1120Generator 2 sizes considered (kW) ¼ 0 and 1120Generator 3 sizes considered (kW) ¼ 0 and 1120Generator 4 sizes considered (kW) ¼ 0 and 1120Generator 5 sizes considered (kW) ¼ 0 and 1120Life time operating hours (hours) ¼ 20,000Minimum load ratio (%) ¼ 30Capital cost (US$/kW) ¼ 1521Replacement cost (US$/kW) ¼ 1521Operation and maintenance cost (US$/hour) ¼ 0.012
5. Results and discussion
Based on the above input, a total of 276,480 runs were madewhich comprised of 540 sensitivities and 512 simulations for eachsensitivity run. A high speed computer, Pentium D, with 3.2 GHzspeed and 2 GB ram took 40 min and 27 s to complete the requiredsimulation. The HOMER suggested an optimal windepvedieselhybrid power system for the village with three wind turbines eachof 600 kW (26% wind penetration), 1000 kWp pv panels (9% solarenergy penetration); five generators with rated power of 1120each, and 500 kW sized power converter. The suggested optimalhybrid power system was found to have a capital cost of13,764,080$ with an annual operating cost of 2,408,521$, total netpresent cost (NPC) of 41,389,628$ and levelized cost of energy(COE) of 0.212 $/kWh, as shown in Table 1. The diesel only powersystem was found to be the uneconomical power systems (COE0.232 $/kWh) even at a diesel price 0.2 $/l. The energy output andthe economical analysis of the proposed hybrid systems and therelated sensitivity analysis are provided in the forthcomingparagraphs.
5.1. Energy yield analysis
The proposed windepvediesel hybrid system was able to meetthe energy requirement of the villagewith 35% of renewable energy
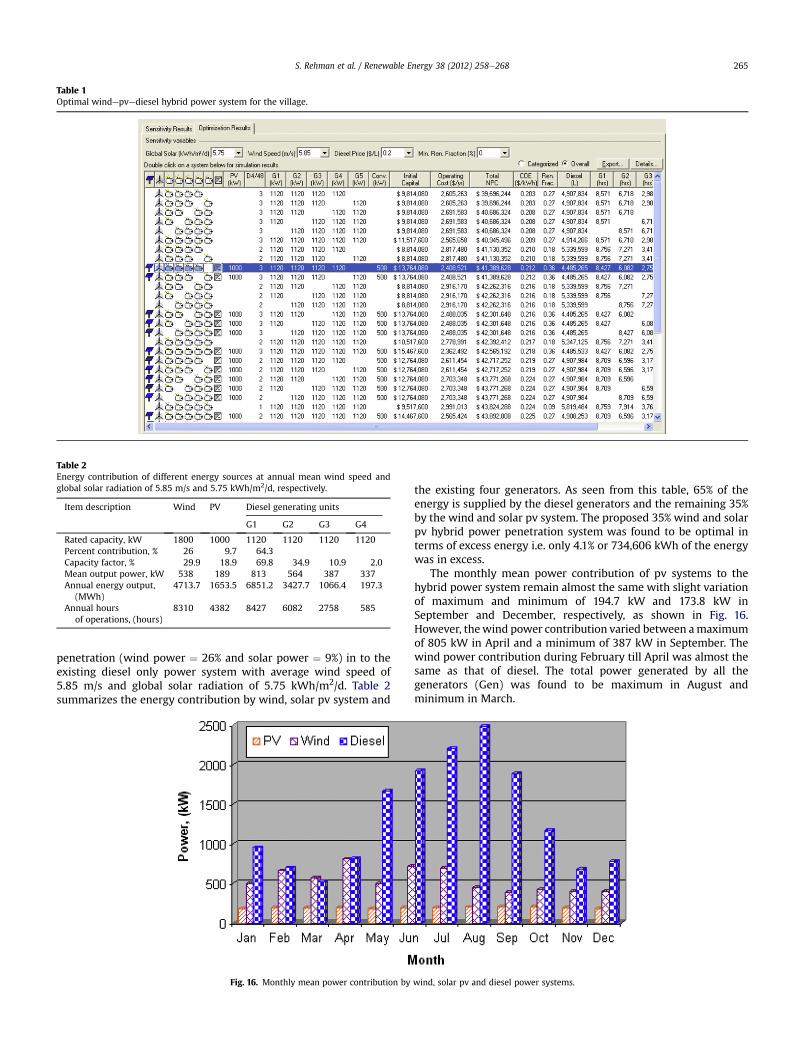
Table 1Optimal windepvediesel hybrid power system for the village.
Table 2Energy contribution of different energy sources at annual mean wind speed andglobal solar radiation of 5.85 m/s and 5.75 kWh/m2/d, respectively.
Item description Wind PV Diesel generating units
G1 G2 G3 G4
Rated capacity, kW 1800 1000 1120 1120 1120 1120Percent contribution, % 26 9.7 64.3Capacity factor, % 29.9 18.9 69.8 34.9 10.9 2.0Mean output power, kW 538 189 813 564 387 337Annual energy output,
(MWh)4713.7 1653.5 6851.2 3427.7 1066.4 197.3
Annual hoursof operations, (hours)
8310 4382 8427 6082 2758 585
S. Rehman et al. / Renewable Energy 38 (2012) 258e268 265
penetration (wind power ¼ 26% and solar power ¼ 9%) in to theexisting diesel only power system with average wind speed of5.85 m/s and global solar radiation of 5.75 kWh/m2/d. Table 2summarizes the energy contribution by wind, solar pv system and
Fig. 16. Monthly mean power contribution by
the existing four generators. As seen from this table, 65% of theenergy is supplied by the diesel generators and the remaining 35%by the wind and solar pv system. The proposed 35% wind and solarpv hybrid power penetration system was found to be optimal interms of excess energy i.e. only 4.1% or 734,606 kWh of the energywas in excess.
The monthly mean power contribution of pv systems to thehybrid power system remain almost the same with slight variationof maximum and minimum of 194.7 kW and 173.8 kW inSeptember and December, respectively, as shown in Fig. 16.However, thewind power contribution varied between amaximumof 805 kW in April and a minimum of 387 kW in September. Thewind power contribution during February till April was almost thesame as that of diesel. The total power generated by all thegenerators (Gen) was found to be maximum in August andminimum in March.
wind, solar pv and diesel power systems.
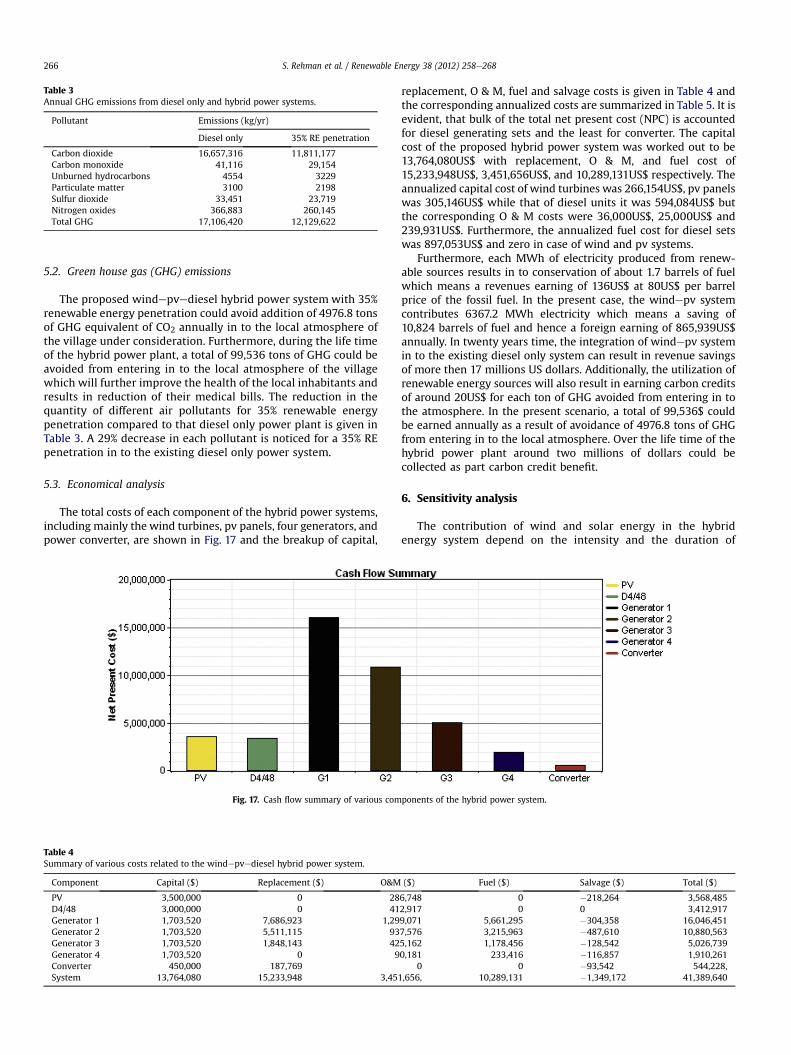
Table 3Annual GHG emissions from diesel only and hybrid power systems.
Pollutant Emissions (kg/yr)
Diesel only 35% RE penetration
Carbon dioxide 16,657,316 11,811,177Carbon monoxide 41,116 29,154Unburned hydrocarbons 4554 3229Particulate matter 3100 2198Sulfur dioxide 33,451 23,719Nitrogen oxides 366,883 260,145Total GHG 17,106,420 12,129,622
S. Rehman et al. / Renewable Energy 38 (2012) 258e268266
5.2. Green house gas (GHG) emissions
The proposed windepvediesel hybrid power system with 35%renewable energy penetration could avoid addition of 4976.8 tonsof GHG equivalent of CO2 annually in to the local atmosphere ofthe village under consideration. Furthermore, during the life timeof the hybrid power plant, a total of 99,536 tons of GHG could beavoided from entering in to the local atmosphere of the villagewhich will further improve the health of the local inhabitants andresults in reduction of their medical bills. The reduction in thequantity of different air pollutants for 35% renewable energypenetration compared to that diesel only power plant is given inTable 3. A 29% decrease in each pollutant is noticed for a 35% REpenetration in to the existing diesel only power system.
5.3. Economical analysis
The total costs of each component of the hybrid power systems,including mainly the wind turbines, pv panels, four generators, andpower converter, are shown in Fig. 17 and the breakup of capital,
Fig. 17. Cash flow summary of various com
Table 4Summary of various costs related to the windepvediesel hybrid power system.
Component Capital ($) Replacement ($) O&M
PV 3,500,000 0 28D4/48 3,000,000 0 41Generator 1 1,703,520 7,686,923 1,29Generator 2 1,703,520 5,511,115 93Generator 3 1,703,520 1,848,143 42Generator 4 1,703,520 0 9Converter 450,000 187,769System 13,764,080 15,233,948 3,451
replacement, O & M, fuel and salvage costs is given in Table 4 andthe corresponding annualized costs are summarized in Table 5. It isevident, that bulk of the total net present cost (NPC) is accountedfor diesel generating sets and the least for converter. The capitalcost of the proposed hybrid power system was worked out to be13,764,080US$ with replacement, O & M, and fuel cost of15,233,948US$, 3,451,656US$, and 10,289,131US$ respectively. Theannualized capital cost of wind turbines was 266,154US$, pv panelswas 305,146US$ while that of diesel units it was 594,084US$ butthe corresponding O & M costs were 36,000US$, 25,000US$ and239,931US$. Furthermore, the annualized fuel cost for diesel setswas 897,053US$ and zero in case of wind and pv systems.
Furthermore, each MWh of electricity produced from renew-able sources results in to conservation of about 1.7 barrels of fuelwhich means a revenues earning of 136US$ at 80US$ per barrelprice of the fossil fuel. In the present case, the windepv systemcontributes 6367.2 MWh electricity which means a saving of10,824 barrels of fuel and hence a foreign earning of 865,939US$annually. In twenty years time, the integration of windepv systemin to the existing diesel only system can result in revenue savingsof more then 17 millions US dollars. Additionally, the utilization ofrenewable energy sources will also result in earning carbon creditsof around 20US$ for each ton of GHG avoided from entering in tothe atmosphere. In the present scenario, a total of 99,536$ couldbe earned annually as a result of avoidance of 4976.8 tons of GHGfrom entering in to the local atmosphere. Over the life time of thehybrid power plant around two millions of dollars could becollected as part carbon credit benefit.
6. Sensitivity analysis
The contribution of wind and solar energy in the hybridenergy system depend on the intensity and the duration of
ponents of the hybrid power system.
($) Fuel ($) Salvage ($) Total ($)
6,748 0 �218,264 3,568,4852,917 0 0 3,412,9179,071 5,661,295 �304,358 16,046,4517,576 3,215,963 �487,610 10,880,5635,162 1,178,456 �128,542 5,026,7390,181 233,416 �116,857 1,910,261
0 0 �93,542 544,228,,656, 10,289,131 �1,349,172 41,389,640
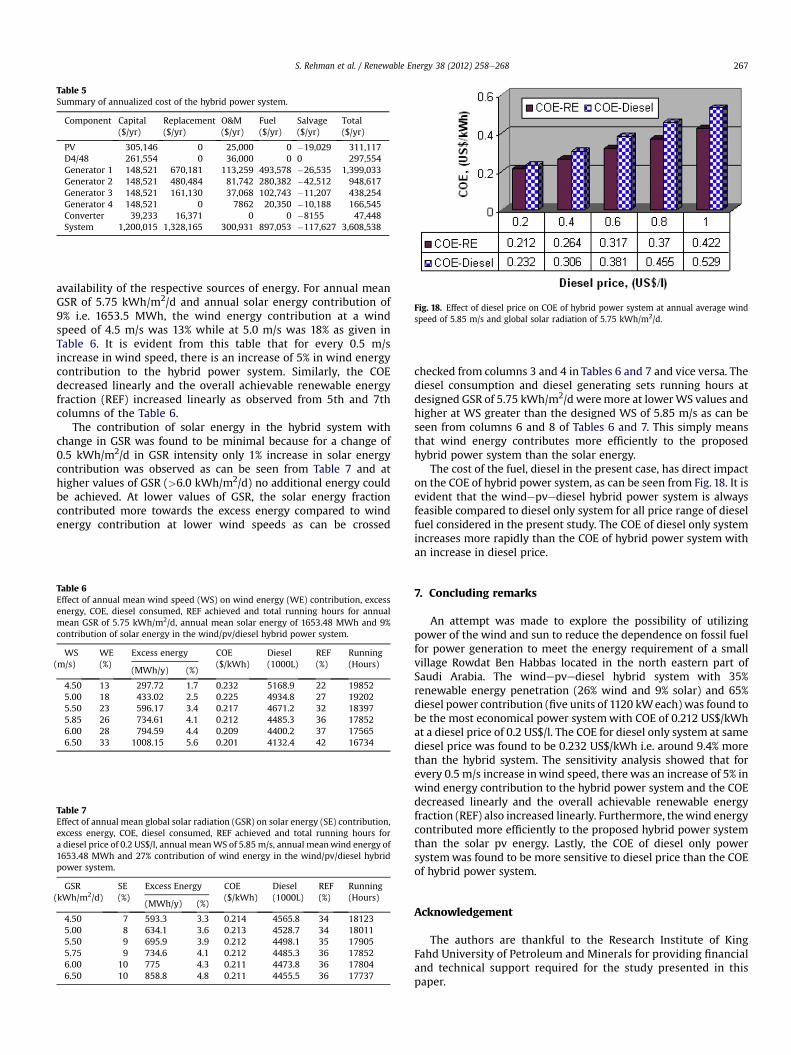
Table 5Summary of annualized cost of the hybrid power system.
Component Capital($/yr)
Replacement($/yr)
O&M($/yr)
Fuel($/yr)
Salvage($/yr)
Total($/yr)
PV 305,146 0 25,000 0 �19,029 311,117D4/48 261,554 0 36,000 0 0 297,554Generator 1 148,521 670,181 113,259 493,578 �26,535 1,399,033Generator 2 148,521 480,484 81,742 280,382 �42,512 948,617Generator 3 148,521 161,130 37,068 102,743 �11,207 438,254Generator 4 148,521 0 7862 20,350 �10,188 166,545Converter 39,233 16,371 0 0 �8155 47,448System 1,200,015 1,328,165 300,931 897,053 �117,627 3,608,538
Fig. 18. Effect of diesel price on COE of hybrid power system at annual average windspeed of 5.85 m/s and global solar radiation of 5.75 kWh/m2/d.
S. Rehman et al. / Renewable Energy 38 (2012) 258e268 267
availability of the respective sources of energy. For annual meanGSR of 5.75 kWh/m2/d and annual solar energy contribution of9% i.e. 1653.5 MWh, the wind energy contribution at a windspeed of 4.5 m/s was 13% while at 5.0 m/s was 18% as given inTable 6. It is evident from this table that for every 0.5 m/sincrease in wind speed, there is an increase of 5% in wind energycontribution to the hybrid power system. Similarly, the COEdecreased linearly and the overall achievable renewable energyfraction (REF) increased linearly as observed from 5th and 7thcolumns of the Table 6.
The contribution of solar energy in the hybrid system withchange in GSR was found to be minimal because for a change of0.5 kWh/m2/d in GSR intensity only 1% increase in solar energycontribution was observed as can be seen from Table 7 and athigher values of GSR (>6.0 kWh/m2/d) no additional energy couldbe achieved. At lower values of GSR, the solar energy fractioncontributed more towards the excess energy compared to windenergy contribution at lower wind speeds as can be crossed
Table 6Effect of annual mean wind speed (WS) on wind energy (WE) contribution, excessenergy, COE, diesel consumed, REF achieved and total running hours for annualmean GSR of 5.75 kWh/m2/d, annual mean solar energy of 1653.48 MWh and 9%contribution of solar energy in the wind/pv/diesel hybrid power system.
WS(m/s)
WE(%)
Excess energy COE($/kWh)
Diesel(1000L)
REF(%)
Running(Hours)
(MWh/y) (%)
4.50 13 297.72 1.7 0.232 5168.9 22 198525.00 18 433.02 2.5 0.225 4934.8 27 192025.50 23 596.17 3.4 0.217 4671.2 32 183975.85 26 734.61 4.1 0.212 4485.3 36 178526.00 28 794.59 4.4 0.209 4400.2 37 175656.50 33 1008.15 5.6 0.201 4132.4 42 16734
Table 7Effect of annual mean global solar radiation (GSR) on solar energy (SE) contribution,excess energy, COE, diesel consumed, REF achieved and total running hours fora diesel price of 0.2 US$/l, annual meanWS of 5.85 m/s, annual meanwind energy of1653.48 MWh and 27% contribution of wind energy in the wind/pv/diesel hybridpower system.
GSR(kWh/m2/d)
SE(%)
Excess Energy COE($/kWh)
Diesel(1000L)
REF(%)
Running(Hours)
(MWh/y) (%)
4.50 7 593.3 3.3 0.214 4565.8 34 181235.00 8 634.1 3.6 0.213 4528.7 34 180115.50 9 695.9 3.9 0.212 4498.1 35 179055.75 9 734.6 4.1 0.212 4485.3 36 178526.00 10 775 4.3 0.211 4473.8 36 178046.50 10 858.8 4.8 0.211 4455.5 36 17737
checked from columns 3 and 4 in Tables 6 and 7 and vice versa. Thediesel consumption and diesel generating sets running hours atdesigned GSR of 5.75 kWh/m2/d weremore at lowerWS values andhigher at WS greater than the designed WS of 5.85 m/s as can beseen from columns 6 and 8 of Tables 6 and 7. This simply meansthat wind energy contributes more efficiently to the proposedhybrid power system than the solar energy.
The cost of the fuel, diesel in the present case, has direct impacton the COE of hybrid power system, as can be seen from Fig. 18. It isevident that the windepvediesel hybrid power system is alwaysfeasible compared to diesel only system for all price range of dieselfuel considered in the present study. The COE of diesel only systemincreases more rapidly than the COE of hybrid power system withan increase in diesel price.
7. Concluding remarks
An attempt was made to explore the possibility of utilizingpower of the wind and sun to reduce the dependence on fossil fuelfor power generation to meet the energy requirement of a smallvillage Rowdat Ben Habbas located in the north eastern part ofSaudi Arabia. The windepvediesel hybrid system with 35%renewable energy penetration (26% wind and 9% solar) and 65%diesel power contribution (five units of 1120 kWeach) was found tobe the most economical power systemwith COE of 0.212 US$/kWhat a diesel price of 0.2 US$/l. The COE for diesel only system at samediesel price was found to be 0.232 US$/kWh i.e. around 9.4% morethan the hybrid system. The sensitivity analysis showed that forevery 0.5 m/s increase inwind speed, there was an increase of 5% inwind energy contribution to the hybrid power system and the COEdecreased linearly and the overall achievable renewable energyfraction (REF) also increased linearly. Furthermore, thewind energycontributed more efficiently to the proposed hybrid power systemthan the solar pv energy. Lastly, the COE of diesel only powersystemwas found to be more sensitive to diesel price than the COEof hybrid power system.
Acknowledgement
The authors are thankful to the Research Institute of KingFahd University of Petroleum and Minerals for providing financialand technical support required for the study presented in thispaper.
S. Rehman et al. / Renewable Energy 38 (2012) 258e268268
References
[1] Muselli M, Notton G, Louche A. Design of hybrid-photovoltaic power gener-ator, with optimization of energy management. Solar Energy 1999;65(3):143e57.
[2] Bagen BR. Evaluation of different operating strategies in small stand-alonepower systems. IEEE Transactions on Energy Conversion 2005;20(3):654e60.
[3] Yang H, Wei Z, Chengzhi L. Optimal design and techno-economic analysis ofa hybrid solar-wind power generation system. Applied Energy 2009;86:163.
[4] Yang H, Zhou W, Lu L, Fang Z. Optimal sizing method for stand-alone hybridsolar-wind system with LPSP technology by using genetic algorithm. SolarEnergy 2008;82:354.
[5] Barley CD. Optimal dispatch strategy in remote hybrid power systems. SolarEnergy 1996;58:165e79.
[6] Bryne J, Shen B, Wallace B. The economics of sustainable energy for ruraldevelopment: a study of renewable energy in China. Energy Policy 1998;26:45e54.
[7] Celik AN. A simplified model for estimating yearly wind fraction. RenewableEnergy 2006;31:105e18.
[8] Cavello AJ, Grubb AM. Renewable energy sources for fuels and electricity.London: Earthscan; 1993.
[9] Dihrab SS, Sopian K. Electricity generation of hybrid PV/wind systems in Iraq.Renewable Energy 2010;35:1303e7.
[10] Ekren O, Ekren BY, Ozerdem B. Break-even analysis and size optimization ofa PV/wind hybrid energy conversion system with battery storage e a casestudy. Applied Energy 2009;86(7e8):1043e54.
[11] Saheb-Koussa D, Haddadi M, Belhamel M. Economic and technical study ofa hybrid system (windephotovoltaicediesel) for rural electrification inAlgeria. Applied Energy 2009;86:1024e30.
[12] Nfah EM, Ngundam JM, Tchinda R. Modelling of solar/diesel/battery hybridpower systems for far-north Cameroon. Renewable Energy 2007;32:832e44.
[13] Bernal-Agustın Jose L, Dufo-Lopez R. Techno-economical optimization of theproduction of hydrogen from PV-Wind systems connected to the electricalgrid. Renewable Energy 2010;35:747e58.
[14] Arribas L, Cano L, Cruz I, Mata M, Llobet E. PVewind hybrid system perfor-mance: a new approach and a case study. Renewable Energy 2010;35:128e37.
[15] Sopian K, Ibrahim MZ, Daud WRW, Othman MY, Yatim B, Amin N. Perfor-mance of a PVewind hybrid system for hydrogen production. RenewableEnergy 2009;34:1973e8.
[16] Mahmoudi H, Abdul-Wahab SA, Goosen MFA, Sablani SS, Perret J, Ouagued A,et al. Weather data and analysis of hybrid photovoltaic-wind power genera-tion systems adapted to a seawater greenhouse desalination unit designed forarid coastal countries. Desalination 2008;222:119.
[17] Dufo-Lopez R, Bernal-Agustın Jose L. Multi-objective design of PVe windediesele hydrogene battery systems. Renewable Energy 2008;33:2559e72.
[18] Shakya BD, Aye L, Musgrave P. Technical feasibility and financial analysis ofhybrid wind-photovoltaic system with hydrogen storage for Cooma. Inter-national Journal of Hydrogen Energy 2005;30:9.
[19] Tina G, Gagliano S, Raiti S. Hybrid solar/wind power system probabilisticmodeling for long-term performance assessment. Solar Energy 2006;80:578.
[20] Lambert T and Lilienthal P. HOMER: the micro-power optimization model.Software Developed by NREL. Available from: <www.nrel/gov/HOMER>;2004 http://www.mistaya.ca/homer/MicropowerSystemModelingWithHOMER.pdf.
[21] Rhoads-Weaver H, Grove J. Exploring joint green tag financing and marketingmodels for energy independence. In: Conference proceedings of globalwindpower. NREL, http://www.ourwind.org/windcoop/pdfs/AWEA_Paper.pdf.
[22] Yang D. Local photovoltaic wind hybrid system with battery storage or gridconnection. NREL, http://www.chem.jyu.fi/ue/frame_left/UEsem2005-Yang.pdf.
[23] Edwards JL, Wiser R, Bolinger M, Forsyth T. Building a market for small wind:the break-even turnkey cost of residential wind systems in the United States.Berkeley, CA (US): Ernest Orlando Lawrence Berkeley National Laboratory,http://www.osti.gov/energycitations/product.biblio.jsp?osti_id1/4823465.
[24] Forsyth T, Tu P, Gilbert J. Economics of grid-connected small wind turbines inthe domestic market. National Renewable Energy Laboratory (NREL). Avail-able from: http://www.nrel.gov/docs/fy00osti/26975.pdf.