fear and loathing across party lines: new evidence … · fear and loathing across party lines: new...
TRANSCRIPT
Fear and Loathing Across Party Lines: New Evidenceon Group Polarization
Shanto Iyengar1 and Sean J. Westwood ∗2
1Chandler Chair of Communication and Professor of Political ScienceStanford University
Building 120, Room 110450 Serra Mall
Stanford, CA 94305-2050
2Post-Doctoral ResearcherPrinceton University308 Robertson HallPrinceton, NJ 08544
June 2014
∗We are grateful for helpful comments and suggestions from the editors of the AJPS, our anonymousreviewers, Alan Abramowitz, Lauren Davenport, Jamie Druckman, Mo Fiorina, Justin Grimmer, YphtachLelkes, Jane Mansbridge, Solomon Messing, Erik Perterson, Paul Sniderman, Sidney Verba, Rebecca Weiss,and Frances Zlotnick.
1

Abstract
When defined in terms of social identity and affect toward co-partisans and op-
posing partisans, the polarization of the American electorate has dramatically
increased. We document the scope and consequences of affective polarization of
partisans using implicit, explicit and behavioral indicators. Our evidence demon-
strates that hostile feelings for the opposing party are ingrained or automatic in
voters’ minds, and that affective polarization based on party is just as strong
as polarization based on race. We further show that party cues exert powerful
effects on non-political judgments and behaviors. Partisans discriminate against
opposing partisans, and do so to a degree that exceeds discrimination based on
race. We note that the willingness of partisans to display open animus for oppos-
ing partisans can be attributed to the absence of norms governing the expression
of negative sentiment and that increased partisan affect provides an incentive for
elites to engage in confrontation rather than cooperation.
More than fifty years after the publication of The American Voter, debates over the na-
ture of partisanship and the extent of party polarization continue (see Fiorina & Abrams,
2008; Hetherington, 2009).1 While early studies viewed partisanship as a manifestation of
other group affiliations (Berelson, Lazarsfeld, and McPhee 1954; Campbell et al. 1960),
more recent work suggests that party is an important form of social identity in its own
right (Green, Palmquist, and Schickler 2004; Greene 1999; Huddy, Mason, and Aarøe 2010;
Iyengar, Sood, and Lelkes 2012). As anticipated by social identity theorists (e.g. Tajfel
1970; Tajfel and Turner 1979), under conditions of group competition, the sense of group
membership inculcates positive evaluations of the in-group and correspondingly hostile eval-
uations of out-groups. In the case of partisanship, this divergence in affect toward the in and
out parties—affective polarization—has increased substantially over the past four decades
(Haidt and Hetherington 2012; Iyengar, Sood, and Lelkes 2012).
Unlike race, gender and other social divides where group-related attitudes and behaviors
are constrained by social norms (Maccoby and Maccoby 1954; Sigall and Page 1971; Him-
melfarb and Lickteig 1982), there are no corresponding pressures to temper disapproval of
political opponents. If anything, the rhetoric and actions of political leaders demonstrate
that hostility directed at the opposition is acceptable, even appropriate. Partisans therefore
feel free to express animus and engage in discriminatory behavior toward opposing partisans.
Scholars have typically treated the sense of partisan identity as a major cue for political
choices, most notably, voting behavior. We demonstrate that partisan cues now also influence
decisions outside of politics and that partisanship is a political and social divide. Using novel
measurement techniques, we directly compare implicit, explicit and behavioral measures of
partisan affect with affect based on racial identity. We find that implicit affect and behavioral
discrimination based on partisanship are just as significant as affect and discrimination based
on race.
Our argument proceeds in two parts. We first scale the magnitude of the in-group versus
1Replication data available on the AJPS Data Archive.
3

out-group partisan divide against the comparable divide for race. To ensure a fair comparison
we use implicit measures. The use of implicit measures allows us to assess racial attitudes
that are uncontaminated by social desirability biases (Asendorpf, Banse, and Mcke 2002;
Boysen, Vogel, and Madon 2006) and to capture unconscious attitudes (Greenwald, McGhee,
and Schwartz 1998) that are difficult to manipulate. By documenting significant implicit
partisan affective polarization, we demonstrate that hostile feelings for the opposing party
are ingrained and automatic in voters’ minds. The general agreement that race represents
the deepest divide in American society (Myrdal 1944; Pager and Shepherd 2008; Schuman et
al. 1997), makes racial affect a particularly robust benchmark for the assessment of partisan
affect. We show that the level of partisan animus in the American public exceeds racial
hostility.
Second, through three experiments we show that partisanship and partisan affect are
strong cues for non-political judgments and behaviors. We continue to benchmark the ef-
fects of partisan bias against racial bias. In the absence of a social norm or sanction that
discourages partisan discrimination, we show in three independent studies that partisans
frequently choose to discriminate against opposing partisans. We further document that
discrimination against the out-group is based more on out-group animus than in-group fa-
voritism.
Affective Polarization by Party: The State of the Evi-
dence
We define affective polarization as the tendency of people identifying as Republicans or
Democrats to view opposing partisans negatively and co-partisans positively (Campbell et
al. 1960; Green, Palmquist, and Schickler 2004). This affective separation is a result of
classifying opposing partisans as members of an out-group and co-partisans as members of
an in-group. The standard definition of an “out-group” is a group to which a person does not
4
belong, while an “in-group” is a group to which a person does belong. Research in psychology
generally shows that members of an in-group frequently ascribe undesirable or inappropriate
traits to members of out-groups (Tajfel 1970; Tajfel and Turner 1979), though some high-
status out-groups such as Whites are viewed positively by out-group members (Jost and
Banaji 1994). Classic studies by psychologists have demonstrated that the mere act of
identifying with a particular group in competitive environments—no matter how trivial the
basis for group assignment—is often sufficient to trigger negative evaluations of out-groups
(see Billig and Tajfel 1973).
In the contemporary American political environment, there is evidence of increasing
hostility across party lines, which has been attributed to a variety of factors including can-
didates’ reliance on negative campaigning and the availability of news sources with a clear
partisan preference (see Iyengar, Sood, and Lelkes 2012; Lelkes and Iyengar 2012). Among
Americans who say they identify with a political party, negative views of the out party and
its supporters have risen sharply since the 1980s (Haidt and Hetherington 2012; Iyengar,
Sood, and Lelkes 2012). Not only are group evaluations polarized along party lines, but
the specific content of out-group stereotypes has also followed suit. While Republicans view
fellow partisans as patriotic, well-informed, and altruistic, Democrats are judged to exhibit
precisely the opposite traits (see Iyengar, Sood, and Lelkes 2012). Citizens are also more
dubious of the motivations and ulterior motives of politicians from opposing parties than
co-partisans (Munro, Weih, and Tsai 2010).
Intrusion of Partisan Cues into Everyday Life
Unlike race and gender, which are physical traits, partisanship is a less obvious affiliation.
Nonetheless, there are ample opportunities to discern partisan cues. Political discussion at
the workplace provides one such opportunity (Mutz and Mondak 2006). Exposure to social
networks is another; on Facebook 35 million Americans like Barack Obama, 11 million like
5
Mitt Romney, and more than 25 million like various national politicians and news correspon-
dents for Fox News and MSNBC (“Facebook” 2013). Partisan affiliation is also displayed
openly on cars and lawns. Two months before the end of the 2012 election, Obama for
America sold—only counting official campaign sales—over $43 million dollars in campaign
merchandise such as t-shirts and bumper stickers (Korte 2012). Thus, for a large portion of
the electorate information on individuals’ political affiliations is conveniently accessible.
Even more striking than the availability of partisan cues is the gradual encroachment
of party preference into non-political and hitherto personal domains. Residential neigh-
borhoods are increasingly politically homogeneous (Bishop 2008) and geographic distance
creates social distance (Bogardus 1925). A standard measure of social distance—parents’
displeasure over the prospects of their offspring marrying into a family with a different party
affiliation—shows startling increases in the United States, but not in Britain (Iyengar, Sood,
and Lelkes 2012). The stated preference for same-party marriage is but the tip of an eviden-
tiary iceberg concerning the growing relevance of partisan cues for interpersonal relations.
Actual marriage across party lines is rare; in a 2009 survey of married couples, only nine
percent consisted of Democrat-Republican pairs (Rosenfeld, Reuben, and Falcon 2011; also
see Stoker and Jennings 1995). Moreover, marital selection based on partisanship exceeds
selection based on physical (e.g. body shape) or personality attributes (Alford et al. 2011).
Recent data from online dating sites are especially revealing. Even though single men and
women seeking companionship online behave strategically and exclude political interests
from their personal profiles (Klofstad, McDermott, and Hatemi 2012), partisan agreement
nevertheless predicts reciprocal communication between men and women seeking potential
dates (Huber and Malhotra 2012). As the authors of one inter-marriage study put it, “the
timeless character of political divisiveness may emanate not just from the machinations of
elites, but also from the nuances of courtship” (Alford et al. 2011, 378).
All told, despite only mixed evidence of sharp ideological or partisan divergence in their
policy preferences, Americans increasingly dislike people and groups on the other side of the
6
political divide and face no social repercussions for the open expression of these attitudes.
Heightened affective polarization has widened the reach of partisan cues; party affiliation
increasingly constrains social and personal ties.
Hypotheses
Our underlying research questions are 1) how does partisan affect compare with affect
based on other social divides, and 2) to what extent are partisans willing to discriminate
against opposing partisans in non-political decisions? For the first research question we
hypothesize 1) that partisan affect is sufficiently ingrained in citizen consciousness to manifest
itself in implicit indicators of partisan attitudes and 2) that the effect size of partisan affect
is larger than the effect size of affect for other social divides where social norms discourage
discrimination. For the second research question, our hypotheses are 1) that partisanship
and partisan affect motivate respondents to make determinations and judgments that are
biased in favor of co-partisans and 2) that co-partisan favoritism is a weaker influence than
animosity toward opposing partisans.
Study 1: Anchoring Partisan Affect
The growth of explicit partisan affective polarization is clear from analysis of survey data
(Iyengar, Sood, and Lelkes 2012), but these data only show that people report affective biases
when evaluating partisan groups. Survey data do not show the extent to which affective
partisan attitudes are ingrained in the minds of public. Survey data are also subject to
cognitive manipulation, which allows participants to filter or under-report actual partisan
affect. To address these limitations, we designed Study 1 to measure implicit partisan affect.
Implicit attitudes are the “[t]races of past experience that mediate favorable or unfavor-
able feeling, thought, or action toward social objects” (Greenwald and Banaji 1995). The
detection of implicit partisan affect thus shows that the sense of partisan identity is deeply
7
embedded in citizen’s minds. We also include an implicit assessment of racial affect to anchor
the measure of implicit partisan affect. The general argument is that implicit measures—not
subject to cognitive processing—are more accurate since they do not permit active masking
of feelings toward out-groups. Unobtrusive measures such as the Implicit Association Test
(IAT) developed by Greenwald et al. (1998) and the brief version or BIAT developed by
Sriram and Greenwald (2009) are much harder to manipulate than explicit self-reports, pro-
ducing more valid and less biased results (Asendorpf, Banse, and Mcke 2002; Boysen, Vogel,
and Madon 2006).
The full IAT measures the reaction time necessary to associate in-groups and out-groups
(such as “Democrat” and “Republican” or “African American” and “European American”)
with positive and negative attributes (such as “good” and “bad”). While completing the task,
participants are instructed to go as quickly as possible. Since people are able to respond faster
to group-attribute pairs for which they have acquired automatic associations, the metric of
the IAT compares the time taken to respond to pairings of in-group + good with out-group
+ good as well as in-group + bad and out-group + bad. The differences in response times to
the group pairings are used to generate an indirect measure of group preference. Since the
full version of the IAT requires more than fifteen minutes to administer, psychologists have
developed (and validated) a brief version (BIAT), which measures the same associations,
but with a reduced number of trials. We measure implicit racial affect using the standard
European American/African American BIAT and implicit partisan affect using a partisan
BIAT that we created.
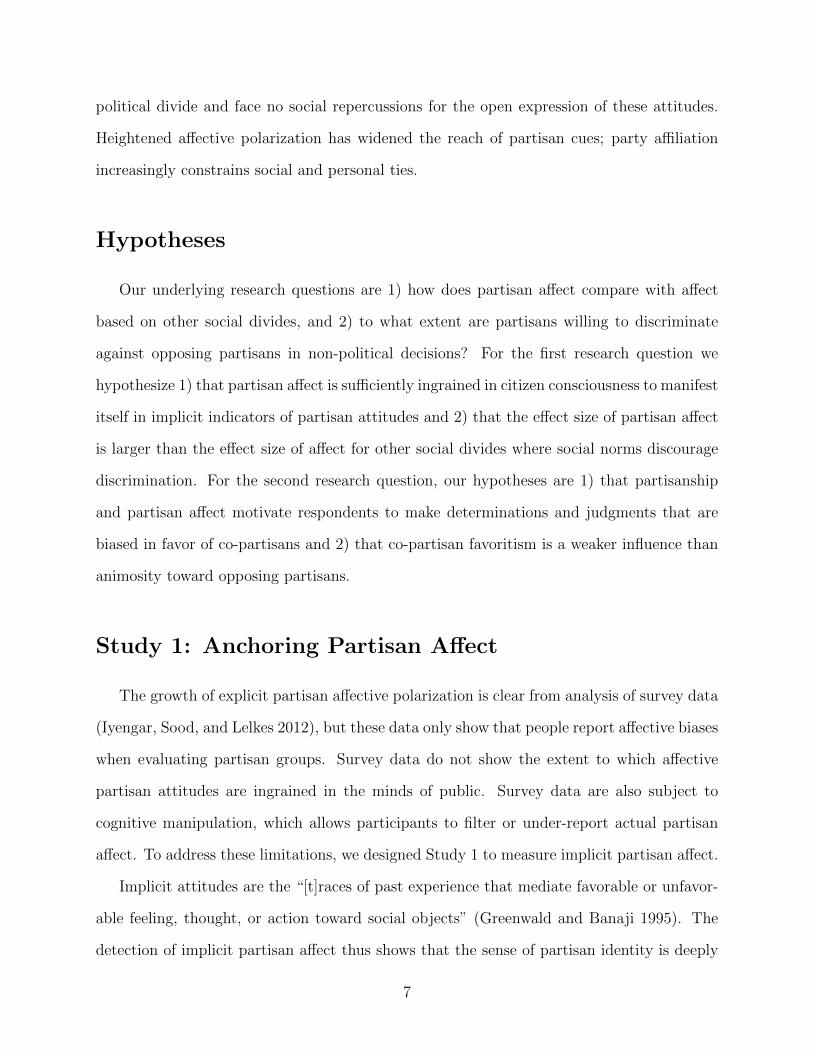
In a BIAT participants complete four rounds of 20 timed categorizations, with the first
pair of rounds treated as training and the last pair used for scoring the measure of implicit
attitudes. The four blocks consist of two repetitions (randomly ordered) of the “in-group +
good” block and the “out-group + good” block. In each block the group not paired with
good is grouped with negative words. The top panel of Figure 1 shows an example of a
categorization round in the partisan BIAT. In this example the target stimuli is the Demo-
8
cratic mascot and the round pairs Democrats with good. Democratic respondents should
more quickly categorize the mascot as “good” since they have come to associate “good”
with Democrats. Conversely Republican respondents should take more time to associate the
Democrat mascot with “good. We constructed the partisan BIAT using the standard set of
good stimuli (Wonderful, Best, Superb, Excellent), the standard set of bad stimuli (Terrible,
Awful, Worst, Horrible) and eight images (shown in the bottom panel of Figure 1) referring
to the Democratic and Republican parties.2 We created a custom software tool to implement
the BIAT in a web browser.
[Figure 1 about here.]
Design
We recruited a sample of 2,000 adults from the Survey Sampling International panel.3
Respondents completed both the African-American/European-American BIAT and our par-
tisan BIAT at the end of a survey instrument. To minimize possible order effects and to
account for reductions in implicit attitude extremity among those who have completed one
or more IATs (see Nosek, Banaji, and Greenwald 2002), the order of the two BIATs was
randomized. We oversampled African Americans (500 each) in order to capture racial affect
among non-whites.
Following Greenwald et al. (2003) we utilize the “D-score” to interpret the BIAT results.
The score, which can range from -2 to 2, is calculated by subtracting the mean response times
for the round pairing targets from Category A (Democrat/Black) with positive terms from
the mean response times for the round pairing targets from Category B (Republican/White)
with positive terms (for full details on the computation of the D-score, see Greenwald,
Nosek, and Banaji 2003). This difference in response latency is then divided by the pooled
2The study was fielded in July of 2012.3After removing subjects with BIAT error rates above .35—the recommended filtering rate—and those
who failed to complete the BIATs we were left with a sample of 1,971.
9
standard deviation over both rounds.4 Positive D-scores indicate that participants respond
faster to Republican-good than to Democrat-good pairings. Since people respond faster
to group attribute pairs for which they have acquired automatic associations, this pattern
would indicate greater positive affect for Republicans, while the inverse response times would
reflect greater positive affect for Democrats. The party stimuli used to construct the D-score
produced highly correlated latencies (r=.35) and a robust standardized Cronbach’s Alpha of
.89.5
Results
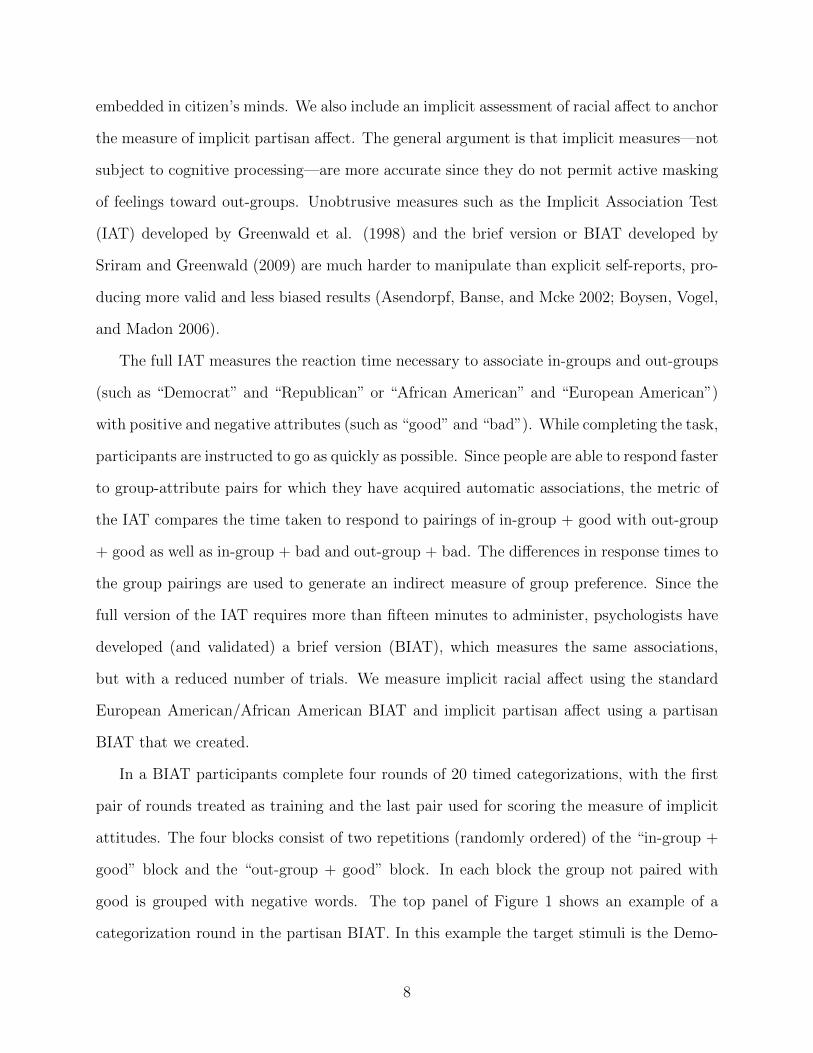
The sign and magnitude of the obtained partisan D-score converged with traditional
measures of partisan and ideological affiliation. Figure 2 shows the average partisan D-
scores grouped by responses to self-reported strength of partisan and ideological identity.
The partisan D-score corresponded closely with the conventional survey measure of party
identification. “Strong Republicans” revealed the most bias in favor of Republicans (mean
= .35, se = .03, n = 218), while “weak Democrats” were the most biased in favor Democrats
(mean = -.26, se = .02, n = 374). There were traces of intransitivity in the explicit indicator
as strong Democrats were slightly less biased against Republicans than weak Democrats
(mean = -.21, se = .02, n = 466).
Turning to the measure of ideology, “very conservative” individuals had the strongest
implicit preference for Republicans (mean = .227, se = .041, n = 171), followed by “conser-
vatives” who obtained the next highest (mean =.170, se = .026, n = 360). Once again, there
were minor inconsistencies in the pattern. Thus, “liberals” were the most biased toward
Democrats (mean = -.282, se = .025, n = 338), followed closely by respondents in the “very
liberal” category (mean = -.267, se = .041, n = 149).
[Figure 2 about here.]
4The D-score is recommended for a variety of reasons including only weak effects of cognitive ability onIAT results (Cai et al. 2004).
5Cronbach’s Alpha for the average latencies (pooled) within the two sets of party stimuli was .81.
10
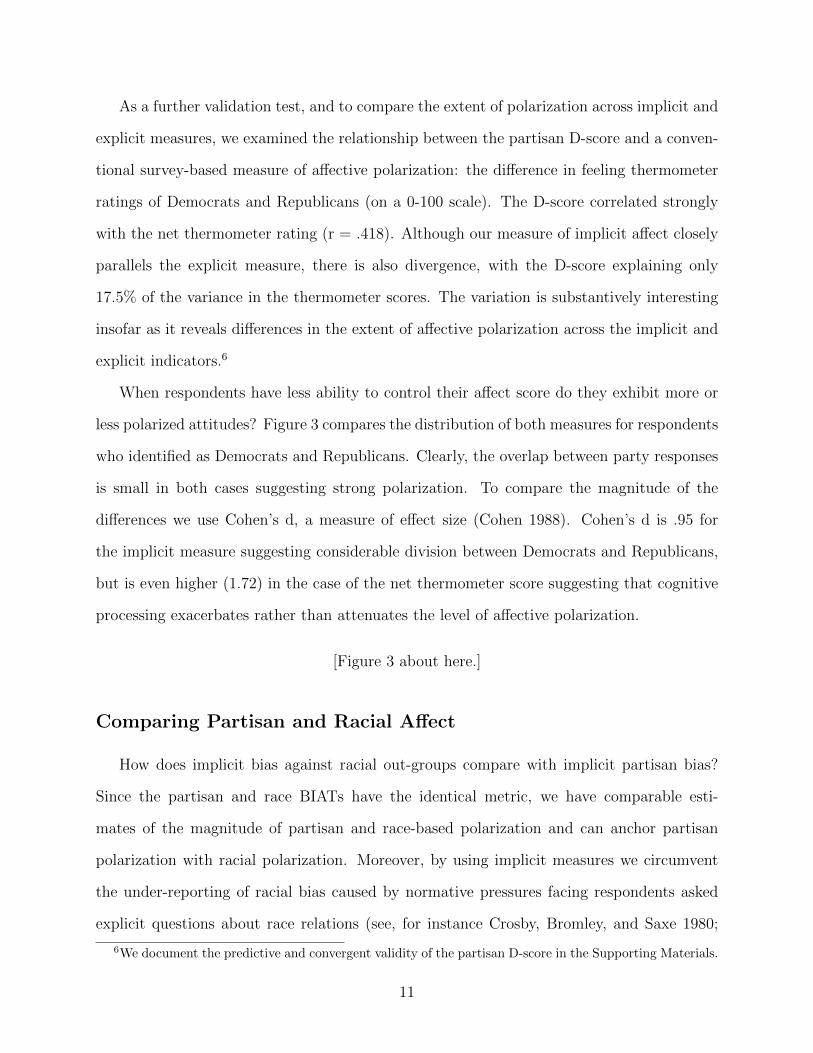
As a further validation test, and to compare the extent of polarization across implicit and
explicit measures, we examined the relationship between the partisan D-score and a conven-
tional survey-based measure of affective polarization: the difference in feeling thermometer
ratings of Democrats and Republicans (on a 0-100 scale). The D-score correlated strongly
with the net thermometer rating (r = .418). Although our measure of implicit affect closely
parallels the explicit measure, there is also divergence, with the D-score explaining only
17.5% of the variance in the thermometer scores. The variation is substantively interesting
insofar as it reveals differences in the extent of affective polarization across the implicit and
explicit indicators.6
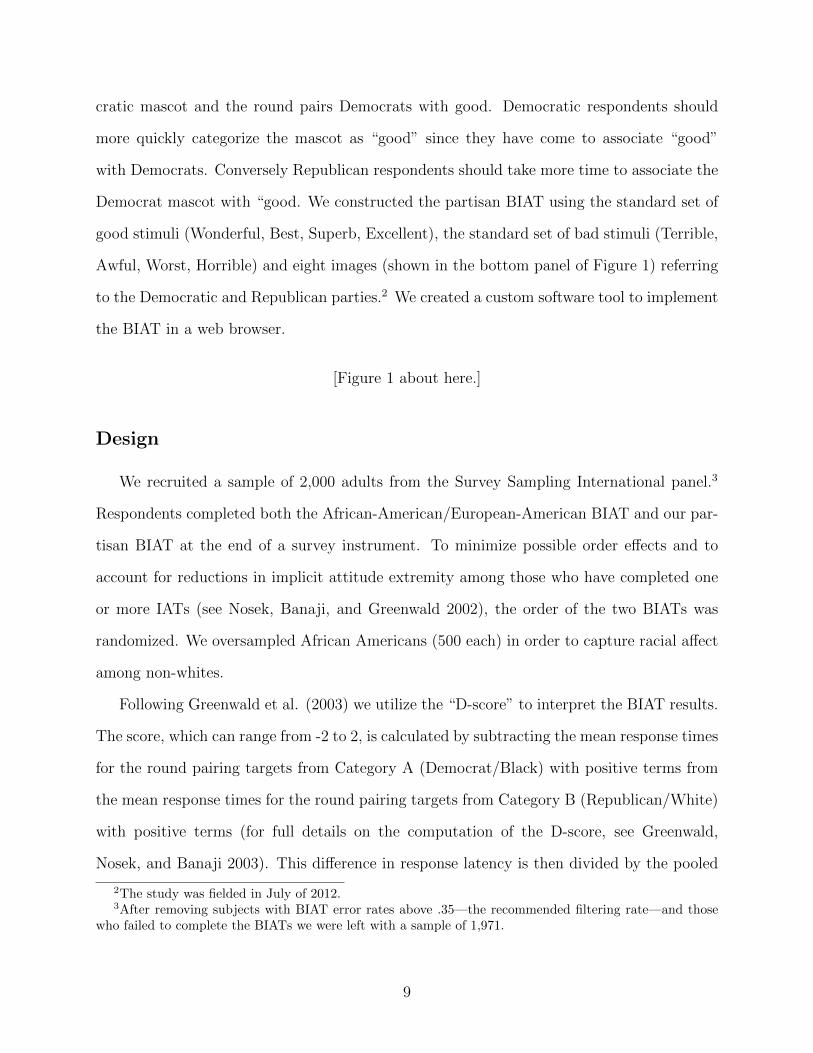
When respondents have less ability to control their affect score do they exhibit more or
less polarized attitudes? Figure 3 compares the distribution of both measures for respondents
who identified as Democrats and Republicans. Clearly, the overlap between party responses
is small in both cases suggesting strong polarization. To compare the magnitude of the
differences we use Cohen’s d, a measure of effect size (Cohen 1988). Cohen’s d is .95 for
the implicit measure suggesting considerable division between Democrats and Republicans,
but is even higher (1.72) in the case of the net thermometer score suggesting that cognitive
processing exacerbates rather than attenuates the level of affective polarization.
[Figure 3 about here.]
Comparing Partisan and Racial Affect
How does implicit bias against racial out-groups compare with implicit partisan bias?
Since the partisan and race BIATs have the identical metric, we have comparable esti-
mates of the magnitude of partisan and race-based polarization and can anchor partisan
polarization with racial polarization. Moreover, by using implicit measures we circumvent
the under-reporting of racial bias caused by normative pressures facing respondents asked
explicit questions about race relations (see, for instance Crosby, Bromley, and Saxe 1980;
6We document the predictive and convergent validity of the partisan D-score in the Supporting Materials.
11

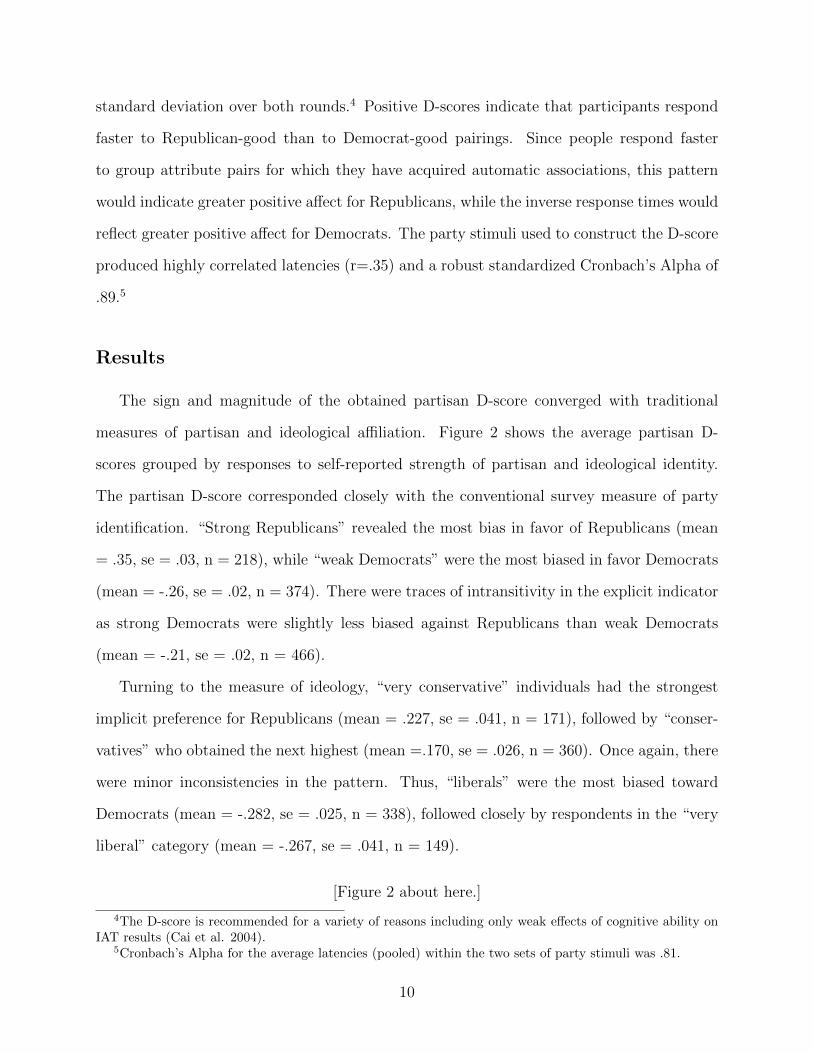
McConahay, Hardee, and Batts 1981). Figure 4 shows the results of the partisan and African
American/European American BIATs. Negative D-scores indicate an affective preference for
Democrats (and African Americans), while positive scores indicate an affective preference
for Republicans and European Americans, respectively.
[Figure 4 about here.]
The spread between Democrats and Republicans on the partisan D-score was massive
(t(824.66) = 17.68, p<.001), with the Republicans averaging .27 (se = .02), the Democrats
-.23 (se = .02), and Independents -.02 (.02). In the case of implicit racial bias, African-
Americans showed a preference for African Americans (D-score = -.09, se = .02), while
whites displayed a somewhat stronger in-group preference (D-score = .16, se = .01). His-
panics and Asians both revealed a slight preference for whites over blacks. Consistent with
previous research, the black-white difference in implicit bias was substantial (t(740.10) =
11.04, p<.001), but the effect size for race (Cohen’s d = .61) was not nearly as strong as the
corresponding effect of party (Cohen’s d = .95).
We can also compare the overall distribution of D-scores by party and race. As shown
in Figure 4 (which graphs the distribution of D-scores for Democrats and Republicans and
Blacks and Whites, respectively), the separation of the distributions appears larger between
Republicans and Democrats than between Whites and African Americans. Party polarization
exceeds polarization based on race.
From our perspective, the difference in the magnitude of the partisan and racial divides in
implicit affect is especially telling. Racial identity is acquired at birth and racial attitudes are
deeply ingrained (see Baron and Banaji 2006). For partisanship to approach (and surpass)
race, the underlying animosity must be more substantial than previously thought. Yet, the
data show that negative associations of opposing partisans are faster (more automatic) than
negative associations of African Americans.
Given the contrasting positions of the parties on issues relating to race and the clear racial
divide in party affiliation, it is possible that the level of out-party animosity reflects a con-
12

catenation of racial and partisan or ideological affect. At the level of explicit attitudes, there
is significant overlap between measures of anti-black sentiment and ideological sentiment
(e.g., Carmines, Sniderman, and Easter 2011). At the level of implicit attitudes, however,
our evidence suggests that the overlap between partisan and racial affect is minimal. The
correlation between the partisan D-score and race D-score was .13 (p<.001) suggesting that
implicit affect based on racial identity does not simply mirror partisan leanings.
Partisan Affect Among Independents and Leaners
Not surprisingly, self-identified partisans have the highest levels of polarization, but pure
independents and independent leaners also show significant levels of partisan affect. As
shown in Figure 5, among independents in the SSI sample the difference in Republican and
Democratic feeling thermometer scores, is slightly slanted toward Democrats (mean=3.52,
se=0.84, n=697; t(696)=4.19, p<.001). Among Democratic leaners, the net thermome-
ter ratings reveal a stronger affective preference for Democrats (mean= -30.64, se=1.60,
n=297) that is smaller than the preference among Democrats (mean =-48.84, se=0.93,
n=1,340). Thus, Democratic leaners are significantly less affectively polarized than self-
identified Democrats (t(466.93)=-15.02, p<.001), but significantly more polarized than in-
dependents (t(516.52)=9.98, p<.001). This pattern is nearly identical on the Republican side
where leaners (mean=28.18, se=1.85, n=222) are significantly less polarized than partisans
(mean=42.58, se=1.32, n=624; t(461.55)=6.33, p<.001), and significantly more polarized
than independents with no leanings (t(317.25)=-12.13, p<.001). Consistent with prior re-
search showing that leaners adopt a social identity of their preferred party (Greene 1999),
these results support offer additional support for the contention that leaners behave like
partisans.
[Figure 5 about here.]
13
Study 2: The Intrusion of Partisan Affect into Non-
Political Domains
Our comparisons of implicit partisan and racial bias suggest that partisan identity is
a relatively strong source of group affect, but the behavioral implications remain unclear.
We designed this follow-up study to compare the relative influence of partisan and racial
affiliation in a non-political decision task and to examine whether affect predicted decisions
favoring the respondent’s own group affiliation.
Design
We randomly assigned 1,021 participants drawn from the SSI panel to one of two selection
tasks. The first selection task required a selection between a Democrat and Republican, while
the second required selection between a European American and an African American. In
each task we asked participants to read the resumes for a pair of graduating high school
seniors. We extend existing scholarship assessment designs (for example DeSante 2013;
Munro, Weih, and Tsai 2010) to measure partisan and racial bias.7 To increase the robustness
of our design, we randomly varied the academic achievements of each candidate (by assigning
them either a 4.0 GPA or a 3.5 GPA). We therefore have a four cell design (candidate 1 more
qualified; candidate 2 more qualified; both candidates equally qualified with a 4.0 GPA; both
candidates equally qualified with a 3.5 GPA). This design allows us to measure the effects of
partisan and racial bias when the candidates are equally qualified and when one candidate
is more qualified than the other. Participants were randomly assigned to complete only one
of the two selection tasks. The order of the two candidates as well as the order of their
extracurricular activities was randomized.8 An example of the resumes presented is shown
7As a cover story, participants were instructed that an anonymous donor had contributed $30,000 to ascholarship fund. The instructions also stated that the selection committee had deadlocked over two finalistsand commissioned a survey to decide the winner.
8We use a paired instead of factorial design since crossing the various group attributes would have ne-cessitated a sample beyond our budget constraint and because many of the cells in a fully crossed design
14
in Table 1.
[Table 1 about here.]
Depending on the task to which they were assigned, participants were exposed to candi-
dates with either a partisan affiliation (cued through membership in a partisan extracurric-
ular group), or a racial identity (cued through a stereotypical African American/European
American name and membership in an extracurricular group). Table 2 shows the full set of
names and extracurricular activities for each task. Gender was not varied but fixed as male;
in the partisan task race was fixed as European American for both candidates; in the race
task partisanship was not offered as an attribute of the student.
[Table 2 about here.]
Given this design, comparisons across conditions shed light on the relative strength of
in-group preference across partisan and racial lines. More specifically, we can compare the
frequency with which respondents demonstrate a discriminatory preference for the in-group
candidate while varying an objective measure of merit (GPA).
Results
Despite the explicitly apolitical nature of the task, it was the party cue that exerted the
strongest impact on selection for the largest number of participants. Table 3 shows the effects
of participant partisanship and participant race on winner selection, aggregating across the
four qualification manipulations
[Table 3 about here.]
In the partisan task approximately 80% of partisans (both Democrats and Republicans)
selected their in-party candidate. Democratic leaners showed a stronger preference for the
correspond to only small segments of the U.S. population.
15

Democratic candidate than Republican leaners showed for the Republican candidate, though
both groups displayed the in-party preference (80.4% and 69.2% respectively). Independents
showed a slight preference for the Democratic candidate (57.9%).
In-group selection on the basis of race was confined to African Americans (73.1% selecting
the African American), with European Americans showing a small preference for the African
American candidate (55.8% selecting the African American). To clarify these results and
account for the manipulation of academic qualifications, we generated predicted probabilities
(Figure 6) from logistic regression models.9 For the partisan task the dependent variable was
a dummy coded as 1 when then Republican was selected, and for the race task the dependent
variable was set as 1 when the African American was selected. The independent variables
were participant partisan affiliation (including independents and leaners) interacted with
academic qualification for the partisan task, and participant race interacted with qualification
for the race task.10
[Figure 6 about here.]
In the partisan task, candidate qualification had no significant effect on winner selection.
Compared to independents, Democrats were more likely to select a fellow Democrat (b=-
1.04, se=.33, p<.01) and Republicans were more likely to select a fellow Republican (b=1.60,
se=.39, p<.001). Even when the candidate from the opposing party was more qualified,
partisans opted to award the scholarship money to the co-partisan candidate. When the
Republican was more qualified than the Democrat, the probability of a Democrat select-
ing the Republican candidate was only .30 (95% confidence interval [.20, .44]), when both
candidates were equally qualified the probability of a Democrat selecting the Republican
candidate fell to .21 (95% confidence interval [.14, .29]), and when the Democrat was most
qualified the probability of a Democrat selecting the Republican candidate was a meager .14
9Full model results are included in the Supporting Information.10In both tasks there was no significant or substantive difference in selection rates between the two condi-
tions where candidates were equally qualified at different GPAs (two 3.5 GPAs and two 4.0 GPAs), so bothconditions were combined to produce a singe “equally qualified” condition.
16
(95% confidence interval [.08, .24]). Similarly, when the Democrat was more qualified, the
probability of a Republican selecting the Democrat was only .15 (95% confidence interval
[.16, .35]), when the two candidates were equally qualified the probability of a Republican
selecting the Democrat candidate was .21 (95% confidence interval [.13, .33]), and when the
Republican was most qualified the probability of Republicans selecting the Democrat candi-
date was .21 (95% confidence interval [.10, .38]). The probability of a partisan selecting an
out-party candidate never rose above .3 and the coefficients for the various interaction terms
between participant partisan affiliation and candidate qualifications were never significant;
partisanship simply trumped academic excellence in this task.
Consistent with the results from the party feeling thermometers, leaners behaved like
partisans and selected the candidate from the party they prefer, but the effects were less
robust than those of partisans due to smaller numbers of leaners in the sample (top of
Figure 8). Despite the larger variance in the behavior of leaners, compared to independents
their tendency to select a winner from their preferred party was consistently significant for
both Democratic leaners (b=-1.35, se=.33, p<.05) and Republican leaners (b=.99, se=.49,
p<.05). Leaners were also unresponsive to candidate qualifications, with all estimates of the
interaction between leaner political identity and candidate qualification proving insignificant.
This result offers additional evidence that leaners are in fact closet partisans.
Independents were nearly evenly split in all conditions, even when one candidate was
more qualified than another. When the candidates were equally qualified the probability of
an independent selecting a Republican winner was .42 (95% confidence interval [.32, .54]),
when the Republican was more qualified the probability of an independent selecting the
Republican candidate was .50 (95% confidence interval [.34, .66]) and when the Democrat
was more qualified the probability of an independent selecting the Republican candidate was
.33 (95% confidence interval [.19, .51]). Their unresponsiveness to academic qualification
and the general preference for a Democratic winner corresponds with the small Democratic
skew in independents’ implicit and explicit partisan affect and suggests that independents
17

are also more responsive to partisan cues than academic qualifications. Partisanship is
important even for individuals who, in terms of self-identified partisan affiliation, present
themselves as non-partisan. Placed in the context of affective preferences and behavior, the
label “independent” seems to function merely as an identity tag and not as a measure of the
relevance of partisan cues to decision-making.
The results of the race manipulation (Figure 7) showed generally weaker effects of out-
group bias. Most African American and European American participants selected the African
American candidate. African Americans were significantly more likely than European Amer-
icans to select the African American candidate (b=.95, se=.36, p<.01). However, there was
an overall tendency to select the European American as the winner when she was the more
qualified candidate (b=-.93, se=.30, p<.01). There were no significant interactions between
participant race and candidate qualifications.
[Figure 7 about here.]
To illustrate these effects, we again present predicted probabilities. Unlike partisanship
where in-group preferences dominate selection, only African Americans showed a consis-
tent preference for the in-group candidate. Asked to choose between two equally qualified
candidates, the probability of an African American selecting an in-group winner was .78
(95% confidence interval [.66, .87]), which was no different than their support for the more
qualified in-group candidate—.76 (95% confidence interval [.59, .87]). Compared to these
conditions, the probability of African Americans selecting an out-group winner was at its
highest—.45—when the European American was most qualified (95% confidence interval
[.26, .66]).
The probability of a European American selecting an in-group winner was only .42 (95%
confidence interval [.34, .50]), and further decreased to .29 (95% confidence interval [.20,
.40]) when the in-group candidate was less qualified. The only condition in which a majority
of European Americans selected their in-group candidate was when the candidate was more
qualified, with a probability of in-group selection at .64 (95% confidence interval [.53, .74]).
18
Overall, in contrast with the behavior of partisans, the majority racial group consistently
selected the minority candidate unless the qualifications of the majority in-group candidate
exceeded the qualifications of the minority candidate. In-group selection was stronger and
the effects of academic qualifications much weaker in the partisan cue conditions.
Overall, the results from the candidate selection study suggest that evaluations of high
school students’ academic credentials are remarkably sensitive to small partisan cues. The
partisan cue consisted of a single activity (among a randomly ordered list of five); nevertheless
the effects of the cue proved strong, even for leaners. Facing no social pressures to make
unbiased choices, partisans feel no compunction to discriminate against out-party candidates.
The data also show that discrimination based on party affiliation exceeds discrimination
based on race. Despite the obvious relevance of academic credentials to scholarship eligibility,
we found no evidence that partisans took academic merit into account.
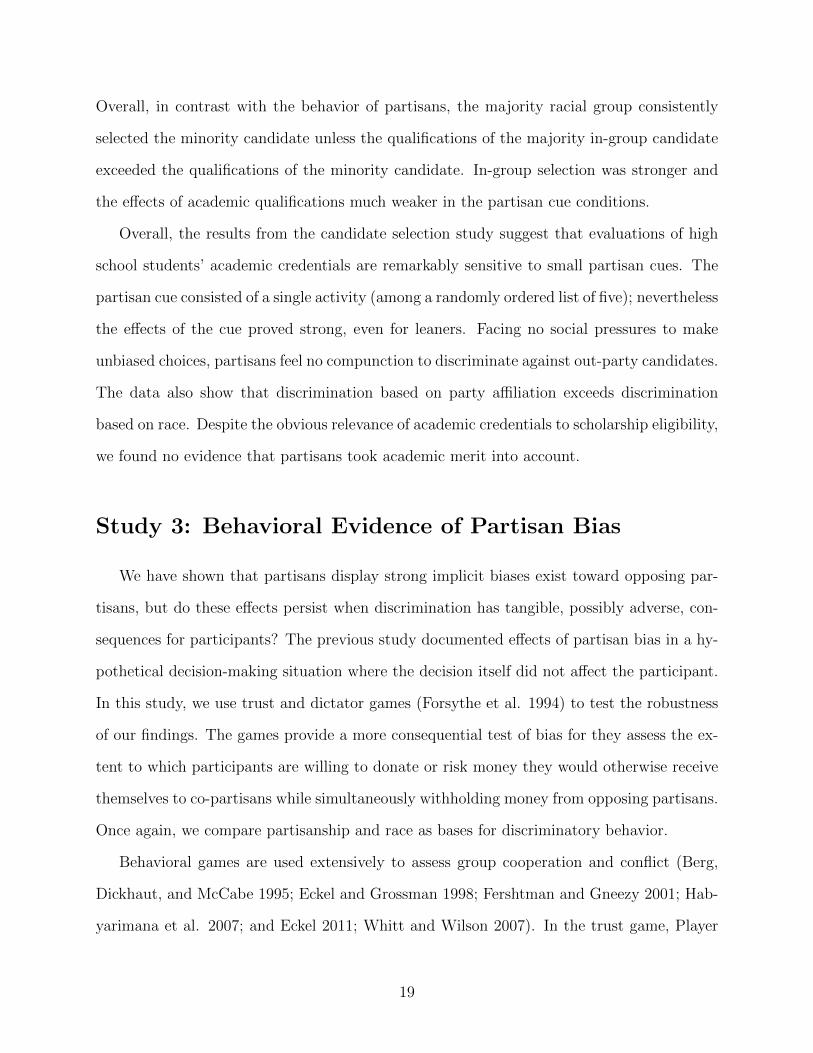
Study 3: Behavioral Evidence of Partisan Bias
We have shown that partisans display strong implicit biases exist toward opposing par-
tisans, but do these effects persist when discrimination has tangible, possibly adverse, con-
sequences for participants? The previous study documented effects of partisan bias in a hy-
pothetical decision-making situation where the decision itself did not affect the participant.
In this study, we use trust and dictator games (Forsythe et al. 1994) to test the robustness
of our findings. The games provide a more consequential test of bias for they assess the ex-
tent to which participants are willing to donate or risk money they would otherwise receive
themselves to co-partisans while simultaneously withholding money from opposing partisans.
Once again, we compare partisanship and race as bases for discriminatory behavior.
Behavioral games are used extensively to assess group cooperation and conflict (Berg,
Dickhaut, and McCabe 1995; Eckel and Grossman 1998; Fershtman and Gneezy 2001; Hab-
yarimana et al. 2007; and Eckel 2011; Whitt and Wilson 2007). In the trust game, Player
19
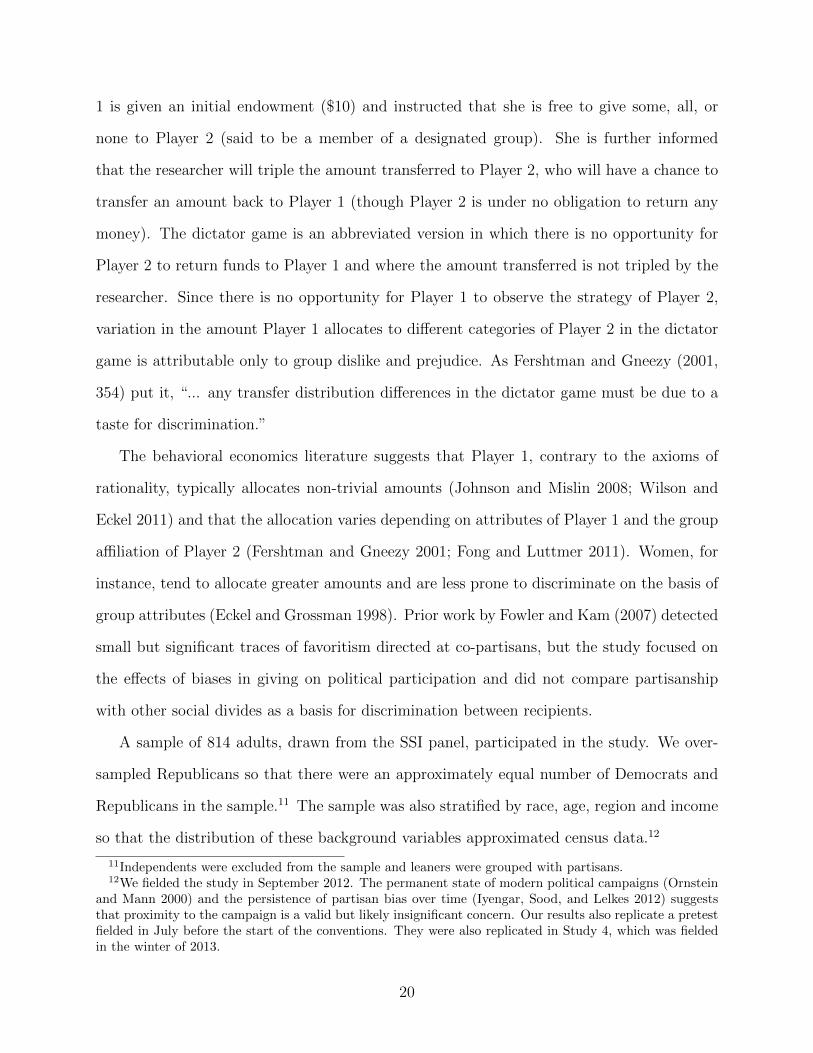
1 is given an initial endowment ($10) and instructed that she is free to give some, all, or
none to Player 2 (said to be a member of a designated group). She is further informed
that the researcher will triple the amount transferred to Player 2, who will have a chance to
transfer an amount back to Player 1 (though Player 2 is under no obligation to return any
money). The dictator game is an abbreviated version in which there is no opportunity for
Player 2 to return funds to Player 1 and where the amount transferred is not tripled by the
researcher. Since there is no opportunity for Player 1 to observe the strategy of Player 2,
variation in the amount Player 1 allocates to different categories of Player 2 in the dictator
game is attributable only to group dislike and prejudice. As Fershtman and Gneezy (2001,
354) put it, “... any transfer distribution differences in the dictator game must be due to a
taste for discrimination.”
The behavioral economics literature suggests that Player 1, contrary to the axioms of
rationality, typically allocates non-trivial amounts (Johnson and Mislin 2008; Wilson and
Eckel 2011) and that the allocation varies depending on attributes of Player 1 and the group
affiliation of Player 2 (Fershtman and Gneezy 2001; Fong and Luttmer 2011). Women, for
instance, tend to allocate greater amounts and are less prone to discriminate on the basis of
group attributes (Eckel and Grossman 1998). Prior work by Fowler and Kam (2007) detected
small but significant traces of favoritism directed at co-partisans, but the study focused on
the effects of biases in giving on political participation and did not compare partisanship
with other social divides as a basis for discrimination between recipients.
A sample of 814 adults, drawn from the SSI panel, participated in the study. We over-
sampled Republicans so that there were an approximately equal number of Democrats and
Republicans in the sample.11 The sample was also stratified by race, age, region and income
so that the distribution of these background variables approximated census data.12
11Independents were excluded from the sample and leaners were grouped with partisans.12We fielded the study in September 2012. The permanent state of modern political campaigns (Ornstein
and Mann 2000) and the persistence of partisan bias over time (Iyengar, Sood, and Lelkes 2012) suggeststhat proximity to the campaign is a valid but likely insignificant concern. Our results also replicate a pretestfielded in July before the start of the conventions. They were also replicated in Study 4, which was fieldedin the winter of 2013.
20
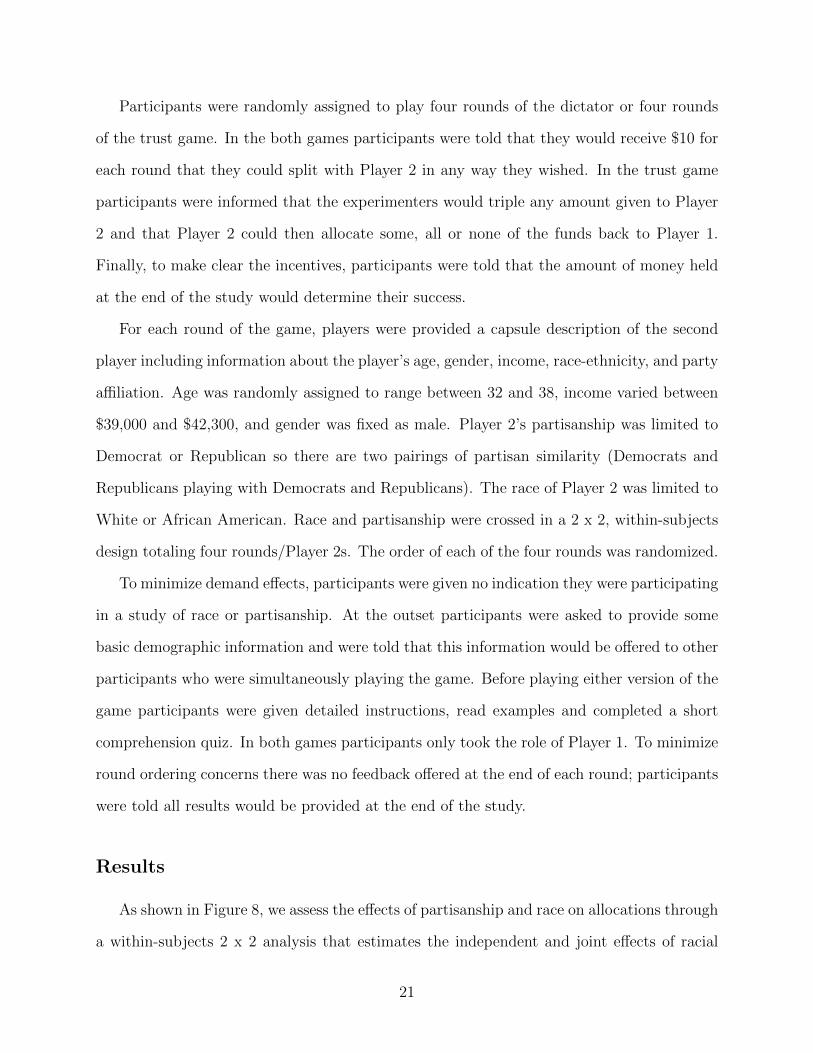
Participants were randomly assigned to play four rounds of the dictator or four rounds
of the trust game. In the both games participants were told that they would receive $10 for
each round that they could split with Player 2 in any way they wished. In the trust game
participants were informed that the experimenters would triple any amount given to Player
2 and that Player 2 could then allocate some, all or none of the funds back to Player 1.
Finally, to make clear the incentives, participants were told that the amount of money held
at the end of the study would determine their success.
For each round of the game, players were provided a capsule description of the second
player including information about the player’s age, gender, income, race-ethnicity, and party
affiliation. Age was randomly assigned to range between 32 and 38, income varied between
$39,000 and $42,300, and gender was fixed as male. Player 2’s partisanship was limited to
Democrat or Republican so there are two pairings of partisan similarity (Democrats and
Republicans playing with Democrats and Republicans). The race of Player 2 was limited to
White or African American. Race and partisanship were crossed in a 2 x 2, within-subjects
design totaling four rounds/Player 2s. The order of each of the four rounds was randomized.
To minimize demand effects, participants were given no indication they were participating
in a study of race or partisanship. At the outset participants were asked to provide some
basic demographic information and were told that this information would be offered to other
participants who were simultaneously playing the game. Before playing either version of the
game participants were given detailed instructions, read examples and completed a short
comprehension quiz. In both games participants only took the role of Player 1. To minimize
round ordering concerns there was no feedback offered at the end of each round; participants
were told all results would be provided at the end of the study.
Results
As shown in Figure 8, we assess the effects of partisanship and race on allocations through
a within-subjects 2 x 2 analysis that estimates the independent and joint effects of racial
21
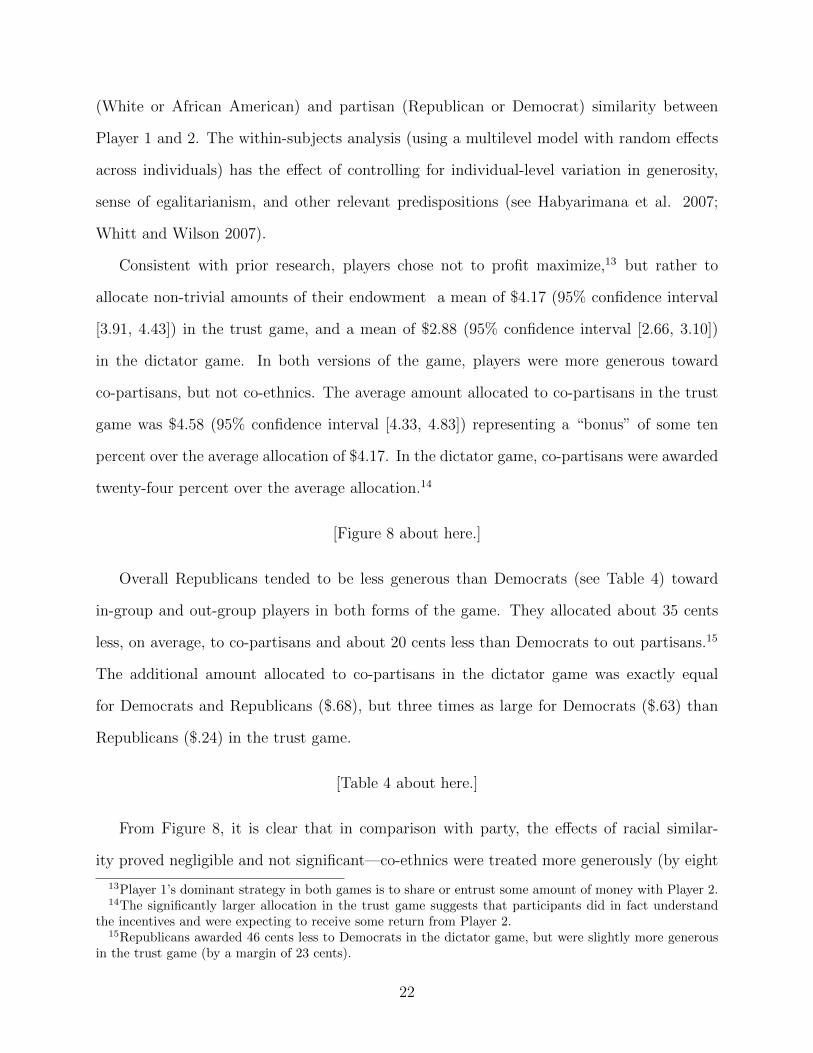
(White or African American) and partisan (Republican or Democrat) similarity between
Player 1 and 2. The within-subjects analysis (using a multilevel model with random effects
across individuals) has the effect of controlling for individual-level variation in generosity,
sense of egalitarianism, and other relevant predispositions (see Habyarimana et al. 2007;
Whitt and Wilson 2007).
Consistent with prior research, players chose not to profit maximize,13 but rather to
allocate non-trivial amounts of their endowment a mean of $4.17 (95% confidence interval
[3.91, 4.43]) in the trust game, and a mean of $2.88 (95% confidence interval [2.66, 3.10])
in the dictator game. In both versions of the game, players were more generous toward
co-partisans, but not co-ethnics. The average amount allocated to co-partisans in the trust
game was $4.58 (95% confidence interval [4.33, 4.83]) representing a “bonus” of some ten
percent over the average allocation of $4.17. In the dictator game, co-partisans were awarded
twenty-four percent over the average allocation.14
[Figure 8 about here.]
Overall Republicans tended to be less generous than Democrats (see Table 4) toward
in-group and out-group players in both forms of the game. They allocated about 35 cents
less, on average, to co-partisans and about 20 cents less than Democrats to out partisans.15
The additional amount allocated to co-partisans in the dictator game was exactly equal
for Democrats and Republicans ($.68), but three times as large for Democrats ($.63) than
Republicans ($.24) in the trust game.
[Table 4 about here.]
From Figure 8, it is clear that in comparison with party, the effects of racial similar-
ity proved negligible and not significant—co-ethnics were treated more generously (by eight
13Player 1’s dominant strategy in both games is to share or entrust some amount of money with Player 2.14The significantly larger allocation in the trust game suggests that participants did in fact understand
the incentives and were expecting to receive some return from Player 2.15Republicans awarded 46 cents less to Democrats in the dictator game, but were slightly more generous
in the trust game (by a margin of 23 cents).
22

cents, 95% confidence interval [-.11, .27]) in the dictator game, but incurred a loss (seven
cents, 95% confidence interval [-.34, .20]) in the trust game. There was no interaction be-
tween partisan and racial similarity; playing with both a co-partisan and co-ethnic did not
elicit additional trust over and above the effects of co-partisanship. These results thus repli-
cate Study 1 and Study 2. Despite lingering negative attitudes toward African Americans,
social norms appear to suppress racial discrimination, but there is no such reluctance to
discriminate based on partisan affiliation.
Study 4: Separating In-Group Favoritism from Out-
Group Animosity
Affect toward co-partisans has remained relatively stable in ANES data, while affect
toward opposing partisans has dramatically decreased (Iyengar, Sood, and Lelkes 2012).
Study 2 shows that when placed in a zero-sum decision task participants were more likely
to select a co-partisan. Study 3 similarly shows that participants are more generous and
trusting toward co-partisans. Neither study, however, allows us to disentangle the effects of
out-group prejudice from in-group favoritism. This was the goal of Study 4.
We drew a sample of 1,252 members of the SSI panel in the winter of 2012. Participants
were randomly assigned to complete either a dictator game or a trust game. We used the
same instructions and procedure as in Study 3, but utilized a different set of Player 2 profiles.
For both games we deployed a four condition, within subjects design (Player 2 was described
without any partisan identity, as a Democrat, as a Republican or as an independent). The
inclusion of a true control lacking any reference to partisan affiliation provides a neutral
baseline from which to assess preferences for in-group and out-group members.16
As shown in Figure 9, there was a significant co-partisan bonus of $.67 (95% confidence
interval [.50, .84]) in the dictator game and $.30 (95% confidence interval [.08, .52]) in the
16Leaners were grouped with partisans.
23

trust game. There was also a significant penalty of $.63 (95% confidence interval [-.80, -
.46]) for opposing partisans in the dictator game and a penalty of $.63 (95% confidence
interval [-.85, -.41]) for opposing partisans in the trust game. Compared to the control (no
information) condition, there was no effect when Player 2 was an independent in the dictator
game or the trust game.
[Figure 9 about here.]
The out-group penalty remained approximately the same across the two types of games
(although the penalty represented a smaller proportion of the overall allocation to Player 2
in the trust game than the dictator game), while the in-group bonus was halved in the trust
game compared to the dictator game. Decisions in the trust game require more complex
analysis than the dictator game. Not only must participants judge how much money they
wish to keep for themselves, but they must also assess how likely it is that a given Player
2 will share some of the returns offered by the researcher. If information on Player 2 is
not useful in the assessment of the trustworthiness of Player 2, the information should be
ignored or given little weight. However, if participants believe that a known trait of Player
2 is an indicator of trustworthiness they should be more likely to increase their allocation
to Player 2 in anticipation of reaping greater financial rewards. Study 3 clearly shows that
partisanship is used to assess the trustworthiness of Player 2, a finding we replicate here,
but the results from this study show that partisanship is treated differently when Player 2 is
a member of the in-group rather than the out-group. Participants assume that co-partisans
are more likely to return money and adjust their allocations upward to increase potential
returns. They remain, however, more punitive and untrusting of opposing partisans (with
the opposing partisan penalty amounting to almost twice the co-partisan bonus). Despite
the stronger incentive to allocate funds to Player 2, participants are much less inclined to
favor co-partisans in the trust game compared to the dictator game, but only slightly less
inclined to discriminate against out-partisans in the trust game compared to the dictator
game. Out-group animosity is more consequential than favoritism for the in-group
24
Discussion
Compared with the most salient social divide in American society—race—partisanship
elicits more extreme evaluations and behavioral responses to in-groups and out-groups. This
remarkable pattern applies to both explicit and implicit measures of group affect and holds
up even when the tests of in-group favoritism are unobtrusive, completely non-political,
and partisans are incentivized to treat co-partisans no differently from out-partisans. The
most plausible explanation for the stronger affective response generated by partisan cues
is the non-applicability of egalitarian norms. These norms, which are supported by large
majorities, discourage the manifestation of behavior that may be construed as discriminatory.
In contemporary America, the strength of these norms has made virtually any discussion
of racial differences a taboo subject to the point that citizens suppress their true feelings
(Greenwald, McGhee, and Schwartz 1998). No such constraints apply to evaluations of
partisan groups.
The larger animus associated with the party divide is further attributable to fundamental
differences between partisan and race-based identity. First, individuals choose rather than
inherit their party affiliation. It is possible, therefore, that they are more likely to be held
responsible (i.e., blamed) for their partisanship rather than their ethnic affiliation. Second,
Democrats and Republicans almost by definition stand in opposition to each other and Amer-
icans are regularly exposed to rhetoric from their leaders conveying open hostility toward
political opponents. Racial identity, on the other hand, is less transparently conflictual. Fi-
nally, there is considerable evidence that group identity is heightened among disadvantaged
groups, i.e. among women and non-whites (see Chong and Rogers 2005; Miller et al. 1981;
Schmitt et al. 2002). For men and whites, accordingly, the sense of gender/racial identity
may be insufficiently salient to generate animus for the out-group.
Our comparisons across indicators of implicit and explicit party affect revealed no differ-
ences in the degree of affective polarization; if anything, conventional survey measures may
25

be somewhat inflated. Similarly, the analysis of individuals’ responsiveness to party cues
suggests that it is partisan affect—either implicit or explicit—that underlies the broader
political ramifications of polarization.
More generally, our results provide further support for the view that party identification
in the United States is more of an affective than instrumental or ideological bond. This
“primal” view of partisanship was first documented in The American Voter (Campbell et
al. 1960) and has since been reinforced by considerable work on the psychology of partisan
identity (see Green, Palmquist, and Schickler 2004; Huddy, Mason, and Aarøe 2010) and by
corroborating evidence demonstrating that partisans are poorly informed about the policy
positions advocated by party elites (Delli Carpini and Keeter 1996; Bennett 2003).
Current debates over the degree of ideological polarization within the electorate and
dismissals of polarization as a symptom of partisan sorting (e.g., Fiorina and Abrams 2008)
do not come to grips with this conception of partisan identity and the significant role played
by partisan affect in the psyche of ordinary Americans. The mass public may offer centrist
preferences, but they certainly sense that “the other side” is an out-group. While Americans
are inclined to “hedge” expressions of overt animosity toward racial minorities, immigrants,
gays, or other marginalized groups, they enthusiastically voice hostility for the out-party and
its supporters.
The extent of affective polarization—at least in these studies—appears uniform across
parties. Previous research suggests stronger bias against the out-group among Republicans
and conservatives (Jost, Hennes, and Lavine in press; Jost et al. 2003; Stern et al. 2012), but
our evidence indicates that the polarization scores (both explicit and implicit) for partisans
on the left and right were generally indistinguishable. However, when we limit the analysis
to people who identify as strongly partisan, out-party animus is significantly higher among
Republicans.
There are several limitations to this work. Racial cues are easy to assess and hard to
suppress, while partisanship must be disclosed or revealed. We can therefore document
26
effects of partisanship on decision-making, and show that they are consistently more sizable
than race, but we cannot show that partisanship is considered as frequently as race. However,
partisanship, as we note, is a source of social identity that people embrace in their social
networks, their workplace discussions and their place of residence. People may not wear their
partisanship on their sleeves, but, for millions of Americans, it is not difficult to discern. It
is true that we run the risk of artificially elevating the role of partisanship by revealing it
as an attribute of the target individuals in studies 2-4. However, these studies also provided
participants with information about the target person’s race, gender, income and academic
achievements. If partisanship were unimportant we should expect participants to disregard
it when given a good reason to do so (such as the presence of a candidate with superior
academic qualifications). It is also possible that the political environment at the time of the
decision encouraged the use of partisanship in decision tasks. However, our results replicate
during times of relatively low political conflict (Winter 2013 and Spring 2013), and times of
stronger political conflict (i.e., during the 2012 presidential election).
In closing, we note that the increased levels of partisan affect have fairly clear implications
for the political process. Hostility for the out party among rank and file partisans sends a
clear signal to elected officials; representatives who appear willing to work across party
lines run the risk of being perceived as “appeasers.” For the vast majority who represent
uncompetitive districts, there are strong incentives to “bash” the opposition. Recent evidence
on Congressional “taunting” fits precisely this pattern; representatives from safe seats are
especially likely to taunt the opposition party. Congressional press releases that fit the
partisan taunting category—meaning that they utilize “exaggerated language to put [the
opposition] down or devalue their ideas”—make up more than one quarter of all congressional
press releases issued between 2005 and 2007 (Grimmer and King 2011, 2649).
The level of animosity across party lines also implies a reduced willingness to treat the
actions of partisan opponents as legitimate, resulting in more intense contestation of policy
outcomes. The passage of the landmark 1964 and 1965 Civil Rights Acts were no doubt
27

controversial and opposed by large numbers of Americans, but they were not subject to
persistent efforts at nullification. In contrast, two years after passage of the Affordable Care
Act, legislative efforts to repeal the law show no signs of weakening.
Finally, our evidence documents a significant shift in the relationship between American
voters and their parties. Fifty years ago, comparative party researchers described American
parties as relatively weak, at least by the standards of European “mass membership” parties
(Committee on Political Parties. 1950; Duverger 1963; Kirchheimer 1966). The prototypical
instance of the latter category was a party “membership in which is bound up in all aspects
of the individual’s life” (Katz and Mair 1995, 6). By this standard, American parties have
undergone a significant “role reversal.” Today, the sense of partisan identification is all
encompassing and affects behavior in both political and non-political contexts.
References
Alford, John R., Peter K. Hatemi, John R. Hibbing, Nicholas G. Martin, and Lindon J.
Eaves. 2011. “The Politics of Mate Choice.” The Journal of Politics 73 (2): 36279.
Asendorpf, Jens B., Rainer Banse, and Daniel Mcke. 2002. “Double Dissociation between
Implicit and Explicit Personality Self-Concept: The Case of Shy Behavior.” Journal
of Personality and Social Psychology 83 (2): 380.
Baron, Andrew S., and Mahzarin R. Banaji. 2006. “The Development of Implicit Attitudes
Evidence of Race Evaluations From Ages 6 and 10 and Adulthood.” Psychological
Science 17 (1): 5358.
Bennett, W. Lance. 2003. News: The Politics of Illusion. 5th ed. New York: Longman.
Berelson, Bernard, Paul F. Lazarsfeld, and William McPhee. 1954. Voting: A Study of
Opinion Formation in a Presidential Campaign. Chicago: University of Chicago
Press.
Berg, Joyce, John Dickhaut, and Kevin McCabe. 1995. “Trust, Reciprocity, and Social
28
History.” Games and Economic Behavior 10 (1): 12242.
Billig, Michael, and Henri Tajfel. 1973. “Social Categorization and Similarity in Intergroup
Behaviour.” European Journal of Social Psychology 3: 2751.
Bishop, B. 2008. The Big Sort: Why the Clustering of Like-Minded America Is Tearing Us
Apart. New York: Houghton Mifflin Harcourt.
Bogardus, Emory S. 1925. “Social Distance and Its Origins.” Journal of Applied Sociology
9: 21626.
Boysen, Guy A., David L. Vogel, and Stephanie Madon. 2006. “A Public versus Private
Administration of the Implicit Association Test.” European Journal of Social Psy-
chology 36 (6): 84556.
Cai, Huajian, N. Sriram, Anthony G. Greenwald, and Sam G. McFarland. 2004. “The
Implicit Association Tests D Measure Can Minimize a Cognitive Skill Confound:
Comment on McFarland and Crouch (2002).” Social Cognition 22 (6): 67384.
Campbell, Angus, Philip E. Converse, Warren E. Miller, and Donald Stokes. 1960. The
American Voter: Unabridged Edition. New York: Wiley.
Carmines, Edward G., Paul M. Sniderman, and Beth C. Easter. 2011. “On the Meaning,
Measurement, and Implications of Racial Resentment.” The ANNALS of the Ameri-
can Academy of Political and Social Science 634 (1): 98116. doi:10.1177/0002716210387499.
Chong, Dennis, and Reuel Rogers. 2005. “Racial Solidarity and Political Participation.”
Political Behavior 27 (4): 34774.
Cohen, Jack. 1988. Statistical Power Analysis for the Behavioral Sciences. Routledge
Academic.
Committee on Political Parties. 1950. “Toward a More Responsible Two-Party System.”
American Political Science Review 44 (3).
Crosby, Faye, Stephanie Bromley, and Leonard Saxe. 1980. “Recent Unobtrusive Studies of
Black and White Discrimination and Prejudice: A Literature Review.” Psychological
Bulletin 87 (3): 54663.
29
Delli Carpini, Michael X., and Scott Keeter. 1996. What Americans Know about Politics
and Why It Matters. New Haven, Conn.: Yale University Press.
DeSante, Christopher D. 2013. “Working Twice as Hard to Get Half as Far: Race, Work
Ethic, and Americas Deserving Poor.” American Journal of Political Science 57 (2):
34256. doi:10.1111/ajps.12006.
Duverger, Maurice. 1963. Political Parties: Their Organization and Activity in the Modern
State. Wiley.
Eckel, Catherine C., and Philip J. Grossman. 1998. “Are Women Less Selfish than Men?:
Evidence from Dictator Experiments.” The Economic Journal 108 (448): 72635.
“Facebook.” 2013. Facebook. http://www.facebook.com/press/info.php?statistics.
Fershtman, Chaim, and Uri Gneezy. 2001. “Discrimination in a Segmented Society: An
Experimental Approach.” The Quarterly Journal of Economics 116 (1): 35177.
Fiorina, Morris P., and Samuel J. Abrams. 2008. “Political Polarization in the American
Public.” Annual Review of Political Science 11: 56388.
Fong, Christina M., and Erzo F. Luttmer. 2011. “Do Fairness and Race Matter in Gen-
erosity? Evidence from a Nationally Representative Charity Experiment.” Journal
of Public Economics 95 (5): 37294.
Forsythe, Robert, Joel L. Horowitz, Nathan E. Savin, and Martin Sefton. 1994. “Fairness
in Simple Bargaining Experiments.” Games and Economic Behavior 6 (3): 34769.
Fowler, John H., and Cindy D. Kam. 2007. “Beyond the Self: Social Identity, Altruism, and
Political Participation.” Journal of Politics 69 (3): 81327.
Green, Donald, Bradley Palmquist, and Eric Schickler. 2004. Partisan Hearts and Minds:
Political Parties and the Social Identities of Voters. Yale University Press.
Greene, Steven. 1999. “Understanding Party Identification: A Social Identity Approach.”
Political Psychology 20 (2): 393403. doi:10.1111/0162-895X.00150.
Greenwald, Anthony G., and Mahzarin R. Banaji. 1995. “Implicit Social Cognition: Atti-
tudes, Self-Esteem, and Stereotypes.” Psychological Review 102 (1): 427. doi:10.1037/0033-
30
295X.102.1.4.
Greenwald, Anthony G., Debbie E. McGhee, and Jordan L. K. Schwartz. 1998. “Measuring
Individual Differences in Implicit Cognition: The Implicit Association Test.” Journal
of Personality and Social Psychology 74 (6): 146480.
Greenwald, Anthony G., Brian A. Nosek, and Mahzarin R. Banaji. 2003. “Understanding
and Using the Implicit Association Test: I. An Improved Scoring Algorithm.” Journal
of Personality and Social Psychology 85 (2): 197.
Grimmer, Justin, and Gary King. 2011. “General Purpose Computer-Assisted Clustering
and Conceptualization.” Proceedings of the National Academy of Sciences 108 (7):
264350.
Habyarimana, James, Macartan Humphreys, Daniel N. Posner, and Jeremy M. Weinstein.
2007. “Why Does Ethnic Diversity Undermine Public Goods Provision?” American
Political Science Review 101 (04): 70925.
Haidt, Jonathan, and Marc J. Hetherington. 2012. “Look How Far Weve Come Apart.”
Campaign Stops, September 17. http://campaignstops.blogs.nytimes.com/2012/09/17/look-
how-far-weve-come-apart/.
Hetherington, Marc J. 2009. “Putting Polarization in Perspective.” British Journal of
Political Science 39 (02): 41348.
Himmelfarb, Samuel, and Carl Lickteig. 1982. “Social Desirability and the Randomized
Response Technique.” Journal of Personality and Social Psychology 43 (4): 71017.
doi:10.1037/0022-3514.43.4.710.
Huber, Gregory, and Neil Malhotra. 2012. “Political Sorting in Social Relationships: Evi-
dence from an Online Dating Community.” http://xa.yimg.com/kq/groups/17296918/440105617/name/Political+Sorting+in+Social+Relationships.pdf.
Huddy, Leonie, Lilliana Mason, and Lene Aarøe. 2010. “Measuring Partisanship as a So-
cial Identity, Predicting Political Activism.” In Annual Meeting of the International
Society for Political Psychology.
Iyengar, Shanto, Gaurav Sood, and Yphtach Lelkes. 2012. “Affect, Not Ideology A So-
31
cial Identity Perspective on Polarization.” Public Opinion Quarterly, September.
doi:10.1093/poq/nfs038.
Johnson, Noel D., and Alexandra Mislin. 2008. “Cultures of Kindness: A Meta-Analysis of
Trust Game Experiments.”
Jost, John T., and Mahzarin R. Banaji. 1994. “The Role of Stereotyping in System-
Justification and the Production of False Consciousness.” British Journal of Social
Psychology 33 (1): 127.
Jost, John T., Jack Glaser, Arie W. Kruglanski, and Frank J. Sulloway. 2003. “Political
Conservatism as Motivated Social Cognition.” Psychological Bulletin 129 (3): 339.
Jost, John T., E. P. Hennes, and H. Lavine. In press. “Hot Political Cognition: Its Self-,
Group-, and System-Serving Purposes.” In Oxford Handbook of Social Cognition.
Katz, Richard S., and Peter Mair. 1995. “Changing Models of Party Organization and
Party Democracy The Emergence of the Cartel Party.” Party Politics 1 (1): 528.
doi:10.1177/1354068895001001001.
Kirchheimer, Otto. 1966. “The Transformation of the Western European Party Systems.”
Political Parties and Political Development, 177200.
Klofstad, Casey A., Rose McDermott, and Peter K. Hatemi. 2012. “The Dating Preferences
of Liberals and Conservatives.” Political Behavior, 120.
Korte, Gregory. 2012. “Obama Has Edge in Political Merchandise.” USA Today, September
25.
Lelkes, Yphtach, and Shanto Iyengar. 2012. “Fear and Loathing across Party Lines? Cross-
National Evidence on Party Polarization.”
Maccoby, Eleanor E., and Nathan Maccoby. 1954. “The Interview: A Tool of Social Science.”
In Handbook of Social Psychology, edited by Gardiner Lindzey, 1:44987. Cambridge,
MA: Addison Wesley.
McConahay, J. B., B. B. Hardee, and V. Batts. 1981. “Has Racism Declined in America? It
Depends on Who Is Asking and What Is Asked.” The Journal of Conflict Resolution
32
25 (4): 56379.
Miller, Arthur H., Patricia Gurin, Gerald Gurin, and Oksana Malanchuk. 1981. “Group
Consciousness and Political Participation.” American Journal of Political Science 25
(3): 494511. doi:10.2307/2110816.
Munro, Geoffrey D., Carrie Weih, and Jeffrey Tsai. 2010. “Motivated Suspicion: Asym-
metrical Attributions of the Behavior of Political Ingroup and Outgroup Members.”
Basic and Applied Social Psychology 32 (2): 17384.
Mutz, Diana C., and Jeffry Mondak. 2006. “The Workplace as a Context for Cross-Cutting
Political Discourse.” Journal of Politics 68 (1): 14055.
Myrdal, Gunnar. 1944. An American Dilemma: The Negro Problem and Modern Democ-
racy. Transaction Publishers.
Nosek, Brian A., Mahzarin R. Banaji, and Anthony G. Greenwald. 2002. “Harvesting
Implicit Group Attitudes and Beliefs from a Demonstration Web Site.” Group Dy-
namics: Theory, Research, and Practice 6 (1): 10115.
Ornstein, Norman J., and Thomas E. Mann. 2000. The Permanent Campaign and Its Future.
American Enterprise Institute Press. Pager, Devah, and Hana Shepherd. 2008. “The
Sociology of Discrimination: Racial Discrimination in Employment, Housing, Credit,
and Consumer Markets.” Annual Review of Sociology 34: 181.
Rosenfeld, Michael J., Thomas J. Reuben, and Maja Falcon. 2011. How Couples Meet
and Stay Together, Waves 1, 2, and 3: Public Version 3.04. Stanford, CA: Stanford
University Libraries.
Schmitt, Michael T., Nyla R. Branscombe, Diane Kobrynowicz, and Susan Owen. 2002.
“Perceiving Discrimination Against Ones Gender Group Has Different Implications
for Well-Being in Women and Men.” Personality and Social Psychology Bulletin 28
(2): 197210. doi:10.1177/0146167202282006.
Schuman, Howard, Charlotte Steeh, Lawrence Bobo, and Maria Krysan. 1997. Racial
Attitudes in America. Cambridge, MA: Harvard University Press.
33
Sigall, Harold, and Richard Page. 1971. “Current Stereotypes: A Little Fading, a Little Fak-
ing.” Journal of Personality and Social Psychology 18 (2): 24755. doi:10.1037/h0030839.
Sriram, N, and Anthony G. Greenwald. 2009. “The Brief Implicit Association Test.” Ex-
perimental Psychology 56 (4): 28394. doi:10.1027/1618-3169.56.4.283.
Stern, Chadly, Tessa V. West, John T. Jost, and Nicholas O. Rule. 2012. “The Politics of
Gaydar: Ideological Differences in the Use of Gendered Cues in Categorizing Sexual
Orientation.” Journal of Personality and Social Psychology.
Stoker, Laura, and M. Kent Jennings. 1995. “Life-Cycle Transitions and Political Partici-
pation: The Case of Marriage.” American Political Science Review, 42133.
Tajfel, Henri. 1970. “Experiments in Intergroup Discrimination.” Scientific American 223
(5): 96102.
Tajfel, Henri, and John C. Turner. 1979. “An Integrative Theory of Intergroup Conflict.”
In The Social Psychology of Intergroup Relations, edited by William G. Austin and
Stephen Worchel, 33:3347. Monterey, CA: Brooks-Cole.
Whitt, Sam, and Rick K. Wilson. 2007. “The Dictator Game, Fairness and Ethnicity in Post-
war Bosnia.” American Journal of Political Science 51 (3): 65568. doi:10.1111/j.1540-
5907.2007.00273.x.
Wilson, Rick K., and Catherine C. Eckel. 2011. “Trust and Social Exchange.” In Cambridge
Handbook of Experimental Political Science, edited by James S. Druckman, Donald
P. Green, John H. Kuklinski, and Arthur Lupia. New York: Cambridge University
Press.
34

Figure 1: BIAT Design
Sample Partisan BIAT Screenshot
Partisan BIAT Stimuli
The state of California and the “(D)” are colored blue and the state of Texas and the
“(R)” are colored red.
35
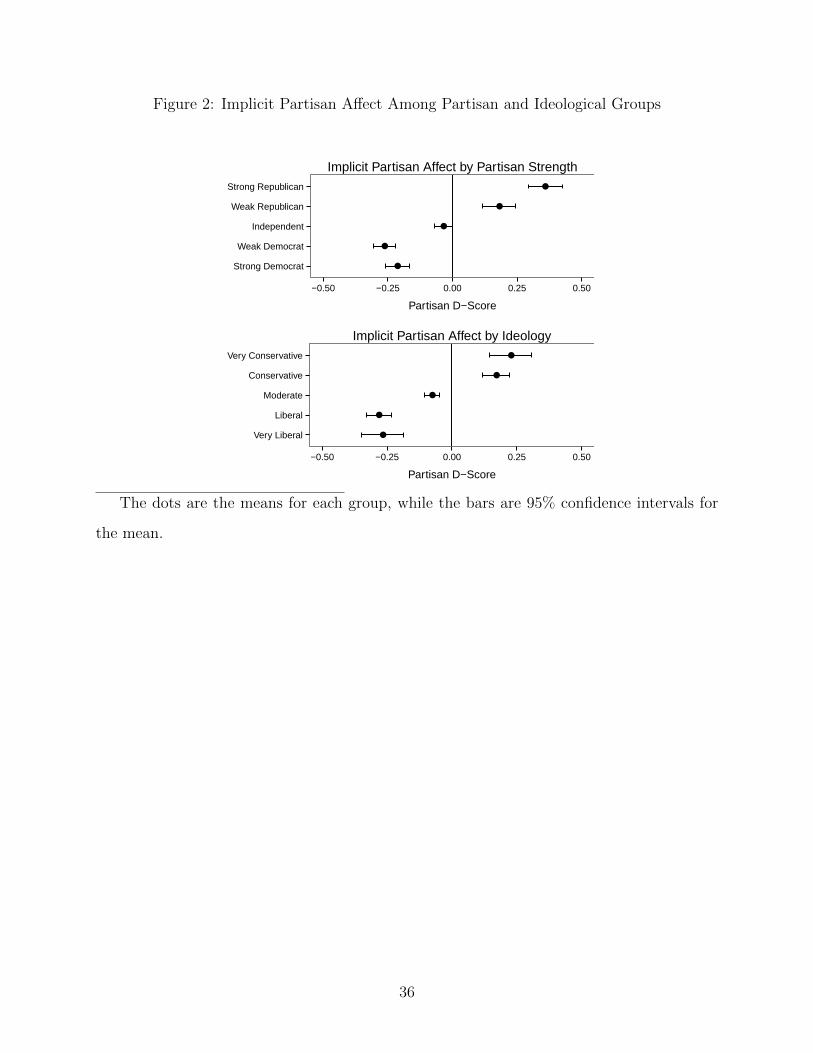
Figure 2: Implicit Partisan Affect Among Partisan and Ideological Groups
●
●
●
●
●
●
●
●
●
●
Strong Democrat
Weak Democrat
Independent
Weak Republican
Strong Republican
−0.50 −0.25 0.00 0.25 0.50
Partisan D−Score
Implicit Partisan Affect by Partisan Strength
●
●
●
●
●
●
●
●
●
●
Very Liberal
Liberal
Moderate
Conservative
Very Conservative
−0.50 −0.25 0.00 0.25 0.50
Partisan D−Score
Implicit Partisan Affect by Ideology
The dots are the means for each group, while the bars are 95% confidence intervals for
the mean.
36

Figure 3: Comparing The Distribution of Implicit and Explicit Partisan Affect
0.0000
0.0025
0.0050
0.0075
0.0100
−100 −50 0 50 100
Net Feeling Thermometer
Den
sity
Democrat
Republican
0.0
0.2
0.4
0.6
0.8
−2 −1 0 1 2
Partisan D−score
Den
sity
Democrat
Republican
This figure shows the distributions of partisan affective polarization scores (explicit in
the top and implicit in the bottom) for Democrats (to the left) and Republicans (to the
right).
37
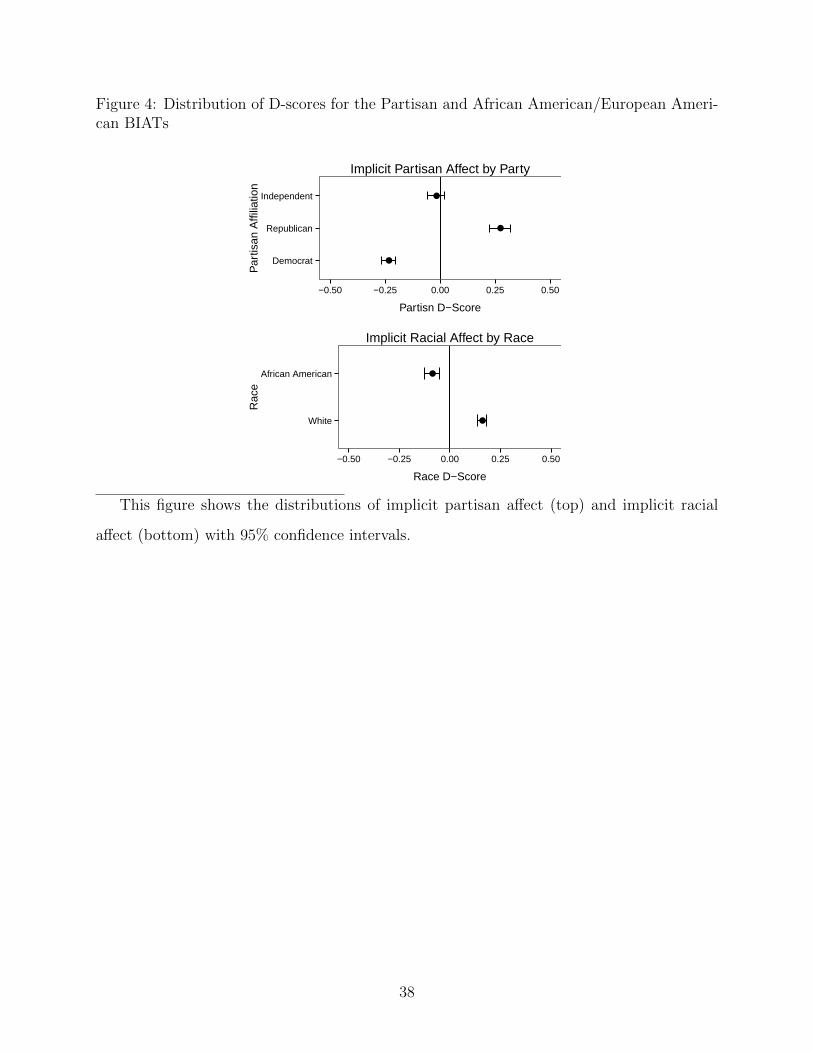
Figure 4: Distribution of D-scores for the Partisan and African American/European Ameri-can BIATs
●
●
●
●
●
●
Democrat
Republican
Independent
−0.50 −0.25 0.00 0.25 0.50
Partisn D−Score
Par
tisan
Affi
liatio
n
Implicit Partisan Affect by Party
●
●
●
●
White
African American
−0.50 −0.25 0.00 0.25 0.50
Race D−Score
Rac
e
Implicit Racial Affect by Race
This figure shows the distributions of implicit partisan affect (top) and implicit racial
affect (bottom) with 95% confidence intervals.
38
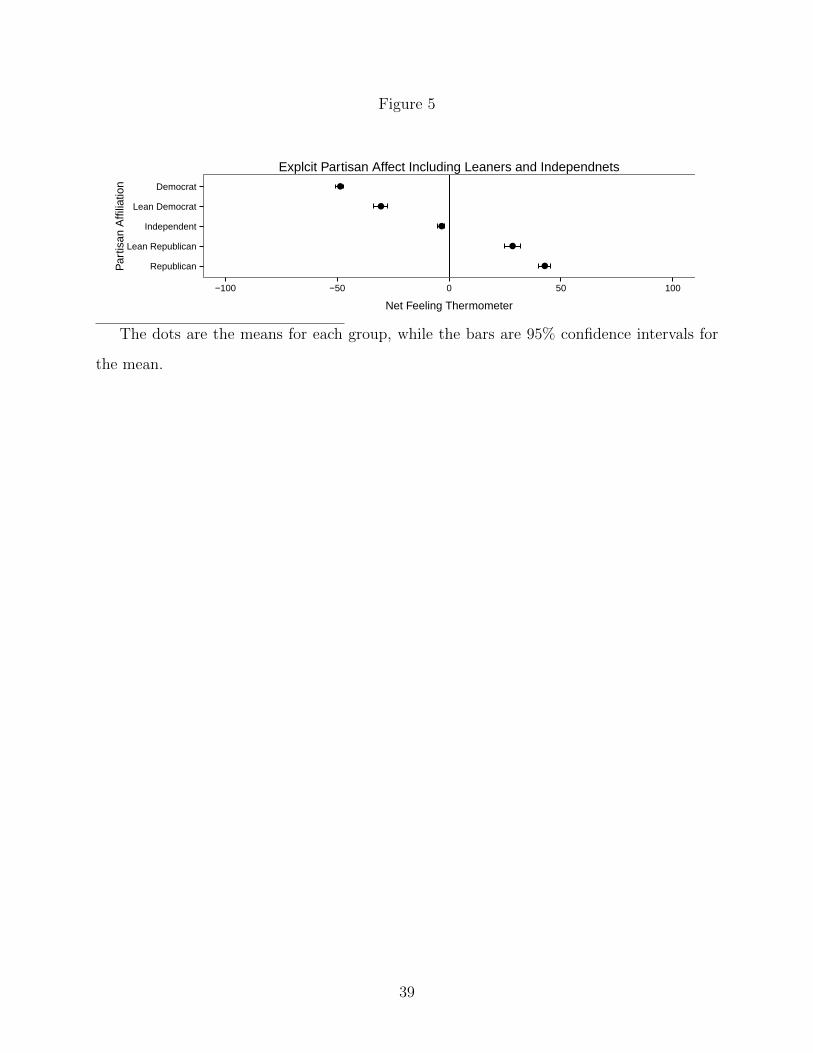
Figure 5
●
●
●
●
●
●
●
●
●
●Republican
Lean Republican
Independent
Lean Democrat
Democrat
−100 −50 0 50 100
Net Feeling Thermometer
Par
tisan
Affi
liatio
n
Explcit Partisan Affect Including Leaners and Independnets
The dots are the means for each group, while the bars are 95% confidence intervals for
the mean.
39
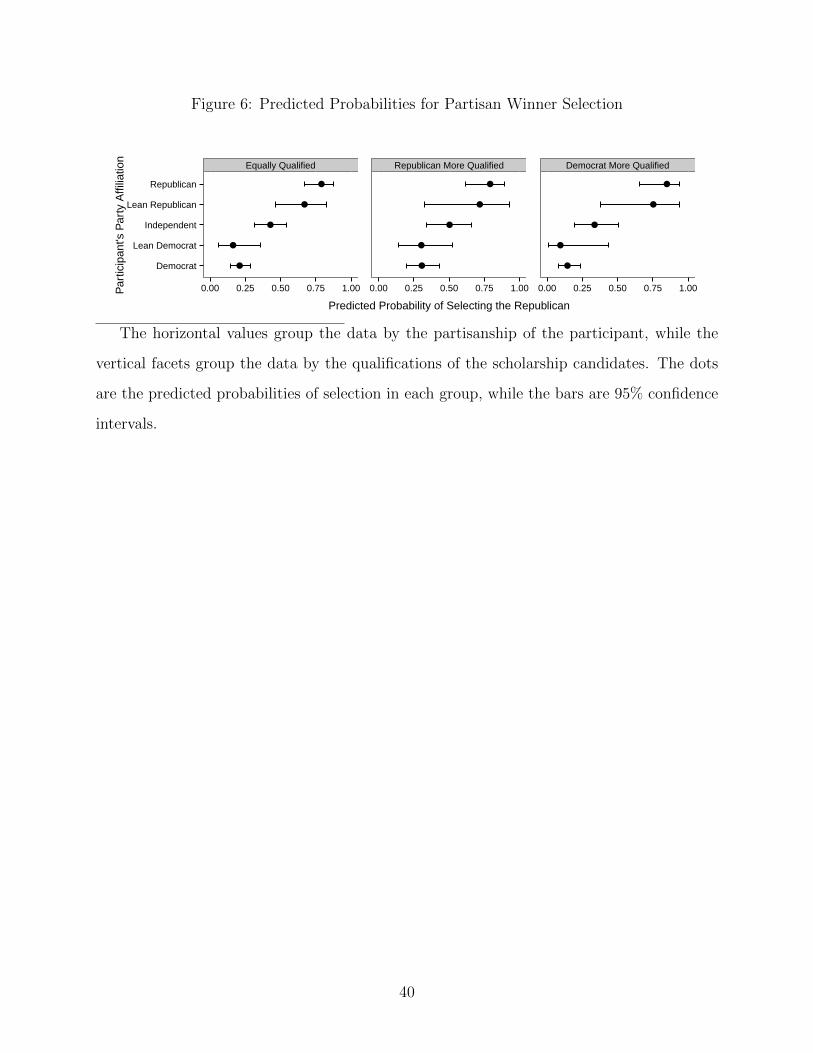
Figure 6: Predicted Probabilities for Partisan Winner Selection
Equally Qualified Republican More Qualified Democrat More Qualified
●
●
●
●
●
●
●
●
●
●
●
●
●
●
●
●
●
●
●
●
●
●
●
●
●
●
●
●
●
●
Democrat
Lean Democrat
Independent
Lean Republican
Republican
0.00 0.25 0.50 0.75 1.00 0.00 0.25 0.50 0.75 1.00 0.00 0.25 0.50 0.75 1.00
Predicted Probability of Selecting the Republican
Par
ticip
ant's
Par
ty A
ffilia
tion
The horizontal values group the data by the partisanship of the participant, while the
vertical facets group the data by the qualifications of the scholarship candidates. The dots
are the predicted probabilities of selection in each group, while the bars are 95% confidence
intervals.
40
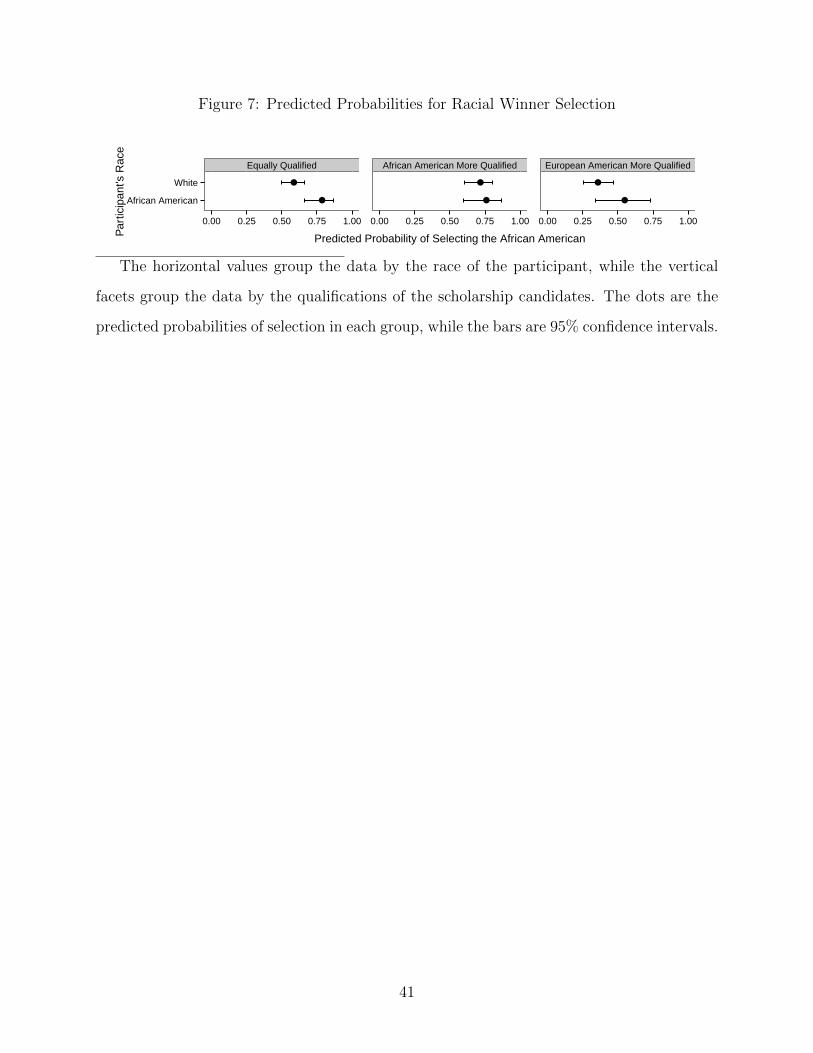
Figure 7: Predicted Probabilities for Racial Winner Selection
Equally Qualified African American More Qualified European American More Qualified
●
●
●
●
●
●
●
●
●
●
●
●African American
White
0.00 0.25 0.50 0.75 1.00 0.00 0.25 0.50 0.75 1.00 0.00 0.25 0.50 0.75 1.00
Predicted Probability of Selecting the African AmericanPar
ticip
ant's
Rac
e
The horizontal values group the data by the race of the participant, while the vertical
facets group the data by the qualifications of the scholarship candidates. The dots are the
predicted probabilities of selection in each group, while the bars are 95% confidence intervals.
41
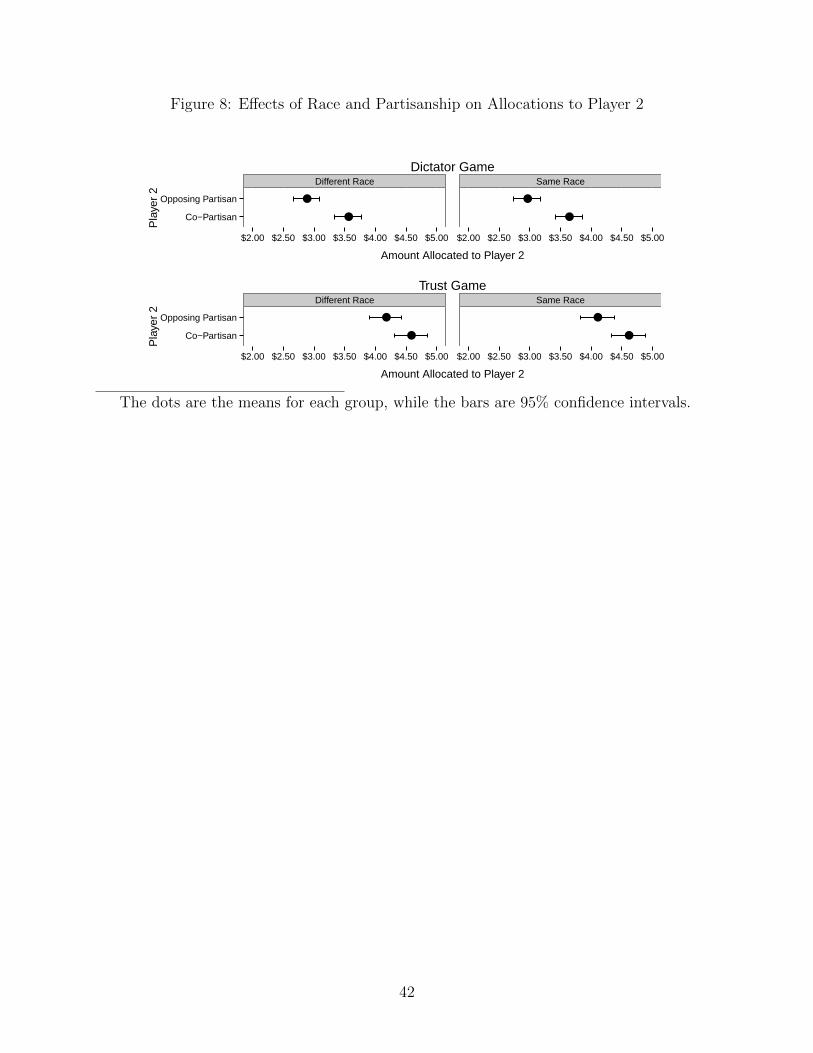
Figure 8: Effects of Race and Partisanship on Allocations to Player 2
Different Race Same Race
●
●
●
●
●
●
●
●Co−Partisan
Opposing Partisan
$2.00 $2.50 $3.00 $3.50 $4.00 $4.50 $5.00 $2.00 $2.50 $3.00 $3.50 $4.00 $4.50 $5.00
Amount Allocated to Player 2
Pla
yer
2Dictator Game
Different Race Same Race
●
●
●
●
●
●
●
●Co−Partisan
Opposing Partisan
$2.00 $2.50 $3.00 $3.50 $4.00 $4.50 $5.00 $2.00 $2.50 $3.00 $3.50 $4.00 $4.50 $5.00
Amount Allocated to Player 2
Pla
yer
2
Trust Game
The dots are the means for each group, while the bars are 95% confidence intervals.
42
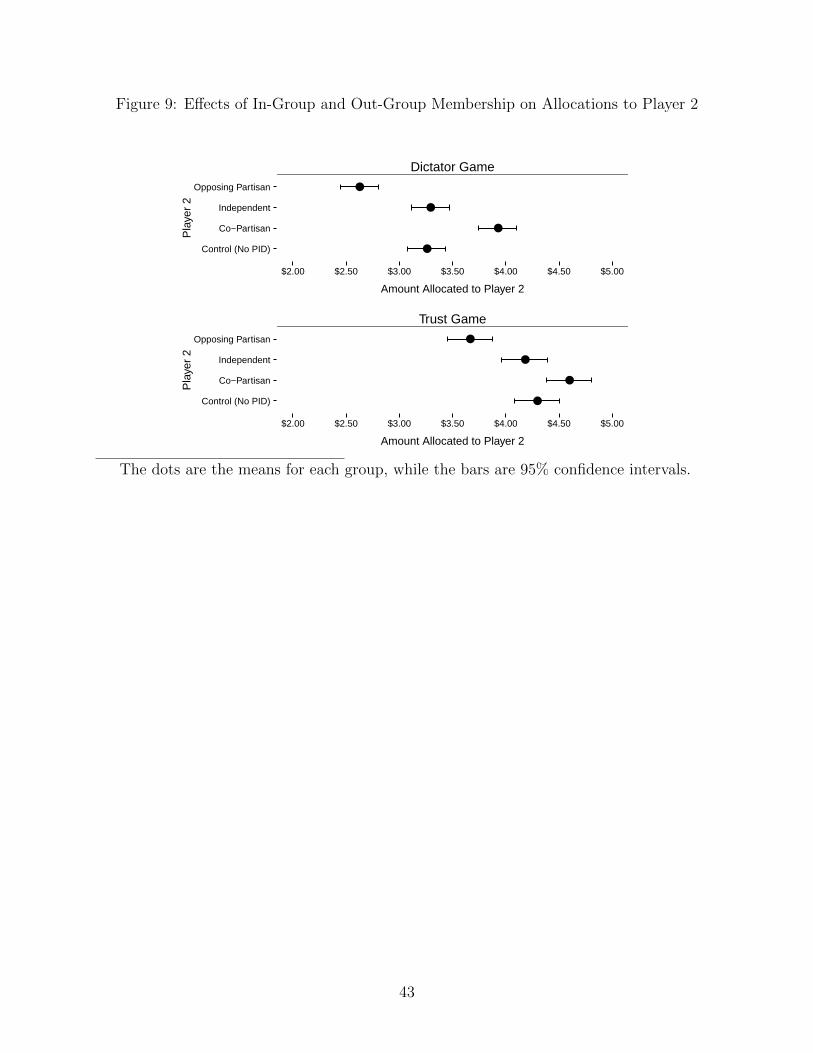
Figure 9: Effects of In-Group and Out-Group Membership on Allocations to Player 2
●
●
●
●
●
●
●
●
Control (No PID)
Co−Partisan
Independent
Opposing Partisan
$2.00 $2.50 $3.00 $3.50 $4.00 $4.50 $5.00
Amount Allocated to Player 2
Pla
yer
2
Dictator Game
●
●
●
●
●
●
●
●
Control (No PID)
Co−Partisan
Independent
Opposing Partisan
$2.00 $2.50 $3.00 $3.50 $4.00 $4.50 $5.00
Amount Allocated to Player 2
Pla
yer
2
Trust Game
The dots are the means for each group, while the bars are 95% confidence intervals.
43
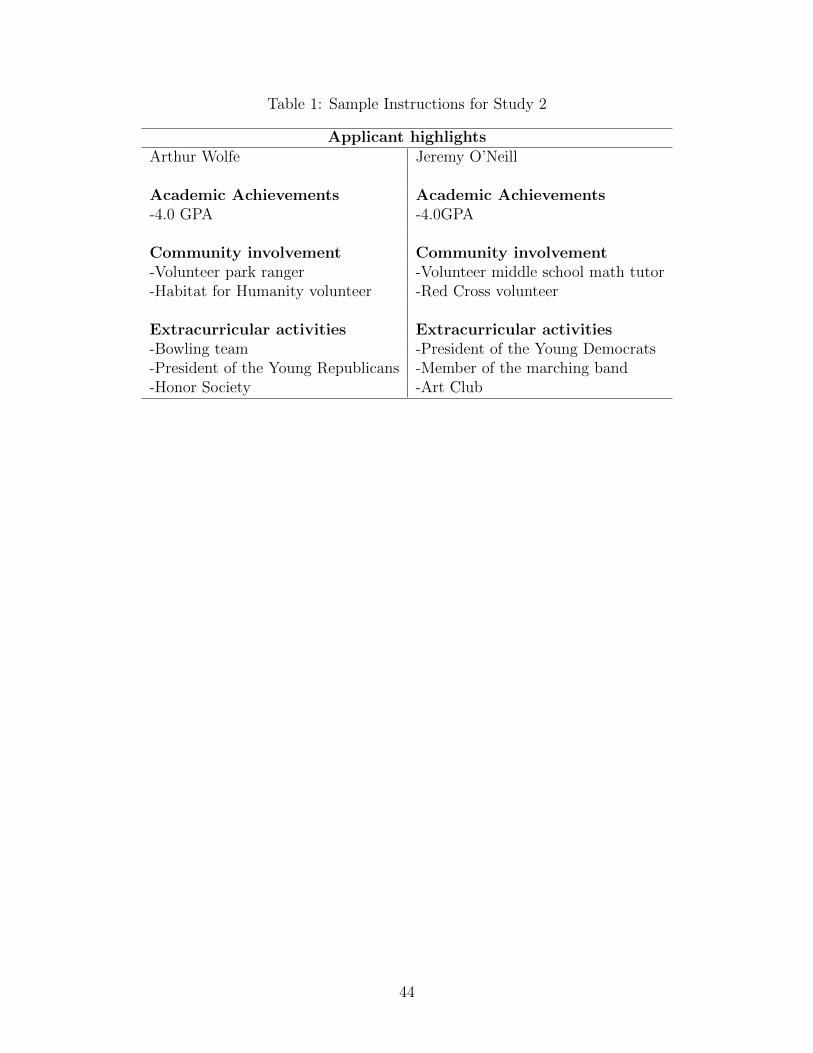
Table 1: Sample Instructions for Study 2
Applicant highlightsArthur Wolfe Jeremy O’Neill
Academic Achievements Academic Achievements-4.0 GPA -4.0GPA
Community involvement Community involvement-Volunteer park ranger -Volunteer middle school math tutor-Habitat for Humanity volunteer -Red Cross volunteer
Extracurricular activities Extracurricular activities-Bowling team -President of the Young Democrats-President of the Young Republicans -Member of the marching band-Honor Society -Art Club
44

Table 2: Full Set of Conditions and Treatments for Study 2
Task Identity Name Extracurricular Activity GPA
Partisan Republican Arthur WolfePresident of the Young Republi-cans
3.5 or 4.0
Democrat Jeremy O’NeillPresident of the YoungDemocrats
3.5 or 4.0
Racial European American Arthur WolfePresident of the Future Invest-ment Banker Club
3.5 or 4.0
African American Jamal WashingtonPresident of the African Ameri-can Student Association
3.5 or 4.0
45

Table 3: Favoritism in Candidate Selection by Group Membership
Partisan Selection TaskParticipant’s Partisanship Democrat Winner (N) Republican Winner (N)
Democrat 79.2% (202) 20.8% (53)Lean Democrat 80.4% (45) 19.6% (11)
Independent 57.9% (81) 42.1% (59)Lean Republican 30.8% (12) 69.2% (27)
Republican 20.0% (24) 80.0% (96)
Racial Selection TaskParticipant’s Race European American Winner (N) African American Winner (N)
European American 44.2% (129) 55.8% (163)African American 26.9% (32) 73.1% (87)
46

Table 4: Allocation Based on Party
Dictator GameParticipant Party Player 2 Party Amount Standard Error Allocating $0 to Player 2Democrat Democrat $3.82 0.11 14%Democrat Republican $3.14 0.11 23%Republican Democrat $2.68 0.12 33%Republican Republican $3.36 0.11 20%
Trust GameParticipant Party Player 2 Party Amount Standard Error Allocating $0 to Player 2Democrat Democrat $4.71 0.12 7%Democrat Republican $4.08 0.12 10%Republican Democrat $4.21 0.16 15%Republican Republican $4.45 0.15 11%
47