fdx corporation annual report 1998 - fedex: · pdf file · 2007-05-10fdx...
TRANSCRIPT
F D X C O R P O R A T I O N A N N U A L R E P O R T 1 9 9 8
FD
X C
OR
PO
RA
TIO
N A
NN
UA
L R
EP
OR
T 19
98
=A WHOLE GREATER =A WHOLE GREATER
On January 27, 1998, Federal
Express Corporation launched a
new era in transportation –
again. Twenty-five years after it
founded the express distribu-
tion industry, FedEx acquired
the Caliber System, Inc. compa-
nies, leaders in ground small-
THAN THE SUM OF ITS PARTSTHAN THE SUM OF ITS PARTS
On January 27, 1998, Federal
Express Corporation launched a
new era in transportation –
again. Twenty-five years after it
founded the express distribu-
tion industry, FedEx acquired
the Caliber System, Inc. compa-
nies, leaders in ground small-
package delivery, surface expedited shipping, less-than-truckload freight and integrated logistics
management. From this historic union emerged a new brand of transportation leadership:
FDX Corporation, a $16 billion distribution and logistics powerhouse. With its unprecedented portfolio
of shipping and logistics services, FDX is uniquely equipped to provide the comprehensive distribution
solutions customers seek in today’s fast, competitive, interconnected global marketplace. The service,
technology and marketing synergies created by FDX unlock exciting new opportunities for stockholders.
In this inaugural annual report
to FDX stockholders, you’ll dis-
cover why the acquisition of
Caliber System by FedEx involved
more than simple addition – why
for customers and stockholders
alike, FDX equals a whole far
greater than the sum of its parts.
= A N E W B R A N D O F L E A D E R S H I P= A N E W B R A N D O F L E A D E R S H I P
P2
=A $400 BILLION=A $400 BILLION
CHAIRMAN’S LETTER P3
To Our Stockholders: During fiscal year 1998, FedEx
celebrated its 25th year of industry leadership by
laying the foundation for future growth with the
acquisition of Caliber System, Inc., and the creation
of FDX Corporation. Our consolidated results for the
year were strong, revealing a $16 billion company with
net income of $583 million, excluding merger expenses.
Earnings per share rose to a record $3.91. We are pleased with our
financial achievements and excited about our growth opportunities.
FDX is poised to take advantage of a global transportation market that
– with the express, less-than-truckload and ground small-package
segments combined – is projected to grow from $75 billion today to
nearly $400 billion over the next 20 years.
Once again, we have changed the competitive landscape, creat-
ing a one-stop source for global shipping and logistics solutions.
No other corporation is better situated to take advantage of business
trends such as “just-in-time” shipping, the explosive growth of elec-
tronic commerce, and the proliferation of global sourcing and selling
across markets. Prior to the acquisition, neither
FedEx nor RPS individually could offer the same com-
plementary mix of express and ground small-package
delivery services. Now – operating independently yet
Frederick W. SmithChairman, President andChief Executive Officer
MARKET OPPORTUNITYMARKET OPPORTUNITY
P4 CHAIRMAN’S LETTER
working together under FDX – we’re winning busi-
ness from our competitors by providing unmatched
service, access and connectivity. When we
announced the formation of FDX Corporation, many
observers assumed that the Caliber acquisition made sense only if we
fully integrated our operations. Based on 25 years of industry leader-
ship and expertise, we are doing just the opposite – and for compelling
strategic reasons. Simply layering the unique resource and operating
requirements of a time-definite, global, express-delivery network onto a
day-definite, ground small-package network would surely result in
diminished service quality and increased costs.
Under the FDX umbrella, we will leverage our shared
strengths while operating each delivery network independently,
with each focused on its respective markets. For FedEx, that
means an unrelenting dedication to rapid, time-specific global delivery
in 1, 2 or 3 business days. For RPS, that means continued commit-
ment to its highly efficient and reliable, business-to-business, ground
small-package delivery capability. The result for all FDX companies
is optimal service quality, reliability and profitability.
To capitalize on the synergies of our shared cus-
tomer relationships, we are aggressively aligning
sales and marketing initiatives across all FDX
=COMPLETE ONE =COMPLETE ONE
CHAIRMAN’S LETTER P5
companies, with particular attention to our primary
opportunities – FedEx and RPS. We have identified
more than one million FedEx customers who cur-
rently have no relationship with RPS. Conversely,
tens of thousands of RPS customers do not use FedEx for their inter-
national or U.S. domestic express shipments. Given an opportunity to
obtain the best of both delivery services, we find many businesses
eager to become full-fledged “FDX customers.”
FDX is now positioned to meet customer needs by providing
comprehensive transportation, logistics and supply chain
management solutions.
Increasingly, businesses are seeking strategic, cost-effective ways
to manage their supply chains – the series of transportation and
information exchanges required to convert parts and raw materials
into finished, delivered products. Experience tells us that customers
prefer one supplier to meet all of their distribution and logistics
needs. And FDX has what it takes: Our unique global network,
operational expertise and air route authorities cannot be repli-
cated by the competition. With FDX, our cus-
tomers have a strategic competitive weapon to
squeeze time, mass and cost from the supply chain.
-STOP SHIPPING -STOP SHIPPING + + +
P6 CHAIRMAN’S LETTER
Looking ahead, FDX will seize opportunities
to drive revenue growth and build bottom-line
results for our stockholders. We are focused on
three primary growth strategies: 1) A collabora-
tive sales process that leverages our shared customer relationships;
2) Aggressive global marketing of the broad FDX portfolio to tar-
geted prospective customers; and 3) Strategic application of infor-
mation systems to reduce costs and improve customer access and
connectivity. We see a very bright future for FDX – and we’re not
alone in our confidence. In June 1998, Wired magazine selected FDX
as one of 40 “New Blue Chips,” companies that are “building the new
economy (using) technology, networks and information to reshape the
world.” Of the 40 companies cited for possessing fundamental quali-
ties necessary to succeed in a fast-changing economy – globalism,
communication, innovation, technology and strategic vision – FDX was
the only company deemed to possess all five fundamentals as core
business elements. Thank you for your investment of capital and con-
fidence in this new brand of leadership
we call FDX. We expect to reward your
investment by demonstrating that FDX
equals a historic opportunity for growth,
profitability and market leadership.
=A NEW BRAND =A NEW BRAND
Frederick W. Smith
Chairman, President and
Chief Executive Officer

OF LEADERSHIPOF LEADERSHIP
P7
+ + +
P8
==
P9
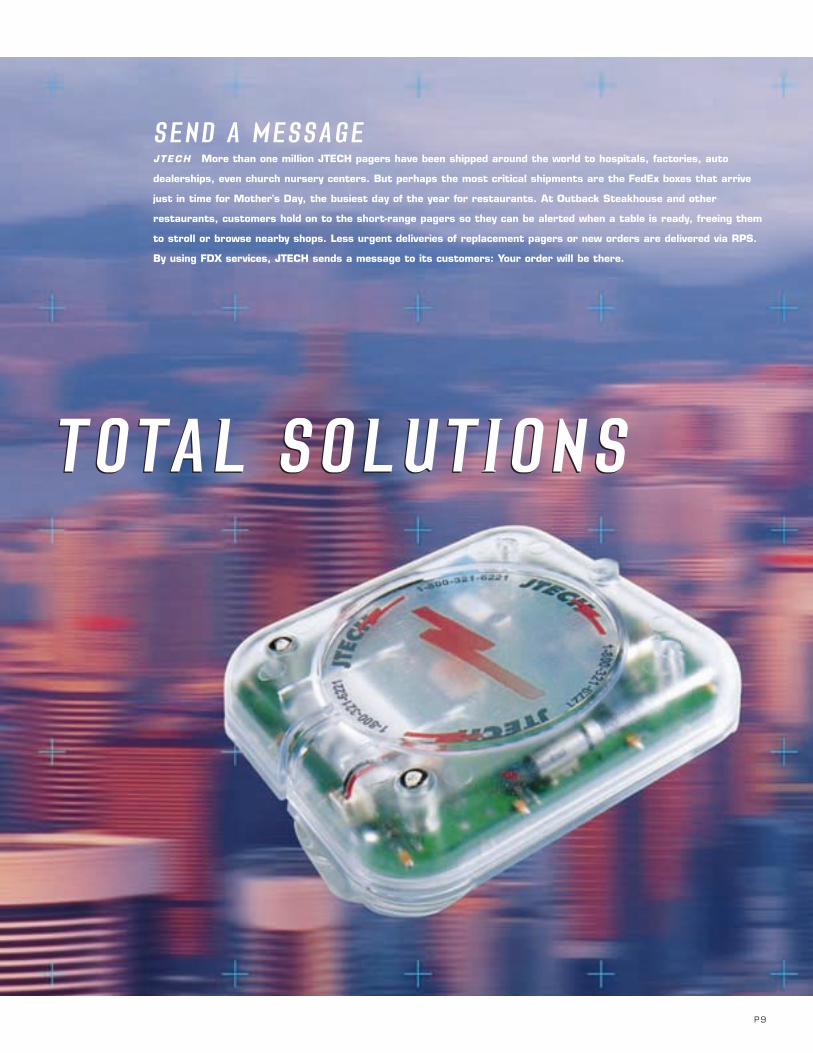
SEND A MESSAGEJTECH More than one million JTECH pagers have been shipped around the world to hospitals, factories, auto
dealerships, even church nursery centers. But perhaps the most critical shipments are the FedEx boxes that arrive
just in time for Mother's Day, the busiest day of the year for restaurants. At Outback Steakhouse and other
restaurants, customers hold on to the short-range pagers so they can be alerted when a table is ready, freeing them
to stroll or browse nearby shops. Less urgent deliveries of replacement pagers or new orders are delivered via RPS.
By using FDX services, JTECH sends a message to its customers: Your order will be there.
TOTAL SOLUTIONSTOTAL SOLUTIONS
P10
P11
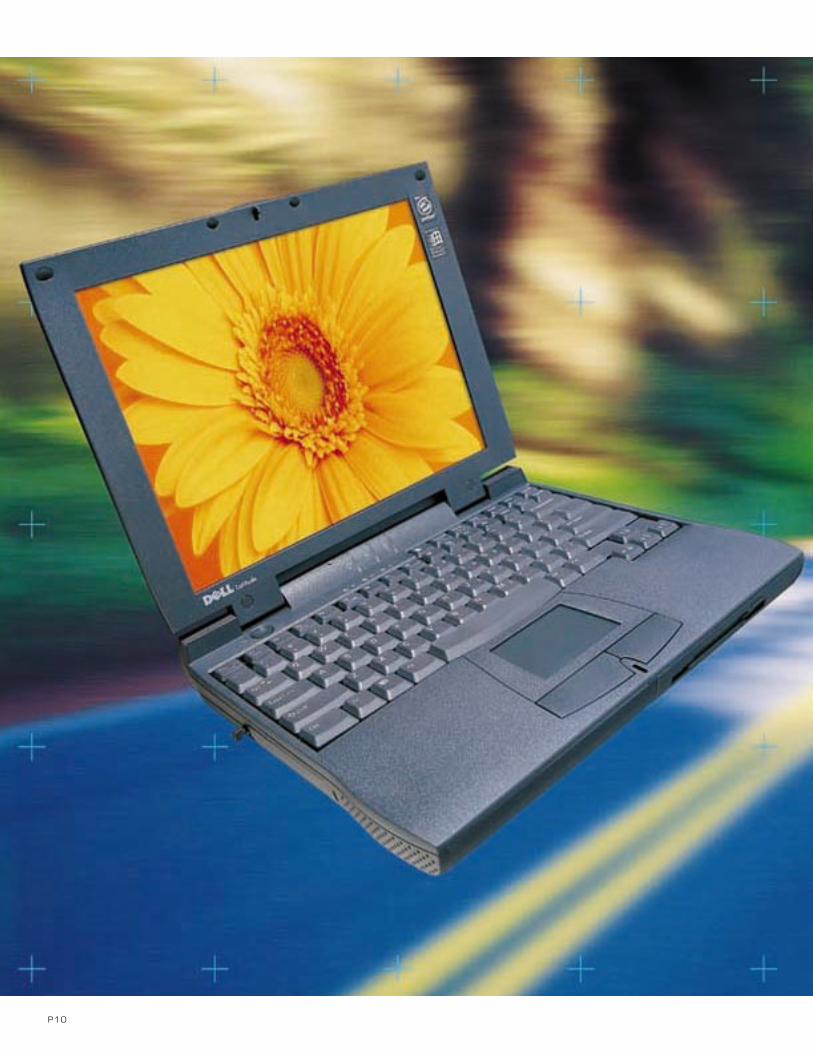
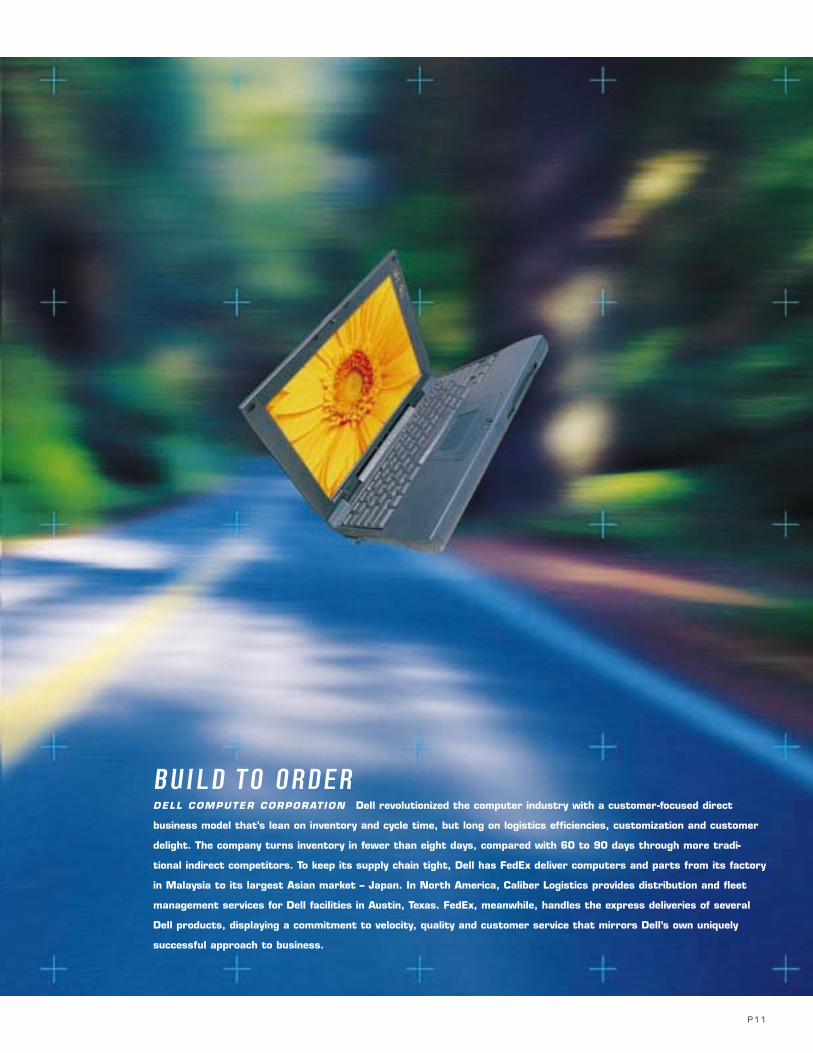
BUILD TO ORDERDELL COMPUTER CORPORATION Dell revolutionized the computer industry with a customer-focused direct
business model that’s lean on inventory and cycle time, but long on logistics efficiencies, customization and customer
delight. The company turns inventory in fewer than eight days, compared with 60 to 90 days through more tradi-
tional indirect competitors. To keep its supply chain tight, Dell has FedEx deliver computers and parts from its factory
in Malaysia to its largest Asian market – Japan. In North America, Caliber Logistics provides distribution and fleet
management services for Dell facilities in Austin, Texas. FedEx, meanwhile, handles the express deliveries of several
Dell products, displaying a commitment to velocity, quality and customer service that mirrors Dell’s own uniquely
successful approach to business.
P12
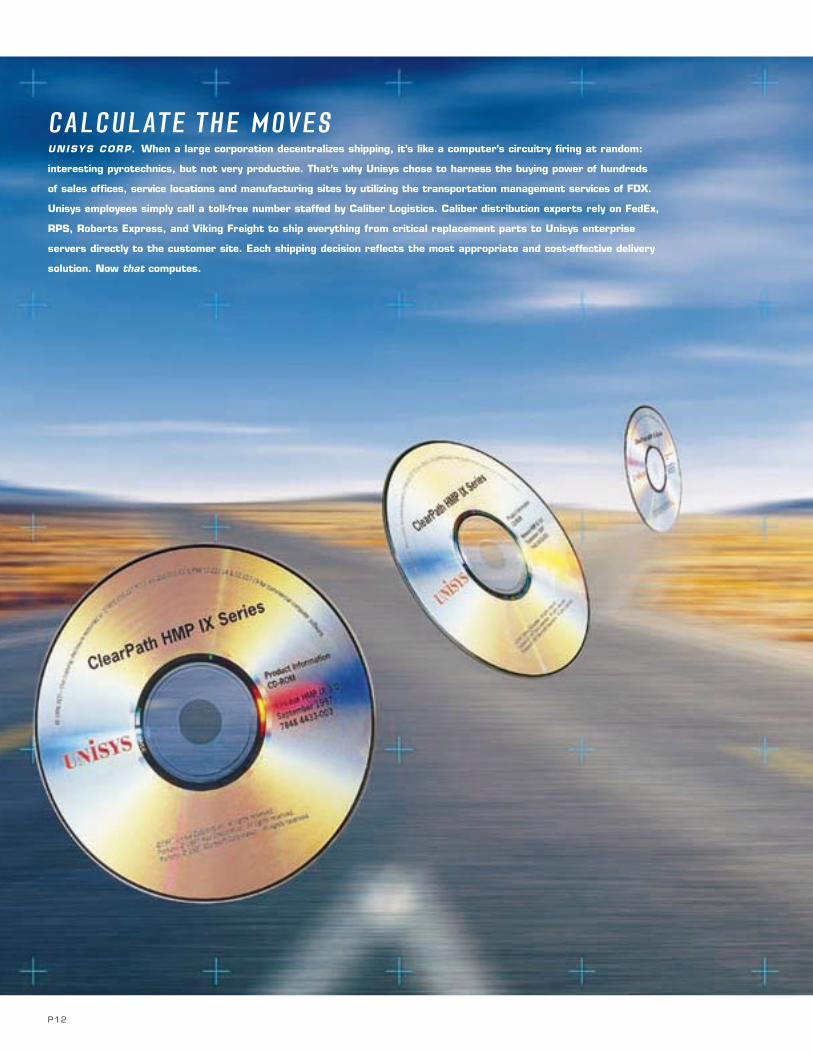
CALCULATE THE MOVESUNISYS CORP. When a large corporation decentralizes shipping, it’s like a computer’s circuitry firing at random:
interesting pyrotechnics, but not very productive. That’s why Unisys chose to harness the buying power of hundreds
of sales offices, service locations and manufacturing sites by utilizing the transportation management services of FDX.
Unisys employees simply call a toll-free number staffed by Caliber Logistics. Caliber distribution experts rely on FedEx,
RPS, Roberts Express, and Viking Freight to ship everything from critical replacement parts to Unisys enterprise
servers directly to the customer site. Each shipping decision reflects the most appropriate and cost-effective delivery
solution. Now that computes.

P13
CAPTURE THE MOMENTSART LEATHER When supplying 25,000 professional photographers with custom handmade photo albums, every-
thing has to be picture perfect from order through delivery. So Art Leather, the world’s largest manufacturer of
albums, folios and frames for professional photographers, and its partner, Gross National Products, offer customers
a choice of FDX services to meet their deadlines and budgets: FedEx express services or RPS ground small-package
delivery services. And the sky is no limit. Russian and U.S. commanders of the Mir Space Station recently exchanged
commemorative Art Leather albums. This year, FedEx and RPS will deliver more than 200,000 Art Leather ship-
ments, each one a thing memories are made of.

P14
SHOP FOR VALUESTAGE STORES INC. Challenged with opening one new department store a week, Stage Stores didn't have to
shop long before selecting FDX as its distribution ally. Every day, RPS delivers up to 13,000 cartons of popular name-
brand merchandise – from Levi Strauss to Liz Claiborne – to 630 stores trade-named Stage, Bealls and Palais Royal.
Stage Stores relies on RPS as the distribution arm of its state-of-the-art inventory tracking system, which identifies
and transfers slow-moving items and keeps staple merchandise in stock. Store advertising, payroll and other time-
sensitive corporate shipments are delivered via FedEx. In other words, for one-stop shipping, Stage Stores shops FDX.

P15
P16
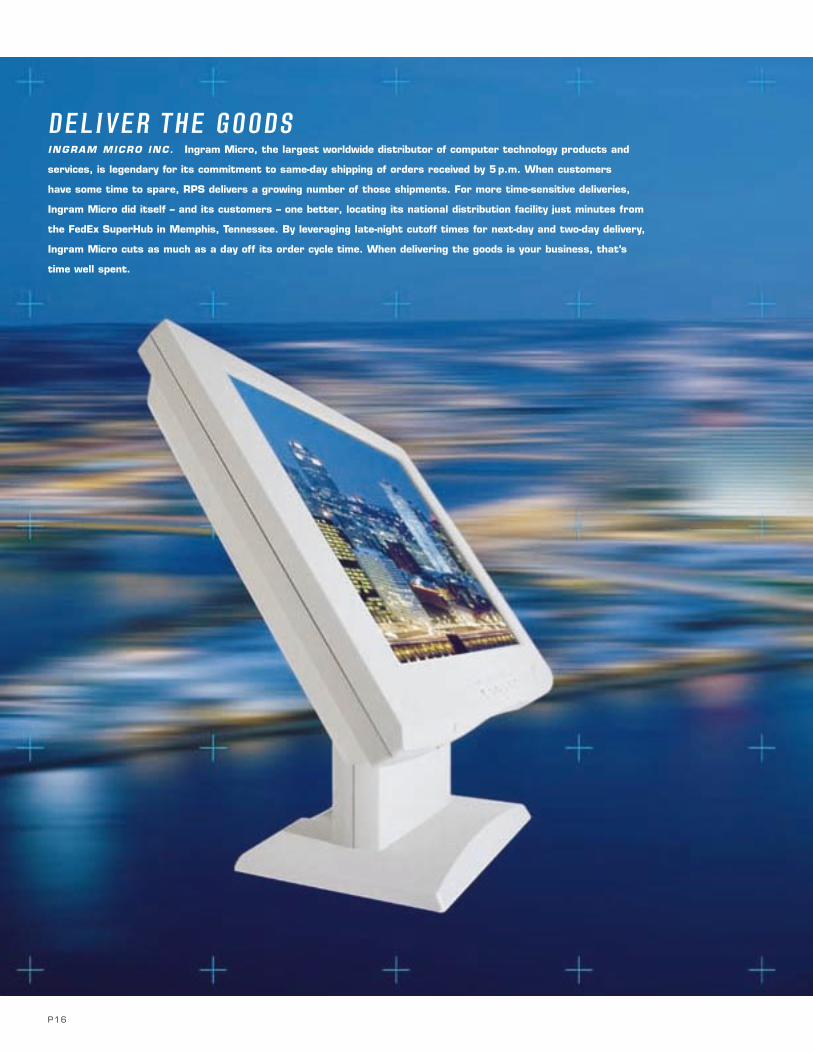
DELIVER THE GOODSINGRAM MICRO INC. Ingram Micro, the largest worldwide distributor of computer technology products and
services, is legendary for its commitment to same-day shipping of orders received by 5p.m. When customers
have some time to spare, RPS delivers a growing number of those shipments. For more time-sensitive deliveries,
Ingram Micro did itself – and its customers – one better, locating its national distribution facility just minutes from
the FedEx SuperHub in Memphis, Tennessee. By leveraging late-night cutoff times for next-day and two-day delivery,
Ingram Micro cuts as much as a day off its order cycle time. When delivering the goods is your business, that’s
time well spent.
P17
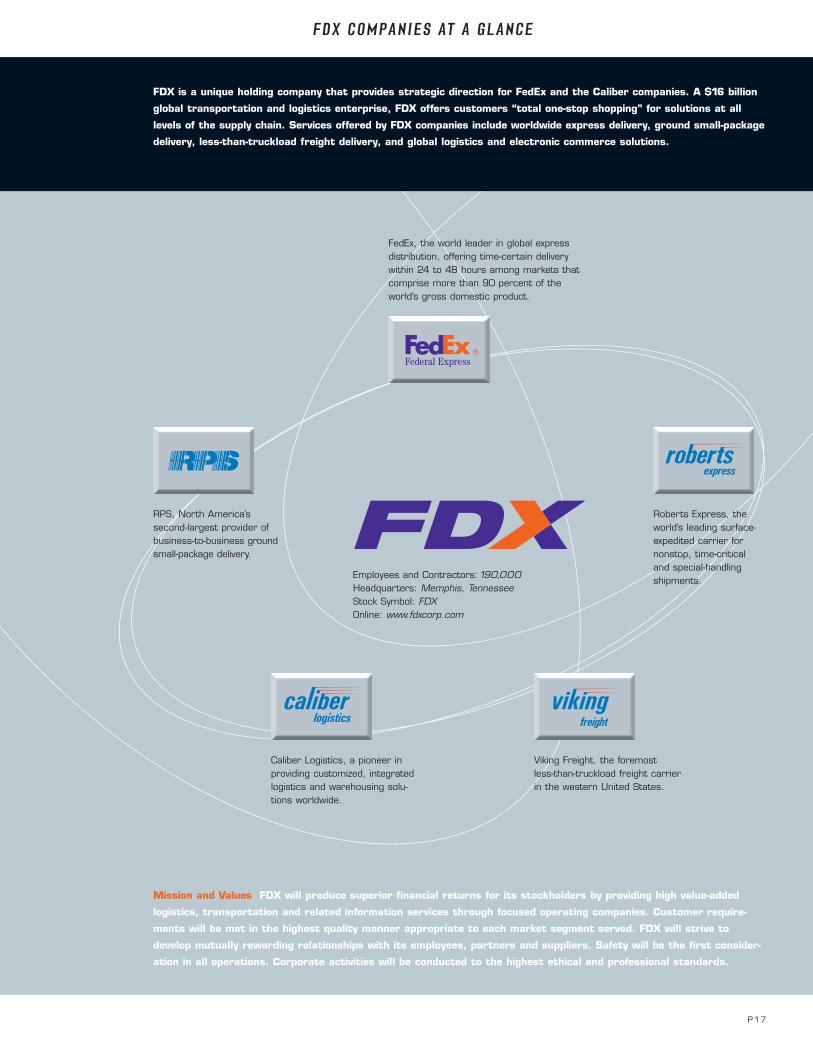
FDX COMPANIES AT A GLANCE
FedEx, the world leader in global express distribution, offering time-certain deliverywithin 24 to 48 hours among markets thatcomprise more than 90 percent of theworld’s gross domestic product.
RPS, North America’s second-largest provider ofbusiness-to-business groundsmall-package delivery.
Roberts Express, theworld’s leading surface-expedited carrier fornonstop, time-criticaland special-handlingshipments.
Viking Freight, the foremost less-than-truckload freight carrierin the western United States.
Caliber Logistics, a pioneer inproviding customized, integratedlogistics and warehousing solu-tions worldwide.
FDX is a unique holding company that provides strategic direction for FedEx and the Caliber companies. A $16 billion
global transportation and logistics enterprise, FDX offers customers “total one-stop shopping” for solutions at all
levels of the supply chain. Services offered by FDX companies include worldwide express delivery, ground small-package
delivery, less-than-truckload freight delivery, and global logistics and electronic commerce solutions.
Mission and Values FDX will produce superior financial returns for its stockholders by providing high value-added
logistics, transportation and related information services through focused operating companies. Customer require-
ments will be met in the highest quality manner appropriate to each market segment served. FDX will strive to
develop mutually rewarding relationships with its employees, partners and suppliers. Safety will be the first consider-
ation in all operations. Corporate activities will be conducted to the highest ethical and professional standards.
Employees and Contractors:190,000Headquarters: Memphis, Tennessee Stock Symbol: FDXOnline: www.fdxcorp.com
P18
A CELEBRAT ION OF
INNOVAT ION
Fiscal year 1998 marked
Federal Express Corporation’s
25th anniversary, and with it
the latest in a string of serv-
ice and technology innova-
tions that have made – and
kept – FedEx the industry
leader since 1973.
Despite Asia’s current finan-
cial situation, FedEx stuck by
its long-term strategy of
improving global connectivity
for FDX customers by refin-
ing and strategically expand-
ing FedEx’s worldwide
network. Examples include:
l To reduce transit times
along a route that links
North America, Europe,
the Middle East, India and
Asia, a new around-the-
world flight was launched in
September 1997.
l To expand customers’
options for delivering heavy
freight, FedEx introduced
FedEx International
Economy® Freight, providing
time-specific delivery (typi-
cally within five business
days) for heavy, skidded ship-
ments up to 1,500 lbs.
l To enhance global connec-
tivity with Asia, FedEx added
a nonstop daily flight with
overnight service linking
Osaka, Japan, with the
FedEx SuperHub in
Memphis. The flight makes
possible unprecedented
next-business-day delivery by
10:30 a.m. – backed by the
FedEx Money-Back
Guarantee – from key mar-
kets in Asia to thousands of
U.S. cities, major Canadian
markets and Mexico City.
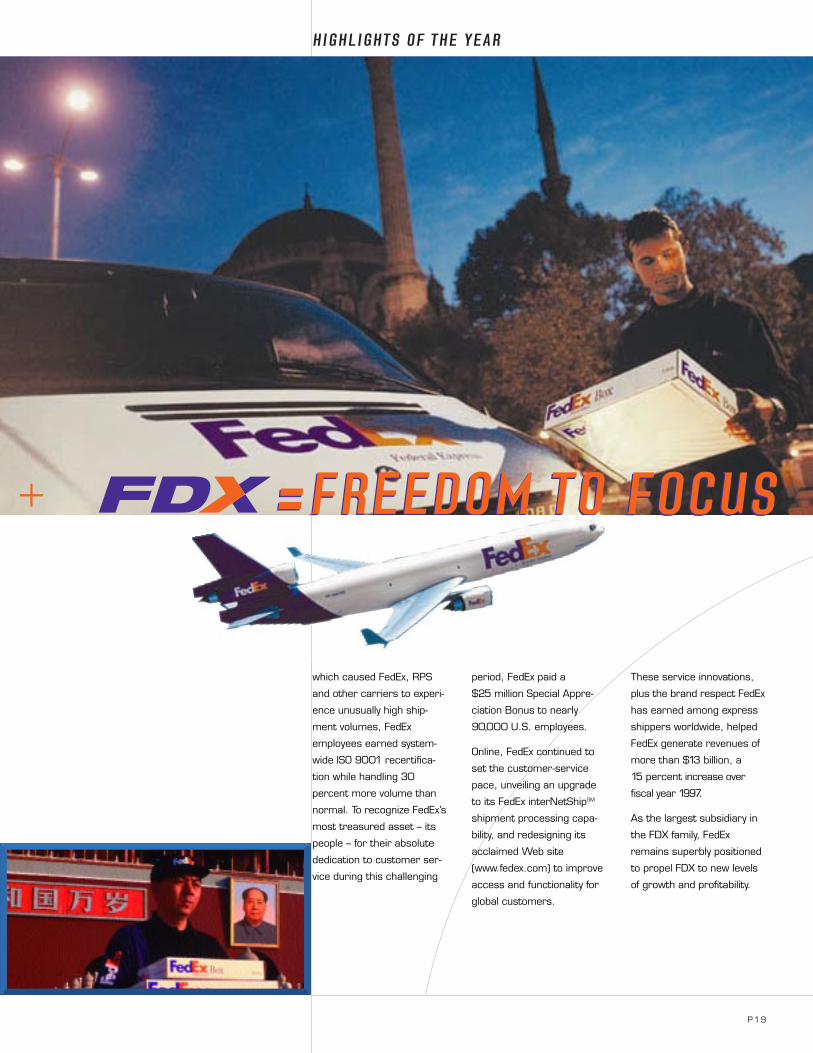
SERV ICE EXCELLENCE
Even as it expanded the
reach of its network, FedEx
continued to enhance the
convenience and quality of
its service.
During an August 1997
strike by UPS employees,
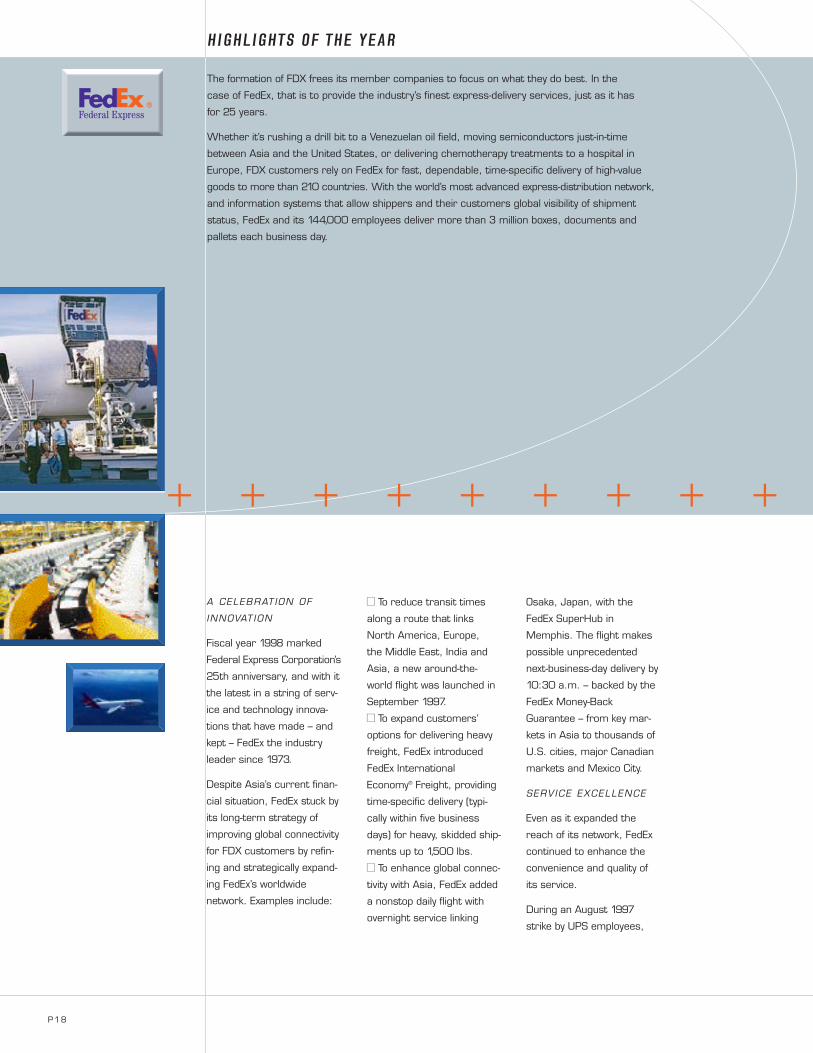
The formation of FDX frees its member companies to focus on what they do best. In the
case of FedEx, that is to provide the industry’s finest express-delivery services, just as it has
for 25 years.
Whether it’s rushing a drill bit to a Venezuelan oil field, moving semiconductors just-in-time
between Asia and the United States, or delivering chemotherapy treatments to a hospital in
Europe, FDX customers rely on FedEx for fast, dependable, time-specific delivery of high-value
goods to more than 210 countries. With the world’s most advanced express-distribution network,
and information systems that allow shippers and their customers global visibility of shipment
status, FedEx and its 144,000 employees deliver more than 3 million boxes, documents and
pallets each business day.
HIGHLIGHTS OF THE YEAR
+ + + + + + + + +
P19
which caused FedEx, RPS
and other carriers to experi-
ence unusually high ship-
ment volumes, FedEx
employees earned system-
wide ISO 9001 recertifica-
tion while handling 30
percent more volume than
normal. To recognize FedEx’s
most treasured asset – its
people – for their absolute
dedication to customer ser-
vice during this challenging
period, FedEx paid a
$25 million Special Appre-
ciation Bonus to nearly
90,000 U.S. employees.
Online, FedEx continued to
set the customer-service
pace, unveiling an upgrade
to its FedEx interNetShipSM
shipment processing capa-
bility, and redesigning its
acclaimed Web site
(www.fedex.com) to improve
access and functionality for
global customers.
These service innovations,
plus the brand respect FedEx
has earned among express
shippers worldwide, helped
FedEx generate revenues of
more than $13 billion, a
15 percent increase over
fiscal year 1997.
As the largest subsidiary in
the FDX family, FedEx
remains superbly positioned
to propel FDX to new levels
of growth and profitability.
HIGHLIGHTS OF THE YEAR
=FREEDOM TO FOCUS + =FREEDOM TO FOCUS
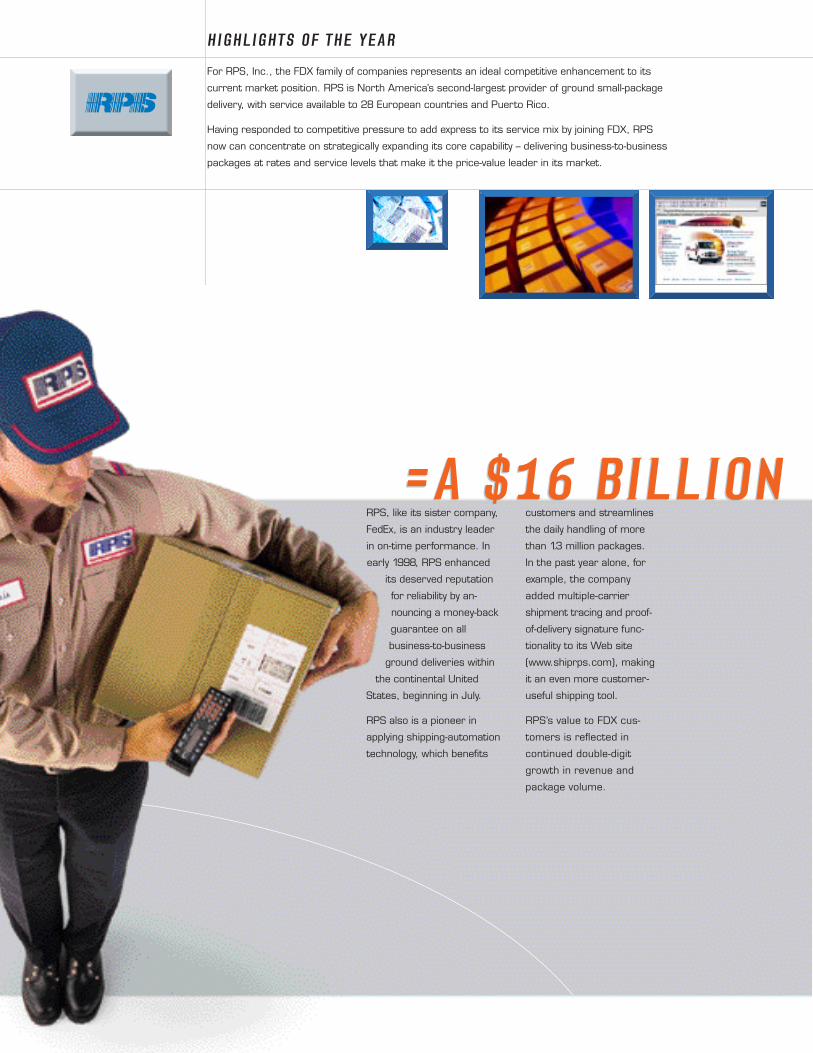
For RPS, Inc., the FDX family of companies represents an ideal competitive enhancement to its
current market position. RPS is North America’s second-largest provider of ground small-package
delivery, with service available to 28 European countries and Puerto Rico.
Having responded to competitive pressure to add express to its service mix by joining FDX, RPS
now can concentrate on strategically expanding its core capability – delivering business-to-business
packages at rates and service levels that make it the price-value leader in its market.
HIGHLIGHTS OF THE YEAR
customers and streamlines
the daily handling of more
than 1.3 million packages.
In the past year alone, for
example, the company
added multiple-carrier
shipment tracing and proof-
of-delivery signature func-
tionality to its Web site
(www.shiprps.com), making
it an even more customer-
useful shipping tool.
RPS’s value to FDX cus-
tomers is reflected in
continued double-digit
growth in revenue and
package volume.
RPS, like its sister company,
FedEx, is an industry leader
in on-time performance. In
early 1998, RPS enhanced
its deserved reputation
for reliability by an-
nouncing a money-back
guarantee on all
business-to-business
ground deliveries within
the continental United
States, beginning in July.
RPS also is a pioneer in
applying shipping-automation
technology, which benefits
=A $16 BILLION =A $16 BILLION
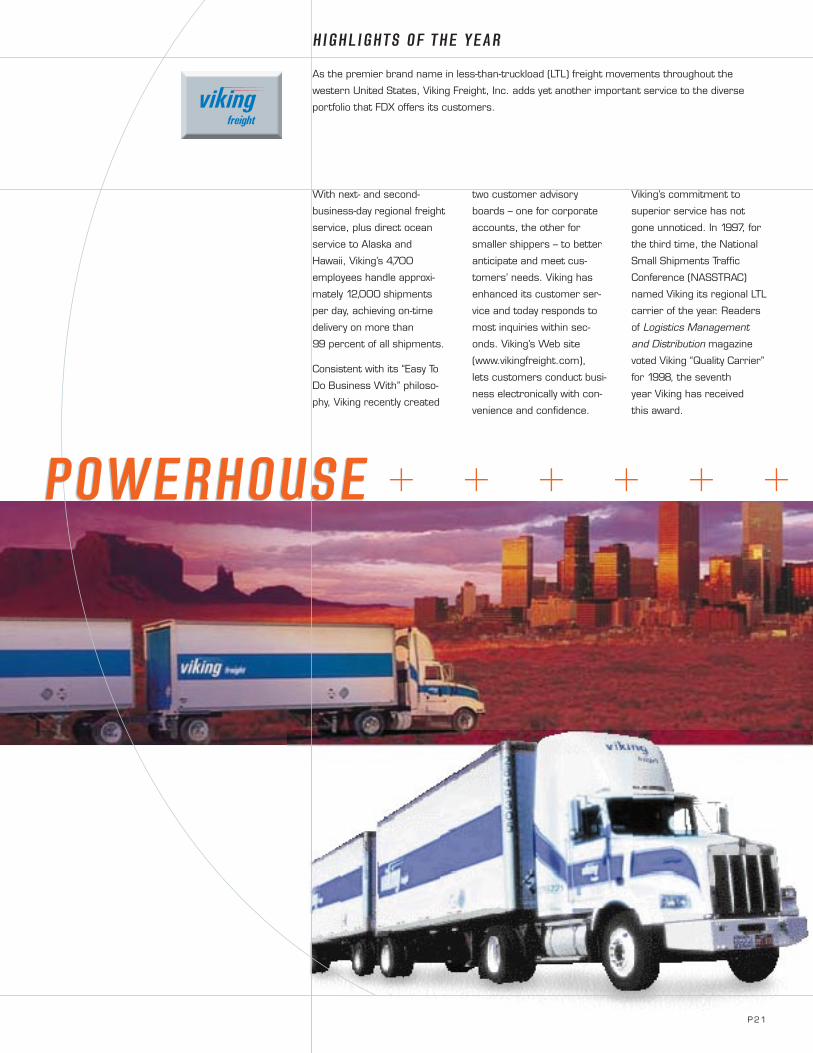
With next- and second-
business-day regional freight
service, plus direct ocean
service to Alaska and
Hawaii, Viking’s 4,700
employees handle approxi-
mately 12,000 shipments
per day, achieving on-time
delivery on more than
99 percent of all shipments.
Consistent with its “Easy To
Do Business With” philoso-
phy, Viking recently created
two customer advisory
boards – one for corporate
accounts, the other for
smaller shippers – to better
anticipate and meet cus-
tomers’ needs. Viking has
enhanced its customer ser-
vice and today responds to
most inquiries within sec-
onds. Viking’s Web site
(www.vikingfreight.com),
lets customers conduct busi-
ness electronically with con-
venience and confidence.
Viking’s commitment to
superior service has not
gone unnoticed. In 1997, for
the third time, the National
Small Shipments Traffic
Conference (NASSTRAC)
named Viking its regional LTL
carrier of the year. Readers
of Logistics Management
and Distribution magazine
voted Viking “Quality Carrier”
for 1998, the seventh
year Viking has received
this award.
As the premier brand name in less-than-truckload (LTL) freight movements throughout the
western United States, Viking Freight, Inc. adds yet another important service to the diverse
portfolio that FDX offers its customers.
+ + + + + +
HIGHLIGHTS OF THE YEAR
POWERHOUSE POWERHOUSE
P21
P22
HIGHLIGHTS OF THE YEAR
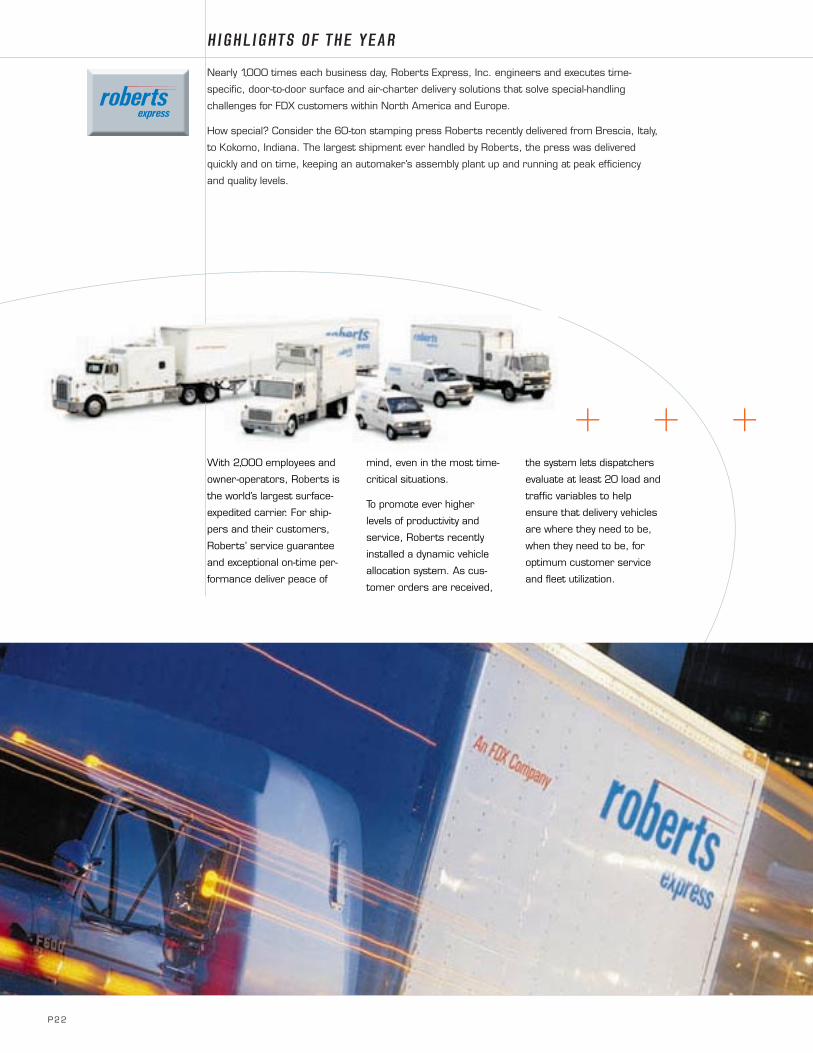
Nearly 1,000 times each business day, Roberts Express, Inc. engineers and executes time-
specific, door-to-door surface and air-charter delivery solutions that solve special-handling
challenges for FDX customers within North America and Europe.
How special? Consider the 60-ton stamping press Roberts recently delivered from Brescia, Italy,
to Kokomo, Indiana. The largest shipment ever handled by Roberts, the press was delivered
quickly and on time, keeping an automaker’s assembly plant up and running at peak efficiency
and quality levels.
With 2,000 employees and
owner-operators, Roberts is
the world’s largest surface-
expedited carrier. For ship-
pers and their customers,
Roberts’ service guarantee
and exceptional on-time per-
formance deliver peace of
mind, even in the most time-
critical situations.
To promote ever higher
levels of productivity and
service, Roberts recently
installed a dynamic vehicle
allocation system. As cus-
tomer orders are received,
the system lets dispatchers
evaluate at least 20 load and
traffic variables to help
ensure that delivery vehicles
are where they need to be,
when they need to be, for
optimum customer service
and fleet utilization.
+ + +
P23
From order-fulfillment systems to warehousing solutions, Caliber Logistics, Inc. develops and
implements customized logistics solutions that help FDX customers manage costs, improve cus-
tomer service and focus on their core business activities.
With 3,500 employees and owner-operators worldwide, Caliber Logistics manages logistics for
more than 100 FDX customer locations. It handles more than 3 million shipments per year and
operates more than 6 million square feet of contract warehouse space.
HIGHLIGHTS OF THE YEAR
From its base of operations
in the United States and
Canada, Caliber Logistics
launched European opera-
tions in the Netherlands in
1996. Since then, new oper-
ations in Belgium, Northern
Ireland and Scotland have
propelled European rev-
enues to nearly 10 percent
of the company’s annual
total. During the second half
of 1998, the company
expects to continue its
controlled, opportunistic
expansion by initiating opera-
tions in Mexico and Asia.
To help customers manage
logistics activities and infor-
mation seamlessly across
international borders, the
company is deploying unique
transportation management
software. When installed,
initially in the United States
and Europe, it will make
Caliber the first logistics sup-
plier to offer customers a
single transportation-
management interface on
both sides of the Atlantic.
=SHARED STRENGTHS=SHARED STRENGTHS
P24
MESSAGE FROM THE CHIEF FINANCIAL OFFICER
Stockholders can expect to
benefit from growth trends
driving the multiple market
niches now served by FDX.
For each one of the FDX
companies, we will focus on
making appropriate
investments in the technol-
ogy and transportation
assets necessary to opti-
mize our enhanced profit
position in terms of earnings
performance and cash
flow. Our strict yield manage-
ment programs will
continue to support profit-
able volume growth.
We will manage the busi-
ness as a portfolio. As a
result, decisions on capital
investment, expansion of our
delivery and information
technology networks, and
service additions or
enhancements will be based
on achieving the highest
overall return on capital. In
addition, our collaborative
selling process will increase
revenues for the operating
companies through a tar-
geted program focusing on
high-yielding business.
While the birth of FDX was a
unique event in the trans-
portation industry, fiscal
year 1998 was, in many
ways, another step on a con-
tinuum of excellence – that
is, a continuation of the
financial performance, ser-
vice and technology innova-
tion, and global leadership
FedEx stockholders have
grown to expect.
The birth of FDX Corporation illustrates the financial synergies that can result when two
complementary organizations combine strengths under a shared vision.
The acquisition of Caliber System, Inc. by FedEx – a “pooling of interests” transaction – was
accretive to FedEx earnings in fiscal year 1998. The transaction included no goodwill charges,
produced a tax-free exchange of shares for Caliber stockholders, and left the FDX balance
sheet in robust health.
Alan B. Graf, Jr.
Executive Vice President
and Chief Financial Officer
FINANCIAL SECTION
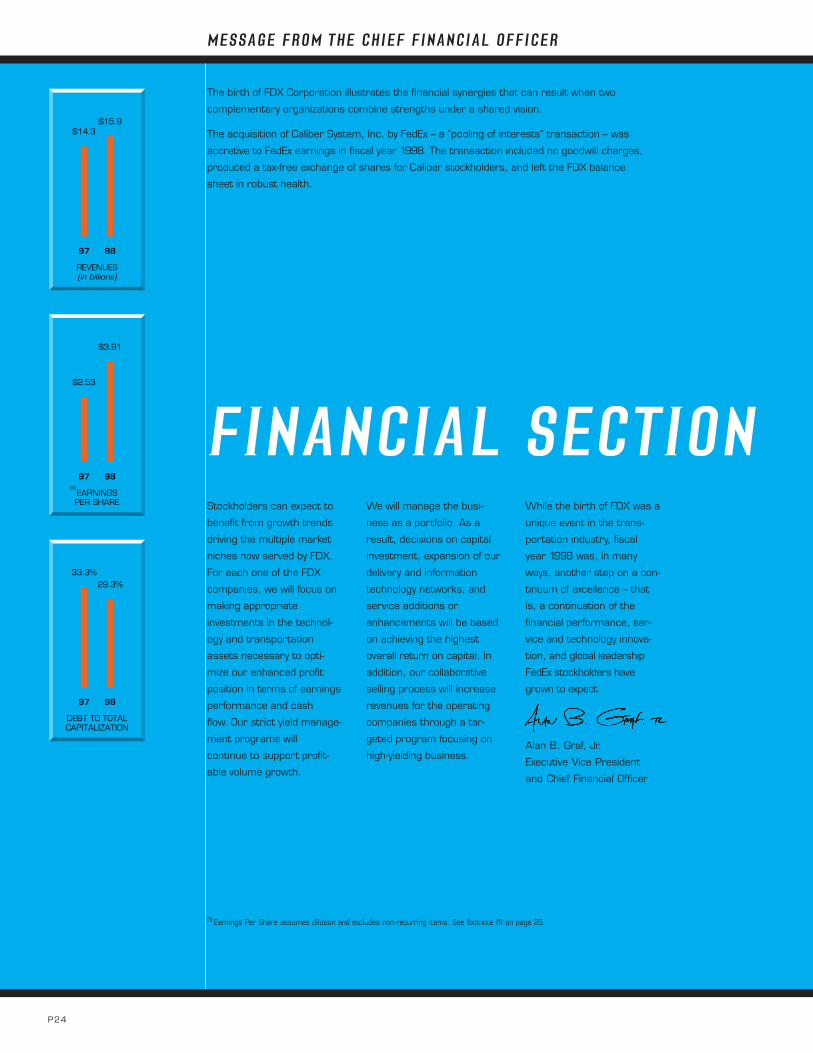
97 98
REVENUES(in billions)
(1)
97 98
EARNINGS PER SHARE
33.3%29.3%
97 98
DEBT TO TOTAL CAPITALIZATION
$14.3$15.9
$2.53
$3.91
(1) Earnings Per Share assumes dilution and excludes non-recurring items. See footnote (1) on page 25.
FDX CORPORATION P25
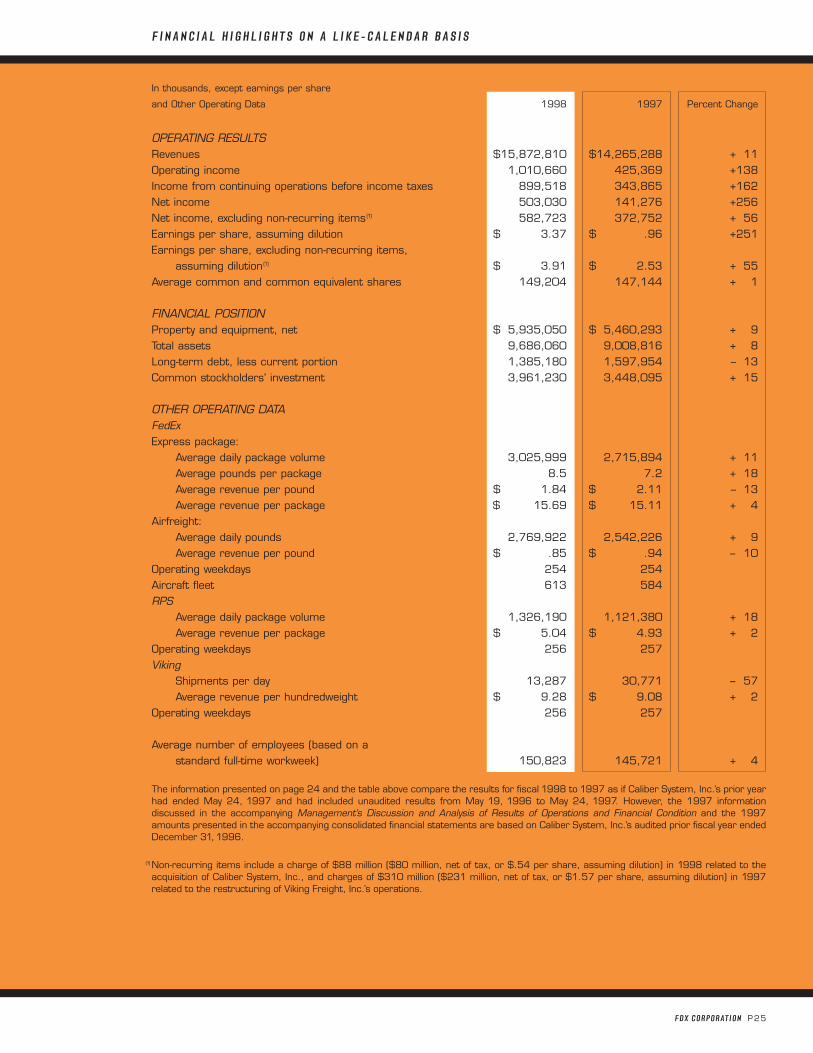
In thousands, except earnings per share
and Other Operating Data 1998 1997 Percent Change
OPERATING RESULTSRevenues $15,872,810 $14,265,288 + 11Operating income 1,010,660 425,369 +138Income from continuing operations before income taxes 899,518 343,865 +162Net income 503,030 141,276 +256Net income, excluding non-recurring items(1) 582,723 372,752 + 56Earnings per share, assuming dilution $ 3.37 $ .96 +251Earnings per share, excluding non-recurring items,
assuming dilution(1) $ 3.91 $ 2.53 + 55Average common and common equivalent shares 149,204 147,144 + 1
FINANCIAL POSITIONProperty and equipment, net $ 5,935,050 $ 5,460,293 + 9Total assets 9,686,060 9,008,816 + 8Long-term debt, less current portion 1,385,180 1,597,954 – 13Common stockholders’ investment 3,961,230 3,448,095 + 15
OTHER OPERATING DATAFedExExpress package:
Average daily package volume 3,025,999 2,715,894 + 11Average pounds per package 8.5 7.2 + 18Average revenue per pound $ 1.84 $ 2.11 – 13Average revenue per package $ 15.69 $ 15.11 + 4
Airfreight:Average daily pounds 2,769,922 2,542,226 + 9Average revenue per pound $ .85 $ .94 – 10
Operating weekdays 254 254Aircraft fleet 613 584RPS
Average daily package volume 1,326,190 1,121,380 + 18Average revenue per package $ 5.04 $ 4.93 + 2
Operating weekdays 256 257Viking
Shipments per day 13,287 30,771 – 57Average revenue per hundredweight $ 9.28 $ 9.08 + 2
Operating weekdays 256 257
Average number of employees (based on a standard full-time workweek) 150,823 145,721 + 4
The information presented on page 24 and the table above compare the results for fiscal 1998 to 1997 as if Caliber System, Inc.’s prior yearhad ended May 24, 1997 and had included unaudited results from May 19, 1996 to May 24, 1997. However, the 1997 information discussed in the accompanying Management’s Discussion and Analysis of Results of Operations and Financial Condition and the 1997amounts presented in the accompanying consolidated financial statements are based on Caliber System, Inc.’s audited prior fiscal year endedDecember 31,1996.
(1) Non-recurring items include a charge of $88 million ($80 million, net of tax, or $.54 per share, assuming dilution) in 1998 related to theacquisition of Caliber System, Inc., and charges of $310 million ($231 million, net of tax, or $1.57 per share, assuming dilution) in 1997related to the restructuring of Viking Freight, Inc.’s operations.
F I N A N C I A L H I G H L I G H T S O N A L I K E - C A L E N D A R B A S I S
P26 FDX CORPORATION
F I N A N C I A L H I G H L I G H T S
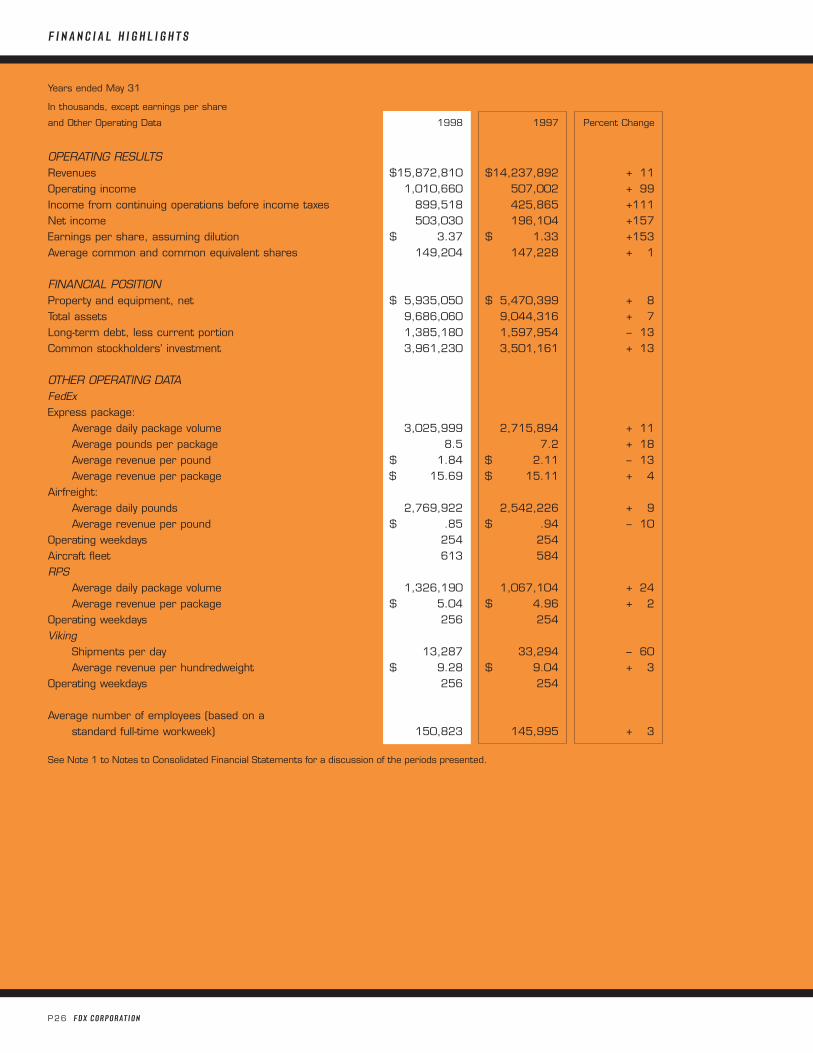
Years ended May 31
In thousands, except earnings per share
and Other Operating Data 1998 1997 Percent Change
OPERATING RESULTSRevenues $15,872,810 $14,237,892 + 11Operating income 1,010,660 507,002 + 99Income from continuing operations before income taxes 899,518 425,865 +111Net income 503,030 196,104 +157Earnings per share, assuming dilution $ 3.37 $ 1.33 +153Average common and common equivalent shares 149,204 147,228 + 1
FINANCIAL POSITIONProperty and equipment, net $ 5,935,050 $ 5,470,399 + 8Total assets 9,686,060 9,044,316 + 7Long-term debt, less current portion 1,385,180 1,597,954 – 13Common stockholders’ investment 3,961,230 3,501,161 + 13
OTHER OPERATING DATAFedExExpress package:
Average daily package volume 3,025,999 2,715,894 + 11Average pounds per package 8.5 7.2 + 18Average revenue per pound $ 1.84 $ 2.11 – 13Average revenue per package $ 15.69 $ 15.11 + 4
Airfreight:Average daily pounds 2,769,922 2,542,226 + 9Average revenue per pound $ .85 $ .94 – 10
Operating weekdays 254 254Aircraft fleet 613 584RPS
Average daily package volume 1,326,190 1,067,104 + 24Average revenue per package $ 5.04 $ 4.96 + 2
Operating weekdays 256 254Viking
Shipments per day 13,287 33,294 – 60Average revenue per hundredweight $ 9.28 $ 9.04 + 3
Operating weekdays 256 254
Average number of employees (based on a standard full-time workweek) 150,823 145,995 + 3
See Note 1 to Notes to Consolidated Financial Statements for a discussion of the periods presented.
FDX CORPORATION P27
On January 27, 1998, Federal Express Corporation(“FedEx”) and Caliber System, Inc. (“Caliber”) became wholly-owned subsidiaries of a newly-formed holding company,FDX Corporation (together with its subsidiaries, the “Com-pany”). In this transaction, which was accounted for as apooling of interests, Caliber shareholders received 0.8shares of the Company’s common stock for each share ofCaliber common stock. Each share of FedEx common stockwas automatically converted into one share of the Com-pany’s common stock. There were approximately146,800,000 of $.10 par value shares so issued or con-verted. The accompanying financial statements have beenrestated to include the financial position and results of oper-ations for both FedEx and Caliber for all periods presented.
Caliber operated on a13 four-week period calendar end-ing December 31 with 12 weeks in each of the firstthree quarters and 16 weeks in the fourth quarter.FedEx’s fiscal year ending May 31 consists of four, three-month quarters. The accompanying consolidatedresults of operations and cash flows and the followingfinancial and statistical information for the year endedMay 31, 1998 combine Caliber’s 53-week period fromMay 25, 1997 to May 31, 1998 with FedEx’s yearended May 31, 1998. The Company’s consolidatedfinancial position as of May 31, 1998 consists of Cal-iber’s financial position as of May 31,1998 consolidatedwith FedEx’s financial position as of May 31, 1998. Theaccompanying consolidated results of operations andcash flows and the following financial and statisticalinformation for the years ended May 31, 1997 and1996 combine Caliber’s 52 weeks ended December31, 1996 and 1995, respectively, with FedEx’s yearsended May 31, 1997 and 1996, respectively. The Com-pany’s consolidated financial position as of May 31,1997 consists of Caliber’s financial position as ofDecember 31, 1996 consolidated with FedEx’s financialposition as of May 31, 1997.
Due to the different fiscal year ends, Caliber’s results ofoperations for the period January 1, 1997 to May 24,1997 do not appear in the Consolidated Statements ofIncome and instead are recorded as a direct adjust-ment to equity. Caliber’s revenues, operating expensesand net loss for this period were $1.0 billion, $1.1 billionand $41 million, respectively. Included in expenses forthis period was an $85 million pre-tax charge ($56 mil-lion, net of tax) related to the restructuring of VikingFreight, Inc. (“Viking”), Caliber’s regional freight carrier(discussed below).
RESULTS OF OPERATIONS
Consolidated net income for 1998 was $503 million($3.37 per share, assuming dilution) compared with $196 million ($1.33 per share, assuming dilution) and
$281million ($1.92 per share, assuming dilution) for1997and1996, respectively. Current year results reflect strongdomestic package volume growth and slightly improving revenue per package (yield) at both FedEx and RPS, Inc.(“RPS”) and significant improvements in Viking’s operations.
FedEx’s net income for 1998 was $421 million com-pared with $361 million and $308 million for 1997 and1996, respectively. Year-over-year improvements inFedEx’s consolidated results for the past three yearsreflect double-digit growth of its express delivery pack-age volume and slight improvements in U.S. domesticyield. In 1998, U.S. domestic margins improved asyields increased at a higher rate than cost per package.However, international margins declined in the face ofdiminished airfreight revenues, foreign currency fluctua-tions and rising expenses.
From continuing operations, Caliber recorded income of$78 million for 1998, a loss of $165 million for 1997and income of $92 million for 1996. The current yearincome is attributable to strong volume growth andincreased yields at RPS, Caliber’s ground small-packagecarrier, and improved operations at Viking since itsrestructuring in March 1997 (discussed below). Exclud-ing impairment charges related to the Viking restructur-ing, Caliber recorded net income of $10 million in1997.
Non-recurring ItemsResults of operations included various non-recurringitems which affected reported earnings for 1998 and1997 as discussed below.
Current year results included $88 million ($80 million,net of tax) of expenses related to the acquisition of Cal-iber and the formation of the Company. These expenseswere primarily investment banking fees and payments tomembers of Caliber’s management in accordance withpre-existing management retention agreements. Exclud-ing these expenses, consolidated net income for 1998was $583 million, or $3.91 per share, assuming dilu-tion.
Also in the current year, Viking recognized a $16 milliongain from assets sold in its restructuring, which wasannounced by Caliber on March 27, 1997. Under therestructuring plan, operations at Viking’s midwestern,eastern and northeastern divisions ceased on March27, 1997, and Viking’s southwestern division operatedthrough June 1997 and was subsequently sold. Vikingcontinues to operate in the western United Stateswhere it has been a leader in the regional less-than-truckload market for many years. In connection with therestructuring, Caliber recorded a non-cash assetimpairment charge of $225 million ($175 million, net oftax) in December 1996 and an $85 million restructur-ing charge in March 1997. Excluding the net effect ofthe December 1996 charge, consolidated net income
M A N A G E M E N T ’ S D I S C U S S I O N A N D A N A L Y S I S O F R E S U LT S O F O P E R AT I O N S A N D F I N A N C I A L C O N D I T I O N
P28 FDX CORPORATION
M A N A G E M E N T ’ S D I S C U S S I O N A N D A N A L Y S I S
for 1997 was $371 million, or $2.52 per share,assuming dilution.
In addition, Caliber recorded in 1998 approximately$5 million of income, net of tax, from discontinued oper-ations related to the exiting of the airfreight businessserved by Roadway Global Air, Inc. in 1995.
A significant non-recurring item impacting 1998’sresults of operations was the Teamsters strike againstUnited Parcel Service (“UPS”) in August 1997. Duringthe 12 operating days of the strike, FedEx deliveredapproximately 800,000 additional U.S. domesticexpress packages per day, and RPS delivered approxi-mately 300,000 additional packages per day. While it isdifficult to estimate with precision the impact of thisadditional volume, FedEx and RPS have retained a por-tion of this volume. The Company analytically calculatedthat the volume not retained at the end of the first quar-ter contributed approximately $170 million in revenuesto that quarter. This additional revenue, net of applicablevariable compensation, income taxes and variablecosts, but not allocated fixed costs, resulted in approxi-mately $.25 additional earnings per share, assumingdilution, to the consolidated first quarter’s earnings.
FedEx recorded two aircraft-related items in the currentyear. FedEx realized a net gain of $17 million from the
insurance settlement and the release from certainrelated liabilities on a leased MD11 aircraft destroyed inan accident in July 1997. This gain was recorded inoperating and non-operating income in substantiallyequal amounts. An unrelated expense, which partiallyoffset this gain, was an addition of $9 million to an oper-ating reserve for the disposition of leased B747 air-craft. In recording the additional reserve, maintenanceand repairs and rentals and landing fees expenses wereincreased. These aircraft, which were subleased,underwent certain maintenance and repairs beforebeing transferred to a new lessee. The net effect of theMD11 gain and the B747 reserve on FedEx’s domesticand international operating income was immaterial. Thecombined effect of these aircraft-related items con-tributed approximately $.03 per share in the first quar-ter of 1998, net of applicable variable compensationand income taxes.
FedEx’s 1997 results included a $15 million pre-tax benefit to operating income from the settlement of a Tennessee personal property tax matter and a $17 million gain in non-operating income from an insur-ance settlement for a DC10 destroyed by fire in Sep-tember 1996.
In 1998, FedEx’s U.S. domestic package volumesincreased on a year-over-year basis primarily due to
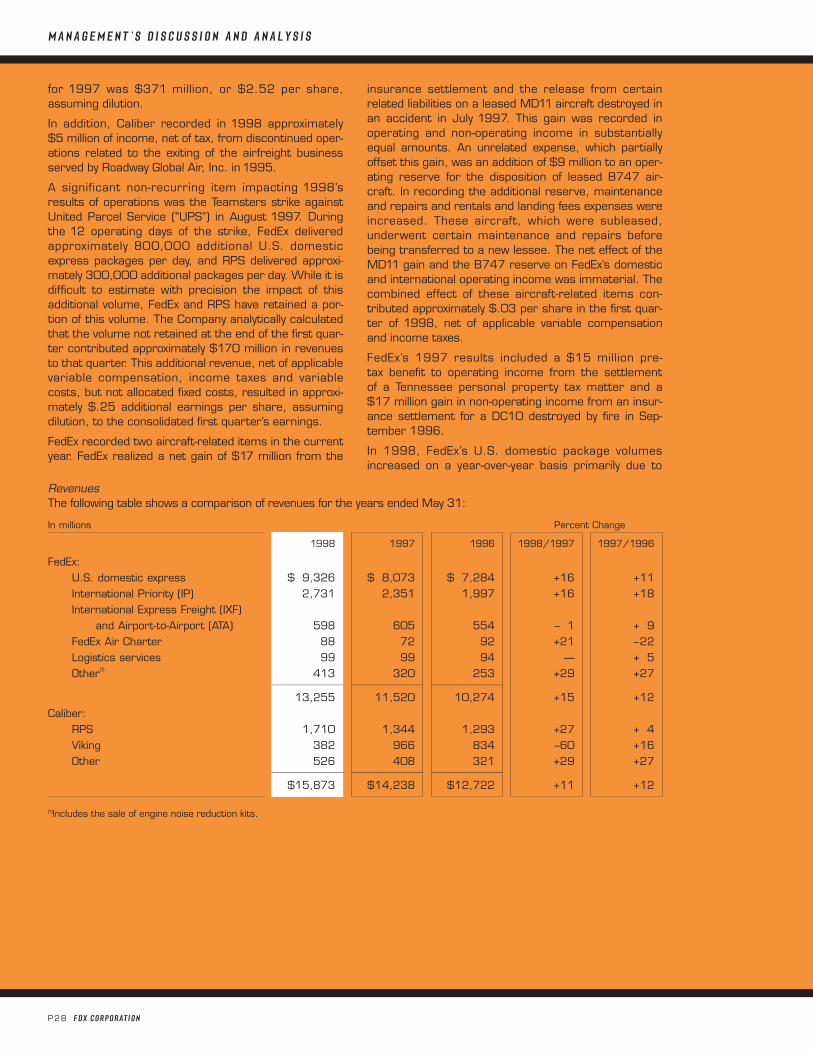
RevenuesThe following table shows a comparison of revenues for the years ended May 31:
In millions Percent Change
1998 1997 1996 1998/1997 1997/1996
FedEx:U.S. domestic express $ 9,326 $ 8,073 $ 7,284 +16 +11International Priority (IP) 2,731 2,351 1,997 +16 +18International Express Freight (IXF)
and Airport-to-Airport (ATA) 598 605 554 – 1 + 9FedEx Air Charter 88 72 92 +21 –22Logistics services 99 99 94 — + 5Other(1) 413 320 253 +29 +27
pppppppppppppppppppppppppppppppppppppppppppppppppppppp pppppppppppppppppppppppppppppppppppppppppppppppppppppp pppppppppppppppppppppppppppppppppppppppppppppppppppppp
13,255 11,520 10,274 +15 +12Caliber:
RPS 1,710 1,344 1,293 +27 + 4Viking 382 966 834 –60 +16Other 526 408 321 +29 +27
pppppppppppppppppppppppppppppppppppppppppppppppppppppp pppppppppppppppppppppppppppppppppppppppppppppppppppppp pppppppppppppppppppppppppppppppppppppppppppppppppppppp
$15,873 $14,238 $12,722 +11 +12
(1)Includes the sale of engine noise reduction kits.
FDX CORPORATION P29
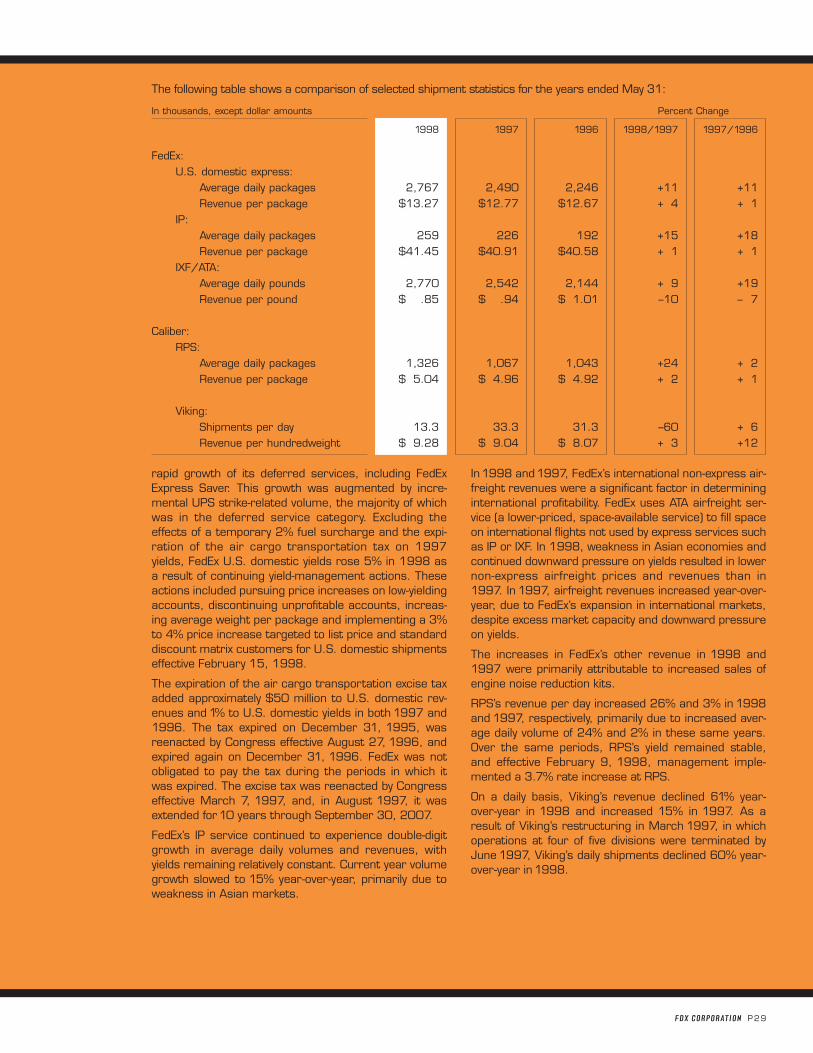
The following table shows a comparison of selected shipment statistics for the years ended May 31:
In thousands, except dollar amounts Percent Change
1998 1997 1996 1998/1997 1997/1996
FedEx:U.S. domestic express:
Average daily packages 2,767 2,490 2,246 +11 +11Revenue per package $13.27 $12.77 $12.67 + 4 + 1
IP:Average daily packages 259 226 192 +15 +18Revenue per package $41.45 $40.91 $40.58 + 1 + 1
IXF/ATA:Average daily pounds 2,770 2,542 2,144 + 9 +19Revenue per pound $ .85 $ .94 $ 1.01 –10 – 7
Caliber:RPS:
Average daily packages 1,326 1,067 1,043 +24 + 2Revenue per package $ 5.04 $ 4.96 $ 4.92 + 2 + 1
Viking:Shipments per day 13.3 33.3 31.3 –60 + 6Revenue per hundredweight $ 9.28 $ 9.04 $ 8.07 + 3 +12
rapid growth of its deferred services, including FedExExpress Saver. This growth was augmented by incre-mental UPS strike-related volume, the majority of whichwas in the deferred service category. Excluding theeffects of a temporary 2% fuel surcharge and the expi-ration of the air cargo transportation tax on 1997yields, FedEx U.S. domestic yields rose 5% in 1998 asa result of continuing yield-management actions. Theseactions included pursuing price increases on low-yieldingaccounts, discontinuing unprofitable accounts, increas-ing average weight per package and implementing a 3%to 4% price increase targeted to list price and standarddiscount matrix customers for U.S. domestic shipmentseffective February 15, 1998.
The expiration of the air cargo transportation excise taxadded approximately $50 million to U.S. domestic rev-enues and 1% to U.S. domestic yields in both 1997 and1996. The tax expired on December 31, 1995, wasreenacted by Congress effective August 27, 1996, andexpired again on December 31, 1996. FedEx was notobligated to pay the tax during the periods in which itwas expired. The excise tax was reenacted by Congresseffective March 7, 1997, and, in August 1997, it wasextended for10 years through September 30, 2007.
FedEx’s IP service continued to experience double-digitgrowth in average daily volumes and revenues, withyields remaining relatively constant. Current year volumegrowth slowed to 15% year-over-year, primarily due toweakness in Asian markets.
In1998 and1997, FedEx’s international non-express air-freight revenues were a significant factor in determininginternational profitability. FedEx uses ATA airfreight ser-vice (a lower-priced, space-available service) to fill spaceon international flights not used by express services suchas IP or IXF. In 1998, weakness in Asian economies andcontinued downward pressure on yields resulted in lowernon-express airfreight prices and revenues than in1997. In 1997, airfreight revenues increased year-over-year, due to FedEx’s expansion in international markets,despite excess market capacity and downward pressureon yields.
The increases in FedEx’s other revenue in 1998 and1997 were primarily attributable to increased sales ofengine noise reduction kits.
RPS’s revenue per day increased 26% and 3% in 1998and 1997, respectively, primarily due to increased aver-age daily volume of 24% and 2% in these same years.Over the same periods, RPS’s yield remained stable,and effective February 9, 1998, management imple-mented a 3.7% rate increase at RPS.
On a daily basis, Viking’s revenue declined 61% year-over-year in 1998 and increased 15% in 1997. As aresult of Viking’s restructuring in March 1997, in whichoperations at four of five divisions were terminated byJune 1997, Viking’s daily shipments declined 60% year-over-year in 1998.
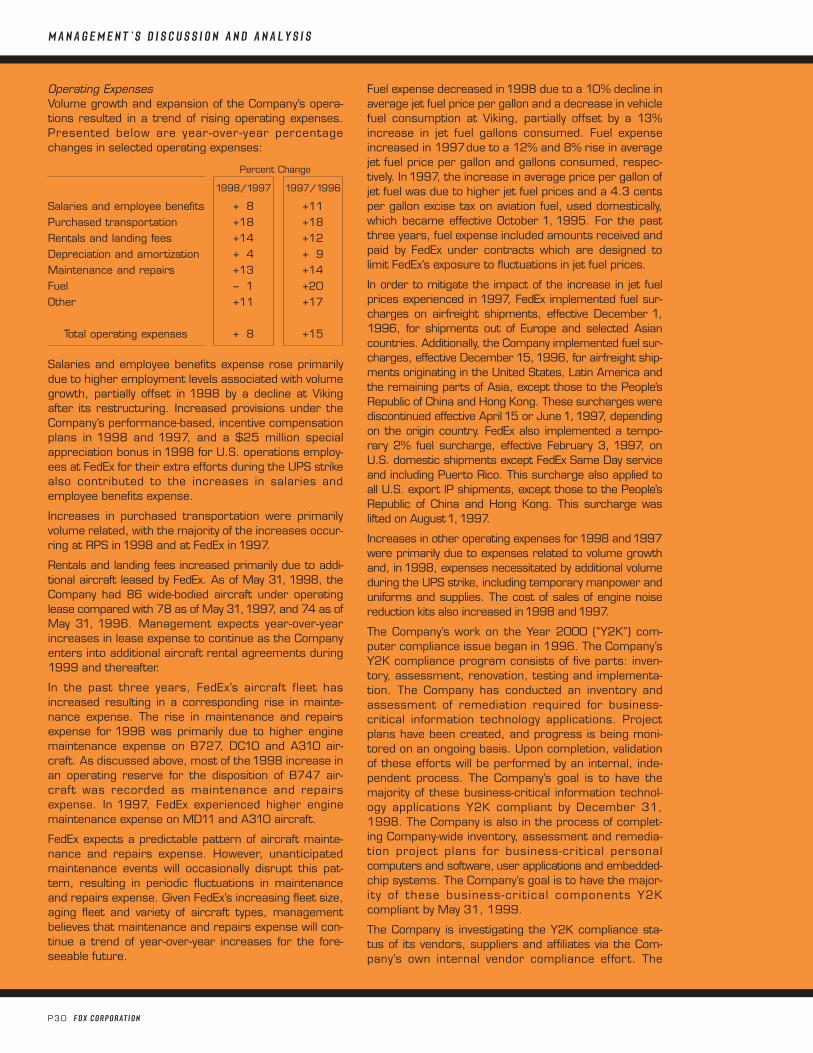
Operating ExpensesVolume growth and expansion of the Company’s opera-tions resulted in a trend of rising operating expenses.Presented below are year-over-year percentagechanges in selected operating expenses:
Percent Change
1998/1997 1997/1996
Salaries and employee benefits + 8 +11Purchased transportation +18 +18Rentals and landing fees +14 +12Depreciation and amortization + 4 + 9Maintenance and repairs +13 +14Fuel – 1 +20Other +11 +17
Total operating expenses + 8 +15
Salaries and employee benefits expense rose primarilydue to higher employment levels associated with volumegrowth, partially offset in 1998 by a decline at Vikingafter its restructuring. Increased provisions under theCompany’s performance-based, incentive compensationplans in 1998 and 1997, and a $25 million specialappreciation bonus in 1998 for U.S. operations employ-ees at FedEx for their extra efforts during the UPS strikealso contributed to the increases in salaries andemployee benefits expense.
Increases in purchased transportation were primarilyvolume related, with the majority of the increases occur-ring at RPS in1998 and at FedEx in 1997.
Rentals and landing fees increased primarily due to addi-tional aircraft leased by FedEx. As of May 31, 1998, theCompany had 86 wide-bodied aircraft under operatinglease compared with 78 as of May 31,1997, and 74 as ofMay 31, 1996. Management expects year-over-yearincreases in lease expense to continue as the Companyenters into additional aircraft rental agreements during1999 and thereafter.
In the past three years, FedEx’s aircraft fleet hasincreased resulting in a corresponding rise in mainte-nance expense. The rise in maintenance and repairsexpense for 1998 was primarily due to higher enginemaintenance expense on B727, DC10 and A310 air-craft. As discussed above, most of the1998 increase inan operating reserve for the disposition of B747 air-craft was recorded as maintenance and repairsexpense. In 1997, FedEx experienced higher enginemaintenance expense on MD11 and A310 aircraft.
FedEx expects a predictable pattern of aircraft mainte-nance and repairs expense. However, unanticipatedmaintenance events will occasionally disrupt this pat-tern, resulting in periodic fluctuations in maintenanceand repairs expense. Given FedEx’s increasing fleet size,aging fleet and variety of aircraft types, managementbelieves that maintenance and repairs expense will con-tinue a trend of year-over-year increases for the fore-seeable future.
Fuel expense decreased in1998 due to a 10% decline inaverage jet fuel price per gallon and a decrease in vehiclefuel consumption at Viking, partially offset by a 13%increase in jet fuel gallons consumed. Fuel expenseincreased in 1997due to a 12% and 8% rise in averagejet fuel price per gallon and gallons consumed, respec-tively. In1997, the increase in average price per gallon ofjet fuel was due to higher jet fuel prices and a 4.3 centsper gallon excise tax on aviation fuel, used domestically,which became effective October 1, 1995. For the pastthree years, fuel expense included amounts received andpaid by FedEx under contracts which are designed tolimit FedEx’s exposure to fluctuations in jet fuel prices.
In order to mitigate the impact of the increase in jet fuelprices experienced in 1997, FedEx implemented fuel sur-charges on airfreight shipments, effective December 1,1996, for shipments out of Europe and selected Asiancountries. Additionally, the Company implemented fuel sur-charges, effective December 15,1996, for airfreight ship-ments originating in the United States, Latin America andthe remaining parts of Asia, except those to the People’sRepublic of China and Hong Kong. These surcharges werediscontinued effective April 15 or June1,1997, dependingon the origin country. FedEx also implemented a tempo-rary 2% fuel surcharge, effective February 3, 1997, onU.S. domestic shipments except FedEx Same Day serviceand including Puerto Rico. This surcharge also applied toall U.S. export IP shipments, except those to the People’sRepublic of China and Hong Kong. This surcharge waslifted on August1,1997.
Increases in other operating expenses for1998 and1997were primarily due to expenses related to volume growthand, in 1998, expenses necessitated by additional volumeduring the UPS strike, including temporary manpower anduniforms and supplies. The cost of sales of engine noisereduction kits also increased in1998 and1997.
The Company’s work on the Year 2000 (“Y2K”) com-puter compliance issue began in 1996. The Company’sY2K compliance program consists of five parts: inven-tory, assessment, renovation, testing and implementa-tion. The Company has conducted an inventory andassessment of remediation required for business-critical information technology applications. Projectplans have been created, and progress is being moni-tored on an ongoing basis. Upon completion, validationof these efforts will be performed by an internal, inde-pendent process. The Company’s goal is to have themajority of these business-critical information technol-ogy applications Y2K compliant by December 31,1998. The Company is also in the process of complet-ing Company-wide inventory, assessment and remedia-tion project plans for business-critical personalcomputers and software, user applications and embedded-chip systems. The Company’s goal is to have the major-ity of these business-crit ical components Y2Kcompliant by May 31, 1999.
The Company is investigating the Y2K compliance sta-tus of its vendors, suppliers and affiliates via the Com-pany’s own internal vendor compliance effort. The
P30 FDX CORPORATION
M A N A G E M E N T ’ S D I S C U S S I O N A N D A N A L Y S I S
FDX CORPORATION P31
Company will carry out this task through a Company-wide effort, assisted by consultants, to address internalissues, and jointly with industry trade groups, toaddress issues related to third parties which are com-mon to transportation companies.
The Company has incurred approximately $50 million todate, including consulting fees, internal staff costs andother expenses. The Company expects to incur addi-tional expenses of approximately $100 million in thenext two years to be Y2K compliant.
While the Company believes it is taking all appropriatesteps to achieve Y2K compliance, its Y2K issues and anypotential future business interruptions, costs, damages orlosses related thereto, are dependent, to a significantdegree, upon the Y2K compliance of third parties, bothdomestic and international, such as government agencies,customers, vendors and suppliers. The Y2K problem ispervasive and complex, as virtually every computer opera-tion will be affected in some way. Consequently, no assur-ance can be given that Y2K compliance can be achievedwithout significant additional costs.
Operating IncomeThe Company’s consol idated operating incomeincreased 99% in 1998 and decreased 35% in 1997.Operating income for 1998 benefited from the effect ofthe UPS strike; whereas, operating income for 1997was reduced by the Viking asset impairment charge of$225 million.
FedEx’s consolidated operating income increased 20%and 12% in1998 and1997, respectively.
FedEx’s U.S. domestic operating income rose 35% and3% in 1998 and 1997, respectively. In 1998, operatingincome improved primarily due to increases in revenueper package (3.9%) exceeding increases in cost perpackage (2.9%) and due to a rise in average daily vol-ume (11%). Also, as noted above, 1998 U.S. domesticoperating results were significantly impacted by theUPS strike. Sales of engine noise reduction kits con-tributed $127 million, $87 million and $63 million toFedEx’s U.S. domestic operating income in1998,1997and 1996, respectively. In 1997, domestic operatingincome included a $15 million pre-tax benefit from thesettlement of a Tennessee personal property tax mat-ter. Increases in cost per package (1.4%) exceededincreases in revenue per package (0.8%), while aver-age daily volume rose 11%. U.S. domestic operatingmargins were 7.8%, 6.7% and 7.3% in 1998, 1997and 1996, respectively.
International operating income declined $57 million in1998, compared with a $59 million increase in 1997.International operating results declined in 1998 as aresult of slower growth of IP and IXF volumes during aperiod of international network expansion. Lower air-freight yields, higher salaries and employee benefits andaircraft lease expense, additional start-up costs for sev-eral new international flights and the net effect of foreigncurrency fluctuations negatively impacted internationalresults. The increase in operating income in 1997 was
attributable to strong growth in the Company’s IP volumesand airfreight pounds, partially offset by lower airfreightyields. International operating margins were 2.3%, 4.4%and 2.9% in1998,1997 and1996, respectively.
RPS reported operating income of $172 million, $136million and $174 million for 1998, 1997 and 1996,respectively. The increase in operating income for 1998resulted from package volume growth and the positiveeffect of the 12-day UPS strike. In 1997, despite a 4%increase in revenues, higher fixed costs of RPS’s contin-uing expansion and investment in technology and equip-ment contributed to the decline in operating results.Operating margins were 10.1%, 10.1% and 13.4% in1998, 1997 and1996, respectively.
Viking reported operating income of $28 million in1998, an operating loss of $362 million in1997 and anoperating loss of $40 million in 1996. As discussedabove, operating results for 1998 include a $16 milliongain on the sale of certain Viking assets, and results for1997 include a $225 million asset impairment charge.Operating margins were 7.3%, (37.5%) and (4.8%) in1998,1997 and1996, respectively.
For additional information on the Company’s businesssegments, see Note 12 of Notes to ConsolidatedFinancial Statements.
Other Income and Expense and Income TaxesNet interest expense increased 19% for 1998, primar-ily due to lower levels of capitalized interest at bothFedEx and Caliber. Interest is capitalized during themodification of certain MD11 and DC10 aircraft frompassenger to freighter configuration, among other pro-jects. For 1997, net interest expense increased 16%due to higher debt levels at Caliber and the loss ofinterest income from discontinued operations, partiallyoffset by lower effective interest rates at FedEx. Thelevel of capitalized interest in 1997 was comparable tothat of 1996.
Other, net for 1998 included a gain from an insurancesettlement for an MD11 aircraft destroyed in an acci-dent in July 1997. Other, net for 1997 included a $17million gain from an insurance settlement for a DC10aircraft destroyed by fire in September1996.
The Company’s effective tax rate was 44.6% in 1998,53.9% in 1997 and 43.0% in 1996. Excluding non-recurring items from the Caliber acquisition in 1998and the Viking restructuring in 1997, the effective ratewould have been 41.5% in 1998 and 43.0% in 1997and 1996. In each year, the effective tax rate (exclusiveof non-recurring items) was greater than the statutoryU.S. federal tax rate primarily because of state incometaxes and other factors as identified in Note 9 of Notesto Consolidated Financial Statements. For 1999,management expects the effective tax rate to remain at a level similar to the 1998 rate (exclusive of non-recurring items). The actual rate, however, is depen-dent on a number of factors, including the amount andsource of operating income.
P32 FDX CORPORATION
M A N A G E M E N T ’ S D I S C U S S I O N A N D A N A L Y S I S
OutlookManagement is committed to achieving long-term earn-ings growth by providing transportation, high value-added logistics and related information services throughfocused operating companies. This frequently involves asignificant front-end investment in assets, technologyand personnel that may reduce near-term profitability.
As discussed in Revenues above, a key reason for theincrease in FedEx’s U.S. domestic yield was the contin-ued yield-management actions of implementing priceincreases on low-yielding accounts, discontinuingunprofitable accounts, increasing average weight perpackage and implementing a 3% to 4% rate increase inFebruary 1998. Management believes yields will con-tinue to benefit from these actions in 1999, while pack-age volumes will grow at a lower rate in 1999 than inthe past several years. FedEx will continue to manageyields with the goal of ensuring an appropriate balancebetween revenues generated and the cost of providingexpress services. Actual results, however, may varydepending primarily on the impact of competitive pricingchanges, customer responses to yield-management ini-tiatives, changing customer demand patterns anddomestic economic conditions.
FedEx’s operating income from the sales of engine noisereduction kits peaked in1998 and is expected to decline$45 million year-over-year in 1999 and to becomeinsignificant by 2001. Actual results may differ depend-ing primarily on the impact of actions by FedEx’s com-petitors and regulatory conditions.
While FedEx’s long-term strategy for international opera-tions is to improve global connectivity for its customersby strategically expanding its worldwide network, inter-national economic developments, including the currentAsian economic difficulties, may limit short-term growthof FedEx’s international services and profits. Manage-ment expects, however, strategic expansion to allow forcontinued, long-term growth of these services.
Management expects IP average daily volume to con-tinue its strong growth in 1999, and IP yields to remainrelatively constant. With respect to airfreight, manage-ment believes volumes and yields will decline year-over-year in 1999. Actual results for IP or airfreight,however, will depend on international economic condi-tions, actions by FedEx’s competitors and regulatoryconditions for international aviation rights.
To boost customer confidence and RPS’s competitive position, RPS introduced a guaranteed ground offeringin July1998 for business-to-business shipments. Manage-ment expects RPS’s package volume to continue to grow,as projected facility expansions begin to address cur-rent capacity constraints. Yields will likely remain stable or increase slightly. Actual results, however, will dependprimarily on the impact of competitive pricing changes,actions by RPS’s competitors, changing customer demandpatterns and domestic economic conditions.
Viking’s strategy for 1999 is to maintain its market leader-ship in the western United States, improve yields and investin updated information systems and other technologies.
The Company will continue to invest in technologies thatimprove the efficiency of package pick-up, sorting, track-ing and delivery and that improve customer access andconnectivity. The Company will also continue projectsdesigned to enhance productivity and strengthen theCompany’s infrastructure. Assuming effective implemen-tation, these investments are expected to reduce trans-portation cost per package.
Effective June 1, 1998, the Company adopted a newaccounting standard which provides guidance onaccounting for the costs of software developed orobtained for internal use. This standard requires thatcertain of these costs be capitalized, and the Companyestimates the pre-tax benefit of the adoption to beapproximately $30 million for 1999.
FINANCIAL CONDITION
LiquidityCash and cash equivalents totaled $230 million atMay 31, 1998, an increase of $69 million during 1998compared with an increase of $33 million in 1997 and adecrease of $244 million in 1996. Cash provided fromoperations during 1998 was $1.7 billion compared with$1.1billion and $1.2 billion in1997 and1996, respectively.The Company currently has available a $1.0 billion revolv-ing bank credit facility that is generally used to finance tem-porary operating cash requirements and to providesupport for the issuance of commercial paper. Manage-ment believes that cash flow from operations, its commer-cial paper program and the revolving bank credit facility willadequately meet its working capital needs for the fore-seeable future.
Capital ResourcesThe Company’s operations are capital intensive, charac-terized by significant investments in aircraft, vehicles,computer and telecommunication equipment, packagehandling facilities and sort equipment. The amount andtiming of capital additions are dependent on various fac-tors including volume growth, domestic and interna-tional economic conditions, new or enhanced services,geographical expansion of services, competition andavailability of satisfactory financing.
Capital expenditures for 1998 totaled $1.9 billion andincluded three MD11 aircraft (which were subsequentlysold and leased back), four Airbus A310 aircraft, air-craft modifications, customer automation and computerequipment, facilities and vehicles and ground supportequipment. In comparison, prior year expenditurestotaled $1.8 billion and included ten Airbus A310 aircraft, two MD11 aircraft (which were subsequentlysold and leased back, one in 1997 and one in 1998),customer automation and computer equipment and
FDX CORPORATION P33
vehicles and ground support equipment. For informationon the Company’s purchase commitments, see Note14of Notes to Consolidated Financial Statements.
The Company has historically financed its capitalinvestments through the use of lease, debt and equityfinancing in addition to the use of internally generatedcash from operations. Generally, management’s prac-tice in recent years with respect to funding new wide-bodied aircraft acquisitions has been to finance suchaircraft through long-term lease transactions thatqualify as off-balance sheet operating leases underapplicable accounting rules. Management has deter-mined that these operating leases have provided eco-nomic benefits favorable to ownership with respect tomarket values, liquidity and after-tax cash flows. In thefuture, other forms of secured financing may be pur-sued to finance the Company’s aircraft acquisitionswhen management determines that it best meets theCompany’s needs. The Company has been successfulin obtaining investment capital, both domestic andinternational, for long-term leases on terms accept-able to it although the marketplace for such capitalcan become restricted depending on a variety of eco-nomic factors beyond the control of the Company. SeeNote 4 of Notes to Consolidated Financial Statementsfor additional information concerning the Company’sdebt and credit facilities.
In July1997, $20 million of Memphis-Shelby County AirportAuthority (“MSCAA”) Special Facilities Revenue Bonds wereissued. The proceeds of the bonds in combination withother funds were used to refund outstanding MSCAA1982B bonds on September 2, 1997. Also in July 1997,FedEx issued $250 million of unsecured senior notes with amaturity date of July1, 2097, under FedEx’s July1996 shelfregistration statement filed with the Securities andExchange Commission.
In June 1998, approximately $833 million of pass throughcertificates were issued under shelf registration state-ments filed with the Securities and Exchange Commissionto finance or refinance the debt portion of leveraged leasesrelated to eight Airbus A300 and five MD11 aircraft to bedelivered through the summer of 1999. The pass throughcertificates are not direct obligations of, or guaranteed by,the Company or FedEx, but amounts payable by FedExunder the leveraged leases are sufficient to pay the princi-pal of and interest on the certificates.
Management believes that the capital resources avail-able to the Company provide flexibility to access themost efficient markets for financing its capital acquisi-tions, including aircraft, and are adequate for the Com-pany’s future capital needs.
Market Risk Sensitive Instruments and PositionsThe Company currently has market risk sensitive instru-ments related to interest rates. As disclosed in Note 4 ofNotes to Consolidated Financial Statements, the Companyhas outstanding unsecured debt of $1.6 billion at May 31,1998, of which $1.4 billion is long-term. The Companydoes not have significant exposure to changing interest
rates on its long-term debt because the interest rates arefixed. Market risk for fixed-rate long-term debt is estimatedas the potential decrease in fair value resulting from ahypothetical 10% increase in interest rates and amountsto approximately $55 million as of May 31, 1998. Theunderlying fair values of the Company’s long-term debtwere estimated based on quoted market prices or onthe current rates offered for debt with similar termsand maturities. The Company does not use derivativefinancial instruments to manage interest rate risk.
The Company’s earnings are affected by fluctuations inthe value of the U.S. dollar as compared to foreign cur-rencies, as a result of transactions in foreign markets.At May 31, 1998, the result of a uniform 10% strength-ening in the value of the dollar relative to the currenciesin which the Company’s transactions are denominatedwould result in a decrease in operating income ofapproximately $15 million for the year ending May 31,1999. This calculation assumes that each exchangerate would change in the same direction relative to theU.S. dollar. In addition to the direct effects of changes inexchange rates, which are a changed dollar value of theresulting sales, changes in exchange rates also affectthe volume of sales or the foreign currency sales priceas competitors’ services become more or less attrac-tive. The Company’s sensitivity analysis of the effects ofchanges in foreign currency exchange rates does notfactor in a potential change in sales levels or local cur-rency prices.
In the past three years, FedEx has entered into con-tracts which are designed to limit its exposure to fluc-tuations in jet fuel prices. FedEx hedges its exposure to jet fuel price market risk only on a conservative, lim-ited basis. No such contracts were outstanding as ofMay 31, 1998. See Note 14 of Notes to ConsolidatedFinancial Statements for accounting policy and addi-tional information regarding jet fuel contracts.
The Company does not purchase or hold any derivativefinancial instruments for trading purposes.
Deferred Tax AssetsAt May 31, 1998, the Company had a net cumula-tive deferred tax liability of $41 million consisting of$601 million of deferred tax assets and $642 million ofdeferred tax liabilities. The reversals of deferred taxassets in future periods will be offset by similar amountsof deferred tax liabilities.
Statements in this “Management’s Discussion andAnalysis of Results of Operations and Financial Condi-tion” or made by management of the Company whichcontain more than historical information may be consid-ered forward-looking statements (as such term isdefined in the Private Securities Litigation Reform Act of1995) which are subject to risks and uncertainties.Actual results may differ materially from thoseexpressed in the forward-looking statements because ofimportant factors identified in this section.
P34 FDX CORPORATION
C O N S O L I D AT E D S T A T E M E N T S O F I N C O M E
Years ended May 31
In thousands,
except Earnings Per Share 1998 1997 1996
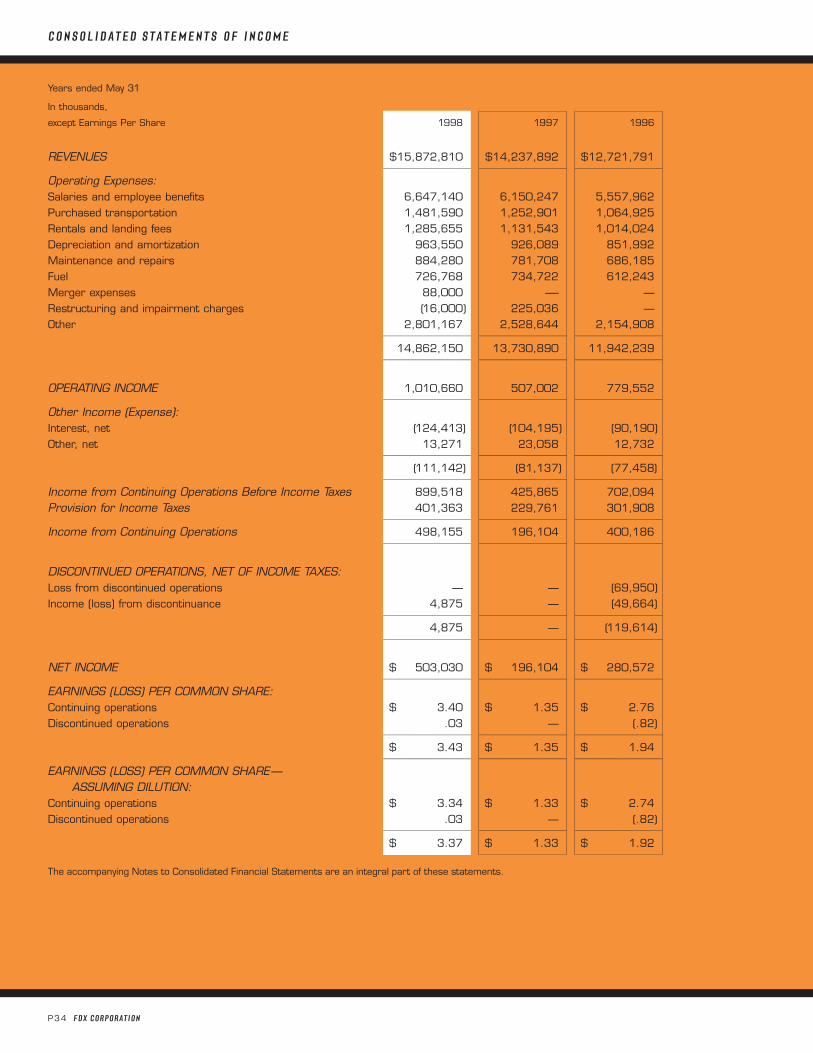
REVENUES $15,872,810 $14,237,892 $12,721,791pppppppppppppppppppppppppppppppppppppppppppppppppppppppppppppppppp pppppppppppppppppppppppppppppppppppppppppppppppppppppppppppppppppp pppppppppppppppppppppppppppppppppppppppppppppppppppppppppppppppppp
Operating Expenses:Salaries and employee benefits 6,647,140 6,150,247 5,557,962Purchased transportation 1,481,590 1,252,901 1,064,925Rentals and landing fees 1,285,655 1,131,543 1,014,024Depreciation and amortization 963,550 926,089 851,992Maintenance and repairs 884,280 781,708 686,185Fuel 726,768 734,722 612,243Merger expenses 88,000 —- —Restructuring and impairment charges (16,000) 225,036 —Other 2,801,167 2,528,644 2,154,908
pppppppppppppppppppppppppppppppppppppppppppppppppppppppppppppppppp pppppppppppppppppppppppppppppppppppppppppppppppppppppppppppppppppp pppppppppppppppppppppppppppppppppppppppppppppppppppppppppppppppppp
14,862,150 13,730,890 11,942,239pppppppppppppppppppppppppppppppppppppppppppppppppppppppppppppppppp pppppppppppppppppppppppppppppppppppppppppppppppppppppppppppppppppp pppppppppppppppppppppppppppppppppppppppppppppppppppppppppppppppppp
OPERATING INCOME 1,010,660 507,002 779,552pppppppppppppppppppppppppppppppppppppppppppppppppppppppppppppppppp pppppppppppppppppppppppppppppppppppppppppppppppppppppppppppppppppp pppppppppppppppppppppppppppppppppppppppppppppppppppppppppppppppppp
Other Income (Expense):Interest, net (124,413) (104,195) (90,190)Other, net 13,271 23,058 12,732
pppppppppppppppppppppppppppppppppppppppppppppppppppppppppppppppppp pppppppppppppppppppppppppppppppppppppppppppppppppppppppppppppppppp pppppppppppppppppppppppppppppppppppppppppppppppppppppppppppppppppp
(111,142) (81,137) (77,458)pppppppppppppppppppppppppppppppppppppppppppppppppppppppppppppppppp pppppppppppppppppppppppppppppppppppppppppppppppppppppppppppppppppp pppppppppppppppppppppppppppppppppppppppppppppppppppppppppppppppppp
Income from Continuing Operations Before Income Taxes 899,518 425,865 702,094Provision for Income Taxes 401,363 229,761 301,908
pppppppppppppppppppppppppppppppppppppppppppppppppppppppppppppppppp pppppppppppppppppppppppppppppppppppppppppppppppppppppppppppppppppp pppppppppppppppppppppppppppppppppppppppppppppppppppppppppppppppppp
Income from Continuing Operations 498,155 196,104 400,186pppppppppppppppppppppppppppppppppppppppppppppppppppppppppppppppppp pppppppppppppppppppppppppppppppppppppppppppppppppppppppppppppppppp pppppppppppppppppppppppppppppppppppppppppppppppppppppppppppppppppp
DISCONTINUED OPERATIONS, NET OF INCOME TAXES:Loss from discontinued operations — — (69,950)Income (loss) from discontinuance 4,875 — (49,664)
pppppppppppppppppppppppppppppppppppppppppppppppppppppppppppppppppp pppppppppppppppppppppppppppppppppppppppppppppppppppppppppppppppppp pppppppppppppppppppppppppppppppppppppppppppppppppppppppppppppppppp
4,875 — (119,614)pppppppppppppppppppppppppppppppppppppppppppppppppppppppppppppppppp pppppppppppppppppppppppppppppppppppppppppppppppppppppppppppppppppp pppppppppppppppppppppppppppppppppppppppppppppppppppppppppppppppppp
NET INCOME $ 503,030 $ 196,104 $ 280,572pppppppppppppppppppppppppppppppppppppppppppppppppppppppppppppppppp pppppppppppppppppppppppppppppppppppppppppppppppppppppppppppppppppp pppppppppppppppppppppppppppppppppppppppppppppppppppppppppppppppppp
EARNINGS (LOSS) PER COMMON SHARE:Continuing operations $ 3.40 $ 1.35 $ 2.76Discontinued operations .03 — (.82)
pppppppppppppppppppppppppppppppppppppppppppppppppppppppppppppppppp pppppppppppppppppppppppppppppppppppppppppppppppppppppppppppppppppp pppppppppppppppppppppppppppppppppppppppppppppppppppppppppppppppppp
$ 3.43 $ 1.35 $ 1.94pppppppppppppppppppppppppppppppppppppppppppppppppppppppppppppppppp pppppppppppppppppppppppppppppppppppppppppppppppppppppppppppppppppp pppppppppppppppppppppppppppppppppppppppppppppppppppppppppppppppppp
EARNINGS (LOSS) PER COMMON SHARE—ASSUMING DILUTION:
Continuing operations $ 3.34 $ 1.33 $ 2.74Discontinued operations .03 — (.82)
pppppppppppppppppppppppppppppppppppppppppppppppppppppppppppppppppp pppppppppppppppppppppppppppppppppppppppppppppppppppppppppppppppppp pppppppppppppppppppppppppppppppppppppppppppppppppppppppppppppppppp
$ 3.37 $ 1.33 $ 1.92
The accompanying Notes to Consolidated Financial Statements are an integral part of these statements.
FDX CORPORATION P35
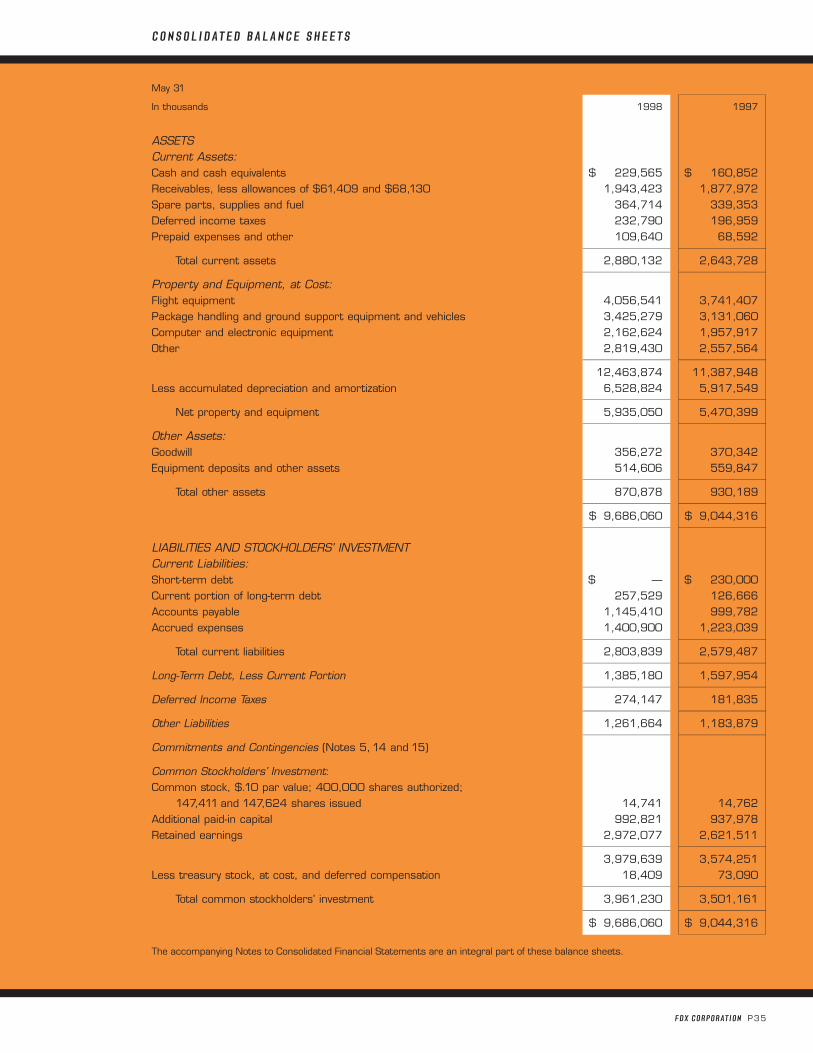
May 31
In thousands 1998 1997
ASSETSCurrent Assets:Cash and cash equivalents $ 229,565 $ 160,852Receivables, less allowances of $61,409 and $68,130 1,943,423 1,877,972Spare parts, supplies and fuel 364,714 339,353Deferred income taxes 232,790 196,959Prepaid expenses and other 109,640 68,592
pppppppppppppppppppppppppppppppppppppppppppppppppppppppppppppppppp pppppppppppppppppppppppppppppppppppppppppppppppppppppppppppppppppp
Total current assets 2,880,132 2,643,728pppppppppppppppppppppppppppppppppppppppppppppppppppppppppppppppppp pppppppppppppppppppppppppppppppppppppppppppppppppppppppppppppppppp
Property and Equipment, at Cost:Flight equipment 4,056,541 3,741,407Package handling and ground support equipment and vehicles 3,425,279 3,131,060Computer and electronic equipment 2,162,624 1,957,917Other 2,819,430 2,557,564
pppppppppppppppppppppppppppppppppppppppppppppppppppppppppppppppppp pppppppppppppppppppppppppppppppppppppppppppppppppppppppppppppppppp
12,463,874 11,387,948Less accumulated depreciation and amortization 6,528,824 5,917,549
pppppppppppppppppppppppppppppppppppppppppppppppppppppppppppppppppp pppppppppppppppppppppppppppppppppppppppppppppppppppppppppppppppppp
Net property and equipment 5,935,050 5,470,399pppppppppppppppppppppppppppppppppppppppppppppppppppppppppppppppppp pppppppppppppppppppppppppppppppppppppppppppppppppppppppppppppppppp
Other Assets:Goodwill 356,272 370,342Equipment deposits and other assets 514,606 559,847
pppppppppppppppppppppppppppppppppppppppppppppppppppppppppppppppppp pppppppppppppppppppppppppppppppppppppppppppppppppppppppppppppppppp
Total other assets 870,878 930,189pppppppppppppppppppppppppppppppppppppppppppppppppppppppppppppppppp pppppppppppppppppppppppppppppppppppppppppppppppppppppppppppppppppp
$ 9,686,060 $ 9,044,316pppppppppppppppppppppppppppppppppppppppppppppppppppppppppppppppppp pppppppppppppppppppppppppppppppppppppppppppppppppppppppppppppppppp
LIABILITIES AND STOCKHOLDERS’ INVESTMENTCurrent Liabilities:Short-term debt $ — $ 230,000Current portion of long-term debt 257,529 126,666Accounts payable 1,145,410 999,782Accrued expenses 1,400,900 1,223,039
pppppppppppppppppppppppppppppppppppppppppppppppppppppppppppppppppp pppppppppppppppppppppppppppppppppppppppppppppppppppppppppppppppppp
Total current liabilities 2,803,839 2,579,487pppppppppppppppppppppppppppppppppppppppppppppppppppppppppppppppppp pppppppppppppppppppppppppppppppppppppppppppppppppppppppppppppppppp
Long-Term Debt, Less Current Portion 1,385,180 1,597,954pppppppppppppppppppppppppppppppppppppppppppppppppppppppppppppppppp pppppppppppppppppppppppppppppppppppppppppppppppppppppppppppppppppp
Deferred Income Taxes 274,147 181,835pppppppppppppppppppppppppppppppppppppppppppppppppppppppppppppppppp pppppppppppppppppppppppppppppppppppppppppppppppppppppppppppppppppp
Other Liabilities 1,261,664 1,183,879pppppppppppppppppppppppppppppppppppppppppppppppppppppppppppppppppp pppppppppppppppppppppppppppppppppppppppppppppppppppppppppppppppppp
Commitments and Contingencies (Notes 5, 14 and 15)
Common Stockholders’ Investment:Common stock, $.10 par value; 400,000 shares authorized;
147,411 and 147,624 shares issued 14,741 14,762Additional paid-in capital 992,821 937,978Retained earnings 2,972,077 2,621,511
pppppppppppppppppppppppppppppppppppppppppppppppppppppppppppppppppp pppppppppppppppppppppppppppppppppppppppppppppppppppppppppppppppppp
3,979,639 3,574,251Less treasury stock, at cost, and deferred compensation 18,409 73,090
pppppppppppppppppppppppppppppppppppppppppppppppppppppppppppppppppp pppppppppppppppppppppppppppppppppppppppppppppppppppppppppppppppppp
Total common stockholders’ investment 3,961,230 3,501,161pppppppppppppppppppppppppppppppppppppppppppppppppppppppppppppppppp pppppppppppppppppppppppppppppppppppppppppppppppppppppppppppppppppp
$ 9,686,060 $ 9,044,316
The accompanying Notes to Consolidated Financial Statements are an integral part of these balance sheets.
C O N S O L I D AT E D B A L A N C E S H E E T S
P36 FDX CORPORATION
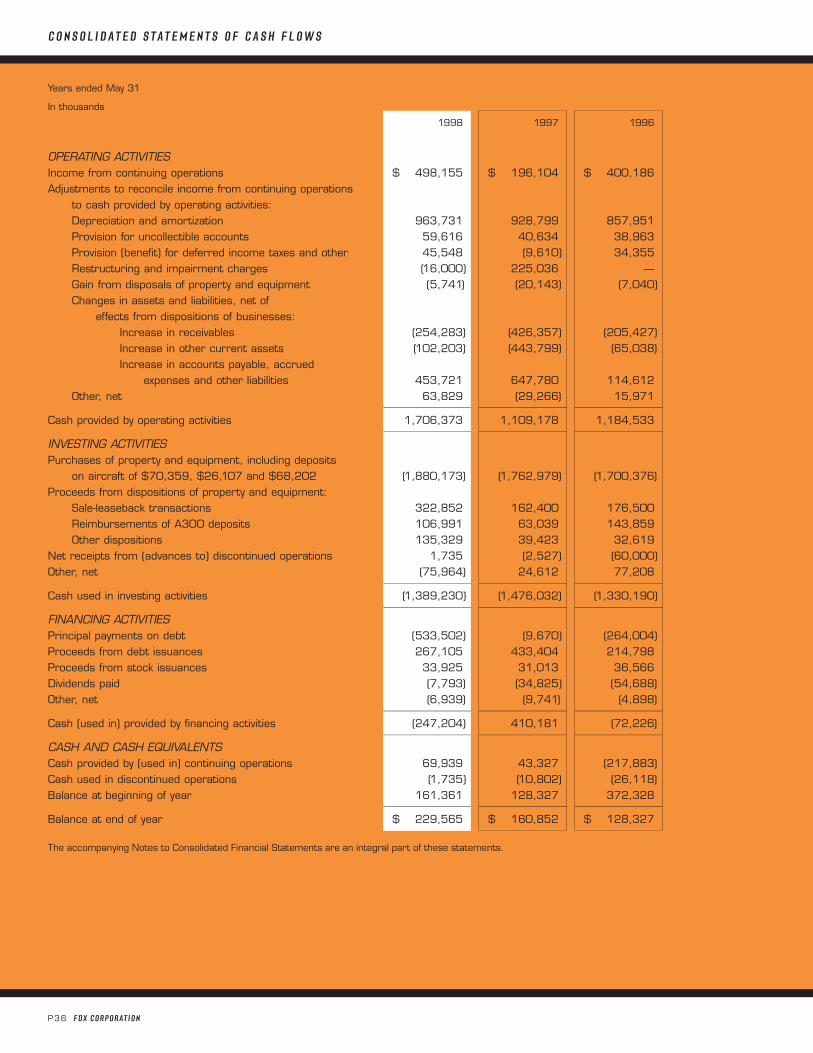
Years ended May 31
In thousands
1998 1997 1996
OPERATING ACTIVITIESIncome from continuing operations $ 498,155 $ 196,104 $ 400,186 Adjustments to reconcile income from continuing operations
to cash provided by operating activities:Depreciation and amortization 963,731 928,799 857,951 Provision for uncollectible accounts 59,616 40,634 38,963 Provision (benefit) for deferred income taxes and other 45,548 (9,610) 34,355 Restructuring and impairment charges (16,000) 225,036 —Gain from disposals of property and equipment (5,741) (20,143) (7,040)Changes in assets and liabilities, net of
effects from dispositions of businesses:Increase in receivables (254,283) (426,357) (205,427)Increase in other current assets (102,203) (443,799) (65,038)Increase in accounts payable, accrued
expenses and other liabilities 453,721 647,780 114,612 Other, net 63,829 (29,266) 15,971
pppppppppppppppppppppppppppppppppppppppppppppppppppppppppppppppppp pppppppppppppppppppppppppppppppppppppppppppppppppppppppppppppppppp pppppppppppppppppppppppppppppppppppppppppppppppppppppppppppppppppp
Cash provided by operating activities 1,706,373 1,109,178 1,184,533 pppppppppppppppppppppppppppppppppppppppppppppppppppppppppppppppppp pppppppppppppppppppppppppppppppppppppppppppppppppppppppppppppppppp pppppppppppppppppppppppppppppppppppppppppppppppppppppppppppppppppp
INVESTING ACTIVITIESPurchases of property and equipment, including deposits
on aircraft of $70,359, $26,107 and $68,202 (1,880,173) (1,762,979) (1,700,376)Proceeds from dispositions of property and equipment:
Sale-leaseback transactions 322,852 162,400 176,500 Reimbursements of A300 deposits 106,991 63,039 143,859 Other dispositions 135,329 39,423 32,619
Net receipts from (advances to) discontinued operations 1,735 (2,527) (60,000)Other, net (75,964) 24,612 77,208
pppppppppppppppppppppppppppppppppppppppppppppppppppppppppppppppppp pppppppppppppppppppppppppppppppppppppppppppppppppppppppppppppppppp pppppppppppppppppppppppppppppppppppppppppppppppppppppppppppppppppp
Cash used in investing activities (1,389,230) (1,476,032) (1,330,190)pppppppppppppppppppppppppppppppppppppppppppppppppppppppppppppppppp pppppppppppppppppppppppppppppppppppppppppppppppppppppppppppppppppp pppppppppppppppppppppppppppppppppppppppppppppppppppppppppppppppppp
FINANCING ACTIVITIESPrincipal payments on debt (533,502) (9,670) (264,004)Proceeds from debt issuances 267,105 433,404 214,798 Proceeds from stock issuances 33,925 31,013 36,566 Dividends paid (7,793) (34,825) (54,688)Other, net (6,939) (9,741) (4,898)
pppppppppppppppppppppppppppppppppppppppppppppppppppppppppppppppppp pppppppppppppppppppppppppppppppppppppppppppppppppppppppppppppppppp pppppppppppppppppppppppppppppppppppppppppppppppppppppppppppppppppp
Cash (used in) provided by financing activities (247,204) 410,181 (72,226)pppppppppppppppppppppppppppppppppppppppppppppppppppppppppppppppppp pppppppppppppppppppppppppppppppppppppppppppppppppppppppppppppppppp pppppppppppppppppppppppppppppppppppppppppppppppppppppppppppppppppp
CASH AND CASH EQUIVALENTSCash provided by (used in) continuing operations 69,939 43,327 (217,883)Cash used in discontinued operations (1,735) (10,802) (26,118)Balance at beginning of year 161,361 128,327 372,328
pppppppppppppppppppppppppppppppppppppppppppppppppppppppppppppppppp pppppppppppppppppppppppppppppppppppppppppppppppppppppppppppppppppp pppppppppppppppppppppppppppppppppppppppppppppppppppppppppppppppppp
Balance at end of year $ 229,565 $ 160,852 $ 128,327
The accompanying Notes to Consolidated Financial Statements are an integral part of these statements.
C O N S O L I D AT E D S T A T E M E N T S O F C A S H F L O W S
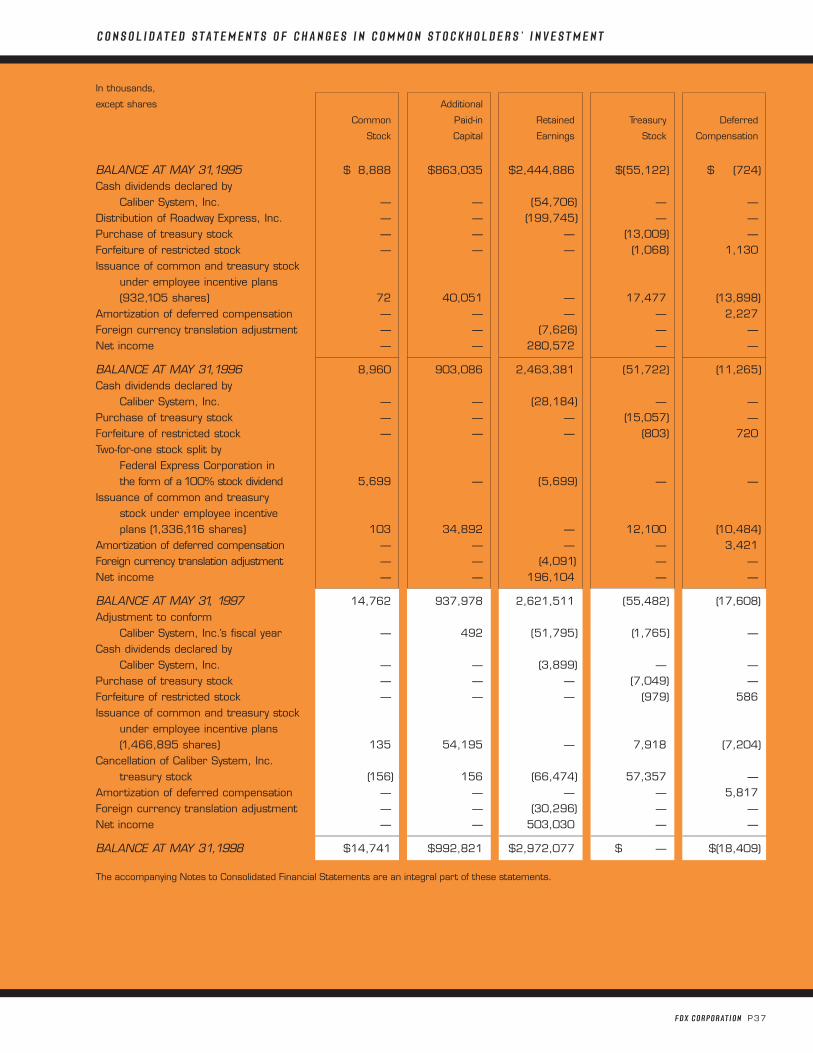
In thousands,
except shares Additional
Common Paid-in Retained Treasury Deferred
Stock Capital Earnings Stock Compensation
BALANCE AT MAY 31,1995 $ 8,888 $863,035 $2,444,886 $(55,122) $ (724)Cash dividends declared by
Caliber System, Inc. — — (54,706) — —Distribution of Roadway Express, Inc. — — (199,745) — —Purchase of treasury stock — — — (13,009) —Forfeiture of restricted stock — — — (1,068) 1,130Issuance of common and treasury stock
under employee incentive plans (932,105 shares) 72 40,051 — 17,477 (13,898)
Amortization of deferred compensation — — — — 2,227Foreign currency translation adjustment — — (7,626) — —Net income — — 280,572 — —
ppppppppppppppppppppppppppppppppppppppppppppppppppppppppppppppp ppppppppppppppppppppppppppppppppppppppppppppppppppppppppppppppp ppppppppppppppppppppppppppppppppppppppppppppppppppppppppppppppp ppppppppppppppppppppppppppppppppppppppppppppppppppppppppppppppp ppppppppppppppppppppppppppppppppppppppppppppppppppppppppppppppp
BALANCE AT MAY 31,1996 8,960 903,086 2,463,381 (51,722) (11,265)Cash dividends declared by
Caliber System, Inc. — — (28,184) — —Purchase of treasury stock — — — (15,057) —Forfeiture of restricted stock — — — (803) 720Two-for-one stock split by
Federal Express Corporation in the form of a 100% stock dividend 5,699 — (5,699) — —
Issuance of common and treasury stock under employee incentive plans (1,336,116 shares) 103 34,892 — 12,100 (10,484)
Amortization of deferred compensation — — — — 3,421 Foreign currency translation adjustment — — (4,091) — — Net income — — 196,104 — —
BALANCE AT MAY 31, 1997 14,762 937,978 2,621,511 (55,482) (17,608)Adjustment to conform
Caliber System, Inc.’s fiscal year — 492 (51,795) (1,765) —Cash dividends declared by
Caliber System, Inc. — — (3,899) — —Purchase of treasury stock — — — (7,049) —Forfeiture of restricted stock — — — (979) 586Issuance of common and treasury stock
under employee incentive plans(1,466,895 shares) 135 54,195 — 7,918 (7,204)
Cancellation of Caliber System, Inc.treasury stock (156) 156 (66,474) 57,357 —
Amortization of deferred compensation — — — — 5,817Foreign currency translation adjustment — — (30,296) — —Net income — — 503,030 — —
ppppppppppppppppppppppppppppppppppppppppppppppppppppppppppppppp ppppppppppppppppppppppppppppppppppppppppppppppppppppppppppppppp ppppppppppppppppppppppppppppppppppppppppppppppppppppppppppppppp ppppppppppppppppppppppppppppppppppppppppppppppppppppppppppppppp ppppppppppppppppppppppppppppppppppppppppppppppppppppppppppppppp
BALANCE AT MAY 31,1998 $14,741 $992,821 $2,972,077 $ — $(18,409)
The accompanying Notes to Consolidated Financial Statements are an integral part of these statements.
FDX CORPORATION P37
C O N S O L I D AT E D S T A T E M E N T S O F C H A N G E S I N C O M M O N S T O C K H O L D E R S ’ I N V E S T M E N T
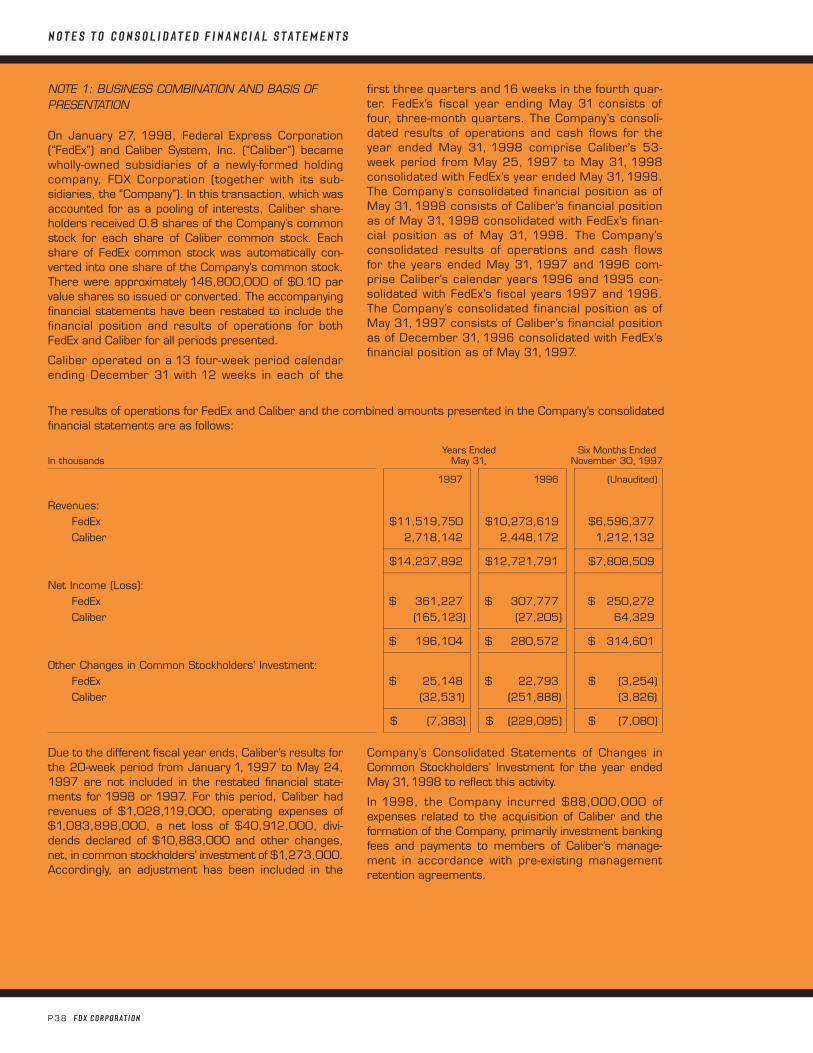
The results of operations for FedEx and Caliber and the combined amounts presented in the Company’s consolidatedfinancial statements are as follows:
Years Ended Six Months Ended In thousands May 31, November 30, 1997
1997 1996 (Unaudited)
Revenues:FedEx $11,519,750 $10,273,619 $6,596,377Caliber 2,718,142 2,448,172 1,212,132
pppppppppppppppppppppppppppppppppppppppppppppppppppppppppppppppppp pppppppppppppppppppppppppppppppppppppppppppppppppppppppppppppppppp pppppppppppppppppppppppppppppppppppppppppppppppppppppppppppppppppp
$14,237,892 $12,721,791 $7,808,509pppppppppppppppppppppppppppppppppppppppppppppppppppppppppppppppppp pppppppppppppppppppppppppppppppppppppppppppppppppppppppppppppppppp pppppppppppppppppppppppppppppppppppppppppppppppppppppppppppppppppp
Net Income (Loss):FedEx $ 361,227 $ 307,777 $ 250,272Caliber (165,123) (27,205) 64,329
pppppppppppppppppppppppppppppppppppppppppppppppppppppppppppppppppp pppppppppppppppppppppppppppppppppppppppppppppppppppppppppppppppppp pppppppppppppppppppppppppppppppppppppppppppppppppppppppppppppppppp
$ 196,104 $ 280,572 $ 314,601pppppppppppppppppppppppppppppppppppppppppppppppppppppppppppppppppp pppppppppppppppppppppppppppppppppppppppppppppppppppppppppppppppppp pppppppppppppppppppppppppppppppppppppppppppppppppppppppppppppppppp
Other Changes in Common Stockholders’ Investment:FedEx $ 25,148 $ 22,793 $ (3,254)Caliber (32,531) (251,888) (3,826)
pppppppppppppppppppppppppppppppppppppppppppppppppppppppppppppppppp pppppppppppppppppppppppppppppppppppppppppppppppppppppppppppppppppp pppppppppppppppppppppppppppppppppppppppppppppppppppppppppppppppppp
$ (7,383) $ (229,095) $ (7,080)
P38 FDX CORPORATION
Due to the different fiscal year ends, Caliber’s results forthe 20-week period from January 1, 1997 to May 24,1997 are not included in the restated financial state-ments for 1998 or 1997. For this period, Caliber hadrevenues of $1,028,119,000, operating expenses of$1,083,898,000, a net loss of $40,912,000, divi-dends declared of $10,883,000 and other changes,net, in common stockholders’ investment of $1,273,000.Accordingly, an adjustment has been included in the
Company’s Consolidated Statements of Changes inCommon Stockholders’ Investment for the year endedMay 31,1998 to reflect this activity.
In 1998, the Company incurred $88,000,000 ofexpenses related to the acquisition of Caliber and theformation of the Company, primarily investment bankingfees and payments to members of Caliber’s manage-ment in accordance with pre-existing managementretention agreements.
N O T E S T O C O N S O L I D AT E D F I N A N C I A L S T A T E M E N T S
NOTE 1: BUSINESS COMBINATION AND BASIS OFPRESENTATION
On January 27, 1998, Federal Express Corporation(“FedEx”) and Caliber System, Inc. (“Caliber”) becamewholly-owned subsidiaries of a newly-formed holdingcompany, FDX Corporation (together with its sub-sidiaries, the “Company”). In this transaction, which wasaccounted for as a pooling of interests, Caliber share-holders received 0.8 shares of the Company’s commonstock for each share of Caliber common stock. Eachshare of FedEx common stock was automatically con-verted into one share of the Company’s common stock.There were approximately 146,800,000 of $0.10 parvalue shares so issued or converted. The accompanyingfinancial statements have been restated to include thefinancial position and results of operations for bothFedEx and Caliber for all periods presented.
Caliber operated on a 13 four-week period calendarending December 31 with 12 weeks in each of the
first three quarters and 16 weeks in the fourth quar-ter. FedEx’s fiscal year ending May 31 consists offour, three-month quarters. The Company’s consoli-dated results of operations and cash flows for theyear ended May 31, 1998 comprise Caliber’s 53-week period from May 25, 1997 to May 31, 1998consolidated with FedEx’s year ended May 31,1998.The Company’s consolidated financial position as ofMay 31, 1998 consists of Caliber’s financial positionas of May 31, 1998 consolidated with FedEx’s finan-cial position as of May 31, 1998. The Company’sconsolidated results of operations and cash flowsfor the years ended May 31, 1997 and 1996 com-prise Caliber’s calendar years 1996 and 1995 con-solidated with FedEx’s fiscal years 1997 and 1996.The Company’s consolidated financial position as ofMay 31, 1997 consists of Caliber’s financial positionas of December 31, 1996 consolidated with FedEx’sfinancial position as of May 31, 1997.
FDX CORPORATION P39
NOTE 2: SUMMARY OF SIGNIFICANT ACCOUNTINGPOLICIES
Principles of consolidation. The consolidated financialstatements include the accounts of FDX Corporationand its subsidiaries. All significant intercompanyaccounts and transactions have been eliminated.
Property and equipment. Expenditures for major addi-tions, improvements, flight equipment modifications,and certain overhaul costs are capitalized. Maintenanceand repairs are charged to expense as incurred, exceptfor B747 airframe and engine overhaul maintenancewhich is accrued and charged to expense on the basisof hours flown. The cost and accumulated depreciationof property and equipment disposed of are removedfrom the related accounts, and any gain or loss isreflected in the results of operations.
For financial reporting purposes, depreciation andamortization of property and equipment is provided on astraight-line basis over the asset’s service life or relatedlease term as follows:
Flight equipment 5 to 20 yearsPackage handling and ground
support equipment and vehicles 5 to 30 yearsComputer and electronic equipment 3 to 10 yearsOther 2 to 30 years
Aircraft airframes and engines are assigned residualvalues ranging from10% to 20% of asset cost. All otherproperty and equipment have no assigned residual val-ues. Vehicles are depreciated on a straight-line basisover 5 to10 years.
For income tax purposes, depreciation is generally com-puted using accelerated methods.
Deferred gains. Gains on the sale and leaseback of air-craft and other property and equipment are deferredand amortized over the life of the lease as a reduction ofrent expense. Included in other liabilities at May 31,1998 and1997, were deferred gains of $338,119,000and $340,166,000, respectively.
Deferred lease obligations. While certain of the Com-pany’s aircraft and facility leases contain fluctuating orescalating payments, the related rent expense isrecorded on a straight-line basis over the lease term.Included in other liabilities at May 31, 1998 and 1997,were $324,203,000 and $289,822,000, respec-tively, representing the cumulative difference betweenrent expense and rent payments.
Self-insurance reserves. The Company is self-insured upto certain levels for workers’ compensation, employeehealth care and vehicle liabilities. Reserves are basedon the actuarially estimated cost of claims. Included inother liabilities at May 31, 1998 and 1997, were$277,696,000 and $275,663,000, respectively, rep-resenting the long-term portion of self-insurancereserves for the Company’s workers’ compensation andvehicle liabilities.
Capitalized interest. Interest on funds used to financethe acquisition and modification of aircraft and construc-tion of certain facilities up to the date the asset isplaced in service is capitalized and included in the costof the asset. Capitalized interest was $33,009,000,$45,717,000 and $44,624,000 for 1998, 1997 and1996, respectively.
Advertising. Advertising costs are generally expensed asincurred and are included in other operating expenses.Advertising expenses were $183,253,000,$162,337,000 and $145,592,000 for 1998,1997 and1996, respectively.
Cash equivalents. Cash equivalents are cash in excessof current operating requirements invested in short-term, interest-bearing instruments with maturities ofthree months or less at the date of purchase and arestated at cost, which approximates market value. Inter-est income was $11,283,000, $5,885,000 and$19,059,000 in1998, 1997 and1996, respectively.
Spare parts, supplies and fuel. Spare parts are statedprincipally at weighted-average cost; supplies and fuel arestated principally at standard cost which approximatesactual cost on a first-in, first-out basis. Neither methodvalues inventory in excess of current replacement cost.
Goodwill. Goodwill is the excess of the purchase priceover the fair value of net assets of businesses acquired.It is amortized on a straight-line basis over periods rang-ing up to 40 years. Accumulated amortization was$144,580,000 and $131,927,000 at May 31, 1998and 1997, respectively.
Foreign currency translation. Translation gains andlosses of the Company’s foreign operations that uselocal currencies as the functional currency are accumu-lated and reported, net of related deferred incometaxes, as a component of common stockholders’ invest-ment. Transaction gains and losses that arise fromexchange rate fluctuations on transactions denominatedin a currency other than the local functional currencyare included in the results of operations.
Income taxes. Deferred income taxes are provided forthe tax effect of temporary differences between the taxbasis of assets and liabilities and their reportedamounts in the financial statements. The Company usesthe liability method to account for income taxes, whichrequires deferred taxes to be recorded at the statutoryrate expected to be in effect when the taxes are paid.
The Company has not provided for U.S. federal incometaxes on its foreign subsidiaries’ earnings deemed to bepermanently reinvested. Quantification of the deferredtax liability, if any, associated with permanently rein-vested earnings is not practicable.
Revenue recognition. Revenue is generally recognizedupon delivery of shipments. For shipments in transit,revenue is recorded based on the percentage of serv-ice completed.
Earnings per share. In accordance with the provisionsof Statement of Financial Accounting Standards
P40 FDX CORPORATION
NOTE 3: ACCRUED EXPENSES
May 31
In thousands 1998 1997
Insurance $ 292,173 $ 266,397Compensated absences 278,550 260,724Employee benefits 190,056 145,556Taxes other than income taxes 188,464 159,180Salaries 143,876 126,030Aircraft overhaul 73,643 84,006Other 234,138 181,146
pppppppppppppppppppppppppppppppppppppppppppppppppppppppppppp pppppppppppppppppppppppppppppppppppppppppppppppppppppppppppp
$1,400,900 $1,223,039
N O T E S T O C O N S O L I D AT E D F I N A N C I A L S T A T E M E N T S
No. 128, “Earnings Per Share,” basic earnings pershare is computed by dividing net income by the numberof weighted-average common shares outstanding duringthe year. Diluted earnings per share is computed bydividing net income by the number of weighted-averagecommon and common equivalent shares outstandingduring the year (See Note 8).
Recent pronouncements. In 1999, the Company willadopt the provisions of three Statements of FinancialAccounting Standards (“SFAS”) recently issued by theFinancial Accounting Standards Board. SFAS No. 130,“Reporting Comprehensive Income,” establishes stan-dards for displaying comprehensive income and its components in a full set of general purpose financialstatements. SFAS No. 131, “Disclosures about Seg-ments of an Enterprise and Related Information,” estab-lishes standards for reporting information aboutoperating segments in annual financial statements andrequires reporting selected information about operatingsegments in interim financial reports issued to share-holders. SFAS No. 132, “Employers’ Disclosures aboutPensions and Other Postretirement Benefits,” standard-izes the disclosures for pensions and other postretire-ment benefits to the extent practicable, requiresadditional information on changes in the benefit obliga-tions and fair values of plan assets that will facilitatefinancial analysis and eliminates other disclosures nolonger useful as prescribed in previous standards.
SFAS Nos.130, 131 and 132 only affect financial disclo-sures in interim and annual reports; therefore, theadoption of these accounting standards will not have animpact on the Company’s financial condition or resultsof operations.
Effective June1,1998, the Company adopted Statementof Position (“SOP”) 98-1, “Accounting for the Cost ofComputer Software Developed or Obtained for InternalUse,” released by the American Institute of CertifiedPublic Accountants in March 1998. SOP 98-1 providesguidance on accounting for these costs and requiresthat certain related expenses be capitalized. The Com-pany estimates the pre-tax benefit of the adoption ofthis Statement to be approximately $30,000,000 in1999.
Reclassifications. Certain prior year amounts have beenreclassified to conform to the1998 presentation.
Use of estimates. The preparation of the consolidatedfinancial statements in conformity with generallyaccepted accounting principles requires management tomake estimates and assumptions that affect thereported amounts of assets and liabilities and disclosureof contingent assets and liabilities at the date of thefinancial statements and the reported amounts of rev-enues and expenses during the reporting period. Actualresults could differ from those estimates.
NOTE 4: LONG-TERM DEBT
May 31
In thousands 1998 1997
Unsecured notes payable, interest rates of 7.60% to 10.57%, due through 2098 $1,253,770 $1,128,525
pppppppppppppppppppppppppppppppppppppppppppppppppppppppppppp pppppppppppppppppppppppppppppppppppppppppppppppppppppppppppp
Unsecured sinking fund debentures, interest rate of 9.63%, due through 2020 98,529 98,461
pppppppppppppppppppppppppppppppppppppppppppppppppppppppppppp pppppppppppppppppppppppppppppppppppppppppppppppppppppppppppp
Commercial paper — 200,904pppppppppppppppppppppppppppppppppppppppppppppppppppppppppppp pppppppppppppppppppppppppppppppppppppppppppppppppppppppppppp
Capital lease obligations and tax exempt bonds, due through 2017, interest rates of 5.35% to 7.88% 253,425 255,100
Less bond reserves 9,024 11,096pppppppppppppppppppppppppppppppppppppppppppppppppppppppppppp pppppppppppppppppppppppppppppppppppppppppppppppppppppppppppp
244,401 244,004pppppppppppppppppppppppppppppppppppppppppppppppppppppppppppp pppppppppppppppppppppppppppppppppppppppppppppppppppppppppppp
Other debt, interest rates of 9.68% to 9.98% 46,009 52,726pppppppppppppppppppppppppppppppppppppppppppppppppppppppppppp pppppppppppppppppppppppppppppppppppppppppppppppppppppppppppp
1,642,709 1,724,620Less current portion 257,529 126,666
pppppppppppppppppppppppppppppppppppppppppppppppppppppppppppp pppppppppppppppppppppppppppppppppppppppppppppppppppppppppppp
$1,385,180 $1,597,954
FDX CORPORATION P41
The Company has a revolving credit agreement withdomestic and foreign banks that provides for a totalcommitment of $1,000,000,000, all of which wasavailable at May 31,1998. This agreement is composedof two parts. The first part provides for a commitmentof $800,000,000 through January 15, 2003. The sec-ond part provides for a commitment of $200,000,000through January 14,1999. Interest rates on borrowingsunder this agreement are generally determined by maturi-ties selected and prevailing market conditions. The agree-ment contains certain covenants and restrictions, none ofwhich are expected to significantly affect operations or theability to pay dividends. As of May 31,1998, approximately$1,066,000,000 was available for the payment of divi-dends under the restrictive covenant of the agreement.Commercial paper borrowings are backed by unused com-mitments under the revolving credit agreement andreduce the amount available under the agreement. Bor-rowings under this credit agreement and commercialpaper borrowings are classified as long-term based on theCompany’s ability and intent to refinance such borrowings.
Tax exempt bonds were issued by the Memphis-ShelbyCounty Airport Authority (“MSCAA”) and the City of Indi-anapolis. A lease agreement with the MSCAA and a loanagreement with the City of Indianapolis covering the facil-ities and equipment financed with the bond proceedsobligate FedEx to pay rentals and loan payments, respec-tively, equal to principal and interest due on the bonds.
Caliber has issued $200,000,000 of unsecured noteswhich is included in long-term debt. The notes matureon August 1, 2006 and bear interest at 7.80%. Thenotes contain restrictive covenants limiting the ability ofCaliber and its subsidiaries to incur liens on assets andenter into certain leasing transactions.
In July 1997, the MSCAA issued $20,105,000 of5.35% Special Facilities Revenue Bonds. The proceedsof the bonds in combination with other funds were usedto refund outstanding MSCAA 1982B 8.3% bonds onSeptember 2, 1997. The 1997 bonds have a maturitydate of September 1, 2012. FedEx is obligated under alease agreement with MSCAA to pay rentals equal tothe principal and interest on the bonds.
In July 1997, FedEx issued $250,000,000 of 7.6%unsecured senior notes due July 1, 2097, under its July1996 shelf registration statement filed with the Securi-ties and Exchange Commission.
Scheduled annual principal maturities of long-term debtfor the five years subsequent to May 31, 1998, are asfollows: $257,500,000 in 1999; $14,900,000 in2000; $11,300,000 in 2001; $206,900,000 in2002; and $10,900,000 in 2003.
The Company’s long-term debt, exclusive of capitalleases, had carrying values of $1,446,000,000 and$1,322,000,000 at May 31, 1998 and 1997, respec-tively, compared with fair values of approximately$1,597,000,000 and $1,423,000,000 at thosedates. The estimated fair values were determined basedon quoted market prices or on current rates offered fordebt with similar terms and maturities.
NOTE 5: LEASE COMMITMENTS
The Company utilizes certain aircraft, land, facilities andequipment under capital and operating leases whichexpire at various dates through 2025. In addition, sup-plemental aircraft are leased under agreements whichgenerally provide for cancellation upon 30 days’ notice.
Property and equipment recorded under capital leases at May 31 was as follows:
In thousands
1998 1997
Package handling and ground support equipment and vehicles $261,985 $274,017Facilities 134,442 134,442Computer and electronic equipment and other 6,518 6,520
pppppppppppppppppppppppppppppppppppppppppppppppppppppppppppp pppppppppppppppppppppppppppppppppppppppppppppppppppppppppppp
402,945 414,979Less accumulated amortization 274,494 277,406
pppppppppppppppppppppppppppppppppppppppppppppppppppppppppppp pppppppppppppppppppppppppppppppppppppppppppppppppppppppppppp
$128,451 $137,573
Rent expense under operating leases for the years ended May 31 was as follows:
In thousands
1998 1997 1996
Minimum rentals $1,135,567 $ 986,758 $866,865Contingent rentals 60,925 57,806 61,164
pppppppppppppppppppppppppppppppppppppppppppppppppppppppppppp pppppppppppppppppppppppppppppppppppppppppppppppppppppppppppp pppppppppppppppppppppppppppppppppppppppppppppppppppppppppppp
$1,196,492 $1,044,564 $928,029
Contingent rentals are based on mileage under supplemental aircraft leases.
A summary of future minimum lease payments under capital leases and non-cancellable operating leases (principally air-craft and facilities) with an initial or remaining term in excess of one year at May 31, 1998 follows:
In thousands
Capital Leases Operating Leases
1999 $ 15,023 $ 960,4622000 15,023 918,1932001 15,023 843,3522002 15,023 778,0162003 15,023 716,559Thereafter 317,397 8,225,590
pppppppppppppppppppppppppppppppppppppppppppppppppppppppppppppppppp pppppppppppppppppppppppppppppppppppppppppppppppppppppppppppppppppp
$392,512 $12,442,172
At May 31, 1998, the present value of future minimum lease payments for capital lease obligations was$200,183,000.
P42 FDX CORPORATION
NOTE 6: PREFERRED STOCK
The Certificate of Incorporation authorizes the Board ofDirectors, at its discretion, to issue up to 4,000,000shares of Series Preferred Stock. The stock is issuablein series which may vary as to certain rights and prefer-ences and has no par value. As of May 31,1998, noneof these shares had been issued.
NOTE 7: COMMON STOCKHOLDERS’ INVESTMENT
Stock Compensation PlansAt May 31,1998, the Company had options and awardsoutstanding under 12 stock-based compensation plansconsisting of nine fixed stock option plans and threerestricted stock plans, which are described below. As ofMay 31,1998, there were 10,049,688 shares of com-mon stock reserved for issuance under these plans. TheBoard of Directors has authorized repurchase of the
Company’s common stock necessary for grants underits restricted stock plans. As of May 31, 1998, a total of 6,112,517 shares at an average cost of$23.61 per share had been purchased and reissuedunder the above-mentioned plans. On January 27,1998,as part of the Caliber acquisition,1,950,251shares of Cal-iber treasury stock (equivalent to 1,560,201 shares ofFDX common stock) were cancelled.
The Company applies Accounting Principles Board Opin-ion No. 25, “Accounting for Stock Issued to Employees,”and related interpretations in accounting for its plans.Accordingly, no compensation cost was recognized forits fixed stock option plans. The compensation costcharged against income for its restricted stock planswas $5,817,000, $3,421,000 and $2,227,000 for1998,1997 and1996, respectively. Had compensationcost for the Company’s stock-based compensation plansbeen determined consistent with SFAS 123, “Account-ing for Stock-Based Compensation,”
N O T E S T O C O N S O L I D AT E D F I N A N C I A L S T A T E M E N T S
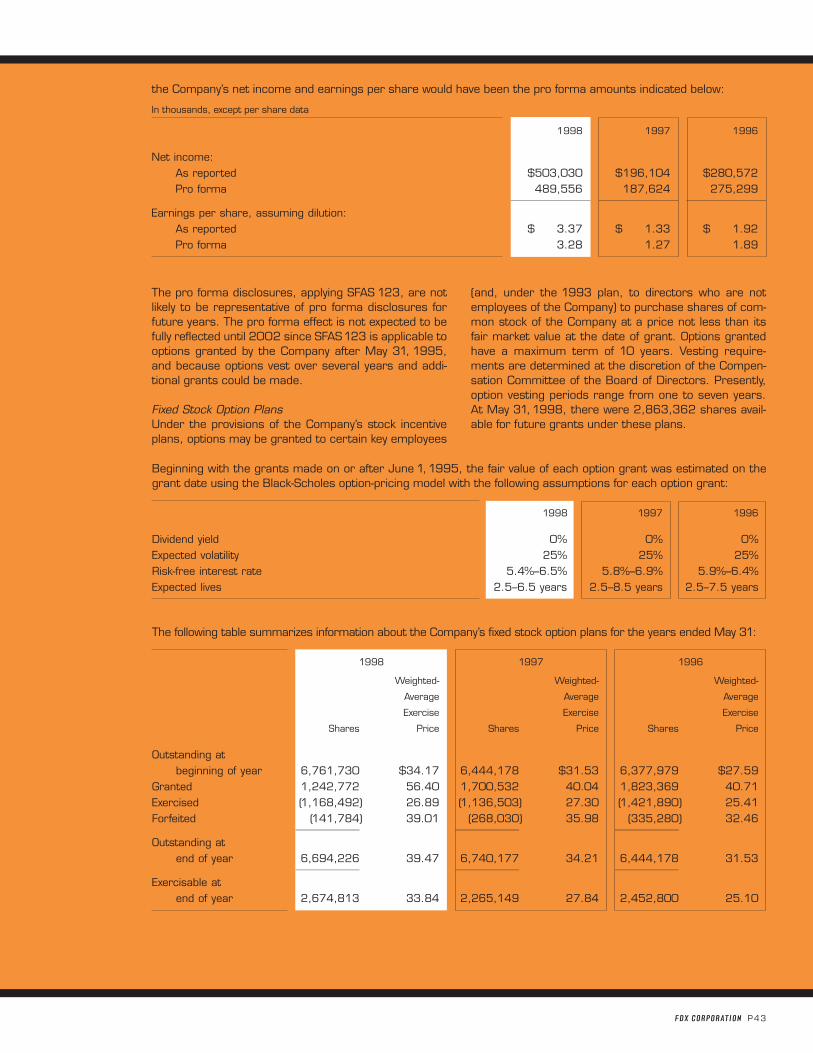
Beginning with the grants made on or after June 1,1995, the fair value of each option grant was estimated on thegrant date using the Black-Scholes option-pricing model with the following assumptions for each option grant:
1998 1997 1996
Dividend yield 0% 0% 0%Expected volatility 25% 25% 25%Risk-free interest rate 5.4%–6.5% 5.8%–6.9% 5.9%–6.4%Expected lives 2.5–6.5 years 2.5–8.5 years 2.5–7.5 years
The following table summarizes information about the Company’s fixed stock option plans for the years ended May 31:
1998 1997 1996
Weighted- Weighted- Weighted-
Average Average Average
Exercise Exercise Exercise
Shares Price Shares Price Shares Price
Outstanding atbeginning of year 6,761,730 $34.17 6,444,178 $31.53 6,377,979 $27.59
Granted 1,242,772 56.40 1,700,532 40.04 1,823,369 40.71 Exercised (1,168,492) 26.89 (1,136,503) 27.30 (1,421,890) 25.41 Forfeited (141,784) 39.01 (268,030) 35.98 (335,280) 32.46
pppppppppppppppppppppppppppppppppppppppppppppppp pppppppppppppppppppppppppppppppppppppppppppppppp pppppppppppppppppppppppppppppppppppppppppppppppp
Outstanding at end of year 6,694,226 39.47 6,740,177 34.21 6,444,178 31.53
pppppppppppppppppppppppppppppppppppppppppppppppp pppppppppppppppppppppppppppppppppppppppppppppppp pppppppppppppppppppppppppppppppppppppppppppppppp
Exercisable atend of year 2,674,813 33.84 2,265,149 27.84 2,452,800 25.10
the Company’s net income and earnings per share would have been the pro forma amounts indicated below:
In thousands, except per share data
1998 1997 1996
Net income:As reported $503,030 $196,104 $280,572Pro forma 489,556 187,624 275,299
pppppppppppppppppppppppppppppppppppppppppppppppppppppppppppp pppppppppppppppppppppppppppppppppppppppppppppppppppppppppppp pppppppppppppppppppppppppppppppppppppppppppppppppppppppppppp
Earnings per share, assuming dilution:As reported $ 3.37 $ 1.33 $ 1.92Pro forma 3.28 1.27 1.89
FDX CORPORATION P43
The pro forma disclosures, applying SFAS 123, are notlikely to be representative of pro forma disclosures forfuture years. The pro forma effect is not expected to befully reflected until 2002 since SFAS123 is applicable tooptions granted by the Company after May 31, 1995,and because options vest over several years and addi-tional grants could be made.
Fixed Stock Option PlansUnder the provisions of the Company’s stock incentiveplans, options may be granted to certain key employees
(and, under the 1993 plan, to directors who are notemployees of the Company) to purchase shares of com-mon stock of the Company at a price not less than itsfair market value at the date of grant. Options grantedhave a maximum term of 10 years. Vesting require-ments are determined at the discretion of the Compen-sation Committee of the Board of Directors. Presently,option vesting periods range from one to seven years.At May 31,1998, there were 2,863,362 shares avail-able for future grants under these plans.
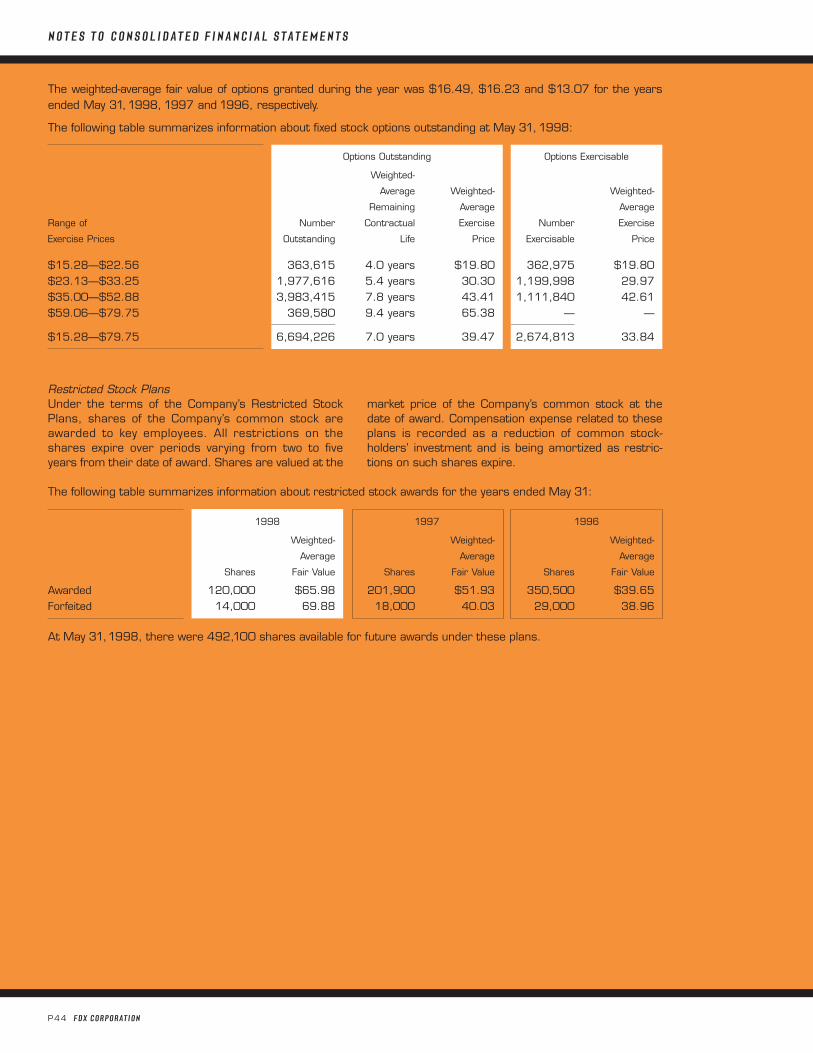
P44 FDX CORPORATION
The weighted-average fair value of options granted during the year was $16.49, $16.23 and $13.07 for the yearsended May 31,1998, 1997 and 1996, respectively.
The following table summarizes information about fixed stock options outstanding at May 31, 1998:
Options Outstanding Options Exercisable
Weighted-
Average Weighted- Weighted-
Remaining Average Average
Range of Number Contractual Exercise Number Exercise
Exercise Prices Outstanding Life Price Exercisable Price
$15.28—$22.56 363,615 4.0 years $19.80 362,975 $19.80 $23.13—$33.25 1,977,616 5.4 years 30.30 1,199,998 29.97 $35.00—$52.88 3,983,415 7.8 years 43.41 1,111,840 42.61 $59.06—$79.75 369,580 9.4 years 65.38 — —
pppppppppppppppppppppppppppppppppppppppppppppppp pppppppppppppppppppppppppppppppppppppppppppppppp
$15.28—$79.75 6,694,226 7.0 years 39.47 2,674,813 33.84
The following table summarizes information about restricted stock awards for the years ended May 31:
1998 1997 1996
Weighted- Weighted- Weighted-
Average Average Average
Shares Fair Value Shares Fair Value Shares Fair Value
Awarded 120,000 $65.98 201,900 $51.93 350,500 $39.65Forfeited 14,000 69.88 18,000 40.03 29,000 38.96
At May 31,1998, there were 492,100 shares available for future awards under these plans.
N O T E S T O C O N S O L I D AT E D F I N A N C I A L S T A T E M E N T S
Restricted Stock PlansUnder the terms of the Company’s Restricted StockPlans, shares of the Company’s common stock areawarded to key employees. All restrictions on theshares expire over periods varying from two to fiveyears from their date of award. Shares are valued at the
market price of the Company’s common stock at thedate of award. Compensation expense related to theseplans is recorded as a reduction of common stock-holders’ investment and is being amortized as restric-tions on such shares expire.
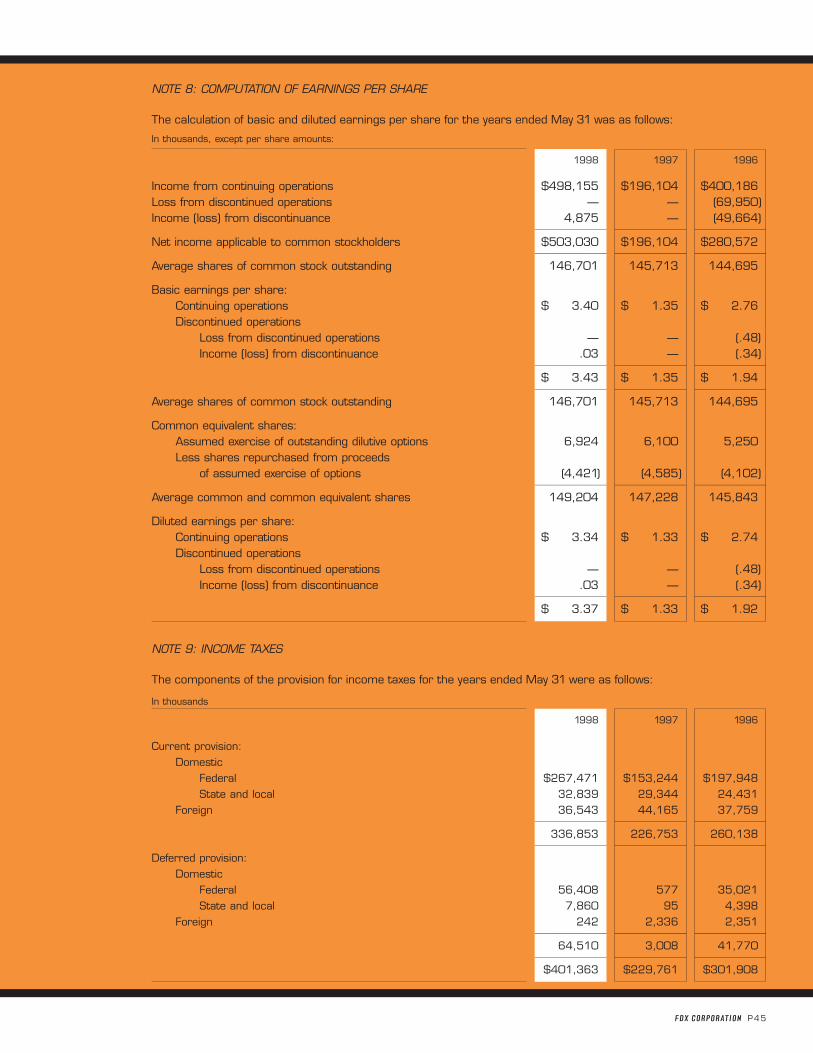
FDX CORPORATION P45
NOTE 8: COMPUTATION OF EARNINGS PER SHARE
The calculation of basic and diluted earnings per share for the years ended May 31 was as follows:
In thousands, except per share amounts:
1998 1997 1996
Income from continuing operations $498,155 $196,104 $400,186 Loss from discontinued operations — — (69,950)Income (loss) from discontinuance 4,875 — (49,664)
pppppppppppppppppppppppppppppppppppppppppppppppppppppp pppppppppppppppppppppppppppppppppppppppppppppppppppppp pppppppppppppppppppppppppppppppppppppppppppppppppppppp
Net income applicable to common stockholders $503,030 $196,104 $280,572 pppppppppppppppppppppppppppppppppppppppppppppppppppppp pppppppppppppppppppppppppppppppppppppppppppppppppppppp pppppppppppppppppppppppppppppppppppppppppppppppppppppp
Average shares of common stock outstanding 146,701 145,713 144,695
Basic earnings per share:Continuing operations $ 3.40 $ 1.35 $ 2.76 Discontinued operations
Loss from discontinued operations — — (.48)Income (loss) from discontinuance .03 — (.34)
pppppppppppppppppppppppppppppppppppppppppppppppppppppp pppppppppppppppppppppppppppppppppppppppppppppppppppppp pppppppppppppppppppppppppppppppppppppppppppppppppppppp
$ 3.43 $ 1.35 $ 1.94 pppppppppppppppppppppppppppppppppppppppppppppppppppppp pppppppppppppppppppppppppppppppppppppppppppppppppppppp pppppppppppppppppppppppppppppppppppppppppppppppppppppp
Average shares of common stock outstanding 146,701 145,713 144,695
Common equivalent shares:Assumed exercise of outstanding dilutive options 6,924 6,100 5,250 Less shares repurchased from proceeds
of assumed exercise of options (4,421) (4,585) (4,102)pppppppppppppppppppppppppppppppppppppppppppppppppppppp pppppppppppppppppppppppppppppppppppppppppppppppppppppp pppppppppppppppppppppppppppppppppppppppppppppppppppppp
Average common and common equivalent shares 149,204 147,228 145,843
Diluted earnings per share:Continuing operations $ 3.34 $ 1.33 $ 2.74 Discontinued operations
Loss from discontinued operations — — (.48)Income (loss) from discontinuance .03 — (.34)
pppppppppppppppppppppppppppppppppppppppppppppppppppppp pppppppppppppppppppppppppppppppppppppppppppppppppppppp pppppppppppppppppppppppppppppppppppppppppppppppppppppp
$ 3.37 $ 1.33 $ 1.92
NOTE 9: INCOME TAXES
The components of the provision for income taxes for the years ended May 31 were as follows:
In thousands
1998 1997 1996
Current provision:Domestic
Federal $267,471 $153,244 $197,948 State and local 32,839 29,344 24,431
Foreign 36,543 44,165 37,759 pppppppppppppppppppppppppppppppppppppppppppppppppppppp pppppppppppppppppppppppppppppppppppppppppppppppppppppp pppppppppppppppppppppppppppppppppppppppppppppppppppppp
336,853 226,753 260,138 pppppppppppppppppppppppppppppppppppppppppppppppppppppp pppppppppppppppppppppppppppppppppppppppppppppppppppppp pppppppppppppppppppppppppppppppppppppppppppppppppppppp
Deferred provision:Domestic
Federal 56,408 577 35,021 State and local 7,860 95 4,398
Foreign 242 2,336 2,351 pppppppppppppppppppppppppppppppppppppppppppppppppppppp pppppppppppppppppppppppppppppppppppppppppppppppppppppp pppppppppppppppppppppppppppppppppppppppppppppppppppppp
64,510 3,008 41,770 pppppppppppppppppppppppppppppppppppppppppppppppppppppp pppppppppppppppppppppppppppppppppppppppppppppppppppppp pppppppppppppppppppppppppppppppppppppppppppppppppppppp
$401,363 $229,761 $301,908
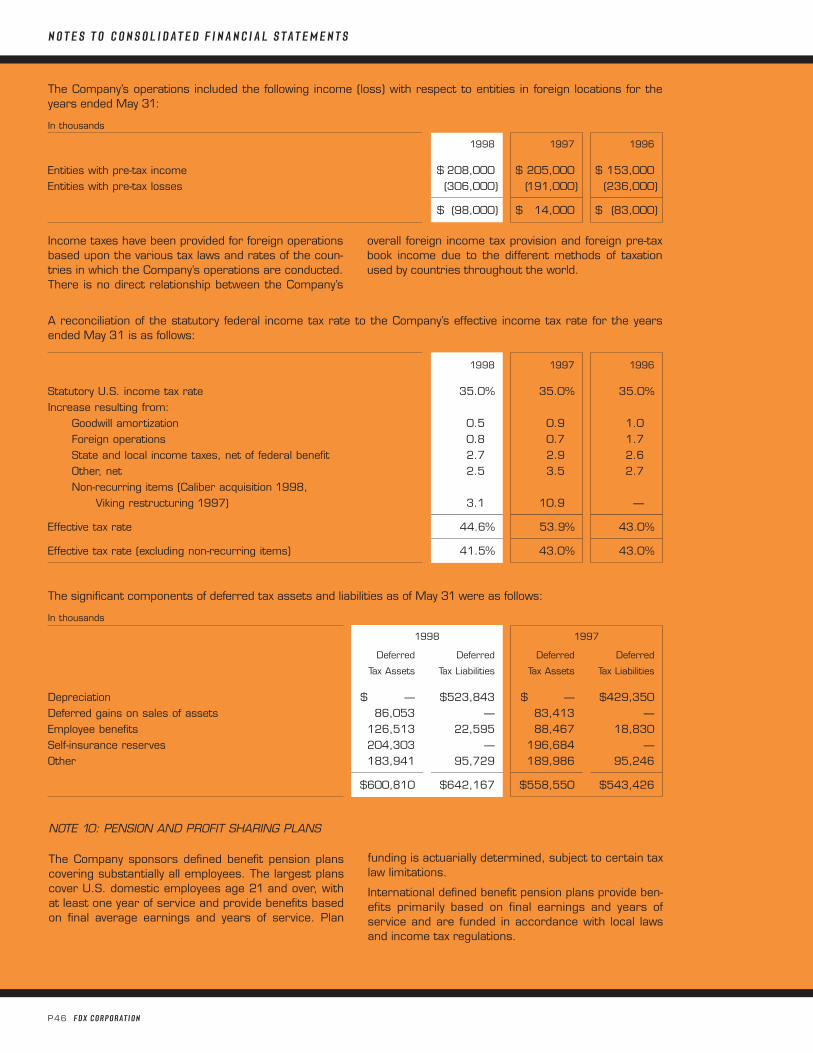
P46 FDX CORPORATION
The Company’s operations included the following income (loss) with respect to entities in foreign locations for theyears ended May 31:
In thousands
1998 1997 1996
Entities with pre-tax income $ 208,000 $ 205,000 $ 153,000 Entities with pre-tax losses (306,000) (191,000) (236,000)
pppppppppppppppppppppppppppppppppppppppppppppppppppppp pppppppppppppppppppppppppppppppppppppppppppppppppppppp pppppppppppppppppppppppppppppppppppppppppppppppppppppp
$ (98,000) $ 14,000 $ (83,000)
A reconciliation of the statutory federal income tax rate to the Company’s effective income tax rate for the yearsended May 31 is as follows:
1998 1997 1996
Statutory U.S. income tax rate 35.0% 35.0% 35.0%Increase resulting from:
Goodwill amortization 0.5 0.9 1.0 Foreign operations 0.8 0.7 1.7 State and local income taxes, net of federal benefit 2.7 2.9 2.6 Other, net 2.5 3.5 2.7 Non-recurring items (Caliber acquisition 1998,
Viking restructuring 1997) 3.1 10.9 —pppppppppppppppppppppppppppppppppppppppppppppppppppppp pppppppppppppppppppppppppppppppppppppppppppppppppppppp pppppppppppppppppppppppppppppppppppppppppppppppppppppp
Effective tax rate 44.6% 53.9% 43.0% pppppppppppppppppppppppppppppppppppppppppppppppppppppp pppppppppppppppppppppppppppppppppppppppppppppppppppppp pppppppppppppppppppppppppppppppppppppppppppppppppppppp
Effective tax rate (excluding non-recurring items) 41.5% 43.0% 43.0%
The significant components of deferred tax assets and liabilities as of May 31 were as follows:
In thousands
1998 1997
Deferred Deferred Deferred Deferred
Tax Assets Tax Liabilities Tax Assets Tax Liabilities
Depreciation $ — $523,843 $ — $429,350Deferred gains on sales of assets 86,053 — 83,413 —Employee benefits 126,513 22,595 88,467 18,830Self-insurance reserves 204,303 — 196,684 —Other 183,941 95,729 189,986 95,246
pppppppppppppppppppppppppppppppppppppppppppppppppppppp pppppppppppppppppppppppppppppppppppppppppppppppppppppp pppppppppppppppppppppppppppppppppppppppppppppppppppppp pppppppppppppppppppppppppppppppppppppppppppppppppppppp
$600,810 $642,167 $558,550 $543,426
N O T E S T O C O N S O L I D AT E D F I N A N C I A L S T A T E M E N T S
Income taxes have been provided for foreign operationsbased upon the various tax laws and rates of the coun-tries in which the Company’s operations are conducted.There is no direct relationship between the Company’s
overall foreign income tax provision and foreign pre-taxbook income due to the different methods of taxationused by countries throughout the world.
NOTE 10: PENSION AND PROFIT SHARING PLANS
The Company sponsors defined benefit pension planscovering substantially all employees. The largest planscover U.S. domestic employees age 21 and over, withat least one year of service and provide benefits basedon final average earnings and years of service. Plan
funding is actuarially determined, subject to certain taxlaw limitations.
International defined benefit pension plans provide ben-efits primarily based on final earnings and years ofservice and are funded in accordance with local lawsand income tax regulations.
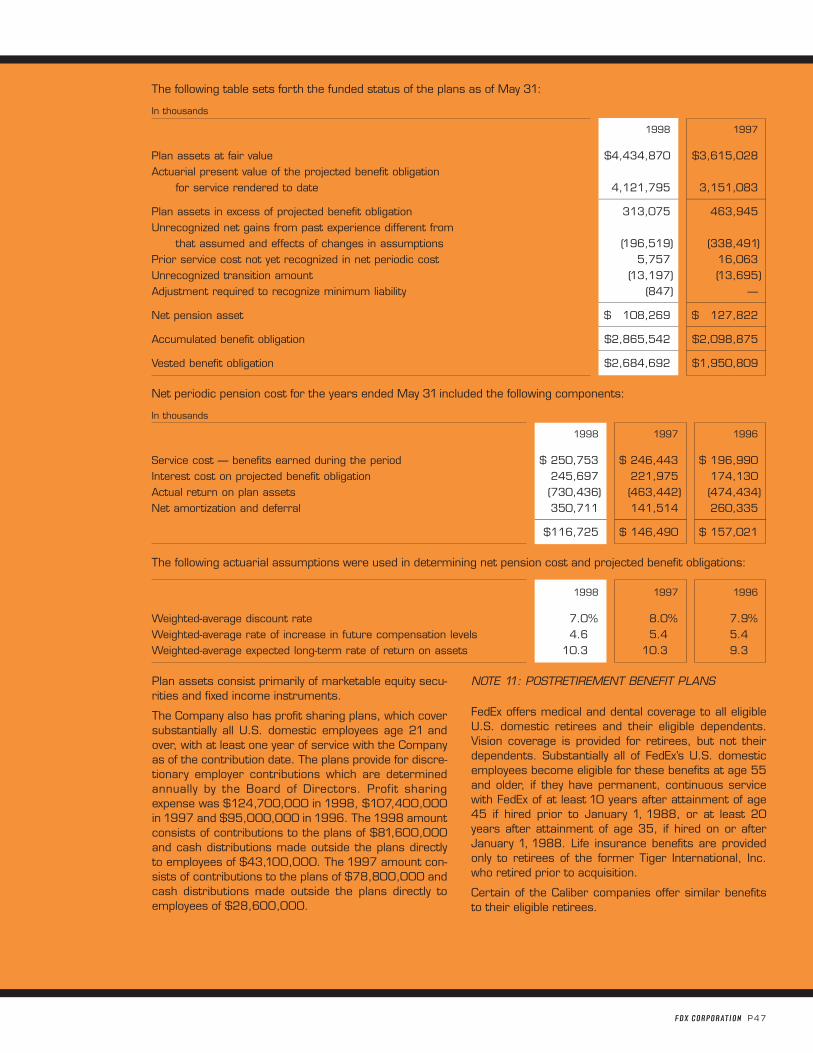
FDX CORPORATION P47
The following table sets forth the funded status of the plans as of May 31:
In thousands
1998 1997
Plan assets at fair value $4,434,870 $3,615,028 Actuarial present value of the projected benefit obligation
for service rendered to date 4,121,795 3,151,083 pppppppppppppppppppppppppppppppppppppppppppppppppppppppppppp pppppppppppppppppppppppppppppppppppppppppppppppppppppppppppp
Plan assets in excess of projected benefit obligation 313,075 463,945Unrecognized net gains from past experience different from
that assumed and effects of changes in assumptions (196,519) (338,491)Prior service cost not yet recognized in net periodic cost 5,757 16,063 Unrecognized transition amount (13,197) (13,695)Adjustment required to recognize minimum liability (847) —
pppppppppppppppppppppppppppppppppppppppppppppppppppppppppppp pppppppppppppppppppppppppppppppppppppppppppppppppppppppppppp
Net pension asset $ 108,269 $ 127,822 pppppppppppppppppppppppppppppppppppppppppppppppppppppppppppp pppppppppppppppppppppppppppppppppppppppppppppppppppppppppppp
Accumulated benefit obligation $2,865,542 $2,098,875 pppppppppppppppppppppppppppppppppppppppppppppppppppppppppppp pppppppppppppppppppppppppppppppppppppppppppppppppppppppppppp
Vested benefit obligation $2,684,692 $1,950,809
Net periodic pension cost for the years ended May 31 included the following components:
In thousands
1998 1997 1996
Service cost — benefits earned during the period $ 250,753 $ 246,443 $ 196,990Interest cost on projected benefit obligation 245,697 221,975 174,130Actual return on plan assets (730,436) (463,442) (474,434)Net amortization and deferral 350,711 141,514 260,335
pppppppppppppppppppppppppppppppppppppppppppppppppppppp pppppppppppppppppppppppppppppppppppppppppppppppppppppp pppppppppppppppppppppppppppppppppppppppppppppppppppppp
$116,725 $ 146,490 $ 157,021
The following actuarial assumptions were used in determining net pension cost and projected benefit obligations:
1998 1997 1996
Weighted-average discount rate 7.0% 8.0% 7.9%Weighted-average rate of increase in future compensation levels 4.6 5.4 5.4Weighted-average expected long-term rate of return on assets 10.3 10.3 9.3
Plan assets consist primarily of marketable equity secu-rities and fixed income instruments.
The Company also has profit sharing plans, which coversubstantially all U.S. domestic employees age 21 andover, with at least one year of service with the Companyas of the contribution date. The plans provide for discre-tionary employer contributions which are determinedannually by the Board of Directors. Profit sharingexpense was $124,700,000 in 1998, $107,400,000in 1997 and $95,000,000 in 1996. The 1998 amountconsists of contributions to the plans of $81,600,000and cash distributions made outside the plans directlyto employees of $43,100,000. The 1997 amount con-sists of contributions to the plans of $78,800,000 andcash distributions made outside the plans directly toemployees of $28,600,000.
NOTE 11: POSTRETIREMENT BENEFIT PLANS
FedEx offers medical and dental coverage to all eligibleU.S. domestic retirees and their eligible dependents.Vision coverage is provided for retirees, but not theirdependents. Substantially all of FedEx’s U.S. domesticemployees become eligible for these benefits at age 55and older, if they have permanent, continuous servicewith FedEx of at least 10 years after attainment of age45 if hired prior to January 1, 1988, or at least 20years after attainment of age 35, if hired on or afterJanuary 1, 1988. Life insurance benefits are providedonly to retirees of the former Tiger International, Inc.who retired prior to acquisition.
Certain of the Caliber companies offer similar benefitsto their eligible retirees.
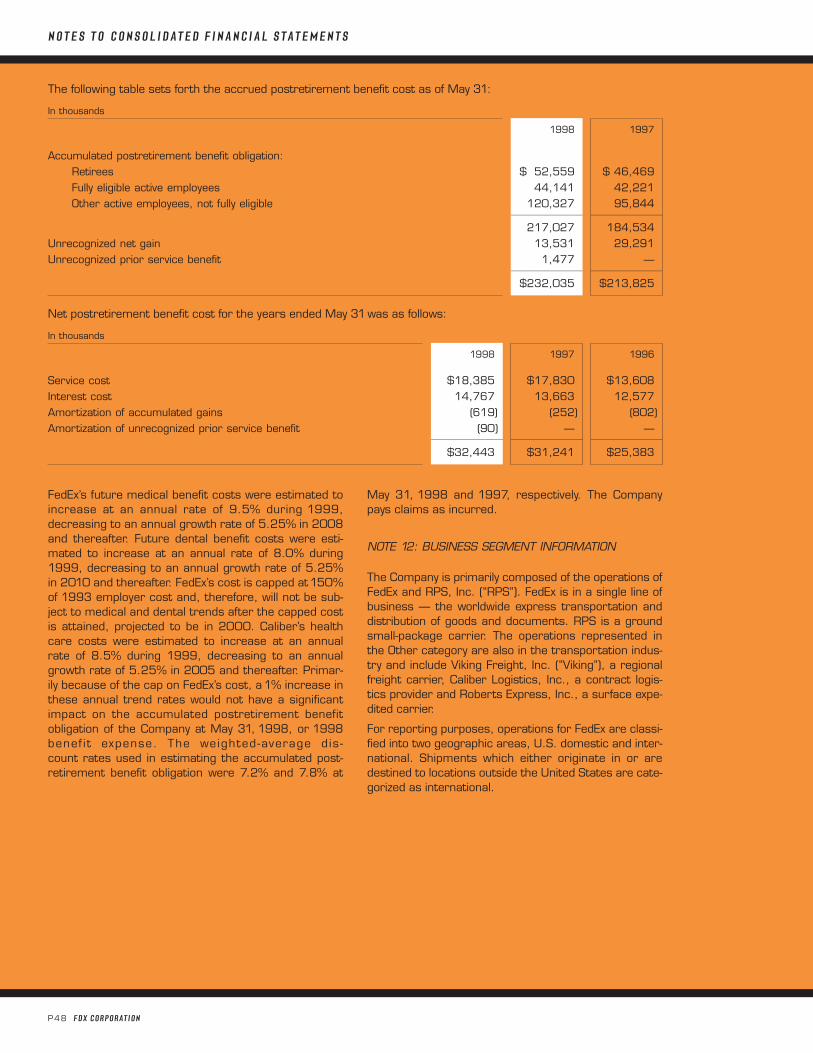
P48 FDX CORPORATION
The following table sets forth the accrued postretirement benefit cost as of May 31:
In thousands
1998 1997
Accumulated postretirement benefit obligation:Retirees $ 52,559 $ 46,469Fully eligible active employees 44,141 42,221Other active employees, not fully eligible 120,327 95,844
pppppppppppppppppppppppppppppppppppppppppppppppppppppp pppppppppppppppppppppppppppppppppppppppppppppppppppppp
217,027 184,534Unrecognized net gain 13,531 29,291Unrecognized prior service benefit 1,477 —
pppppppppppppppppppppppppppppppppppppppppppppppppppppp pppppppppppppppppppppppppppppppppppppppppppppppppppppp
$232,035 $213,825
Net postretirement benefit cost for the years ended May 31was as follows:
In thousands
1998 1997 1996
Service cost $18,385 $17,830 $13,608Interest cost 14,767 13,663 12,577Amortization of accumulated gains (619) (252) (802)Amortization of unrecognized prior service benefit (90) — —
pppppppppppppppppppppppppppppppppppppppppppppppppppppp pppppppppppppppppppppppppppppppppppppppppppppppppppppp pppppppppppppppppppppppppppppppppppppppppppppppppppppp
$32,443 $31,241 $25,383
N O T E S T O C O N S O L I D AT E D F I N A N C I A L S T A T E M E N T S
FedEx’s future medical benefit costs were estimated toincrease at an annual rate of 9.5% during 1999,decreasing to an annual growth rate of 5.25% in 2008and thereafter. Future dental benefit costs were esti-mated to increase at an annual rate of 8.0% during1999, decreasing to an annual growth rate of 5.25%in 2010 and thereafter. FedEx’s cost is capped at150%of 1993 employer cost and, therefore, will not be sub-ject to medical and dental trends after the capped costis attained, projected to be in 2000. Caliber’s healthcare costs were estimated to increase at an annualrate of 8.5% during 1999, decreasing to an annualgrowth rate of 5.25% in 2005 and thereafter. Primar-ily because of the cap on FedEx’s cost, a1% increase inthese annual trend rates would not have a significantimpact on the accumulated postretirement benefitobligation of the Company at May 31, 1998, or 1998benef i t expense. The weighted-average d is -count rates used in estimating the accumulated post-retirement benefit obligation were 7.2% and 7.8% at
May 31, 1998 and 1997, respectively. The Companypays claims as incurred.
NOTE 12: BUSINESS SEGMENT INFORMATION
The Company is primarily composed of the operations ofFedEx and RPS, Inc. (“RPS”). FedEx is in a single line ofbusiness — the worldwide express transportation anddistribution of goods and documents. RPS is a groundsmall-package carrier. The operations represented inthe Other category are also in the transportation indus-try and include Viking Freight, Inc. (“Viking”), a regionalfreight carrier, Caliber Logistics, Inc., a contract logis-tics provider and Roberts Express, Inc., a surface expe-dited carrier.
For reporting purposes, operations for FedEx are classi-fied into two geographic areas, U.S. domestic and inter-national. Shipments which either originate in or aredestined to locations outside the United States are cate-gorized as international.
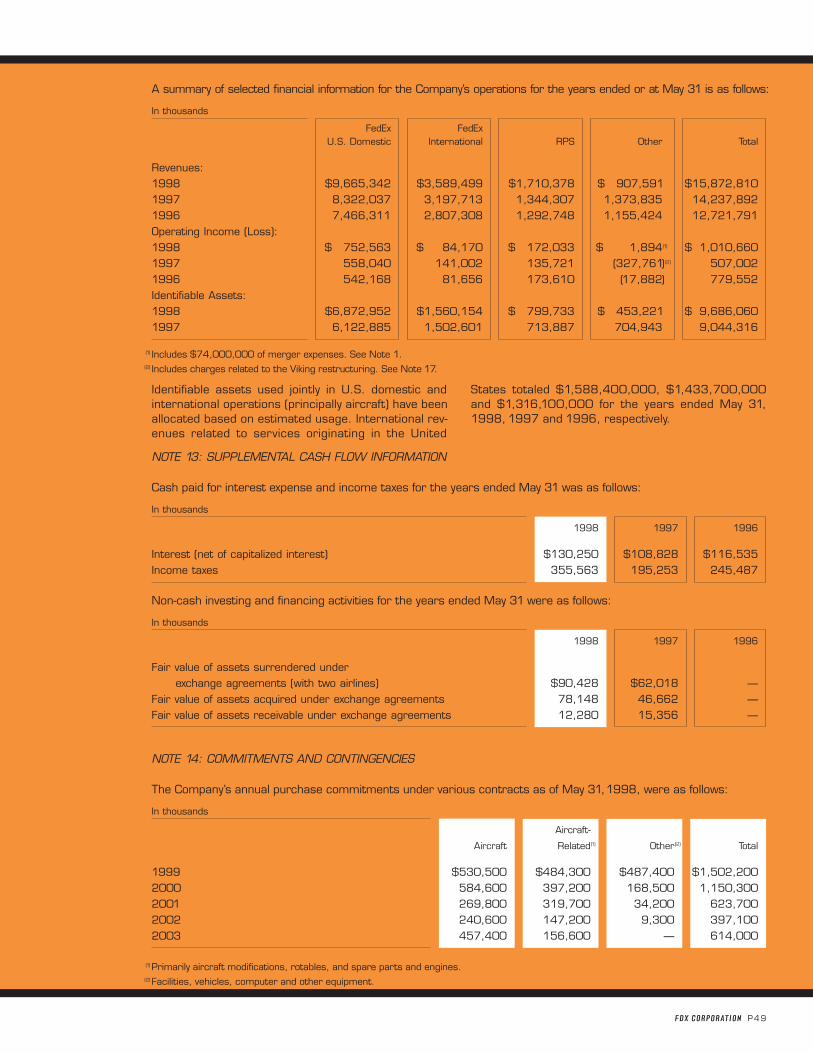
FDX CORPORATION P49
A summary of selected financial information for the Company’s operations for the years ended or at May 31 is as follows:
In thousands
FedEx FedExU.S. Domestic International RPS Other Total
Revenues:1998 $9,665,342 $3,589,499 $1,710,378 $ 907,591 $15,872,8101997 8,322,037 3,197,713 1,344,307 1,373,835 14,237,8921996 7,466,311 2,807,308 1,292,748 1,155,424 12,721,791Operating Income (Loss):1998 $ 752,563 $ 84,170 $ 172,033 $ 1,894(1) $ 1,010,6601997 558,040 141,002 135,721 (327,761)(2) 507,0021996 542,168 81,656 173,610 (17,882) 779,552Identifiable Assets:1998 $6,872,952 $1,560,154 $ 799,733 $ 453,221 $ 9,686,0601997 6,122,885 1,502,601 713,887 704,943 9,044,316
(1) Includes $74,000,000 of merger expenses. See Note 1.(2) Includes charges related to the Viking restructuring. See Note 17.
NOTE 13: SUPPLEMENTAL CASH FLOW INFORMATION
Cash paid for interest expense and income taxes for the years ended May 31 was as follows:
In thousands
1998 1997 1996
Interest (net of capitalized interest) $130,250 $108,828 $116,535Income taxes 355,563 195,253 245,487
Non-cash investing and financing activities for the years ended May 31 were as follows:
In thousands
1998 1997 1996
Fair value of assets surrendered underexchange agreements (with two airlines) $90,428 $62,018 —
Fair value of assets acquired under exchange agreements 78,148 46,662 —Fair value of assets receivable under exchange agreements 12,280 15,356 —
NOTE 14: COMMITMENTS AND CONTINGENCIES
The Company’s annual purchase commitments under various contracts as of May 31,1998, were as follows:
In thousands
Aircraft-
Aircraft Related(1) Other(2) Total
1999 $530,500 $484,300 $487,400 $1,502,2002000 584,600 397,200 168,500 1,150,3002001 269,800 319,700 34,200 623,7002002 240,600 147,200 9,300 397,1002003 457,400 156,600 — 614,000
(1) Primarily aircraft modifications, rotables, and spare parts and engines.(2) Facilities, vehicles, computer and other equipment.
Identifiable assets used jointly in U.S. domestic andinternational operations (principally aircraft) have beenallocated based on estimated usage. International rev-enues related to services originating in the United
States totaled $1,588,400,000, $1,433,700,000and $1,316,100,000 for the years ended May 31,1998, 1997 and 1996, respectively.
P50 FDX CORPORATION
N O T E S T O C O N S O L I D AT E D F I N A N C I A L S T A T E M E N T S
At May 31, 1998, FedEx was committed to purchase12 Airbus A300s, 35 MD11s and 50 Ayers ALM 200sto be delivered through 2007. Deposits and progresspayments of $94,459,000 have been made towardthese purchases.
During 1997, FedEx entered into agreements with twoairlines to acquire 53 DC10s, spare parts, aircraftengines and other equipment, and maintenance ser-vices in exchange for a combination of aircraft enginenoise reduction kits and cash. Delivery of these aircraftbegan in 1997 and will continue through 2001. Addi-tionally, these airlines may exercise put options throughDecember 31, 2003, requiring FedEx to purchase up to29 additional DC10s along with additional aircraftengines and equipment.
In March 1998, put options were exercised by an airlinerequiring FedEx to purchase seven MD11s for a totalpurchase price of $416,000,000. Delivery of the air-craft will begin in 2000.
FedEx has entered into contracts which are designed tolimit its exposure to fluctuations in jet fuel prices. Underthese contracts, FedEx makes (or receives) paymentsbased on the difference between a specified lower (orupper) limit and the market price of jet fuel, as deter-mined by an index of spot market prices representingvarious geographic regions. The difference is recordedas an increase or decrease in fuel expense. At May 31,1998, all such contracts had expired. At May 31,1997,FedEx had contracts with various financial institutionscovering a total notional volume of 396,900,000 gal-lons (approximately 54% of FedEx’s annual jet fuel con-sumption), with some contracts extending throughMay 1998. Based on market prices at May 31, 1997,the fair value of these contracts was a liability of approx-imately $418,000 as of such date. Under jet fuel con-tracts, FedEx made payments of $28,764,000 in1998,received $15,162,000 (net of payments) in 1997 andreceived $1,977,000 in1996.
NOTE 15: LEGAL PROCEEDINGS
Customers of FedEx have filed four separate class-actionlawsuits against FedEx generally alleging that FedEx hasbreached its contract with the plaintiffs in transportingpackages shipped by them. These lawsuits allege thatFedEx continued to collect a 6.25% federal excise tax onthe transportation of property shipped by air after the taxexpired on December 31,1995, until it was reinstated inAugust of 1996. The plaintiffs seek certification as a classaction, damages, an injunction to enjoin FedEx from con-tinuing to collect the excise tax referred to above, and anaward of attorneys’ fees and costs. Three of those caseswere consolidated in Minnesota Federal District Court.That court stayed the consolidated cases in favor of acase filed in Circuit Court of Greene County, Alabama. Thestay was lifted in July 1998. The complaint in theAlabama case also alleges that FedEx continued to collectthe excise tax on the transportation of property shippedby air after the tax expired again on December 31,1996.
A fifth case, filed in the Supreme Court of New York,New York County, containing allegations and requestsfor relief substantially similar to the other four caseswas dismissed with prejudice on FedEx’s motion onOctober 7, 1997. The Court found that there was nobreach of contract and that the other causes of actionwere preempted by federal law. The plaintiffs haveappealed. This case originally alleged that FedEx contin-ued to collect the excise tax on the transportation ofproperty shipped by air after the tax expired on Decem-ber 31, 1996. The New York complaint was lateramended to cover the first expiration period of the tax(December 31,1995 through August 27,1996) coveredin the original Alabama complaint.
The air transportation excise tax expired on December 31,1995, was reenacted by Congress effective August 27,1996, and expired again on December 31, 1996. Theexcise tax was then reenacted by Congress effectiveMarch 7,1997. The expiration of the tax relieved FedExof its obligation to pay the tax during the periods of expi-ration. The Taxpayer Relief Act of 1997, signed by Presi-dent Clinton in August 1997, extended the tax for 10years through September 30, 2007.
FedEx intends to vigorously defend itself in these cases.No amount has been reserved for these contingencies.
FDX Corporation and its subsidiaries are subject to otherlegal proceedings and claims which arise in the ordinarycourse of their business. In the opinion of management,the aggregate liability, if any, with respect to these otheractions will not materially adversely affect the financialposition or results of operations of the Company.
NOTE 16: DISCONTINUED OPERATIONS
On January 2, 1996, Caliber distributed to its share-holders 95% of the issued and outstanding shares ofcommon stock of Roadway Express, Inc. (“REX”), itswholly-owned subsidiary. This distribution, which wastax-free for federal income tax purposes to Caliberand its shareholders, was made to the holders ofrecord of Caliber’s common stock at the close of business on December 29, 1995. Shareholdersreceived one share of REX common stock for everytwo shares of Caliber common stock held on thatdate. As a result, shareholders’ equity was reduced by$199,700,000, which represented the book value ofthe net assets distributed. Caliber’s remaining invest-ment in REX amounted to $8,400,000 and isincluded in other assets as of May 31, 1997. Theremaining investment in REX was sold during the firstquarter of 1998.
On November 6, 1995, Caliber announced plans to exitthe air freight business served by its wholly-owned sub-sidiary, Roadway Global Air, Inc. (“RGA”). Caliberrecorded a pre-tax charge of $64,925,000 related tothe discontinuance of this business. Income from dis-continuance of $4,875,000, net of tax, in 1998included the favorable settlement of leases and othercontractual obligations.
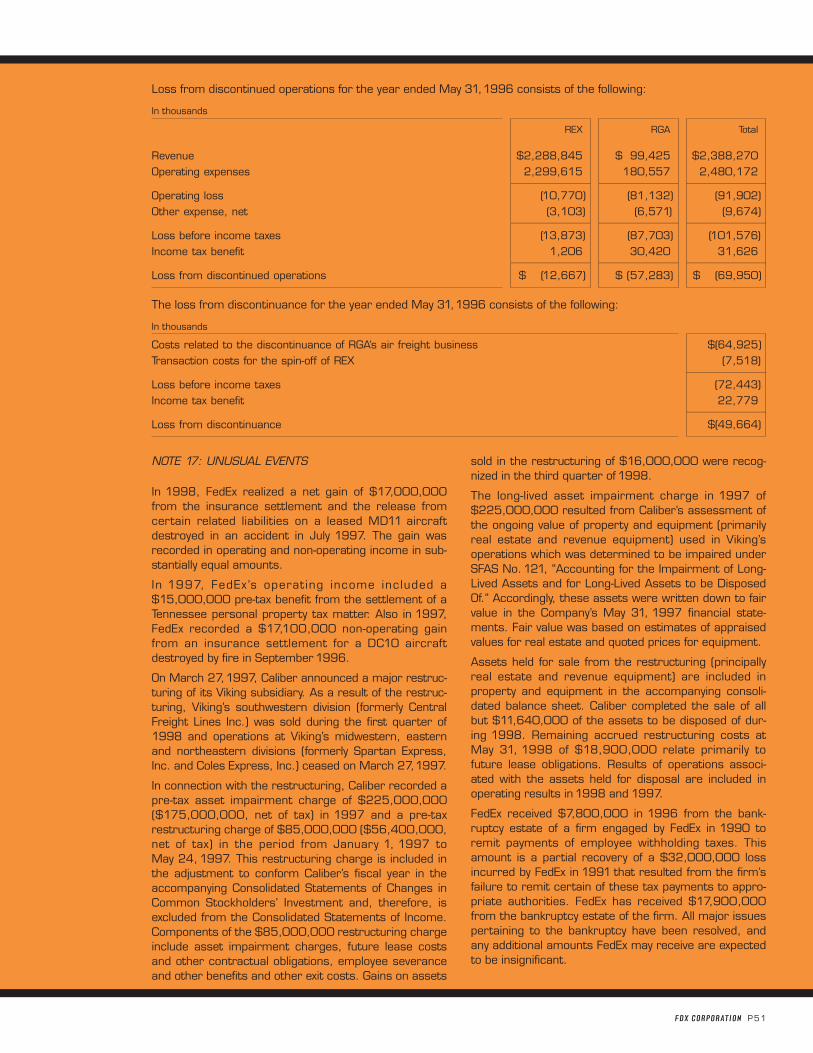
FDX CORPORATION P51
Loss from discontinued operations for the year ended May 31,1996 consists of the following:
In thousands
REX RGA Total
Revenue $2,288,845 $ 99,425 $2,388,270 Operating expenses 2,299,615 180,557 2,480,172
pppppppppppppppppppppppppppppppppppppppppppppppppppppppppppp pppppppppppppppppppppppppppppppppppppppppppppppppppppppppppp pppppppppppppppppppppppppppppppppppppppppppppppppppppppppppp
Operating loss (10,770) (81,132) (91,902)Other expense, net (3,103) (6,571) (9,674)
pppppppppppppppppppppppppppppppppppppppppppppppppppppppppppp pppppppppppppppppppppppppppppppppppppppppppppppppppppppppppp pppppppppppppppppppppppppppppppppppppppppppppppppppppppppppp
Loss before income taxes (13,873) (87,703) (101,576)Income tax benefit 1,206 30,420 31,626
pppppppppppppppppppppppppppppppppppppppppppppppppppppppppppp pppppppppppppppppppppppppppppppppppppppppppppppppppppppppppp pppppppppppppppppppppppppppppppppppppppppppppppppppppppppppp
Loss from discontinued operations $ (12,667) $ (57,283) $ (69,950)
The loss from discontinuance for the year ended May 31,1996 consists of the following:
In thousands
Costs related to the discontinuance of RGA’s air freight business $(64,925)Transaction costs for the spin-off of REX (7,518)
pppppppppppppppppppppppppppppppppppppppppppppppppppppppppppp
Loss before income taxes (72,443)Income tax benefit 22,779
pppppppppppppppppppppppppppppppppppppppppppppppppppppppppppp
Loss from discontinuance $(49,664)
NOTE 17: UNUSUAL EVENTS
In 1998, FedEx realized a net gain of $17,000,000from the insurance settlement and the release fromcertain related liabilities on a leased MD11 aircraftdestroyed in an accident in July 1997. The gain wasrecorded in operating and non-operating income in sub-stantially equal amounts.
In 1997, FedEx’s operat ing income included a$15,000,000 pre-tax benefit from the settlement of aTennessee personal property tax matter. Also in 1997,FedEx recorded a $17,100,000 non-operating gainfrom an insurance settlement for a DC10 aircraftdestroyed by fire in September 1996.
On March 27,1997, Caliber announced a major restruc-turing of its Viking subsidiary. As a result of the restruc-turing, Viking’s southwestern division (formerly CentralFreight Lines Inc.) was sold during the first quarter of1998 and operations at Viking’s midwestern, easternand northeastern divisions (formerly Spartan Express,Inc. and Coles Express, Inc.) ceased on March 27,1997.
In connection with the restructuring, Caliber recorded apre-tax asset impairment charge of $225,000,000($175,000,000, net of tax) in 1997 and a pre-taxrestructuring charge of $85,000,000 ($56,400,000,net of tax) in the period from January 1, 1997 toMay 24, 1997. This restructuring charge is included inthe adjustment to conform Caliber’s fiscal year in theaccompanying Consolidated Statements of Changes inCommon Stockholders’ Investment and, therefore, isexcluded from the Consolidated Statements of Income.Components of the $85,000,000 restructuring chargeinclude asset impairment charges, future lease costsand other contractual obligations, employee severanceand other benefits and other exit costs. Gains on assets
sold in the restructuring of $16,000,000 were recog-nized in the third quarter of 1998.
The long-lived asset impairment charge in 1997 of$225,000,000 resulted from Caliber’s assessment ofthe ongoing value of property and equipment (primarilyreal estate and revenue equipment) used in Viking’soperations which was determined to be impaired underSFAS No.121, “Accounting for the Impairment of Long-Lived Assets and for Long-Lived Assets to be DisposedOf.” Accordingly, these assets were written down to fairvalue in the Company’s May 31, 1997 financial state-ments. Fair value was based on estimates of appraisedvalues for real estate and quoted prices for equipment.
Assets held for sale from the restructuring (principallyreal estate and revenue equipment) are included inproperty and equipment in the accompanying consoli-dated balance sheet. Caliber completed the sale of allbut $11,640,000 of the assets to be disposed of dur-ing 1998. Remaining accrued restructuring costs atMay 31, 1998 of $18,900,000 relate primarily tofuture lease obligations. Results of operations associ-ated with the assets held for disposal are included inoperating results in 1998 and 1997.
FedEx received $7,800,000 in 1996 from the bank-ruptcy estate of a firm engaged by FedEx in 1990 toremit payments of employee withholding taxes. Thisamount is a partial recovery of a $32,000,000 lossincurred by FedEx in 1991 that resulted from the firm’sfailure to remit certain of these tax payments to appro-priate authorities. FedEx has received $17,900,000from the bankruptcy estate of the firm. All major issuespertaining to the bankruptcy have been resolved, andany additional amounts FedEx may receive are expectedto be insignificant.
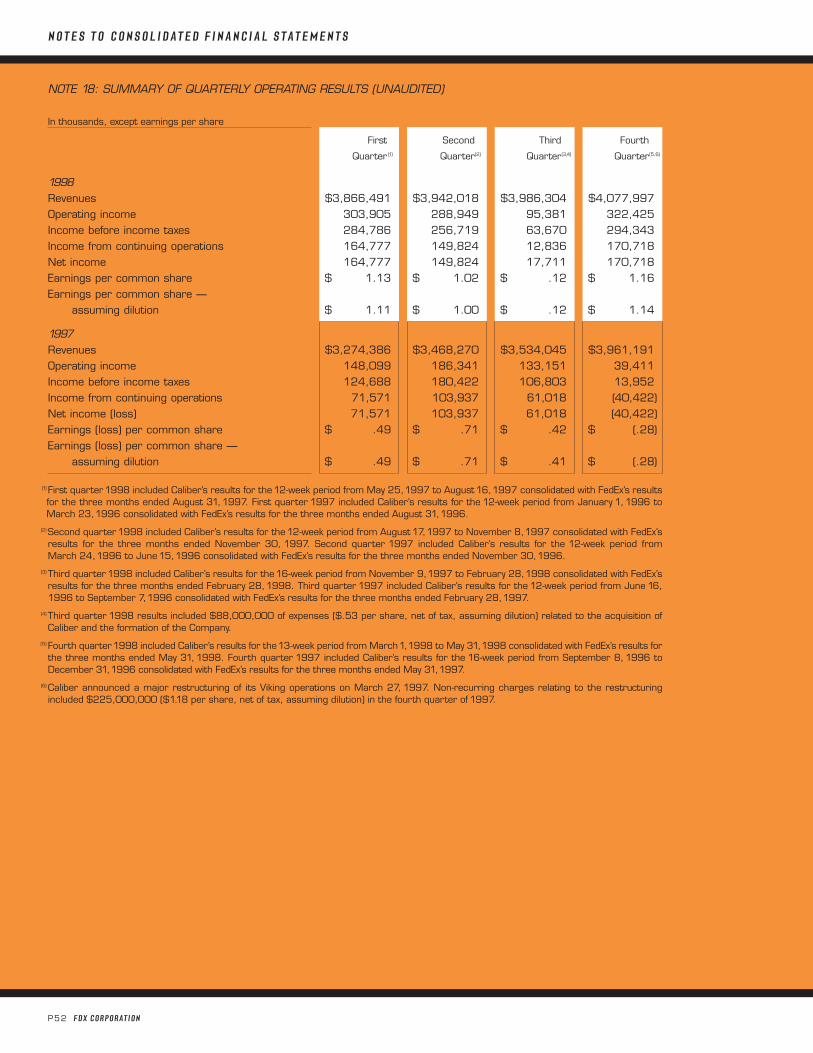
P52 FDX CORPORATION
NOTE 18: SUMMARY OF QUARTERLY OPERATING RESULTS (UNAUDITED)
In thousands, except earnings per share
First Second Third Fourth
Quarter (1) Quarter(2) Quarter(3,4) Quarter(5,6)
1998Revenues $3,866,491 $3,942,018 $3,986,304 $4,077,997 Operating income 303,905 288,949 95,381 322,425 Income before income taxes 284,786 256,719 63,670 294,343 Income from continuing operations 164,777 149,824 12,836 170,718 Net income 164,777 149,824 17,711 170,718 Earnings per common share $ 1.13 $ 1.02 $ .12 $ 1.16 Earnings per common share —
assuming dilution $ 1.11 $ 1.00 $ .12 $ 1.14
1997Revenues $3,274,386 $3,468,270 $3,534,045 $3,961,191 Operating income 148,099 186,341 133,151 39,411 Income before income taxes 124,688 180,422 106,803 13,952 Income from continuing operations 71,571 103,937 61,018 (40,422)Net income (loss) 71,571 103,937 61,018 (40,422)Earnings (loss) per common share $ .49 $ .71 $ .42 $ (.28)Earnings (loss) per common share —
assuming dilution $ .49 $ .71 $ .41 $ (.28)
(1) First quarter1998 included Caliber’s results for the12-week period from May 25,1997 to August16,1997 consolidated with FedEx’s resultsfor the three months ended August 31,1997. First quarter 1997 included Caliber’s results for the 12-week period from January 1,1996 toMarch 23,1996 consolidated with FedEx’s results for the three months ended August 31,1996.
(2) Second quarter1998 included Caliber’s results for the12-week period from August17,1997 to November 8,1997 consolidated with FedEx’sresults for the three months ended November 30, 1997. Second quarter 1997 included Caliber’s results for the 12-week period fromMarch 24,1996 to June15,1996 consolidated with FedEx’s results for the three months ended November 30,1996.
(3) Third quarter1998 included Caliber’s results for the16-week period from November 9,1997 to February 28,1998 consolidated with FedEx’sresults for the three months ended February 28,1998. Third quarter 1997 included Caliber’s results for the 12-week period from June 16,1996 to September 7,1996 consolidated with FedEx’s results for the three months ended February 28,1997.
(4) Third quarter 1998 results included $88,000,000 of expenses ($.53 per share, net of tax, assuming dilution) related to the acquisition ofCaliber and the formation of the Company.
(5) Fourth quarter1998 included Caliber’s results for the13-week period from March1,1998 to May 31,1998 consolidated with FedEx’s results forthe three months ended May 31, 1998. Fourth quarter 1997 included Caliber’s results for the 16-week period from September 8, 1996 toDecember 31,1996 consolidated with FedEx’s results for the three months ended May 31,1997.
(6) Caliber announced a major restructuring of its Viking operations on March 27, 1997. Non-recurring charges relating to the restructuringincluded $225,000,000 ($1.18 per share, net of tax, assuming dilution) in the fourth quarter of 1997.
N O T E S T O C O N S O L I D AT E D F I N A N C I A L S T A T E M E N T S
FDX CORPORATION P53
To the Stockholders of FDX Corporation:
We have audited the accompanying consolidated bal-ance sheets of FDX Corporation (a Delaware corpora-tion) and subsidiaries as of May 31, 1998 and 1997,and the related consolidated statements of income,common stockholders’ investment and cash flows foreach of the three years in the period ended May 31,1998. These financial statements are the responsibilityof the Company’s management. Our responsibility is toexpress an opinion on these financial statements basedon our audits. We did not audit the December 31,1996, balance sheet and the related statements ofincome, shareholders’ equity and cash flows for each ofthe two years in the period ended December 31,1996,of Caliber System, Inc., a company acquired during1998 in a transaction accounted for as a pooling ofinterests, as discussed in Note 1. Such statements areincluded in the consolidated financial statements of FDXCorporation as of May 31,1997, and for each of the twoyears in the period ended May 31,1997, and reflect totalassets of 16 percent at May 31, 1997, and total rev-enues of 19 percent in both 1996 and 1997 of therelated FDX Corporation consolidated totals. Thesestatements were audited by other auditors whose reporthas been furnished to us, and our opinion, insofar as itrelates to amounts included for Caliber System, Inc., isbased solely upon the report of the other auditors.
We conducted our audits in accordance with generallyaccepted auditing standards. Those standards requirethat we plan and perform the audit to obtain reason-able assurance about whether the financial statementsare free of material misstatement. An audit includesexamining, on a test basis, evidence supporting theamounts and disclosures in the financial statements.An audit also includes assessing the accounting princi-ples used and significant estimates made by manage-ment, as well as evaluating the overall financialstatement presentation. We believe that our audits andthe report of the other auditors provide a reasonablebasis for our opinion.
In our opinion, based on our audits and the report of theother auditors, the financial statements referred toabove present fairly, in all material respects, the finan-cial position of FDX Corporation as of May 31,1998 and1997, and the results of their operations and their cashflows for each of the three years in the period endedMay 31, 1998, in conformity with generally acceptedaccounting principles.
Memphis, TennesseeJuly 8,1998
R E P O R T O F I N D E P E N D E N T P U B L I C A C C O U N TA N T S
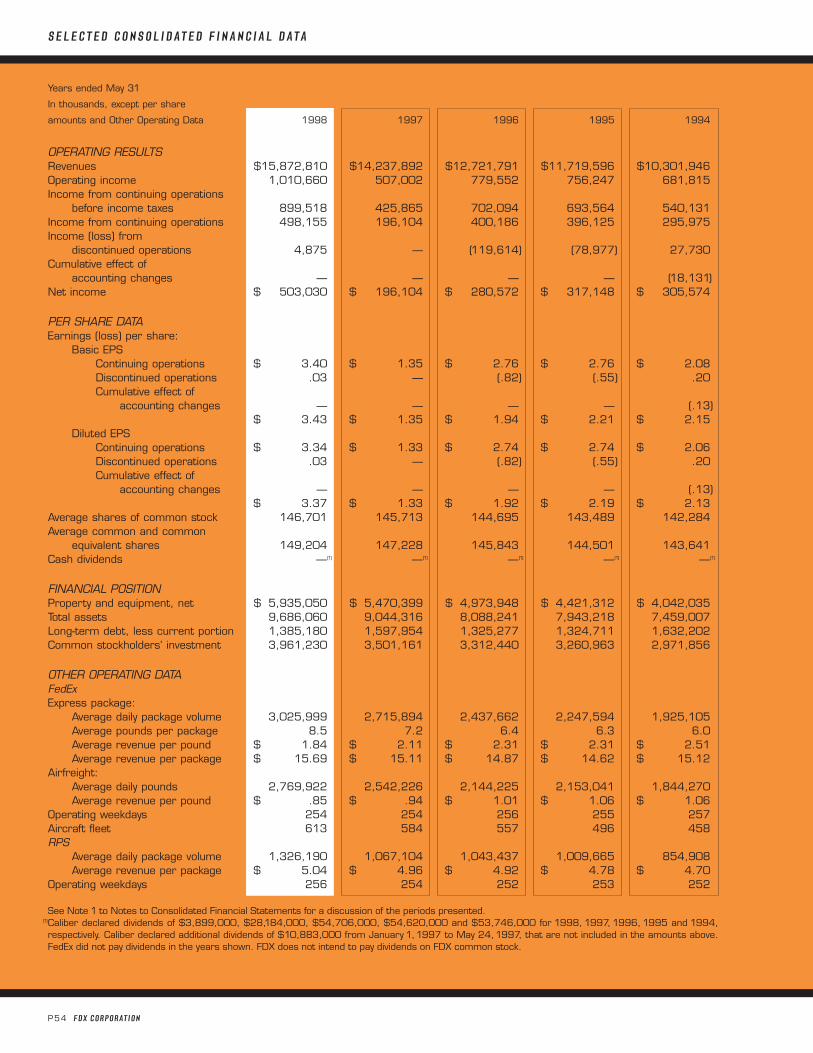
P54 FDX CORPORATION
Years ended May 31
In thousands, except per share
amounts and Other Operating Data 1998 1997 1996 1995 1994
OPERATING RESULTSRevenues $15,872,810 $14,237,892 $12,721,791 $11,719,596 $10,301,946Operating income 1,010,660 507,002 779,552 756,247 681,815Income from continuing operations
before income taxes 899,518 425,865 702,094 693,564 540,131Income from continuing operations 498,155 196,104 400,186 396,125 295,975Income (loss) from
discontinued operations 4,875 — (119,614) (78,977) 27,730Cumulative effect of
accounting changes — — — — (18,131)Net income $ 503,030 $ 196,104 $ 280,572 $ 317,148 $ 305,574
PER SHARE DATAEarnings (loss) per share:
Basic EPSContinuing operations $ 3.40 $ 1.35 $ 2.76 $ 2.76 $ 2.08Discontinued operations .03 — (.82) (.55) .20Cumulative effect of
accounting changes — — — — (.13)$ 3.43 $ 1.35 $ 1.94 $ 2.21 $ 2.15
Diluted EPSContinuing operations $ 3.34 $ 1.33 $ 2.74 $ 2.74 $ 2.06Discontinued operations .03 — (.82) (.55) .20Cumulative effect of
accounting changes — — — — (.13)$ 3.37 $ 1.33 $ 1.92 $ 2.19 $ 2.13
Average shares of common stock 146,701 145,713 144,695 143,489 142,284Average common and common
equivalent shares 149,204 147,228 145,843 144,501 143,641Cash dividends —(1) —(1) —(1) —(1) —(1)
FINANCIAL POSITIONProperty and equipment, net $ 5,935,050 $ 5,470,399 $ 4,973,948 $ 4,421,312 $ 4,042,035Total assets 9,686,060 9,044,316 8,088,241 7,943,218 7,459,007Long-term debt, less current portion 1,385,180 1,597,954 1,325,277 1,324,711 1,632,202Common stockholders’ investment 3,961,230 3,501,161 3,312,440 3,260,963 2,971,856
OTHER OPERATING DATAFedExExpress package:
Average daily package volume 3,025,999 2,715,894 2,437,662 2,247,594 1,925,105Average pounds per package 8.5 7.2 6.4 6.3 6.0Average revenue per pound $ 1.84 $ 2.11 $ 2.31 $ 2.31 $ 2.51Average revenue per package $ 15.69 $ 15.11 $ 14.87 $ 14.62 $ 15.12
Airfreight:Average daily pounds 2,769,922 2,542,226 2,144,225 2,153,041 1,844,270Average revenue per pound $ .85 $ .94 $ 1.01 $ 1.06 $ 1.06
Operating weekdays 254 254 256 255 257Aircraft fleet 613 584 557 496 458RPS
Average daily package volume 1,326,190 1,067,104 1,043,437 1,009,665 854,908Average revenue per package $ 5.04 $ 4.96 $ 4.92 $ 4.78 $ 4.70
Operating weekdays 256 254 252 253 252
See Note 1 to Notes to Consolidated Financial Statements for a discussion of the periods presented.(1)Caliber declared dividends of $3,899,000, $28,184,000, $54,706,000, $54,620,000 and $53,746,000 for 1998, 1997, 1996, 1995 and 1994,respectively. Caliber declared additional dividends of $10,883,000 from January 1,1997 to May 24,1997, that are not included in the amounts above.FedEx did not pay dividends in the years shown. FDX does not intend to pay dividends on FDX common stock.
S E L E C T E D C O N S O L I D AT E D F I N A N C I A L D AT A
FDX CORPORATION P55
BOARD OF DIRECTORS
ROBERT H. ALLEN (2)
Private Investor and Managing PartnerChallenge Investment Partners
Investment firm
ROBERT L. COX (1)
PartnerWaring Cox
Law firm
RALPH D. DENUNZIO (2)
PresidentHarbor Point Associates, Inc.
Private investment and consulting firm
JUDITH L. ESTRIN (1)
Senior Vice President and Chief Technology OfficerCisco Systems, Inc.
Networking systems company
PHILIP GREER (1*)
Senior Managing DirectorWeiss, Peck & Greer, L.L.C.
Investment management firm
J.R. HYDE, III (2)
PresidentPittco, Inc.
Investment company
CHARLES T. MANATT (2)
ChairmanManatt, Phelps & Phillips
Law firm
GEORGE J. MITCHELL(1)
Special CounselVerner, Liipfert, Bernhard, McPherson and Hand
Law firm
JACKSON W. SMART, JR.(2*)
Chairman, Executive CommitteeFirst Commonwealth, Inc.
Managed dental care company
FREDERICK W. SMITHChairman, President and Chief Executive OfficerFDX Corporation
DR. JOSHUA I. SMITH (1)
Chairman, President and Chief Executive OfficerThe MAXIMA Corporation
Information and data processing firm
PAUL S. WALSH (2)
Chairman, President and Chief Executive OfficerThe Pillsbury Company
Consumer food and beverage company
PETER S. WILLMOTT (1)
Chairman and Chief Executive OfficerWillmott Services, Inc.
Retail and consulting firm
(1) Audit Committee(2) Compensation Committee(*) Committee Chairman
B O A R D O F D I R E C T O R S A N D S E N I O R O F F I C E R S
SENIOR OFFICERS
FREDERICK W. SMITHChairman, President andChief Executive Officer
ALAN B. GRAF, JR.Executive Vice President andChief Financial Officer
KENNETH R. MASTERSONExecutive Vice President,General Counsel and Secretary
T. MICHAEL GLENNExecutive Vice President,Market Development andCorporate Communications
DENNIS H. JONESExecutive Vice President andChief Information Officer
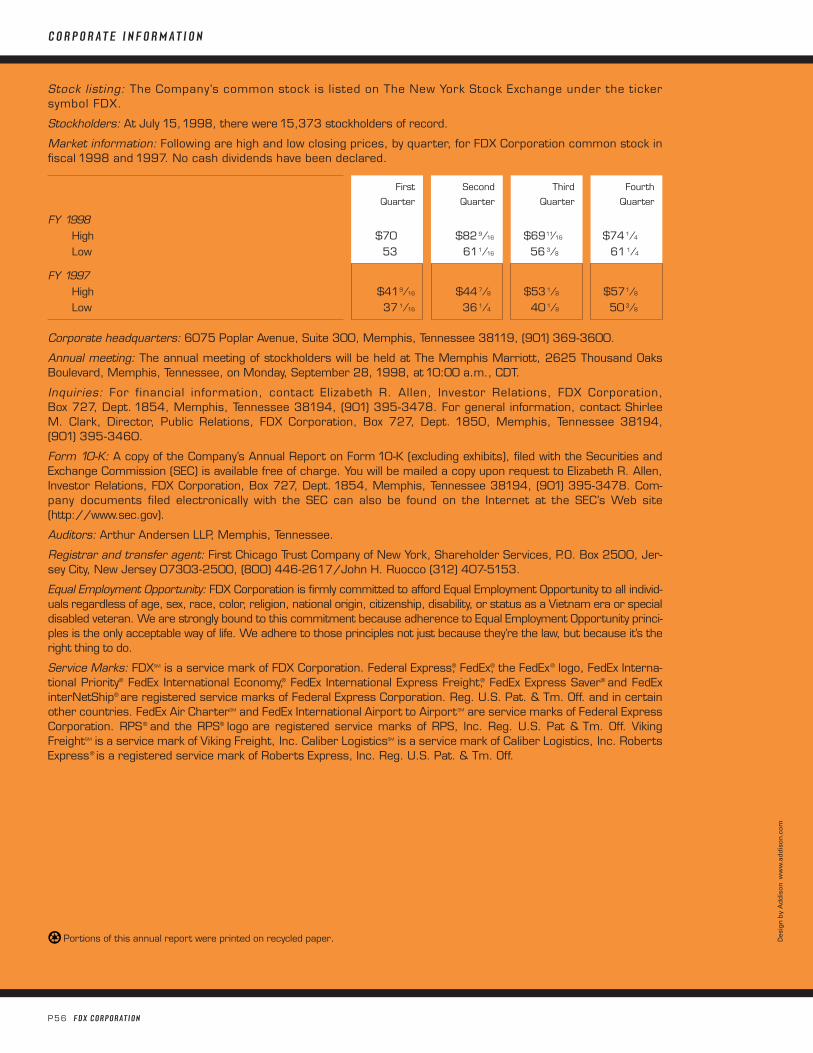
Stock listing: The Company’s common stock is listed on The New York Stock Exchange under the tickersymbol FDX.
Stockholders: At July 15,1998, there were15,373 stockholders of record.
Market information: Following are high and low closing prices, by quarter, for FDX Corporation common stock infiscal 1998 and 1997. No cash dividends have been declared.
First Second Third Fourth
Quarter Quarter Quarter Quarter
FY 1998High $70 $829⁄16 $6911⁄16 $741⁄4
Low 53 611⁄16 56 3⁄8 61 1⁄4
FY 1997High $419⁄16 $447⁄8 $531⁄8 $571⁄8
Low 37 1⁄16 36 1⁄4 40 1⁄8 50 3⁄8
Corporate headquarters: 6075 Poplar Avenue, Suite 300, Memphis, Tennessee 38119, (901) 369-3600.
Annual meeting: The annual meeting of stockholders will be held at The Memphis Marriott, 2625 Thousand OaksBoulevard, Memphis, Tennessee, on Monday, September 28, 1998, at 10:00 a.m., CDT.
Inquiries: For financial information, contact Elizabeth R. Allen, Investor Relations, FDX Corporation, Box 727, Dept. 1854, Memphis, Tennessee 38194, (901) 395-3478. For general information, contact ShirleeM. Clark, Director, Public Relations, FDX Corporation, Box 727, Dept. 1850, Memphis, Tennessee 38194,(901) 395-3460.
Form 10-K: A copy of the Company’s Annual Report on Form 10-K (excluding exhibits), filed with the Securities andExchange Commission (SEC) is available free of charge. You will be mailed a copy upon request to Elizabeth R. Allen,Investor Relations, FDX Corporation, Box 727, Dept. 1854, Memphis, Tennessee 38194, (901) 395-3478. Com-pany documents filed electronically with the SEC can also be found on the Internet at the SEC’s Web site(http://www.sec.gov).
Auditors: Arthur Andersen LLP, Memphis, Tennessee.
Registrar and transfer agent: First Chicago Trust Company of New York, Shareholder Services, P.O. Box 2500, Jer-sey City, New Jersey 07303-2500, (800) 446-2617/John H. Ruocco (312) 407-5153.
Equal Employment Opportunity: FDX Corporation is firmly committed to afford Equal Employment Opportunity to all individ-uals regardless of age, sex, race, color, religion, national origin, citizenship, disability, or status as a Vietnam era or specialdisabled veteran. We are strongly bound to this commitment because adherence to Equal Employment Opportunity princi-ples is the only acceptable way of life. We adhere to those principles not just because they’re the law, but because it’s theright thing to do.
Service Marks: FDXSM is a service mark of FDX Corporation. Federal Express,® FedEx,® the FedEx® logo, FedEx Interna-tional Priority® FedEx International Economy,® FedEx International Express Freight,® FedEx Express Saver® and FedExinterNetShip® are registered service marks of Federal Express Corporation. Reg. U.S. Pat. & Tm. Off. and in certainother countries. FedEx Air CharterSM and FedEx International Airport to AirportSM are service marks of Federal ExpressCorporation. RPS® and the RPS® logo are registered service marks of RPS, Inc. Reg. U.S. Pat & Tm. Off. VikingFreightSM is a service mark of Viking Freight, Inc. Caliber LogisticsSM is a service mark of Caliber Logistics, Inc. RobertsExpress® is a registered service mark of Roberts Express, Inc. Reg. U.S. Pat. & Tm. Off.
P56 FDX CORPORATION
C O R P O R AT E I N F O R M AT I O N
Portions of this annual report were printed on recycled paper. Des
ign
by
Ad
dis
on
ww
w.a
dd
iso
n.c
om
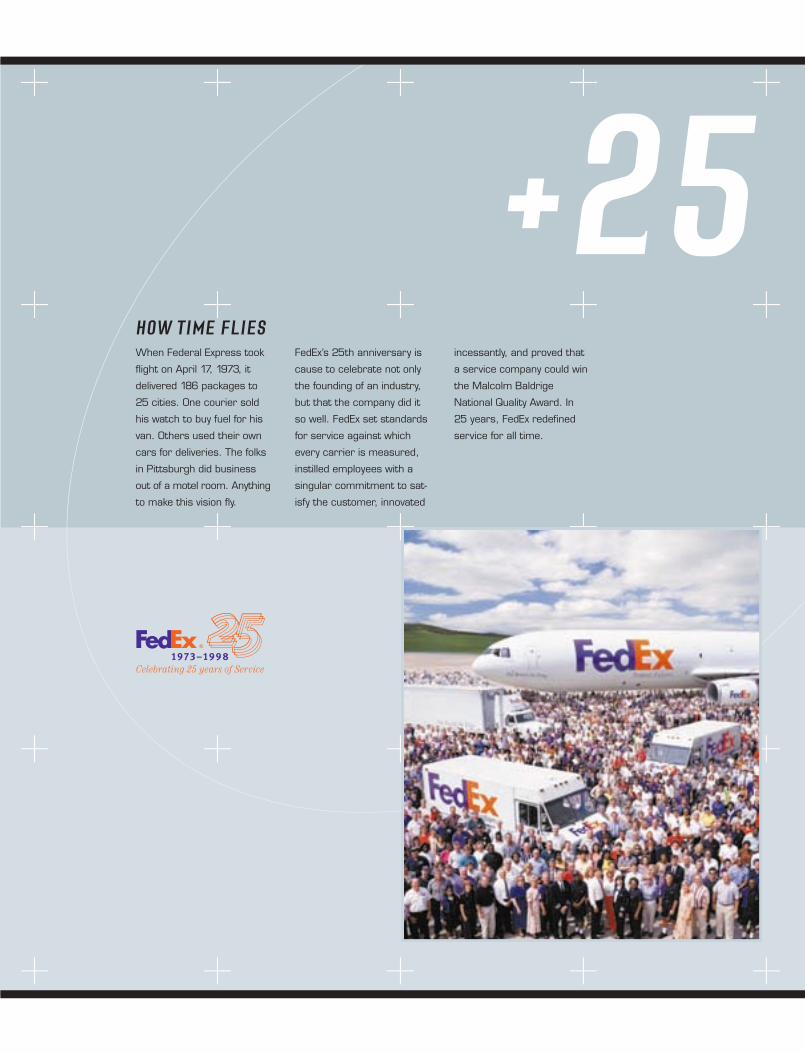
HOW TIME FLIESWhen Federal Express took
flight on April 17, 1973, it
delivered 186 packages to
25 cities. One courier sold
his watch to buy fuel for his
van. Others used their own
cars for deliveries. The folks
in Pittsburgh did business
out of a motel room. Anything
to make this vision fly.
incessantly, and proved that
a service company could win
the Malcolm Baldrige
National Quality Award. In
25 years, FedEx redefined
service for all time.
FedEx’s 25th anniversary is
cause to celebrate not only
the founding of an industry,
but that the company did it
so well. FedEx set standards
for service against which
every carrier is measured,
instilled employees with a
singular commitment to sat-
isfy the customer, innovated
+25
FDX Corporation6075 Poplar AvenueMemphis, Tennessee 38119