fault tree analysis - ulisboa · fault tree analysis ist fault tree analysis • fta is a top-down...
TRANSCRIPT
A. Palos Teixeira and C. Guedes Soares
Fault Tree Analysis
IST
Fault tree analysis
• FTA is a top-down process by which an undesirable event (failure in a projectobjective or a critical failure that can affect the project), referred to as the topevent, is logically decomposed into possible causes in increasing detail todetermine the causes or combinations of causes of the top event.
• FTA can yield both qualitative and quantitative information about the systemunder study.
• Qualitative information may include failure paths, root causes, and weak areas of the system/project.
• Quantitative analysis of a fault tree gives a probabilistic estimation of the top event
Fault Tree Analysis (FTA)
Fault tree analysis
1. Define the system. The interactions between the system and neighbors, includingthe human interface, should be fully analyzed to take account of all potential failurecauses in the FTA.
2. Understand the functional relationships between subsystems and components.
3. Identify the top-level fault events of the system, i.e a failure in a project objective ora critical failure that can affect the project objective
4. Construct a fault tree for the selected top event using event and logic symbols
5. Identify all single failures and prioritize cut sets by the likelihood of occurrence.
FTA Process
Fault tree analysis
6. If quantitative information is needed, calculate the probability of the top event
7. Determine whether corrective actions are required. If necessary, develop measures toeradicate fault paths or to minimize the probability of fault occurrence.
8. Document the analysis and then follow up to ensure that the corrective actionsproposed have been implemented. Update the analysis whenever a design changetakes place.
FTA Process
Fault tree analysis
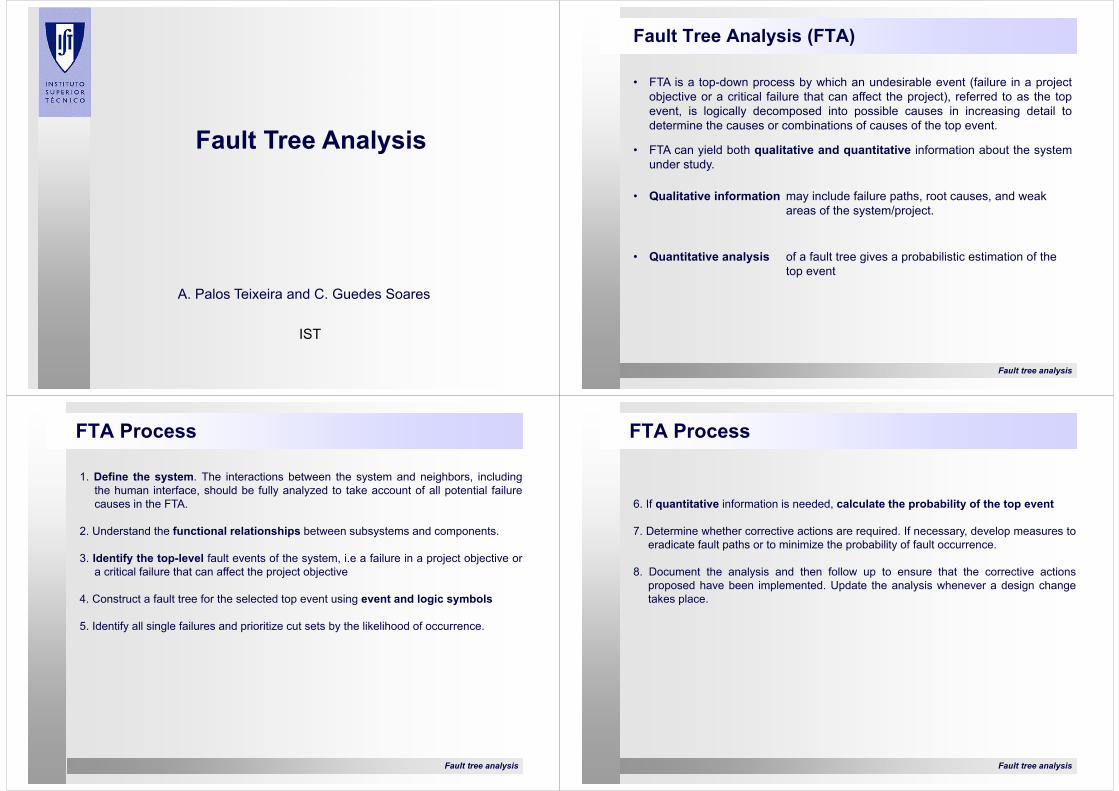
FTA events and logic symbolsA fault tree is a graphical representation of logical relationships between failure events. Thus, a fault tree may be viewed as a system of event and logic symbols.
Fault tree analysis
FTA events and logic symbols
symbol Gate Name Causal Relation
m
n inputs
m Out of n gate
VOTING gate m/n
Output event occurs if at least m of n input events occur.
Inhibit gate
Input procedures output when conditional event occurs
Basic Event
Basic Event or failure
Undeveloped
event
Causes are not developed
Event
Event that can occur normally
Transfer symbol
Represents an event which comes from another lower-order fault tree or which is to be transferred to a higher-order tree
Fault tree analysis
FTA events and logic symbols
Event symbols
Circle: a basic event that requires no further development. It represents the type ofevents at the lowest level and thus indicates the termination of tree ramification.Reliability information of the events should be available for quantitative analysis of afault tree.
Rectangle: an intermediate event that can be developed further. It denotes an eventthat results from a combination of more basic events through logic gates.
Diamond: an undeveloped event that is not developed further either because it is ofinsufficient consequence or because information necessary for further developmentis unavailable.
Triangle: a symbol indicating that the tree is developed further elsewhere (e.g., onanother page).
Fault tree analysis
FTA events and logic symbols
Logic symbols
graphically represent the gates used to interconnect the lowlevel events thatcontribute to the top-level event according to their causal relations. A gate may haveone or more input events, but only one output event.
AND gate - An output event is produced if all the input events occur simultaneously.
OR gate. An output event is produced if any one or more of the input events occurs.
INHIBIT gate. Input produces output only when a certain condition is satisfied. AnINHIBIT gate is a special type of AND gate.
EXCLUSIVE OR gate. Input events cause an output event if only one of the inputevents occurs. The output event will not occur if more than one input event occurs.This gate can be replaced with the combination of AND gates and OR gates.
VOTING gate. Input events produce an output event if at least k of n inputeventsoccur.
Fault tree analysis
FTA events and logic symbols
Fault tree analysis
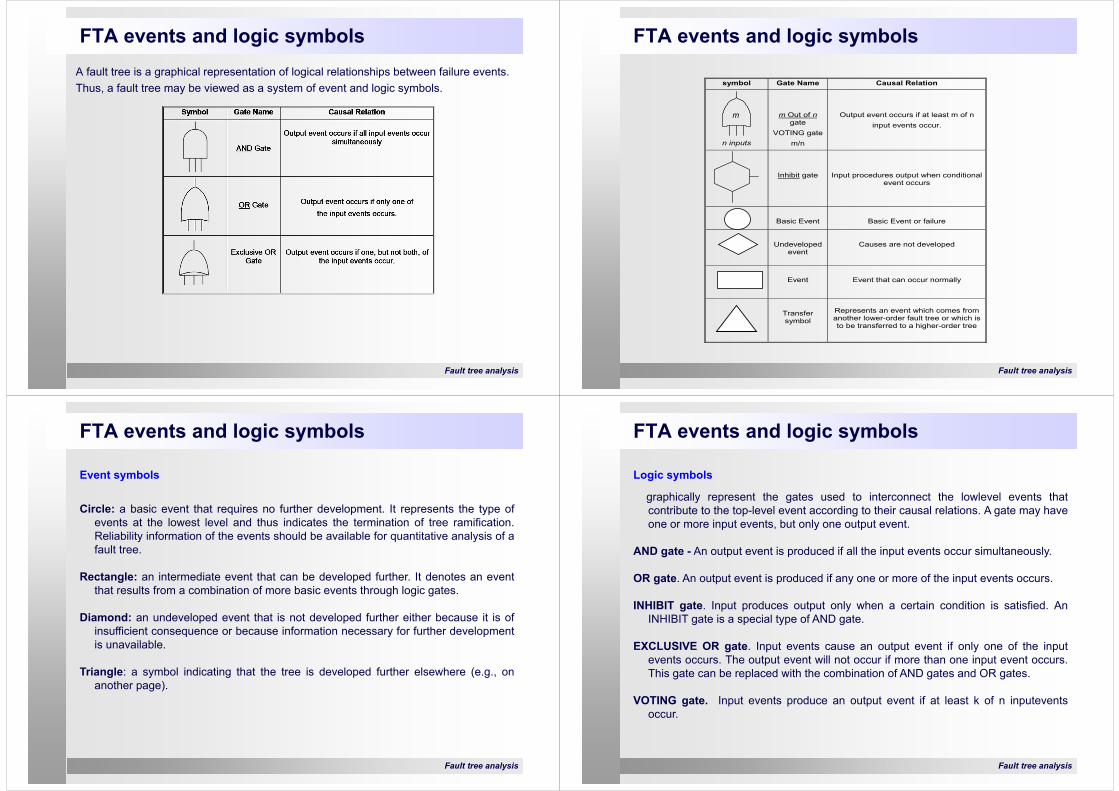
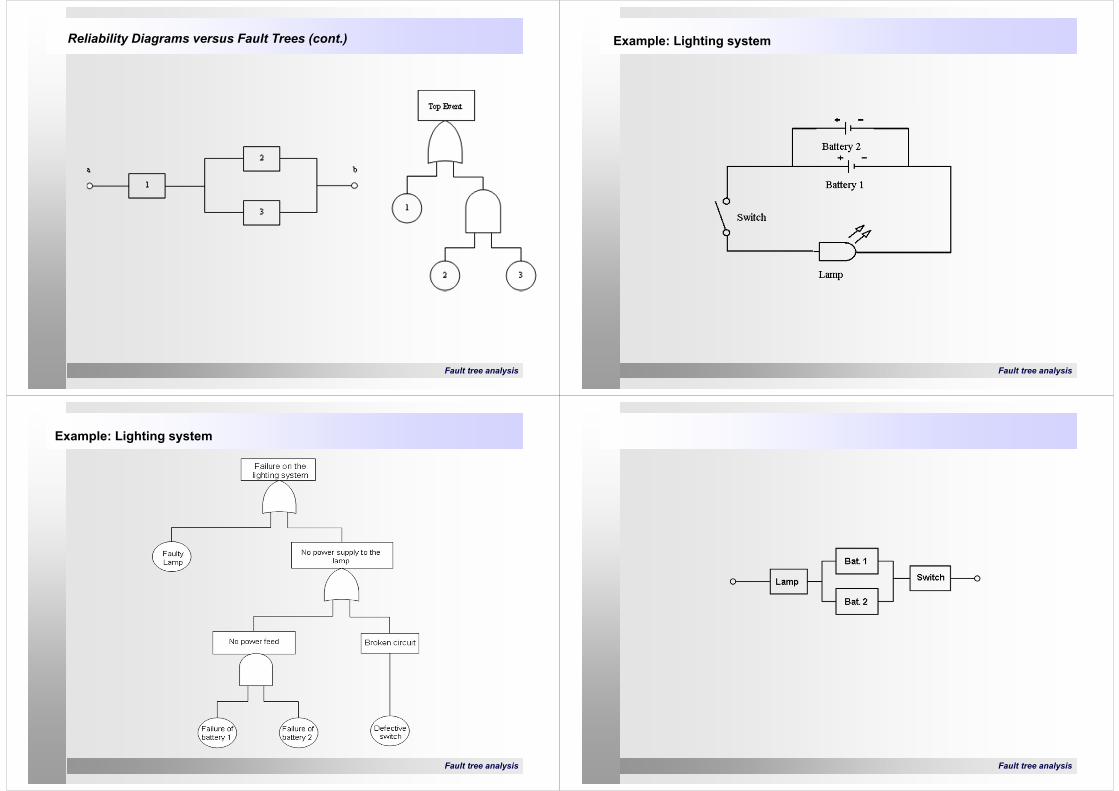
The system represented in the figure illustrates the operation of a lamp fed by twobatteries. In order to have energy in the circuit it is enough that one of the batteries works.
Build the fault tree for the event:
“ Failure of the lighting system ”
Example: FT
Fault tree analysis
Example: FT
Fault tree analysis
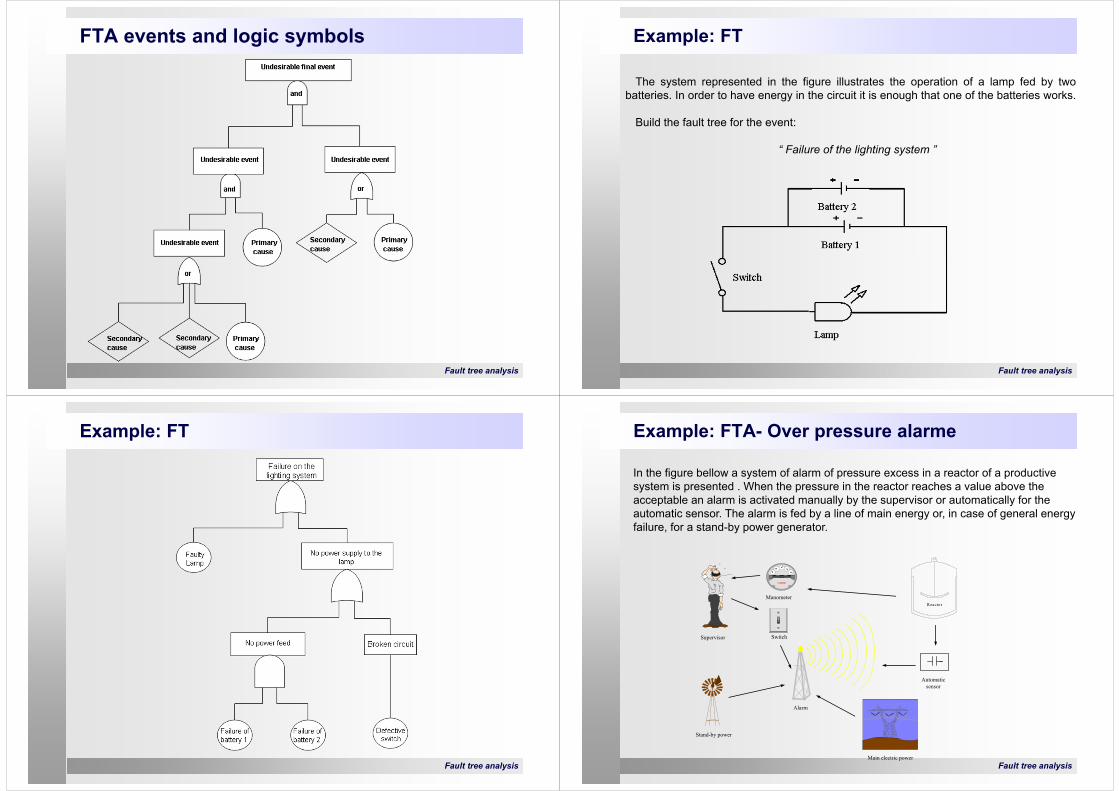
Example: FTA- Over pressure alarme
In the figure bellow a system of alarm of pressure excess in a reactor of a productive system is presented . When the pressure in the reactor reaches a value above the acceptable an alarm is activated manually by the supervisor or automatically for the automatic sensor. The alarm is fed by a line of main energy or, in case of general energy failure, for a stand-by power generator.
Reactor
Supervisor
Stand-by power
Main electric power
Automatic sensor
Manometer
Switch
Alarm
Fault tree analysis
Example: FT
Fault tree analysis
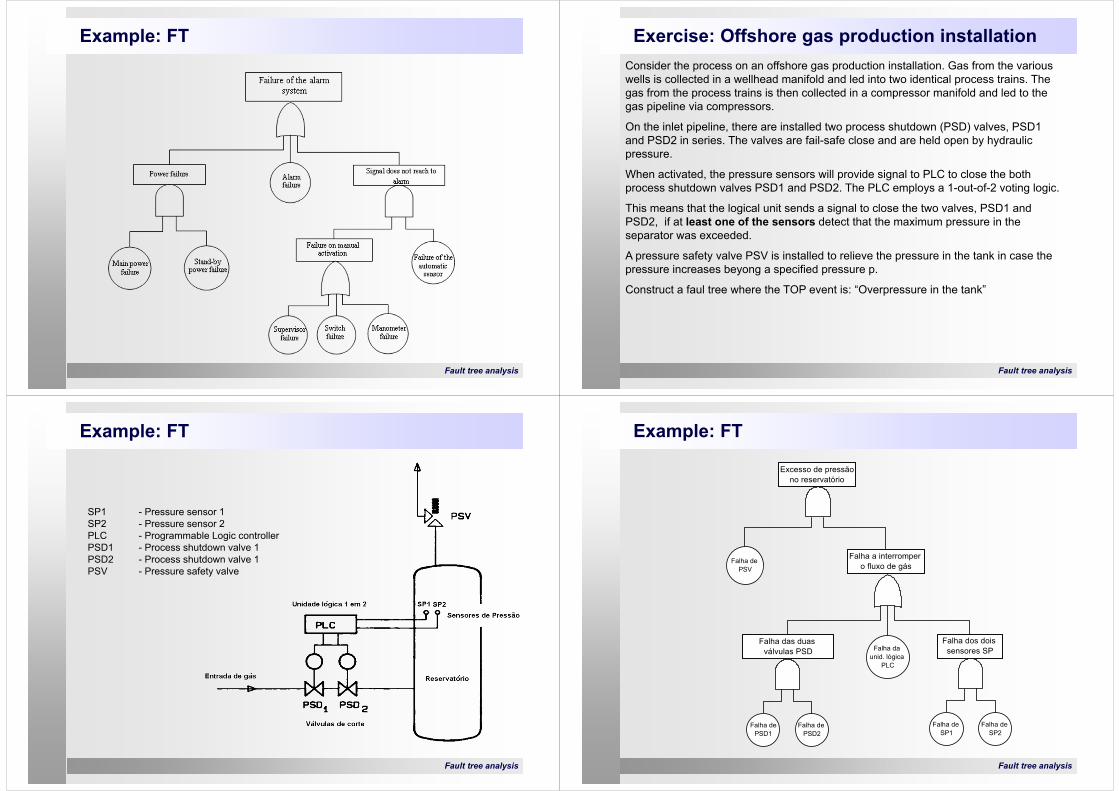
Exercise: Offshore gas production installationConsider the process on an offshore gas production installation. Gas from the various wells is collected in a wellhead manifold and led into two identical process trains. The gas from the process trains is then collected in a compressor manifold and led to the gas pipeline via compressors.
On the inlet pipeline, there are installed two process shutdown (PSD) valves, PSD1 and PSD2 in series. The valves are fail-safe close and are held open by hydraulic pressure.
When activated, the pressure sensors will provide signal to PLC to close the both process shutdown valves PSD1 and PSD2. The PLC employs a 1-out-of-2 voting logic.
This means that the logical unit sends a signal to close the two valves, PSD1 and PSD2, if at least one of the sensors detect that the maximum pressure in the separator was exceeded.
A pressure safety valve PSV is installed to relieve the pressure in the tank in case the pressure increases beyong a specified pressure p.
Construct a faul tree where the TOP event is: “Overpressure in the tank”
Fault tree analysis
Example: FT
SP1 - Pressure sensor 1 SP2 - Pressure sensor 2 PLC - Programmable Logic controllerPSD1 - Process shutdown valve 1PSD2 - Process shutdown valve 1PSV - Pressure safety valve
Fault tree analysis
Excesso de pressão no reservatório
Falha a interromper o fluxo de gás
Falha de PSV
Falha dos dois sensores SP
Falha das duas válvulas PSD Falha da
unid. lógica PLC
Falha de SP1
Falha de SP2
Falha de PSD1
Falha de PSD2
Example: FT
Fault tree analysis
Qualitative Analysis of Fault Trees
Minimal cut and path sets
Fault tree analysis
Cut SetsA cut set is defined by:
1) a set of basic events.2) the top event occurs when all the basic events occur in the cut set.
Minimal Cut SetsA minimal cut set is defined by:
1) It is a cut set.2) It is no longer a cut set whenever an event is removed from the set.
The minimal cut set is a necessary and sufficient set of basic events thatcan cause the top event.
A minimal cut set consisting of a single event is dangerous and should be eliminatedby design change
Minimal Cuts and Minimal Paths
Fault tree analysis
Path SetsA path set is defined by:
1) It is a set of basic events.2) Top event does not occur when none of the basic events in the set
occurs.
Minimal Path SetsA minimal path set is defined by:
1) It is a path set.2) It is no longer a path set whenever an event is removed from the set.
The minimal path set is a necessary and sufficient set of basic events thatensure the nonoccurrence of the top event when none of the basic events occursin the set.
Minimal Cuts and Minimal Paths
Fault tree analysis
EX:
Minimal Cut Sets
Minimal Path Sets
Minimal Cuts and Minimal Paths
Fault tree analysis
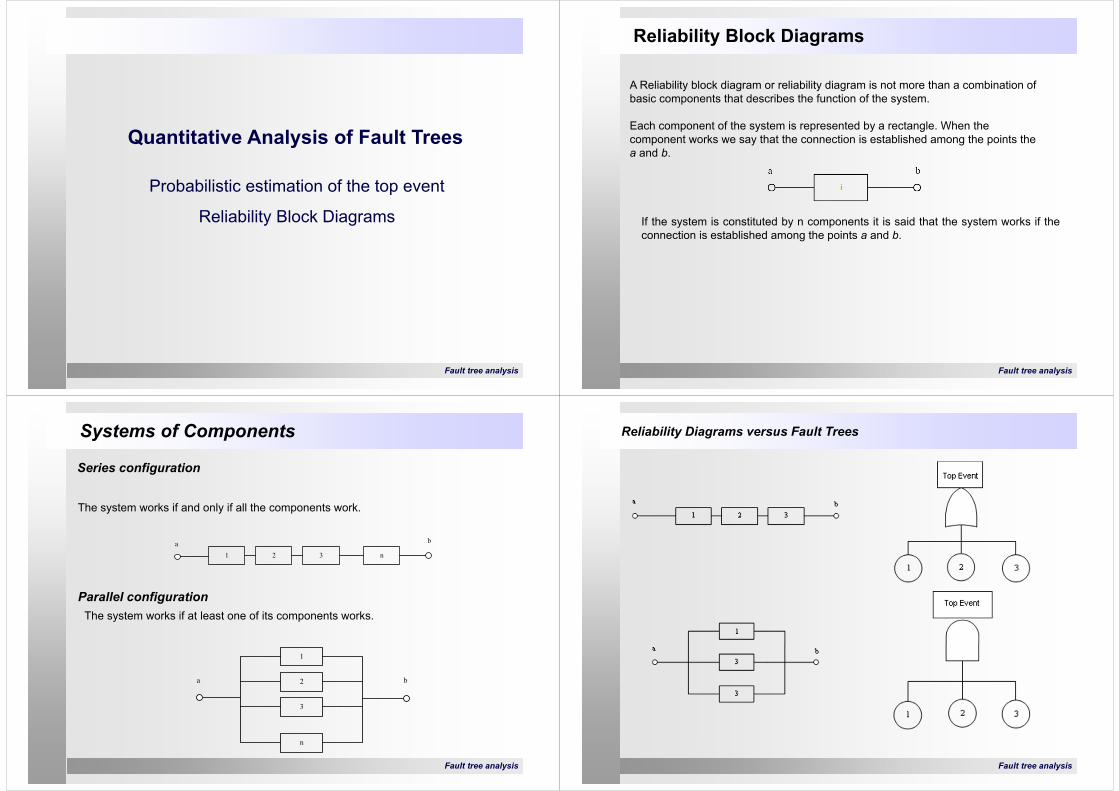
Quantitative Analysis of Fault Trees
Probabilistic estimation of the top event
Reliability Block Diagrams
Fault tree analysis
A Reliability block diagram or reliability diagram is not more than a combination of basic components that describes the function of the system.
Each component of the system is represented by a rectangle. When the component works we say that the connection is established among the points the a and b.
If the system is constituted by n components it is said that the system works if theconnection is established among the points a and b.
Reliability Block Diagrams
Fault tree analysis
The system works if and only if all the components work.
1 2 3 na b
Parallel configurationThe system works if at least one of its components works.
a
1
2
3
n
b
Systems of Components
Series configuration
Fault tree analysis
Reliability Diagrams versus Fault Trees
Fault tree analysis
Reliability Diagrams versus Fault Trees (cont.)
Fault tree analysis
Example: Lighting system
Fault tree analysis
Example: Lighting system
Fault tree analysis
Fault tree analysis
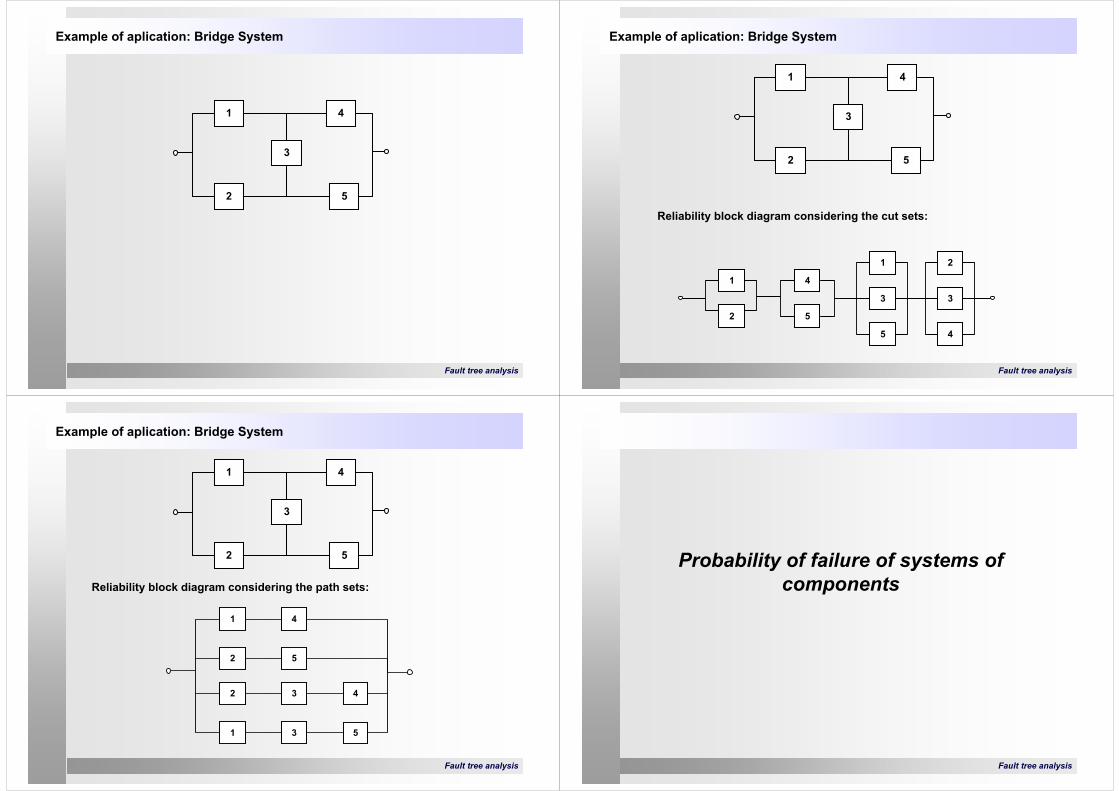
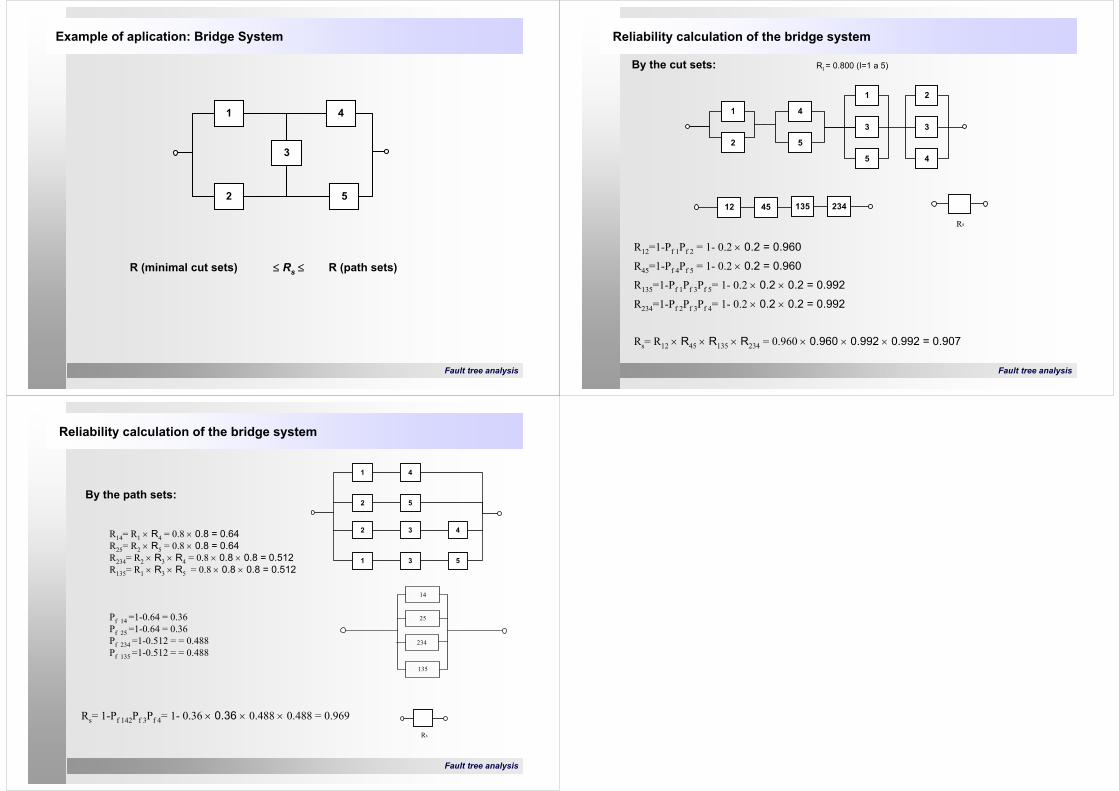
Example of aplication: Bridge System
41
3
52
Fault tree analysis
Reliability block diagram considering the cut sets:
1
2
4
5
2
3
4
1
3
5
41
3
52
Example of aplication: Bridge System
Fault tree analysis
Reliability block diagram considering the path sets:
1 4
2 5
2 3 4
1 3 5
41
3
52
Example of aplication: Bridge System
Fault tree analysis
Probability of failure of systems of components
Fault tree analysis
Basic probability concepts
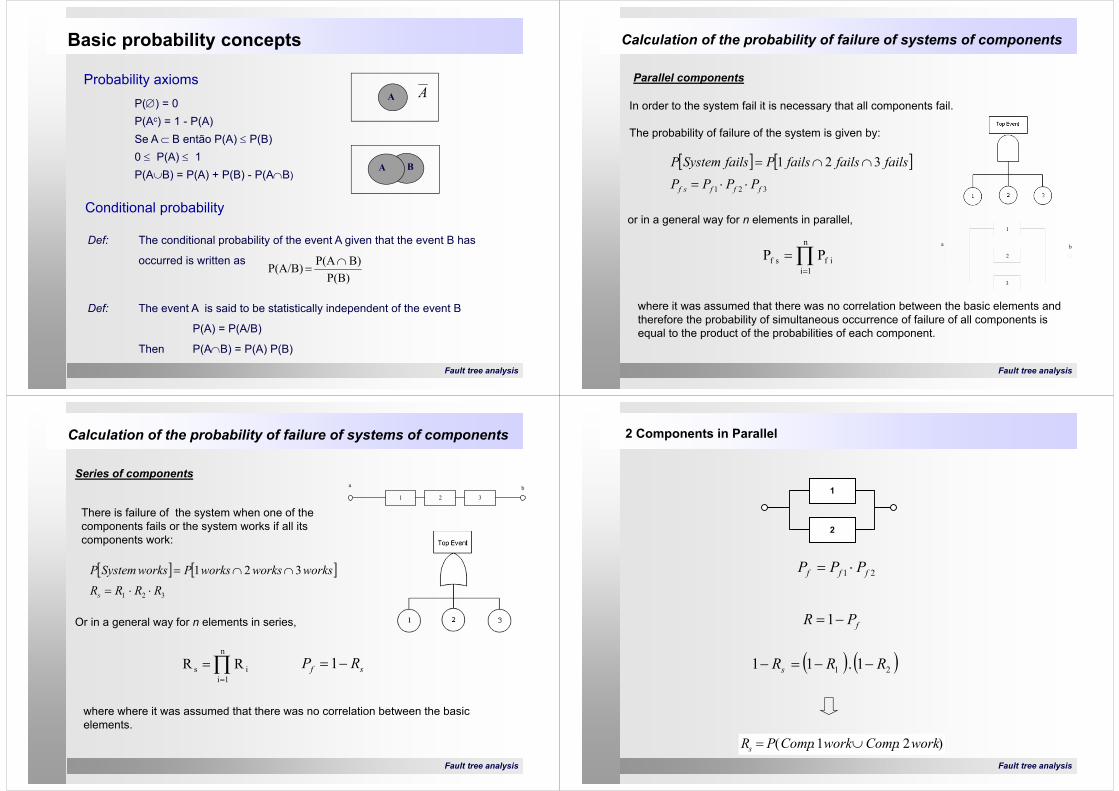
Probability axiomsP() = 0P(Ac) = 1 - P(A)Se A B então P(A) P(B)0 P(A) 1P(AB) = P(A) + P(B) - P(AB)
AA
BA
Conditional probability
Def: The conditional probability of the event A given that the event B has
occurred is written as
P(B)B) P(A P(A/B)
Def: The event A is said to be statistically independent of the event B
P(A) = P(A/B)
Then P(AB) = P(A) P(B)
Fault tree analysis
Calculation of the probability of failure of systems of components
Parallel components
In order to the system fail it is necessary that all components fail.
The probability of failure of the system is given by:
or in a general way for n elements in parallel,
n
1ii fs f PP
where it was assumed that there was no correlation between the basic elements and therefore the probability of simultaneous occurrence of failure of all components is equal to the product of the probabilities of each component.
a
1
2
3
b
321
321
fffsf PPPPfailsfailsfailsPfailsSystemP
Fault tree analysis
Calculation of the probability of failure of systems of components
Series of components
There is failure of the system when one of the components fails or the system works if all its components work:
Or in a general way for n elements in series,
where where it was assumed that there was no correlation between the basic elements.
1 2 3ba
n
1iis RR sf RP 1
321
321RRRR
worksworksworksPworksSystemP
s
Fault tree analysis
1
2
21 fff PPP
fPR 1
21 1 . 11 RRRs
)2.1.( workCompworkCompPRs
2 Components in Parallel
Fault tree analysis
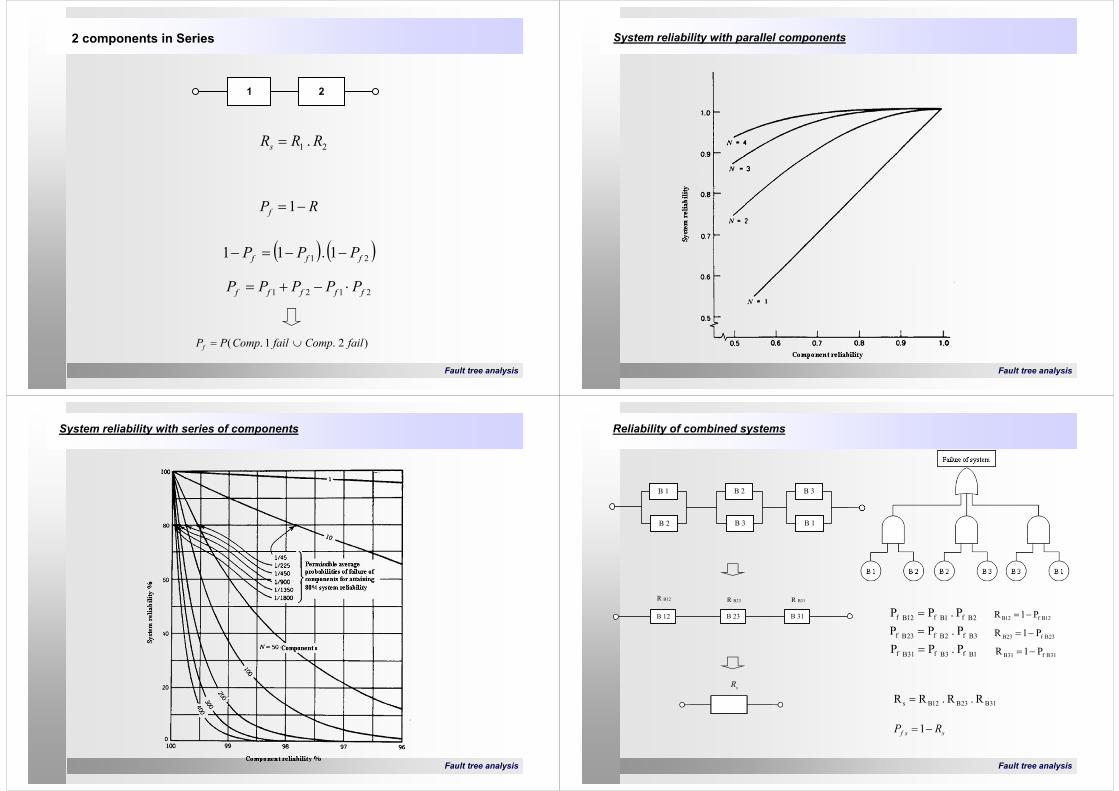
2 components in Series
. 21 RRRs
1 2
21 1 . 11 fff PPP
RPf 1
2121 fffff PPPPP
)2.1.( failCompfailCompPPf
Fault tree analysis
System reliability with parallel components
Fault tree analysis
System reliability with series of components
Fault tree analysis
Reliability of combined systems
B 1
B 2
B 2
B 3
B 3
B 1
B 12 B 23 B 31
R B12 R B23 R B31
1B f3B f31B f
3B f2B f23B f
2B f1B f12B f
P . PPP . PPP . PP
12B f12B P1R
23B f23B P1R
31B f31B P1R
R . R . RR 31B23B12Bs
1 ssf RP
sR
Fault tree analysis
Example of aplication: Bridge System
41
3
52
R (minimal cut sets) Rs R (path sets)
Fault tree analysis
Reliability calculation of the bridge system
By the cut sets: RI = 0.800 (I=1 a 5)
1
2
4
5
2
3
4
1
3
5
12 13545 234
R12=1-Pf 1Pf 2 = 1- 0.2 0.2 = 0.960
R45=1-Pf 4Pf 5 = 1- 0.2 0.2 = 0.960
R135=1-Pf 1Pf 3Pf 5= 1- 0.2 0.2 0.2 = 0.992
R234=1-Pf 2Pf 3Pf 4= 1- 0.2 0.2 0.2 = 0.992
Rs
Rs= R12 R45 R135 R234 = 0.960 0.960 0.992 0.992 = 0.907
Fault tree analysis
By the path sets:
1 4
2 5
2 3 4
1 3 5
14
25
234
135
Rs
R14= R1 R4 = 0.8 0.8 = 0.64R25= R2 R5 = 0.8 0.8 = 0.64R234= R2 R3 R4 = 0.8 0.8 0.8 = 0.512R135= R1 R3 R5 = 0.8 0.8 0.8 = 0.512
Pf 14 =1-0.64 = 0.36Pf 25 =1-0.64 = 0.36Pf 234 =1-0.512 = = 0.488Pf 135 =1-0.512 = = 0.488
Rs= 1-Pf 142Pf 3Pf 4= 1- 0.36 0.36 0.488 0.488 = 0.969
Reliability calculation of the bridge system