fatigue determination in drivers using …ethesis.nitrkl.ac.in/7709/1/2015_fatigue_mishra.pdf ·...
TRANSCRIPT

FATIGUE DETERMINATION IN DRIVERS
USING BIOMARKERS AND SUBJECTIVE
ASSESSMENT TOOLS
A Thesis Submitted In Partial Fulfilment
Of the requirement for the degree of
Bachelor of Technology in
Biotechnology
By
Ritu Mishra
Department Of Biotechnology and Medical Engineering
National Institute of Technology, Rourkela
2015

Dr. B.P. Nayak Phone No- (O) 0661-2462287
Professor (R) 0661-2463287
Dept. of Biotechnology and
Medical Engineering, Mail ID: [email protected]
National Institute of technology,
Rourkela, 769008
CERTIFICATE
This is to certify that the work in the thesis entitled “Fatigue determination in drivers using
biomarkers and subjective assessments” by Ritu Mishra in partial fulfilment of the
requirements for the award of the degree of Bachelor of Technology in Biotechnology
Engineering in the department of Biotechnology and Medical Engineering, National Institute
of Technology Rourkela is an authentic research work carried out by her under my
supervision and guidance.
To the best of my knowledge, the matter enclosed in this project work has not been submitted
by any other university/institute for the award of any degree.
Date:
Dr. Bibhukalyan Prasad Nayak
Asst. Professor
Dept. of Biotechnology and Medical Engineering
NIT Rourkela-769008, Odisha

CONTENTS
Acknowledgement i
List of figures ii
Abstract iii
Chapter-1 Introduction 1
Chapter-2 Objective 5
Chapter-3 Literature Survey 7
Chapter-4 Materials and Methods 11
4.1 Materials 12
4.2 Simulator setup 11
4.3 Subjects 13
4.4 Experimental design 13
4.5 Blood sample collection 14
4.6 Measurement of blood biomarkers 14
4.6.1 Serotonin 14
4.6.2 CK-MB 15
4.6.3 Lactic Acid 16
4.7 Subjective Assessment Tools 17
4.7.1 Demographics 17
4.7.2 Epworth Sleepiness Scale (Johns, 1991) 17
4.7.3 Berlin Questionnaire (Netzer et al., 1999) 18
4.7.4 Beck Depression Inventory 18
Chapter-5 Results 19
5.1 Blood biochemical parameters 20

5.1.1 Serotonin content in whole blood 20
5.1.2 CK-MB level in serum 21
5.1.3 Lactic acid content in plasma 21
5.2 Subjective assessments 23
5.2.1 Demographics 23
5.2.2 Epworth Sleepiness Scale (Johns, 1991) 23
5.2.3 Berlin Questionnaire (Netzer et al., 1999) 25
5.2.4 Beck Depression Inventory 27
5.3 Pearson Correlation 28
Chapter-6 Discussion 29
Chapter-7 Conclusion 33
References 35
Appendix 39

i
Acknowledgement
I take the chance to express my appreciation and obligation to people who have been
included in my project work right from the start to the end.
First of all, I take this opportunity to express my profound feelings of appreciation and
significant respects to my supervisor Dr. B.P. Nayak, Professor of Department of
Biotechnology and Medical Engineering, NIT Rourkela, for his esteemed direction and
respectable supervision amid the emergence of this work. I additionally express gratitude
towards him for helping me to enhance my errors all through the undertaking work and
rousing me towards instilling an exploratory demeanour and keeping my interest alive in the
work and also for being approachable and congenial at all the times.
I am additionally grateful to all other professors of Department of Biotechnology and
Medical Engineering, NIT Rourkela for stretching out full help to use the laboratory facilities
and for providing with steady moral support.
I would also use this chance to extend my earnest to Rakesh Buhlan and Vinay Kumar for
their constant support and aid in the project work throughout.
At long last I want to express my generous thanks to all my batch-mates and others in the
department for their co-operation and encouragement which helped in completion of this
project.

ii
List of Figures
Figure No. Title Page No.
Figure 1 Serotonin levels in blood at 0, 6 & 12 hours 20
Figure 2 CK-MB levels in blood at 0, 6 & 12 hours 21
Figure 3 Lactate concentration in blood at 0, 6 & 12 hours 22
Figure 4 Mean scores of situations on Epworth Scale 24
Figure 5 Mean Scores of Berlin Questionnaire 26

iii
Abstract
Fatigue is a condition of extreme tiredness, resulted from physical or mental stress due to
prolonged monotonous and stressful work with/without sleep deprivation. It can originate
centrally or peripherally due to a multitude of inducing factors like excessive physical
activity, peer-pressure, undue stress, tight schedules etc. Fatigue in specific occupations like
driving can be hazardous by increasing the risk of road traffic accidents. In case of drivers, it
is recorded the most for the ones who drive for long distances, or drive heavy-vehicles or the
ones who are seasoned drivers. The driver shows symptoms like sleepiness, loss of pleasure,
slower reaction/reflex, pessimism, inattentiveness and irritation. According to WHO report,
road traffic injuries are the 6th leading cause in India. And conferring to a study done by JP
Research India, over a span of 2 years, fatigue was the leading cause contributing to 29% of
the total accidents. But there is still no defined machinery to monitor a driver’s fatigue in real
time. In order to get an estimate of physical fatigue in drivers, appropriate study is essential.
In the current study, an attempt was made to quantify physical fatigue in healthy non-trained
subjects during simulated driving session of 12 hours at a stretch. The goal was to observe
and estimate the progress of fatigue in the subjects out of driving task. Briefly, 10 male
healthy subjects with mean age of 25 ± 4 years were selected. During 12 hours of driving on
the simulator, blood samples were collected at 6 hours intervals from each subject, for
estimation of Serotonin, CK-MB and Lactic acid. The subjective feeling of stress and fatigue
was evaluated in the participants using subjective assessment tools like Epworth Sleepiness
Scale, Berlin Questionnaire (for sleep apnoea) and Beck Depression Inventory (mood
disturbance). All the biochemical parameters increased significantly as fatigue progressed.
The subjective assessment scores also indicated the fatigue progress and strongly correlated
with the biochemical parameters.
Key words: fatigue, drivers, stress, serotonin, CK-MB, lactic acid, subjective assessments

1
Chapter 1
Introduction

2
In physiological terms, fatigue is defined as the reduced capability or complete inability of an
organism or one its parts to function normally [2]. It is usually due to extended hours of
uninteresting work, stressful jobs, absence of proper ventilation, exposure to environmental
factors like heat, noise, vibration, etc. Few major symptoms of fatigue are drowsiness, poor
judgement, daydreaming, trouble in focussing, etc. The expanding number of transportation
mishaps has turned into a significant issue for society. The car crashes will be generally
diminished if discovering a judging standard to figure out if drivers stay alert or not, and
make a notice to the drivers when they start to nod off, so it is important to research
weariness location calculation which is likewise a key innovation in shrewd vehicles driving
[18]. The driver weariness issue has turned into an essential component for bringing about car
crashes. Driver weariness is a real reason for auto mishaps, since lethargic drivers are not
able to settle on fast choices, and they may have slower response times. Therefore, numerous
administrations have training system to alarm individuals to the perils of driving while tired,
and drivers are urged to dodge conditions which may prompt driver weariness. Accordingly,
how to direct and keep away from exhaustion and driving proficiently is one of the critical
issues.
Fatigue has a very complex origin and is caused due to a combination of both central and
peripheral factors. Hence, it has been neatly divided into Physical (or Peripheral) fatigue and
Central Fatigue. Peripheral Fatigue (PF) occurs due to dysfunction of the muscles or
impairment in neuromuscular transmission. It’s caused after long hours of recreation,
physical exertion, etc. Central Fatigue (CF) occurs due to specific alterations in the central
nervous system and could originate because of stress, depression, boredom, sleep deprivation,
etc. It basically results from impaired functioning of the central nervous system and even
though it might not affect muscles directly, it reduces the capacity to work. The central
fatigue starts at molecular level much before the symptoms occur. Of all the

3
neurotransmitters responsible for CF, Serotonin or 5-HT (5-hydroxytryptamine) is the most
studied one [12]. The Serotonergic system has been suggested as an important modulator of
mood, emotion, sleep, appetite, and thus has been implicated in the control of numerous
behavioural and physiological functions. 5-HT is unable to cross the Blood-Brain-Barrier
(BBB), therefore cerebral neurons are required to synthesise it for themselves which
increases the amount of Tryptophan (TRP). TRP is the precursor for synthesis of Serotonin,
hence plays an important role by synthesis and release of 5-HT in the brain [13]. This brain
5-HT is involved in control of tiredness, stimulation and mood, hence linked with central
fatigue during sustained exercise. Meanwhile, Lactic acid is produced during chemical
processes in the body when too little oxygen is present for usual processes (anaerobic
metabolism). It serves as a major factor in muscle cramps and is produced in the tissues when
conditions such as heart attack or shock reduce the blood supply responsible for carrying
oxygen [16]. CK-MB is recognised as the leading cardiac serum marker and its determination
has been proven to be more specific for myocardial necrosis. It is released after Myocardial
Infarction and is detectable in plasma as early as 3-4 hours after the onset of symptoms.
Elevated CK-MB levels have been reported in significant percentages of patients with acute
skeletal muscle trauma (59%), chronic muscle disease (78%) and chronic renal failure
(3.8%). This is a notable shortcoming since its determination isn’t tissue-specific [17]. Any
condition that causes muscle damage or interferes with muscle energy production can cause
increase in CK levels.
Of the salivary segments analysed till today, Melatonin has demonstrated most encouraging
as an immediate measure of circadian beat [19]. Levels of cortisol in serum and spit are
known to be impacted by various figures expansion to circadian rhythms, including a mixed
bag of intense and constant stressors, for example, a sleeping disorder, obstructive sleep
apnoea, dejection and incessant weakness [20, 21]. Techniques to measure drowsiness have

4
emerged from different behavioural, electrophysiological, hereditary, proteomic and
metabolomics investigations of slumber and lack of sleep. Techniques for evaluating dozing
risks have been proposed in light of changes in behavioural components, for example,
reaction time. After a certain tranquil period, subjects finished the Profile of Mood States
(POMS) review for appraisal of exhaustion level and Stroop Color-Conflict Test (Stroop
tests) for evaluation as subjective assessments [22]. While the Stroop tests are known to be
affected by learning impacts, they were chosen for their simplicity of organization to
gatherings of the size utilized as a part of this study.
Tiredness has more prominent impact on principle construct driving undertakings than in
light of aptitude based errands, in spite of the fact that ability based assignments can't be
utilized to give early markers of tired driving, deterioration of such errands may demonstrate
the presence of other driving hindrances, for example, intoxication [4]. Fatigue can be treated
by taking proper rest because sleep restores the normal functionality of the nervous system.
And since it increases the risk of mishaps in roadways, aviation and military sector, it is
essential to study the effects of sleep deprivation on performance, in order to develop
methods to fight fatigue.

5
Chapter 2
Objective

6
The objectives of the study are:
To quantify the progress of fatigue in non-trained drivers during simulated driving by
using biochemical parameters (Serotonin, CK-MB, Lactic acid)
To undertake subjective assessment of fatigue by use of subjective assessment tools
namely Epworth Sleepiness Scale, Berlin Questionnaire and Beck Depression
Inventory
To make a correlation between the objective and subjective parameters

7
Chapter 3
Literature Survey

8
Over the past few years, there has been a lot of research done on occupational drivers health
and work safety associated with driver’s fatigue [1]. It is one of the biggest problems of
roadways. The impact of drivers fatigue isn’t trivial and hence there have been a lot of studies
done on it. One study showed that if a person is kept awake for a night, his performance
levels are as impaired as someone with high alcohol concentration in blood. There was a
done by Harvard Medical School which suggested that 28% of adult drivers fell asleep during
driving and 54% of them had feelings of drowsiness while they were handling the stick [5]. A
study by Foret and Latin showed that train drivers feel sleepy during their work time due to
their tight schedules. It deteriorated the quantity and quality of sleep which elevated their
fatigue. Several other studies have advocated incidences of uncontrolled attacks of sleep
during driving. There was a study that showed 50% of the road accidents were fatigue related
on two of America’s busiest roads [3]. An Australian road safety organisation estimated that
30% disastrous crashes, 15% fatal accidents and 6% road mishaps were due to driver’s
fatigue. A World Health Organisation report of 2009 suggested that more people in India died
due to road accidents than anywhere else in the world. So clearly, it’s an important issue
which raises serious questions regarding driver’s fatigue and safety.
In different nations, studies show that male youthful drivers are more inclined to rest-related
crashes because of their hectic schedules and propensity to drive high mileage on roads. It
was also found that sleep related accidents were at peak in the early morning hours, i.e. from
2:00 Hours to 6:00 Hours [6]. According to a study done by Horne, it was found that drivers
were more prone to falling asleep at wheel at dusk than at 10 Hours. The probability of
falling asleep on a monotonous road was also high in case of a long journey. New studies
suggest that brain function is impaired at an equivalent level as it would be after staying
awake for 17-19 hours. And the amount is equivalent to what 50-60 mL of alcohol would
induce [7]. Driving for long hours is bound to be a monotonous exercise which comes with
9
sleep deprivation; hence it induces fatigue as it ascends gradually in cerebral metabolism [8-
10].
Different blood biochemical parameters especially the neurotransmitters and their metabolic
products- Lactic acid, CK-MB and Serotonin whose content in blood speaks of them either
being the inducers or the result of events prompting exhaustion. These biochemical
parameters suggest the gradual onset and progress of fatigue. There are also speculations of
whether Serotonin levels really get affected or not with ascend in fatigue; and that if Lactate
has a threshold which it jumps and then starts increasing rapidly. Hence we take samples at
smaller time intervals and keep the demographics as similar as possible.
Aside from the blood biochemical parameters, the subjective evaluation of the people can
likewise advocate for the level of weakness, or depression or sleepiness. These assessments
give us a fuller and clearer picture of why and how fatigue affects our activities. The Beck
Depression Inventory mirrors the slow increment in the depression and lethargy alongside the
progress of fatigue. Aside from this Epworth Sleepiness Cycle and the Berlin questionnaire
give us an idea of the sleepiness and its risks on the test subjects, according to defined scales.
Hence, we get an outlook of all the changes in parameters that come alongside fatigue
genesis and its following staging.
Yuan-Pang Wang and Clarice Gorenstein did an experiment to perform a systematic review
of the utility of the BDI for detecting depression in medical settings, which was reformulated
according to the DSM-IV criteria for major depression. They concluded that the Beck
Depression Inventory-II can be easily adapted in most clinical conditions for detecting major
depression and recommending an appropriate intervention [24]. Lethargy and exhaustion are
thoughtfully particular however pervasively frustrated in research, estimation instruments,
clinical settings, and ordinary daily language. ESS is limited to the experience of daytime
sleep tendency. The vital clinical ramifications of ESS are in the capacity to recognize

10
"drowsiness which is not fatigue," a construct nearly identified with essential sleep disorder
[25].
In this work, an effort has been made to measure the different blood biochemical parameters
and subjective estimation at the same time. In every type of estimation, various variables
have been examined and their connection with fatigue progression has been assessed.

11
Chapter-4
Materials and Methods

12
This chapter describes the materials, methodology and the protocols followed for the
estimation of the biochemical parameters, the set-up of the simulator for the fatigue study.
4.1 Materials
All the examine packs utilized for the investigation of the different biochemical
parameters are affirmed for IVD (in-vitro diagnosis).
The Serotonin ELISA pack was obtained from Labor Diagnostika Nord GmbH & Co.
KG.
The CK-MB unit was acquired from Coral Clinical frameworks and the Lactic Acid
pack was obtained from Randox research centres.
The pipettes and eppendorfs were acquired from Tarsons.
The blood accumulation tubes and expendable syringes were acquired from BD
Biosciences (India).
For the colorimetric investigation of the blood test, a mechanized biochemical
analyzer (EVOLUTION 3000) was utilized.
4.2 Simulator Setup
The test system comprise of a PC (detail), truck test system programming (EURO TRUCK),
a product good guiding wheel (900º turn) with a vibration leg cushion and water driven
slowing mechanism (Driving Force GT, Logitech, India), a LCD projector, a HD Sound
framework (INSPIRE M 4500™, CREATIVE) and a screen. The test system module
alongside the varying media unit was introduced in the PC. The projector and the screen were
set in such ways that, the driver can get a reasonable vision. The entire setup was organized
keeping drivers ergonomics in perspective.
13
4.3 Subjects
10 healthy male individuals of diverse age groups (25 ± 4) were undertaken for the study and
were made to drive under stimulated laboratory environment. They were told of all the pros
and cons of the study in order for them to make an informed decision. Since driver fatigue is
a consequence of a few variables, for example, sporadic driving calendar, long time driving,
lack of sleep, physical and mental conditions and so forth, the comparative conditions were
re-enacted in the research centre environment by articulating volunteers to experience dreary
activity with lack of sleep. Before the investigation, the subjects experienced strict clinical
examination by enlisted therapeutic professionals and were announced sound. An educated
assent in composed structure was acquired from every subject. Their blood tests were
collected in occasional interims for the estimation of different blood biochemical parameters
to get the genesis and dynamic phases of fatigue improvement.
4.4 Experimental Design
The trial was led under research facility stimulatory conditions with one subject in a solitary
session. The whole investigation was subdivided into different stages (for each person,
beginning time of different stages were: Stage1- 9:00Hrs, stage2-15:00Hrs; Stage3-
21:00Hrs), and in every stage the individual was requested to perform virtual driving on test
system to produce mental and also physical exhaustion. Before the analysis the people were
requested that perform their typical regular movement aside from specific exercises like
dozing toward the evening, any utilization of liquor, caffeine, and tobacco and so forth. Just
before the beginning of the stages, every member was subjected to a progression of survey
for their subjective evaluation before actuation of any weakness. Likewise, the first blood test
was gathered (that serves as the control) and the second blood test was trailed by snacks. The
subjects were kept conscious amid the entire session of the driving reproduction. The

14
progressive blood tests were gathered at 9:00Hrs, 15:00Hrs, and 21:00Hrs to watch the
impact of exhaustion on biochemical parameters. In the meantime the subjective appraisal
was additionally rehashed in the meantime purposes of blood gathering. They were likewise
made to experience tedious activity at customary intervals consequently with lack of sleep
and repetitive activity, a replica of exhaustion condition was re-enacted in vitro.
4.5 Blood Sample Collection
The blood sampling was done three times throughout the experiment from all the individuals.
Briefly a tourniquet was wrapped around either arm (left or right arm altering at each time
point) of the individual and was asked to flex the elbow as well as the fingers. From the
anterior region of the elbow, 5ml of blood was collected by puncturing the brachial vein
through 5ml disposable syringe fitted with 22G needles (BD Biosciences, India) after
sterilizing it with a cotton swab soaked with 70% alcohol. 2ml of the blood was collected in a
tube containing clot inhibitor (Na-EDTA) to obtain whole blood, and the remaining 2ml was
collected in tubes containing clot activator (coated with Silicone gel, AkuSet™, Eastern
Medikit Limited) to obtain serum, for the biochemical and the immunological assays. The
samples were vortexed 8 times for proper mixing followed by preservation in refrigerator at
2-8ºC. Later the samples were analysed for various blood biomarkers.
4.6 Measurement of Blood Biomarkers
The blood test was centrifuged at 400 rpm for 10 minutes and afterwards the plasma was
gathered.
4.6.1 Serotonin Estimation
Serotonin Estimation was done by ELISA test using the kit acquired. The concentrations
were measured by competitive ELISA, after the samples were prepared according to the
guidelines provided in the kit.

15
4.6.1.1 Procedure
Wavelength/filter: 505nm/green
Temperature: 37ºC
The standards were prepared. The sample collection was done and those were stored till
further estimation. Acylation was done in acylation tubes by making three samples for each
reading, namely Diluted Standard, Diluted Controls and Samples. To each tube, 25uL of
acylation buffer was added. Those were mixed shortly and incubated for 15-20 hours at 2-8oC
and then washed using wash-buffer concentrate. The enzyme conjugate was added and the
samples were incubated for 30mins at room temperature on a shaker. Substrate was added
and again the samples were stored for 30mins at room temperature. The stop solution was
added and the absorbance was read at 450nm.
4.6.2 CK-MB Estimation
CK-MB estimation was done with the assistance of a semi-automatic Biochemical Analyzer
(Evolution 3000) and the required merchandized kit.
4.6.2.1 Procedure
Wavelength: 340nm
Temperature: 370 C
Clean dry eppendorfs were taken and labelled as test (T). The subsequent addition sequence
was followed: 0.8mL of L1 (as named in the kit) was added to the tube, followed by 0.5mL
of the sample. It was then incubated at assay temperature for 5mins. Then, 0.2mL L2 was
16
added and mixed well. The tubes were left for 5mins for proper reaction at room temperature.
Absorbance readings were noted after every 1, 2 and 3mins.
4.6.3 Lactic Acid Estimation
The lactate concentration in blood was done by preparing the standards and samples
according to the kit acquired and reading its absorbance and concentration using a micro-
plate reader.
4.6.3.1 Procedure
Wavelength: 550nm
Temperature: 37o C
Two tubes were taken i.e. for Standard and Reagent. In Standard, only 10uL of the standard
provided in the kit was used whereas for the Sample, 10uL of the plasma was taken. To each
tube, 1000uL of the reagent (provided) was added. They were incubated for 5mins at room
temperature and absorbance of sample and standard was measured within 30mins.

17
4.7 Subjective Assessment Tools
The subjective assessments of fatigue takes into account a set of questionnaires which were
asked to every subject towards the end of every step. For this appraisal, three standard
conventions were taken. To be specific, Epworth sluggishness cycle that is a subjective
measure of comprehending somebody's sleepiness. Beck Depression Inventory (BDI-II),
which comprises 21 multiple-choice self-reportable inquiries, have an essential aphorism to
gauge the seriousness of depression and disinterest from the present undertaking in the
subject; Berlin Questionnaire which is essentially used to focus the degree of torment and
inability out of an intervention. All these evaluation instruments were slightly changed
according to the necessity of the present study.
The inquiries were asked in a cooperative environment and the scoring was done on the
consolidated perspective of the subject's self-assessment and the perception of one of the
individuals from the examination group.
4.7.1 Demographics
The participants in this project work were between the ages of 21-30. All the participants in
the study were Male and were tested healthy. Subsequently, a record of the demographics has
been maintained. The assessments used were quite simple and understandable, so all the
returned forms could be studied easily.
4.7.2 Epworth Sleepiness Scale
It is a self-directed test. It is generally utilized as a part of the field of sleep-medicine as a
subjective measure of understanding someone's drowsiness. The test comprises of eight
circumstances in which you rate your propensity to wind up drowsy on a size of 0, no shot of
18
snoozing, to 3, high risk of napping. When one completes the test, the assigned values of
their reactions were summed up. The aggregate score is in view of a size of 0 to 24. The scale
gauges whether subject is encountering excessive tiredness that commands any medical help.
4.7.3 Berlin Questionnaire
The Berlin Questionnaire is a basic sleep apnoea screening poll used to rapidly identify the
danger (low to high) of sleep disturbed breathing, i.e. it is utilized to recognize the danger of
sleeping issues and the disorders. The questionnaire comprises of 3 classes and the danger is
in light of the reactions to individual questions and general scores in the symptom categories.
4.7.4 Beck Depression Inventory
Beck Depression Inventory is a set of questionnaire used for the evaluation of depression
level in patients, experts and so on [11]. The latest form (BDI-II) is a nonexclusive
instrument that can be utilized on various age groups over thirteen, and is made out of polls
that identify with melancholy level (sadness, irritation and so on.) , perceptions (guilty
feeling, self-dislike, feelings of punishment and so forth) and additionally, if any physical
side effects.

19
Chapter-5
Results

20
The result section is divided in two parts.
1. Blood Biochemical measures
2. Subjective assessment Results
5.1 Blood biochemical parameters
5.1.1 Serotonin level in whole blood
The Serotonin level in blood was examined and hence, the average value of Serotonin was on
decrease as the day advanced and the fatigue grew and sleep deprivation increased. It was
found out to be 13.0670 ± 7.8378 at Stage 1, 69.4750 ± 48.7631 at Stage 2 and 181.0813 ±
100.7798 at Stage 3. The standard error of difference was negligible and hence the data was
statistically extremely significant according to the t-test. Earlier researchers have found that
Serotonin affects the mood and its level changes results in fatigue and bad mood.
Figure 1: Serotonin levels in blood at 0, 6 & 12 hours
0
50
100
150
200
250
300
1 2 3
Sero
ton
in C
on
c.
Stages

21
5.1.2 CK-MB level in plasma
The CK-MB level in plasma increased gradually with time, due to sleep deprivation. At Stage
1, it was found to be around 0.2111 ± 0.0675, at Stage 2, around 0.4678 ± 0.0616 and at
Stage 3, around 0.7476 ± 0.2724. The increase in concentration of CK-MB is a critical
parameter of peripheral fatigue that includes muscle damage which thus may have surcharged
the kidneys. The increment in this peripheral marker indicates weariness and can be clarified
by spread of steady central fatigue to the periphery which thus prompts muscle protein
degradation. Any condition that causes muscle damage or interferes with muscle energy
production can cause increase in CK-MB levels.
Figure 2: CK-MB levels in blood at 0, 6 & 12 hours
5.1.3 Lactic acid content in plasma
The lactic acid content in blood showed a great variation with fatigue development in the
subjects. Consequently, the results were on an average of 38. 4867 ± 2.6692 in Stage 1;
0
0.2
0.4
0.6
0.8
1
1.2
1 2 3
Leve
ls o
f C
K-M
B
Stages

22
54.9467 ± 6.8452 in Stage 2; and 82.2344 ± 13.5272 in Stage 3. Hence we can see that lactic
acid was continuously being produced as the person was getting fatigued. We know when
oxygen levels are low, pyruvate converts to lactic acid. High blood lactate levels, together
with decreased oxygen in tissues, now we can say is also caused by strenuous exercise or
damage to the heart.
Figure 3: Lactate concentration in blood at 0, 6 & 12 hours
0
20
40
60
80
100
120
1 2 3
Lact
ate
Le
vels
in
pla
sma
Stages

23
5.2 Subjective Assessment
5.2.1 Demographics
The test subjects of the study were between the age groups of 21 to 30; 6 of them being of
21-25 age whereas the other 4 being of the 26-30 age group. All of them were male. The
experience of the majority differed as 60% of the subjects had below 1 year of experience
and 40% had an experience between 1 to 5 years. 80% of the subjects had experienced
fatigue before and all of them admitted to having their fatigue affect their performance at
work. Some of the common reasons of fatigue were listed to be daily monotonous work,
sleep debt, stress, heavy work-load, etc. None of them had been diagnosed with narcolepsy,
restless leg syndrome and central sleep apnoea, prior to this experiment. The number of
people who admitted that fatigue had affected their work-performance was 8.
There were 6 subjects aged 21-25 whereas the rest 4 were between the ages of 26-30.
Some study-subjects also recorded meals or late meals, tight schedule, night shifts, difficulty
in sleep, disturbed sleep pattern, inadequate medical care, etc. as reasons for their fatigue.
5.2.2 Epworth Sleepiness Cycle
The average scores for people who would have high chances of dozing if they lie down in the
afternoon was recorded to be the highest at 2.8, with a standard deviation of 0.4216. Then,
the people who were most likely to fall asleep were the ones who would doze off during
sleeping and reading or during sitting quietly after lunch. The least likely activity which
would make anyone sleepy was talking to someone.

24
ESS Distribution Table of Test Subjects
SITUATION MEAN SD
Sitting and Reading 1.5 1.1785
Watching television 0.5 0.7071
Sitting, inactive in a place 1.3 0.8232
Passenger in a car for an hour 1.5 0.7071
Lying down to rest at noon 2.8 0.4216
Talking to someone 0.2 0.4216
Sitting quietly after lunch 1.5 0.5164
Figure 4: Mean scores of situations on Epworth Scale
0
0.5
1
1.5
2
2.5
3
Sitting andreading
WatchingTV
SittingInactive in
a publicplace
Passengerin a car
without abreak
Lyingdown torest in
afternoon
Sitting andtalking tosomeone
Sittingquietly
after lunch
In a car,whilst
stopped ata a traffic
Mea
n

25
5.2.3 Berlin Questionnaire
Used to test sleep apnoea, Berlin Questionnaire (BQ) has a set of 10 questions, divided into 3
categories. There is a simple scoring scheme:
A B C D E
1. 1 point -- -- -- --
2. -- -- 1 point 1 point
3. 1 point 1 point -- --
4. 1 point --
5. 2 points 2 points -- -- --
If Score > 2 till now, Category A is positive
6. 1 point 1 point -- -- --
7. 1 point 1 point -- -- --
8. 1 point --
If Score > 2, Category B is positive.
9. Answers to be noted and discussed separately
10. Observations to be noted separately
High Risk if 2 or more categories are positive
Low risk if 1 or no category is positive
The overall observations made showed that 40% of the study subjects were under high risk of
sleep apnoea and 30% were under low risk. The mean values for people who snore and their
frequency of snoring being the highest at 1.5 with standard deviations of 0.4830 and 0.4538
respectively. The rest of the distribution is shown in the table below:

26
Distribution Table of Berlin Questionnaire
LIST MEAN SD
Do you snore? 0.7 0.4830
Loudness 0.1 0.3162
Frequency 0.7 0.4538
Bother others 0.6 0.5164
Quit breathing 0.2 0.6324
Feel tired after sleep 0.6 0.5071
Feel fatigued after waking up 0.5 0.4829
Nodded off while driving 0.2 0.4216
Frequency 0.1 0.1438
High Blood Pressure 0.7 0.4879
Figure 5: Mean Scores of Berlin Questionnaire
0
0.1
0.2
0.3
0.4
0.5
0.6
0.7
0.8
Mea
n

27
5.2.4 Beck Depression Inventory
It is a scale which tests how depressed a person is. This was very important to the study to
record the change in mood and depression levels of the test subjects, during simulated
driving. This would give us a bigger and clearer picture of why the biochemical parameters
are affected. Most of the subjects were recorded to have mild depression at the start of the
study, i.e. comprised as sample study. The results showed that 10% of the subjects had mild
depression, 40% had moderate depression while the rest 50% had severe depression, towards
the end of the study. According to Beck Inventory, depression has two constituents namely,
Affective component which consists of eight items i.e. mood/pessimism, feelings of past
failure, guilty feeling, punishment-like feeling, self-hatred, self-criticalness, worthlessness,
suicidal feelings; whereas the Somatic component consists of loss of pleasure, sadness,
agitation, loss of zeal and energy, sobbing, loss of interest, prickliness, change of appetite,
vagueness, tiredness, concentration difficulties, change in sleep pattern and loss of
interest[22][23].
Distribution Table of Beck Depression Inventory
ATTITUDE MEAN STANDARD DEVIATION
Mood 1.9 0.9944
Pessimism 1.5 0.5270
Past failure 1.4 0.6992
Loss of pleasure 2.1 0.5676
Guilty feeling 1.6 0.8432
Sense of punishment 2 1.0540
Self-hatred 1.7 0.6749
Self-criticalness 1.9 0.8756
28
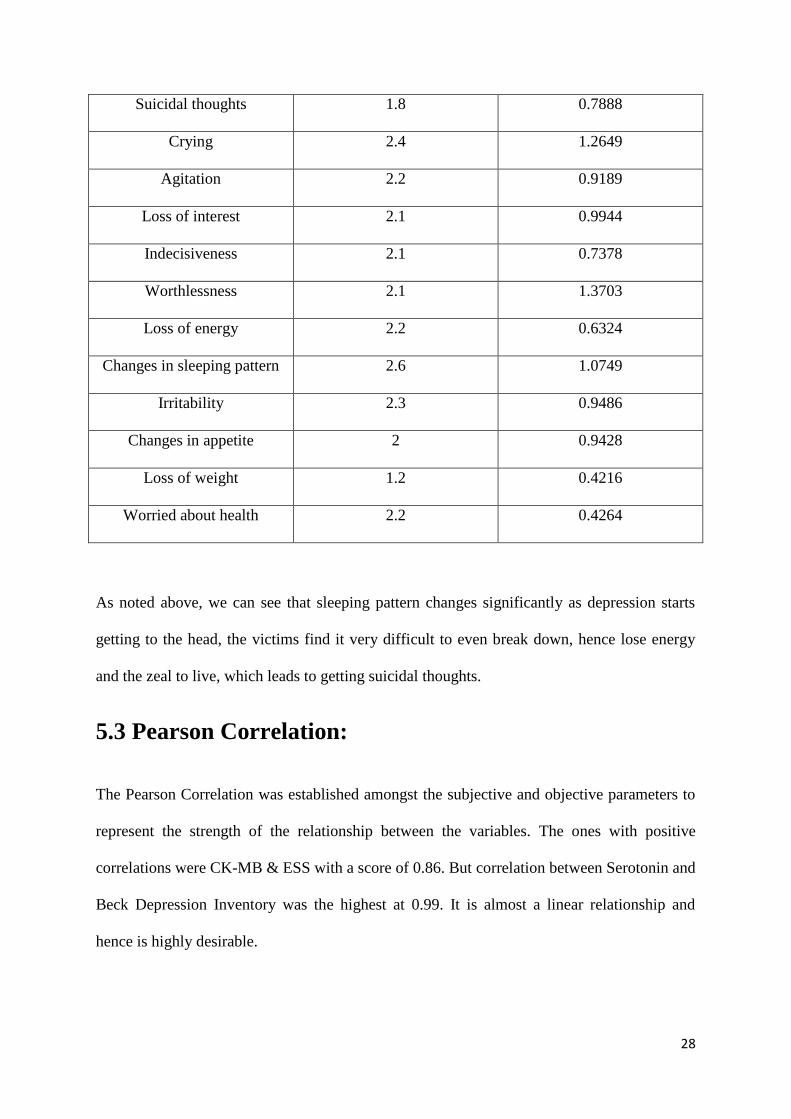
Suicidal thoughts 1.8 0.7888
Crying 2.4 1.2649
Agitation 2.2 0.9189
Loss of interest 2.1 0.9944
Indecisiveness 2.1 0.7378
Worthlessness 2.1 1.3703
Loss of energy 2.2 0.6324
Changes in sleeping pattern 2.6 1.0749
Irritability 2.3 0.9486
Changes in appetite 2 0.9428
Loss of weight 1.2 0.4216
Worried about health 2.2 0.4264
As noted above, we can see that sleeping pattern changes significantly as depression starts
getting to the head, the victims find it very difficult to even break down, hence lose energy
and the zeal to live, which leads to getting suicidal thoughts.
5.3 Pearson Correlation:
The Pearson Correlation was established amongst the subjective and objective parameters to
represent the strength of the relationship between the variables. The ones with positive
correlations were CK-MB & ESS with a score of 0.86. But correlation between Serotonin and
Beck Depression Inventory was the highest at 0.99. It is almost a linear relationship and
hence is highly desirable.

29
CHAPTER 6
Discussion

30
It can be observed that all the three biochemical markers follow a similar trend. The increase
in the level of Serotonin indicates that it can be safely used as a parameter to test drivers’
fatigue. It affects the mood significantly during driving for prolonged hours and hence leads
to fatigue. The increase in concentration of CK-MB is a critical parameter of peripheral
fatigue that includes muscle damage which thus may have surcharged the kidneys. The
increment in this peripheral marker indicates weariness and can be clarified by spread of
steady central fatigue to the periphery which thus prompts muscle protein degradation. Any
condition that causes muscle damage or interferes with muscle energy production can cause
increase in CK-MB levels. Lactic acid was continuously being produced as the person was
getting fatigued. We know when oxygen levels are low, pyruvate converts to lactic acid. High
blood lactate levels, together with decreased oxygen in tissues, now we can say is also caused
by strenuous exercise or damage to the heart.
Driver fatigue could be due to a plethora of reasons like emotional disturbance or pressure or
long shifts at work which could lead to diversion of their attention, depression, fatigue,
absence of interest and vitality and so forth. When both kinds of fatigue (physical and
mental) are consolidated with lack of sleep for a long period of time (like in case of long
distance driving), it can lead psychological pain which triggers the depression levels in
subjects. Like we saw in the study, the different biochemical and subjective components
prove that they follow a similar pattern as they change with progression in fatigue. The
decrease in Serotonin concentration shows that with an upsurge in depression levels,
Serotonin is produced less. The reasons could also be lack of receptor sites to get the
produced 5-HT, failure of the 5-HT to reach the sites, deficiency of Trp, etc. Obviously,
Serotonin can’t be the only reason for depression, it’s a part of a bigger picture of which
Serotonin and SSRI’s are a small part. We also observed that blood lactate levels increase as
the person starts to get fatigued. Amid low-intensity activity, blood lactate levels will stay

31
close to resting levels and then it rises exponentially due to the growth in work-intensity.
Though it cannot be generalised that blood lactate accumulation happens due to increase in
H+ ion concentration, since once they clear out, it will have no negative impact. The study
also ruled out any defined point after which the lactate levels take a shot up, since we see a
steady increase in the levels. Normally, CK-MB levels are deficient in blood, its
concentration is so low but its increase shows damage to heart tissues. It leads to unusual
fatigue, disturbance in sleep pattern, etc. This cardiac marker, as can be seen from results,
rises slowly after 3-4 hours of work and reaches higher peaks at the end of 12 hours or more.
More diverse conditions in which drivers actually have to undergo long-distance driving (like
extreme temperature, alcohol use/abuse, etc.) may lead to more acute interference in the test
subjects. But the test subjects were placed under similar conditions and are of almost the
same age, still the levels of CK-MB in serum vary to an extent. In some cases, it could be
genetic but a pinpoint reason still remains unknown.
Discussion of Subjective assessments:
The ESS report showed that around 60% of the subjects had enough sleep which came down
to approx. 10% at the end of 12 hours. The subjects felt dangerously sleepy which could pose
undesirable dangers for them, their partners and the normal road users. Significant
improvement was seen while ‘someone was sitting and talking to them’, rather than the
drivers driving alone for long hours. It was also seen the risks of accidents were high if th
person had had alcohol in lunch or dinner.
Now, the BQ suggested that around 4 out of the 10 test subjects were at high-risk of sleep
apnoea, 3 were at low-risk and nothing could be said about the rest 3, since they were
unaware of some of their health problems and had varied answers. Sleep apnoea could lead to
memory loss, depression, stroke, etc. It is disturbing to find that so many individuals were at
32
high risks and were completely unaware of it. It was also noted that snoring is a habit
amongst many subjects and that their snoring bothers other people, hence it could lead to
disturb in their partners’ sleep pattern too. None of the subjects nodded off or fell asleep
during the driving period, so that was a relief. Though, some admitted to have had signs of
moderate dozing during the lunch hours. People were also asked if they had suffered from
high blood pressure and 30% of them could not give us an affirmation. Proper diagnosis was
suggested to those at high risk.
The BDI questionnaire showed that 50% of the test subjects were under severe depression
while 40% were under moderate depression. As the day started, their depression levels were
recorded to be minimal or mild. But with the advance of the strenuous activity, their
depression levels showed major changes. It was noted that once the person is depressed, the
most affected criteria is one’s sleeping pattern. They find it difficult to cry, even if they want
to. It makes them irritated for most of the time and hence, they find it difficult to concentrate
on their work. Most of them admitted that their depression state affects their quality of work
and it leads to withdrawal from the job undertaken. They become indecisive, due to which
they find it difficult to make any snap judgement or take reflex actions on time, once faced
with a calamity or accident. These traits are highly undesirable in drivers and needs to be
looked out for. The stark changes and differences of the undertaken components hence show
that they can be used for medical presentation of fatigue, its causes and its effects.

33
Chapter 7
Conclusion

34
After correlation, Serotonin comparatively shows a better correlation with Beck Depression
Inventory. Serotonin is also a key inducer of central fatigue during driving sessions and hence
can be used for real time assessment. By combining Serotonin with peripheral biomarkers
like CK-MB and Lactic Acid, a précised staging of fatigue in the occupational groups can be
obtained.

35
References

36
[1] Tran Tuan Q., Raddatz Kimberly R., Cady Elizabeth T., Vowels Christopher L., Amstutz
B. J., Elgin Peter D.,Effect of Extreme sleeps Deprivation on Human Performance (2007)
[2] http://www.thefreedictionary.com/fatigue
[3] C J Reissman, the Alert Driver: A Trucker's Guide to Sleep, Fatigue, and Rest in our 24-
Hour Society. American Trucking Associations, 2200 Mill Road, Alexandria, USA 1996.
[4] Ji Hyun Yang, Zhi-Hong Mao, Member, IEEE, Louis Tijerina, Tom Pilutti, Joseph F.
Coughlin, and Eric Feron., Detection of Driver Fatigue Caused by Sleep Deprivation.,
SYSTEMS AND HUMANS, VOL. 39, NO. 4, JULY 2009
[5] Jim Horne and Louise Reyner, Sleep Related Vehicle Accidents, Sleep Research
Laboratory, Loughborough University (2000)
[6] Horne J A and Reyner L A, Driver Sleepiness, Journal of Sleep research Vol. 4, 1995
[7] Dr A Williamson et al, Moderate Sleep Deprivation Produces Impairments in Cognitive
and Motor Performance Equivalent to Legally Prescribed Levels of Alcohol Intoxication,
Occupational and Environmental Medicine, 57, 2000
[8] I.D. Brown, Driver fatigue, Hum Factors 36 (1994) 298-314.
[9] P. Philip, I. Ghorayeb, R. Stoohs, J.C. Menny, P. Dabadie, B. Bioulac, C. Guilleminault,
Determinants of sleepiness in automobile drivers, J Psychosom Res 41 (1996) 279-288.
[10] J. Horne, L. Reyner, Vehicle accidents related to sleep: a review, Occup Environ Med 56
(1999) 289-294.
[11] Beck AT (2006). Depression: Causes and Treatment. Philadelphia: University of
Pennsylvania Press. ISBN 0-8122-1032-8.

37
[12] Blomstrand E., Amino acid and central fatigue, Amino acids (2001) 20:25-34
[13] Newsholme EA (1986) Application of knowledge of metabolic integration to the
problem of metabolic limitations in middle distance and marathon running. Acta Physiol
Scand 128 [Suppl 556]: 93–97
[14] Steer R.A., Ball R., Ranieri W.F., Beck A.T. Dimensions of the Beck Depression
Inventory- II in clinically depressed outpatients". Journal of clinical psychology 55 (1): 117–
28 (1999)
[15] Storch EA, Roberti JW, Roth DA (2004). "Factor structure, concurrent validity, and
internal consistency of the Beck Depression Inventory-Second Edition in a sample of college
students". Depression and anxiety 19 (3): 187–9
[16] medical-dictionary.thefreedictionary.com
[17] Special Review Scripps News, Vol 10 – No. 2, Summer 1996
[18] D.Jayanthi, M.Bommy; Vision-based Real-time Driver Fatigue Detection System for
Efficient Vehicle Control : ISSN: 2249 – 8958, Volume-2, Issue-1, October 2012
[19] Mirick DK, Davis S, authors. Melatonin as a biomarker of circadian dysregulation.
Cancer Epidemiol Biomarkers Prev. 2008;17:3306–13
[20] Buckley TM, Schatzberg AF, authors. On the interactions of the hypothalamic-pituitary-
adrenal (HPA) axis and sleep: Normal HPA axis activity and circadian rhythm, exemplary
sleep disorders. J Clin Endocrinol Metab. 2005;90:3106–14
[21] Adam EK, Kumari M, authors. Assessing salivary cortisol in large-scale,
epidemiological research. Psychoneuroendocrinology. 2009;34:1423–36

38
[22] Manual for the profile of mood states. 1971. San Diego, CA: Educational and Industrial
Testing Services.
[23] JP Research, India Pvt. Ltd., Mumbai – Pune expressway Road Accident Study, 2012-
2014
[24] Yuan-Pang Wang, Clarice Gorenstein., Assessment of depression in medical patients: A
systematic review of the utility of the Beck Depression Inventory-II
[25] Bailes S., Libman E., Brief and distinct empirical sleepiness and fatigue scales, J
Psychosom Res. 2006 Jun; 60(6):605-13

39
Appendix – I
(Subjective assessment
Questionnaires)

40
Demographics
Q1) What is your age group? (Please tick)
1) Below 21 years
2) 21 - 25
3) 26 - 30
4) 31 - 35
5) 36 - 40
6) 41 – 45
7) Above 45
Q2) What is your gender? (Please tick)
1) Male
2) Female
Q3) How long have you been employed as an auto rickshaw driver?
1) Below 1 year
2) 1 – 5 years
3) 5 – 10 years
4) 10 – 15 years
5) Above 15 years
Q4) Have you experienced fatigue in the last 6 months?
1) Yes
2) No
5. If so, what do you believe this is a result of?

41
Q6) Do you believe fatigue has affected your performance at work?
1) Yes
2) No
Q7) Have you ever been diagnosed with narcolepsy, restless leg syndrome, obstructive or central sleep apnoea?
1) Yes
2) No
Q8) If so are you being treated for this?
1) Yes
2) No

42
Epworth Sleepiness Scale (Johns, 1991)
How likely are you to doze off or fall asleep in the following situations (rather than just feeling tired) - referring to your usual way of life in recent times. If you haven't done some of these things recently, try and work out how it would have affected you - so all questions have an answer.
Use the following scale to choose the most appropriate number for each situation 0 = no chance of dozing
1 = slight chance of dozing
2 = moderate chance of dozing 3 = high chance of dozing
SITUATION CHANCE OF DOZING
1. Sitting and reading
_____________________
2. Watching television
_____________________
3. Sitting, inactive in a public place
(eg. in cinema or a meeting) _____________________
4. Passenger in a car for an hour without a break
_____________________
5. Lying down to rest in the afternoon (when circumstances permit)
_____________________
6. Sitting and talking to someone
_____________________
7. Sitting quietly after lunch (without alcohol)
______________________
8. In a car, whilst stopped for a few minutes in traffic
______________________

43
Berlin Questionnaire (for sleep apnoea) (Netzer et al., 1999)
Height _____cm Weight ____ kg
Age ______ yrs Gender M / F
Q1) Do you snore?
6) Yes
7) No
8) Don’t Know
If you snore:
Q2) Your snoring is
1) Slightly louder than your breathing
2) Louder than talking
3) As loud as talking
4) Very Loud
Q3) How often do you snore?
1) Almost every day
2) 3-4 times a week
3) 1-2 times a week
4) Never or almost never
Q4) Does your snoring bother other people?
8) Yes
9) No
Q5) Has anyone ever noticed that you quit breathing during your sleep?
1) Nearly every day
2) 3-4 times a week
3) 1-2 times a week
4) 1-2 times a month

44
5) Never or nearly never

45
Q6) How often do you feel tired or fatigued after you sleep?
1) Nearly every day
2) 3-4 times a week
3) 1-2 times a week
4) 1-2 times a month
5) Never or nearly never
Q7) During your wake time, do you feel tired, fatigued or not up to par?
1) Nearly every day
2) 3-4 times a week
3) 1-2 times a week
4) 1-2 times a month
5) Never or nearly never
Q8) Have you ever nodded off or fallen asleep while driving a vehicle?
1) Yes
2) No
If Yes,
Q9) How often does this occur?
1) Nearly every day
2) 3-4 times a week
3) 1-2 times a week
4) 1-2 times a month
5) Never or nearly never
Q10) Do you have high blood pressure?
1) Yes
2) No
3) Don’t Know

46
Beck Depression Inventory
Q1) Sadness
1) I do not feel sad.
2) I feel sad
3) I am sad all the time and I can't snap out of it.
4) I am so sad and unhappy that I can't stand it.
Q2) Pessimism
1) I am not particularly discouraged about the future.
2) I feel discouraged about the future.
3) I feel I have nothing to look forward to.
4) I feel the future is hopeless and that things cannot improve.
Q3) Past Failure
1) I do not feel like a failure.
2) I feel I have failed more than the average person.
3) As I look back on my life, all I can see is a lot of failures.
4) I feel I am a complete failure as a person.
Q4) Loss of Pleasure
1) I get as much satisfaction out of things as I used to.
2) I don't enjoy things the way I used to.
3) I don't get real satisfaction out of anything anymore.
4) I am dissatisfied or bored with everything.
Q5) Guilty Feelings
1) I don't feel particularly guilty.
2) I feel guilty a good part of the time.
3) I feel quite guilty most of the time.
4) I feel guilty all of the time.

47
Q6) Punishment Feelings
1) I don't feel I am being punished.
2) I feel I may be punished.
3) I expect to be punished.
4) I feel I am being punished.
Q7) Self Dislike
1) I don't feel disappointed in myself.
2) I am disappointed in myself.
3) I am disgusted with myself.
4) I hate myself.
Q8) Self Criticalness
1) I don't feel I am any worse than anybody else.
2) I am critical of myself for my weaknesses or mistakes.
3) I blame myself all the time for my faults.
4) I blame myself for everything bad that happens.
Q9) Suicidal thoughts or wishes
1) I don't have any thoughts of killing myself.
2) I have thoughts of killing myself, but I would not carry them out.
3) I would like to kill myself.
4) I would kill myself if I had the chance.
Q10) Crying
1) I don't cry any more than usual.
2) I cry more now than I used to.
3) I cry all the time now.
4) I used to be able to cry, but now I can't cry even though I want to.

48
Q11) Agitation
1) I am no more irritated by things than I ever was.
2) I am slightly more irritated now than usual.
3) I am quite annoyed or irritated a good deal of the time.
4) I feel irritated all the time.
Q12) Loss of Interest
1) I have not lost interest in other people.
2) I am less interested in other people than I used to be.
3) I have lost most of my interest in other people.
4) I have lost all of my interest in other people.
Q13) Indecisiveness
1) I make decisions about as well as I ever could.
2) I put off making decisions more than I used to.
3) I have greater difficulty in making decisions more than I used to.
4) I can't make decisions at all anymore.
Q14) Worthlessness
1) I don't feel that I look any worse than I used to.
2) I am worried that I am looking old or unattractive.
3) I feel permanently unattractive.
1) I believe that I look ugly.
Q15) Loss of Energy
1) I can work about as well as before.
2) It takes an extra effort to get started at doing something.
3) I have to push myself very hard to do anything.
4) I can't do any work at all.

49
Q16) Changes in sleeping pattern
1) I can sleep as well as usual.
2) I don't sleep as well as I used to.
3) I wake up 1-2 hours earlier than usual and find it hard to get back to sleep.
4) I wake up several hours earlier than I used to and cannot get back to sleep.
Q17) Irritability
1) I don't get more tired than usual.
2) I get tired more easily than I used to.
3) I get tired from doing almost anything.
4) I am too tired to do anything.
Q18) Changes in appetite
1) My appetite is no worse than usual.
2) My appetite is not as good as it used to be.
3) My appetite is much worse now.
4) I have no appetite at all anymore.
Q19) Loss of weight
1) I haven't lost much weight, if any, lately.
2) I have lost more than five pounds.
3) I have lost more than ten pounds.
4) I have lost more than fifteen pounds.
Q20) Tiredness or Fatigue
1) I am no more worried about my health than usual.
2) I am worried about physical problems
3) I’m very worried about physical problems and it's hard to think of much else.
4) I am so worried about my physical problems that I cannot think of anything else.