farmer groups and input access: when membership is not enough
TRANSCRIPT
Food Policy 46 (2014) 37–49
Contents lists available at ScienceDirect
Food Policy
journal homepage: www.elsevier .com/locate / foodpol
Farmer groups and input access: When membership is not enough
http://dx.doi.org/10.1016/j.foodpol.2014.01.0060306-9192/Published by Elsevier Ltd.
⇑ Tel.: +1 5174325418.E-mail address: [email protected]
Lenis Saweda O. Liverpool-Tasie ⇑Department of Agricultural, Food and Resource Economics, Michigan State University, 211B, Agriculture Hall, 446 W. Circle Drive, East Lansing, MI 48824, USA
a r t i c l e i n f o a b s t r a c t
Article history:Received 11 June 2012Received in revised form 11 December 2013Accepted 14 January 2014
Keywords:Input vouchersFertilizerFarmer groupsSocial capitalIntra group dynamicsNigeria
This paper explores the efficiency of a targeted fertilizer subsidy program administered differently in twoNigerian states in 2009. An important dimension along which the otherwise similar programs differedwas the fertilizer distribution strategy. Fertilizer distribution among program participants was done atthe individual level for one set of farmers, while the fertilizer was given indirectly through a grouprepresentative for the other set. Where fertilizer was given to a group representative for further distribu-tion to members, relatives of the farm group’s president received more bags of fertilizer than others.Where fertilizer was given directly to farmers such results did not obtain. This differential outcomesuggests that while groups may facilitate the process of farmer identification and coordination, elite cap-ture and intra group dynamics may affect their efficacy for providing equal access to inputs for members.Two-tier models enable us to model the potentially separate processes that determine participation inthe voucher program and the amount of fertilizer received, upon deciding to participate. With intentionsto adopt and scale up voucher programs in various food security and poverty alleviation programs acrossdeveloping countries, it is important to understand when and how farmer groups can affect the success-ful implementation of such programs.
Published by Elsevier Ltd.
Introduction
Farmer groups are considered to be effective mechanisms toincrease farmer livelihood (Kruijssen et al., 2009; Bernard andSpielman, 2009). In addition to reducing information asymmetries,farmer group members can pool resources and market their prod-ucts collectively; overcoming the high transaction costs resultingfrom their small individual sizes. Farmer groups are also believedto improve member access to resources (such as inputs, credit,training, transport and information), increase bargaining powerand facilitate certification and labeling (Bosc et al., 2002). Similarly,collective action, as is possible through farm groups can alsoreduce individual farmer risk for long-term investments such asthose required for perennial crops and capital intensive processingtechnologies, (Di Gregorio et al., 2004).
Consequently, organized farm groups are promoted as usefulavenues for increasing farmer productivity and for the implemen-tation of food security and other development projects. They areparticularly favored for dissemination of extension informationand inputs as well as for the marketing of agricultural commodities(Davis, 2009).In Nigeria, like many other African countries, there isa strong push for the use of organized groups to implement
development programs. The World Bank-assisted Fadama (I, IIand III) are cases in point, as is the fertilizer input voucher programthat took place in Nigeria in 2009 and 2010. The ability of a vou-cher program to improve on the previously government led systemin Nigeria has already been demonstrated (Liverpool-Tasie, 2013).However, no studies that we are aware of, have considered thepotentially varying experience of different kinds of farmers in avoucher program, conditional on participation. With the currentemphasis on using organized groups to improve access to agricul-tural inputs in many developing countries, it is important andtimely to understand the role that group dynamics (e.g. relationsbetween members) play within such arrangements. While groupscan be an effective way to coordinate program beneficiaries, ensur-ing that group characteristics do not limit the benefits that accrueto individual members is important.
Using primary data collected from 1000 households across twostates, this study takes advantage of key state level differences inthe way organized groups were used in the program to explorethe role that farmer clout and intra group dynamics likely playedin the implementation of the program. We empirically test for adifference in the quantity of subsidized fertilizer received byparticipating farmers depending on how subsidized fertilizer wasdistributed in their farm group. A farmer’s decision to participatein the voucher program (receive a fertilizer voucher) and theextent of participation (number of bags of subsidized fertilizer they
38 Lenis Saweda O. Liverpool-Tasie / Food Policy 46 (2014) 37–49
received) are possibly two different processes. Thus, this studyuses various two-tier (two-stage) models to explore if and howthese intra group dynamics affect participation as well as the ex-tent of farmer participation in the voucher program.
The paper proceeds as follows: ‘‘Literature review’’ provides abrief summary of some relevant literature while ‘‘The 2009 Fertil-izer voucher program in Kano and Taraba’’ describes the 2009fertilizer voucher program in Kano and Taraba states. ‘‘Empiricalframework’’ presents the analytical framework and Section 5discusses the data used. ‘‘Conclusion’’ presents the study resultsand Section 7 concludes.
1 The traditional system of government procurement and distribution of subsidizedfertilizer in Nigeria has been characterized as persistently delivering fertilizer latewith the diversion of fertilizer from the intended beneficiaries (Nagy and Edun, 2002).Leakages of the product into the regular market were common, distorting the marketprice and providing arbitrage opportunities.
Literature review
The case for collective action among farmers dates back to the1920s. Active debates surrounded whether cooperatives were nec-essary to unite farmers on a commodity wide basis (for marketpower and higher returns to agriculture) or whether they were ameans to increase competitiveness within the agricultural businesssystem (Staatz, 1989). Though decades of productivity growth andthe structural transformation of societies saw less emphasis placedon collective action among farmers, there has been a recent refocuson smallholder agriculture for economic growth and poverty alle-viation (World Bank, 2007). This has brought a renewed attentionto institutions of collective action like farmer groups stemmingfrom their proposed ability to address market access issues ofsmallholder farmers (Barham and Chitemi,2009). Farmer groupsare considered an efficient mechanism to improve the marketingperformance of small holder farmers which is necessary to im-prove farmer welfare, food security, rural employment and sus-tained agricultural growth (Kariuki and Place, 2005; Dorwardet al., 2003; Poulton et al., 1998). With the declining role of thestate in many developing countries, assisting smallholder farmersto access and participate in various markets is increasingly beingpromoted as a sustainable approach to addressing problems of glo-bal malnutrition and poverty (Fafchamps, 2005; Reardon and Bar-rett, 2000; Cook and Chaddad, 2000; Von Braun, 1995).Consequently, development agencies geared to improve farmeraccess to agricultural services and markets are increasingly work-ing through local institutions like farmer groups (World Bank-assisted Fadama (2010), Stringfellow et al., 1997; Davis, 2009).
The literature on farmer groups in developing countries tends tofocus on their benefits (Bonin et al., 1993; Dulfer, 1974; Kruijssenet al., 2009; Bernard and Spielman, 2009; Di Gregorio et al., 2004;Marsh and Pannell, 2000; Davis, 2009). Fewer studies have high-lighted the challenges associated with farmer groups. These in-clude the potential to exclude some subgroups or members ofthe community (Arnaiz, 1995; Bebbington et al., 1994; Ashbyand Sperling, 1994; Vanclay and Lawrence 1995) as well as com-plexities added when multiple individuals, rather than a singleinvestor, engage in commercial activities discussed in the agribusi-ness literature (Cook and Chambers, 2007; Putterman et al., 1985;Fama, 1980). Within these two strands of literature however, lim-ited emphasis is played on the effect of elite capture and intragroup dynamics on the potential benefits of farmer groups. Conse-quently this study contributes to that limited literature by empir-ically testing for the effect of intra group dynamics on the extent offarmer participation in an input voucher program in Nigeria.
This study also contributes to the literature on agriculturalinput vouchers in Sub-Saharan Africa. Agricultural input vouchersare increasingly being used across sub Saharan Africa to addressproblems of low agricultural productivity and food security. Inmany cases, farmers are coordinated in groups for participation.There has also been a recent increase in empirical studies on theeffects of targeted input vouchers across sub Saharan Africa. The
effect of targeted input subsidies on crop production and conse-quently growth and poverty reduction has been studied (Dorwardet al., 2008). Similarly, several studies have looked at the effects oftargeted input voucher programs on farmer participation in privatemarkets (e.g. Mason and Jayne, in press Liverpool-Tasie (2012),Ricker-Gilbert et al. (2011) and Xu et al. (2009). Others haveevaluated the effect of targeted input vouchers on farmer’s timelyaccess to affordable inputs (Liverpool-Tasie (2013) or the politicalmotivation behind the allocation of vouchers (Banful, 2011). How-ever, the role that farmer influence and social capital play in theeffectiveness of targeted subsidy programs is an area largely unex-plored. One exception is Pan and Christiaensen (2012) who demon-strate the potential for elite capture in decentralized distributionsystems to limit the efficiency of targeting. However, no studywe are aware of till now has looked at the role of such social capitalon the experience of farmers who participate in an otherwise iden-tical targeted voucher program; with the exception of how farmgroups were used for product distribution. Understanding whengroup characteristics can be leveraged as well as potentiallyproblematic mechanisms from their use can increase the efficiencyof targeted input programs in reaching their intended beneficiaries.
The 2009 fertilizer voucher program in Kano and Taraba
Studies have shown that policy inconsistency, late access to fer-tilizer; high prices and poor fertilizer quality are major constraintsto fertilizer use in Nigeria (Banful and Olayide, 2010; Liverpool-Tasie et al., 2010). Consequently, the use of vouchers has beenproffered as a potential solution to the shortcomings of subsidizedfertilizer largely distributed by the government1 (IFDC, 2010). In2009, a fertilizer voucher program was piloted in two Nigerianstates; Taraba and Kano. The voucher program was a collaborativeeffort between the Nigerian government (Federal and State), theprivate sector suppliers and dealers and an implementing agencycalled ‘‘The International Center for soil fertility and development’’(IFDC). Contrary to past National subsidy programs largely driven bythe government, the voucher program (though supported by thegovernment) was implemented under the direct supervision of adevelopment agency (IFDC) and through the private sector.
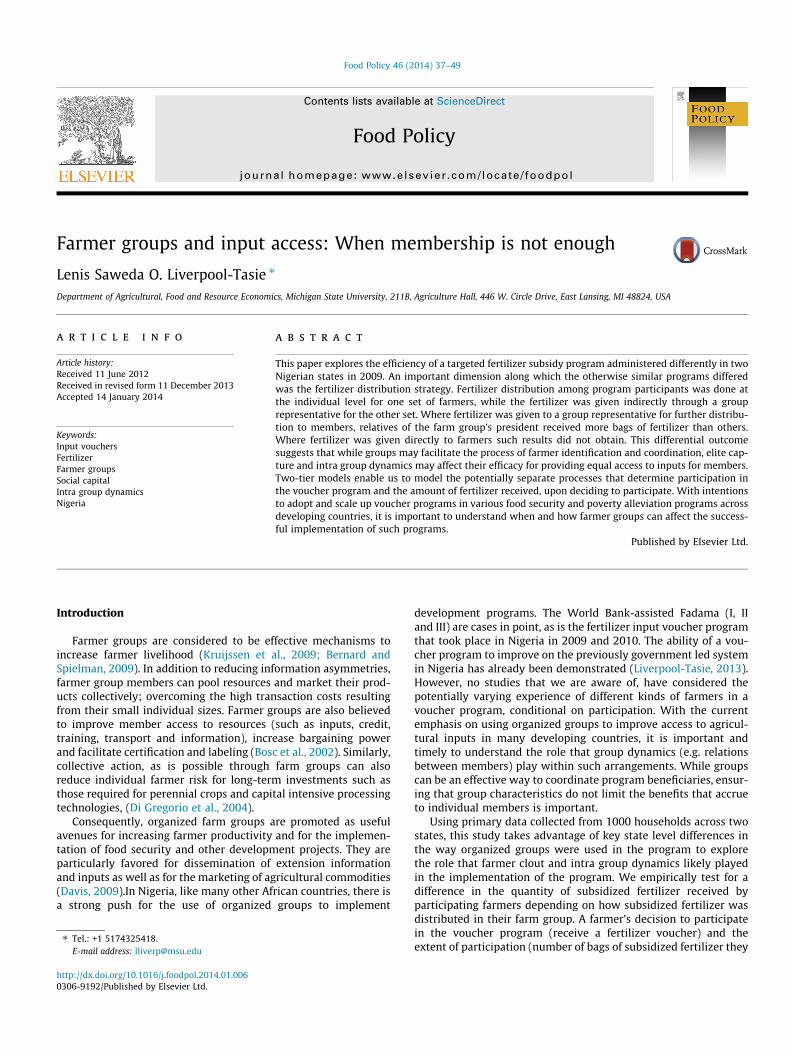
The two pilot states chosen for the 2009 program were Tarabaand Kano. Taraba state with a population of about 2.3 million islocated in North Eastern Nigeria (See Fig. 1). Majority of the state’spopulation is engaged in farming and grows cassava (manioc),sorghum, millet, rice, yams, sugarcane, and corn (maize). Otherimportant economic activities in the state include river fishingand the herding of cattle, goats, and sheep (EncyclopediaBritannica, 2012). Kano state on the other hand is located inNorthwestern Nigeria (see Fig. 1). It is the most populous Nigerianstate, with about 9.4 million residents (National PopulationCommission, 2006). The primary activities in Kano are commerceand agriculture. The principal food crops cultivated in abundanceare millet, cowpeas, sorghum, maize and rice for local consumptionwhile groundnuts and cotton are produced for export andindustrial purposes (Kano State, 2012).
The voucher program in both states was driven by a commonmotive to expand farmer access to fertilizer and to demonstratea better way of distributing subsidized fertilizer in the country.The implementation of both programs was under the strict super-vision of IFDC with very similar implementation procedures (IFDC,2010). Though voucher distribution and redemption differed
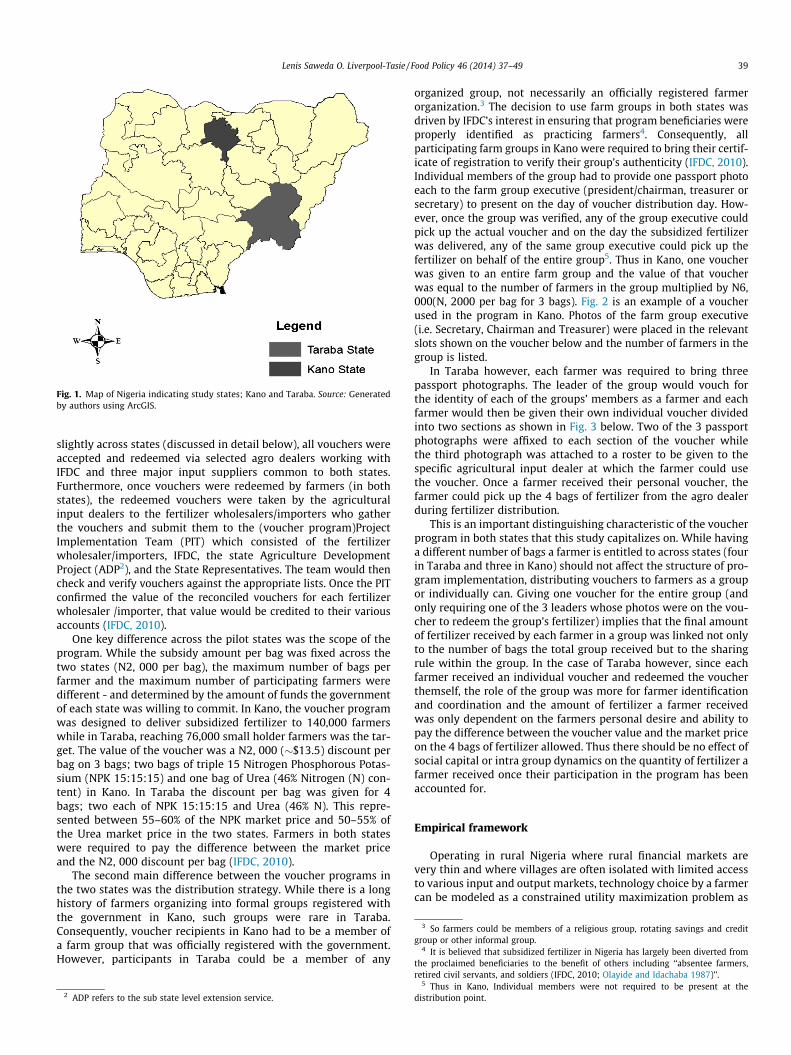
Fig. 1. Map of Nigeria indicating study states; Kano and Taraba. Source: Generatedby authors using ArcGIS.
3 So farmers could be members of a religious group, rotating savings and creditgroup or other informal group.
4 It is believed that subsidized fertilizer in Nigeria has largely been diverted fromthe proclaimed beneficiaries to the benefit of others including ‘‘absentee farmers,
Lenis Saweda O. Liverpool-Tasie / Food Policy 46 (2014) 37–49 39
slightly across states (discussed in detail below), all vouchers wereaccepted and redeemed via selected agro dealers working withIFDC and three major input suppliers common to both states.Furthermore, once vouchers were redeemed by farmers (in bothstates), the redeemed vouchers were taken by the agriculturalinput dealers to the fertilizer wholesalers/importers who gatherthe vouchers and submit them to the (voucher program)ProjectImplementation Team (PIT) which consisted of the fertilizerwholesaler/importers, IFDC, the state Agriculture DevelopmentProject (ADP2), and the State Representatives. The team would thencheck and verify vouchers against the appropriate lists. Once the PITconfirmed the value of the reconciled vouchers for each fertilizerwholesaler /importer, that value would be credited to their variousaccounts (IFDC, 2010).
One key difference across the pilot states was the scope of theprogram. While the subsidy amount per bag was fixed across thetwo states (N2, 000 per bag), the maximum number of bags perfarmer and the maximum number of participating farmers weredifferent - and determined by the amount of funds the governmentof each state was willing to commit. In Kano, the voucher programwas designed to deliver subsidized fertilizer to 140,000 farmerswhile in Taraba, reaching 76,000 small holder farmers was the tar-get. The value of the voucher was a N2, 000 (�$13.5) discount perbag on 3 bags; two bags of triple 15 Nitrogen Phosphorous Potas-sium (NPK 15:15:15) and one bag of Urea (46% Nitrogen (N) con-tent) in Kano. In Taraba the discount per bag was given for 4bags; two each of NPK 15:15:15 and Urea (46% N). This repre-sented between 55–60% of the NPK market price and 50–55% ofthe Urea market price in the two states. Farmers in both stateswere required to pay the difference between the market priceand the N2, 000 discount per bag (IFDC, 2010).
The second main difference between the voucher programs inthe two states was the distribution strategy. While there is a longhistory of farmers organizing into formal groups registered withthe government in Kano, such groups were rare in Taraba.Consequently, voucher recipients in Kano had to be a member ofa farm group that was officially registered with the government.However, participants in Taraba could be a member of any
2 ADP refers to the sub state level extension service.
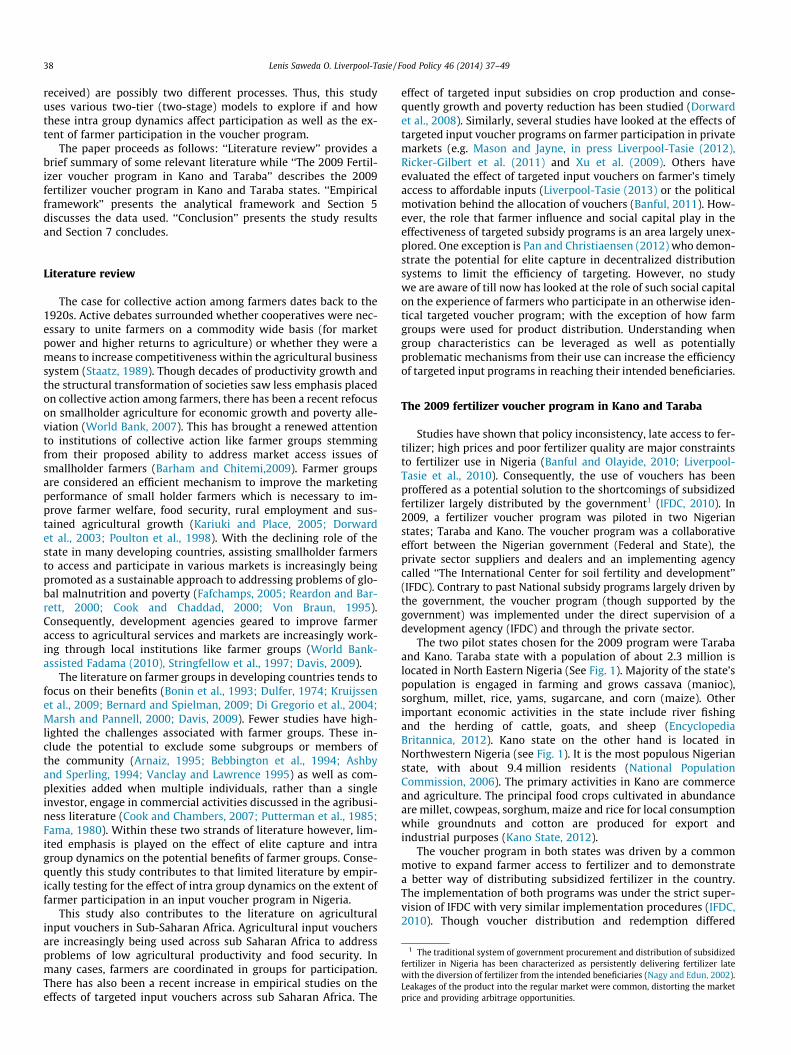
organized group, not necessarily an officially registered farmerorganization.3 The decision to use farm groups in both states wasdriven by IFDC’s interest in ensuring that program beneficiaries wereproperly identified as practicing farmers4. Consequently, allparticipating farm groups in Kano were required to bring their certif-icate of registration to verify their group’s authenticity (IFDC, 2010).Individual members of the group had to provide one passport photoeach to the farm group executive (president/chairman, treasurer orsecretary) to present on the day of voucher distribution day. How-ever, once the group was verified, any of the group executive couldpick up the actual voucher and on the day the subsidized fertilizerwas delivered, any of the same group executive could pick up thefertilizer on behalf of the entire group5. Thus in Kano, one voucherwas given to an entire farm group and the value of that voucherwas equal to the number of farmers in the group multiplied by N6,000(N, 2000 per bag for 3 bags). Fig. 2 is an example of a voucherused in the program in Kano. Photos of the farm group executive(i.e. Secretary, Chairman and Treasurer) were placed in the relevantslots shown on the voucher below and the number of farmers in thegroup is listed.
In Taraba however, each farmer was required to bring threepassport photographs. The leader of the group would vouch forthe identity of each of the groups’ members as a farmer and eachfarmer would then be given their own individual voucher dividedinto two sections as shown in Fig. 3 below. Two of the 3 passportphotographs were affixed to each section of the voucher whilethe third photograph was attached to a roster to be given to thespecific agricultural input dealer at which the farmer could usethe voucher. Once a farmer received their personal voucher, thefarmer could pick up the 4 bags of fertilizer from the agro dealerduring fertilizer distribution.
This is an important distinguishing characteristic of the voucherprogram in both states that this study capitalizes on. While havinga different number of bags a farmer is entitled to across states (fourin Taraba and three in Kano) should not affect the structure of pro-gram implementation, distributing vouchers to farmers as a groupor individually can. Giving one voucher for the entire group (andonly requiring one of the 3 leaders whose photos were on the vou-cher to redeem the group’s fertilizer) implies that the final amountof fertilizer received by each farmer in a group was linked not onlyto the number of bags the total group received but to the sharingrule within the group. In the case of Taraba however, since eachfarmer received an individual voucher and redeemed the voucherthemself, the role of the group was more for farmer identificationand coordination and the amount of fertilizer a farmer receivedwas only dependent on the farmers personal desire and ability topay the difference between the voucher value and the market priceon the 4 bags of fertilizer allowed. Thus there should be no effect ofsocial capital or intra group dynamics on the quantity of fertilizer afarmer received once their participation in the program has beenaccounted for.
Empirical framework
Operating in rural Nigeria where rural financial markets arevery thin and where villages are often isolated with limited accessto various input and output markets, technology choice by a farmercan be modeled as a constrained utility maximization problem as
retired civil servants, and soldiers (IFDC, 2010; Olayide and Idachaba 1987)’’.5 Thus in Kano, Individual members were not required to be present at the
distribution point.
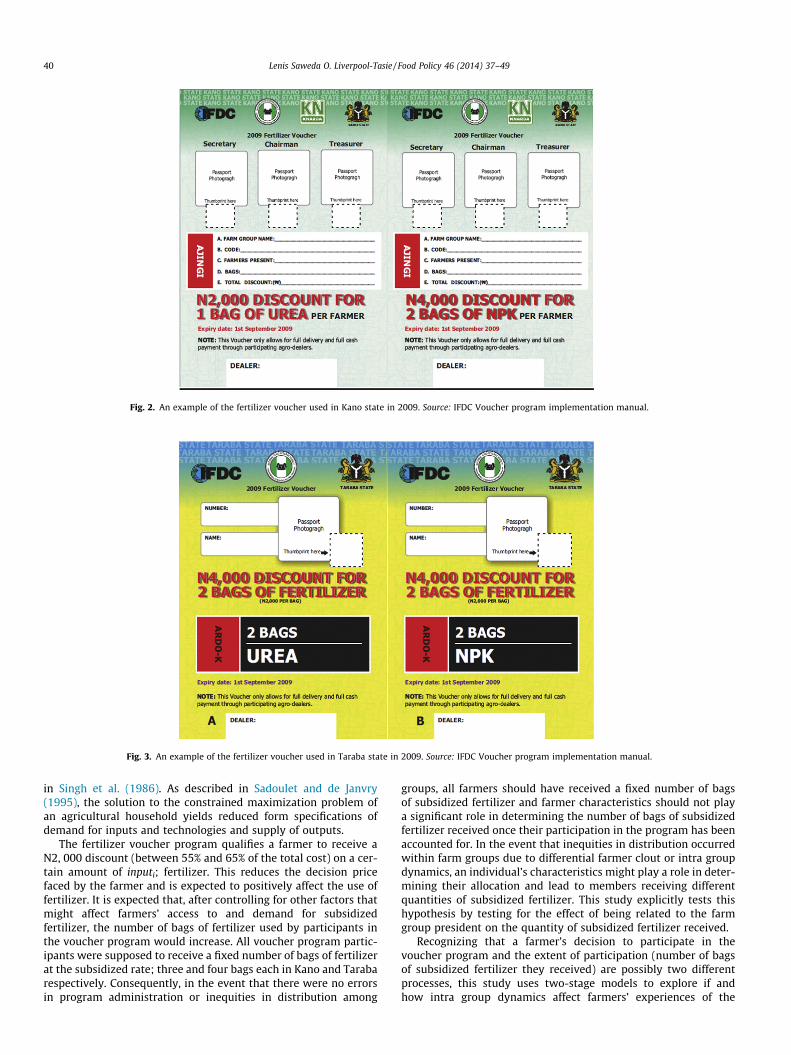
Fig. 2. An example of the fertilizer voucher used in Kano state in 2009. Source: IFDC Voucher program implementation manual.
Fig. 3. An example of the fertilizer voucher used in Taraba state in 2009. Source: IFDC Voucher program implementation manual.
40 Lenis Saweda O. Liverpool-Tasie / Food Policy 46 (2014) 37–49
in Singh et al. (1986). As described in Sadoulet and de Janvry(1995), the solution to the constrained maximization problem ofan agricultural household yields reduced form specifications ofdemand for inputs and technologies and supply of outputs.
The fertilizer voucher program qualifies a farmer to receive aN2, 000 discount (between 55% and 65% of the total cost) on a cer-tain amount of inputi; fertilizer. This reduces the decision pricefaced by the farmer and is expected to positively affect the use offertilizer. It is expected that, after controlling for other factors thatmight affect farmers’ access to and demand for subsidizedfertilizer, the number of bags of fertilizer used by participants inthe voucher program would increase. All voucher program partic-ipants were supposed to receive a fixed number of bags of fertilizerat the subsidized rate; three and four bags each in Kano and Tarabarespectively. Consequently, in the event that there were no errorsin program administration or inequities in distribution among
groups, all farmers should have received a fixed number of bagsof subsidized fertilizer and farmer characteristics should not playa significant role in determining the number of bags of subsidizedfertilizer received once their participation in the program has beenaccounted for. In the event that inequities in distribution occurredwithin farm groups due to differential farmer clout or intra groupdynamics, an individual’s characteristics might play a role in deter-mining their allocation and lead to members receiving differentquantities of subsidized fertilizer. This study explicitly tests thishypothesis by testing for the effect of being related to the farmgroup president on the quantity of subsidized fertilizer received.
Recognizing that a farmer’s decision to participate in thevoucher program and the extent of participation (number of bagsof subsidized fertilizer they received) are possibly two differentprocesses, this study uses two-stage models to explore if andhow intra group dynamics affect farmers’ experiences of the
Lenis Saweda O. Liverpool-Tasie / Food Policy 46 (2014) 37–49 41
voucher program. Cragg (1971) specified the double-hurdle (DH)model by modifying the standard Tobit model. This study usesthe DH model with the assumption that participation in the 2009voucher program6 and one’s extent of participation (the numberof subsidized fertilizer received) are two distinct processes withpotentially different determining factors.7 This can be expressed as:
(a) The voucher participation decision:
V�i ¼ bX1i þ ui ui � Nð0;1Þ ð1Þ
where
Vi ¼1 if; V� > 00 if ; V� 6 0
�
(b) The extent of participation
Q �si ¼ b2X2i þ v iv i � Nð0;rÞ ð2Þ
where
Q si ¼Q �si if Vi ¼ 1 and Q �si > 0
0 otherwise
�ð3Þ
where Vi refers to whether an individual i participated in thevoucher program or not and Qsi refers to the quantity of subsidizedfertilizer received by individual i. This set up allows separate factorsto determine participation in the voucher program from those thatdetermine the quantity of subsidized fertilizer received by partici-pants. X1i and X2i are vectors of explanatory variables that affectthe two stages and are assumed to be uncorrelated with the respec-tive error terms while b1 and b2 are the corresponding parametervectors. Note that V�i is a latent index variable that determinescensoring, Vi is the observed value (1 or 0) which representswhether a respondent participated in the voucher program or not.Thus the observed number of subsidized bags of fertilizer receivedequals the unobserved latent value only when the individual partic-ipated in the voucher program and is zero, otherwise.
The consequent likelihood function to be maximized as demon-strated in (Jones, 1992; Moffatt, 2005; Aristae and Pieroni, 2007): is:
LL ¼X
0
ln 1� /ðX01ib1ÞUX02ib2
r
� �� �
þXþ
ln /ðX 01ib1Þ1r
uQ si � X02ib2
r
� �� �ð4Þ
One important distinguishing feature of the DH model is thefact that the model considers the number of bags of subsidized fer-tilizer to be positive when an individual participates in the voucherprogram and we observe their positive receipt of some subsidizedfertilizer. Thus it allows zero values to obtain when individuals donot participate in the program but also allows for zero values to ob-tain when respondents participated in the program (i.e. were in afarmer group that got subsidized fertilizer) but do not receiveany subsidized fertilizer themselves.8 This is captured by the first
6 A participant in the voucher program in this paper refers to a respondent whoreceived a fertilizer voucher or was a member of a farm group who received avoucher. Our results remain effectively the same whether we define a participant assomeone who received a voucher or redeemed a voucher since some who receivedvouchers might not have redeemed them. We maintain this definition to ensure thatour definition is consistent across the two states.
7 While it is likely that the participation decision is correlated with the extent ofparticipation, it is also possible that while factors like fixed costs of participating inthe program might affect a farmers interest in the voucher program, these are notlikely to be important once the farmer is a participant and entitled to a certainamount of the input.
8 This could occur if a farmer was a member of a group that redeemed theirvoucher but that particular farmer did not receive any fertilizer themself.
term in Eq. (4). This distinguishes the DH model from the standardTobit model as well as the Generalized tobit model (heckman typemodels). For the standard Tobit model, while the model accountsfor censoring at zero, the model assumes that the same process thatdrives participation in the voucher program also drives the numberof subsidized fertilizer received. The Generalized tobit model pro-posed by Heckman (1979) recognizes that the processes that deter-mines the two stages might be different but assumes that the firststage decision dominates the extent of participation, i.e. once anindividual participates in the voucher program, they will receivesome fertilizer. Another distinguishing feature between the Heck-man two stage model and the DH model is the assumption aboutthe relationship between the errors (ui and vi) of Eqs. (1) and (2).The DH model assumes that these errors are normally and indepen-dently distributed indicating that these two decisions are madeseparately rather than the assumption of correlated errors with abivariate normal distribution of the Generalized tobit model.
Arguments in support of both the assumptions of the DH andthe Heckman two stage models can be made in our study context.In line with the Generalized tobit model, we can assume that theparticipation decision dominates the number of bags of fertilizerreceived by participants and as such it is appropriate to think thatthose who received vouchers would record receiving some subsi-dized fertilizer, even if not the expected amount. However, recog-nizing that the two processes are separate and to account for thepossibility that program participants might still record receivingzero bags of subsidized fertilizer (if for example they did notreceive any fertilizer from the expected group representatives),we estimate both the Generalized Tobit model and the DH model.Furthermore, the DH model enables us to account for the fact thatwhile factors like fixed costs of participating in the program(meeting the program requirements) might affect a farmer’s inter-est in the voucher program, these are not likely to be importantonce such a farmer is a participant and entitled to a certain amountof fertilizer.
Consequently, the determinants of participation in the 2009voucher program and the extent of participation in Kano can beexpressed as follows:
ViK ¼ bz1kZ1iK þ bp1kPRESIDENTiK þ e1K ð5aÞ
QsiK ¼ bz2kZ2iK þ bp2kPRESIDENTiK þ e2K ; if Vik ¼ 1 ð5bÞ
where the dependent variable (Vik) is a dummy variable, set to one ifthe farmer in Kano state participated in the voucher program in2009 and QsiK is the number of 50 kg bags of subsidized NPK andUrea fertilizer that a farmer in Kano received in 2009. PRESIDENTiK
is a dummy variable equal to 1 if the respondent in Kano was a fam-ily member of the farm group president and zero otherwise9. Z1iK
and Z2iK refers to a vector of household characteristics and othervariables expected to affect a respondent in Kano state’s probabilityof participating in the voucher program and/or the quantity offertilizer that they consequently receives. Specifically, the vector Z(Z1i and Z2i) consists of the respondent’s age, their household size,whether they used irrigation, whether they were in a householdwhose head was formally educated; if farming was their primarysource of livelihood; if they held a leadership position in the village,
9 This variable is dummy equal to 1 if the respondent answered ‘‘relative’’ to thequestion, ‘‘How do you know your farm group president?’’ This distinguished fromfriend (one who you share things/problems with and could go to for help);acquaintance (someone you knew around the community but who you would notnecessarily go to for help) and someone who you barely knew till you joined thegroup. We consider other specifications such as if the respondent was either thepresident or any of the leadership members (secretary and treasurer) who wasqualified to pick up fertilizer on behalf of the entire group. None of these variables aresignificant and when included do not change our findings.
42 Lenis Saweda O. Liverpool-Tasie / Food Policy 46 (2014) 37–49
the size of land cultivated and proxies of wealth like livestock andnon-livestock asset indices. The asset index is based on the presenceof cell phones, televisions, radios, bicycles and motorcycles. It wasgenerated as the sum of a series of dummy variables (1/0) indicatingthe presence of any of these items in the household, ranging from 0to 5 (Liverpool-Tasie et al., 2010). The livestock index is the house-hold tropical livestock unit (TLU) value10. The vector also includesdistrict dummies to account for district level factors that could affectaccess to fertilizer or the implementation of the program. e1K and e2K
refer to the respondent specific errors.Similarly, for Taraba, the determinants of participation in the
2009 voucher program and the extent of participation can be ex-pressed as follows:
ViT ¼ bz1T Z1iT þ bp1T PRESIDENTiT þ e1T ð6aÞ
Q siT ¼ bz2T Z2iT þ bp2T PRESIDENTiT þ e2T ; if ViT ¼ 1 ð6bÞ
where variables are analogous to Kano.In both states, among the variables in Z is whether a respon-
dent’s farm group procured fertilizer together in 2009. Thisvariable is a proxy for qualifying to participate in the voucherprogram since farmers had to be members of farm groups toparticipate.11 To control for the fact that certain types of farmerswith social or economic clout might also strategically form groupsjust to benefit from the program we include the age of therespondent’s farm group as a control variable.12 Furthermore, todistinguish group related characteristics that could affect the quan-tity of fertilizer available to individuals separate from individualcharacteristics (e.g. individuals in larger groups might have accessto more fertilizer), we include the size of the respondent’s farmgroup.13
This study is particularly interested in the effect of intra groupdynamics (farmer clout and social capital) on farmer experienceof a targeted subsidy program. Consequently though we recognizethat some of the control variables (like being in a group thatpurchases fertilizer together or use of improved seed) might becorrelated with unobserved variables that also affect the quantityof fertilizer received, we focus on precisely estimating bpT andbpK. Since being related to the farm group president is not a choicevariable, we argue that the ‘‘relation to farm group president’’variable is exogenous.
A key argument of this paper is that due to the differential waythat groups were used in the two pilot states, the effects of beingrelated to the farm group president (an indicator of social capi-tal/intragroup dynamics) are different in Kano and Taraba and thisis separate from any state level characteristics that might affectedthe administration of the otherwise similar program. To test for thedifferential effect of intra group dynamics, we pool the data acrossthe two states and statistically test for the difference between thecoefficients on the interaction of the variable of interest (being
10 Tropical livestock unit (TLU) is a common unit used to describe livestock numbersof various types as a single figure that expresses the total amount of livestock ahousehold owns, taking into account the weight and size of each animal. See http://www.fao.org/ag/againfo/programmes/en/lead/toolbox/Mixed1/TLU.htm from theFood and Agricultural Organization (FAO) for more information.
11 Using membership in a farm group is a perfect predictor of participation and thusnot a possible control. However, model estimates for the second stage based on thesample of participants only are effectively the same and available from the authorsupon request.
12 We also compare these results to when we use a dummy for all groups formed in2009 (the year of the program) Again while significant in some cases, this does notchange the main findings.
13 Unfortunately, we do not have information on whether groups always purchasedthe maximum number of bags possible through the program nor the total number ofbags each farm group actually purchased for the two states. To account for thepossibility that there are particular farm group characteristics that might affect thenumber of bags purchased by the group and thus available for distribution to groupmembers we include the size of the respondent’s farm group.
related to the farm group president) with a state variable for eachstate. Following Gould (2013) and Gould et al. (2010), we combineEqs. (5a) and (5b) with Eqs. (6a) and (6b) to get:
Vi ¼ bz1kðZ1i � KanoÞ þ bp1kðPRESIDENTi � KanoÞ þ bz1TðZ1i
� TarabaÞ þ bp1TðPRESIDENTi � TarabaÞ þ Kano � ei1
þ Taraba � ei1 ð7aÞ
QSi ¼ bz2kðZ2i � KanoÞ þ bp2kðPRESIDENTi � KanoÞþ bz2TðZ2i � TarabaÞ þ bp2TðPRESIDENTi � TarabaÞþ Kano � ei2 þ Taraba � ei2 ð7bÞ
where all variables are as earlier defined. By algebraic manipulation,Eqs. (7a) and (7b) can be expressed as
Vi ¼ bz1T � ðZ1iÞ þ Kano � ðZ1iÞðbz1k � bz1TÞ þ Kano
� PRESIDENTi � ðbp1k � bp1TÞ þ Taraba � ei1T þ Kano
� ei1k ð8aÞ
and
QSi ¼ bz2T � ðZ2iÞ þ Kano � ðZ2iÞðbz2k � bz2TÞ þ Kano
� PRESIDENTi � ðbp2k � bp2TÞ þ Taraba � ei1K
þ Kano � ei2k ð8bÞ
A test for statistically significant differences in the PRESIDENT var-iable across Kano and Taraba amounts to testing for the statisticallysignificant difference of (bp1k � bp1T) in Eq. (8a) and (bp2k � bp2T) in(8b). Consequently, the study estimates Eq. (8a) and (8b). Eq. (8a) isthe first stage decision and is estimated using a limited dependentvariable (PROBIT) estimation.14 Eq. (8b) is estimated using a trun-cated regression model. In all estimations continuous variables arenormalized by transforming to natural logs.
In addition to the program implementation strategy, outcomesacross the two states could differ due to other factors such asadministration, culture, level of infrastructural development andmarket access, etc. at a sub state level. Thus we include localitydummies (LGA dummies) to account for any distinct localgeographic or cultural reasons that could also affect farmer accessto and demand for subsidized fertilizer as well as any other loca-tion specific factors that could have affected the implementationof the program. We recognize that there might be unobservedlocation specific effects beyond the local government that couldalso affect the number of bags that respondents in a community re-ceive. However, we argue that these are not likely to be correlatedwith a respondents relation to the farm group president and thusnot likely to affect our ability to properly estimate bpT and bpK.
To confirm if the participation decision dominates the extent ofparticipation process we also estimate the Generalized tobitmodel. While the Generalized tobit two stage model estimates aPROBIT model for the participation stage and then estimates anOLS model on the respondents with non zero subsidized fertilizerreceipts, the DH model runs a nonlinear model like PROBIT forthe first stage and then runs a truncated regression model on thenon zero observations.
Contrary to expectation, farmers did not necessarily receive anumber of bags equal to a round number in either state. This wouldhave necessitated the use of a count model for estimating thedesired differential effects of intra group dynamics. From the data,farmers often received fractional amounts; sometimes as little as a
14 As a robustness check, we also ran a version of the model which was restrictedonly to those who got subsidized fertilizer form the voucher program. Thus here thedependent variable was the probability of redeeming the voucher or being in a groupthat redeemed their voucher and the control variable for participation was receiving avoucher. Results from both models are similar.
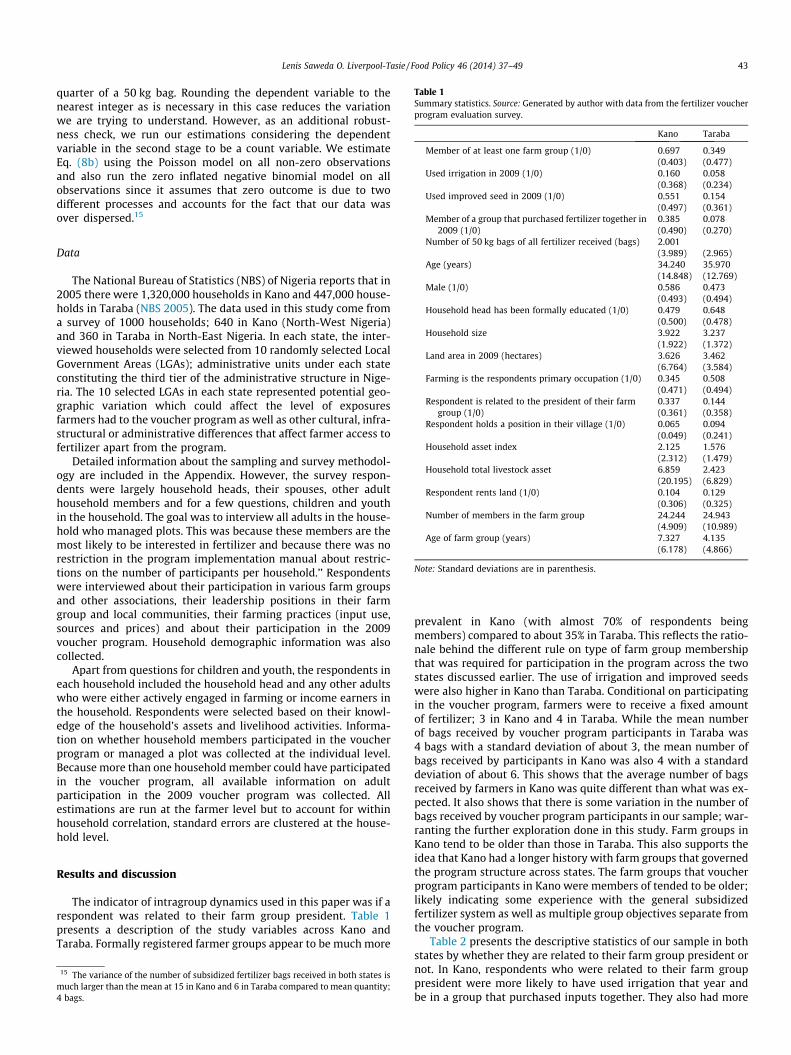
Table 1Summary statistics. Source: Generated by author with data from the fertilizer voucherprogram evaluation survey.
Kano Taraba
Member of at least one farm group (1/0) 0.697 0.349(0.403) (0.477)
Used irrigation in 2009 (1/0) 0.160 0.058(0.368) (0.234)
Used improved seed in 2009 (1/0) 0.551 0.154(0.497) (0.361)
Member of a group that purchased fertilizer together in 0.385 0.078
Lenis Saweda O. Liverpool-Tasie / Food Policy 46 (2014) 37–49 43
quarter of a 50 kg bag. Rounding the dependent variable to thenearest integer as is necessary in this case reduces the variationwe are trying to understand. However, as an additional robust-ness check, we run our estimations considering the dependentvariable in the second stage to be a count variable. We estimateEq. (8b) using the Poisson model on all non-zero observationsand also run the zero inflated negative binomial model on allobservations since it assumes that zero outcome is due to twodifferent processes and accounts for the fact that our data wasover dispersed.15
2009 (1/0) (0.490) (0.270)Number of 50 kg bags of all fertilizer received (bags) 2.001
(3.989) (2.965)Age (years) 34.240 35.970
(14.848) (12.769)Male (1/0) 0.586 0.473
(0.493) (0.494)Household head has been formally educated (1/0) 0.479 0.648
(0.500) (0.478)Household size 3.922 3.237
(1.922) (1.372)Land area in 2009 (hectares) 3.626 3.462
(6.764) (3.584)Farming is the respondents primary occupation (1/0) 0.345 0.508
(0.471) (0.494)Respondent is related to the president of their farm
group (1/0)0.337 0.144(0.361) (0.358)
Respondent holds a position in their village (1/0) 0.065 0.094(0.049) (0.241)
Household asset index 2.125 1.576(2.312) (1.479)
Household total livestock asset 6.859 2.423(20.195) (6.829)
Respondent rents land (1/0) 0.104 0.129(0.306) (0.325)
Number of members in the farm group 24.244 24.943(4.909) (10.989)
Age of farm group (years) 7.327 4.135(6.178) (4.866)
Note: Standard deviations are in parenthesis.
Data
The National Bureau of Statistics (NBS) of Nigeria reports that in2005 there were 1,320,000 households in Kano and 447,000 house-holds in Taraba (NBS 2005). The data used in this study come froma survey of 1000 households; 640 in Kano (North-West Nigeria)and 360 in Taraba in North-East Nigeria. In each state, the inter-viewed households were selected from 10 randomly selected LocalGovernment Areas (LGAs); administrative units under each stateconstituting the third tier of the administrative structure in Nige-ria. The 10 selected LGAs in each state represented potential geo-graphic variation which could affect the level of exposuresfarmers had to the voucher program as well as other cultural, infra-structural or administrative differences that affect farmer access tofertilizer apart from the program.
Detailed information about the sampling and survey methodol-ogy are included in the Appendix. However, the survey respon-dents were largely household heads, their spouses, other adulthousehold members and for a few questions, children and youthin the household. The goal was to interview all adults in the house-hold who managed plots. This was because these members are themost likely to be interested in fertilizer and because there was norestriction in the program implementation manual about restric-tions on the number of participants per household.’’ Respondentswere interviewed about their participation in various farm groupsand other associations, their leadership positions in their farmgroup and local communities, their farming practices (input use,sources and prices) and about their participation in the 2009voucher program. Household demographic information was alsocollected.
Apart from questions for children and youth, the respondents ineach household included the household head and any other adultswho were either actively engaged in farming or income earners inthe household. Respondents were selected based on their knowl-edge of the household’s assets and livelihood activities. Informa-tion on whether household members participated in the voucherprogram or managed a plot was collected at the individual level.Because more than one household member could have participatedin the voucher program, all available information on adultparticipation in the 2009 voucher program was collected. Allestimations are run at the farmer level but to account for withinhousehold correlation, standard errors are clustered at the house-hold level.
Results and discussion
The indicator of intragroup dynamics used in this paper was if arespondent was related to their farm group president. Table 1presents a description of the study variables across Kano andTaraba. Formally registered farmer groups appear to be much more
15 The variance of the number of subsidized fertilizer bags received in both states ismuch larger than the mean at 15 in Kano and 6 in Taraba compared to mean quantity;4 bags.
prevalent in Kano (with almost 70% of respondents beingmembers) compared to about 35% in Taraba. This reflects the ratio-nale behind the different rule on type of farm group membershipthat was required for participation in the program across the twostates discussed earlier. The use of irrigation and improved seedswere also higher in Kano than Taraba. Conditional on participatingin the voucher program, farmers were to receive a fixed amountof fertilizer; 3 in Kano and 4 in Taraba. While the mean numberof bags received by voucher program participants in Taraba was4 bags with a standard deviation of about 3, the mean number ofbags received by participants in Kano was also 4 with a standarddeviation of about 6. This shows that the average number of bagsreceived by farmers in Kano was quite different than what was ex-pected. It also shows that there is some variation in the number ofbags received by voucher program participants in our sample; war-ranting the further exploration done in this study. Farm groups inKano tend to be older than those in Taraba. This also supports theidea that Kano had a longer history with farm groups that governedthe program structure across states. The farm groups that voucherprogram participants in Kano were members of tended to be older;likely indicating some experience with the general subsidizedfertilizer system as well as multiple group objectives separate fromthe voucher program.
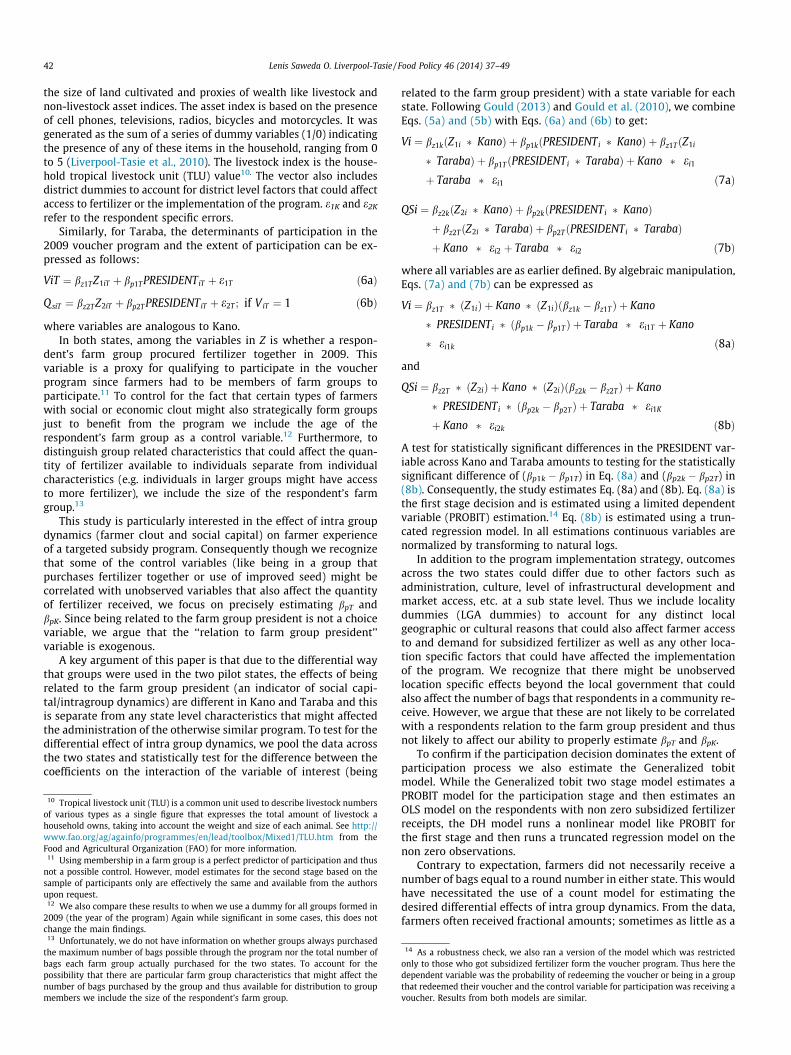
Table 2 presents the descriptive statistics of our sample in bothstates by whether they are related to their farm group president ornot. In Kano, respondents who were related to their farm grouppresident were more likely to have used irrigation that year andbe in a group that purchased inputs together. They also had more
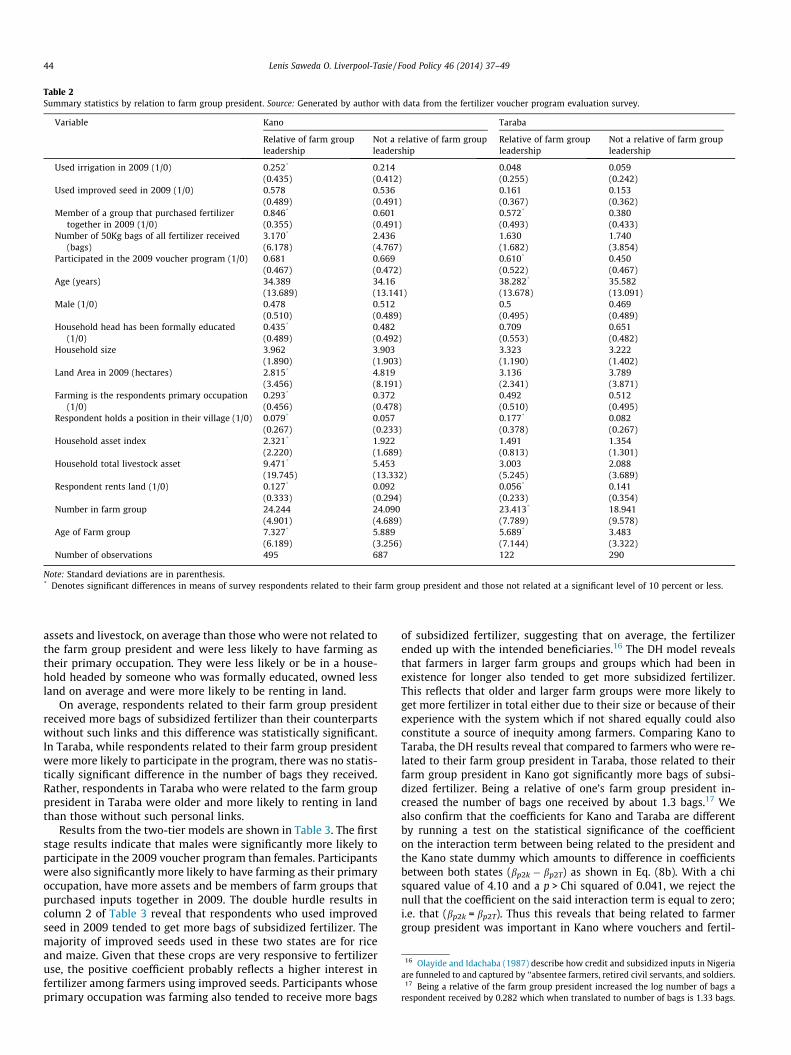
Table 2Summary statistics by relation to farm group president. Source: Generated by author with data from the fertilizer voucher program evaluation survey.
Variable Kano Taraba
Relative of farm groupleadership
Not a relative of farm groupleadership
Relative of farm groupleadership
Not a relative of farm groupleadership
Used irrigation in 2009 (1/0) 0.252* 0.214 0.048 0.059(0.435) (0.412) (0.255) (0.242)
Used improved seed in 2009 (1/0) 0.578 0.536 0.161 0.153(0.489) (0.491) (0.367) (0.362)
Member of a group that purchased fertilizertogether in 2009 (1/0)
0.846* 0.601 0.572* 0.380(0.355) (0.491) (0.493) (0.433)
Number of 50Kg bags of all fertilizer received(bags)
3.170* 2.436 1.630 1.740(6.178) (4.767) (1.682) (3.854)
Participated in the 2009 voucher program (1/0) 0.681 0.669 0.610* 0.450(0.467) (0.472) (0.522) (0.467)
Age (years) 34.389 34.16 38.282* 35.582(13.689) (13.141) (13.678) (13.091)
Male (1/0) 0.478 0.512 0.5 0.469(0.510) (0.489) (0.495) (0.489)
Household head has been formally educated(1/0)
0.435* 0.482 0.709 0.651(0.489) (0.492) (0.553) (0.482)
Household size 3.962 3.903 3.323 3.222(1.890) (1.903) (1.190) (1.402)
Land Area in 2009 (hectares) 2.815* 4.819 3.136 3.789(3.456) (8.191) (2.341) (3.871)
Farming is the respondents primary occupation(1/0)
0.293* 0.372 0.492 0.512(0.456) (0.478) (0.510) (0.495)
Respondent holds a position in their village (1/0) 0.079* 0.057 0.177* 0.082(0.267) (0.233) (0.378) (0.267)
Household asset index 2.321* 1.922 1.491 1.354(2.220) (1.689) (0.813) (1.301)
Household total livestock asset 9.471* 5.453 3.003 2.088(19.745) (13.332) (5.245) (3.689)
Respondent rents land (1/0) 0.127* 0.092 0.056* 0.141(0.333) (0.294) (0.233) (0.354)
Number in farm group 24.244 24.090 23.413* 18.941(4.901) (4.689) (7.789) (9.578)
Age of Farm group 7.327* 5.889 5.689* 3.483(6.189) (3.256) (7.144) (3.322)
Number of observations 495 687 122 290
Note: Standard deviations are in parenthesis.* Denotes significant differences in means of survey respondents related to their farm group president and those not related at a significant level of 10 percent or less.
16 Olayide and Idachaba (1987) describe how credit and subsidized inputs in Nigeriaare funneled to and captured by ‘‘absentee farmers, retired civil servants, and soldiers.
17 Being a relative of the farm group president increased the log number of bags arespondent received by 0.282 which when translated to number of bags is 1.33 bags.
44 Lenis Saweda O. Liverpool-Tasie / Food Policy 46 (2014) 37–49
assets and livestock, on average than those who were not related tothe farm group president and were less likely to have farming astheir primary occupation. They were less likely or be in a house-hold headed by someone who was formally educated, owned lessland on average and were more likely to be renting in land.
On average, respondents related to their farm group presidentreceived more bags of subsidized fertilizer than their counterpartswithout such links and this difference was statistically significant.In Taraba, while respondents related to their farm group presidentwere more likely to participate in the program, there was no statis-tically significant difference in the number of bags they received.Rather, respondents in Taraba who were related to the farm grouppresident in Taraba were older and more likely to renting in landthan those without such personal links.
Results from the two-tier models are shown in Table 3. The firststage results indicate that males were significantly more likely toparticipate in the 2009 voucher program than females. Participantswere also significantly more likely to have farming as their primaryoccupation, have more assets and be members of farm groups thatpurchased inputs together in 2009. The double hurdle results incolumn 2 of Table 3 reveal that respondents who used improvedseed in 2009 tended to get more bags of subsidized fertilizer. Themajority of improved seeds used in these two states are for riceand maize. Given that these crops are very responsive to fertilizeruse, the positive coefficient probably reflects a higher interest infertilizer among farmers using improved seeds. Participants whoseprimary occupation was farming also tended to receive more bags
of subsidized fertilizer, suggesting that on average, the fertilizerended up with the intended beneficiaries.16 The DH model revealsthat farmers in larger farm groups and groups which had been inexistence for longer also tended to get more subsidized fertilizer.This reflects that older and larger farm groups were more likely toget more fertilizer in total either due to their size or because of theirexperience with the system which if not shared equally could alsoconstitute a source of inequity among farmers. Comparing Kano toTaraba, the DH results reveal that compared to farmers who were re-lated to their farm group president in Taraba, those related to theirfarm group president in Kano got significantly more bags of subsi-dized fertilizer. Being a relative of one’s farm group president in-creased the number of bags one received by about 1.3 bags.17 Wealso confirm that the coefficients for Kano and Taraba are differentby running a test on the statistical significance of the coefficienton the interaction term between being related to the president andthe Kano state dummy which amounts to difference in coefficientsbetween both states (bp2k � bp2T) as shown in Eq. (8b). With a chisquared value of 4.10 and a p > Chi squared of 0.041, we reject thenull that the coefficient on the said interaction term is equal to zero;i.e. that (bp2k = bp2T). Thus this reveals that being related to farmergroup president was important in Kano where vouchers and fertil-
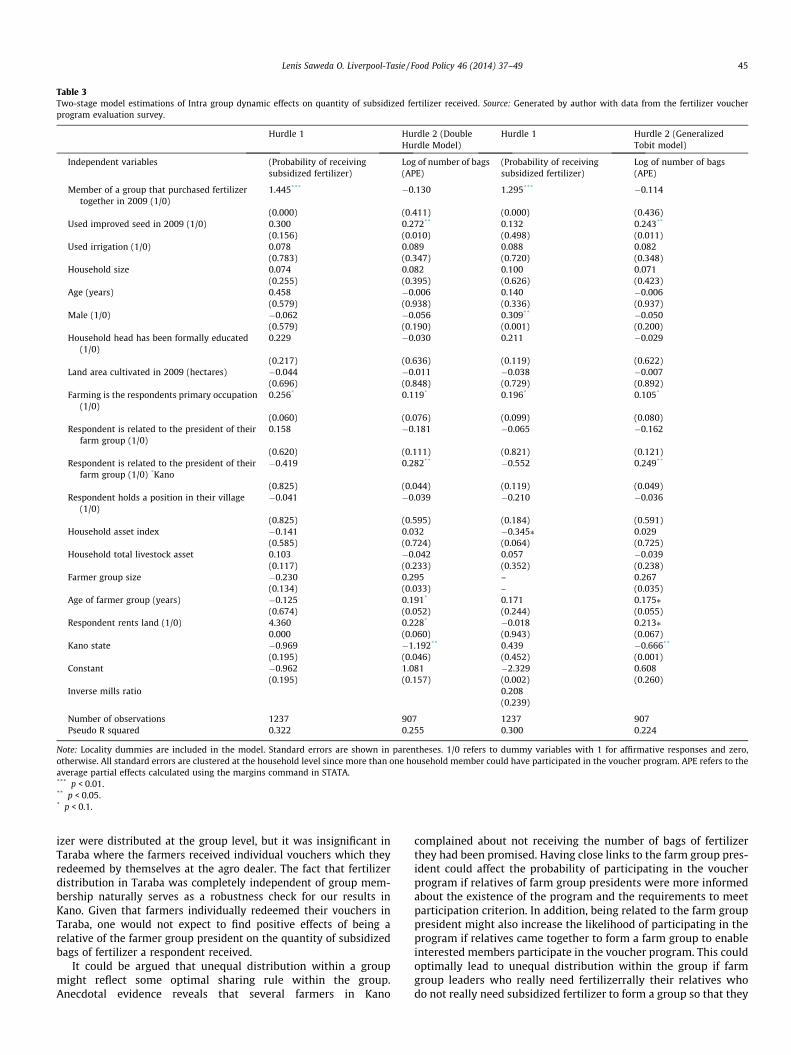
Table 3Two-stage model estimations of Intra group dynamic effects on quantity of subsidized fertilizer received. Source: Generated by author with data from the fertilizer voucherprogram evaluation survey.
Hurdle 1 Hurdle 2 (DoubleHurdle Model)
Hurdle 1 Hurdle 2 (GeneralizedTobit model)
Independent variables (Probability of receivingsubsidized fertilizer)
Log of number of bags(APE)
(Probability of receivingsubsidized fertilizer)
Log of number of bags(APE)
Member of a group that purchased fertilizertogether in 2009 (1/0)
1.445*** �0.130 1.295*** �0.114
(0.000) (0.411) (0.000) (0.436)Used improved seed in 2009 (1/0) 0.300 0.272** 0.132 0.243**
(0.156) (0.010) (0.498) (0.011)Used irrigation (1/0) 0.078 0.089 0.088 0.082
(0.783) (0.347) (0.720) (0.348)Household size 0.074 0.082 0.100 0.071
(0.255) (0.395) (0.626) (0.423)Age (years) 0.458 �0.006 0.140 �0.006
(0.579) (0.938) (0.336) (0.937)Male (1/0) �0.062 �0.056 0.309** �0.050
(0.579) (0.190) (0.001) (0.200)Household head has been formally educated
(1/0)0.229 �0.030 0.211 �0.029
(0.217) (0.636) (0.119) (0.622)Land area cultivated in 2009 (hectares) �0.044 �0.011 �0.038 �0.007
(0.696) (0.848) (0.729) (0.892)Farming is the respondents primary occupation
(1/0)0.256* 0.119* 0.196* 0.105*
(0.060) (0.076) (0.099) (0.080)Respondent is related to the president of their
farm group (1/0)0.158 �0.181 �0.065 �0.162
(0.620) (0.111) (0.821) (0.121)Respondent is related to the president of their
farm group (1/0) *Kano�0.419 0.282** �0.552 0.249**
(0.825) (0.044) (0.119) (0.049)Respondent holds a position in their village
(1/0)�0.041 �0.039 �0.210 �0.036
(0.825) (0.595) (0.184) (0.591)Household asset index �0.141 0.032 �0.345⁄ 0.029
(0.585) (0.724) (0.064) (0.725)Household total livestock asset 0.103 �0.042 0.057 �0.039
(0.117) (0.233) (0.352) (0.238)Farmer group size �0.230 0.295 – 0.267
(0.134) (0.033) – (0.035)Age of farmer group (years) �0.125 0.191* 0.171 0.175⁄
(0.674) (0.052) (0.244) (0.055)Respondent rents land (1/0) 4.360 0.228* �0.018 0.213⁄
0.000 (0.060) (0.943) (0.067)Kano state �0.969 �1.192** 0.439 �0.666**
(0.195) (0.046) (0.452) (0.001)Constant �0.962 1.081 �2.329 0.608
(0.195) (0.157) (0.002) (0.260)Inverse mills ratio 0.208
(0.239)
Number of observations 1237 907 1237 907Pseudo R squared 0.322 0.255 0.300 0.224
Note: Locality dummies are included in the model. Standard errors are shown in parentheses. 1/0 refers to dummy variables with 1 for affirmative responses and zero,otherwise. All standard errors are clustered at the household level since more than one household member could have participated in the voucher program. APE refers to theaverage partial effects calculated using the margins command in STATA.*** p < 0.01.** p < 0.05.* p < 0.1.
Lenis Saweda O. Liverpool-Tasie / Food Policy 46 (2014) 37–49 45
izer were distributed at the group level, but it was insignificant inTaraba where the farmers received individual vouchers which theyredeemed by themselves at the agro dealer. The fact that fertilizerdistribution in Taraba was completely independent of group mem-bership naturally serves as a robustness check for our results inKano. Given that farmers individually redeemed their vouchers inTaraba, one would not expect to find positive effects of being arelative of the farmer group president on the quantity of subsidizedbags of fertilizer a respondent received.
It could be argued that unequal distribution within a groupmight reflect some optimal sharing rule within the group.Anecdotal evidence reveals that several farmers in Kano
complained about not receiving the number of bags of fertilizerthey had been promised. Having close links to the farm group pres-ident could affect the probability of participating in the voucherprogram if relatives of farm group presidents were more informedabout the existence of the program and the requirements to meetparticipation criterion. In addition, being related to the farm grouppresident might also increase the likelihood of participating in theprogram if relatives came together to form a farm group to enableinterested members participate in the voucher program. This couldoptimally lead to unequal distribution within the group if farmgroup leaders who really need fertilizerrally their relatives whodo not really need subsidized fertilizer to form a group so that they
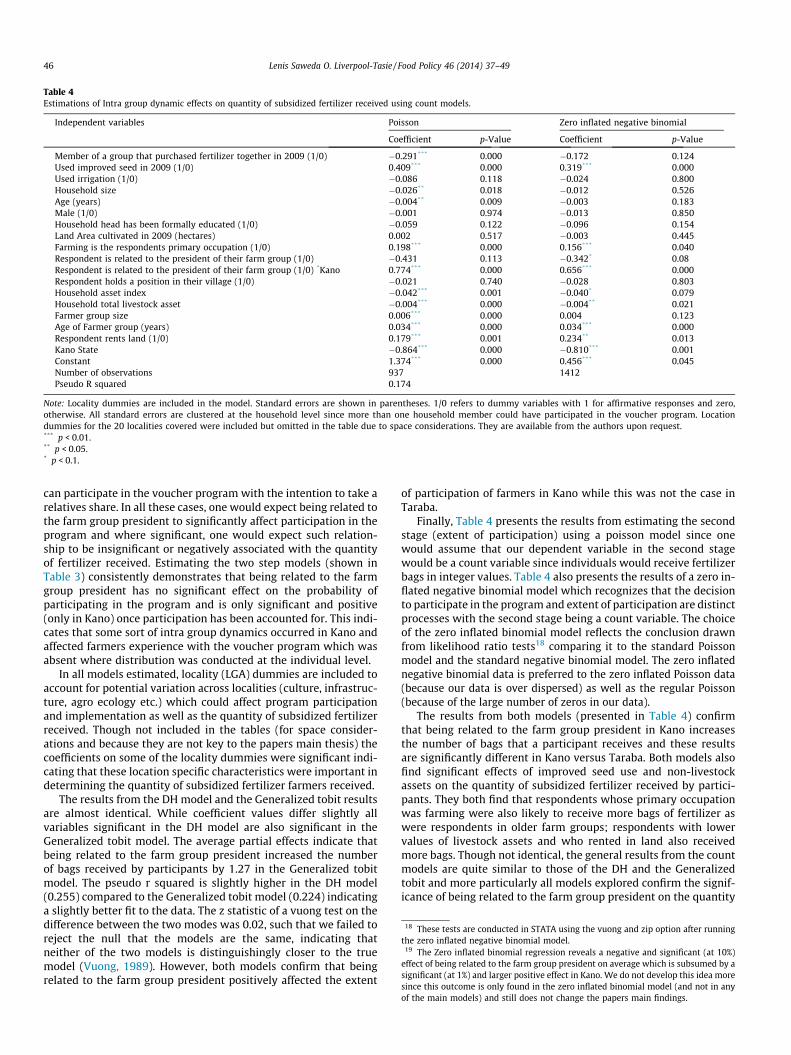
Table 4Estimations of Intra group dynamic effects on quantity of subsidized fertilizer received using count models.
Independent variables Poisson Zero inflated negative binomial
Coefficient p-Value Coefficient p-Value
Member of a group that purchased fertilizer together in 2009 (1/0) �0.291*** 0.000 �0.172 0.124Used improved seed in 2009 (1/0) 0.409*** 0.000 0.319*** 0.000Used irrigation (1/0) �0.086 0.118 �0.024 0.800Household size �0.026** 0.018 �0.012 0.526Age (years) �0.004** 0.009 �0.003 0.183Male (1/0) �0.001 0.974 �0.013 0.850Household head has been formally educated (1/0) �0.059 0.122 �0.096 0.154Land Area cultivated in 2009 (hectares) 0.002 0.517 �0.003 0.445Farming is the respondents primary occupation (1/0) 0.198*** 0.000 0.156*** 0.040Respondent is related to the president of their farm group (1/0) �0.431 0.113 �0.342* 0.08Respondent is related to the president of their farm group (1/0) *Kano 0.774*** 0.000 0.656*** 0.000Respondent holds a position in their village (1/0) �0.021 0.740 �0.028 0.803Household asset index �0.042*** 0.001 �0.040* 0.079Household total livestock asset �0.004*** 0.000 �0.004** 0.021Farmer group size 0.006*** 0.000 0.004 0.123Age of Farmer group (years) 0.034*** 0.000 0.034*** 0.000Respondent rents land (1/0) 0.179*** 0.001 0.234** 0.013Kano State �0.864*** 0.000 �0.810*** 0.001Constant 1.374*** 0.000 0.456*** 0.045Number of observations 937 1412Pseudo R squared 0.174
Note: Locality dummies are included in the model. Standard errors are shown in parentheses. 1/0 refers to dummy variables with 1 for affirmative responses and zero,otherwise. All standard errors are clustered at the household level since more than one household member could have participated in the voucher program. Locationdummies for the 20 localities covered were included but omitted in the table due to space considerations. They are available from the authors upon request.*** p < 0.01.** p < 0.05.* p < 0.1.
18 These tests are conducted in STATA using the vuong and zip option after runningthe zero inflated negative binomial model.
19 The Zero inflated binomial regression reveals a negative and significant (at 10%)effect of being related to the farm group president on average which is subsumed by asignificant (at 1%) and larger positive effect in Kano. We do not develop this idea moresince this outcome is only found in the zero inflated binomial model (and not in any
46 Lenis Saweda O. Liverpool-Tasie / Food Policy 46 (2014) 37–49
can participate in the voucher program with the intention to take arelatives share. In all these cases, one would expect being related tothe farm group president to significantly affect participation in theprogram and where significant, one would expect such relation-ship to be insignificant or negatively associated with the quantityof fertilizer received. Estimating the two step models (shown inTable 3) consistently demonstrates that being related to the farmgroup president has no significant effect on the probability ofparticipating in the program and is only significant and positive(only in Kano) once participation has been accounted for. This indi-cates that some sort of intra group dynamics occurred in Kano andaffected farmers experience with the voucher program which wasabsent where distribution was conducted at the individual level.
In all models estimated, locality (LGA) dummies are included toaccount for potential variation across localities (culture, infrastruc-ture, agro ecology etc.) which could affect program participationand implementation as well as the quantity of subsidized fertilizerreceived. Though not included in the tables (for space consider-ations and because they are not key to the papers main thesis) thecoefficients on some of the locality dummies were significant indi-cating that these location specific characteristics were important indetermining the quantity of subsidized fertilizer farmers received.
The results from the DH model and the Generalized tobit resultsare almost identical. While coefficient values differ slightly allvariables significant in the DH model are also significant in theGeneralized tobit model. The average partial effects indicate thatbeing related to the farm group president increased the numberof bags received by participants by 1.27 in the Generalized tobitmodel. The pseudo r squared is slightly higher in the DH model(0.255) compared to the Generalized tobit model (0.224) indicatinga slightly better fit to the data. The z statistic of a vuong test on thedifference between the two modes was 0.02, such that we failed toreject the null that the models are the same, indicating thatneither of the two models is distinguishingly closer to the truemodel (Vuong, 1989). However, both models confirm that beingrelated to the farm group president positively affected the extent
of participation of farmers in Kano while this was not the case inTaraba.
Finally, Table 4 presents the results from estimating the secondstage (extent of participation) using a poisson model since onewould assume that our dependent variable in the second stagewould be a count variable since individuals would receive fertilizerbags in integer values. Table 4 also presents the results of a zero in-flated negative binomial model which recognizes that the decisionto participate in the program and extent of participation are distinctprocesses with the second stage being a count variable. The choiceof the zero inflated binomial model reflects the conclusion drawnfrom likelihood ratio tests18 comparing it to the standard Poissonmodel and the standard negative binomial model. The zero inflatednegative binomial data is preferred to the zero inflated Poisson data(because our data is over dispersed) as well as the regular Poisson(because of the large number of zeros in our data).
The results from both models (presented in Table 4) confirmthat being related to the farm group president in Kano increasesthe number of bags that a participant receives and these resultsare significantly different in Kano versus Taraba. Both models alsofind significant effects of improved seed use and non-livestockassets on the quantity of subsidized fertilizer received by partici-pants. They both find that respondents whose primary occupationwas farming were also likely to receive more bags of fertilizer aswere respondents in older farm groups; respondents with lowervalues of livestock assets and who rented in land also receivedmore bags. Though not identical, the general results from the countmodels are quite similar to those of the DH and the Generalizedtobit and more particularly all models explored confirm the signif-icance of being related to the farm group president on the quantity
of the main models) and still does not change the papers main findings.
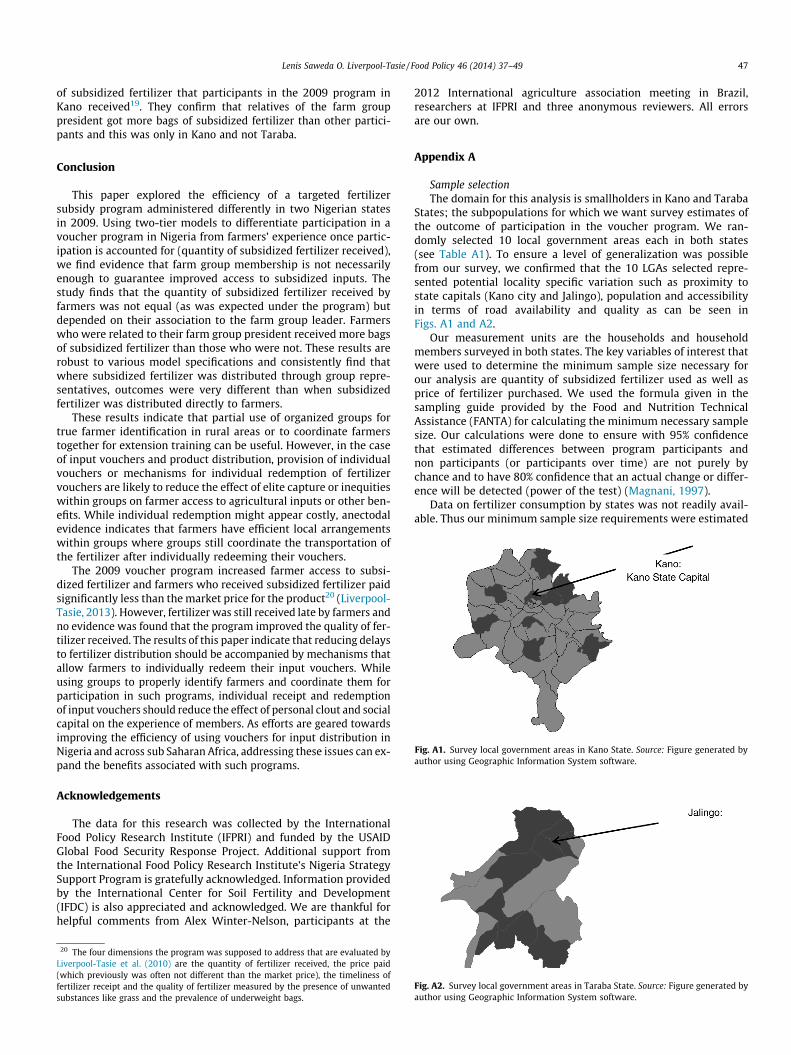
Fig. A1. Survey local government areas in Kano State. Source: Figure generated byauthor using Geographic Information System software.
Lenis Saweda O. Liverpool-Tasie / Food Policy 46 (2014) 37–49 47
of subsidized fertilizer that participants in the 2009 program inKano received19. They confirm that relatives of the farm grouppresident got more bags of subsidized fertilizer than other partici-pants and this was only in Kano and not Taraba.
Conclusion
This paper explored the efficiency of a targeted fertilizersubsidy program administered differently in two Nigerian statesin 2009. Using two-tier models to differentiate participation in avoucher program in Nigeria from farmers’ experience once partic-ipation is accounted for (quantity of subsidized fertilizer received),we find evidence that farm group membership is not necessarilyenough to guarantee improved access to subsidized inputs. Thestudy finds that the quantity of subsidized fertilizer received byfarmers was not equal (as was expected under the program) butdepended on their association to the farm group leader. Farmerswho were related to their farm group president received more bagsof subsidized fertilizer than those who were not. These results arerobust to various model specifications and consistently find thatwhere subsidized fertilizer was distributed through group repre-sentatives, outcomes were very different than when subsidizedfertilizer was distributed directly to farmers.
These results indicate that partial use of organized groups fortrue farmer identification in rural areas or to coordinate farmerstogether for extension training can be useful. However, in the caseof input vouchers and product distribution, provision of individualvouchers or mechanisms for individual redemption of fertilizervouchers are likely to reduce the effect of elite capture or inequitieswithin groups on farmer access to agricultural inputs or other ben-efits. While individual redemption might appear costly, anectodalevidence indicates that farmers have efficient local arrangementswithin groups where groups still coordinate the transportation ofthe fertilizer after individually redeeming their vouchers.
The 2009 voucher program increased farmer access to subsi-dized fertilizer and farmers who received subsidized fertilizer paidsignificantly less than the market price for the product20 (Liverpool-Tasie, 2013). However, fertilizer was still received late by farmers andno evidence was found that the program improved the quality of fer-tilizer received. The results of this paper indicate that reducing delaysto fertilizer distribution should be accompanied by mechanisms thatallow farmers to individually redeem their input vouchers. Whileusing groups to properly identify farmers and coordinate them forparticipation in such programs, individual receipt and redemptionof input vouchers should reduce the effect of personal clout and socialcapital on the experience of members. As efforts are geared towardsimproving the efficiency of using vouchers for input distribution inNigeria and across sub Saharan Africa, addressing these issues can ex-pand the benefits associated with such programs.
Acknowledgements
The data for this research was collected by the InternationalFood Policy Research Institute (IFPRI) and funded by the USAIDGlobal Food Security Response Project. Additional support fromthe International Food Policy Research Institute’s Nigeria StrategySupport Program is gratefully acknowledged. Information providedby the International Center for Soil Fertility and Development(IFDC) is also appreciated and acknowledged. We are thankful forhelpful comments from Alex Winter-Nelson, participants at the
20 The four dimensions the program was supposed to address that are evaluated byLiverpool-Tasie et al. (2010) are the quantity of fertilizer received, the price paid(which previously was often not different than the market price), the timeliness offertilizer receipt and the quality of fertilizer measured by the presence of unwantedsubstances like grass and the prevalence of underweight bags.
2012 International agriculture association meeting in Brazil,researchers at IFPRI and three anonymous reviewers. All errorsare our own.
Appendix A
Sample selectionThe domain for this analysis is smallholders in Kano and Taraba
States; the subpopulations for which we want survey estimates ofthe outcome of participation in the voucher program. We ran-domly selected 10 local government areas each in both states(see Table A1). To ensure a level of generalization was possiblefrom our survey, we confirmed that the 10 LGAs selected repre-sented potential locality specific variation such as proximity tostate capitals (Kano city and Jalingo), population and accessibilityin terms of road availability and quality as can be seen inFigs. A1 and A2.
Our measurement units are the households and householdmembers surveyed in both states. The key variables of interest thatwere used to determine the minimum sample size necessary forour analysis are quantity of subsidized fertilizer used as well asprice of fertilizer purchased. We used the formula given in thesampling guide provided by the Food and Nutrition TechnicalAssistance (FANTA) for calculating the minimum necessary samplesize. Our calculations were done to ensure with 95% confidencethat estimated differences between program participants andnon participants (or participants over time) are not purely bychance and to have 80% confidence that an actual change or differ-ence will be detected (power of the test) (Magnani, 1997).
Data on fertilizer consumption by states was not readily avail-able. Thus our minimum sample size requirements were estimated
Fig. A2. Survey local government areas in Taraba State. Source: Figure generated byauthor using Geographic Information System software.
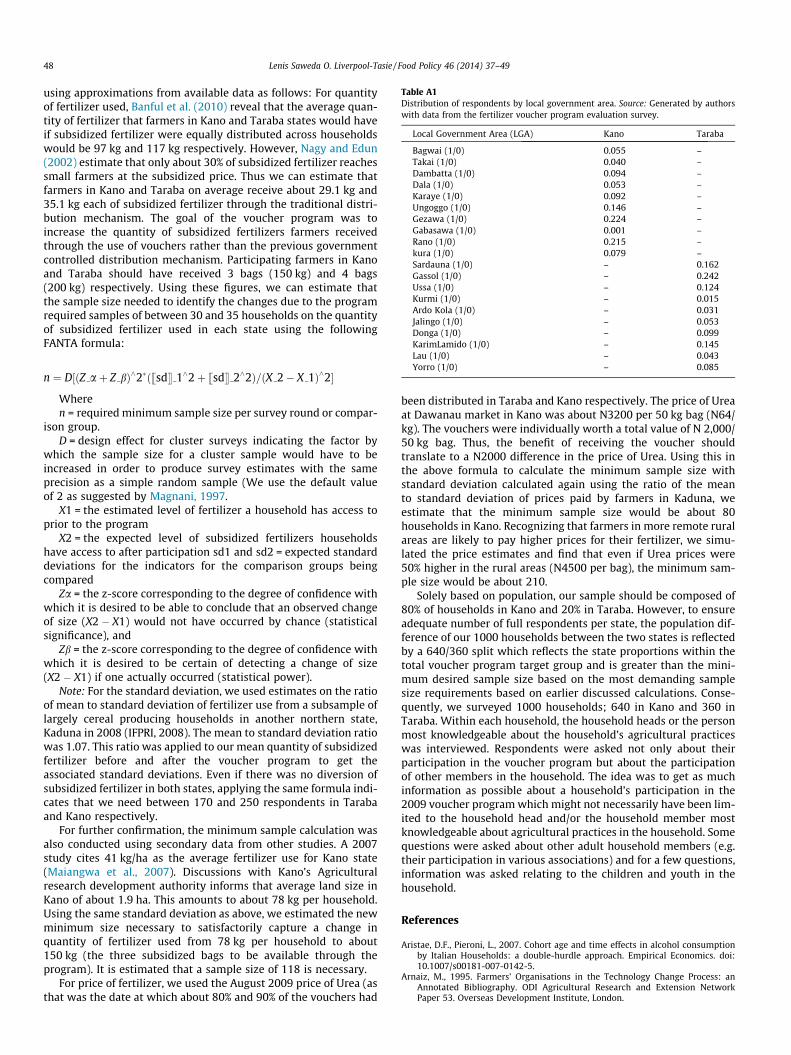
Table A1Distribution of respondents by local government area. Source: Generated by authorswith data from the fertilizer voucher program evaluation survey.
Local Government Area (LGA) Kano Taraba
Bagwai (1/0) 0.055 –Takai (1/0) 0.040 –Dambatta (1/0) 0.094 –Dala (1/0) 0.053 –Karaye (1/0) 0.092 –Ungoggo (1/0) 0.146 –Gezawa (1/0) 0.224 –Gabasawa (1/0) 0.001 –Rano (1/0) 0.215 –kura (1/0) 0.079 –Sardauna (1/0) – 0.162Gassol (1/0) – 0.242Ussa (1/0) – 0.124Kurmi (1/0) – 0.015Ardo Kola (1/0) – 0.031Jalingo (1/0) – 0.053Donga (1/0) – 0.099KarimLamido (1/0) – 0.145
48 Lenis Saweda O. Liverpool-Tasie / Food Policy 46 (2014) 37–49
using approximations from available data as follows: For quantityof fertilizer used, Banful et al. (2010) reveal that the average quan-tity of fertilizer that farmers in Kano and Taraba states would haveif subsidized fertilizer were equally distributed across householdswould be 97 kg and 117 kg respectively. However, Nagy and Edun(2002) estimate that only about 30% of subsidized fertilizer reachessmall farmers at the subsidized price. Thus we can estimate thatfarmers in Kano and Taraba on average receive about 29.1 kg and35.1 kg each of subsidized fertilizer through the traditional distri-bution mechanism. The goal of the voucher program was toincrease the quantity of subsidized fertilizers farmers receivedthrough the use of vouchers rather than the previous governmentcontrolled distribution mechanism. Participating farmers in Kanoand Taraba should have received 3 bags (150 kg) and 4 bags(200 kg) respectively. Using these figures, we can estimate thatthe sample size needed to identify the changes due to the programrequired samples of between 30 and 35 households on the quantityof subsidized fertilizer used in each state using the followingFANTA formula:
Lau (1/0) – 0.043Yorro (1/0) – 0.085
n ¼ D½ðZ aþ Z bÞ^2�ðssdt 1^2þ ssdt 2^2Þ=ðX 2� X 1Þ^2�
Wheren = required minimum sample size per survey round or compar-
ison group.D = design effect for cluster surveys indicating the factor by
which the sample size for a cluster sample would have to beincreased in order to produce survey estimates with the sameprecision as a simple random sample (We use the default valueof 2 as suggested by Magnani, 1997.
X1 = the estimated level of fertilizer a household has access toprior to the program
X2 = the expected level of subsidized fertilizers householdshave access to after participation sd1 and sd2 = expected standarddeviations for the indicators for the comparison groups beingcompared
Za = the z-score corresponding to the degree of confidence withwhich it is desired to be able to conclude that an observed changeof size (X2 � X1) would not have occurred by chance (statisticalsignificance), and
Zb = the z-score corresponding to the degree of confidence withwhich it is desired to be certain of detecting a change of size(X2 � X1) if one actually occurred (statistical power).
Note: For the standard deviation, we used estimates on the ratioof mean to standard deviation of fertilizer use from a subsample oflargely cereal producing households in another northern state,Kaduna in 2008 (IFPRI, 2008). The mean to standard deviation ratiowas 1.07. This ratio was applied to our mean quantity of subsidizedfertilizer before and after the voucher program to get theassociated standard deviations. Even if there was no diversion ofsubsidized fertilizer in both states, applying the same formula indi-cates that we need between 170 and 250 respondents in Tarabaand Kano respectively.
For further confirmation, the minimum sample calculation wasalso conducted using secondary data from other studies. A 2007study cites 41 kg/ha as the average fertilizer use for Kano state(Maiangwa et al., 2007). Discussions with Kano’s Agriculturalresearch development authority informs that average land size inKano of about 1.9 ha. This amounts to about 78 kg per household.Using the same standard deviation as above, we estimated the newminimum size necessary to satisfactorily capture a change inquantity of fertilizer used from 78 kg per household to about150 kg (the three subsidized bags to be available through theprogram). It is estimated that a sample size of 118 is necessary.
For price of fertilizer, we used the August 2009 price of Urea (asthat was the date at which about 80% and 90% of the vouchers had
been distributed in Taraba and Kano respectively. The price of Ureaat Dawanau market in Kano was about N3200 per 50 kg bag (N64/kg). The vouchers were individually worth a total value of N 2,000/50 kg bag. Thus, the benefit of receiving the voucher shouldtranslate to a N2000 difference in the price of Urea. Using this inthe above formula to calculate the minimum sample size withstandard deviation calculated again using the ratio of the meanto standard deviation of prices paid by farmers in Kaduna, weestimate that the minimum sample size would be about 80households in Kano. Recognizing that farmers in more remote ruralareas are likely to pay higher prices for their fertilizer, we simu-lated the price estimates and find that even if Urea prices were50% higher in the rural areas (N4500 per bag), the minimum sam-ple size would be about 210.
Solely based on population, our sample should be composed of80% of households in Kano and 20% in Taraba. However, to ensureadequate number of full respondents per state, the population dif-ference of our 1000 households between the two states is reflectedby a 640/360 split which reflects the state proportions within thetotal voucher program target group and is greater than the mini-mum desired sample size based on the most demanding samplesize requirements based on earlier discussed calculations. Conse-quently, we surveyed 1000 households; 640 in Kano and 360 inTaraba. Within each household, the household heads or the personmost knowledgeable about the household’s agricultural practiceswas interviewed. Respondents were asked not only about theirparticipation in the voucher program but about the participationof other members in the household. The idea was to get as muchinformation as possible about a household’s participation in the2009 voucher program which might not necessarily have been lim-ited to the household head and/or the household member mostknowledgeable about agricultural practices in the household. Somequestions were asked about other adult household members (e.g.their participation in various associations) and for a few questions,information was asked relating to the children and youth in thehousehold.
References
Aristae, D.F., Pieroni, L., 2007. Cohort age and time effects in alcohol consumptionby Italian Households: a double-hurdle approach. Empirical Economics. doi:10.1007/s00181-007-0142-5.
Arnaiz, M., 1995. Farmers’ Organisations in the Technology Change Process: anAnnotated Bibliography. ODI Agricultural Research and Extension NetworkPaper 53. Overseas Development Institute, London.
Lenis Saweda O. Liverpool-Tasie / Food Policy 46 (2014) 37–49 49
Ashby, J., Sperling, L., 1994. Institutionalising Participatory, Client-driven Researchand Technology Development in Agriculture. ODI Agricultural Research andExtension Network Paper 49. Overseas Development Institute, London.
Banful, A.B., 2011. Old problems in the new solutions? Politically motivatedallocation of program benefits and the ‘‘new’’ fertilizer subsidies. World Dev. 39,1166–1176.
Banful, A.B., Nkonya, E., Oboh, V., 2010. Constraints to fertilizer use in Nigeria:Insights from agricultural extension service. IFPRI Discussion Paper 01010.Washington, DC: IFPRI.
Banful, A.B., Olayide, O., 2010. Perspectives of varied stakeholders in Nigeria on thefederaland state fertilizer subsidy programs. IFPRI Discussion Paper01010.Washington, DC: International Food Policy Research Institute.
Barham, J., Chitemi, C., 2009. Collective action to improve marketing performance:lessons from farmer groups in Tanzania. Food Policy 34, 53–59.
Bebbington, A., et al. 1994. Farmer and Community Organisations in AgriculturalResearch and Extension: Functions, Impacts and Questions. ODI AgriculturalResearch and Extension Network Paper 47. Overseas Development Institute,London.
Bernard, T., Spielman, D., 2009. Reaching the rural poor through rural producerorganizations? A study of agricultural marketing cooperatives in Ethiopia. FoodPolicy 34 (1), 60–69.
Bonin, J.P. et al., 1993. Theoretical and empirical studies of producer cooperatives:will ever the twain meet? J. Econ. Literature 1, 1290–1320.
Bosc, P. et al., 2002. The role of rural producer organizations in the World Bank ruraldevelopment strategy. The World Bank Rural Development Family: RuralDevelopment Strategy, Background Paper, World Bank, Washington.
Cook, M., Chaddad, F., 2000. Agroindustrialization of the global agri-food economy:bridging development economics and agri-business research. Agric. Econ. 23(3), 207–218.
Cook, M., Chambers, M., 2007. Role of agricultural cooperatives in global netchains.Working Paper for the Montpellier Workshop organised by INRA-MOISA andWageningen University, Wageningen, The Netherlands.
Cragg, J.G., 1971. Some statistical models for limited dependent variables withapplication to the demand for durable goods. Econometrica 39 (5), 829–844.
Davis, K., 2009. The important role of extension systems. Agriculture and ClimateChange: An Agenda for Negotiation in Copenhagen for Food, Agriculture, andthe Environment. Focus Brief. 6.
Di Gregorio, M., et al. 2004. Property rights, collective action and poverty: the role ofinstitutions for poverty reduction. Paper prepared for the Tenth BiennialConference of the International Association for the Study of Common Property(IASCP), Oaxaca, Mexico, 9–13 August 2004.
Dorward, A. et al., 2003. A policy agenda for pro-poor agricultural growth. WorldDev. 32 (1), 73–89.
Dorward, A., Chirwa, E., Kelly, V., Jayne, T.S., Slater, R., Boughton, D., 2008.Evaluation of the 2006/07 Agricultural Input Subsidy Programme. Malawi. FinalReport, Lilongwe, Malawi.
Dulfer, E., 1974. Operational Efficiency of Agricultural Cooperatives in DevelopingCountries. FAO Agricultural Development Paper No. 96, Rome.
Encyclopædia Britannica Online, s. v. ‘‘Taraba’’, http://www.britannica.com/EBchecked/topic/583292/Taraba. (accessed 12.12.12).
Fafchamps, M., 2005. Market Institutions in Sub-Saharan Africa. MIT Press,Cambridge, Mass, USA.
Fama, E.F., 1980. Agency problems and the theory of the firm. J. Polit. Econ. 88, 288–307.
Gould, William, 2013. Pooling data and performing Chow tests in linear regression.Stata.com. http://www.stata.com/support/faqs/statistics/pooling-data-and-chow-tests/ (retrieved on 05.08.13).
Gould, William, Pitblado, J., Poi, B., 2010. Maximum Likelihood Estimation withStata, fourth ed. College Station, Stata Press.
Heckman, J., 1979. Sample selection bias as a specification error. Econometrica 47(1), 153–161.
International Fertilizer Development Center (IFDC), 2010. ProjectImplementation Manual (PIM) For 2009 Fertilizer Voucher Program inKano and Taraba States.
Jones, A., 1992. A note on computation of the double-hurdle model withdependence with an application to tobacco expenditure. Bull. Econ. Res. 44(1), 67–74.
Kano State Government, 2012. Online ‘‘About Kano’’, http://kano.gov.ng/new/index.php/2012-02-28-03-51-05/ecosoc). (accessed 13.12.12).
Kariuki, G., Place, F., 2005. Initiatives for rural development through collectiveaction: the case of household participation in group activities in the highlandsof central Kenya. CAPRi Working Paper 43.IFPRI, Washington DC.
Kruijssen, F. et al., 2009. Collective action for small-scale producers of agriculturalbiodiversity. Food Policy 34 (1), 46–52.
Liverpool-Tasie, S. 2012. Targeted subsidies and private market participation: Anassessment of fertilizer demand in Nigeria. IFPRI Discussion Paper 01194.Washington DC: IFPRI.
Liverpool-Tasie, L.S.O., 2013. Do vouchers improve government fertilizerdistribution? Evidence from Nigeria. Agric. Econ. http://dx.doi.org/10.1111/agec.12094.
Liverpool-Tasie, L., et al., 2010. An assessment of the 2009 fertilizer voucherprogram in Kano and Taraba, Nigeria. IFPRI NSSP Working paper #17.
Magnani, Robert, 1997. Sampling Guide. Food and Nutrition Technical Assistance(FANTA) publication.
Maiangwa, M.G., Ogungbile, A.O., Olukosi, J.O. and Atala, T.K., 2007. Adoption ofChemical Fertilizer for Land Management in the North–West Zone of NigeriaTropical Agricultural Research and Extension, vol. 10.
Marsh, S., Pannell, D., 2000. Agricultural extension policy in Australia: the good, thebad and the misguided. Aust. J. Agric. Resour. Econ. 44, 605–627. http://dx.doi.org/10.1111/1467-8489.00126.
Mason, N.M., Jayne, T.S., 2013. Fertilizer subsidies and smallholder commercialfertilizer purchases: Crowding out, leakage, and policy implications for Zambia.J. Agric. Econ. 64 (3), 558–582.
Moffatt, P., 2005. Hurdle models of loan default. J. Oper. Res. Soc. 56 (1063–1071).Nagy, J.G., Edun, O., 2002. Assessment of Nigerian government of policy and
suggested alternative market friendly policies.Confidential draft, September 26,2002. International Fertilizer Development Center. <http://www.usaid.gov/ng/downloads/reforms/assessmentoffertilizerpolicy.pdf>. (accessed 10.05.10).
National Bureau of Statistics, 2005. Social Statistics in Nigeria. National Bureau ofStatistics, Abuja.
National Population Commission, Nigeria, 2006. National Population Census. http://www.population.gov.ng/index.php?option=com_content&view=article&id=89(accessed 16.04.13).
Olayide, S.O., Idachaba, F.S., 1987. Input and output marketing systems: a Nigeriancase. In: Mellor, J., Delgado, C.L., Blackie, M.J. (Eds.), Accelerating FoodProduction in Sub Saharan Africa. John Hopkins Press, Baltimore.
Pan, L., Christiaensen, L., 2012. Who is vouching for the input voucher?Decentralized targeting and Elite Capture in Tanzania. World Dev. 40 (8),1619–1633.
Poulton, C. et al., 1998. A new institutional economics perspective on current policydebates. In: Dorward, A., Kydd, J., Poulton, C. (Eds.), Smallholder Cash CropProduction Under Market Liberalization: A New Institutional EconomicsPerspective. CAB International, Wallingford, UK.
Putterman, L. et al., 1985. Choice and efficiency in a model of democratic semicollective agriculture. Oxford Econ. Papers 37 (1), 1–21.
Reardon, T., Barrett, C., 2000. Agroindustrialization, globalization, and internationaldevelopment: an overview of issues, patterns and determinants. Agric. Econ. 23,195–205.
Ricker-Gilbert, J., Jayne, T.S., Chirwa, E., 2011. Subsidies and crowding out: a double-hurdle model of fertilizer demand in Malawi. Am. J. Agric. Econ. 93 (1), 26–42.
Sadoulet, E., de Janvry, A., 1995. Quantitative Development Policy Analysis. JohnsHopkins University Press, Baltimore, MD.
Singh, I., Squire, L., Strauss, J., 1986. Agricultural Household Models. Johns HopkinsUniversity Press, Baltimore, MD.
Staatz, J., 1989. Farmer cooperative theory: recent developments. United StatesDepartment of Agriculture (USDA) Agricultural Cooperative Services ACSResearch, Report Number 84.
Stringfellow, R., et al. 1997. Improving the access of smallholders to agriculturalservices in sub Saharan Africa: Farmer cooperation and the role of the donorcommunity. Overseas development Institute Natural Resources, Perspective No.20.
Vanclay, F., Lawrence, G., 1995. The environmental imperative: eco-social concernsfor Australian agriculture. Central Queensland University Press, Rockhampton.
Von Braun, J., 1995. Agricultural commercialization: impact on income andnutrition and implications for policy. Food Policy 20 (3), 187–202.
Vuong, Quang H., 1989. Likelihood ratio tests for model selection and non-nestedhypotheses. Econometrica 57 (2), 307–333.
World Bank, 2007. Agriculture for Development. World Development Report 2008,Washington D.C., USA.
World Bank, Federal Government of Nigeria, 2010. The National FadamaDevelopment Program. http://fadama.org/ (retrieved on 05.12.10).
Xu, Z., Burke, W.J., Jayne, T.S., Govereh, J., 2009. Do input subsidy programs ‘CrowdIn’ or ‘Crowd Out’ commercial market development? Modeling fertilizerdemand in a two-channel marketing system. Agric. Econ. 40 (1), 79–94.