family dollar
DESCRIPTION
abcTRANSCRIPT

04/19/2023 Copyright 2012, Tony Gauvin, UMFK 1

2
FAMILY DOLLAR, 2009
3
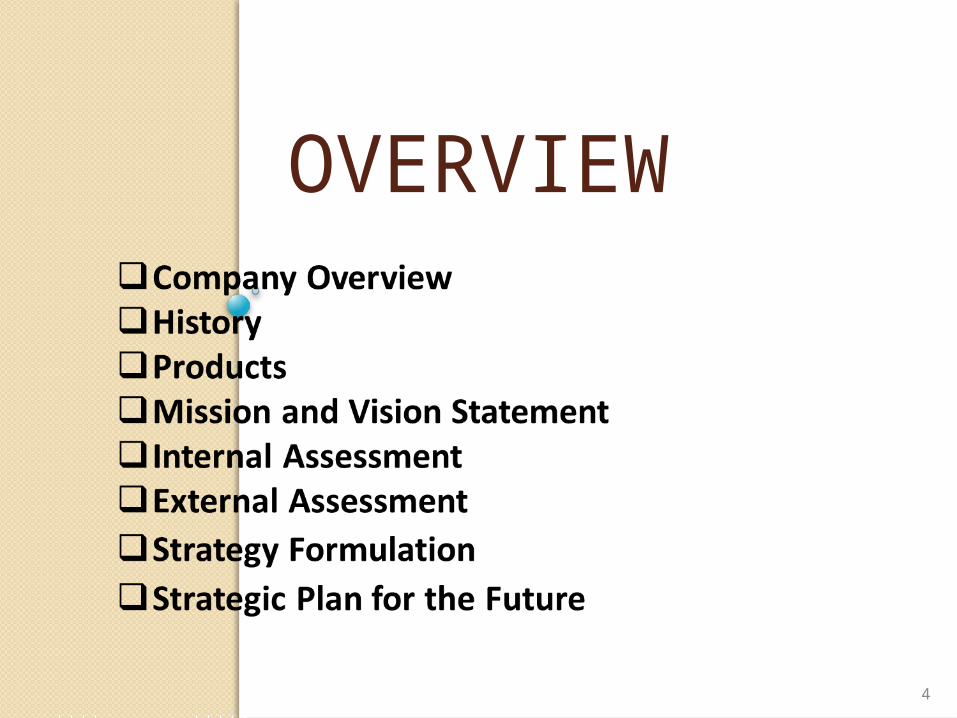
OVERVIEW
4

COMPANY OVERVIEW
5

History
6
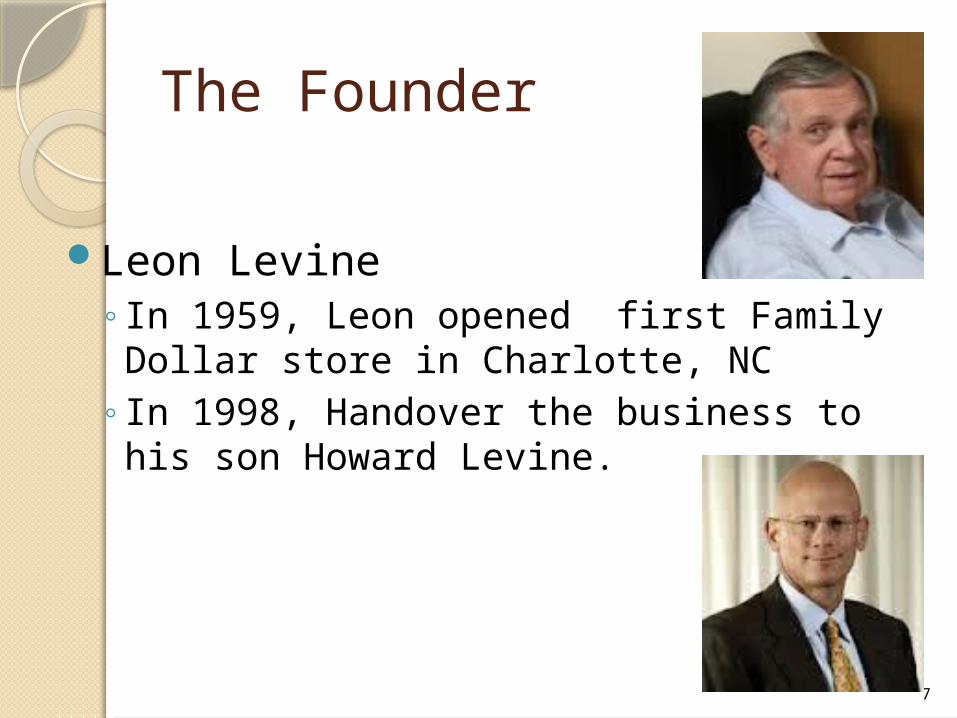
The Founder
Leon Levine ◦In 1959, Leon opened first Family Dollar
store in Charlotte, NC◦In 1998, Handover the business to his
son Howard Levine.
7
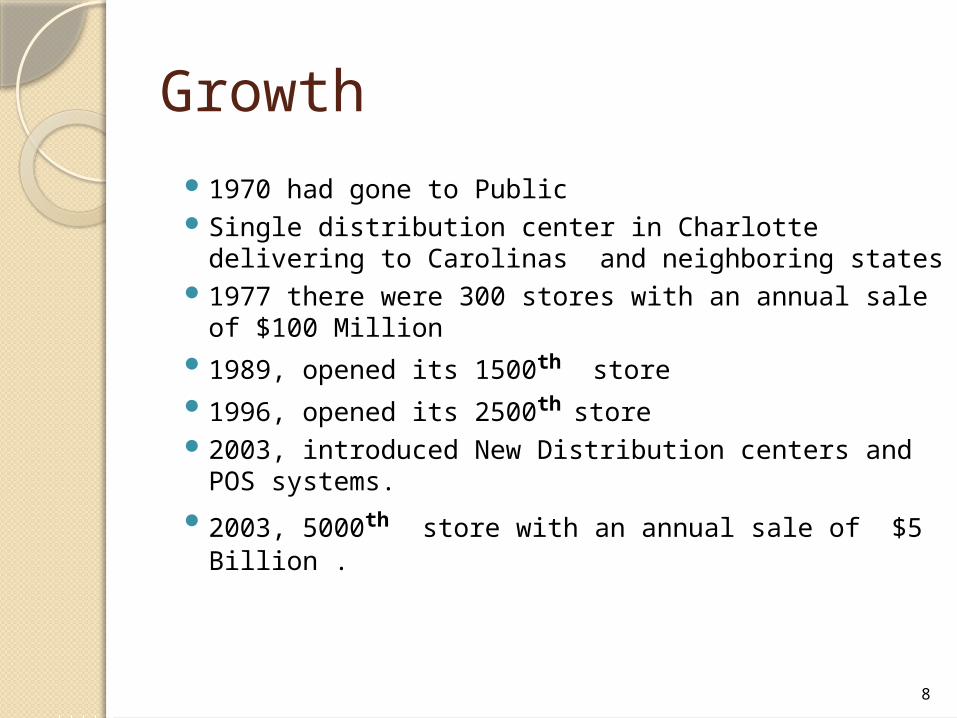
Growth1970 had gone to PublicSingle distribution center in Charlotte delivering to
Carolinas and neighboring states 1977 there were 300 stores with an annual sale of
$100 Million1989, opened its 1500th store1996, opened its 2500th store2003, introduced New Distribution centers and POS
systems.2003, 5000th store with an annual sale of $5 Billion .
8
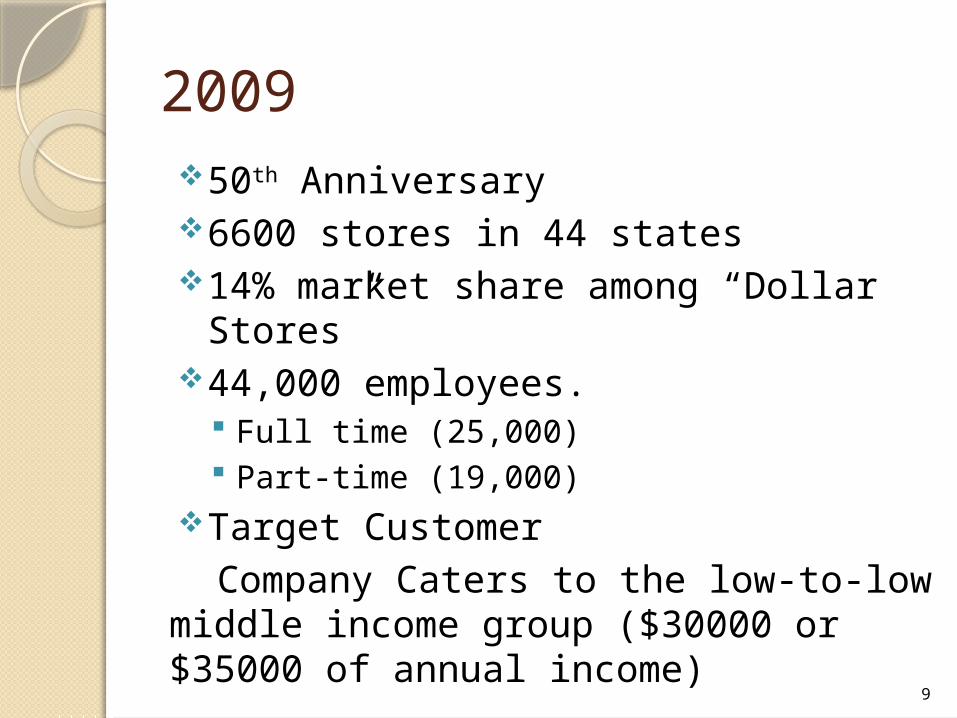
2009 50th Anniversary6600 stores in 44 states14% market share among “Dollar
Stores”44,000 employees.
Full time (25,000) Part-time (19,000)
Target CustomerCompany Caters to the low-to-low
middle income group ($30000 or $35000 of annual income)
9

Organizational Chart
10
11 person Board
CEO & CHAIRMAN OF THE BOARD
EVP SUPPL
Y CHAINDC
MANGERS
DC MANGERS
EVP STOR
E OPERATION
S
REGIONAL MANAGERS
STORE MANGERSSTORE MANGERS
SVP GLOB
AL SOURCING
SVP INVENTORY OPTI
MIZATION
SVP REAL ESTATE AND FACILITIES
SVP CUSTOMER MARKETING
SVP FOOD
SVP FINAN
CECFO

11
4,141
4,616
5,027
5,466
5,898
6,394
6,834 6,983 6,984
Store Count Revenue

04/19/2023 Copyright 2012, Tony Gauvin, UMFK 12

13

COMPANY PRODUCTS
14

15

16

Existing vision
17
To be the best small-format convenience and value retailer serving the needs of families in our neighborhoods
Existing Mission
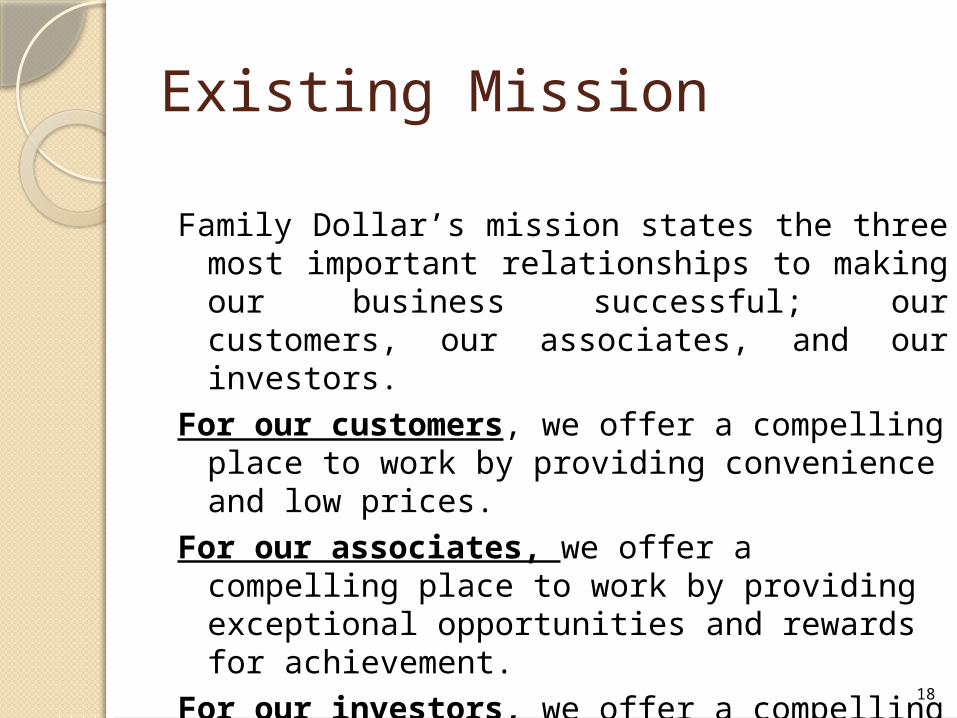
Family Dollar’s mission states the three most important relationships to making our business successful; our customers, our associates, and our investors.
For our customers, we offer a compelling place to work by providing convenience and low prices.
For our associates, we offer a compelling place to work by providing exceptional opportunities and rewards for achievement.
For our investors, we offer a compelling place to invest by providing outstanding returns. 18

19

Vision (proposed)
20
Family Dollar Stores, Inc. brings valued merchandise
to its loyal customers

Mission (Proposed)
21
At Family Dollar, we strive to bring the best to our customers, offering everyday items at everyday low prices (1). We seek to meet our customer’s basic needs, providing them with common household products (2) at affordable prices while maintaining our growth and profitability to our loyal stockholders (5) utilizing the latest technology and through dedicated employees (4, 9). Our purpose has been to open stores where we strongly believe we can be competitive while meeting the demands of our customers (3). We continue to be responsible by contributing back to communities, society and charitable events (6, 7, 8).
1. Customer2. Products or services3. Markets4. Technology5. Concern for survival,
profitability, growth6. Philosophy7. Self-concept8. Concern for public image9. Concern for employees
22
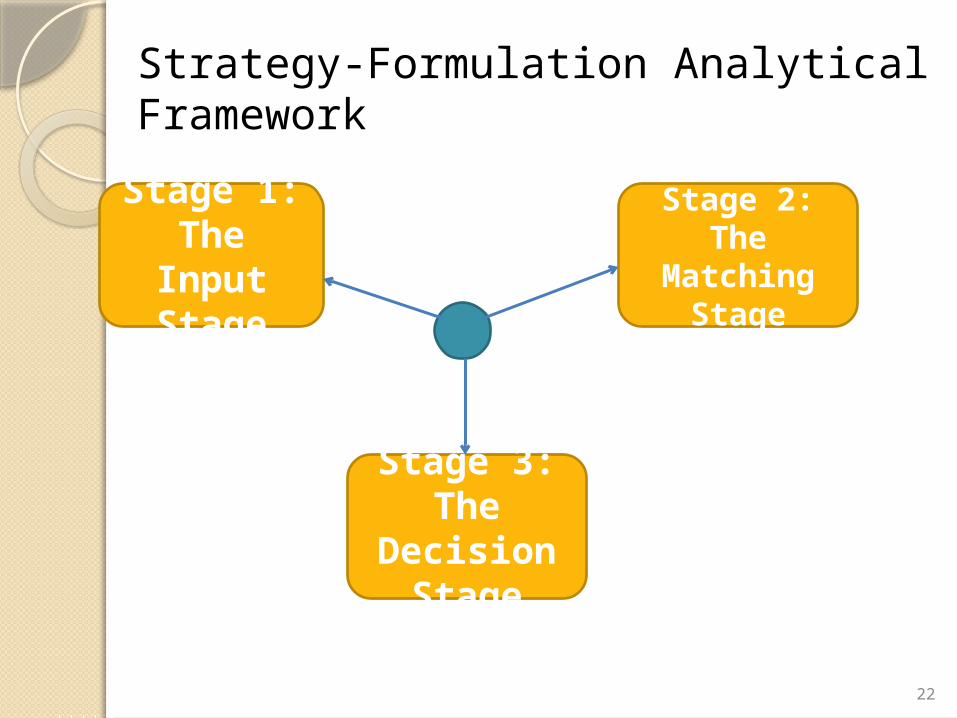
Strategy-Formulation Analytical Framework
Stage 2:The Matching
Stage
Stage 1:The Input
Stage
Stage 3:The Decision
Stage
23
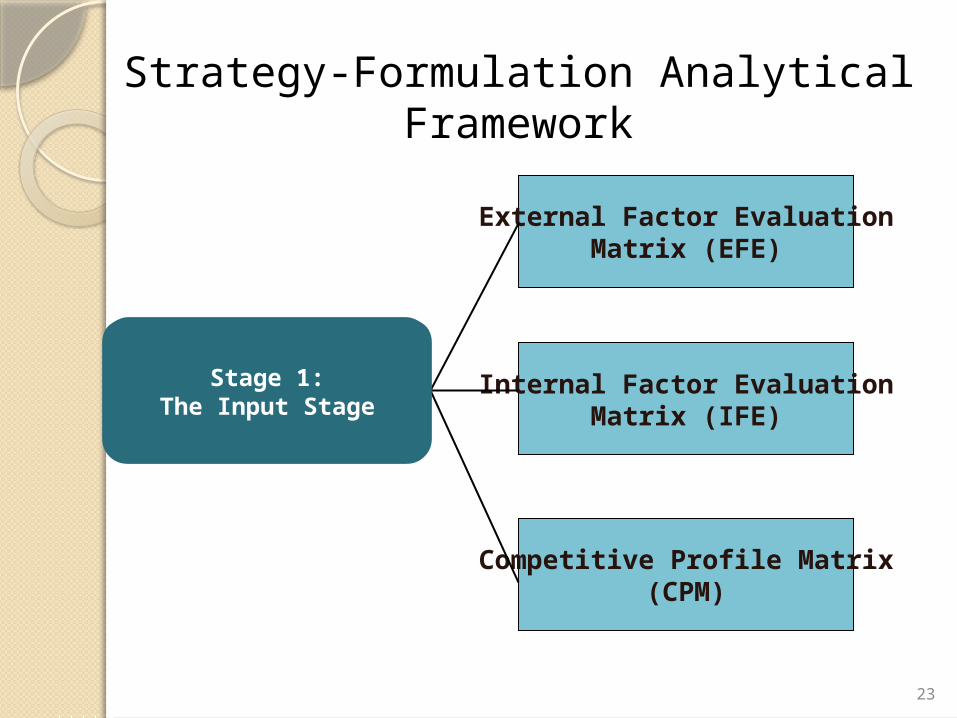
External Factor EvaluationMatrix (EFE)
Internal Factor EvaluationMatrix (IFE)
Competitive Profile Matrix(CPM)
Stage 1:The Input Stage
Strategy-Formulation Analytical Framework
24

25
External Factor Evaluation MatrixKey External Factors Weight Rating Weighted
Score
Opportunities
1. The income for the middle class is diminishing, causing them to be more cautious with their expenditures 0.1 4 0.4
2. The average household income is dropping due to weak economy 0.1 3 0.3
3. The demand for low-priced items is growing 0.07 3 0.214. The unemployment rate is increasing 0.09 4 0.365. Smaller retailers are closing their stores and some have filed for
bankruptcy 0.08 3 0.24
Threats 1. High competition among large discount retailers 0.1 3 0.32. Dollar General has higher market share compare to Family
Dollar 0.09 2 0.18
3. Per square foot, Dollar General is creating more sales 0.07 2 0.144. The industry is sensitive to economic conditions 0.08 3 0.245. Change in demographics due to purchasing habits 0.05 3 0.156. Increase in tariffs and trade barriers 0.07 1 0.077. Lack of quality control in products due to being imported from
other countries 0.1 1 0.1
TOTAL 1.00 2.69

INTERNAL AUDIT
26
Internal Factor Evaluation Matrix

27
Key Internal Factors Weight RatingWeighted
Score
Strengths
1. Sells essential items with relatively inelastic demand 0.05 3 0.152. Healthy gross profit margin 0.05 3 0.153. Accepts food stamps 0.08 4 0.324. Lower than industry average leverage ratio 0.05 3 0.155. Being able to raise its dividends 0.03 3 0.096. Better than industry average total asset turnover 0.03 3 0.097. Its return on assets of 1.84% is higher than the industry average 0.02 3 0.068. Its return on equity is 4%, higher than the industry average 0.03 3 0.099. Approximately 90% of the company’s products are priced below $10 0.07 3 0.21
10.In the past year, the company’s stock has outperformed the average retail industry . 0.03 3 0.09
Weaknesses1. Does not do much advertising 0.07 2 0.142. Limited market share……! 0.08 2 0.16
3. In the year 2008, the company's market share dropped from 1.85% to 1.75% 0.08 2 0.16
4. The company's EPS is only 72% of the industry average and is not growing as quickly as the industry average 0.05 1 0.05
5. Limited in variety of products being offered 0.08 2 0.16
6. For the year 2008, the company's overall sales only grew by 2.18% whereas the average industry sales grew by 5.31% 0.07 2 0.14
7. Does not generate enough sales from its web site due to limited technology 0.08 2 0.16
8.Higher than industry average quick ratio, indicating lack of long term re-investment 0.03 2 0.06
9.The company's long-term debt to equity ratio is only 31.4% of the industry average 0.02 1 0.02
TOTAL 1.00 2.45

28
Competitive Position
Family Dollar
Dollar General Dollar Tree
Year Started 1959 1939 1953
2009 Annual Sale $6,984 m $9,454 m $4,645 m
2009 Net Income $233 m $13 m $230 m
No. of Stores 6,600 8,400 3,600
No. of States 44 35 48
No. of Employees 44,000 71,500 46,000
Fortune 500 Rank 359 357 499
29
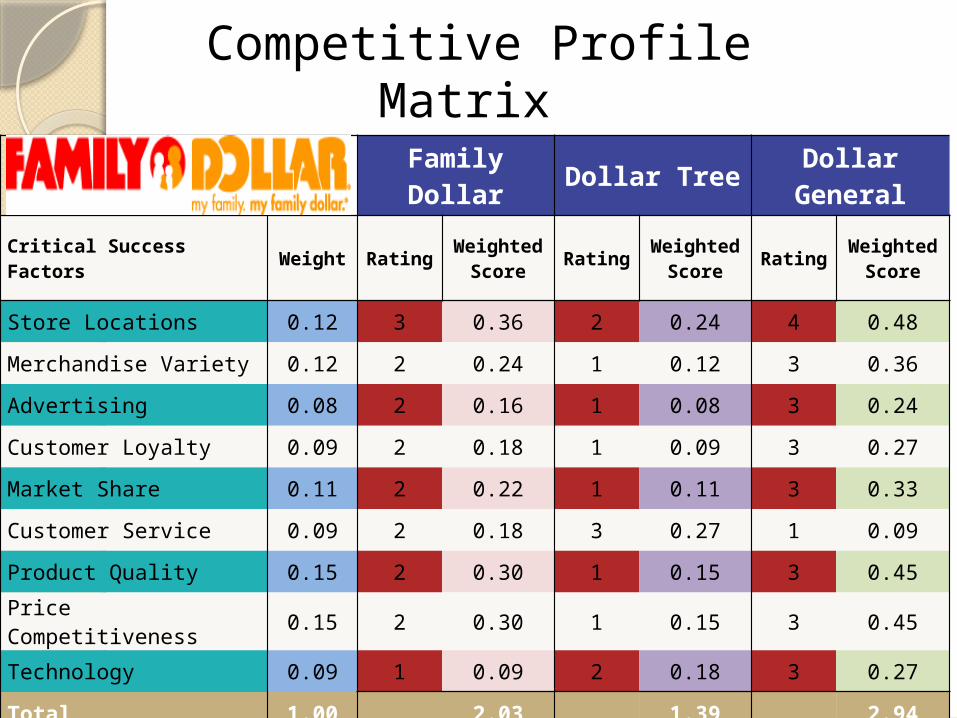
Competitive Profile Matrix
Family Dollar Dollar Tree Dollar General
Critical Success Factors Weight RatingWeighted
ScoreRating
Weighted Score
RatingWeighted
Score
Store Locations 0.12 3 0.36 2 0.24 4 0.48
Merchandise Variety 0.12 2 0.24 1 0.12 3 0.36
Advertising 0.08 2 0.16 1 0.08 3 0.24
Customer Loyalty 0.09 2 0.18 1 0.09 3 0.27
Market Share 0.11 2 0.22 1 0.11 3 0.33
Customer Service 0.09 2 0.18 3 0.27 1 0.09
Product Quality 0.15 2 0.30 1 0.15 3 0.45
Price Competitiveness 0.15 2 0.30 1 0.15 3 0.45
Technology 0.09 1 0.09 2 0.18 3 0.27
Total 1.00 2.03 1.39 2.94

30
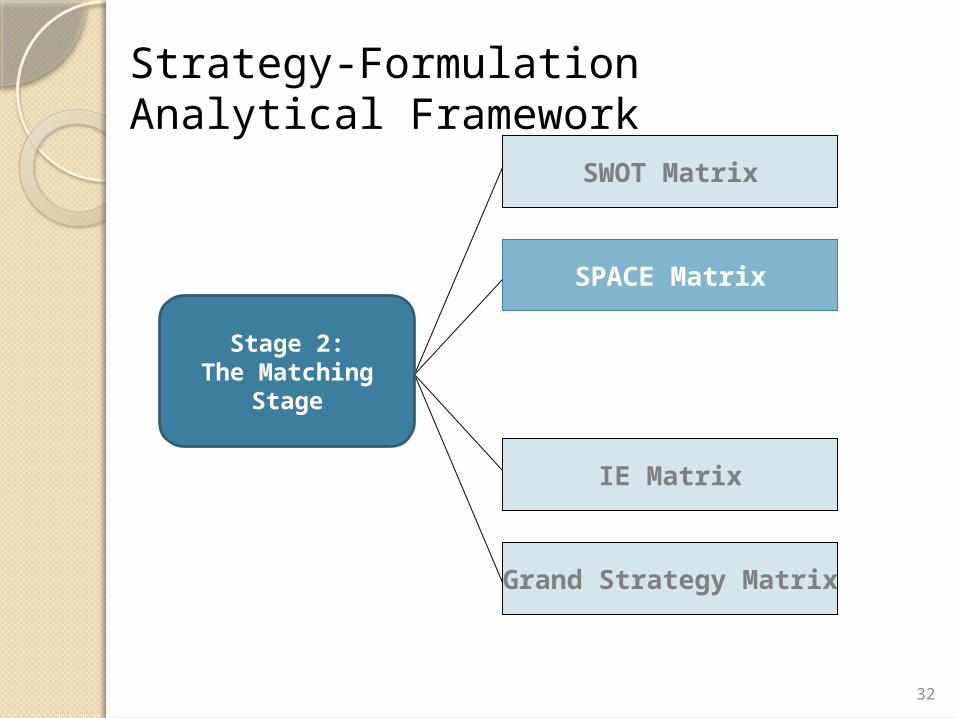
SWOT Matrix
SPACE Matrix
IE Matrix
Grand Strategy Matrix
Stage 2:The Matching Stage
Strategy-Formulation Analytical Framework
31
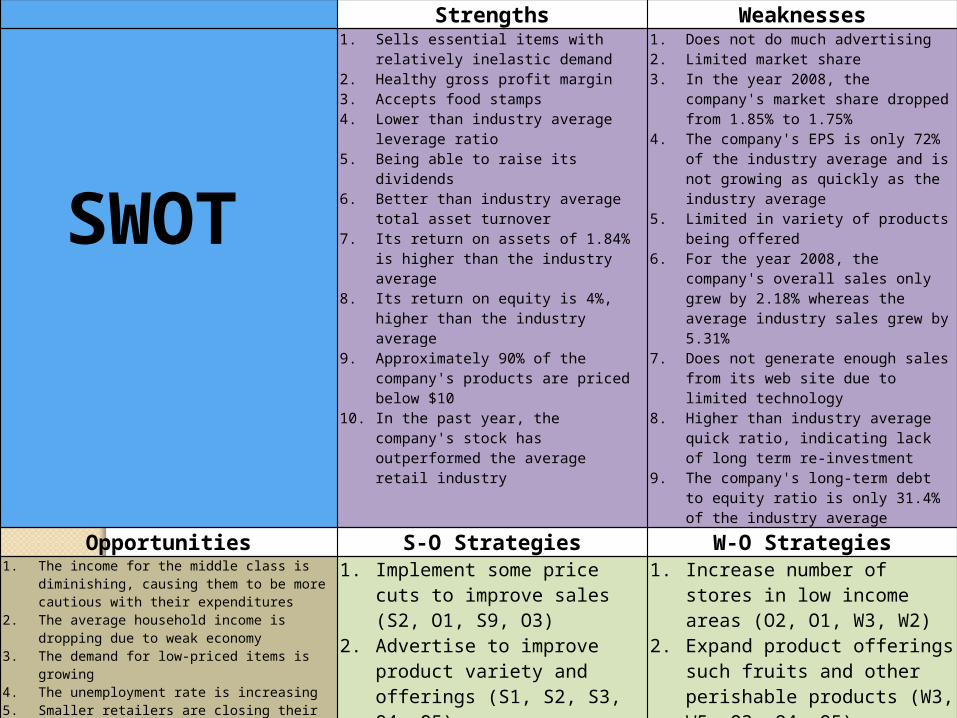
Strengths Weaknesses1. Sells essential items with relatively
inelastic demand2. Healthy gross profit margin3. Accepts food stamps4. Lower than industry average
leverage ratio5. Being able to raise its dividends6. Better than industry average total
asset turnover 7. Its return on assets of 1.84% is
higher than the industry average8. Its return on equity is 4%, higher
than the industry average9. Approximately 90% of the
company's products are priced below $10
10. In the past year, the company's stock has outperformed the average retail industry
1. Does not do much advertising2. Limited market share3. In the year 2008, the company's
market share dropped from 1.85% to 1.75%
4. The company's EPS is only 72% of the industry average and is not growing as quickly as the industry average
5. Limited in variety of products being offered
6. For the year 2008, the company's overall sales only grew by 2.18% whereas the average industry sales grew by 5.31%
7. Does not generate enough sales from its web site due to limited technology
8. Higher than industry average quick ratio, indicating lack of long term re-investment
9. The company's long-term debt to equity ratio is only 31.4% of the industry average
Opportunities S-O Strategies W-O Strategies1. The income for the middle class is
diminishing, causing them to be more cautious with their expenditures
2. The average household income is dropping due to weak economy
3. The demand for low-priced items is growing4. The unemployment rate is increasing5. Smaller retailers are closing their stores and
some have filed for bankruptcy
1. Implement some price cuts to improve sales (S2, O1, S9, O3)
2. Advertise to improve product variety and offerings (S1, S2, S3, O4, O5)
1. Increase number of stores in low income areas (O2, O1, W3, W2)
2. Expand product offerings such fruits and other perishable products (W3, W5, O3, O4, O5)
Threats S-T Strategies W-T Strategies1. High competition among large discount
retailers2. Dollar General has higher market share
compare to Family Dollar3. Per square foot, Dollar General is creating
more sales 4. The industry is sensitive to economic
conditions 5. Change in demographics due to purchasing
habits6. Increase in tariffs and trade barriers7. Lack of quality control in products due to
being imported from and other countries
1. Due to better return on assets ratio, the company can invest in technology, promoting online selling (S6, T1, T5)
1. Increase advertising by offering discounts, coupons, and other special offerings (W1, W2, W3, T1, T2, T3, T4)
SWOT
32
SWOT Matrix
SPACE Matrix
IE Matrix
Grand Strategy Matrix
Stage 2:The Matching Stage
Strategy-Formulation Analytical Framework

33
Internal Dimensions External Dimensions
Financial Strength (FS)
Competitive Advantage (CA)
Environmental Stability (ES)
Industry Strength (IS)
Space Matrix
34
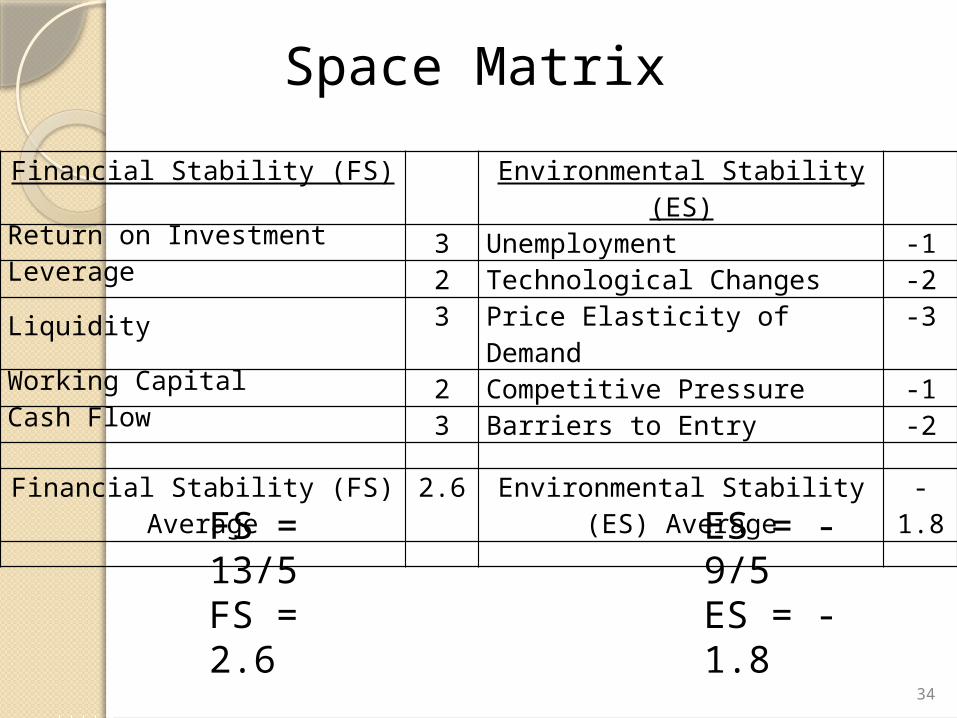
Financial Stability (FS) Environmental Stability (ES)Return on Investment 3 Unemployment -1Leverage 2 Technological Changes -2Liquidity 3 Price Elasticity of Demand -3Working Capital 2 Competitive Pressure -1Cash Flow 3 Barriers to Entry -2
Financial Stability (FS) Average
2.6 Environmental Stability (ES) Average
-1.8
Space Matrix
FS = 13/5FS = 2.6
ES = -9/5ES = -1.8

35
Space Matrix
Competitive Advantage (CA) Industry Stability (IS)Market Share -4 Growth Potential 4Product Quality -5 Financial Stability 2Customer Loyalty -4 Ease of Market Entry 5Competition’s Capacity Utilization
-3 Resource Utilization 3
Technological Know-How -6 Profit Potential 3
Competitive Stability (CS) -22 Industry Stability (IS) 3.4
CA = -22/5CA = -4.4
IS = 17/5IS = 3.4

36
Space Matrix
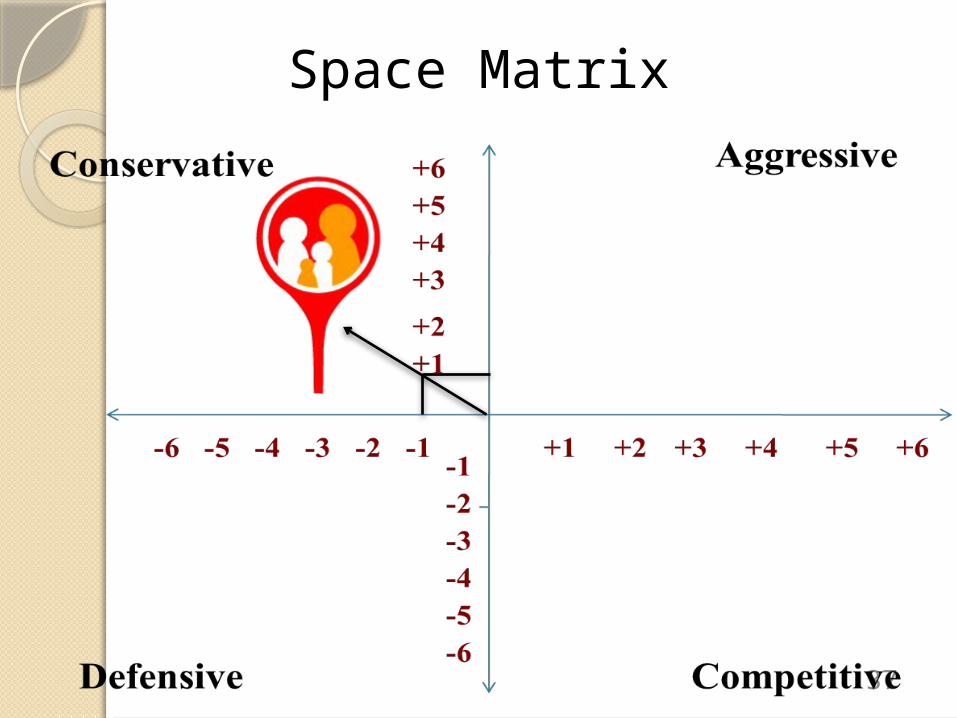
X-axis = CA+IS
= -4.4 + 3.4
= -1
Y-axis = FS+ES
= 2.6 - 1.8
= 0.8
37
Space Matrix

38
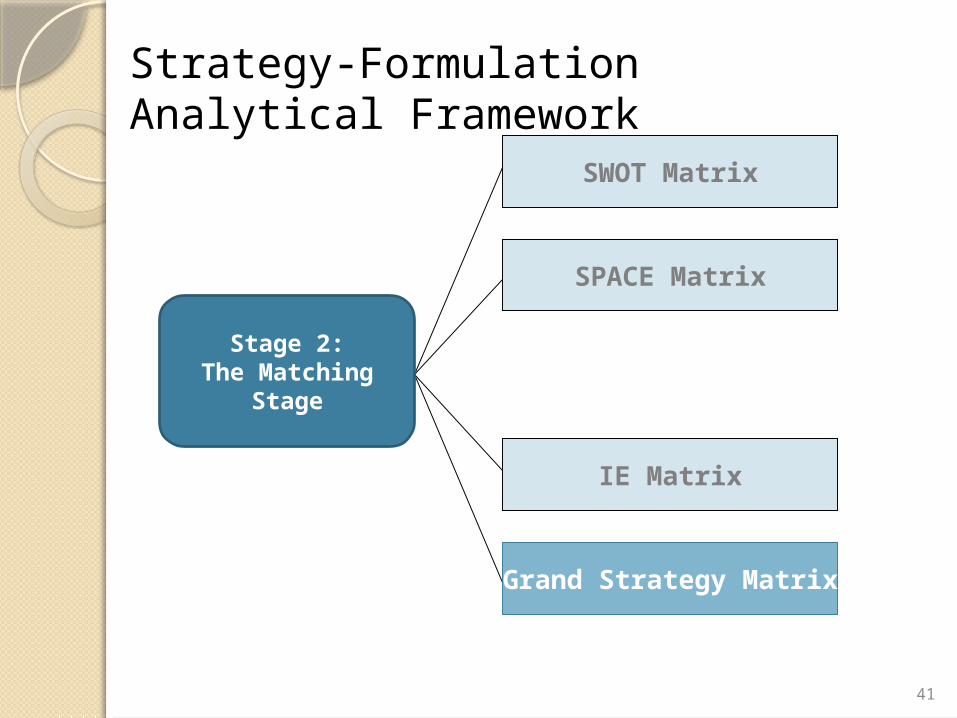
SWOT Matrix
SPACE Matrix
IE Matrix
Grand Strategy Matrix
Stage 2:The Matching Stage
Strategy-Formulation Analytical Framework
39
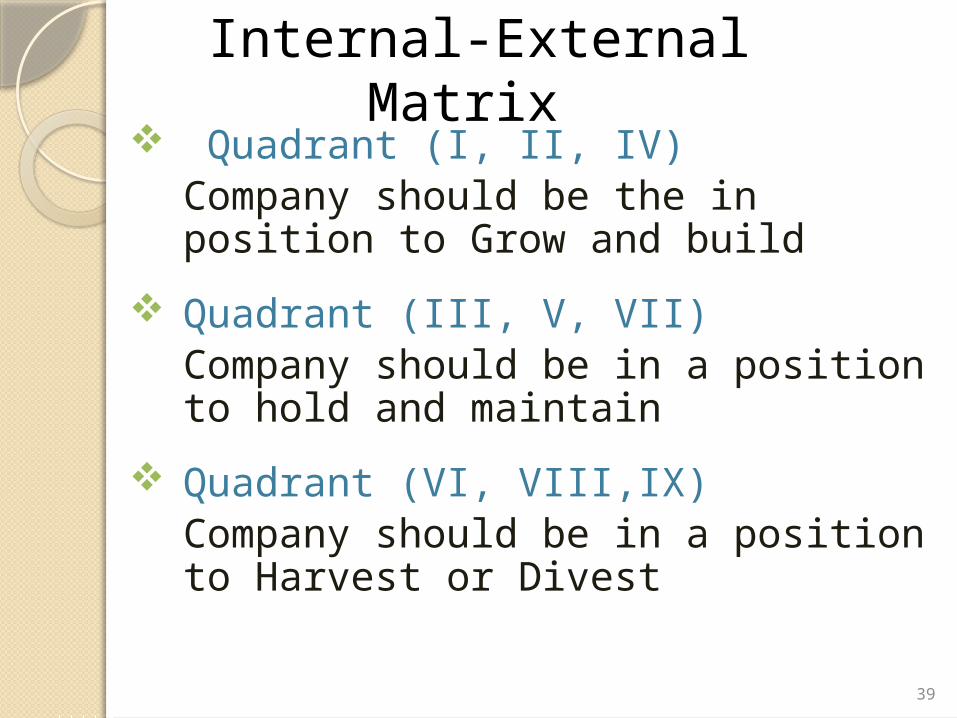
Quadrant (I, II, IV)Company should be the in position to Grow and build
Quadrant (III, V, VII) Company should be in a position to hold and maintain
Quadrant (VI, VIII,IX)Company should be in a position to Harvest or Divest
Internal-External Matrix

40
Strong3.0 to 4.0
Average2.0 to 2.99
Weak1.0 to 1.99
High3.0 to 3.99
I II III
Medium2.0 to 2.99
IV IV VI
Low1.0 to 1.99
VII VIII IX
IFE Total Weighted Score
EFE
Tota
l W
eig
hte
d
Sco
re
41
SWOT Matrix
SPACE Matrix
IE Matrix
Grand Strategy Matrix
Stage 2:The Matching Stage
Strategy-Formulation Analytical Framework

Rapid Market Growth
Quadrant II Quadrant I
Quadrant III Quadrant IV
Slow Market Growth
Weak Competitive
Position
Strong Competitive
Position
Market DevelopmentProduct DevelopmentMarket Penetration

43
Strategy-Formulation Analytical Framework
Quantitative StrategicPlanning Matrix
(QSPM)Stage 3:
The Decision Stage
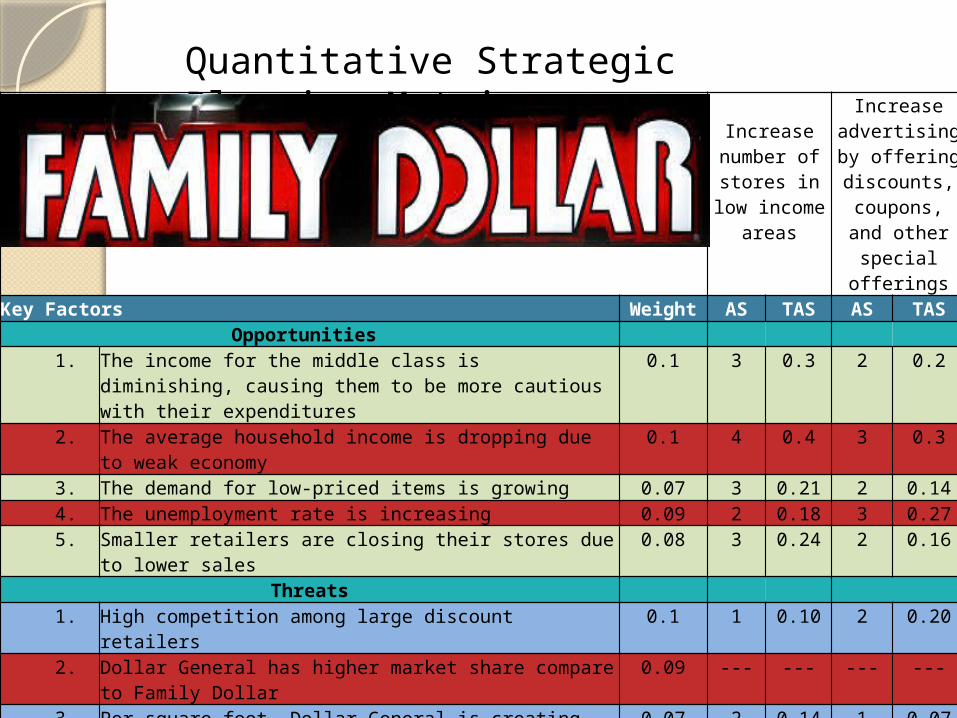
44
Increase number of
stores in low income areas
Increase advertising by
offering discounts,
coupons, and other special
offeringsKey Factors Weight AS TAS AS TAS
Opportunities 1. The income for the middle class is diminishing, causing them
to be more cautious with their expenditures0.1 3 0.3 2 0.2
2. The average household income is dropping due to weak economy
0.1 4 0.4 3 0.3
3. The demand for low-priced items is growing 0.07 3 0.21 2 0.144. The unemployment rate is increasing 0.09 2 0.18 3 0.275. Smaller retailers are closing their stores due to lower sales 0.08 3 0.24 2 0.16
Threats 1. High competition among large discount retailers 0.1 1 0.10 2 0.202. Dollar General has higher market share compare to Family
Dollar0.09 --- --- --- ---
3. Per square foot, Dollar General is creating more sales 0.07 2 0.14 1 0.074. The industry is sensitive to economic conditions 0.08 3 0.24 1 0.085. Change in demographics due to purchasing habits 0.05 3 0.15 2 0.16. Increase in tariffs and trade barriers 0.07 --- --- --- ---7. Lack of quality control in products due to being imported from
and other countries 0.1 --- --- --- ---
TOTAL 1.00 1.96 1.52
Quantitative Strategic Planning Matrix

45
Strengths 1. Sells essential items with relatively inelastic demand 0.05 1 0.05 2 0.12. Healthy gross profit margin 0.05 2 0.1 4 0.23. Accepts food stamps 0.08 4 0.32 3 0.244. Lower than industry average leverage ratio 0.05 2 0.1 1 0.055. Being able to raise its dividends 0.03 --- --- --- ---6. Better than industry average total asset turnover 0.03 3 0.09 1 0.037. Its return on assets of 1.84% is higher than the industry
average0.02 --- --- --- ---
8. Its return on equity is 4%, higher than the industry average 0.03 --- --- --- ---9. Approximately 90% of the company's products are priced
below $100.07 4 0.28 3 0.21
10. In the past year, the company's stock has outperformed the average retail industry
0.03 3 0.09 2 0.06
Weaknesses 1. Does not do much advertising 0.07 1 0.07 3 0.212. Limited market, solely in the only 0.08 3 0.24 2 0.163. In the year 2008, the company's market share dropped from
1.85% to 1.75%0.08 4 0.32 2 0.16
4. The company's EPS is only 72% of the industry average and is not growing as quickly as the industry average
0.05 --- --- --- ---
5. Limited in variety of products being offered 0.08 2 0.16 1 0.086. For the year 2008, the company's overall sales only grew by
2.18% whereas the average industry sales grew by 5.31%0.07 2 0.14 3 0.21
7. Does not generate enough sales from its web site due to limited technology
0.08 1 0.08 2 0.16
8. Higher than industry average quick ratio, indicating lack of long term re-investment
0.03 --- --- --- ---
9. The company's long-term debt to equity ratio is only 31.4% of the industry average
0.02 1 0.02 2 0.04
SUBTOTAL 1.00 2.06 1.91SUM TOTAL ATTRACTIVENESS SCORE 4.02 3.43

Recommendations
46
(Market Development)Build additional stores in the U.S. Currently, many stores are closing and the price of real estate has dropped, in some areas, as high as 60%. Opening stores in lower priced areas.
Build/acquire 200 stores/year for next 3 years Grow to 7000+ stores till 2013
.

47