family demography - ssccjraymo/links/soc674/674_9.pdf · family demography 1) ... • increase in...
TRANSCRIPT
Family Demography
1) What is family demography or demography of
families?
2) Nuptiality
a. Marriage, Divorce, Cohabitation (?)
3) Family structure, living arrangements
(& changes therein)
AMERICAN FAMILIES:1900 UNTIL TODAY
• Increase in premarital sex and divorce, delayed marriage• Drop in birth rate• New, rebellious youth culture• Growing economic independence of women• Shift in marriage from economic partnership to
companionship and emotional satisfaction• Increase in privacy among family members
– Rise of individualism beginning– Birthrate decline– Adult life expectancy increased – More apartments were built for independent living

UNIQUE FAMILY ERAS:
THE GREAT DEPRESSION• Delays in marriage & childlessness • 1 in 5 never had children (1 in 10 norm)
– Divorce rate fell because people could not afford it.
WORLD WAR II• People marry and reproduce as soon as
economic circumstances permit. (Norman Ryder)
Unique Family Eras: Post War Baby Boom
• Early Marriage– Typical age at first marriage: 20 for women and
23 for men• Fertility Increase
– Baby Boom: Total Fertility Rate reached a high of 3.6 Due to
• Earlier Age of Childbearing, • Make-up Fertility of Depression and WW II generations• More Children, higher birth order

Total Fertility Rates
12345678
18001820184018601880190019201940196019801997
The second demographic transition: definition
• Below replacement fertility (at least in Europe)
• Package of associated family behaviors• Debate• Posited explanations
– Changes in economic circumstances – esp. women
– Value change – individuation, self-fulfillment
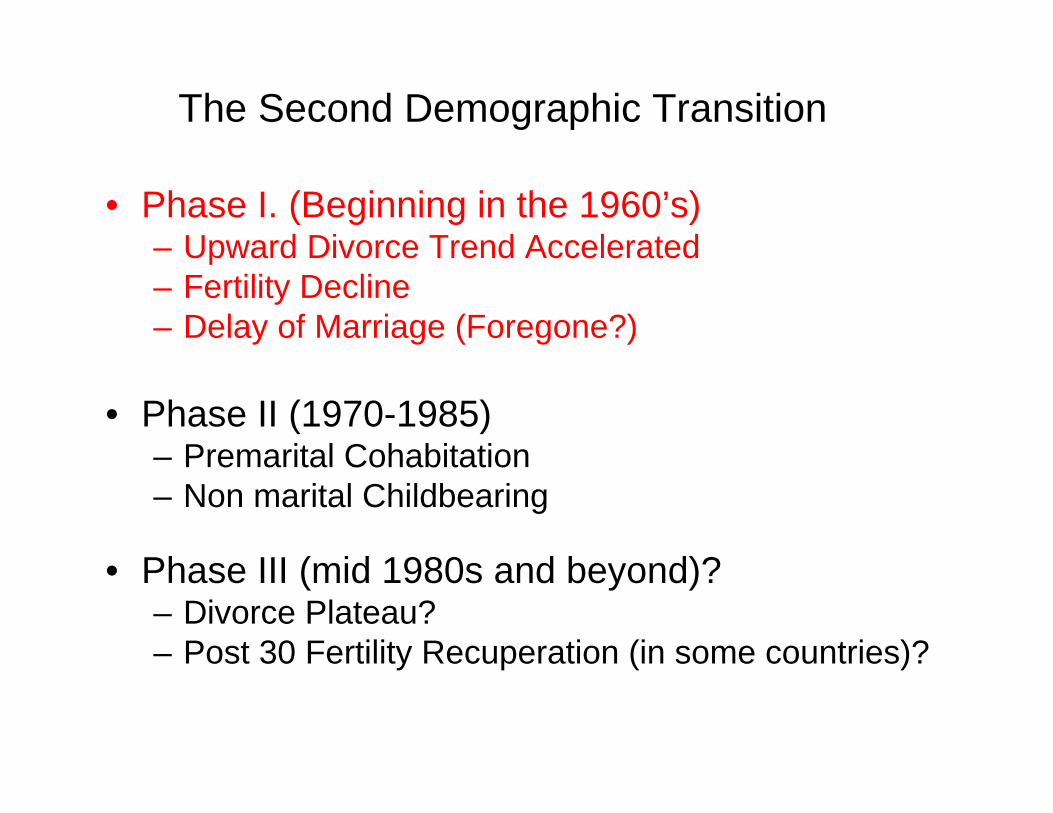
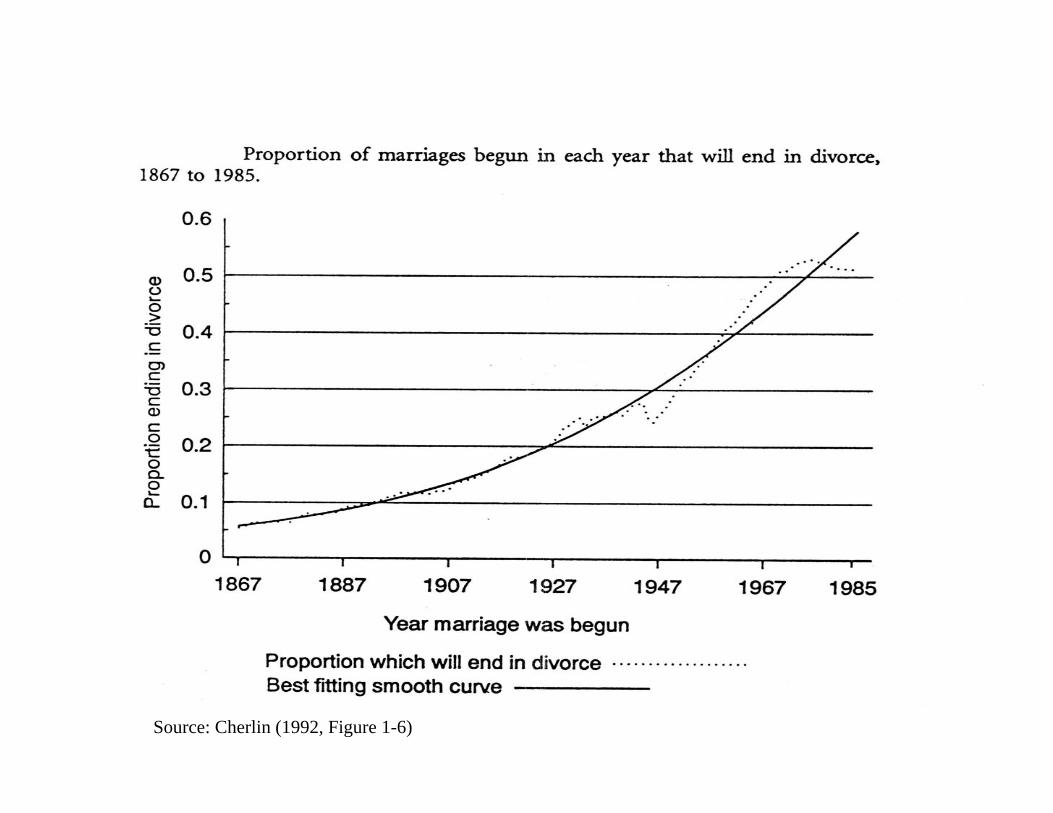
The Second Demographic Transition
• Phase I. (Beginning in the 1960’s)– Upward Divorce Trend Accelerated– Fertility Decline– Delay of Marriage (Foregone?)
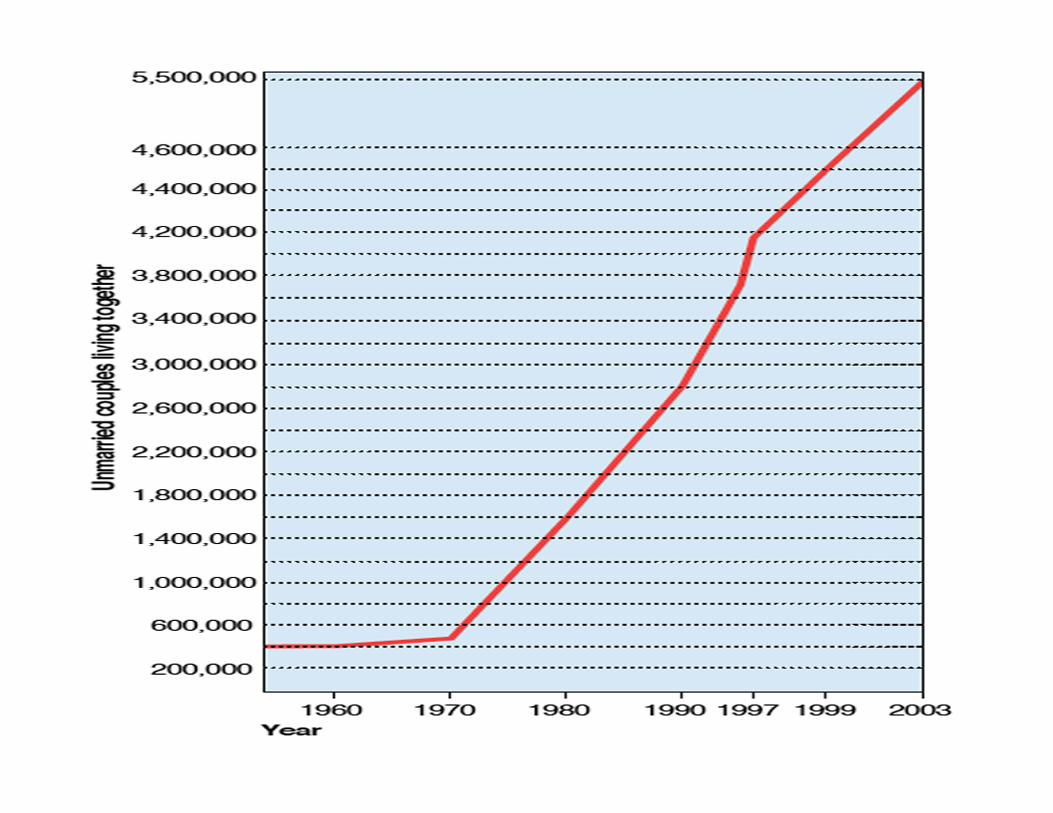
• Phase II (1970-1985)– Premarital Cohabitation– Non marital Childbearing
• Phase III (mid 1980s and beyond)?– Divorce Plateau? – Post 30 Fertility Recuperation (in some countries)?

Source: Cherlin (1992, Figure 1-6)
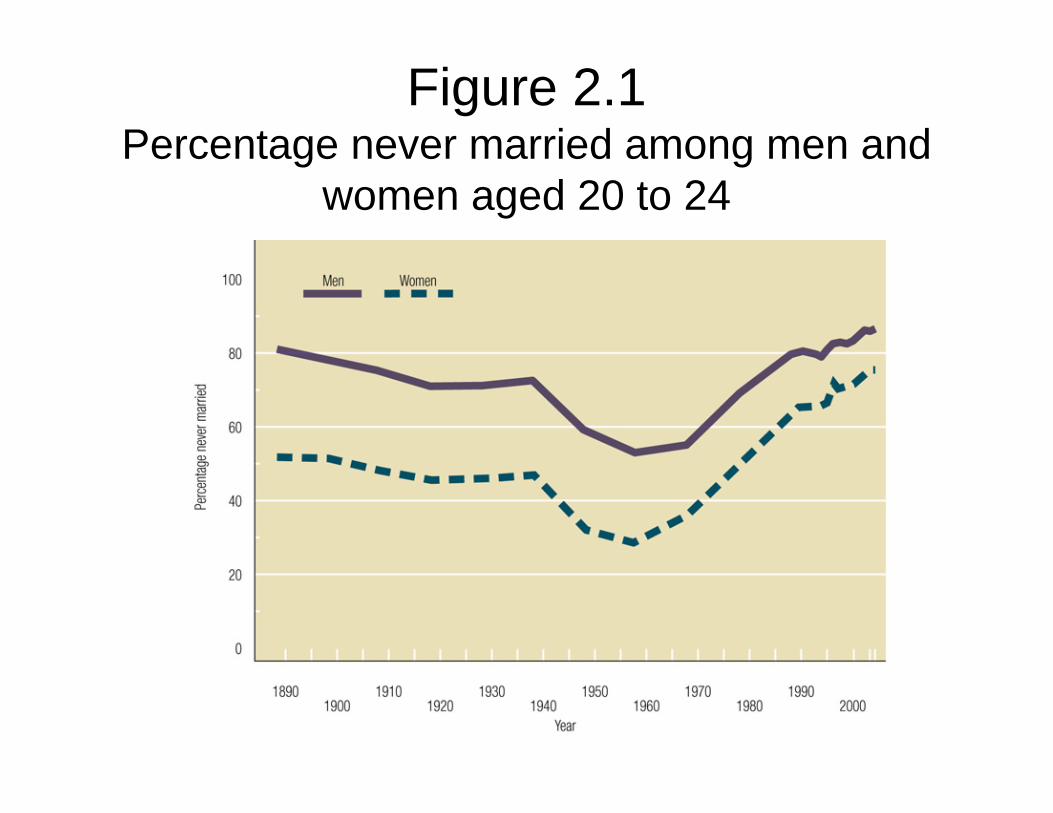
Figure 2.1Percentage never married among men and
women aged 20 to 24
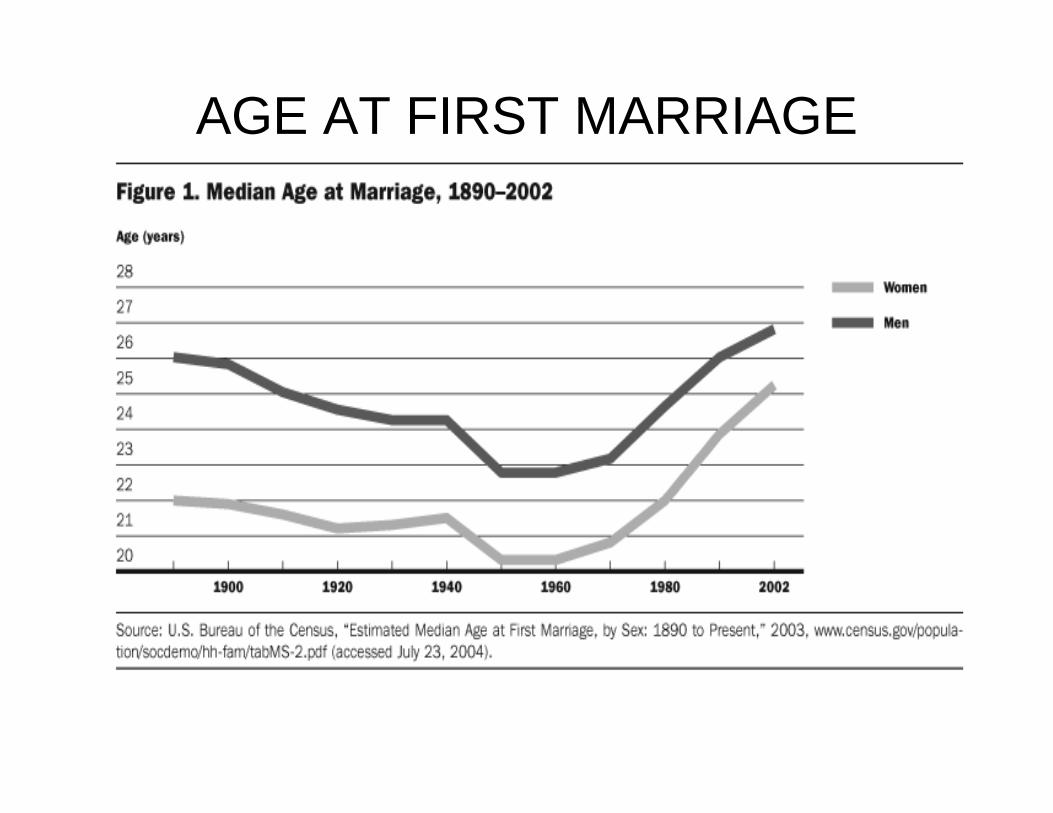
AGE AT FIRST MARRIAGE
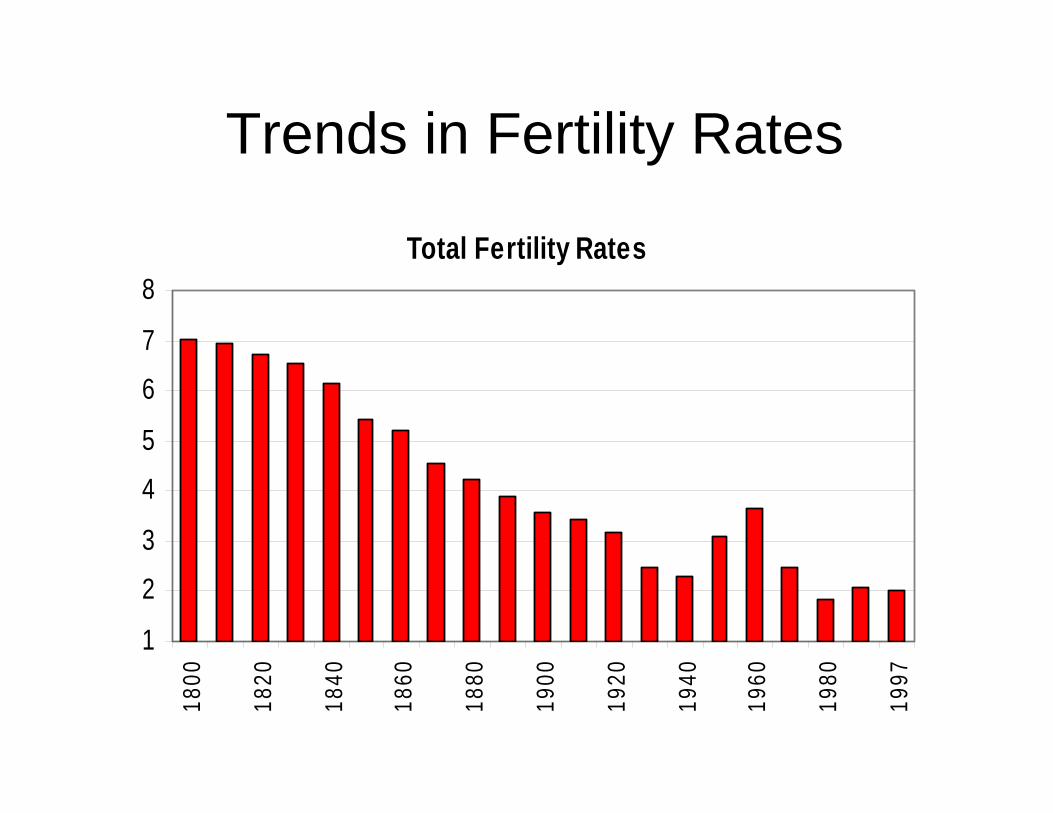
Trends in Fertility Rates
Total Fertility Rates
1
2
3
4
5
6
7
8
1800
1820
1840
1860
1880
1900
1920
1940
1960
1980
1997

The Second Demographic Transition
• Phase I. (Beginning in the 1960’s)– Upward Divorce Trend Accelerated– Fertility Decline– Delay of Marriage (Foregone?)
• Phase II (1970-1985)– Premarital Cohabitation– Non marital Childbearing
• Phase III (mid 1980s and beyond)?– Divorce Plateau? – Post 30 Fertility Recuperation (in some countries)?
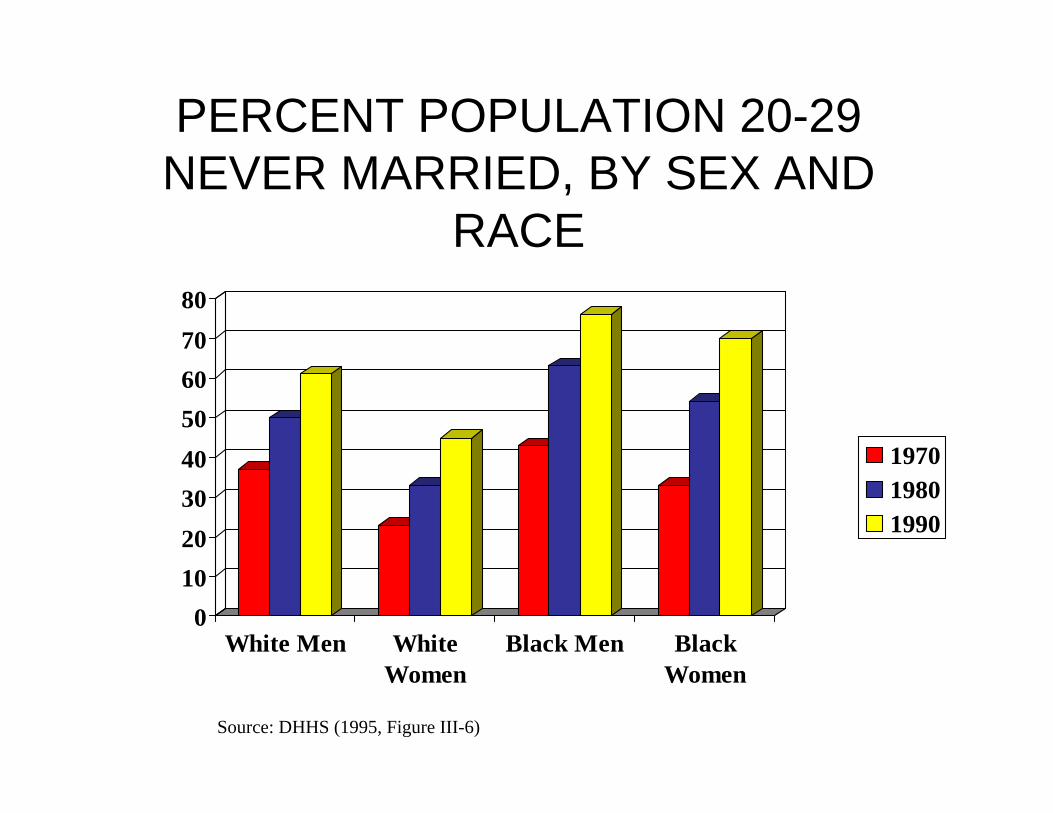
PERCENT POPULATION 20-29 NEVER MARRIED, BY SEX AND
RACE
01020304050607080
White Men WhiteWomen
Black Men BlackWomen
197019801990
Source: DHHS (1995, Figure III-6)
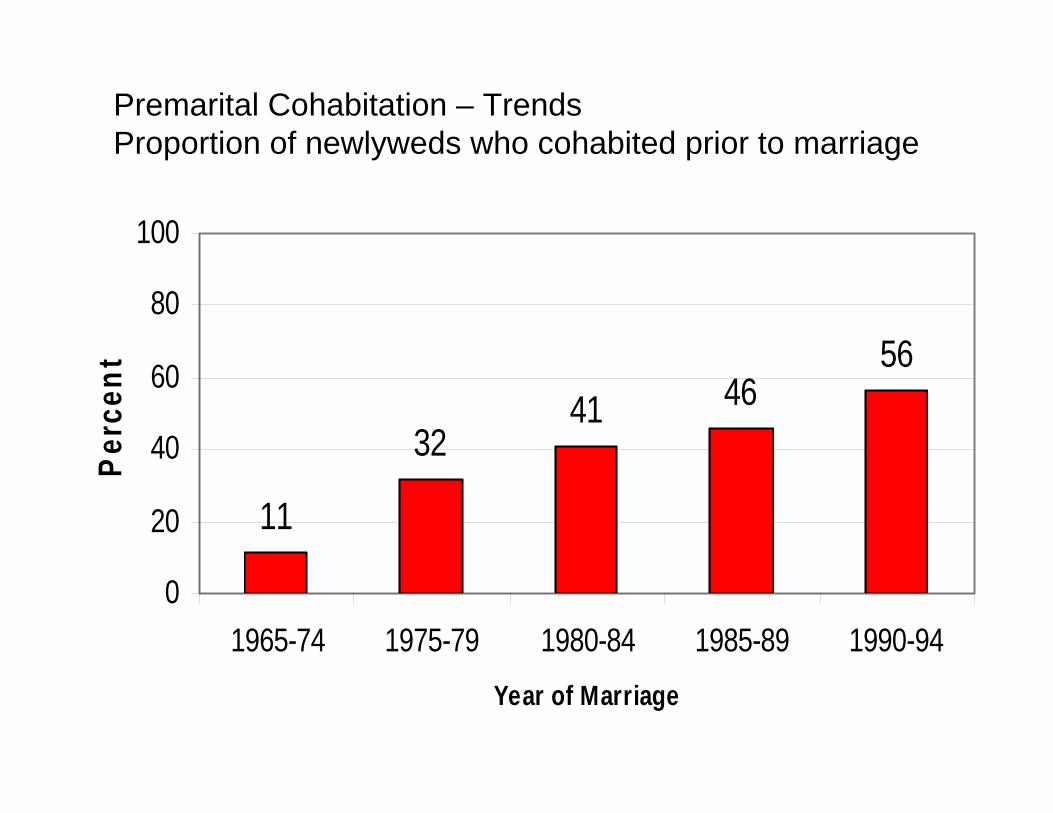
11
3241 46
56
0
20
40
60
80
100
1965-74 1975-79 1980-84 1985-89 1990-94Year of Marriage
Perc
ent
Premarital Cohabitation – TrendsProportion of newlyweds who cohabited prior to marriage

The Second Demographic Transition
• Phase I. (Beginning in the 1960’s)– Upward Divorce Trend Accelerated– Fertility Decline– Delay of Marriage (Foregone?)
• Phase II (1970-1985)– Premarital Cohabitation– Non marital Childbearing
• Phase III (mid 1980s and beyond)?– Divorce Plateau? – Post 30 Fertility Recuperation (in some countries)?

Divorce Rate, Per 1,000 Married Women 15+
0
5
10
15
20
25
1940
1943
1946
1949
1952
1955
1958
1961
1964
1967
1970
1973
1976
1979
1982
1985
1988
1991
1994
Source: Cherlin (1992, Figure 1-6)

Cross-national Comparisons of Divorce
Percent of Marriages Ending in Divorce
0
10
20
30
40
50
60
1965 1970 1975 1980 1985 1990 1995
Perc
ent
US Canada Sw eden Hungary Italy

OTHER MAJOR CHANGES IN THE U.S. FAMILY OVER THE PAST 40 (+) YEARS
• More sex outside of marriage• More remarriage/stepfamilies
The Second Demographic Transition
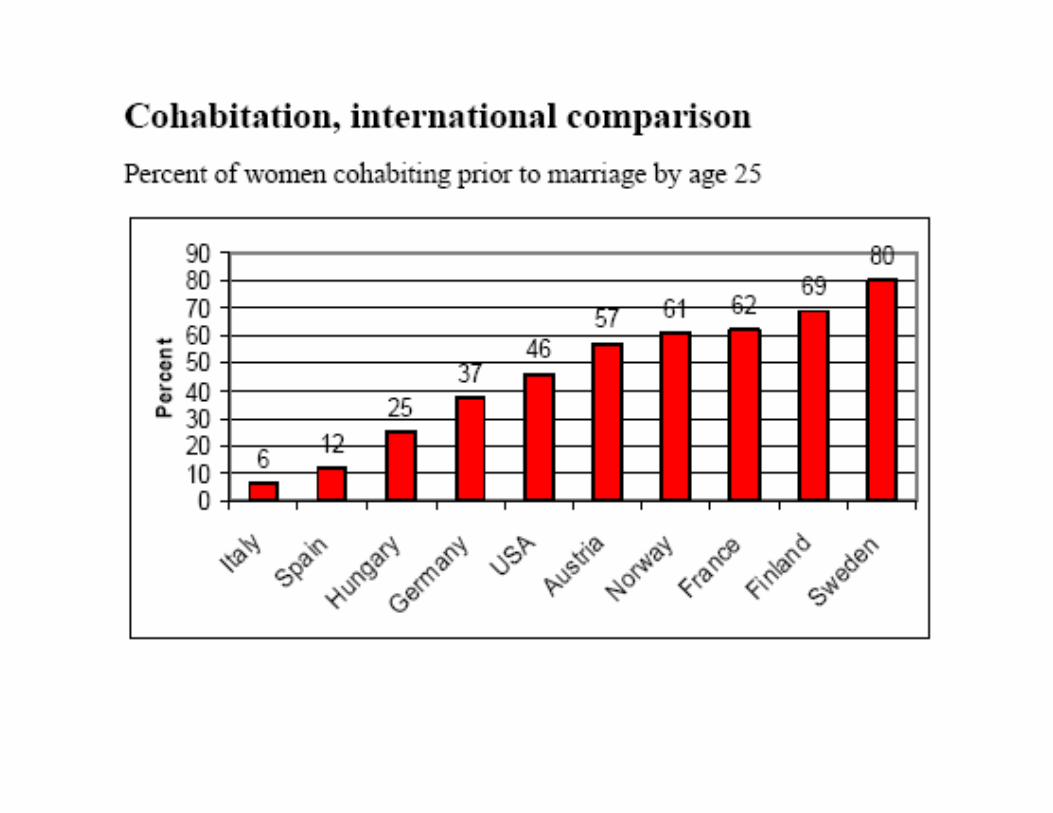
• Changes in family in US generally not unique
– Increases in marital disruption, cohabitation, age at marriage, and nonmarital childbearing are widely shared across industrialized societies.
• US distinct among industrialized societies
– Highest divorce rates.
– Highest share of single (non cohabiting) mothers with children
• 50% of all births are non marital in Sweden, Denmark, and Iceland, but most are in cohabiting unions. U.S. has higher percent of births outside unions.
• US’s higher divorce rate, and lower rates of cohabitation
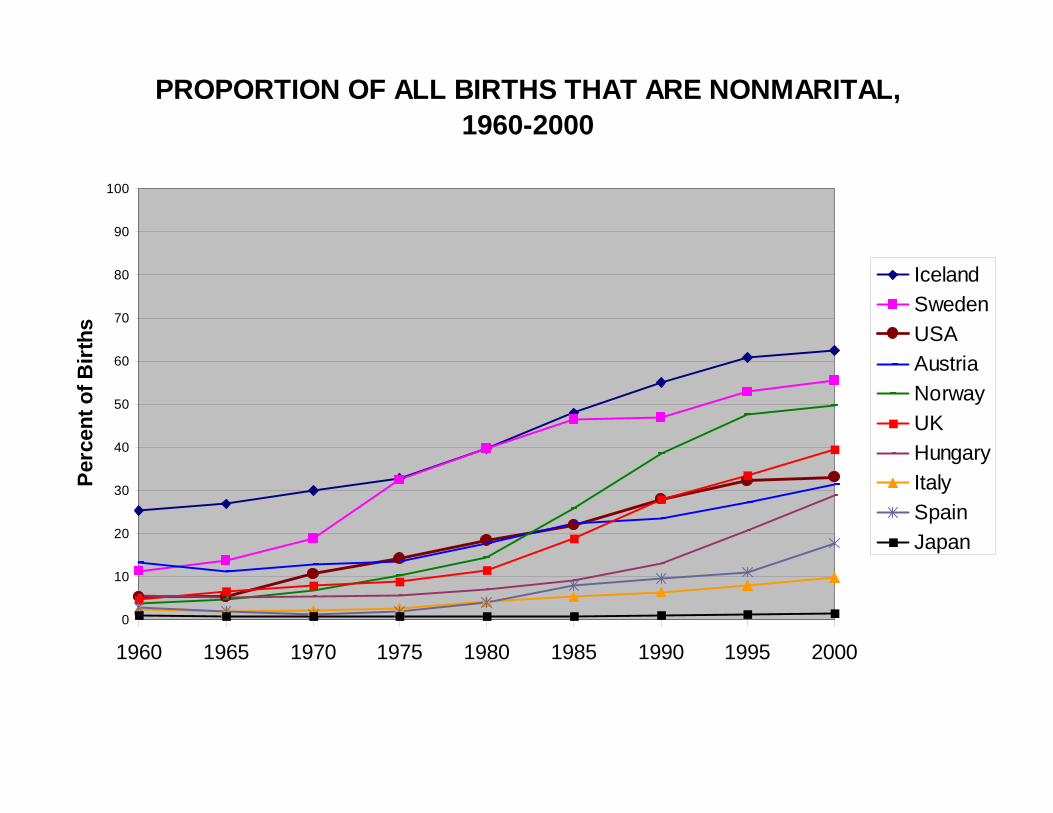
PROPORTION OF ALL BIRTHS THAT ARE NONMARITAL, 1960-2000
0
10
20
30
40
50
60
70
80
90
100
1960 1965 1970 1975 1980 1985 1990 1995 2000
Perc
ent o
f Birt
hs
IcelandSwedenUSAAustriaNorwayUKHungaryItalySpainJapan
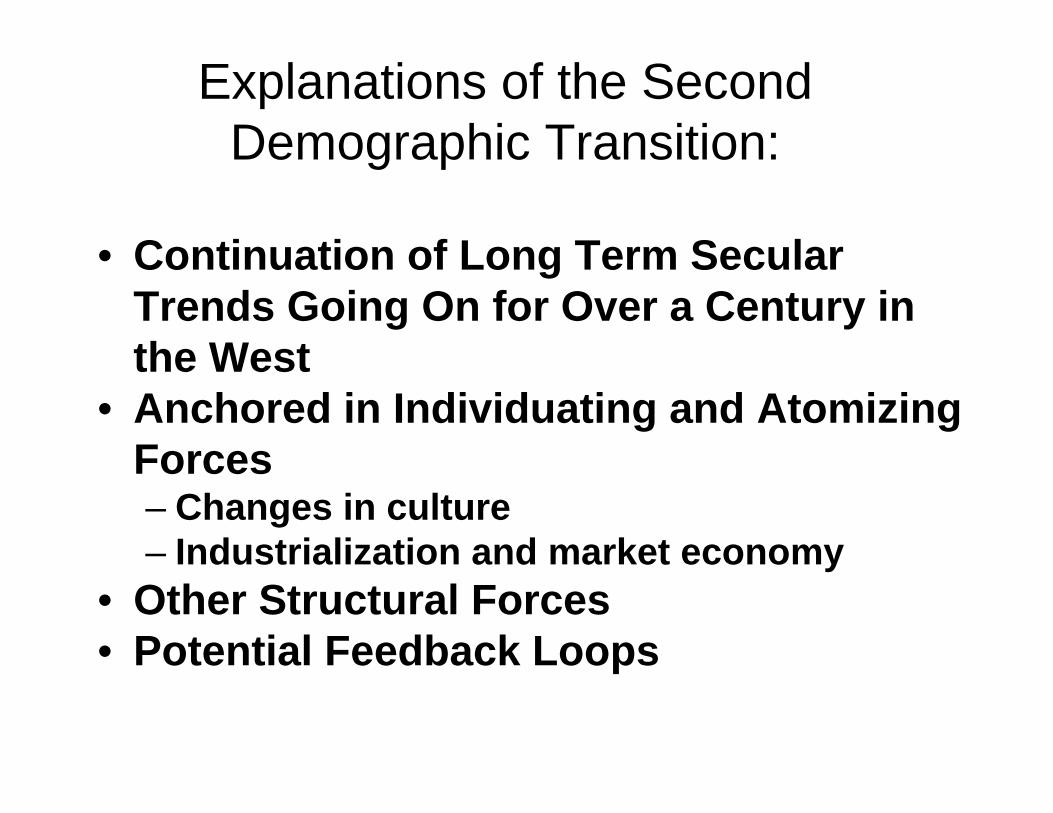
Explanations of the Second Demographic Transition:
• Continuation of Long Term Secular Trends Going On for Over a Century in the West
• Anchored in Individuating and Atomizing Forces– Changes in culture– Industrialization and market economy
• Other Structural Forces• Potential Feedback Loops
Changes in Culture Behind the Second Demographic Transition
• Rising Individualism: Legitimacy of “self-interest”as criteria for decision-making
• Consumerism: Increasing material aspirations• Weakening of normative imperatives governing
family life• Secularization of culture and family life• Less moral stigma• Women’s movement • The sexual revolution
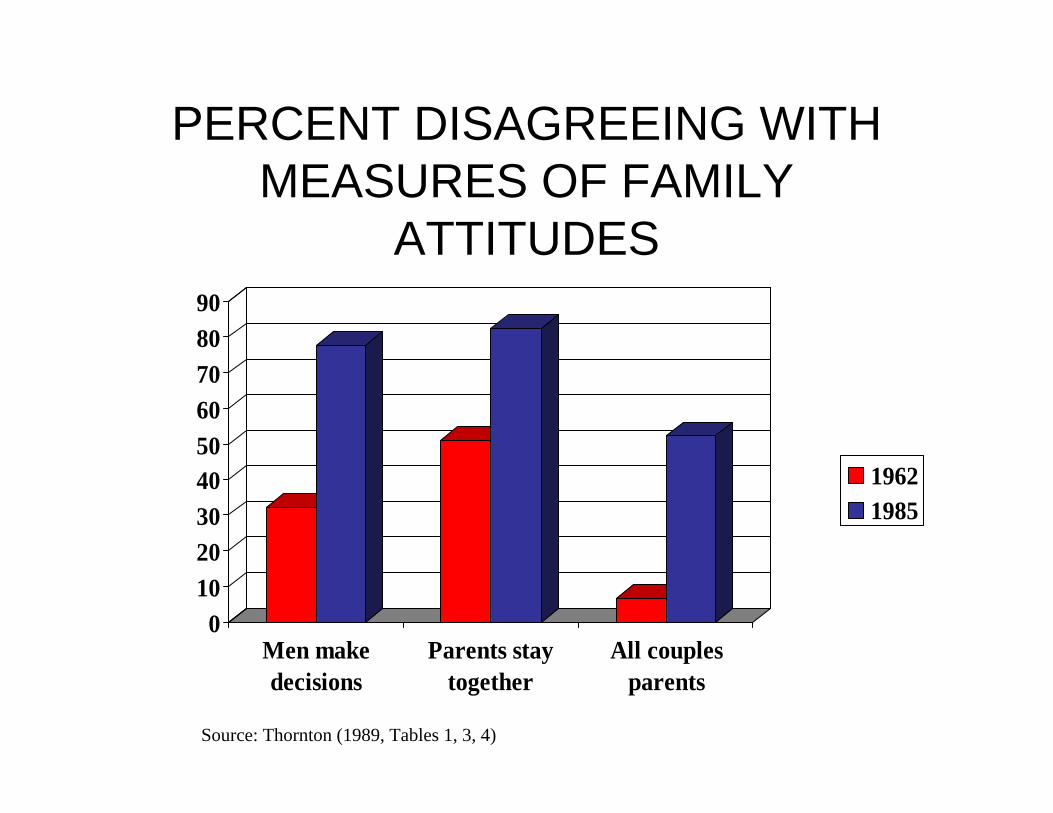
PERCENT DISAGREEING WITH MEASURES OF FAMILY
ATTITUDES
0102030405060708090
Men makedecisions
Parents staytogether
All couplesparents
19621985
Source: Thornton (1989, Tables 1, 3, 4)
Other Structural Changes Behind the Second Demographic Transition
• Education Trends• Technological innovation in birth control• Political
• Legalization of Abortion (1973)• Divorce Laws
Economic Changes Behind the Second Demographic Transition
• Decline in family functions with Industrialization
• Women’s economic independence• Employment and wages• Delay marriage and fertility to establish careers• Welfare
• Men’s deteriorating economic prospects• Major economic restructuring. Loss of manufacturing jobs in
urban centers. • High unemployment rates (men over 20, Jan. 2004): whites=4.5%;
blacks=9.6%• Men’s declining wages
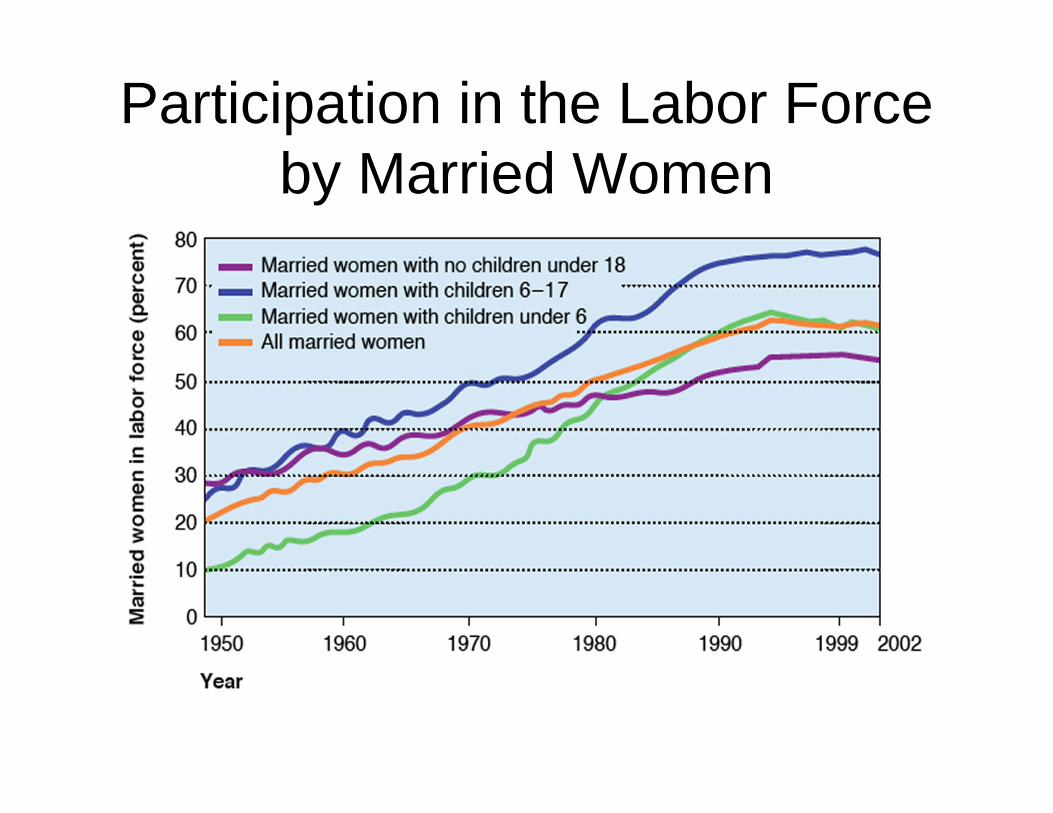
Participation in the Labor Force by Married Women