failure analysis of grp pipes under compressive...
TRANSCRIPT
THESIS
Presented to Faculdade de Engenharia da Universidade do Porto
to obtain the degree of Master of Science of Universidade do Porto
Specialty: Mechanical Engineering – Structural Analysis
Failure Analysis of GRP Pipes
Under Compressive Ring Loads
Last revision: March 31st, 2005
by
Hugo Faria
No. 030550004
To be defended in _________, the _____, 2005, before the jury nominated by FEUP
Failure Analysis of GRP Pipes Under Compressive Ring Loads
i
Abstract
The need of evaluating the mechanical behaviour of glass-fibre reinforced plastic
(GRP) pipes when installed in the sub-soil, for example, leads to test and simulation
methodologies under compressive ring loads.
The present study focused on the experimental and numerical analysis of GRP
pipes under ring compressive loading condition. Short and long-term experimental
procedures, as well as numerical models, simulating those loading conditions were
carried out.
The main objectives were comparing results achieved in different test conditions
and evaluating the applicability of numerical analysis for structure’s characterization.
Keywords
GRP pipes; ring load; mechanical tests; creep; damage
Resumo
A utilização de metodologias de ensaio e simulação de tubagens em plástico
reforçado com fibra de vidro (PRFV) sob carregamento de compressão lateral
pretende avaliar o seu comportamento em instalações no sub-solo, por exemplo.
Este estudo incidiu sobre a análise experimental e numérica de tubagens PRFV
nessas situações de carregamento de compresão lateral. Foram realizados
procedimentos experimentais de curta e longa duração, bem como modelos
numéricos, simulando aquelas condições de carregamento.
Os objectivos principais foram a comparação entre os resultados e comportamentos
estruturais verificados nas diferentes condições de ensaio e a avaliação da
aplicabilidade da análise numérica para caracterização da estrutura.
Palavras-chave
Tubos PRFV; carregamento anelar; ensaios mecânicos; fluência; dano
Failure Analysis of GRP Pipes Under Compressive Ring Loads
ii
Acknowledgements
The experimental tasks presented in this study were carried out in the Laboratory of Mechanical Tests (INEGI/CEMACOM) and in the Laboratory of Technological Tests (FEUP/DEMEGI) without whose equipments and technicians they would not been viable. Concerning to that I must express my recognition for the work initiated by those who preceded me, André Vieira and João Reis.
The first steps in the development of the numerical models were given aside with André Roque, whose precious contribution I thank.
Furthermore, I have to enhance the good work environment which Unidade de Materiais Compósitos of INEGI, CEMACOM, received me with. I cannot leave to thank the unit’s direction, in the person of Professor António Torres Marques, the availability, efficient advices and the freedom I was transmitted for the best prosecution of the study.
To professors Rui Miranda Guedes and Marcelo Moura my recognition goes, of course, for the total availability and capacity demonstrated in the advising and orientation of this work, but, over all, it goes for the notable easiness with which they had provided me months of pleasant joint work.
Agradecimentos
As tarefas experimentais apresentadas neste estudo foram realizadas no Laboratório de Ensaios Mecânicos (INEGI/CEMACOM) e no Laboratório de Ensaios Tecnológicos (FEUP/DEMEGI) sem cujos equipamentos e recursos humanos não teriam sido viáveis. A esse respeito quero exprimir o meu reconhecimento pelo trabalho iniciado pelos que me antecederam, André Vieira e João Reis.
Os primeiros passos no desenvolvimento dos modelos numéricos foram dados em conjunto com André Roque a quem agradeço a preciosa colaboração.
Ao mais, tenho de realçar o bom ambiente de trabalho com que a Unidade de Materiais Compósitos do INEGI, CEMACOM, me acolheu. Não posso deixar de agradecer à direcção dessa mesma unidade, na pessoa do Prof. António Torres Marques, a disponibilidade, os conselhos eficazes e a liberdade que me foram transmitidos para a melhor prossecução do trabalho.
Aos professores Rui Miranda Guedes e Marcelo Moura o meu reconhecimento vai, naturalmente, para a total disponibilidade e capacidade demonstradas no aconselhamento e orientação deste trabalho, mas, sobretudo, também para a notável facilidade com que me proporcionaram meses de agradável trabalho conjunto.

Failure Analysis of GRP Pipes Under Compressive Ring Loads
iii
Table of Contents
1. Introduction ............................................................................................................. 1 2. State of the Art......................................................................................................... 5 3. Standards Analysis ................................................................................................ 13 EN 1225............................................................................................................. 13 EN 1226............................................................................................................. 18 EN 1227............................................................................................................. 21 EN 1228............................................................................................................. 25 EN 705............................................................................................................... 29 4. Experimental Program ......................................................................................... 37 Procedures ......................................................................................................... 38 Initial Ring Stiffness................................................................................ 38 Creeping In Wet Conditions.................................................................... 40 Stress Relaxation ..................................................................................... 42 Burn-off tests ........................................................................................... 43 Results ............................................................................................................... 45 Initial Ring Stiffness................................................................................ 45 Creeping In Wet Conditions.................................................................... 53 Stress Relaxation ..................................................................................... 59 Burn-off tests ........................................................................................... 61 5. Numerical Models.................................................................................................. 63 Modelling Approaches ...................................................................................... 64 3D models................................................................................................ 64 2D models................................................................................................ 66 Results ............................................................................................................... 75 3D models................................................................................................ 75 2D models................................................................................................ 81 6. Analysis of Results................................................................................................. 97 7. Conclusion ............................................................................................................ 103 8. References ............................................................................................................ 105 References ....................................................................................................... 105 Consulted Bibliography................................................................................... 106 9. Annex .................................................................................................................... 109


Failure Analysis of GRP Pipes Under Compressive Ring Loads
1
1. Introduction
Fibre reinforced polymers (FRP) are a practical alternative to metals in
applications where corrosion, weight, environment and other factors limit the use of
metals. In piping systems, glass-fibre reinforced plastic (GRP) pipes have been
increasingly introduced and are now an important class of engineering structures.
Within their typical applications, either in mechanical structures or civil
infrastructures GRP pipes are, frequently, exposed to complex service environment
conditions of a range of combinations of stress, time, temperature, moisture, radiation,
chemical, and gaseous environments and are expected to perform for fifty years or
more [1].
The lack of understanding the fundamental parameters controlling long-term
materials performance necessarily leads to over-design and in-service prototype
evaluations and, furthermore, inhibits greater utilization.
Additionally, the current standards treating normalization/certification of GRP
pipes typically require test durations of 10000 hours and high number of specimens.
Even though it is felt that these strong requirements are reasonable, concerning to the
confident utilization needs of many applications, the fact is that they are restrictive for
the improvement and innovation of new products. Testing times of that long also lead
end users to avoid confirmation tests.
FRP materials should be required to pass a series of specifications based on
inherent and residual mechanical, physical, and thermal properties after accelerated
service environment exposure conditions [1]. The main purpose of developing new
test methods with determined preconditioning temperatures, time and environment
conditions, is imposing accelerated ageing to the specimens, reducing test time.
By being designed either for gravitational or pressurized transportation of fluids,
GRP pipes are typically tested under ring deflection and/or internal pressure
conditions. In this study, focused in the ring deflection condition, they were conducted
standard and alternative test methods under that loading condition. This loading
configuration seems to be appropriated to approximately simulate in laboratory the
solicitations verified in a sub-soil installation.

Introduction
2
One condition and limitation of the existing methods is the implicit assumption that
the mechanisms responsible for the long-term material failure are the same at different
load levels. The failure mechanisms originated by the new methods being developed
should be as close as possible to those ones verified in real service conditions. So, it is
intended to develop damage phenomena similar to those that lead to long-term loss of
integrity and failure.
The pipe behaviour in a ring deflected condition is then evaluated by three
different test methods, differing in the controlled parameter and/or duration:
• Initial failure strain tests
• Creep Tests
• Relaxation Tests
Determining the characteristics related to creep and relaxation phenomena of these
materials and understanding the phenomena is critical to further use of FRP
composites in civil infrastructure [1].
There are two main technologies to produce large volumes of FRP pipe: filament
winding (1) and centrifugal cast. Some manufacturers also use hybrid methods
comprising the two philosophies in the same production. Four different types of GRP
pipes, from four different manufacturers have been selected for the test campaigns.
Fig. 1 – Schematic view of filament winding process on FRP pipes [2]

Failure Analysis of GRP Pipes Under Compressive Ring Loads
3
Resulting properties depend on the construction materials, fibre geometry, lay-up
thickness, fibre pretensioning and quality of the manufacturing process. That
dependence on several parameters makes important to evaluate also the initial
properties of the pipes. That is why short-term, static tests were conducted, too.
Besides the experimental procedures, numerical models were developed in order to
complement the analysis. Evaluating the reproducibility of the damage mechanisms
and the admissible values for several parameters such as fibers elastic stress limit,
strain energy release in mode I delamination (GId) and strain energy release in fibre
rupture in mode I (GIf) were the main objectives of numerical modeling. It was used a
2D finite element methodology integrating cohesive interface elements with a known
softening law developed by M. Moura and J. Gonçalves [3-5]
In this report the experimental and the numerical results achieved will be
presented, as well as the main conclusions retrieved from their comparison and
analysis. The first two chapters refer to the initial study developed over the state of the
art and the current standards defining methodologies for evaluating GRP pipes.

Failure Analysis of GRP Pipes Under Compressive Ring Loads
5
2. State of the Art
Laminated FRP structures assume specific behaviour due, not only to the
mechanical properties of their components (strength, elastic modulus, elastic stress
limit, etc) but also to the imposed geometry to each ply in the laminate.
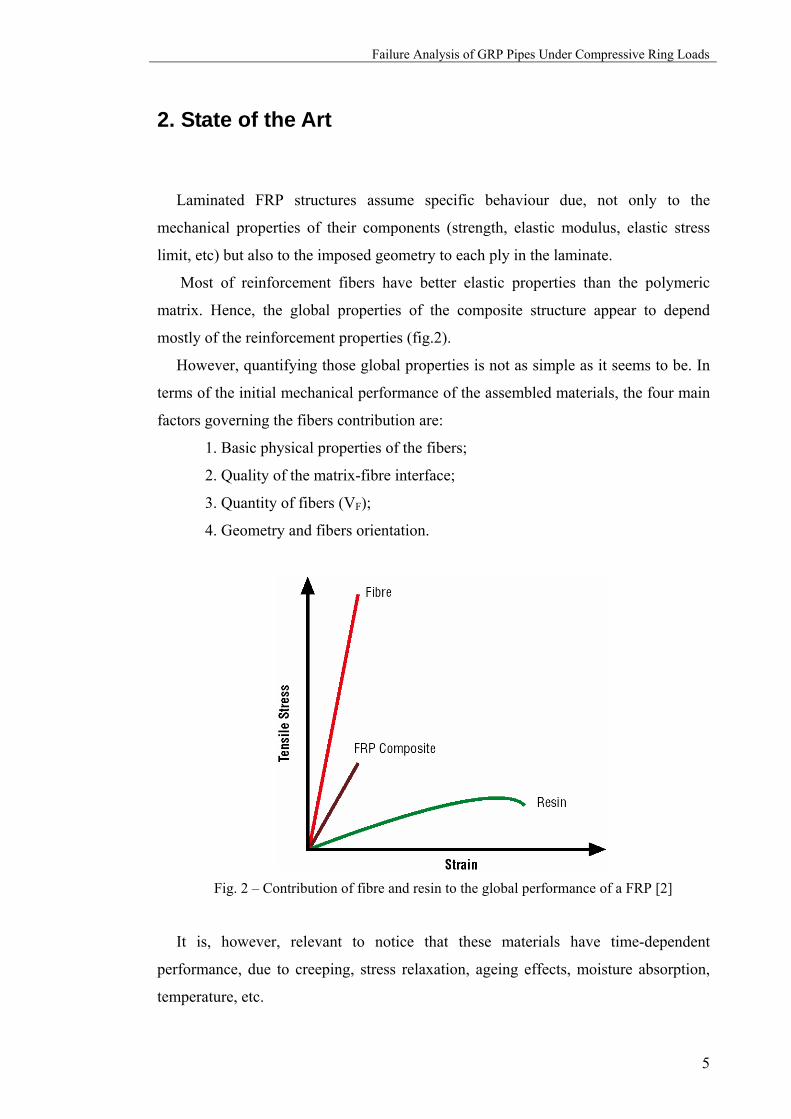
Most of reinforcement fibers have better elastic properties than the polymeric
matrix. Hence, the global properties of the composite structure appear to depend
mostly of the reinforcement properties (fig.2).
However, quantifying those global properties is not as simple as it seems to be. In
terms of the initial mechanical performance of the assembled materials, the four main
factors governing the fibers contribution are:
1. Basic physical properties of the fibers;
2. Quality of the matrix-fibre interface;
3. Quantity of fibers (VF);
4. Geometry and fibers orientation.
Fig. 2 – Contribution of fibre and resin to the global performance of a FRP [2]
It is, however, relevant to notice that these materials have time-dependent
performance, due to creeping, stress relaxation, ageing effects, moisture absorption,
temperature, etc.
State of the Art
6
The compliance and strength of polymeric composite materials may then change
over time in high temperature or long service applications. To avoid failures due to
unexpected loss of strength after long periods of time, it is imperative that accelerated
tests be developed to determine long-term strength properties [6].
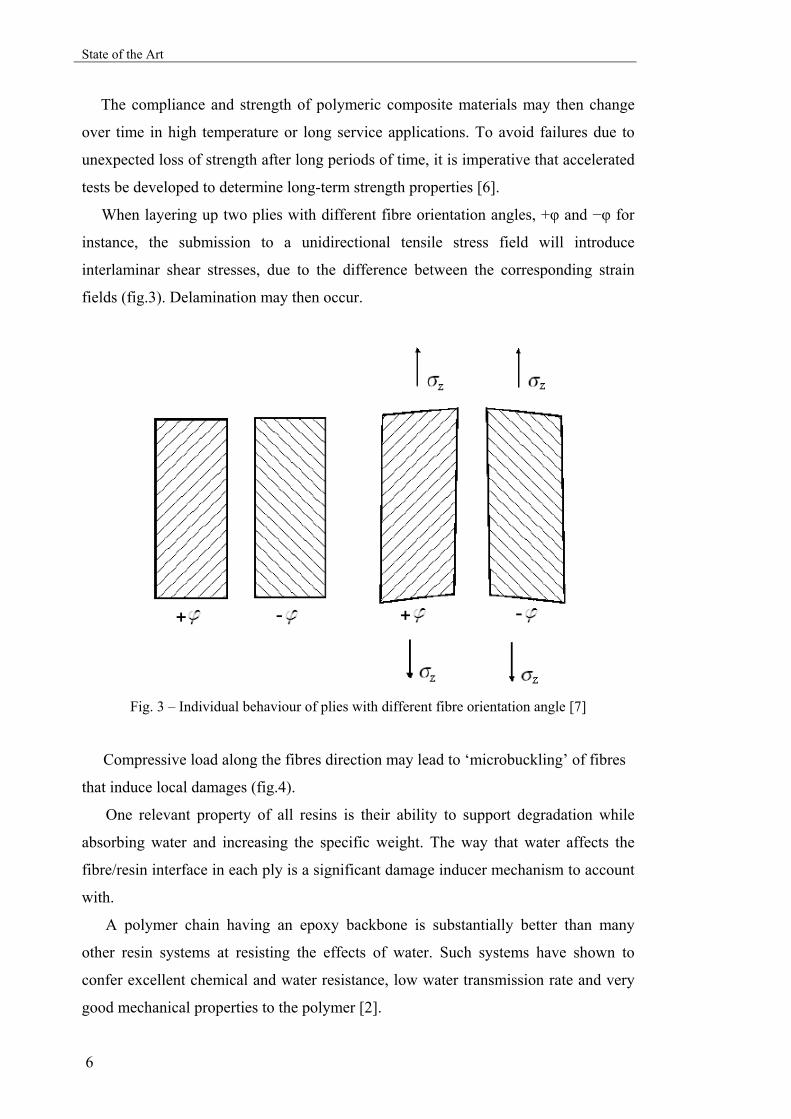
When layering up two plies with different fibre orientation angles, +φ and −φ for
instance, the submission to a unidirectional tensile stress field will introduce
interlaminar shear stresses, due to the difference between the corresponding strain
fields (fig.3). Delamination may then occur.
Fig. 3 – Individual behaviour of plies with different fibre orientation angle [7]
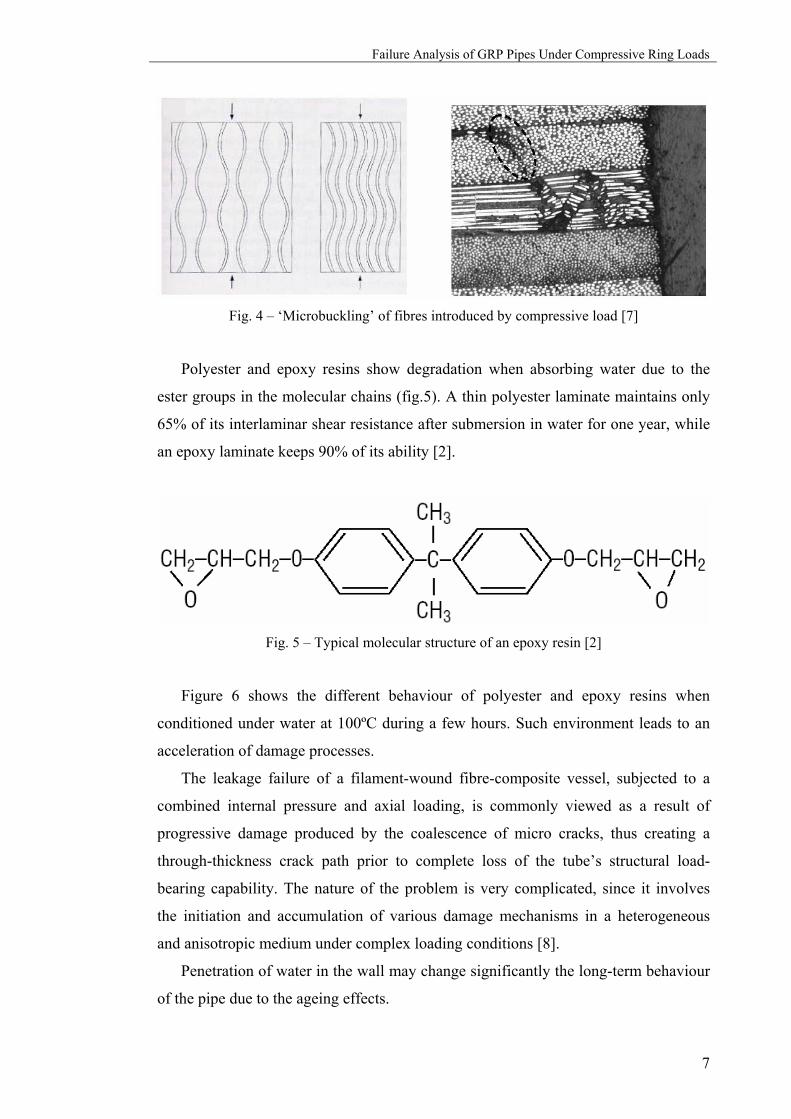
Compressive load along the fibres direction may lead to ‘microbuckling’ of fibres
that induce local damages (fig.4).
One relevant property of all resins is their ability to support degradation while
absorbing water and increasing the specific weight. The way that water affects the
fibre/resin interface in each ply is a significant damage inducer mechanism to account
with.
A polymer chain having an epoxy backbone is substantially better than many
other resin systems at resisting the effects of water. Such systems have shown to
confer excellent chemical and water resistance, low water transmission rate and very
good mechanical properties to the polymer [2].
Failure Analysis of GRP Pipes Under Compressive Ring Loads
7
Fig. 4 – ‘Microbuckling’ of fibres introduced by compressive load [7]
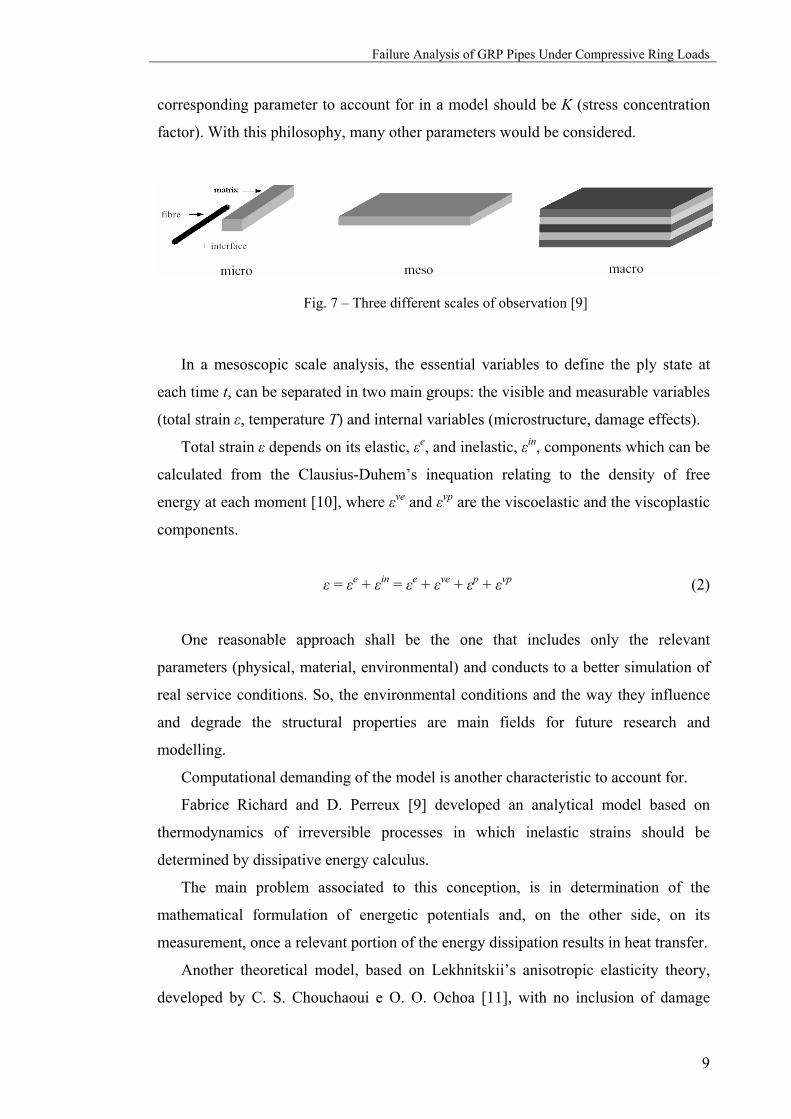
Polyester and epoxy resins show degradation when absorbing water due to the
ester groups in the molecular chains (fig.5). A thin polyester laminate maintains only
65% of its interlaminar shear resistance after submersion in water for one year, while
an epoxy laminate keeps 90% of its ability [2].
Fig. 5 – Typical molecular structure of an epoxy resin [2]
Figure 6 shows the different behaviour of polyester and epoxy resins when
conditioned under water at 100ºC during a few hours. Such environment leads to an
acceleration of damage processes.
The leakage failure of a filament-wound fibre-composite vessel, subjected to a
combined internal pressure and axial loading, is commonly viewed as a result of
progressive damage produced by the coalescence of micro cracks, thus creating a
through-thickness crack path prior to complete loss of the tube’s structural load-
bearing capability. The nature of the problem is very complicated, since it involves
the initiation and accumulation of various damage mechanisms in a heterogeneous
and anisotropic medium under complex loading conditions [8].
Penetration of water in the wall may change significantly the long-term behaviour
of the pipe due to the ageing effects.

State of the Art
8
In water distribution and sewerage systems the loss of mechanical properties is
due to material creeping, plasticity, resin hydrolysis, and chemical attack of the
interface fibre/resin by fluid.
Fig. 6 – Effect of periods of water soak at 100ºC on resin interlaminar shear strength [2]
Concerning to the analytical study, a model that let us simulate the laminate
composite structure response, r, to an external solicitation, p, will have a time
dependent generic formulation like
( )[ ] tpxtr ≤<Φ= ττ 0,)( (1)
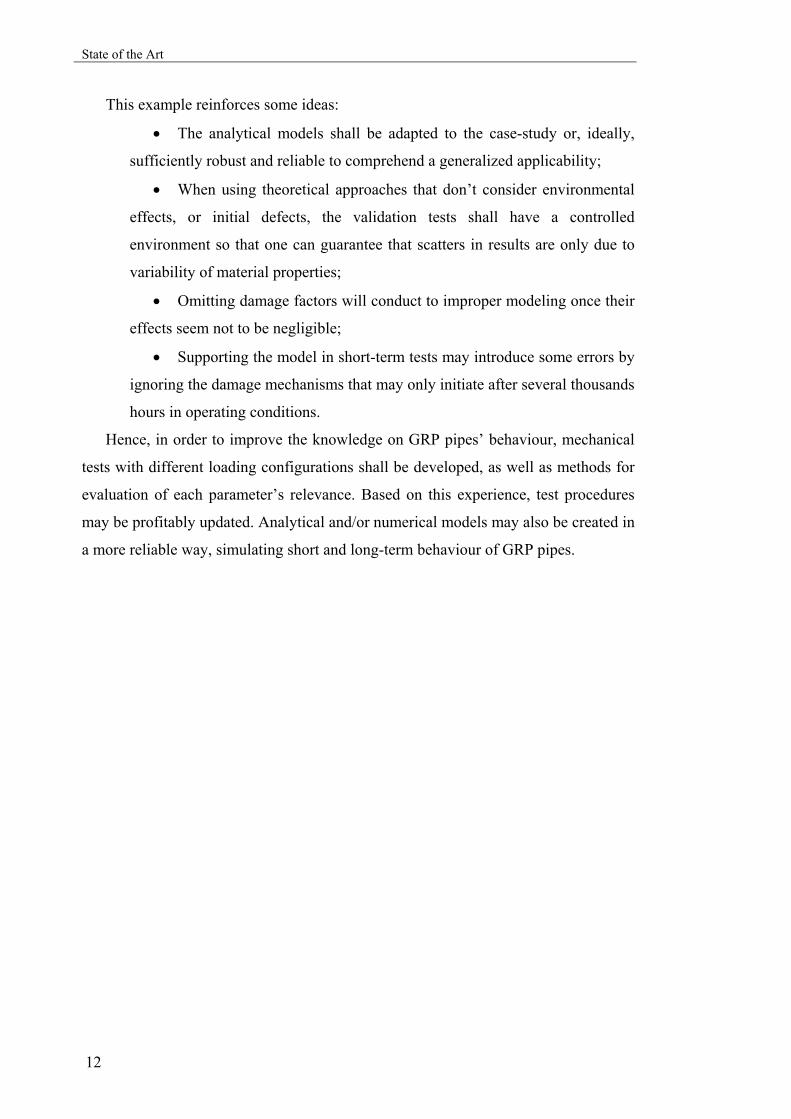
where x represents the parameter’s vector. The principal methods to achieve an
appropriate formulation for Ф operator differ, primarily, in the scale of observation
used in the analysis (fig.7) [9].
The damage mechanisms, its effects, the predominance of ones on others,
although having been object of several studies, are not well dominated, once there is
not, for now, a reliable analytical model, capable of predict long-term properties of
these structures.
One local effect of porosity is increasing the stress concentration, which becomes
particularly relevant when it occurs in the fibre/resin or ply/ply interface. As so, the
Failure Analysis of GRP Pipes Under Compressive Ring Loads
9
corresponding parameter to account for in a model should be K (stress concentration
factor). With this philosophy, many other parameters would be considered.
Fig. 7 – Three different scales of observation [9]
In a mesoscopic scale analysis, the essential variables to define the ply state at
each time t, can be separated in two main groups: the visible and measurable variables
(total strain ε, temperature T) and internal variables (microstructure, damage effects).
Total strain ε depends on its elastic, εe, and inelastic, εin, components which can be
calculated from the Clausius-Duhem’s inequation relating to the density of free
energy at each moment [10], where εve and εvp are the viscoelastic and the viscoplastic
components.
ε = εe + εin = εe + εve + εp + εvp (2)
One reasonable approach shall be the one that includes only the relevant
parameters (physical, material, environmental) and conducts to a better simulation of
real service conditions. So, the environmental conditions and the way they influence
and degrade the structural properties are main fields for future research and
modelling.
Computational demanding of the model is another characteristic to account for.
Fabrice Richard and D. Perreux [9] developed an analytical model based on
thermodynamics of irreversible processes in which inelastic strains should be
determined by dissipative energy calculus.
The main problem associated to this conception, is in determination of the
mathematical formulation of energetic potentials and, on the other side, on its
measurement, once a relevant portion of the energy dissipation results in heat transfer.
Another theoretical model, based on Lekhnitskii’s anisotropic elasticity theory,
developed by C. S. Chouchaoui e O. O. Ochoa [11], with no inclusion of damage

State of the Art
10
phenomena, establish constitutive equations for different cases of load (traction,
torsion, flexure, pressure), obeying to the restraints of each problem and to the
fundamentals of the continuum strains and stresses between plies.
Most of the times, failure by leakage in a laminate is seen as result of coalescence
of micro-cracks [8] which propitiate damage progression.
Complementarily, one can say that delaminating, transverse or longitudinal
(parallel to fibers direction) cracking are the main damage mechanisms that may lead
to long-term loss of structural integrity and are influenced by ageing effects
depending on environmental conditions.
The analytical approach by macro structural models introduces some
simplifications but one must always attempt to the non-linearities introduced by
damage phenomena and other factor that shall not be dismissed. Different mechanical
behaviour of a single ply when isolated or integrated (fig.8) denotes the necessity of
accounting the differences between different model scales.
Fig. 8 – Different behaviour of a single ply (isolated or integrated) [9]
Once more, the main concern when modeling composite structures is the correct
choice of the parameters to include in the governing equations so that one can
satisfactory simulate elasticity, viscoelasticity, plasticity and/or viscoplasticity,
damage mechanisms as well as every important phenomena occurring during long-
term service conditions.

Failure Analysis of GRP Pipes Under Compressive Ring Loads
11
Experimental procedures and mechanical tests are essential to validate any
theoretical model developed. They are also determinant to define the parameters that
are relevant to use in the predictive model.
Within the different loading possibilities one must choose those which propitiate
plasticity phenomena, micro-cracking, delaminating, as far as possible sequentially
sorted so that one can associate each one to the corresponding inducing mechanism.
For instance, increasing progressively the amplitude of a dynamic loading, with
intercalary measurements of elastic modulus is a promising test method to evaluate
degradation in composite structures.
Certainly is also interesting considering effective properties as input parameters in
a model that include damage mechanisms. That is the main focus of a study conducted
by L. Parnas and N. Katrici [12] and may consist in relevant simplifications of
complex analytical approaches.
One of the goals of the experimental procedures conducted by F. Richard and D.
Perreux [9], I. Ghorbel and P. Spiteri [13] among others is the measurement of elastic
properties degradation factors. These factors are introduced in the model as
parameters such as D1, D2, D3, …, and can be evaluated during progressive loading
assays. Next expression shows an example of measurement of elastic modulus
degradation:
i
ii E
ED
∆−= (3)
The failure times of similar test specimens, mainly in creep tests, typically are
quite disperse what is due to material variability originated in the manufacturing
process [14].
H. Toutanji and S. Dempsey [15] developed formulations including damage
mechanisms that are potential tools to analyse the behaviour of such structures as
those filament-wounded subjected to different combined load conditions.
N. Tarakçioglu and A. Akdemir [16] analysed experimentally the superficial crack
propagation in test specimens with different orientation angles of fibres, showing that
the theoretical model based on equations of Newman-Raju of fracture mechanics is
inefficient when changing the fibres orientation.
State of the Art
12
This example reinforces some ideas:
• The analytical models shall be adapted to the case-study or, ideally,
sufficiently robust and reliable to comprehend a generalized applicability;
• When using theoretical approaches that don’t consider environmental
effects, or initial defects, the validation tests shall have a controlled
environment so that one can guarantee that scatters in results are only due to
variability of material properties;
• Omitting damage factors will conduct to improper modeling once their
effects seem not to be negligible;
• Supporting the model in short-term tests may introduce some errors by
ignoring the damage mechanisms that may only initiate after several thousands
hours in operating conditions.
Hence, in order to improve the knowledge on GRP pipes’ behaviour, mechanical
tests with different loading configurations shall be developed, as well as methods for
evaluation of each parameter’s relevance. Based on this experience, test procedures
may be profitably updated. Analytical and/or numerical models may also be created in
a more reliable way, simulating short and long-term behaviour of GRP pipes.
Failure Analysis of GRP Pipes Under Compressive Ring Loads
13
3. Standards Analysis
The existing European test methods for prediction of long-term behaviour of GRP
pipes have been prepared by CEN/TC155/WG14, following the work done by
ISO/TC138/SC6, during more than 20 years [17].
In this section will be presented, beyond the basic study of the current European
Standards in GRP pipes, some of the procedures pointed to be possible targets of
important changes or updates, very soon.
The standards analyzed are related to the mechanical testing procedures under ring
deflection condition and the last one, EN 705:1994 [18], describes the predictive
extrapolation methods to use complimentarily.
EN 1225 – Determination of the creep factor under wet conditions and calculation of the long-term specific ring stiffness
Based on ISO/CD 10468, this standard specifies a method for determining by
extrapolation1 both the long-term specific ring stiffness and the creep factor for glass-
reinforced thermosetting plastics (GRP) pipes under wet conditions.
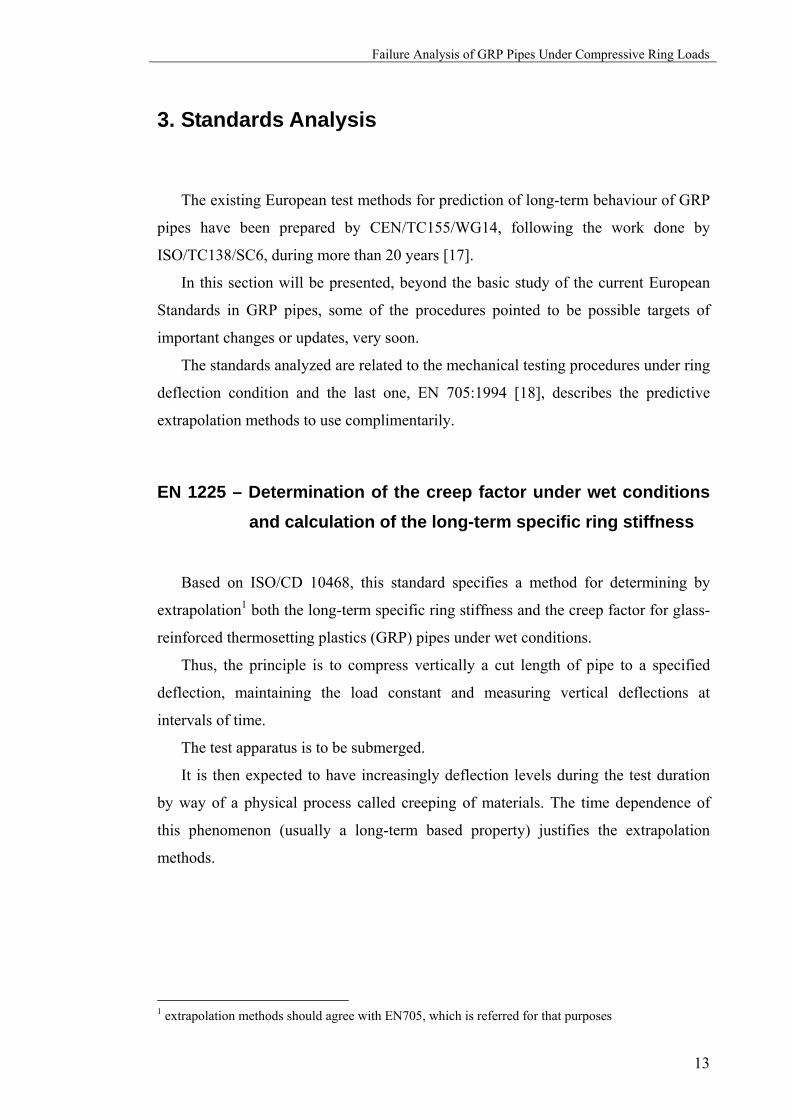
Thus, the principle is to compress vertically a cut length of pipe to a specified
deflection, maintaining the load constant and measuring vertical deflections at
intervals of time.
The test apparatus is to be submerged.
It is then expected to have increasingly deflection levels during the test duration
by way of a physical process called creeping of materials. The time dependence of
this phenomenon (usually a long-term based property) justifies the extrapolation
methods.
1 extrapolation methods should agree with EN705, which is referred for that purposes
Standards Analysis
14
Fig. 9 - Schematic diagram of the test arrangement [19]
• Definitions
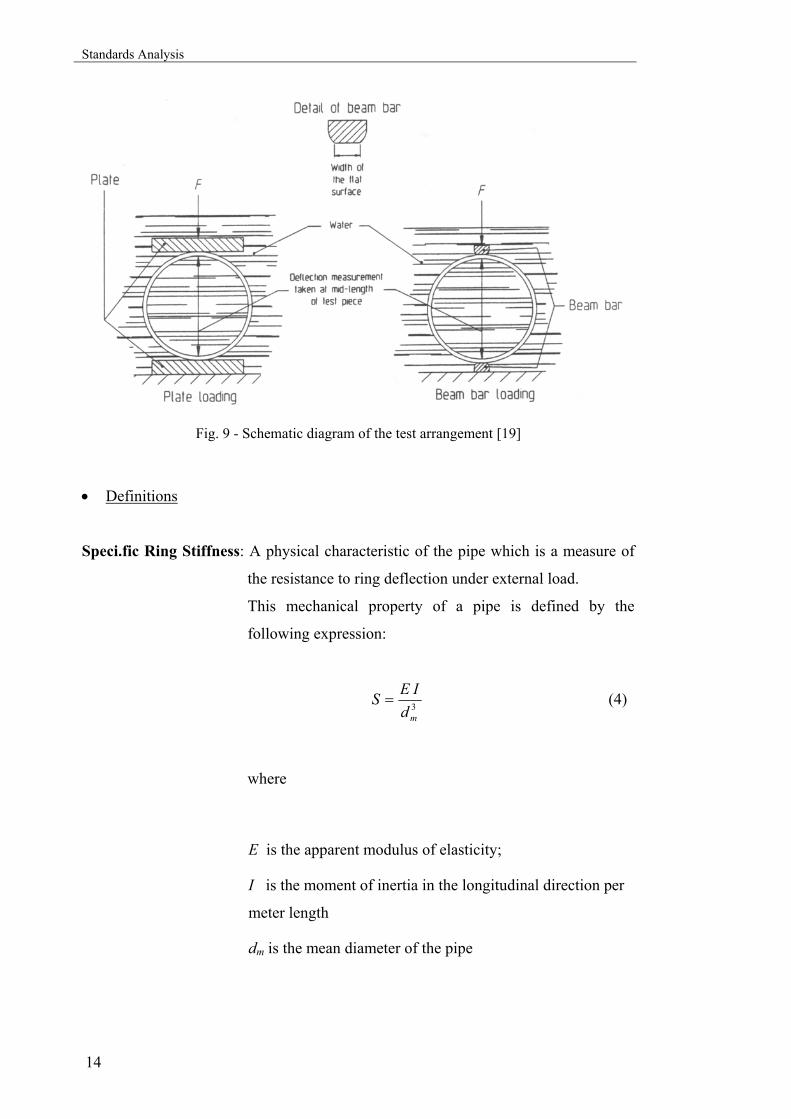
Speci.fic Ring Stiffness: A physical characteristic of the pipe which is a measure of
the resistance to ring deflection under external load.
This mechanical property of a pipe is defined by the
following expression:
3mdIES = (4)
where
E is the apparent modulus of elasticity;
I is the moment of inertia in the longitudinal direction per
meter length
dm is the mean diameter of the pipe

Failure Analysis of GRP Pipes Under Compressive Ring Loads
15
Deflection Coefficient: A dimensionless factor which takes into account the theory of
second order. It is given by the following equation:
5,1, 1025001860 −×⎥⎦
⎤⎢⎣
⎡⎟⎟⎠
⎞⎜⎜⎝
⎛×+=
m
wetx
dy
f (5)
where
yx,1,wet is the extrapolated long-term vertical deflection (x
years, reference position 1, wet conditions.
dm is the mean diameter of the pipe.
• Procedure
Eventual previous conditioning of test pieces shall be based in the referring
standard(s) and the following procedure must be conducted at the specified
temperature, too.
The initial specific ring stiffness2 must be accounted for a reference position (two
reference longitudinal lines drawn in the specimen) in order to estimate the load, F,
required to compress the test piece to between 98.0% and 98.5% of its mean diameter.
Placing the test piece in the apparatus with the pair of diametrically opposed
reference lines in contact with the upper and lower bars (or plates), it must be ensured
that the contact between the test piece and each beam bar is as uniform as possible
and that the bars are not tilted laterally.
Charging rate must then be as slow as necessary to obtain the vertical deflection
correspondent to de estimated load in 3 min. and this initial deflection recorded.
Fill the container with water to a level such that the test piece is completely
submerged.
Maintaining load constant measures of vertical deflection must be taken at
intervals at increments of log(time), such that at least three readings are taken for each
decade of log(time). Table 1 presents intervals of time in minutes, hours or days
2 determined in accordance with prEN 1228
Standards Analysis
16
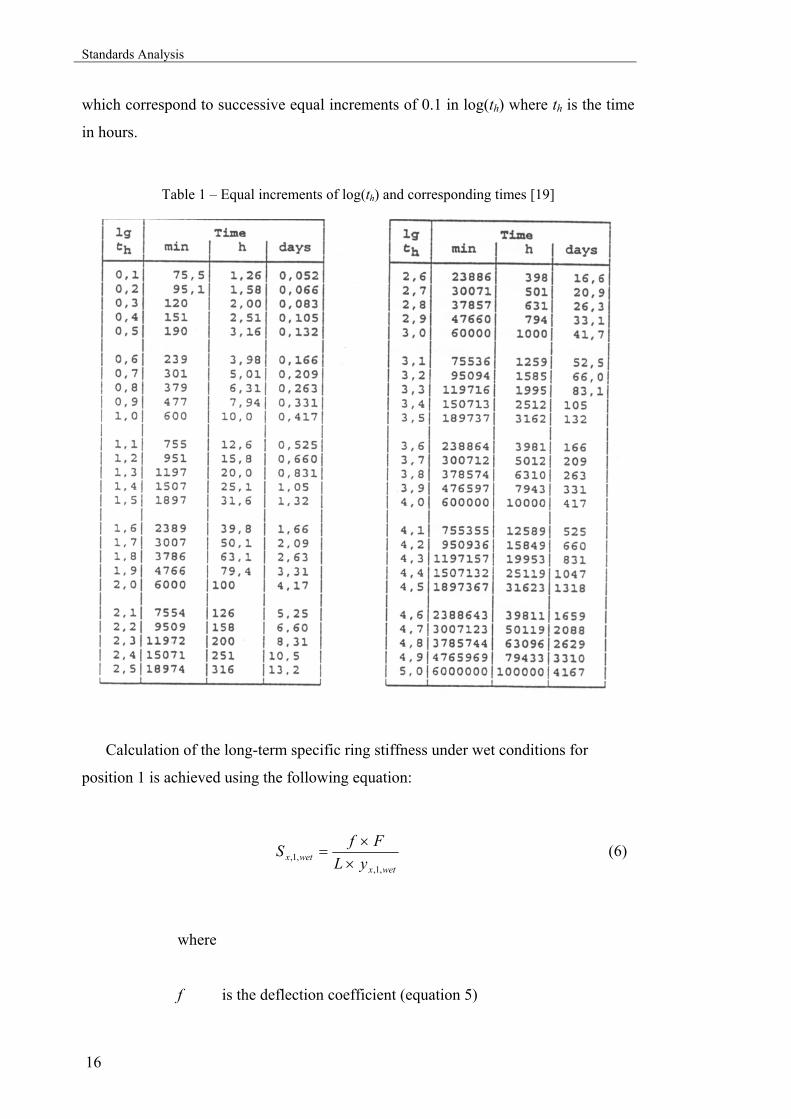
which correspond to successive equal increments of 0.1 in log(th) where th is the time
in hours.
Table 1 – Equal increments of log(th) and corresponding times [19]
Calculation of the long-term specific ring stiffness under wet conditions for
position 1 is achieved using the following equation:
wetxwetx yL
FfS,1,
,1, ××
= (6)
where
f is the deflection coefficient (equation 5)

Failure Analysis of GRP Pipes Under Compressive Ring Loads
17
F is the constant load applied
yx,1,wet is the extrapolated long-term vertical deflection (x years,
position 1, wet conditions)
L is the average length of the test piece.
And the wet creep factor, αx,wet, calculation must be determined as follows on:
1,0
,1,, S
S wetxwetx =α (7)
• Comments on EN 1225
The water environment imposed in this standard tends to accelerate the damage
progression as it also approximates this test to the usual service conditions of these
structures (water supply and sewerage). One must attempt the water chemical
properties and their stability during the test.
This standard refers to EN 1228:1997 [22] when it comes to the initial ring
stiffness of the pipes.
By reporting the definition of preconditioning conditions to the referring
standard(s), EN 1225 allows the existence of different procedures among different
manufacturers and/or certification testers which eventually act in the same type of
market and applications of GRP pipes.
• Related Standards
EN 761 Plastics piping systems. Glass-reinforced thermosetting plastics (GRP) pipes.
Determination of the creep factor under dry conditions
EN 1228 Plastics piping systems. Glass-reinforced thermosetting plastics (GRP)
pipes. Determination of initial specific ring stiffness
Standards Analysis
18
EN 1394 Plastics piping systems. Glass-reinforced thermosetting plastics (GRP)
pipes. Determination of the apparent initial circumferential tensile strength
ISO 7685 Plastics piping systems - glass reinforced thermosetting plastics (GRP)
pipes – Determination of initial specific ring stiffness.
ISO 14828 Glass-reinforced thermosetting plastics (GRP) pipes - Determination of
the long-term specific ring relaxation stiffness under wet conditions and calculation of
the wet relaxation factor
ISO 10952 Plastics piping systems - Glass-reinforced thermosetting plastics (GRP)
pipes and fittings - Determination of the resistance to chemical attack from the inside
of a section in a deflected condition
EN 1226 – Test method to prove the resistance to initial ring deflection
This standard, which is based on ISO/DIS 10466, describes a method for testing
the ability of glass-reinforced thermosetting plastics (GRP) pipes to withstand
specified levels of initial ring deflection without displaying surface damage and/or
structural failure.
Applying diametrically opposed forces (see figure 10), the test tube must be
compressed from zero up to the maximum allowable level of deflection. The
increment of deflection must include two stages at two different specified levels of
two minutes each.
At these two levels, defined by the referring standard(s), the specimen is inspected
for surface damage and/or structural failure (first deflection level) and for structural
failure (second deflection level).
Many of the test parameters must be set by the referring standards, such like:
- the two deflection limits of the pipe;
- the length of the test pieces;
- the number of test pieces;
- the test temperature;
Failure Analysis of GRP Pipes Under Compressive Ring Loads
19
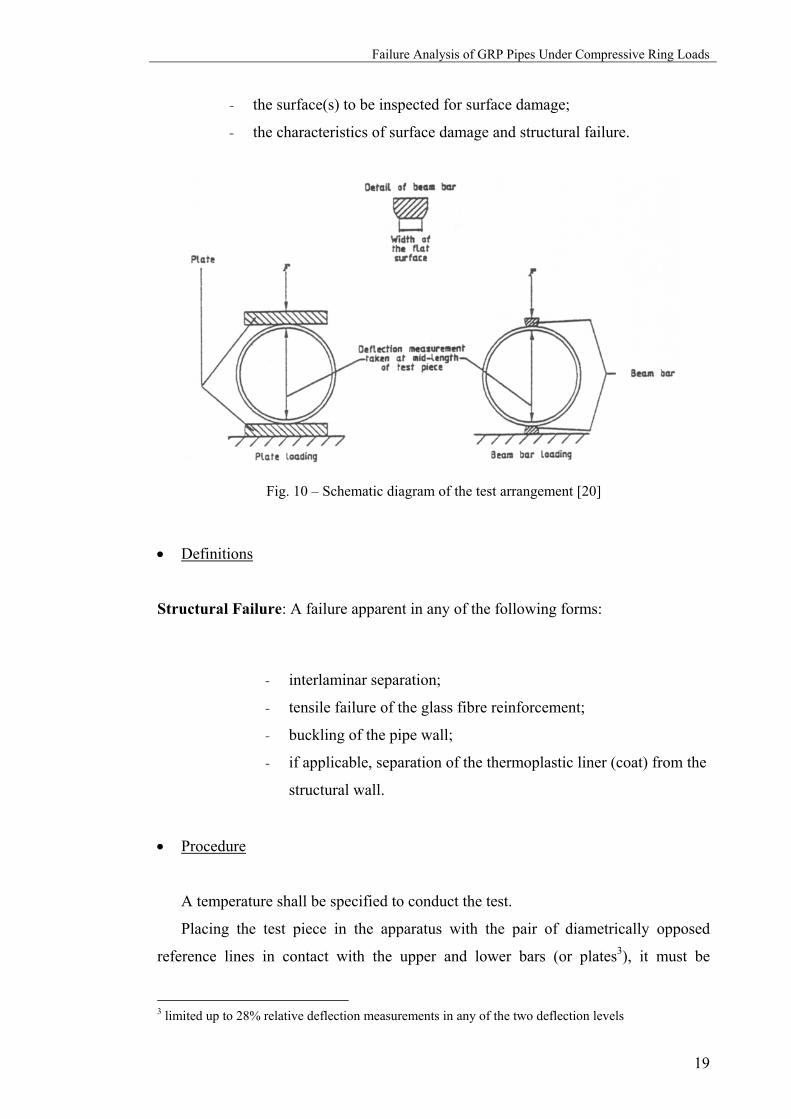
- the surface(s) to be inspected for surface damage;
- the characteristics of surface damage and structural failure.
Fig. 10 – Schematic diagram of the test arrangement [20]
• Definitions
Structural Failure: A failure apparent in any of the following forms:
- interlaminar separation;
- tensile failure of the glass fibre reinforcement;
- buckling of the pipe wall;
- if applicable, separation of the thermoplastic liner (coat) from the
structural wall.
• Procedure
A temperature shall be specified to conduct the test.
Placing the test piece in the apparatus with the pair of diametrically opposed
reference lines in contact with the upper and lower bars (or plates3), it must be
3 limited up to 28% relative deflection measurements in any of the two deflection levels
Standards Analysis
20
ensured that the contact between the test piece and each beam bar is as uniform as
possible and that the bars are not tilted laterally.
Compressive loading rate must be constant so that the first minimum initial
relative vertical deflection is reached to an accuracy of ±2.0 % of the specified value
in 2±0.5 min.
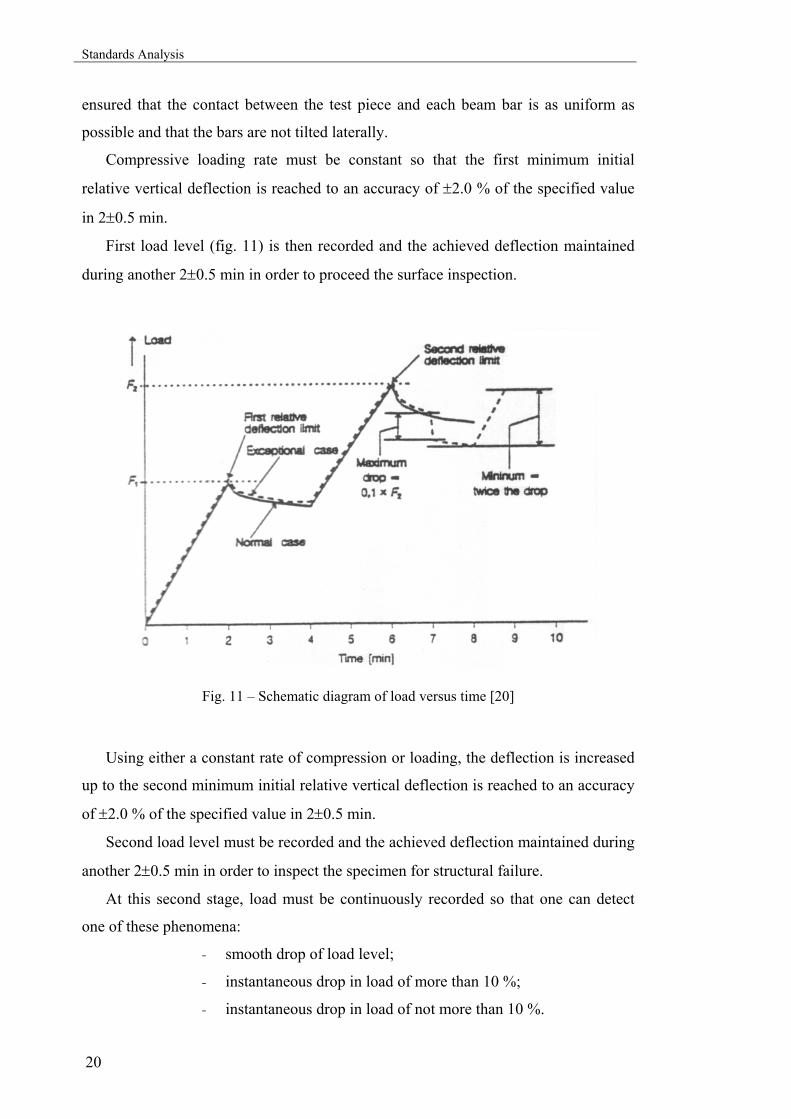
First load level (fig. 11) is then recorded and the achieved deflection maintained
during another 2±0.5 min in order to proceed the surface inspection.
Fig. 11 – Schematic diagram of load versus time [20]
Using either a constant rate of compression or loading, the deflection is increased
up to the second minimum initial relative vertical deflection is reached to an accuracy
of ±2.0 % of the specified value in 2±0.5 min.
Second load level must be recorded and the achieved deflection maintained during
another 2±0.5 min in order to inspect the specimen for structural failure.
At this second stage, load must be continuously recorded so that one can detect
one of these phenomena:
- smooth drop of load level;
- instantaneous drop in load of more than 10 %;
- instantaneous drop in load of not more than 10 %.
Failure Analysis of GRP Pipes Under Compressive Ring Loads
21
Considering that failure have occurred or not, depends on the specimen behaviour
at second load level stage. In the third case (drop ≤ 0.1F2) one must be able to
increase load level up to twice of the drop value otherwise failure is registered.
• Comments on EN 1226
The expected drop of load at each deflection level is due to relaxation phenomena
during the test time. In these materials, relaxation may induce damage such as fibre
and/or interface rupture. The progressive loss of mechanical properties may lead up to
loss of structural integrity (delaminating, cracking, etc). That property shall be
investigated as far as possible with different testing conditions to evaluate the
influence of preconditioning and/or level of deflection.
Although the times set for each period of the test seem to be properly defined, it is
relevant to notice (and eventually study) how sensitive these GRP pipes are to the
type of charging evolution.
• Related Standards
ISO 10466 Plastics piping systems - glass reinforced thermosetting plastics (GRP)
pipes – test method to prove the resistance to initial ring deflection.
EN 1228 / ISO 7685 Plastics piping systems. Glass-reinforced thermosetting plastics
(GRP) pipes. Determination of initial specific ring stiffness
EN 1227 – Determination of the long-term ultimate relative ring deflection under wet conditions
Based on ISO/DP 10471.2, this standard specifies a method for determining by
extrapolation4 the long-term ultimate relative ring deflection of glass-reinforced
thermosetting plastics (GRP) pipes under wet conditions.
4 extrapolation methods should be based on EN705, which is referred for that purposes
Standards Analysis
22
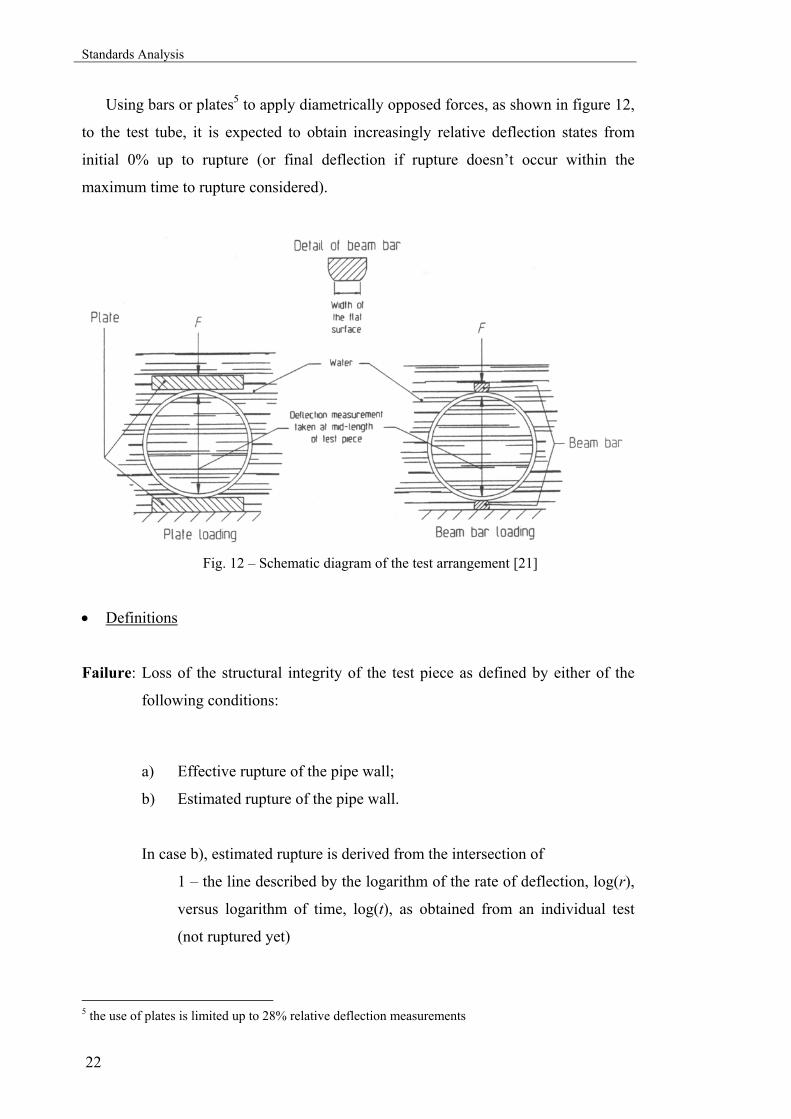
Using bars or plates5 to apply diametrically opposed forces, as shown in figure 12,
to the test tube, it is expected to obtain increasingly relative deflection states from
initial 0% up to rupture (or final deflection if rupture doesn’t occur within the
maximum time to rupture considered).
Fig. 12 – Schematic diagram of the test arrangement [21]
• Definitions
Failure: Loss of the structural integrity of the test piece as defined by either of the
following conditions:
a) Effective rupture of the pipe wall;
b) Estimated rupture of the pipe wall.
In case b), estimated rupture is derived from the intersection of
1 – the line described by the logarithm of the rate of deflection, log(r),
versus logarithm of time, log(t), as obtained from an individual test
(not ruptured yet)
5 the use of plates is limited up to 28% relative deflection measurements
Failure Analysis of GRP Pipes Under Compressive Ring Loads
23
2 – the line described by the logarithm of the rate of vertical deflection
at rupture, log(ru), versus logarithm of time, log(tu), derived from a
series of test pieces.
The equation that describes that intersection is
( )( )
( )( )u
u
tr
tr
loglog
loglog
= (8)
• Procedure
The following procedure must be conducted at the temperature of (23±5)º C.
Placing the test piece in the apparatus6 with the pair of diametrically opposed
reference lines7 in contact with the upper and lower bars (or plates), it must be
ensured that the contact between the test piece and each beam bar is as uniform as
possible and that the bars are not tilted laterally.
When filling the container with water to a level such that the test piece is
completely submerged, all the apparatus must be prepared for imposing the
predetermined load.
Loading rate must be as slow as necessary to obtain the desired static load in
3±0.5 min. and hold that load constant until the test is completed.
From the deflections directly measured, the values of the relative vertical
deflections at mid-length of the test piece must be recorded. At least three readings for
each decade of logarithm of time, where the time is expressed in hours, must be taken.
The test is completed when either of the following conditions is fulfilled:
a) rupture of the test piece occurs, in which case record the relative vertical
deflection and the time to failure;
b) the test has continued for at least 10000 h without rupture and both the
following conditions are fulfilled:
1) pipe wall rupture has been detected in at least 16 other test pieces
and;
6 compressive loading machine, water container, dimensional measuring devices 7 drawn in the specimen
Standards Analysis
24
2) for at least two of those 16 test pieces, the time to failure exceeded
6000 h.
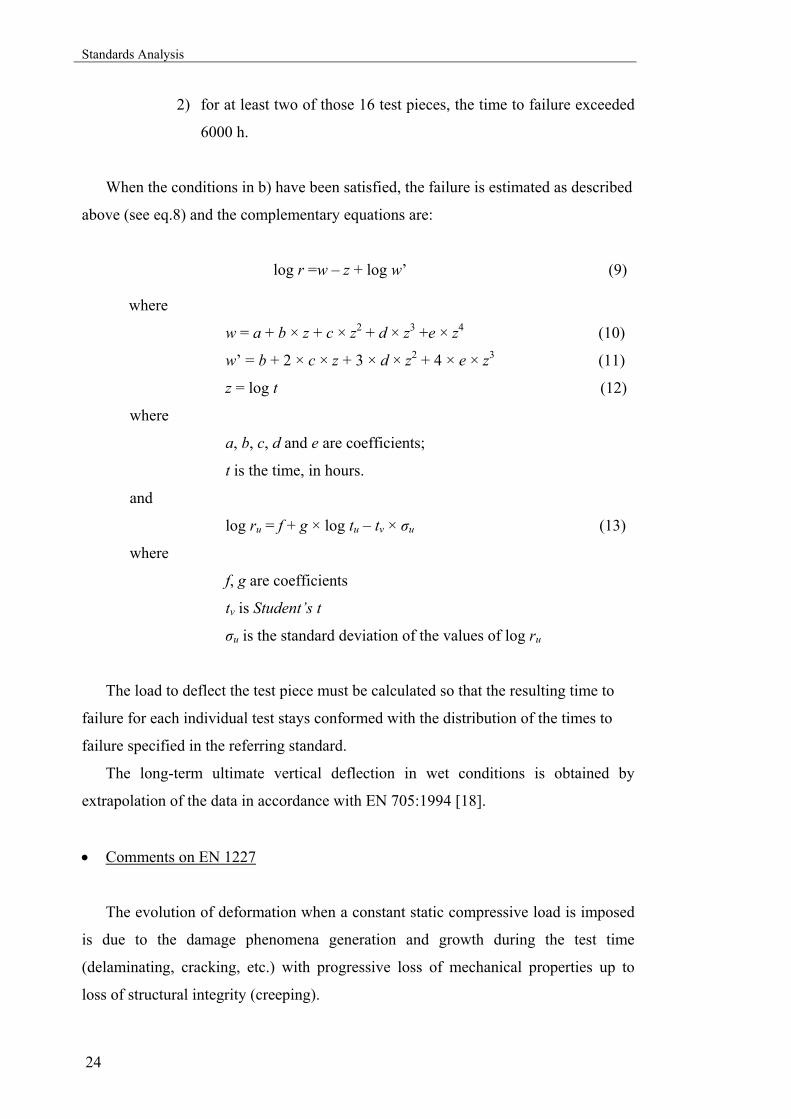
When the conditions in b) have been satisfied, the failure is estimated as described
above (see eq.8) and the complementary equations are:
log r =w – z + log w’ (9)
where
w = a + b × z + c × z2 + d × z3 +e × z4 (10)
w’ = b + 2 × c × z + 3 × d × z2 + 4 × e × z3 (11)
z = log t (12)
where
a, b, c, d and e are coefficients;
t is the time, in hours.
and
log ru = f + g × log tu – tv × σu (13)
where
f, g are coefficients
tv is Student’s t
σu is the standard deviation of the values of log ru
The load to deflect the test piece must be calculated so that the resulting time to
failure for each individual test stays conformed with the distribution of the times to
failure specified in the referring standard.
The long-term ultimate vertical deflection in wet conditions is obtained by
extrapolation of the data in accordance with EN 705:1994 [18].
• Comments on EN 1227
The evolution of deformation when a constant static compressive load is imposed
is due to the damage phenomena generation and growth during the test time
(delaminating, cracking, etc.) with progressive loss of mechanical properties up to
loss of structural integrity (creeping).

Failure Analysis of GRP Pipes Under Compressive Ring Loads
25
The water environment is used to accelerate this damage progression as it is also a
way of simulating real service conditions.
Although the specification of the exact number of test tubes is submitted to the
referring standard(s), the imposed condition of at least 16 valid tests so that further
statistical analysis can be validated lead us to a high number of specimens. Here again
one have relevant economical aspects to be considered.
It must be assured a neutral and stabilized water (pH of 7±2) environment.
• Related Standards
ISO 10471 Glass-reinforced thermosetting plastics (GRP) pipes - Determination of
the long-term ultimate bending strain and the long-term ultimate relative ring
deflection under wet conditions
ISO 10952 Plastics piping systems - Glass-reinforced thermosetting plastics (GRP)
pipes and fittings - Determination of the resistance to chemical attack from the inside
of a section in a deflected condition
EN 1228 – Determination of initial specific ring stiffness
Based on ISO/DIS 7685.2, this standard specifies a method for determining the
initial specific ring stiffness of glass-reinforced thermosetting plastics (GRP) pipes.
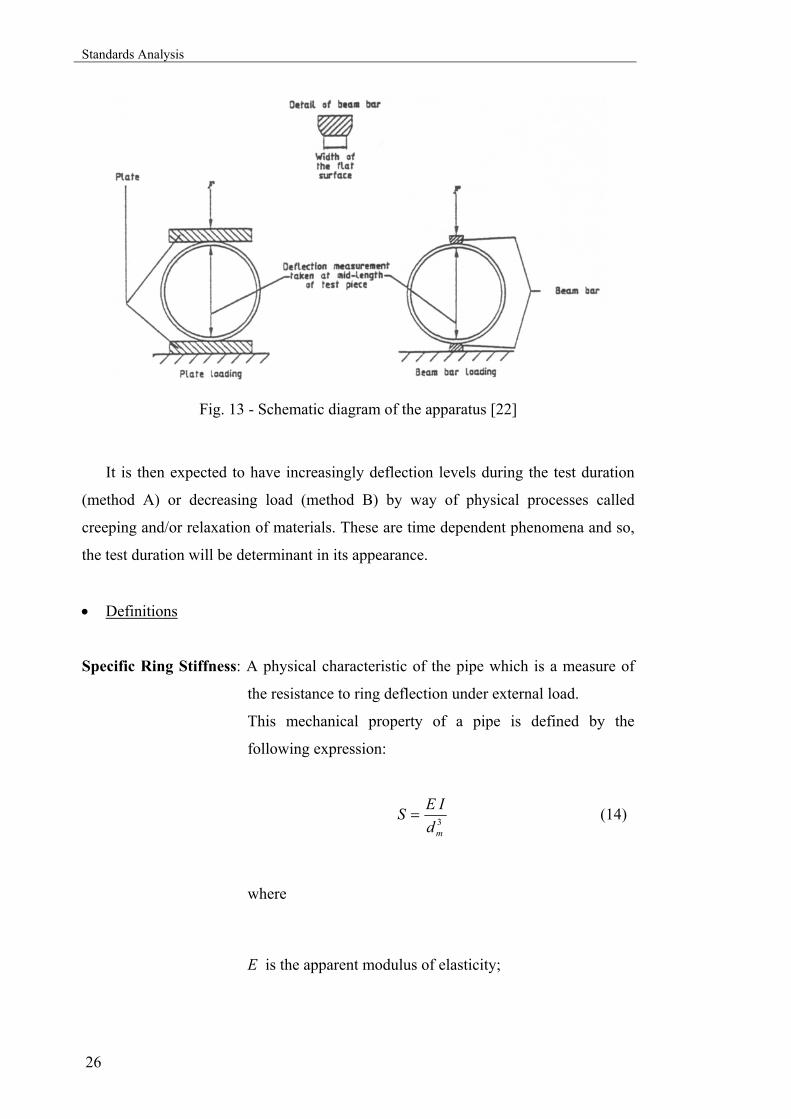
In either the two methods specified, a cut length of pipe is to be loaded throughout
its length to compress it diametrically. In each one of these two methods either plate
or beam bar loading (fig.13) can be used in the test apparatus.
The two methods given, A and B, may be used (within the specified deflection)
for any diameter. The difference between them is in the parameter controlled during
the assay.
After applying the load to achieve the initial deflection specified in the referring
standard, either the load is kept constant (method A) or the deflection is (method B).
In the first case (method A) the final deflection is determined. In the second case
(method B) the final load being applied is the determined parameter.
Standards Analysis
26
Fig. 13 - Schematic diagram of the apparatus [22]
It is then expected to have increasingly deflection levels during the test duration
(method A) or decreasing load (method B) by way of physical processes called
creeping and/or relaxation of materials. These are time dependent phenomena and so,
the test duration will be determinant in its appearance.
• Definitions
Specific Ring Stiffness: A physical characteristic of the pipe which is a measure of
the resistance to ring deflection under external load.
This mechanical property of a pipe is defined by the
following expression:
3mdIES = (14)
where
E is the apparent modulus of elasticity;
Failure Analysis of GRP Pipes Under Compressive Ring Loads
27
I is the moment of inertia in the longitudinal direction per
meter length
dm is the mean diameter of the pipe
• Procedure
The length of the test pieces should be as specified in the referring standard(s).
Pre-conditioning (or not) the test pieces is up to referring standard(s) as well as the
choice of the test temperature. Unless otherwise specified, specimens must be stored
at the test temperature prior to testing. Straight lines shall be drawn on the inside or
the outside along the length of the test piece and repeated at 60º intervals around its
circumference, to serve as reference lines.
Placing the test piece in the apparatus with the pair of diametrically opposed
reference lines in contact with the upper and lower bars (or plates), it must be ensured
that the contact between the test piece and each beam bar is as uniform as possible
and that the bars are not tilted laterally.
- Method A (using constant load):
The compressive load should be applied until a relative deflection between 2.5%
and 3.5% is reached in 60 ± 10 seconds under one of the following conditions:
a) at a constant rate;
b) in three increments of load.
The load is then to be kept constant for 2 min and the final deflection measured
and registered.
- Method B (using constant deflection):
The compressive load should be applied until the relative deflection specified in
the referring standard is reached in 60 ± 10 seconds under one of the following
conditions:

Standards Analysis
28
a) at a constant rate;
b) in three increments of load.
The deflection is then to be kept constant for 2 min and the final applied load
measured and registered.
Fig. 14 – Load and corresponding deflection versus time (using loading condition b) [22]
Fig. 15 – Deflection and corresponding load versus time (using loading condition a) [22]
Failure Analysis of GRP Pipes Under Compressive Ring Loads
29
Note: An estimate of the probable compressive load required to achieve a relative
deflection can be made from knowledge of the nominal stiffness (SN).
• Comments on EN 1228
This standard describes two different methods that, by defining distinct charging
conditions, lead to different processes of mechanical degradation of the specimen to
be tested. As so, method A uses creeping and method B uses stress relaxation to
degradate the specimen after reaching the specified level for load and deflection,
respectively.
The choice of the correct method to apply, either A or B, for testing procedures
according to EN1228 [22] is, then, to be criteriously done, once different in service
applications may demand different residual mechanical properties to be evaluated.
• Related Standards
EN 1394 Plastics piping systems. Glass-reinforced thermosetting plastics (GRP)
pipes. Determination of the apparent initial circumferential tensile strength.
ISO 7685 Plastics piping systems - glass reinforced thermosetting plastics (GRP)
pipes – determination of initial specific ring stiffness.
EN 705 – Methods for regression analysis and their use
Regression analysis is a very common method for prediction of properties by
extrapolation of a series of values obtained by validated tests.
This European Standard, which is based on ISO/TC138/SC6/WG1/N197,
describes the procedures intended for analyzing the regression of test data, usually,
with respect to time.
The referring standards require estimates to be made of the long-term properties of
the pipe for such parameters as circumferential tensile strength, deflection and creep.

Standards Analysis
30
Statistical techniques for data analysis of destructive tests were investigated. Many
of these simple techniques required the logarithms of the experimental data to
a) be normally distributed;
b) produce a regression line with negative slope;
c) have a sufficiently high regression correlation.
The fulfillment of the last two conditions does not guarantee the satisfaction of the
first condition. Further investigation resulted in the adoption of the covariance method
to treat those tests which present skewed distributions of data.
The results from non-destructive tests, such as creep or changes in deflection with
time, often satisfy the three conditions and so, in that cases, simpler procedures can be
used.
So, this European Standard specifies procedures suitable for the analysis of data
which, when converted into logarithms of the values, have either a normal or a
skewed distribution.
The extrapolation using these techniques typically extends the trend from data
gathered over a period of approximately 10000h, to a prediction of the property at 50
years.
• Methods
Data are analyzed for regression using methods based on least squares analysis
which can accommodate the incidence of a skew and/or normal distribution and the
applicability of a first order or a second order polynomial relationship.
The three methods of analysis used comprise the following:
i. Method A: covariance using a first order relationship;
ii. Method B: least squares with time as the independent variable - first order
relationship;
iii. Method C: least squares with time as the independent variable - second order
relationship.
Failure Analysis of GRP Pipes Under Compressive Ring Loads
31
Both methods A and B, must be used to fit a straight line of the form
xbay ×+= (15)
where:
y is the logarithm (log) of the property being investigated;
a is the intercept on the y axis;
b is the slope;
x is the logarithm (log) of the time, in hours.
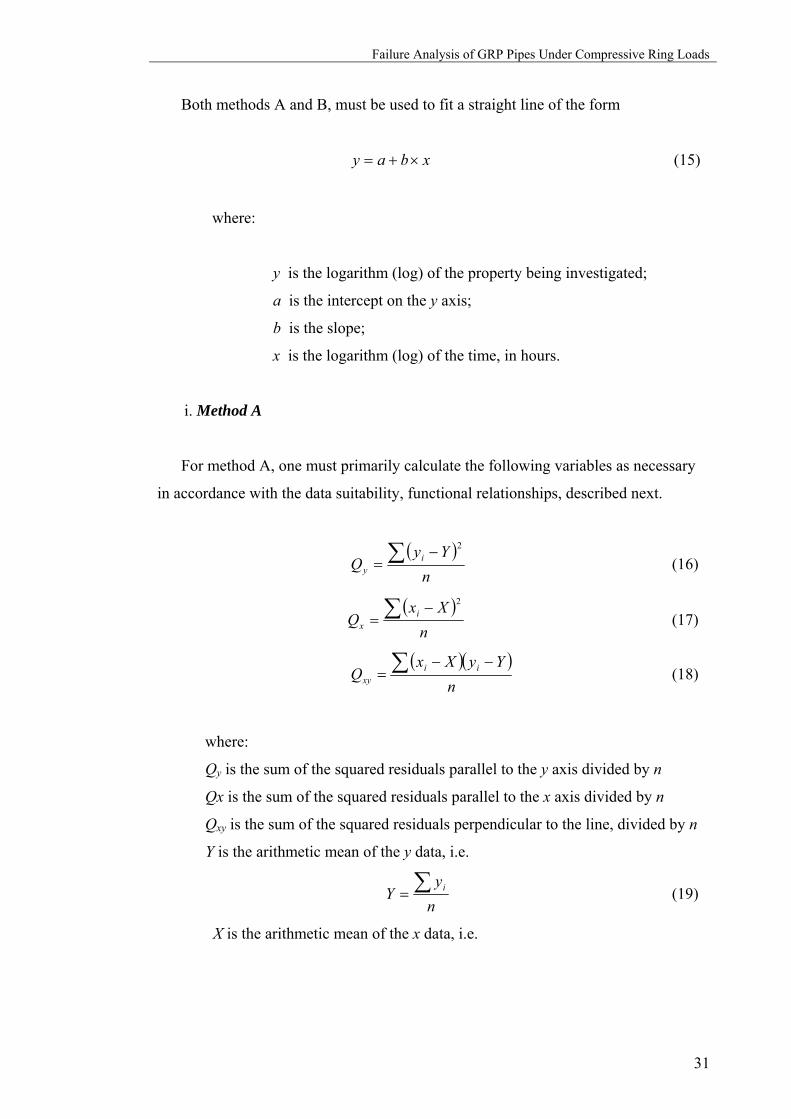
i. Method A
For method A, one must primarily calculate the following variables as necessary
in accordance with the data suitability, functional relationships, described next.
( )n
YyQ i
y∑ −
=2
(16)
( )n
XxQ i
x∑ −
=2
(17)
( )( )n
YyXxQ ii
xy
−−= ∑ (18)
where:
Qy is the sum of the squared residuals parallel to the y axis divided by n
Qx is the sum of the squared residuals parallel to the x axis divided by n
Qxy is the sum of the squared residuals perpendicular to the line, divided by n
Y is the arithmetic mean of the y data, i.e.
ny
Y i∑= (19)
X is the arithmetic mean of the x data, i.e.

Standards Analysis
32
nx
X i∑= (20)
xi, yi are individual values
n; is the total number of results (pairs of readings for xi, yi)
NOTE: If the value of Qxy is greater than zero the slope of the line is positive and if
the value of Qxy is less than zero then the slope is negative.
The suitability of data is then evaluated by calculating r2 and r as follows:
yx
xy
QQQ
r×
=2
2 (21)
yx
xy
Qrr
×== 2 (22)
If the value of r2 or r is less than the applicable minimum value given in table 2
data should be rejected as not being suitable for further analysis.
To find a and b for the functional relationship line
xbay ×+= (15)
it must be set
x
y
=Γ (23)
and then a and b calculated using the following equations:
Γ−=b (24)
XbYa ×−= (25)

Failure Analysis of GRP Pipes Under Compressive Ring Loads
33
Table 2 – Minimum values for the squared, r2, and linear coefficient of correlation, r, for acceptable data from n pairs of data [18]
When calculated the variances, C, one can check the suitability of the data for
extrapolation. Intending to extrapolate the line, it must be considered:
Cb
bslopeofriancevabT == (26)
Data is to be considered suitable for extrapolation when the absolute value of T,
|T|, is equal or greater then the applicable value for Student’s t, tv.
Standards Analysis
34
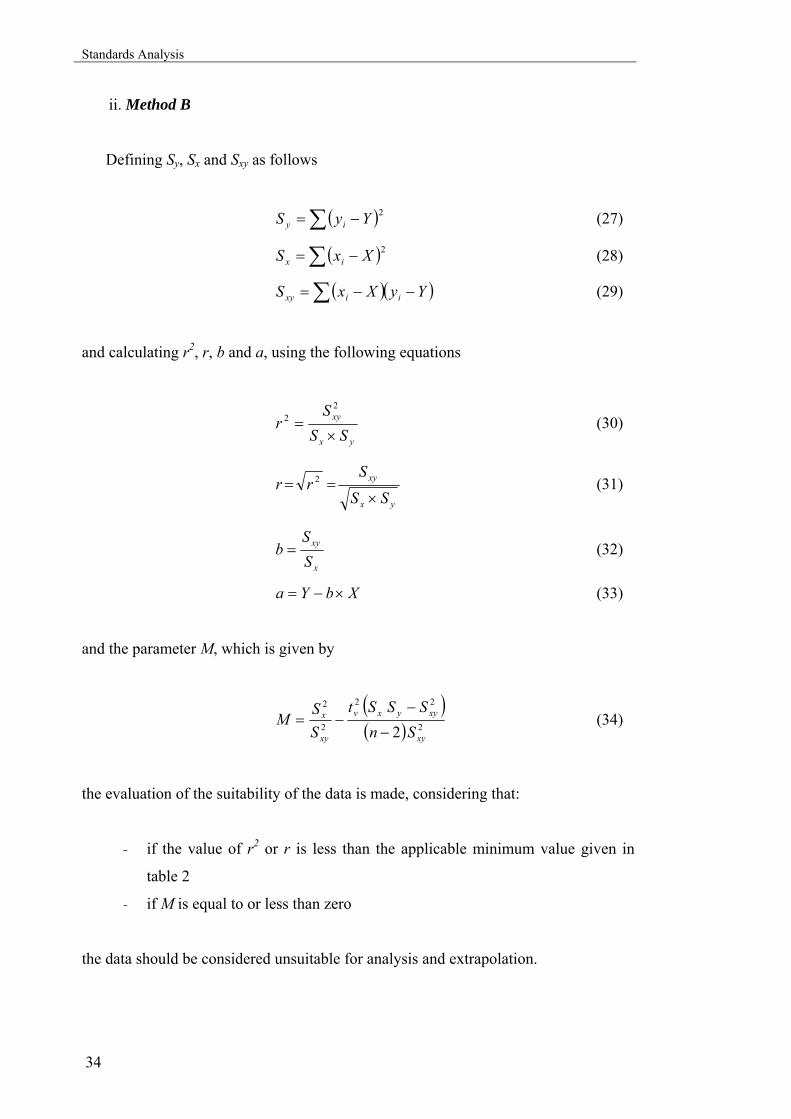
ii. Method B
Defining Sy, Sx and Sxy as follows
( )∑ −= 2YyS iy (27)
( )∑ −= 2XxS ix (28)
( )( )YyXxS iixy −−= ∑ (29)
and calculating r2, r, b and a, using the following equations
yx
xy
SSS
r×
=2
2 (30)
yx
xy
SS
Srr
×== 2 (31)
x
xy
SS
b = (32)
XbYa ×−= (33)
and the parameter M, which is given by
( )( ) 2
22
2
2
2 xy
xyyxv
xy
x
SnSSSt
SS
M−
−−= (34)
the evaluation of the suitability of the data is made, considering that:
- if the value of r2 or r is less than the applicable minimum value given in
table 2
- if M is equal to or less than zero
the data should be considered unsuitable for analysis and extrapolation.
Failure Analysis of GRP Pipes Under Compressive Ring Loads
35
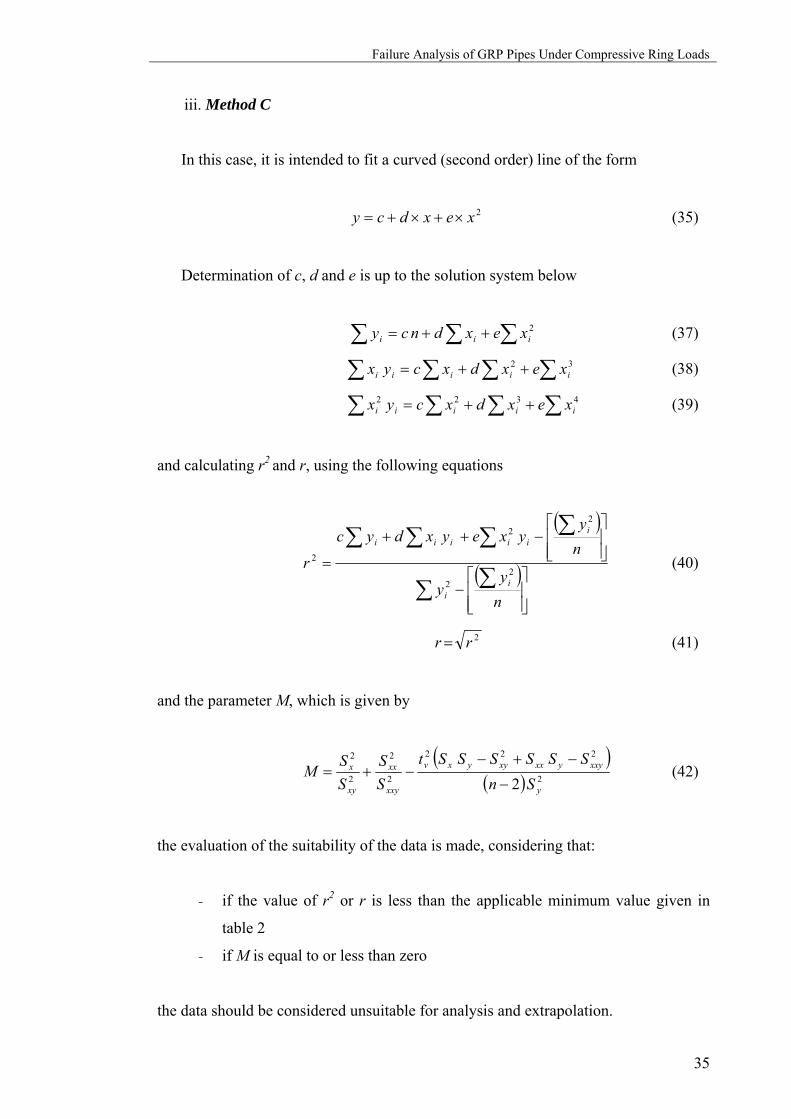
iii. Method C
In this case, it is intended to fit a curved (second order) line of the form
2xexdcy ×+×+= (35)
Determination of c, d and e is up to the solution system below
∑∑∑ ++= 2iii xexdncy (37)
∑∑∑∑ ++= 32iiiii xexdxcyx (38)
∑∑∑∑ ++= 4322iiiii xexdxcyx (39)
and calculating r2 and r, using the following equations
( )
( )⎥⎥⎦
⎤
⎢⎢⎣
⎡−
⎥⎥⎦
⎤
⎢⎢⎣
⎡−++
=∑∑
∑∑∑∑
ny
y
ny
yxeyxdyc
ri
i
iiiiii
22
22
2 (40)
2rr = (41)
and the parameter M, which is given by
( )( ) 2
222
2
2
2
2
2 y
xxyyxxxyyxv
xxy
xx
xy
x
SnSSSSSSt
SS
SS
M−
−+−−+= (42)
the evaluation of the suitability of the data is made, considering that:
- if the value of r2 or r is less than the applicable minimum value given in
table 2
- if M is equal to or less than zero
the data should be considered unsuitable for analysis and extrapolation.
Standards Analysis
36
• Comments on EN 705
Changes to this standard have been recently discussed, namely on which concerns
to the applicability of linear extrapolations.
It seems properly to note that these three methods are used to fit a straight line or a
curved line which is to be considered reliable in terms of its analysis and extrapolation
of the material or structural property that is being studied.
Currently, it isn’t used to extrapolate parameters such as environment effects,
moisture diffusion, damage propagation, etc, i. e., it is not prepared to include or study
these parameters by themselves, but in a global observation analysis type.
This isn’t necessarily a problem, although it may lead to a not so satisfactory
extrapolation of the results, once it can be assumed that the more time it passes,
greater is the damage influence, eventually until total loss of integrity.
• Related Standards
ISO/AWI 10928 Plastics piping systems – Glass-reinforced thermosetting plastics
(GRP) pipes and fittings – Methods for regression analysis and their use
Failure Analysis of GRP Pipes Under Compressive Ring Loads
37
4. Experimental Program
The two main objectives of the experimental program accomplished within this
work were evaluating the applicability of alternative test procedures (being studied in
the last few years by different research groups world wide) and supporting further
investigation on the relevant parameters governing the short and long-term behaviour
of GRP pipes.
The first concern was to evaluate some of the proposed alternative test methods
for the determination of long-term properties of glass-reinforced plastic (GRP) pipes,
in terms of their applicability rendering a considerable reduction of the time needed
for testing with a good level of safety in the long-term estimations when compared to
the existing specified ones described before:
EN 1225 Plastics piping systems - Glass-reinforced thermosetting plastics (GRP)
pipes - Determination of the creep factor under wet conditions and calculation of the
long-term specific ring stiffness
EN 1226 Plastics piping systems - Glass-reinforced thermosetting plastics (GRP)
pipes - Test method to prove the resistance to initial ring deflection
EN 1227 Plastics piping systems - Glass-reinforced thermosetting plastics (GRP)
pipes - Determination of the long-term ultimate relative ring deflection under wet
conditions
EN 1228 Plastics piping systems - Glass-reinforced thermosetting plastics (GRP)
pipes - Determination of initial specific ring stiffness
Tests according to the existing standards were also performed in order to create a
reference database consisting in the first critical basis for the analysis to develop on
the results provided by each of the new approaches.
Different types of GRP pipes from different manufacturers were selected, i.e.,
some of the test campaigns were performed either on filament wound polyester and
epoxy, continuous filament deposition and centrifugal casting pipes.
In the two next sections test procedures are briefly described and the
corresponding results are presented, respectively.

Experimental Program
38
Procedures
Several experimental procedures were conducted comprising a ring deflection
loading condition. Configurations either with a known deflection rate, constant
deflection or with constant load were developed.
“Burn-off” tests were also performed to determine the mass contents of each
component/phase and to observe the real layering-up of manufacturer’s C specimens.
These data were later on used to better understand the pipe’s behaviour as well as to
define the respective properties in numerical modeling.
A brief description of the testing procedures carried out is presented next.
Initial Ring Stiffness
The initial failure strain tests were performed according to EN1226:1999 which
describes a method for testing the ability of glass-reinforced thermosetting plastics
(GRP) pipes to withstand specified levels of initial ring deflection without displaying
surface damage and/or structural failure [20].
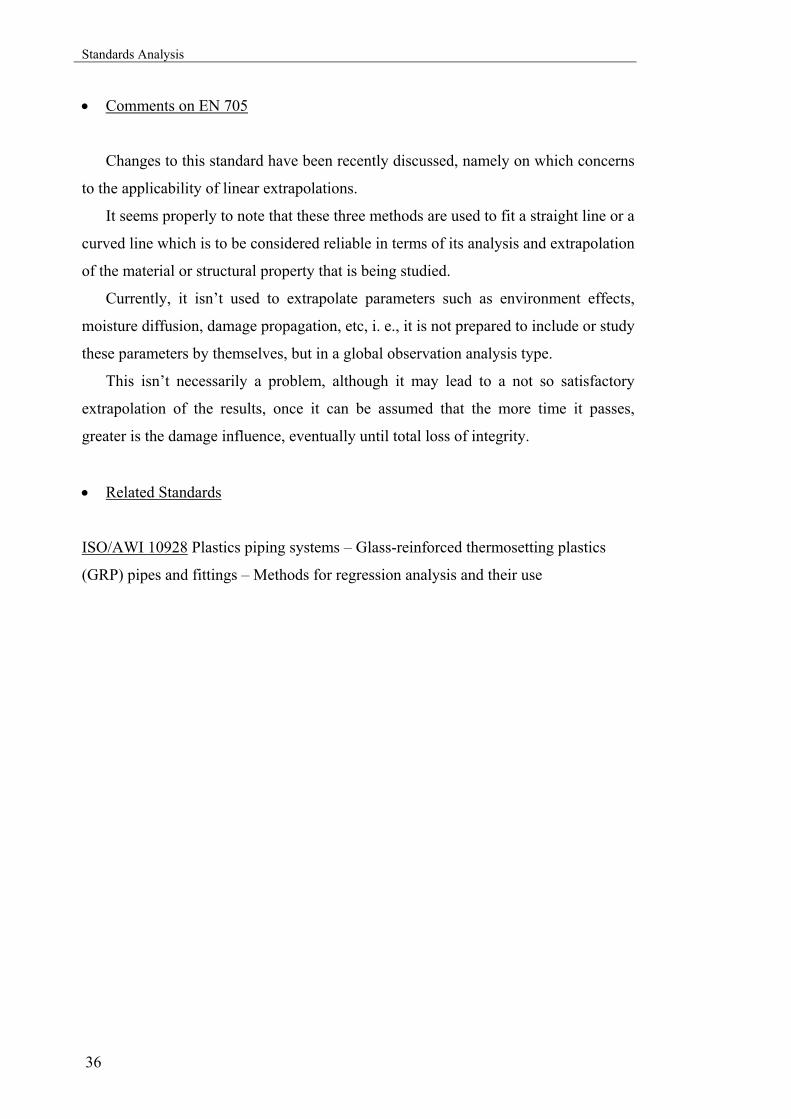
Each of several cut lengths of pipe, supported horizontally, was subjected to a
vertical compressive load throughout its length to two specified levels of vertical
deflection (fig.16).
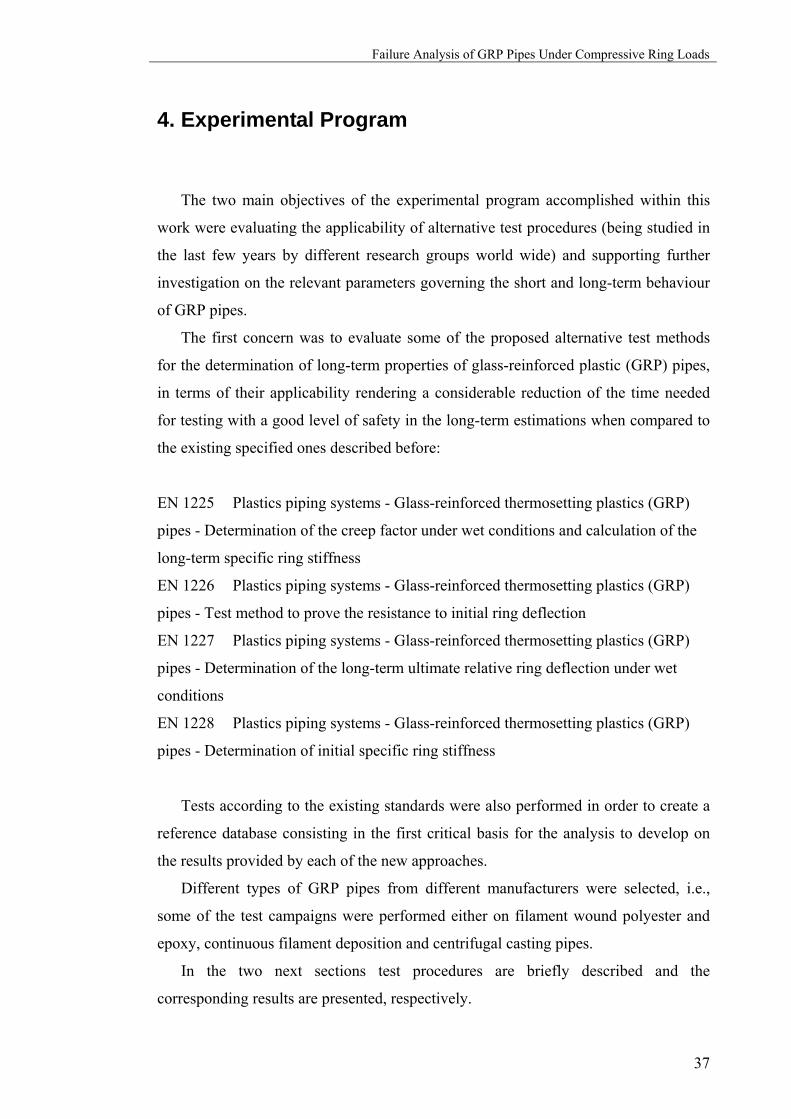
The set-up arrangement consists on an upper beam bar connected with the load
cell and the moving head, and a lower beam bar. The acquisition system is then nearly
disposed (fig.17).
Major axes of beam bars were perpendicular to, and centered on, the direction of
application of load. Each beam bar is rigid and its length is equal to the length of the
test pieces and the width is (50±5) mm.
Two straight lines, to serve as reference lines, were drawn on the outside along the
length of the test piece at 180º to each other. Length of the test piece along each
reference line, external diameter and wall thickness, were measured.
The specimens were inspected at the first deflection level for surface damage, and
at the second deflection level for structural failure. The test proceeded beyond the
second level on all test pieces that haven’t failed until then and maximum deflection
and load at failure were registered.
Failure Analysis of GRP Pipes Under Compressive Ring Loads
39
Fig. 16 – Deflection rate and sequence used
Fig. 17 – Compressive loading test apparatus
Experimental Program
40
Creeping In Wet Conditions
The creep tests carried out aimed to determine, by extrapolation, the long-term
ultimate relative ring deflection of glass-reinforced plastic (GRP) pipes in wet
conditions. These were led according to EN 1227:1997 [21].
Each of several cut lengths of pipe, supported horizontally and submerged, is to be
subjected to a vertical load throughout its length. It is intended to use different loads
in different test specimens, so that, at the end, one can observe the differences in
failure times, such as the deflection increasing during the assays.
The resulting vertical deflections are recorded at given times. The failure times
shall be distributed between 0.1h to over 10.000h.
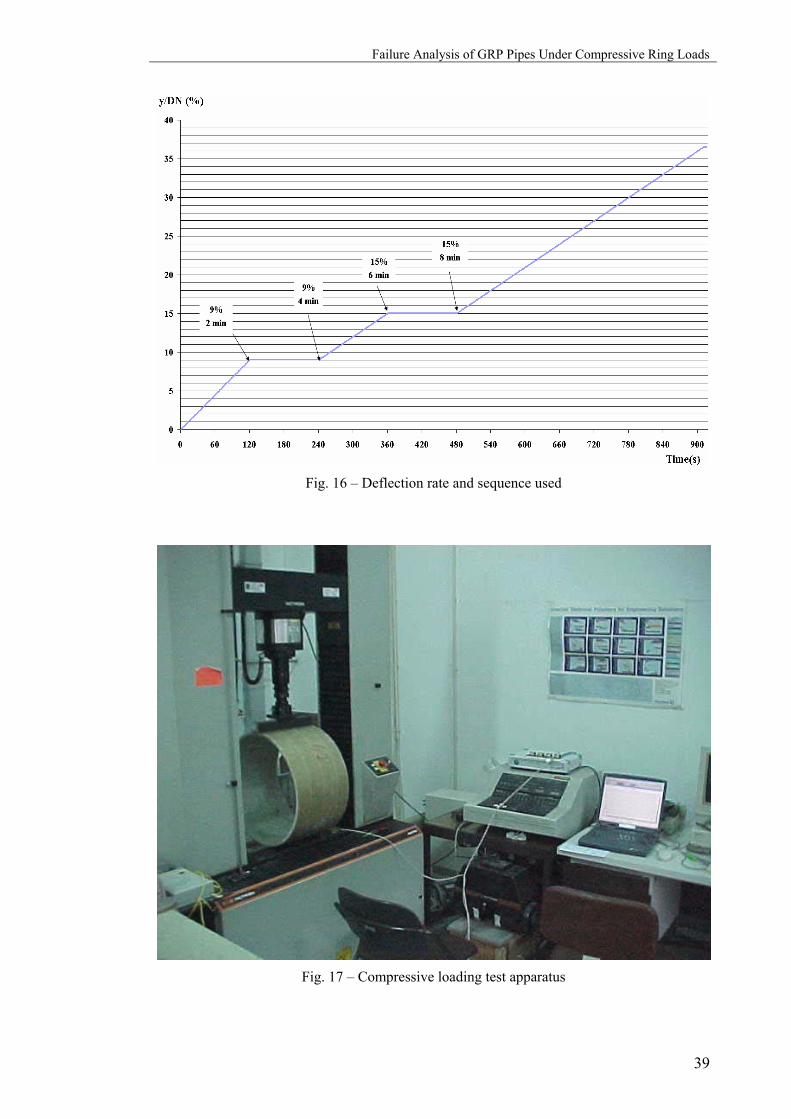
Table 3
yu,wet,2/DN yu,wet,50/DN
SN % % 500 40.8 24.4 625 37.8 22.7 1000 32.4 19.4 1250 30.0 18.0 2000 25.7 15.4 2500 23.9 14.3 4000 20.4 12.2 5000 18.9 11.3 8000 16.2 9.7 10000 15.0 9.0
In table 3 one can see the minimum 2-minute initial ring deflections before bore
cracking and structural failure, as indicated in EN1796 standard for different values of
nominal stiffness (SN).
The parameters yu,wet,2/dm and yu,wet,50/dm are the short-term ultimate relative
vertical deflection (2 minutes) and the long-term ultimate relative vertical deflection
(50 years) under wet conditions, respectively.
Since there are not tabled values for Nominal Stiffnesses higher than 10000N/m2,
therefore yu,wet,50/dm will be 8.3% and yu,wet,2/dm will be 13.9%, by extrapolation of the
limit curves for S0=125638. The compressive loads to be applied on the test piece with
S0=12563, in order to obtain a relative vertical deflection equal to the determined
8 this was the stiffness found in the test specimens to be tested

Failure Analysis of GRP Pipes Under Compressive Ring Loads
41
short-term and long-term ultimate relative vertical deflection, are calculated as
follows:
F = S0 × L × yu,wet,2/f = 12563×0.3×0.139×0.5×105/[1860 + (2500×0.139)] ≈ 11.866 kN (43)
F = S0× L × yu,wet,50/f = 12563×0.3×0.083×0.5×105/[1860 + (2500×0.083)] ≈ 7.565 kN (44)
y = 323.78x-0.3334
y = 194.25x-0.3336
0
10
20
30
40
0 12563
Nominal Stiffness [SN]
Rel
ativ
e R
ing
Def
lect
ion
[%]
short-term failurelong-term failuretrend line (short-term)trend line (long-term)
2500 5000 7500 10000
Fig. 18 - Limit curves for bore cracking and structural failure
Fig. 19 – Ring deflection machine

Experimental Program
42
Two straight lines, to serve as reference lines, are drawn on the external surface
along the length of the test pieces at 180º to each other. Length of the test piece along
each reference line, external diameter and wall thickness are measured.
Figure 19 shows a schematic representation of the deflection machine projected
for these experimental procedures, and a prototype of that machine.
Stress Relaxation
Relaxation tests, in a ring deflected condition were performed using several
specimens of different types of pipes (different manufacturers). These tests were run
in accordance with an alternative procedure proposed in a co-normative European
research project.
Test pieces used for determination of the stress relaxation in a ring deflection
condition, are pre-conditioned under water at 50 ºC for 1000 hours (fig.20).
Fig. 20 – Preconditioning tank
Each of several cut lengths of pipe, supported horizontally, is then to be subjected
to a ring deflection condition throughout its length.
Failure Analysis of GRP Pipes Under Compressive Ring Loads
43
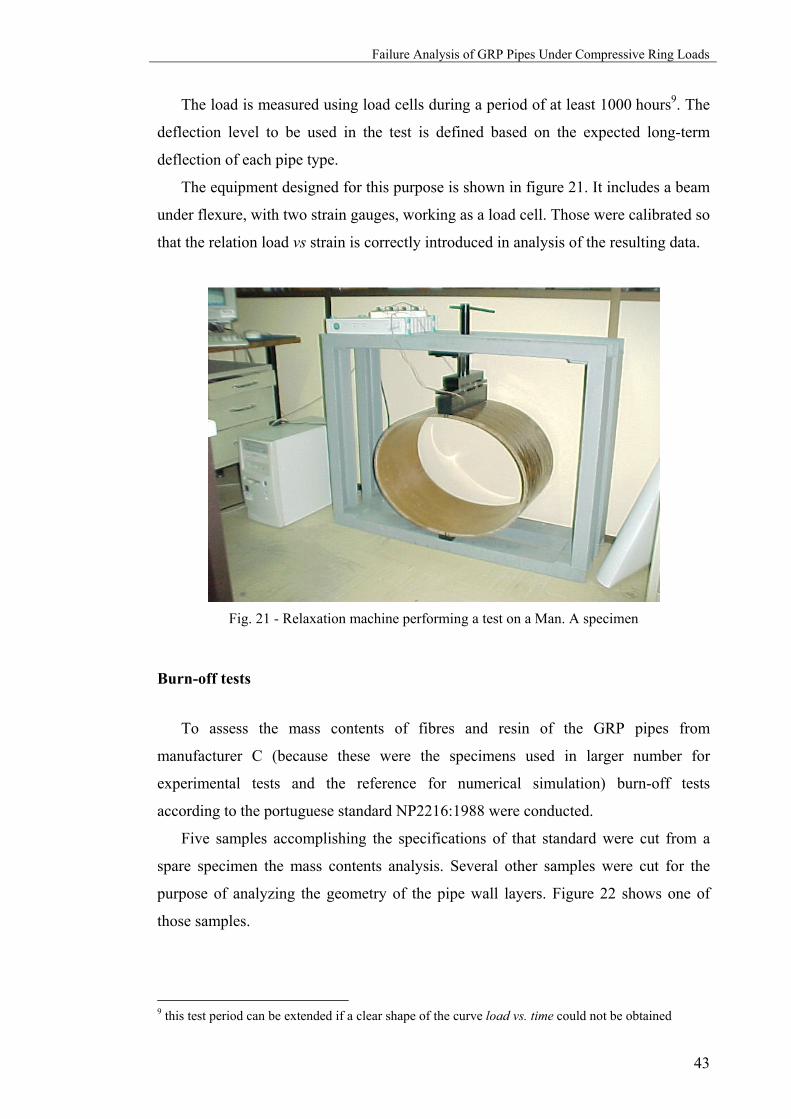
The load is measured using load cells during a period of at least 1000 hours9. The
deflection level to be used in the test is defined based on the expected long-term
deflection of each pipe type.
The equipment designed for this purpose is shown in figure 21. It includes a beam
under flexure, with two strain gauges, working as a load cell. Those were calibrated so
that the relation load vs strain is correctly introduced in analysis of the resulting data.
Fig. 21 - Relaxation machine performing a test on a Man. A specimen
Burn-off tests
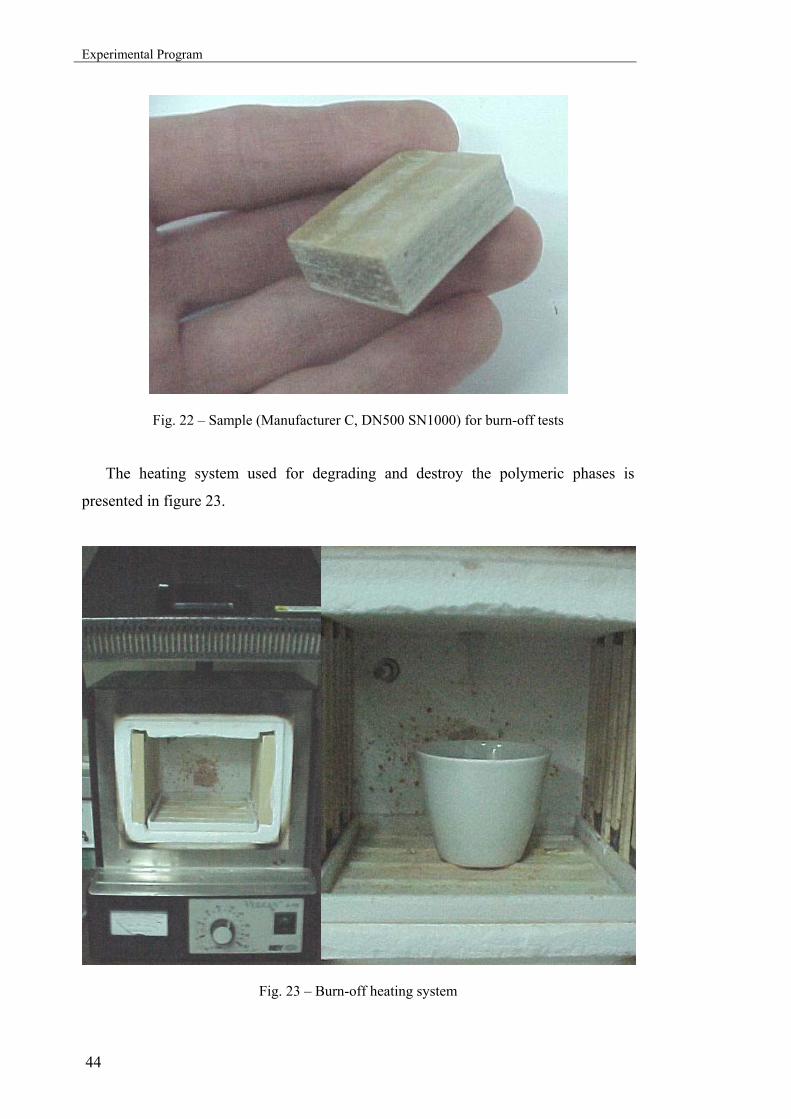
To assess the mass contents of fibres and resin of the GRP pipes from
manufacturer C (because these were the specimens used in larger number for
experimental tests and the reference for numerical simulation) burn-off tests
according to the portuguese standard NP2216:1988 were conducted.
Five samples accomplishing the specifications of that standard were cut from a
spare specimen the mass contents analysis. Several other samples were cut for the
purpose of analyzing the geometry of the pipe wall layers. Figure 22 shows one of
those samples.
9 this test period can be extended if a clear shape of the curve load vs. time could not be obtained
Experimental Program
44
Fig. 22 – Sample (Manufacturer C, DN500 SN1000) for burn-off tests
The heating system used for degrading and destroy the polymeric phases is
presented in figure 23.
Fig. 23 – Burn-off heating system

Failure Analysis of GRP Pipes Under Compressive Ring Loads
45
Results
Initial Ring Stiffness
The machine used for these initial ring stiffness tests was a universal mechanical
testing machine INSTRON. The machine is able to achieve and sustain displacement
in accordance with the periods specified for the procedures (Figure 16).
Each test piece was a complete ring cut from a pipe type DN500 SN10000
supplied by manufacturer C and made by filament winding and short fibres deposition
with 300 mm long (specs 1 to 5).
Table 4 presents geometric measurements initially taken for all five test pieces.
Table 4 – Dimensions of the test specimens
Spec. DN SN L1 [mm]
L2 [mm]
Lmean[mm]
t 1.1 [mm]
t 1.2 [mm]
t 2.1 [mm]
t 2.2 [mm]
t-mean [mm]
Dext [mm]
Dmean [mm]
1 500 10000 300.1 298.6 299.35 11.8 12.1 11.9 12.1 11.96 521.2 509.27
2 500 10000 297.8 298.9 298.35 12.1 12.4 12.9 12.2 12.39 520.7 508.3
3 500 10000 299.0 299.9 299.45 12.1 12.2 12.4 12.0 12.18 521.2 509.0
4 500 10000 298.8 298.8 298.80 11.9 12.3 12.1 12.2 12.11 521.0 508.9
5 500 10000 299.1 299.6 299.35 12.0 12.3 12.3 12.2 12.20 520.7 508.5
Each test piece was compressed at a constant rate so that the first minimum initial
relative vertical deflection specified in the referring standard was reached to an
accuracy of ±2.0% in 2±0.5 min and the corresponding load F1 was recorded.
According to EN 1796, for a pipe type SN 10000 the required minimum initial
ring deflection before bore cracking occurs in 2 minutes (y2,bore,min/dm) is 9%. So, this
deflection was maintained for 2±0.25 min and the corresponding load F2 recorded,
while inspecting the test piece without magnification for surface damage.
Deflection was increased using a constant rate of deflection so that the second
minimum initial relative vertical deflection was reached to an accuracy of ±2% of the
specified deflection value in 2±0.5 min and recorded the corresponding load F3.
In accordance with EN 1796, for a pipe type SN 10000 the required minimum
initial ring deflection without structural failure in 2 minutes (y2,struct,min/dm) is 15%.
This deflection was then maintained for 2±0.25 min and the corresponding load F4
recorded while inspecting the test piece for eventual structural failure.
Experimental Program
46
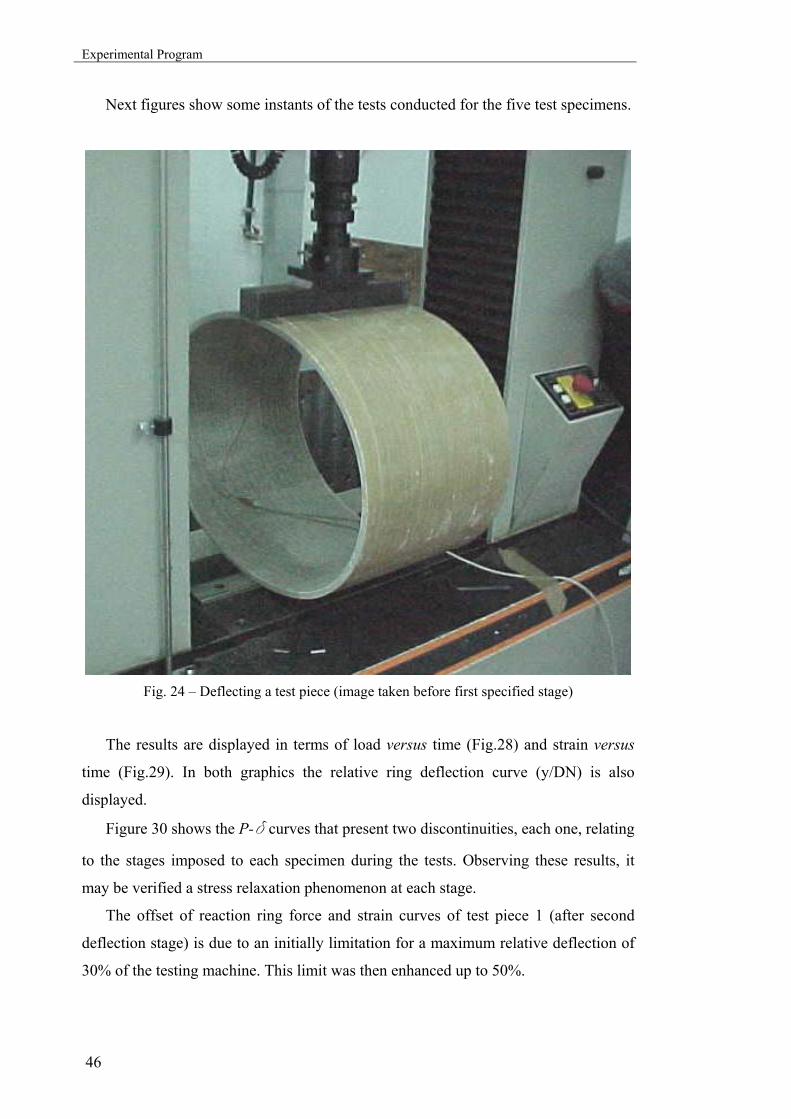
Next figures show some instants of the tests conducted for the five test specimens.
Fig. 24 – Deflecting a test piece (image taken before first specified stage)
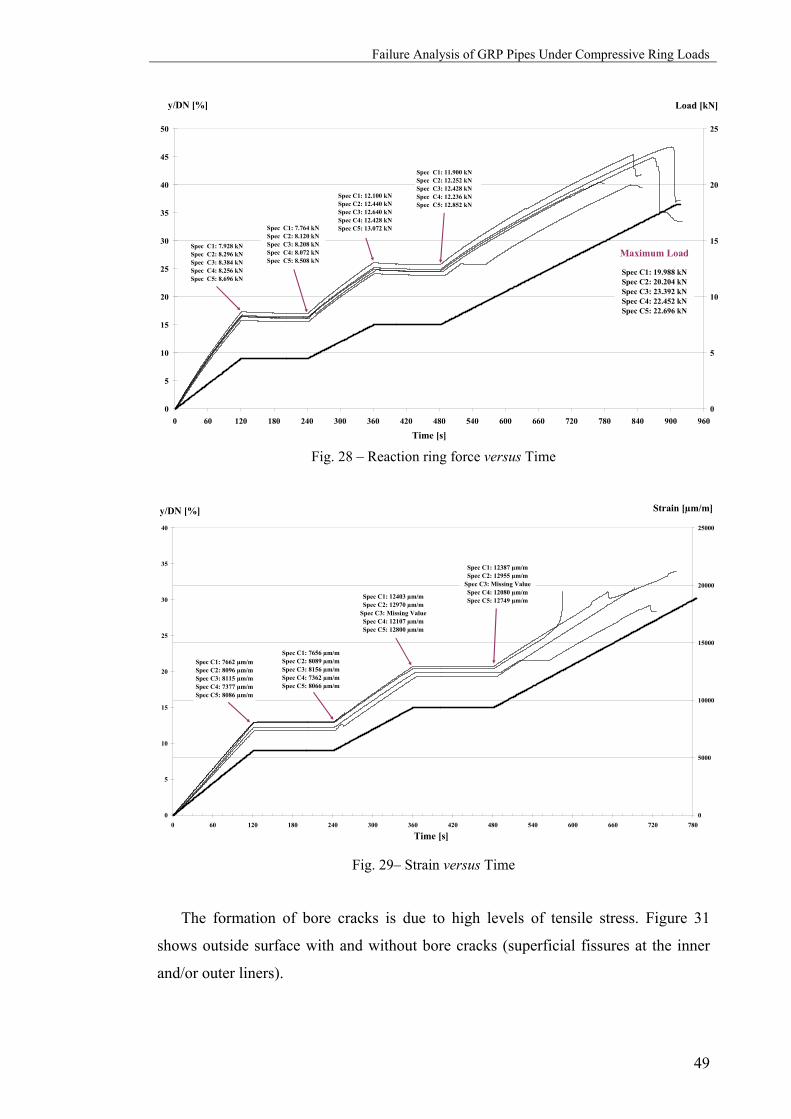
The results are displayed in terms of load versus time (Fig.28) and strain versus
time (Fig.29). In both graphics the relative ring deflection curve (y/DN) is also
displayed.
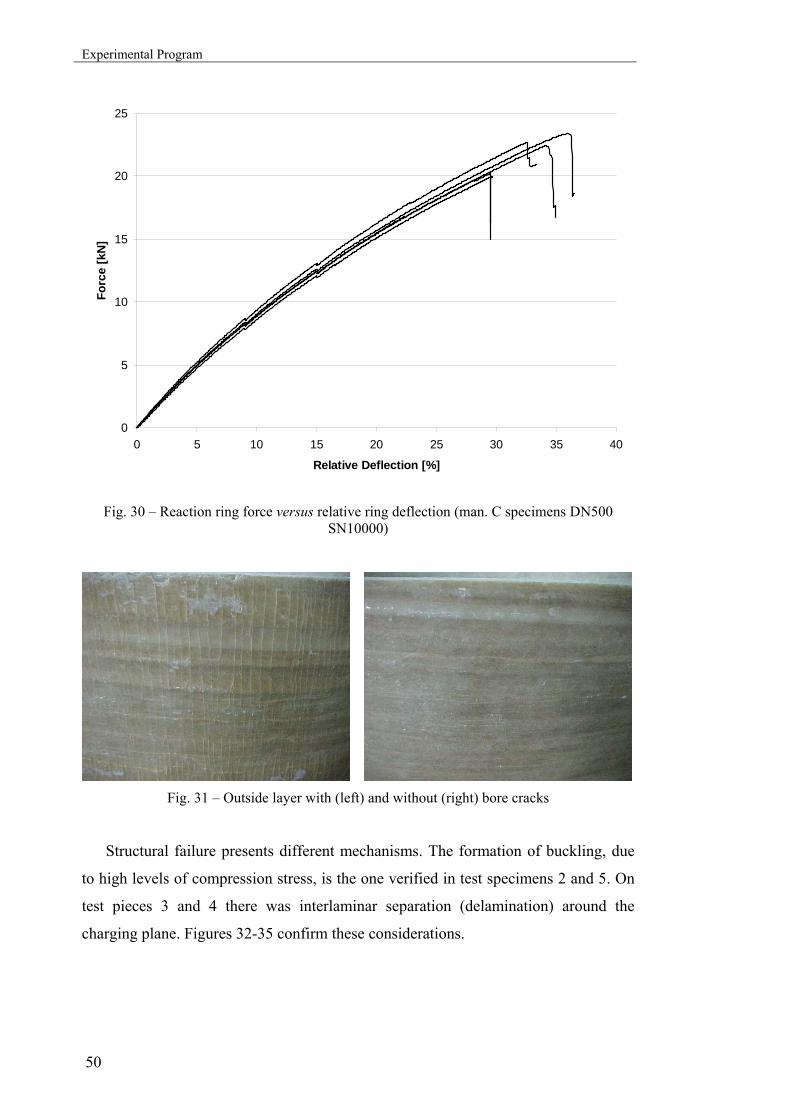
Figure 30 shows the P-d curves that present two discontinuities, each one, relating
to the stages imposed to each specimen during the tests. Observing these results, it
may be verified a stress relaxation phenomenon at each stage.
The offset of reaction ring force and strain curves of test piece 1 (after second
deflection stage) is due to an initially limitation for a maximum relative deflection of
30% of the testing machine. This limit was then enhanced up to 50%.
Failure Analysis of GRP Pipes Under Compressive Ring Loads
47
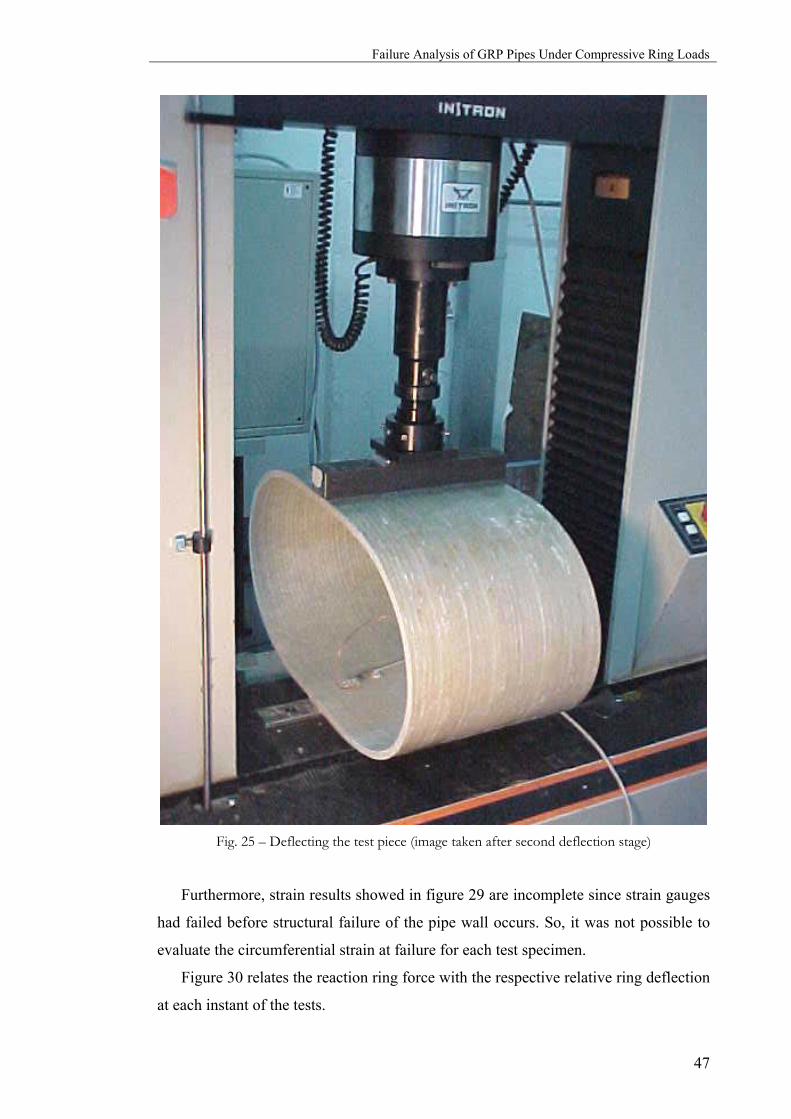
Fig. 25 – Deflecting the test piece (image taken after second deflection stage)
Furthermore, strain results showed in figure 29 are incomplete since strain gauges
had failed before structural failure of the pipe wall occurs. So, it was not possible to
evaluate the circumferential strain at failure for each test specimen.
Figure 30 relates the reaction ring force with the respective relative ring deflection
at each instant of the tests.
Experimental Program
48
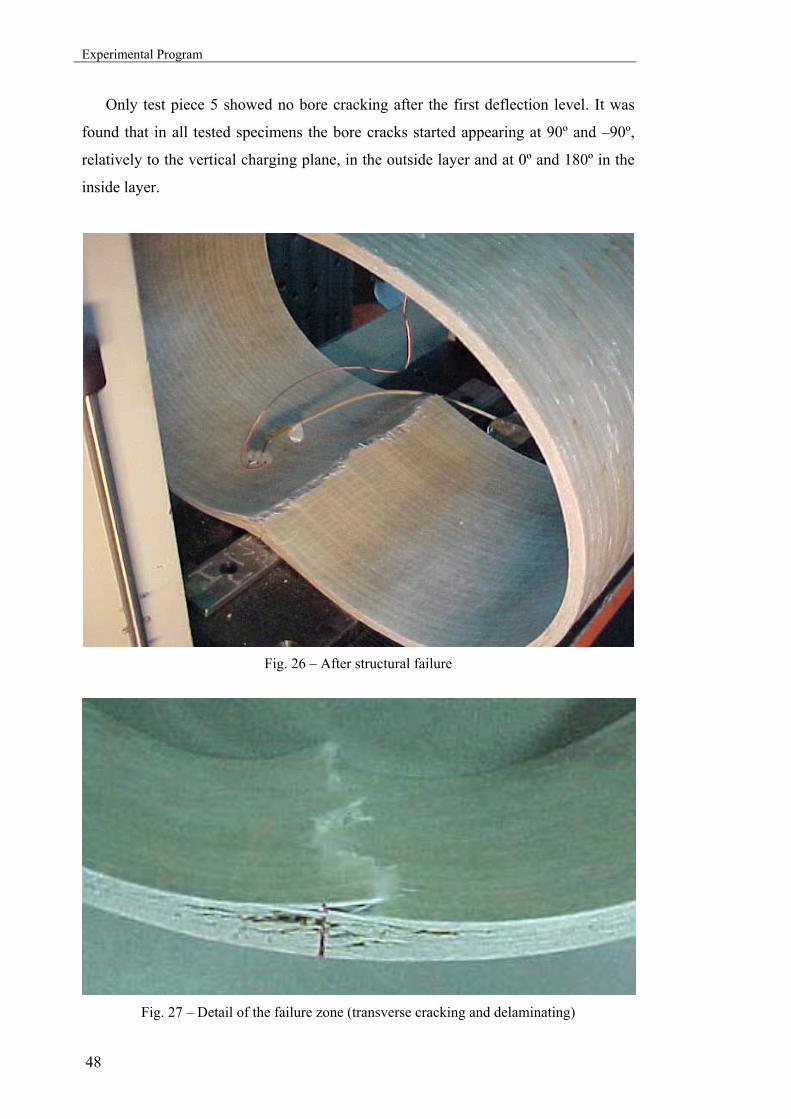
Only test piece 5 showed no bore cracking after the first deflection level. It was
found that in all tested specimens the bore cracks started appearing at 90º and –90º,
relatively to the vertical charging plane, in the outside layer and at 0º and 180º in the
inside layer.
Fig. 26 – After structural failure
Fig. 27 – Detail of the failure zone (transverse cracking and delaminating)
Failure Analysis of GRP Pipes Under Compressive Ring Loads
49
0
5
10
15
20
25
0 60 120 180 240 300 360 420 480 540 600 660 720 780 840 900 960
Load [kN]
0
5
10
15
20
25
30
35
40
45
50
Time [s]
y/DN [%]
Spec C1: 7.928 kN Spec C2: 8.296 kNSpec C3: 8.384 kNSpec C4: 8.256 kNSpec C5: 8.696 kN
Spec C1: 7.764 kN Spec C2: 8.120 kNSpec C3: 8.208 kNSpec C4: 8.072 kNSpec C5: 8.508 kN
Spec C1: 12.100 kN Spec C2: 12.440 kNSpec C3: 12.640 kNSpec C4: 12.428 kNSpec C5: 13.072 kN
Spec C1: 11.900 kN Spec C2: 12.252 kNSpec C3: 12.428 kNSpec C4: 12.236 kNSpec C5: 12.852 kN
Maximum Load
Spec C1: 19.988 kN Spec C2: 20.204 kNSpec C3: 23.392 kNSpec C4: 22.452 kNSpec C5: 22.696 kN
Fig. 28 – Reaction ring force versus Time
0
5000
10000
15000
20000
25000
0 60 120 180 240 300 360 420 480 540 600 660 720 780
Time [s]
Strain [µm/m]
0
5
10
15
20
25
30
35
40
y/DN [%]
Spec C1: 7662 µm/mSpec C2: 8096 µm/mSpec C3: 8115 µm/mSpec C4: 7377 µm/mSpec C5: 8086 µm/m
Spec C1: 12403 µm/mSpec C2: 12970 µm/m
Spec C3: Missing ValueSpec C4: 12107 µm/mSpec C5: 12800 µm/m
Spec C1: 7656 µm/mSpec C2: 8089 µm/mSpec C3: 8156 µm/mSpec C4: 7362 µm/mSpec C5: 8066 µm/m
Spec C1: 12387 µm/mSpec C2: 12955 µm/m
Spec C3: Missing ValueSpec C4: 12080 µm/mSpec C5: 12749 µm/m
Fig. 29– Strain versus Time
The formation of bore cracks is due to high levels of tensile stress. Figure 31
shows outside surface with and without bore cracks (superficial fissures at the inner
and/or outer liners).
Experimental Program
50
0
5
10
15
20
25
0 5 10 15 20 25 30 35 40
Relative Deflection [%]
Forc
e [k
N]
Fig. 30 – Reaction ring force versus relative ring deflection (man. C specimens DN500 SN10000)
Fig. 31 – Outside layer with (left) and without (right) bore cracks
Structural failure presents different mechanisms. The formation of buckling, due
to high levels of compression stress, is the one verified in test specimens 2 and 5. On
test pieces 3 and 4 there was interlaminar separation (delamination) around the
charging plane. Figures 32-35 confirm these considerations.

Failure Analysis of GRP Pipes Under Compressive Ring Loads
51
Fig. 32 – Test piece 2. Buckling of pipe wall around upper bar
Fig. 33 – Test piece 3. Fibre rupture and delaminating from inner surface
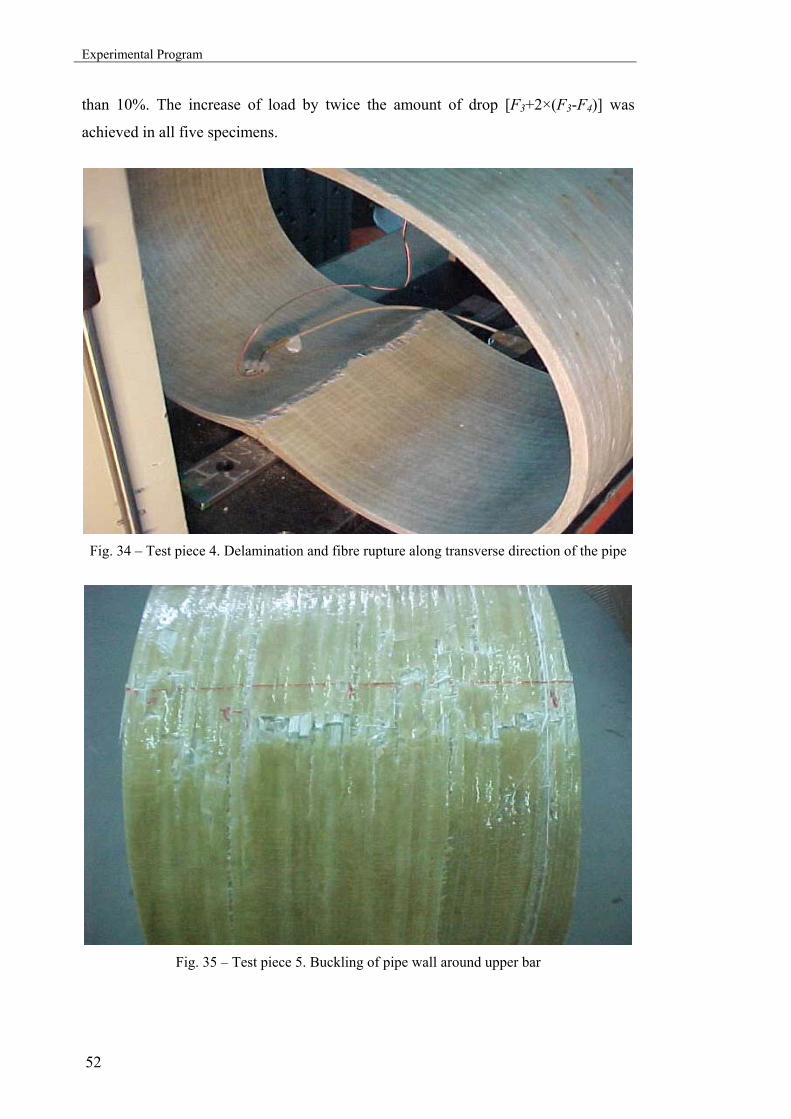
The amount of the drop of reaction ring force during the second deflection stage
was determined in absolute (F3-F4) and percentage terms [100×(F3-F4)/F3]. It was
found that in all five specimens the amount of the drop at the second level was less
Experimental Program
52
than 10%. The increase of load by twice the amount of drop [F3+2×(F3-F4)] was
achieved in all five specimens.
Fig. 34 – Test piece 4. Delamination and fibre rupture along transverse direction of the pipe
Fig. 35 – Test piece 5. Buckling of pipe wall around upper bar

Failure Analysis of GRP Pipes Under Compressive Ring Loads
53
From the observations one can say that the main damage mechanisms leading to
structural failure of GRP pipes10 under static ring deflection are delamination between
plies and rupture of fibres. It seems properly to assume that bore cracks verified at
surface have no structural origin and influence, as they appear at inner and outer
surfaces where liners with no structural relevance are applied.
The softening process that is presented by all tested specimens (see figure 30)
makes one think of the combination of damage phenomena together with the
geometric non-linearity that characterize these structures.
Creeping In Wet Conditions
Each test piece was a complete ring cut from a pipe type DN500 SN10000
supplied by manufacturer C and made by filament winding and short fibres
deposition, a hybrid process, with 300 mm long (specs 36 to 60).
The evolution of the relative ring deflection during each individual test is
represented in the following figure. These curves refer to the 23 valid tests conducted
within this campaign and are drawn in a log-log scale.
1.05
1.15
1.25
1.35
-2 -1 0 1 2 3 4Log (t) [time in hours]
Log(
y/dm
) [re
lativ
e ve
rtic
al d
efle
ctio
n in
%]
Fig. 36 - Relative ring deflections (specimens DN500 SN10000 from manufacturer C)
10 the five specimens tested were made by filament winding and short fibre deposition. One may not assume that all types of GRP pipes behave in the same way.
Experimental Program
54
One should notice that, by being in a tenth based logarithm (log10t), failure times
within the third positive decade (3<log10t<4) are relatively near11 of the equivalent
time representation for 50 years (log10438300≈5.642). This is still the main reason for
requiring long-term tests of 10000h long by existing standard.
Limitations of the test arrangement, namely the impossibility of registering online
the increasing deflection (measurements were made only at intervals of time),
explains the lack of data at the end stages of many of the individual curves presented.
Every specimens tested presented wall rupture before 10000h test duration
(log1010000=4) and the longest assay lasted 5623h. So, there is no necessity of
applying complementary equations, defined in EN1227:1997 [21] for the case of a not
ruptured test piece.
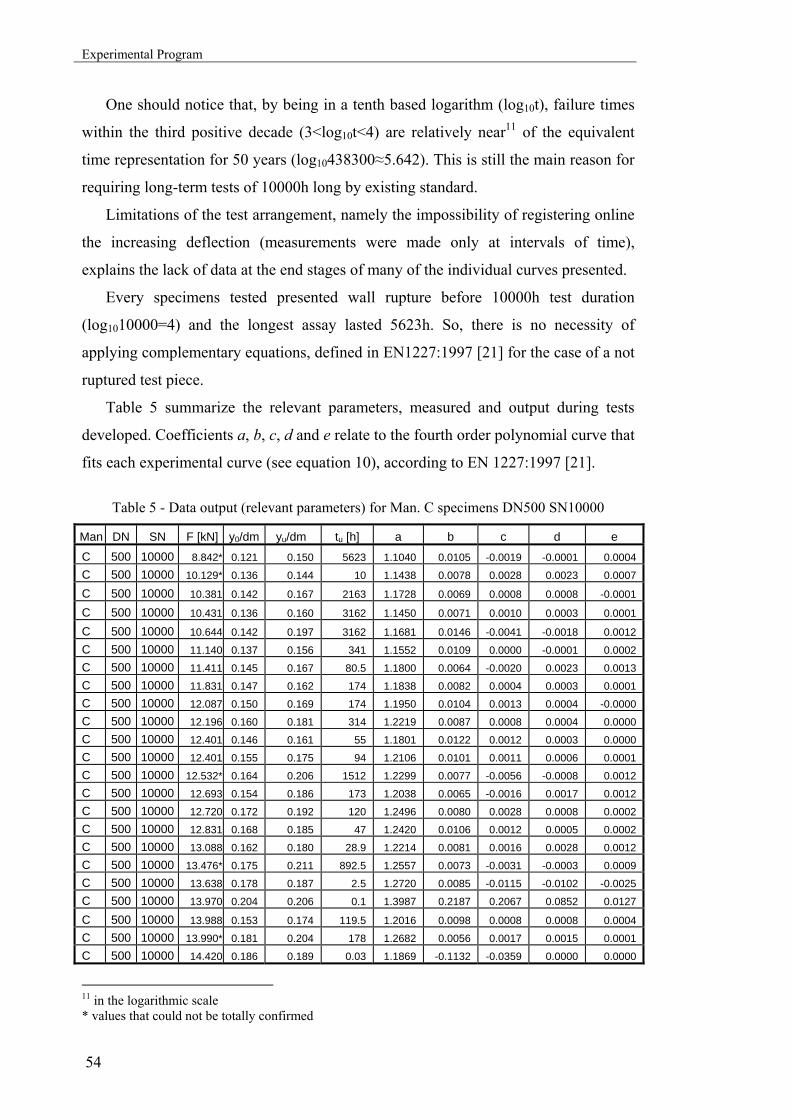
Table 5 summarize the relevant parameters, measured and output during tests
developed. Coefficients a, b, c, d and e relate to the fourth order polynomial curve that
fits each experimental curve (see equation 10), according to EN 1227:1997 [21].
Table 5 - Data output (relevant parameters) for Man. C specimens DN500 SN10000
Man DN SN F [kN] y0/dm yu/dm tu [h] a b c d e C 500 10000 8.842* 0.121 0.150 5623 1.1040 0.0105 -0.0019 -0.0001 0.0004 C 500 10000 10.129* 0.136 0.144 10 1.1438 0.0078 0.0028 0.0023 0.0007
C 500 10000 10.381 0.142 0.167 2163 1.1728 0.0069 0.0008 0.0008 -0.0001
C 500 10000 10.431 0.136 0.160 3162 1.1450 0.0071 0.0010 0.0003 0.0001
C 500 10000 10.644 0.142 0.197 3162 1.1681 0.0146 -0.0041 -0.0018 0.0012 C 500 10000 11.140 0.137 0.156 341 1.1552 0.0109 0.0000 -0.0001 0.0002 C 500 10000 11.411 0.145 0.167 80.5 1.1800 0.0064 -0.0020 0.0023 0.0013 C 500 10000 11.831 0.147 0.162 174 1.1838 0.0082 0.0004 0.0003 0.0001 C 500 10000 12.087 0.150 0.169 174 1.1950 0.0104 0.0013 0.0004 -0.0000 C 500 10000 12.196 0.160 0.181 314 1.2219 0.0087 0.0008 0.0004 0.0000 C 500 10000 12.401 0.146 0.161 55 1.1801 0.0122 0.0012 0.0003 0.0000 C 500 10000 12.401 0.155 0.175 94 1.2106 0.0101 0.0011 0.0006 0.0001 C 500 10000 12.532* 0.164 0.206 1512 1.2299 0.0077 -0.0056 -0.0008 0.0012 C 500 10000 12.693 0.154 0.186 173 1.2038 0.0065 -0.0016 0.0017 0.0012 C 500 10000 12.720 0.172 0.192 120 1.2496 0.0080 0.0028 0.0008 0.0002 C 500 10000 12.831 0.168 0.185 47 1.2420 0.0106 0.0012 0.0005 0.0002 C 500 10000 13.088 0.162 0.180 28.9 1.2214 0.0081 0.0016 0.0028 0.0012 C 500 10000 13.476* 0.175 0.211 892.5 1.2557 0.0073 -0.0031 -0.0003 0.0009 C 500 10000 13.638 0.178 0.187 2.5 1.2720 0.0085 -0.0115 -0.0102 -0.0025 C 500 10000 13.970 0.204 0.206 0.1 1.3987 0.2187 0.2067 0.0852 0.0127
C 500 10000 13.988 0.153 0.174 119.5 1.2016 0.0098 0.0008 0.0008 0.0004 C 500 10000 13.990* 0.181 0.204 178 1.2682 0.0056 0.0017 0.0015 0.0001 C 500 10000 14.420 0.186 0.189 0.03 1.1869 -0.1132 -0.0359 0.0000 0.0000
11 in the logarithmic scale * values that could not be totally confirmed
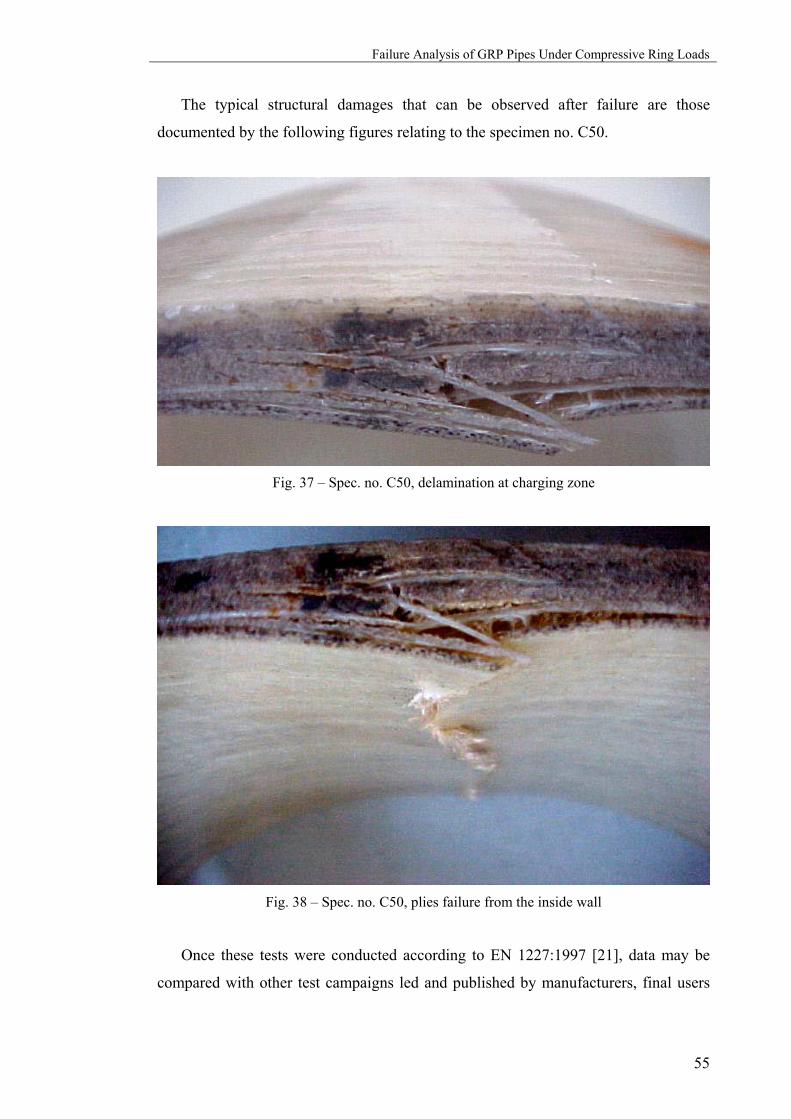
Failure Analysis of GRP Pipes Under Compressive Ring Loads
55
The typical structural damages that can be observed after failure are those
documented by the following figures relating to the specimen no. C50.
Fig. 37 – Spec. no. C50, delamination at charging zone
Fig. 38 – Spec. no. C50, plies failure from the inside wall
Once these tests were conducted according to EN 1227:1997 [21], data may be
compared with other test campaigns led and published by manufacturers, final users
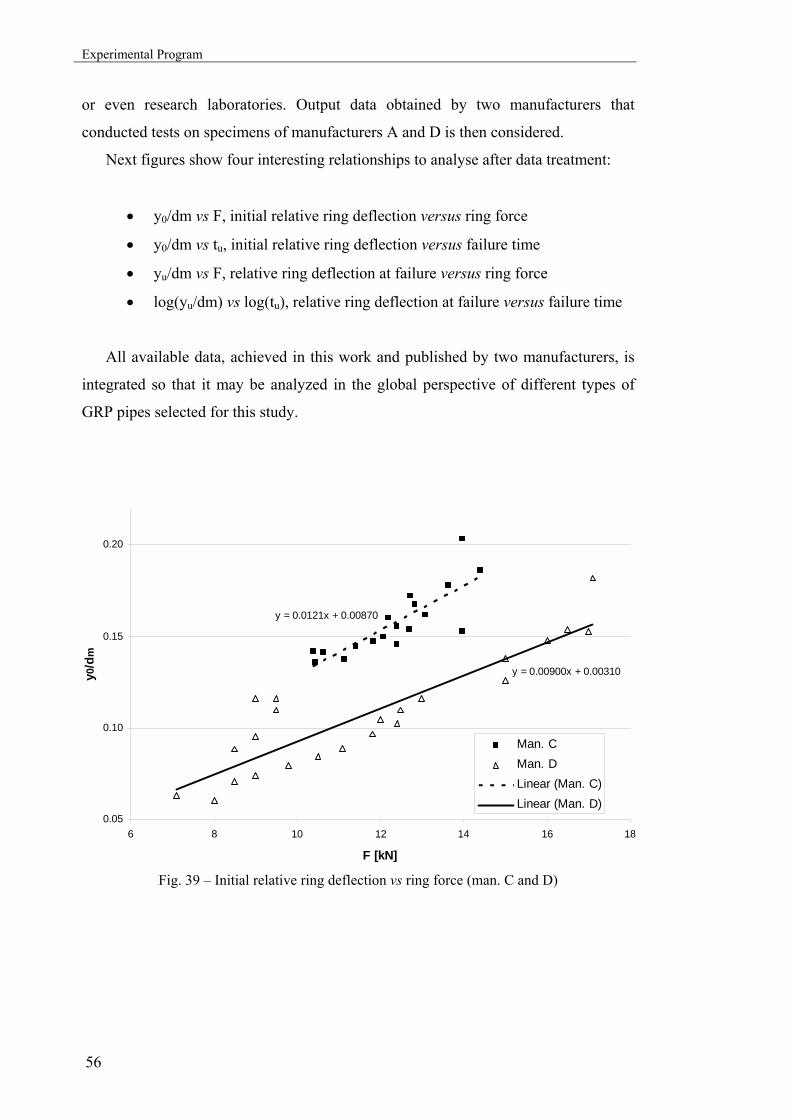
Experimental Program
56
or even research laboratories. Output data obtained by two manufacturers that
conducted tests on specimens of manufacturers A and D is then considered.
Next figures show four interesting relationships to analyse after data treatment:
• y0/dm vs F, initial relative ring deflection versus ring force
• y0/dm vs tu, initial relative ring deflection versus failure time
• yu/dm vs F, relative ring deflection at failure versus ring force
• log(yu/dm) vs log(tu), relative ring deflection at failure versus failure time
All available data, achieved in this work and published by two manufacturers, is
integrated so that it may be analyzed in the global perspective of different types of
GRP pipes selected for this study.
y = 0.0121x + 0.00870
y = 0.00900x + 0.00310
0.05
0.10
0.15
0.20
6 8 10 12 14 16 18
F [kN]
y0/d
m
Man. CMan. DLinear (Man. C)Linear (Man. D)
Fig. 39 – Initial relative ring deflection vs ring force (man. C and D)
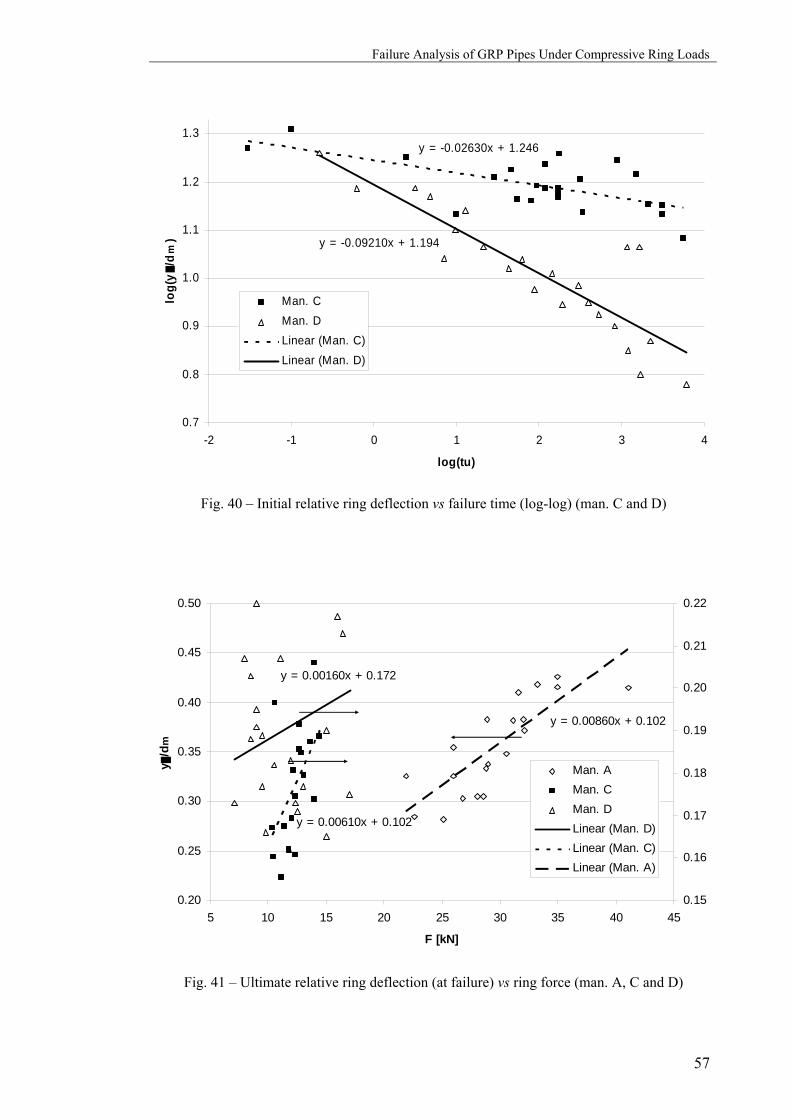
Failure Analysis of GRP Pipes Under Compressive Ring Loads
57
y = -0.02630x + 1.246
y = -0.09210x + 1.194
0.7
0.8
0.9
1.0
1.1
1.2
1.3
-2 -1 0 1 2 3 4
log(tu)
log(
y/d
m)
Man. CMan. DLinear (Man. C)Linear (Man. D)
Fig. 40 – Initial relative ring deflection vs failure time (log-log) (man. C and D)
y = 0.00160x + 0.172
y = 0.00610x + 0.102
y = 0.00860x + 0.102
0.20
0.25
0.30
0.35
0.40
0.45
0.50
5 10 15 20 25 30 35 40 45
F [kN]
y/d
m
0.15
0.16
0.17
0.18
0.19
0.20
0.21
0.22
Man. AMan. CMan. DLinear (Man. D)Linear (Man. C)Linear (Man. A)
Fig. 41 – Ultimate relative ring deflection (at failure) vs ring force (man. A, C and D)
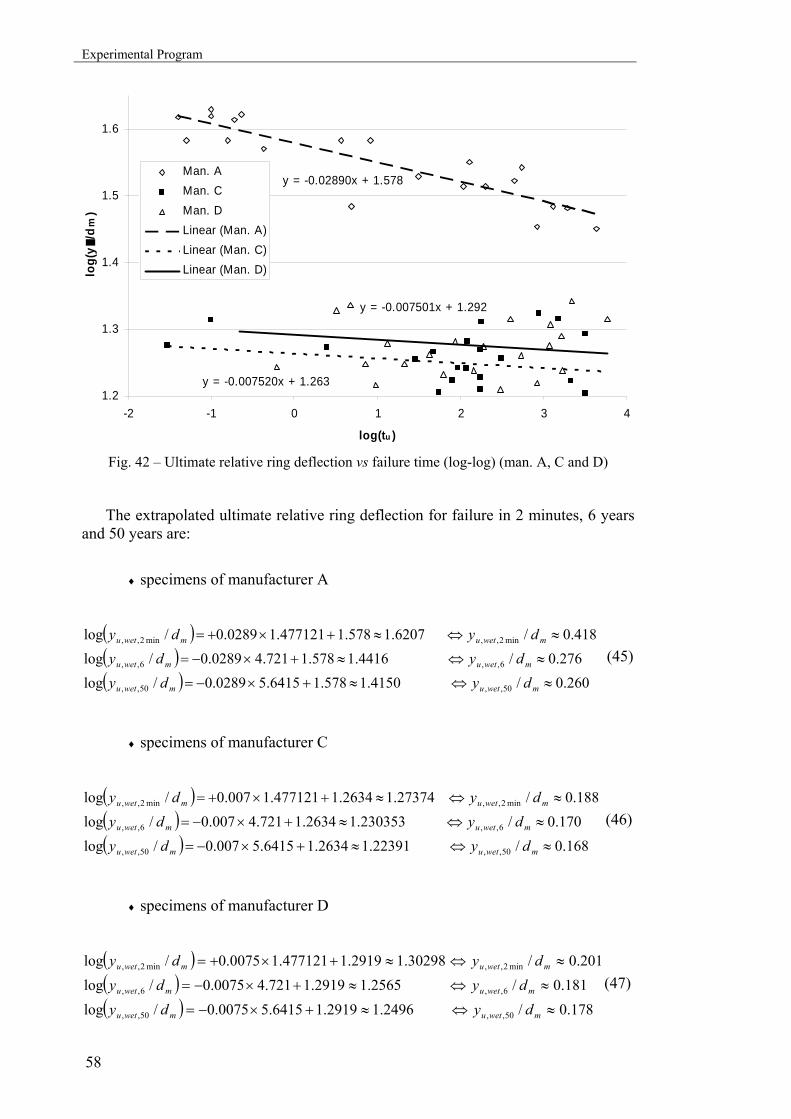
Experimental Program
58
y = -0.02890x + 1.578
y = -0.007520x + 1.263
y = -0.007501x + 1.292
1.2
1.3
1.4
1.5
1.6
-2 -1 0 1 2 3 4
log(tu )
log(
y/d
m)
Man. AMan. CMan. DLinear (Man. A)Linear (Man. C)Linear (Man. D)
Fig. 42 – Ultimate relative ring deflection vs failure time (log-log) (man. A, C and D)
The extrapolated ultimate relative ring deflection for failure in 2 minutes, 6 years and 50 years are:
♦ specimens of manufacturer A
( )( )( ) 260.0/4150.1578.16415.50289.0/log
276.0/4416.1578.1721.40289.0/log418.0/6207.1578.1477121.10289.0/log
50,,50,,
6,,6,,
min2,,min2,,
≈⇔≈+×−=
≈⇔≈+×−=
≈⇔≈+×+=
mwetumwetu
mwetumwetu
mwetumwetu
dydydydy
dydy (45)
♦ specimens of manufacturer C
( )( )( ) 168.0/22391.12634.16415.5007.0/log
170.0/230353.12634.1721.4007.0/log188.0/27374.12634.1477121.1007.0/log
50,,50,,
6,,6,,
min2,,min2,,
≈⇔≈+×−=
≈⇔≈+×−=
≈⇔≈+×+=
mwetumwetu
mwetumwetu
mwetumwetu
dydydydy
dydy (46)
♦ specimens of manufacturer D
( )( )( ) 178.0/2496.12919.16415.50075.0/log
181.0/2565.12919.1721.40075.0/log201.0/30298.12919.1477121.10075.0/log
50,,50,,
6,,6,,
min2,,min2,,
≈⇔≈+×−=
≈⇔≈+×−=
≈⇔≈+×+=
mwetumwetu
mwetumwetu
mwetumwetu
dydydydy
dydy(47)

Failure Analysis of GRP Pipes Under Compressive Ring Loads
59
And so, the respective regression ratios, according to the standards EN1227 [21] and EN705 [18], are:
♦ specimens of manufacturer A 941.0276.0260.0
//
, 6,,
50,, ≈==mwetu
mwetu
dydy
defRR (48)
♦ specimens of manufacturer C 985.0170.0168.0
//
, 6,,
50,, ≈==mwetu
mwetu
dydy
defRR (49)
♦ specimens of manufacturer D 984.0181.0178.0
//
6,,
50,,, ≈==
mdefu
mdefudefR dy
dyR (50)
These regression ratios, representing the deflection tendency by creeping effects
as time under solicitation increases from short to long-term, show that specimens from
manufacturers C and D have a similar behaviour with higher creeping tendency while
those from manufacturer A reveal more stability during same periods of time.
Alternative procedures, with preconditioning under water for different times to
determine the minimum soaking period to achieve saturation of each specimen, are
now being studied in different research projects. In those tests, after a treatment of
data similar to the one made in this standard procedure presented above, the influence
of accelerated ageing as well as of water absorption by the pipe wall will certainly be
assessed for each type of GRP pipe.
Stress Relaxation
The four types of pipes tested in this campaign (man. A, B, C and D) showed
different behaviour in terms of stress relaxation when subjected to a fixed ring
deflection condition. Even in those pipes having the same nominal specification for
stiffness, SN 5000, and that have been subjected to similar preconditioning and
charging procedures, one can observe primarily that the initial reaction ring force, i.e.
the stiffness developed is different for pipes of different manufacturers.
Figure 43 shows how the three machines were disposed allowing the conduction
of three tests simultaneously.
None of the tested tubes suffered structural failure neither visible damages. With
acoustic emission monitoring12 it is, however, evident the occurrence of matrix
12 one singular test with acoustic emission monitoring was conducted in a man. B specimen
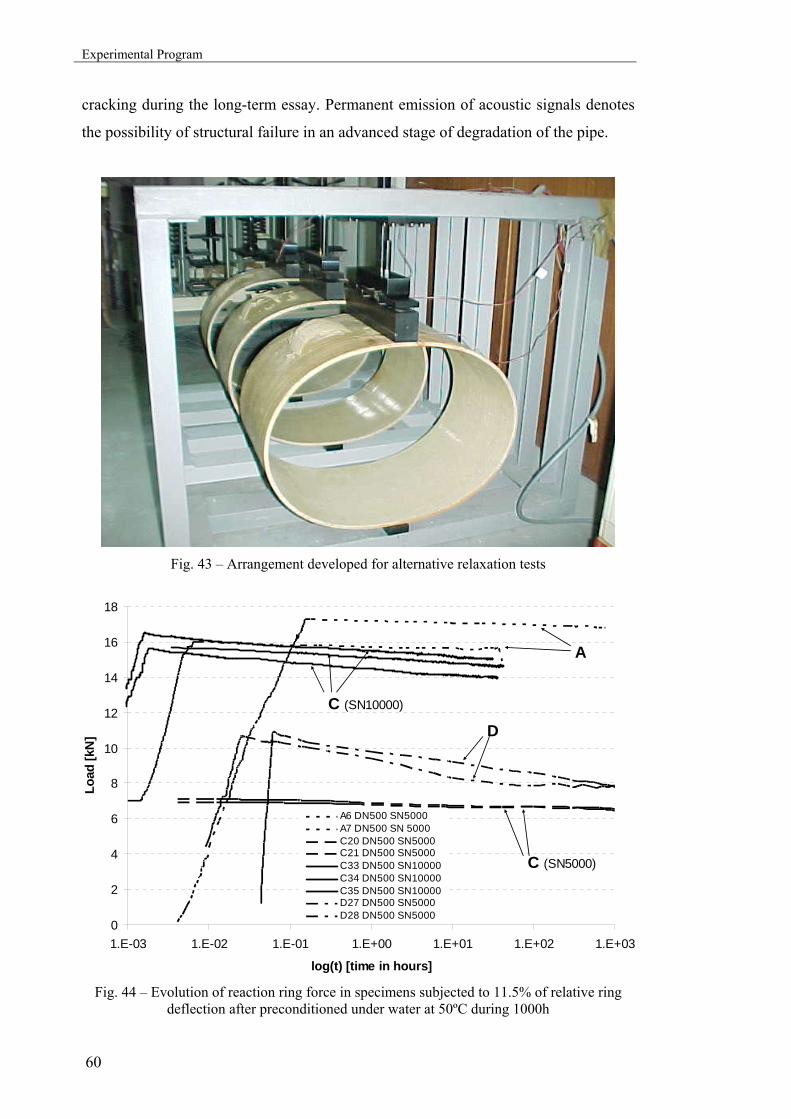
Experimental Program
60
cracking during the long-term essay. Permanent emission of acoustic signals denotes
the possibility of structural failure in an advanced stage of degradation of the pipe.
Fig. 43 – Arrangement developed for alternative relaxation tests
0
2
4
6
8
10
12
14
16
18
1.E-03 1.E-02 1.E-01 1.E+00 1.E+01 1.E+02 1.E+03
log(t) [time in hours]
Load
[kN
]
A6 DN500 SN5000A7 DN500 SN 5000C20 DN500 SN5000C21 DN500 SN5000C33 DN500 SN10000C34 DN500 SN10000C35 DN500 SN10000D27 DN500 SN5000D28 DN500 SN5000
A
C (SN10000)
D
C (SN5000)
Fig. 44 – Evolution of reaction ring force in specimens subjected to 11.5% of relative ring
deflection after preconditioned under water at 50ºC during 1000h
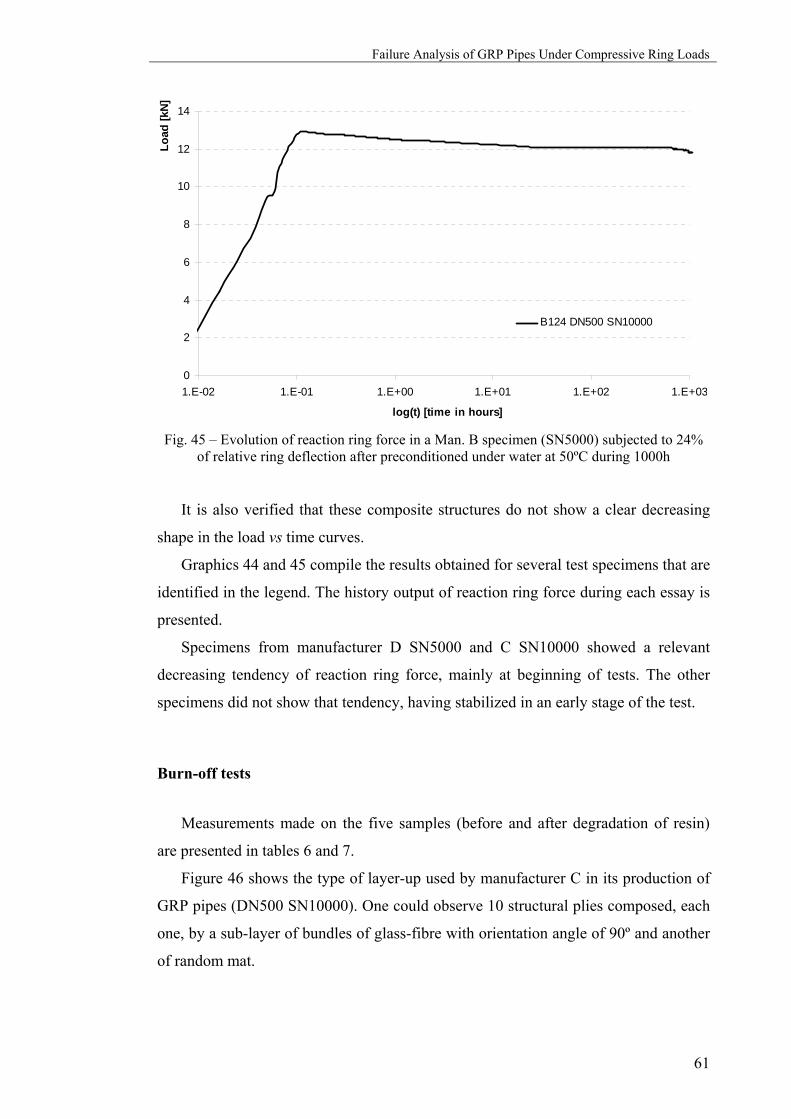
Failure Analysis of GRP Pipes Under Compressive Ring Loads
61
0
2
4
6
8
10
12
14
1.E-02 1.E-01 1.E+00 1.E+01 1.E+02 1.E+03
log(t) [time in hours]
Load
[kN]
B124 DN500 SN10000
Fig. 45 – Evolution of reaction ring force in a Man. B specimen (SN5000) subjected to 24%
of relative ring deflection after preconditioned under water at 50ºC during 1000h
It is also verified that these composite structures do not show a clear decreasing
shape in the load vs time curves.
Graphics 44 and 45 compile the results obtained for several test specimens that are
identified in the legend. The history output of reaction ring force during each essay is
presented.
Specimens from manufacturer D SN5000 and C SN10000 showed a relevant
decreasing tendency of reaction ring force, mainly at beginning of tests. The other
specimens did not show that tendency, having stabilized in an early stage of the test.
Burn-off tests
Measurements made on the five samples (before and after degradation of resin)
are presented in tables 6 and 7.
Figure 46 shows the type of layer-up used by manufacturer C in its production of
GRP pipes (DN500 SN10000). One could observe 10 structural plies composed, each
one, by a sub-layer of bundles of glass-fibre with orientation angle of 90º and another
of random mat.

Experimental Program
62
Table 6 – weight measurements for each sample before and after burn-off tests
Weight [g] sample # sample fibre resin
% resin % fibre13
1 4.640 2.957 1.683 36.27 63.73 2 4.650 3.019 1.631 35.03 64.92 3 5.093 3.351 1.742 34.20 65.80 4 4.957 3.232 1.725 34.80 65.20 5 4.474 2.905 1.570 35.08 64.92
Table 7 – average results for mass contents in Man. C specimens
average results average S.D. Resin [%] 35.09 0.75 Fibre + Silical charges [%] 64.91 0.75 Silical charges [%] (estimation) 35 ---
The presence of silical charges (inerts) embedded in the resin, mostly introduced
to reduce costs of the final product, increases the difficulty of modelling the behaviour
of of these GRP pipes, once either the tension or compressive capabilities are not
easily known.
Fig. 46 – Sample of one single layer free of resin and silical charges (after burning-off)
13 this value represents, in fact, the percentage of fibre + charges (sand).
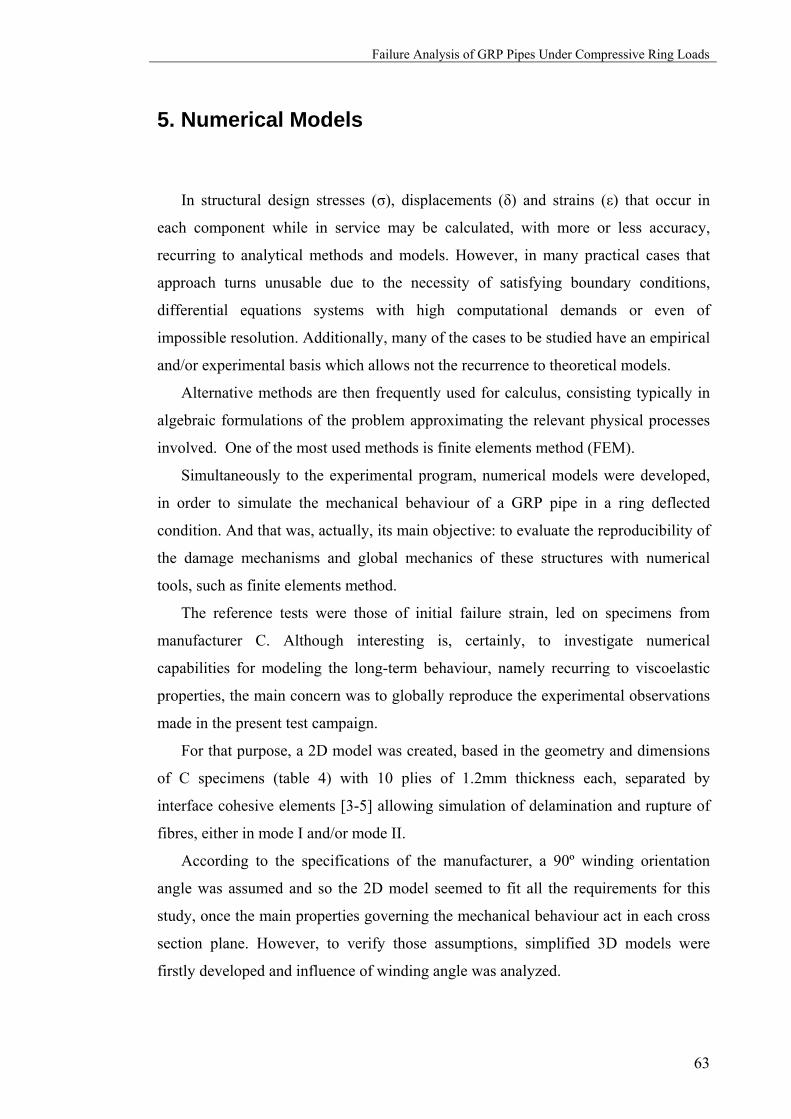
Failure Analysis of GRP Pipes Under Compressive Ring Loads
63
5. Numerical Models
In structural design stresses (σ), displacements (δ) and strains (ε) that occur in
each component while in service may be calculated, with more or less accuracy,
recurring to analytical methods and models. However, in many practical cases that
approach turns unusable due to the necessity of satisfying boundary conditions,
differential equations systems with high computational demands or even of
impossible resolution. Additionally, many of the cases to be studied have an empirical
and/or experimental basis which allows not the recurrence to theoretical models.
Alternative methods are then frequently used for calculus, consisting typically in
algebraic formulations of the problem approximating the relevant physical processes
involved. One of the most used methods is finite elements method (FEM).
Simultaneously to the experimental program, numerical models were developed,
in order to simulate the mechanical behaviour of a GRP pipe in a ring deflected
condition. And that was, actually, its main objective: to evaluate the reproducibility of
the damage mechanisms and global mechanics of these structures with numerical
tools, such as finite elements method.
The reference tests were those of initial failure strain, led on specimens from
manufacturer C. Although interesting is, certainly, to investigate numerical
capabilities for modeling the long-term behaviour, namely recurring to viscoelastic
properties, the main concern was to globally reproduce the experimental observations
made in the present test campaign.
For that purpose, a 2D model was created, based in the geometry and dimensions
of C specimens (table 4) with 10 plies of 1.2mm thickness each, separated by
interface cohesive elements [3-5] allowing simulation of delamination and rupture of
fibres, either in mode I and/or mode II.
According to the specifications of the manufacturer, a 90º winding orientation
angle was assumed and so the 2D model seemed to fit all the requirements for this
study, once the main properties governing the mechanical behaviour act in each cross
section plane. However, to verify those assumptions, simplified 3D models were
firstly developed and influence of winding angle was analyzed.
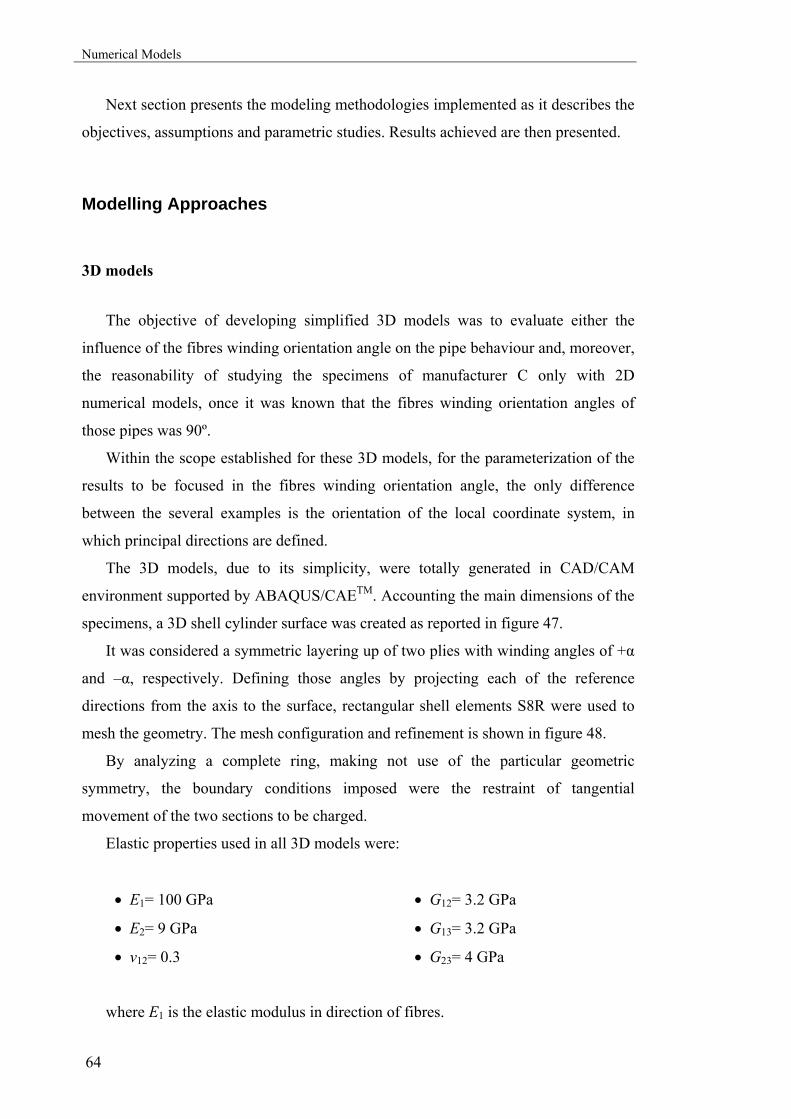
Numerical Models
64
Next section presents the modeling methodologies implemented as it describes the
objectives, assumptions and parametric studies. Results achieved are then presented.
Modelling Approaches
3D models
The objective of developing simplified 3D models was to evaluate either the
influence of the fibres winding orientation angle on the pipe behaviour and, moreover,
the reasonability of studying the specimens of manufacturer C only with 2D
numerical models, once it was known that the fibres winding orientation angles of
those pipes was 90º.
Within the scope established for these 3D models, for the parameterization of the
results to be focused in the fibres winding orientation angle, the only difference
between the several examples is the orientation of the local coordinate system, in
which principal directions are defined.
The 3D models, due to its simplicity, were totally generated in CAD/CAM
environment supported by ABAQUS/CAETM. Accounting the main dimensions of the
specimens, a 3D shell cylinder surface was created as reported in figure 47.
It was considered a symmetric layering up of two plies with winding angles of +α
and –α, respectively. Defining those angles by projecting each of the reference
directions from the axis to the surface, rectangular shell elements S8R were used to
mesh the geometry. The mesh configuration and refinement is shown in figure 48.
By analyzing a complete ring, making not use of the particular geometric
symmetry, the boundary conditions imposed were the restraint of tangential
movement of the two sections to be charged.
Elastic properties used in all 3D models were:
• E1= 100 GPa
• E2= 9 GPa
• ν12= 0.3
• G12= 3.2 GPa
• G13= 3.2 GPa
• G23= 4 GPa
where E1 is the elastic modulus in direction of fibres.

Failure Analysis of GRP Pipes Under Compressive Ring Loads
65
Fig. 47 – Reference shell geometry generated
Number of nodes: 14720 Number of elements: 4800 Element types: S8R
Fig. 48 – Mesh generated on the reference surface

Numerical Models
66
May one notice that, by being looking for the influence of one parameter, the
values attributed to the others is not quite relevant as long as they are equally defined
for every examples evaluated.
The nine models run had the properties summarized in table 8.
Table 8 – Summary of the definitions of examples run
model ref.
parameter 1 2 3 4 5 6 7 8 9
no. plies 2 2 2 2 2 2 2 2 2
α1 [º] 30 45 50 52.5 55 57.5 60 80 90
α2 [º] -30 -45 -50 -52.5 -55 -57.5 -60 -80 90
t1 [mm] 2 2 2 2 2 2 2 2 2
t2 [mm] 2 2 2 2 2 2 2 2 2
2D models
Due to the availability of manufacturing specifications of specimens from
manufacturer C, which were chosen for initial failure strain tests, 2D numerical
models were developed based on them.
The ring deflection was imposed by increasing successively the displacement of
the charging section from initial undeflected condition to the final value specified. To
reduce the computational weight of each model, half of the cross section was
considered. Figures 49 and 50 represent schematically the load case and the
equivalent configuration accounted for 2D modelling (half section) with the
corresponding boundary conditions imposed.
As described before, specimens from manufacturer C are produced by a hybrid
process of filament winding and short-fibre deposition. That means that between each
winded ply one find complete layers of short-fibres randomly orientated impregnated
with resin. Additionally, the epoxy resin used in the manufacturing process contains
high levels (estimated in burn-off tests) of granulated inerts that considerably decrease
the structural ability of the pipe as they allow slippering of plies, propitiating
delaminations at lower stress levels.
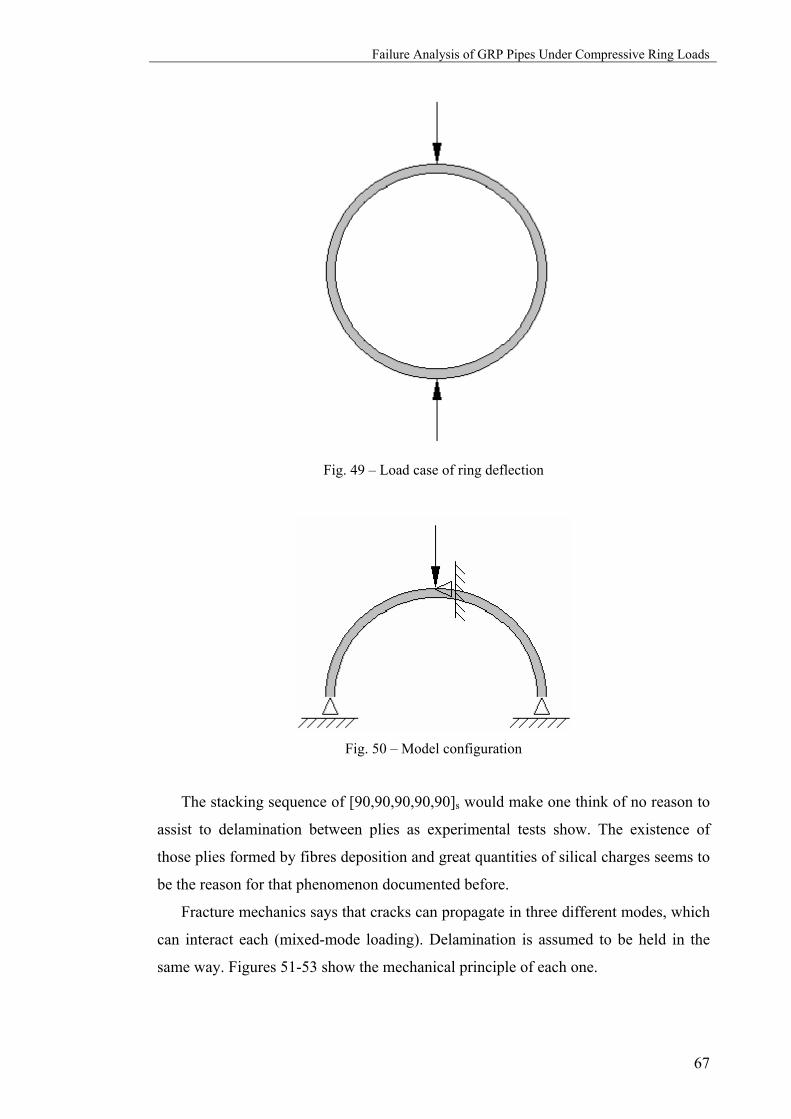
Failure Analysis of GRP Pipes Under Compressive Ring Loads
67
Fig. 49 – Load case of ring deflection
Fig. 50 – Model configuration
The stacking sequence of [90,90,90,90,90]s would make one think of no reason to
assist to delamination between plies as experimental tests show. The existence of
those plies formed by fibres deposition and great quantities of silical charges seems to
be the reason for that phenomenon documented before.
Fracture mechanics says that cracks can propagate in three different modes, which
can interact each (mixed-mode loading). Delamination is assumed to be held in the
same way. Figures 51-53 show the mechanical principle of each one.

Numerical Models
68
Fig. 51 – Fracture in mode I
Fig. 52 – Fracture in mode II
Fig. 53 – Fracture in mode III
In the present case, experimental observations showed that delamination is
dominated by mode I and/or mode II, while rupture of fibres occurs in mode I.
As the strain energy release rates values are not quite easy to achieve
experimentally, mainly when one look for a coherent group of values for E1, G12, GId,
GIId, GIf, it was decided to parameterize the numerical study to these variables.
Using a typical value of 0.3 kJ/m2 for strain energy release rate in mode I
delamination [23], GId, models were parameterized in the GIf/GId ratio, made either 10,
100, 500 and 1000.
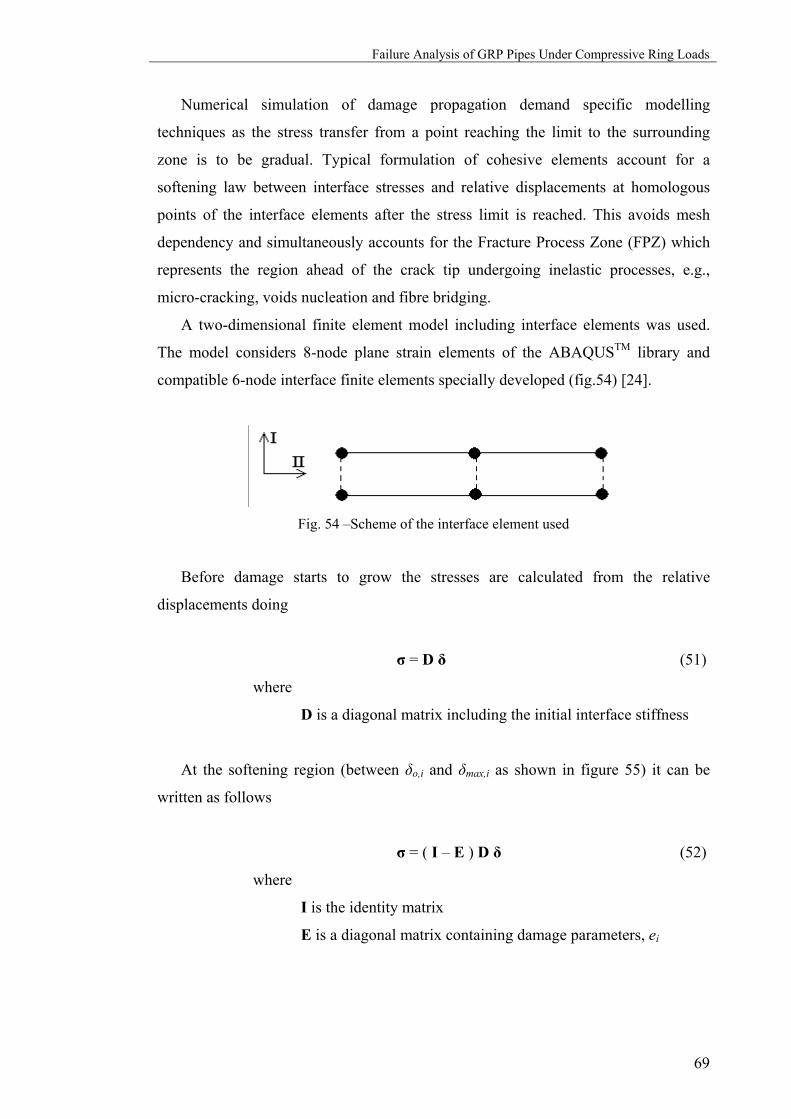
Failure Analysis of GRP Pipes Under Compressive Ring Loads
69
Numerical simulation of damage propagation demand specific modelling
techniques as the stress transfer from a point reaching the limit to the surrounding
zone is to be gradual. Typical formulation of cohesive elements account for a
softening law between interface stresses and relative displacements at homologous
points of the interface elements after the stress limit is reached. This avoids mesh
dependency and simultaneously accounts for the Fracture Process Zone (FPZ) which
represents the region ahead of the crack tip undergoing inelastic processes, e.g.,
micro-cracking, voids nucleation and fibre bridging.
A two-dimensional finite element model including interface elements was used.
The model considers 8-node plane strain elements of the ABAQUSTM library and
compatible 6-node interface finite elements specially developed (fig.54) [24].
Fig. 54 –Scheme of the interface element used
Before damage starts to grow the stresses are calculated from the relative
displacements doing
σ = D δ (51)
where
D is a diagonal matrix including the initial interface stiffness
At the softening region (between δo,i and δmax,i as shown in figure 55) it can be
written as follows
σ = ( I – E ) D δ (52)
where
I is the identity matrix
E is a diagonal matrix containing damage parameters, ei
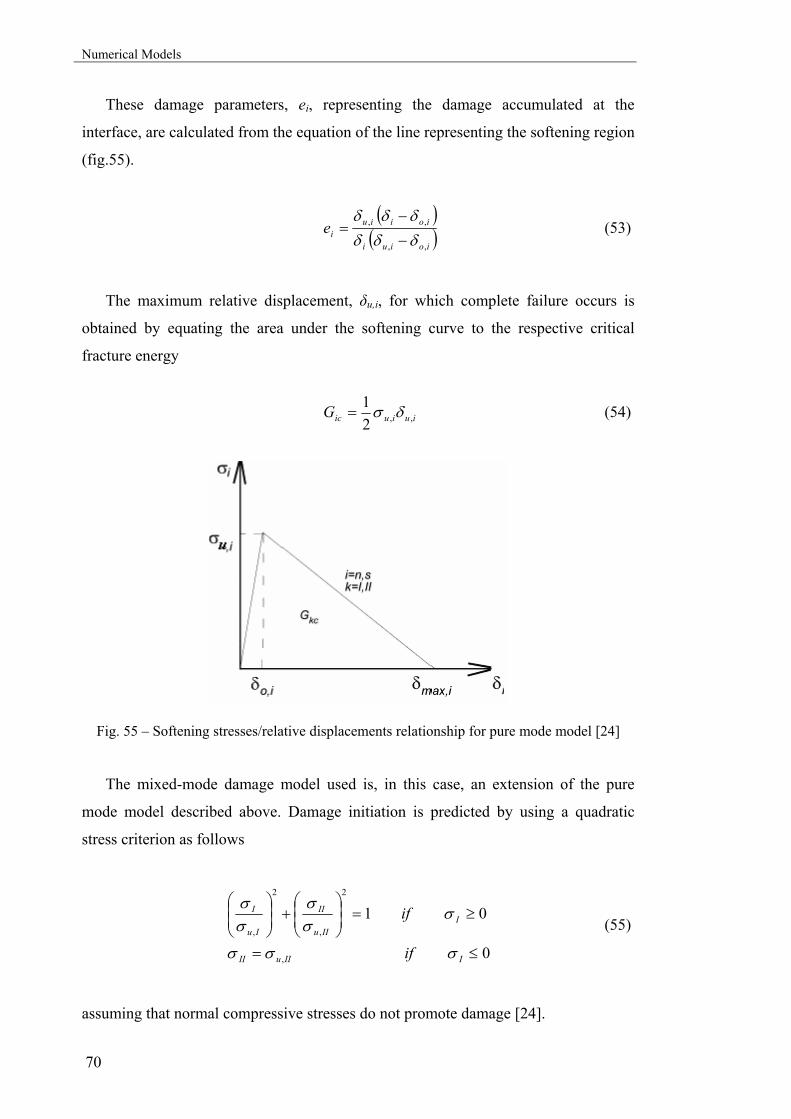
Numerical Models
70
These damage parameters, ei, representing the damage accumulated at the
interface, are calculated from the equation of the line representing the softening region
(fig.55).
( )( )ioiui
ioiiuie
,,
,,
δδδδδδ
−
−= (53)
The maximum relative displacement, δu,i, for which complete failure occurs is
obtained by equating the area under the softening curve to the respective critical
fracture energy
iuiuicG ,,21 δσ= (54)
Fig. 55 – Softening stresses/relative displacements relationship for pure mode model [24]
The mixed-mode damage model used is, in this case, an extension of the pure
mode model described above. Damage initiation is predicted by using a quadratic
stress criterion as follows
0
01
,
2
,
2
,
≤=
≥=⎟⎟⎠
⎞⎜⎜⎝
⎛+⎟
⎟⎠
⎞⎜⎜⎝
⎛
IIIuII
IIIu
II
Iu
I
if
if
σσσ
σσσ
σσ
(55)
assuming that normal compressive stresses do not promote damage [24].
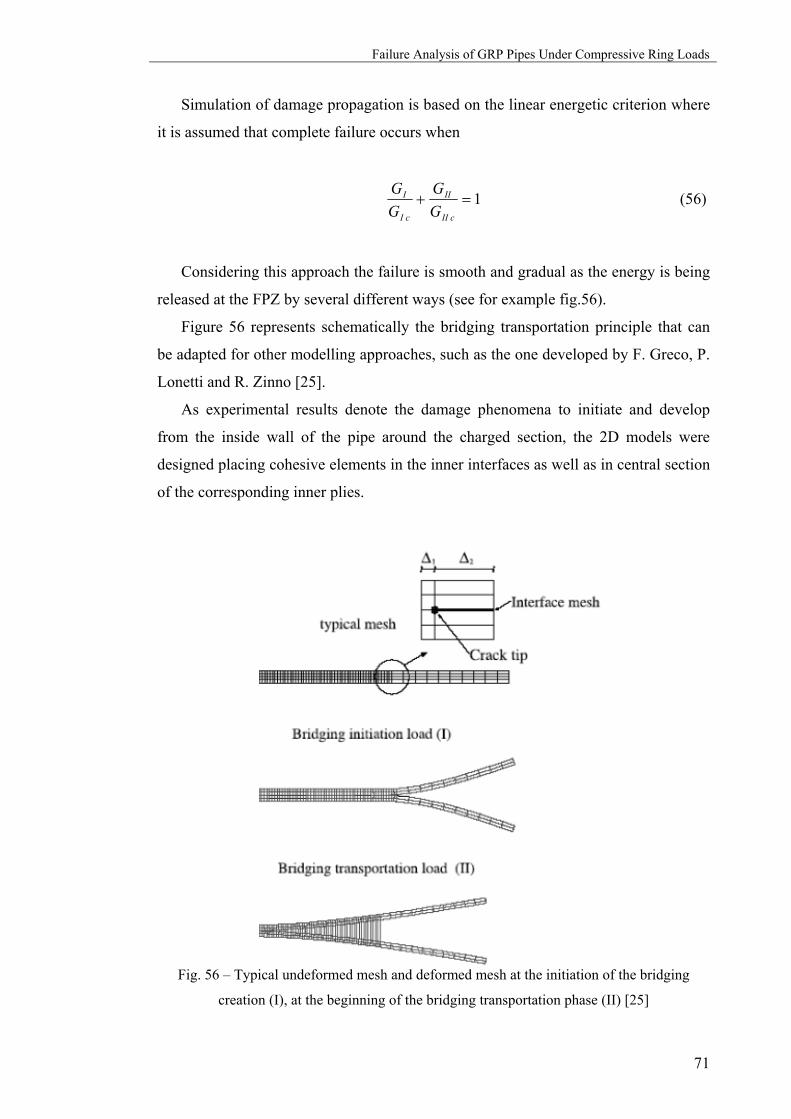
Failure Analysis of GRP Pipes Under Compressive Ring Loads
71
Simulation of damage propagation is based on the linear energetic criterion where
it is assumed that complete failure occurs when
1=+cII
II
cI
I
GG
GG (56)
Considering this approach the failure is smooth and gradual as the energy is being
released at the FPZ by several different ways (see for example fig.56).
Figure 56 represents schematically the bridging transportation principle that can
be adapted for other modelling approaches, such as the one developed by F. Greco, P.
Lonetti and R. Zinno [25].
As experimental results denote the damage phenomena to initiate and develop
from the inside wall of the pipe around the charged section, the 2D models were
designed placing cohesive elements in the inner interfaces as well as in central section
of the corresponding inner plies.
Fig. 56 – Typical undeformed mesh and deformed mesh at the initiation of the bridging
creation (I), at the beginning of the bridging transportation phase (II) [25]
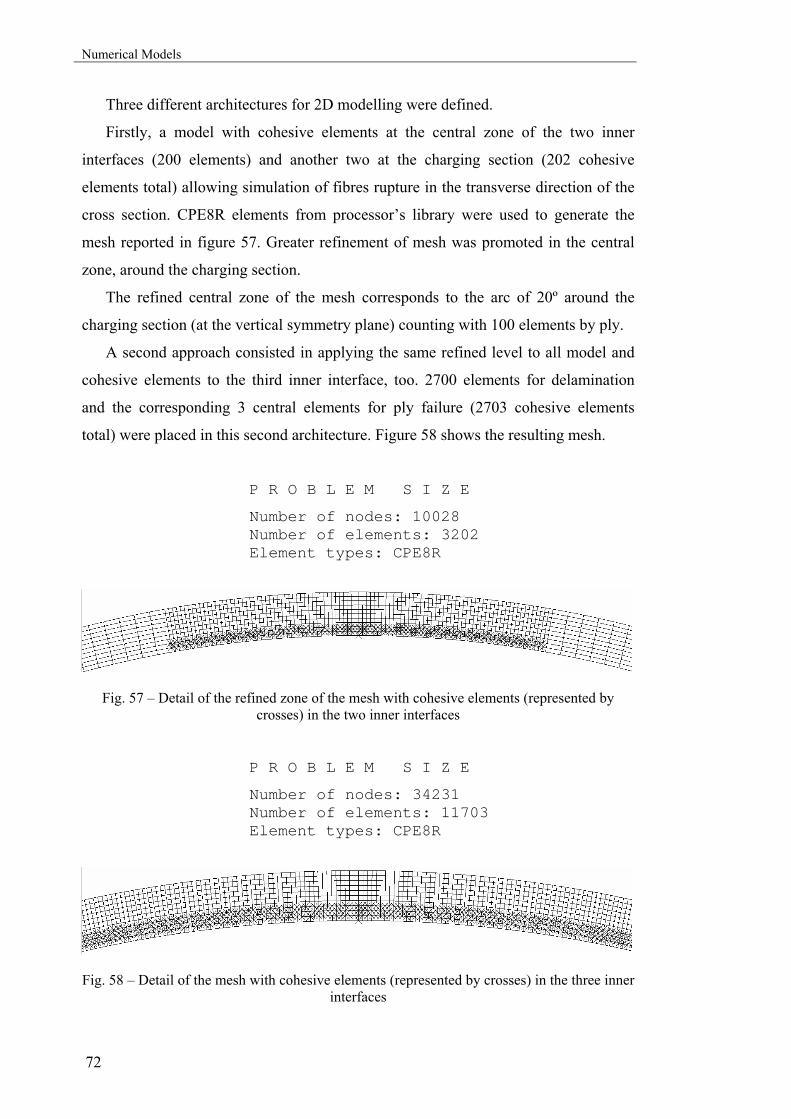
Numerical Models
72
Three different architectures for 2D modelling were defined.
Firstly, a model with cohesive elements at the central zone of the two inner
interfaces (200 elements) and another two at the charging section (202 cohesive
elements total) allowing simulation of fibres rupture in the transverse direction of the
cross section. CPE8R elements from processor’s library were used to generate the
mesh reported in figure 57. Greater refinement of mesh was promoted in the central
zone, around the charging section.
The refined central zone of the mesh corresponds to the arc of 20º around the
charging section (at the vertical symmetry plane) counting with 100 elements by ply.
A second approach consisted in applying the same refined level to all model and
cohesive elements to the third inner interface, too. 2700 elements for delamination
and the corresponding 3 central elements for ply failure (2703 cohesive elements
total) were placed in this second architecture. Figure 58 shows the resulting mesh.
P R O B L E M S I Z E
Number of nodes: 10028 Number of elements: 3202 Element types: CPE8R
Fig. 57 – Detail of the refined zone of the mesh with cohesive elements (represented by crosses) in the two inner interfaces
P R O B L E M S I Z E
Number of nodes: 34231 Number of elements: 11703 Element types: CPE8R
Fig. 58 – Detail of the mesh with cohesive elements (represented by crosses) in the three inner interfaces

Failure Analysis of GRP Pipes Under Compressive Ring Loads
73
Finally, a third configuration was designed allowing delamination in all interfaces
as well as the corresponding failure of each ply at the charging section. 8100 elements
for delamination and the corresponding 10 central elements for ply failure (8110
cohesive elements total) were introduced in this last mesh architecture. Figure 59
shows the respective mesh.
P R O B L E M S I Z E
Number of nodes: 45051 Number of elements: 17110 Element types: S8R
Fig. 59 – Detail of the mesh with cohesive elements (represented by crosses) in all interfaces
Several models, with distinct combinations of main parameters were run. Tables
9, 10 and 11 summarize those different combinations used to evaluate modelling
applicability in simulating GRP pipes mechanics under ring deflection.
* models which correspondent input algorithm files are transcript in annex
Table 9 – List of examples run with cohesive elements in two inner interfaces
Ref. σrup fibres
[MPa]
E1
[GPa] no. plies
wall
thickness
[mm]
GId
[kJ/m2]
GIId
[kJ/m2] GIf/GId
1_2 300 100 10 10 0.3 0.6 10 2_2* 300 100 10 10 0.3 0.6 100 3_2 300 100 10 10 0.3 0.6 500 4_2 300 100 10 10 0.3 0.6 1000 5_2 300 60 10 10 0.3 0.6 10 6_2 300 60 10 10 0.3 0.6 100 7_2 300 60 10 10 0.3 0.6 500 8_2 300 60 10 10 0.3 0.6 1000 9_2 400 100 10 10 0.3 0.6 10
10_2 400 100 10 10 0.3 0.6 100 11_2 400 100 10 10 0.3 0.6 500 12_2 400 100 10 10 0.3 0.6 1000 13_2 400 60 10 10 0.3 0.6 10 14_2 400 60 10 10 0.3 0.6 100 15_2 400 60 10 10 0.3 0.6 500

Numerical Models
74
16_2 400 60 10 10 0.3 0.6 1000 17_2 500 100 10 10 0.3 0.6 10 18_2 600 100 10 10 0.3 0.6 100 19_2 600 100 10 10 0.3 0.6 10 20_2 600 100 10 10 0.3 0.6 100
Table 10 – List of examples run with cohesive elements in three inner interfaces
Ref. σrup fibres
[MPa]
E1
[GPa] no. plies
wall
thickness
[mm]
GId
[kJ/m2]
GIId
[kJ/m2] GIf/GId
1_3 300 100 10 10 0.3 0.6 10 2_3* 300 100 10 10 0.3 0.6 100 3_3 300 100 10 10 0.3 0.6 500 4_3 300 100 10 10 0.3 0.6 1000 5_3 300 60 10 10 0.3 0.6 10 6_3 300 60 10 10 0.3 0.6 100 7_3 300 60 10 10 0.3 0.6 500 8_3 300 60 10 10 0.3 0.6 1000 9_3 400 100 10 10 0.3 0.6 10
10_3 400 100 10 10 0.3 0.6 100 11_3 400 100 10 10 0.3 0.6 500 12_3 400 100 10 10 0.3 0.6 1000 13_3 400 60 10 10 0.3 0.6 10 14_3 400 60 10 10 0.3 0.6 100 15_3 400 60 10 10 0.3 0.6 500 16_3 400 60 10 10 0.3 0.6 1000 17_3 500 100 10 10 0.3 0.6 10 18_3 600 100 10 10 0.3 0.6 100 19_3 600 100 10 10 0.3 0.6 10 20_3 600 100 10 10 0.3 0.6 100
Table 11 – List of examples run with cohesive elements in all interfaces
Ref. σrup fibres
[MPa]
E1
[GPa] no. plies
wall
thickness
[mm]
GId
[kJ/m2]
GIId
[kJ/m2] GIf/GId
1_all 100 10.5 10 12 0.3 0.6 10 2_all 100 10.5 10 12 0.3 0.6 100 3_all 100 10.5 10 12 0.3 0.6 500 4_all 100 10.5 10 12 0.3 0.6 1000 5_all 100 10.5 10 12 0.3 0.6 5000 6_all 200 10.5 10 12 0.3 0.6 10 7_all 200 10.5 10 12 0.3 0.6 100 8_all 200 10.5 10 12 0.3 0.6 500
9_all* 200 10.5 10 12 0.3 0.6 700 10_all 200 10.5 10 12 0.3 0.6 1000 11_all 200 100 10 10 0.3 0.6 1000
12_all* 300 10.5 10 12 0.3 0.6 10 13_all 300 10.5 10 12 0.3 0.6 100
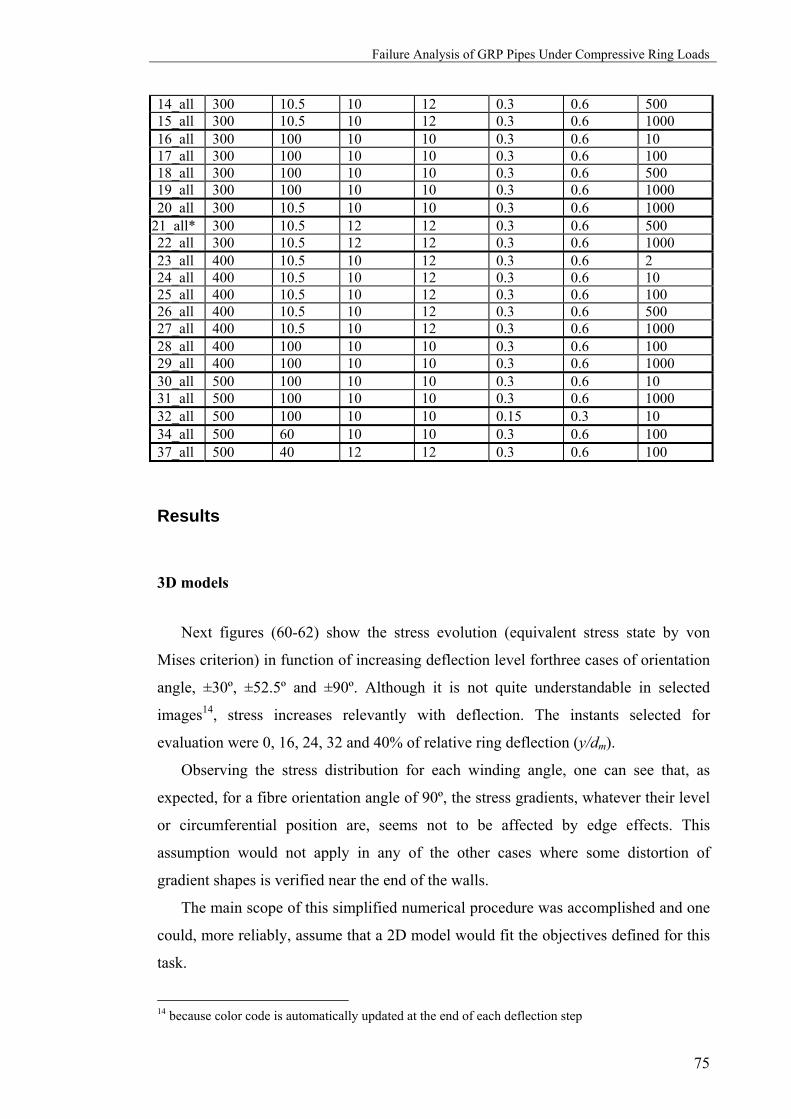
Failure Analysis of GRP Pipes Under Compressive Ring Loads
75
14_all 300 10.5 10 12 0.3 0.6 500 15_all 300 10.5 10 12 0.3 0.6 1000 16_all 300 100 10 10 0.3 0.6 10 17_all 300 100 10 10 0.3 0.6 100 18_all 300 100 10 10 0.3 0.6 500 19_all 300 100 10 10 0.3 0.6 1000 20_all 300 10.5 10 10 0.3 0.6 1000
21_all* 300 10.5 12 12 0.3 0.6 500 22_all 300 10.5 12 12 0.3 0.6 1000 23_all 400 10.5 10 12 0.3 0.6 2 24_all 400 10.5 10 12 0.3 0.6 10 25_all 400 10.5 10 12 0.3 0.6 100 26_all 400 10.5 10 12 0.3 0.6 500 27_all 400 10.5 10 12 0.3 0.6 1000 28_all 400 100 10 10 0.3 0.6 100 29_all 400 100 10 10 0.3 0.6 1000 30_all 500 100 10 10 0.3 0.6 10 31_all 500 100 10 10 0.3 0.6 1000 32_all 500 100 10 10 0.15 0.3 10 34_all 500 60 10 10 0.3 0.6 100 37_all 500 40 12 12 0.3 0.6 100
Results
3D models
Next figures (60-62) show the stress evolution (equivalent stress state by von
Mises criterion) in function of increasing deflection level forthree cases of orientation
angle, ±30º, ±52.5º and ±90º. Although it is not quite understandable in selected
images14, stress increases relevantly with deflection. The instants selected for
evaluation were 0, 16, 24, 32 and 40% of relative ring deflection (y/dm).
Observing the stress distribution for each winding angle, one can see that, as
expected, for a fibre orientation angle of 90º, the stress gradients, whatever their level
or circumferential position are, seems not to be affected by edge effects. This
assumption would not apply in any of the other cases where some distortion of
gradient shapes is verified near the end of the walls.
The main scope of this simplified numerical procedure was accomplished and one
could, more reliably, assume that a 2D model would fit the objectives defined for this
task.
14 because color code is automatically updated at the end of each deflection step

Numerical Models
76
Fig. 60 – Ring deflection sequence of example ±30º
16%
24%
40%
32%
0%
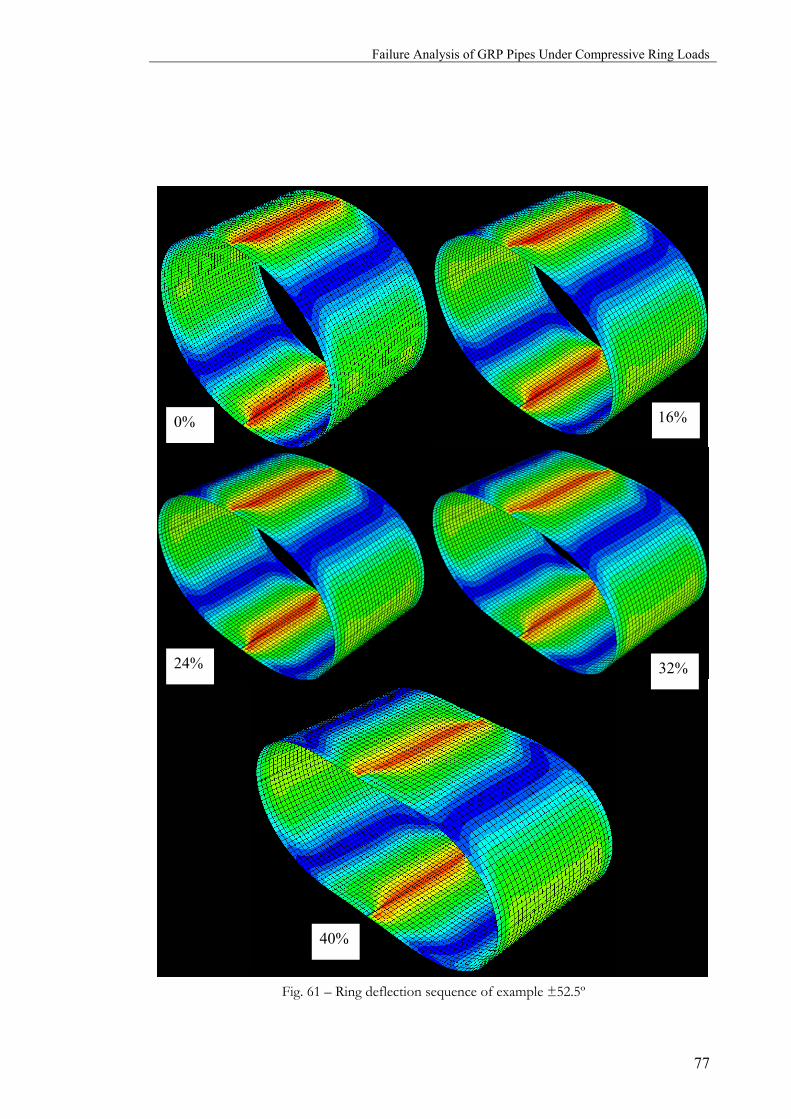
Failure Analysis of GRP Pipes Under Compressive Ring Loads
77
Fig. 61 – Ring deflection sequence of example ±52.5º
16%
24%
40%
32%
0%
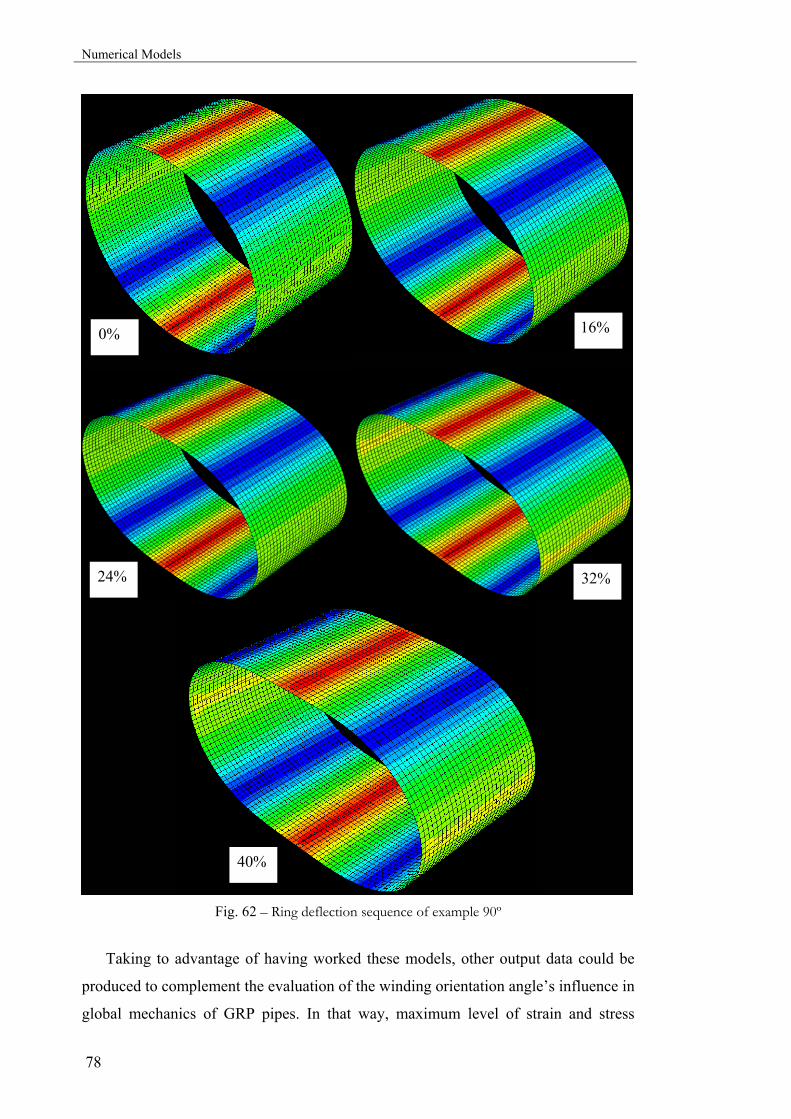
Numerical Models
78
Fig. 62 – Ring deflection sequence of example 90º
Taking to advantage of having worked these models, other output data could be
produced to complement the evaluation of the winding orientation angle’s influence in
global mechanics of GRP pipes. In that way, maximum level of strain and stress
16%
24%
40%
32%
0%
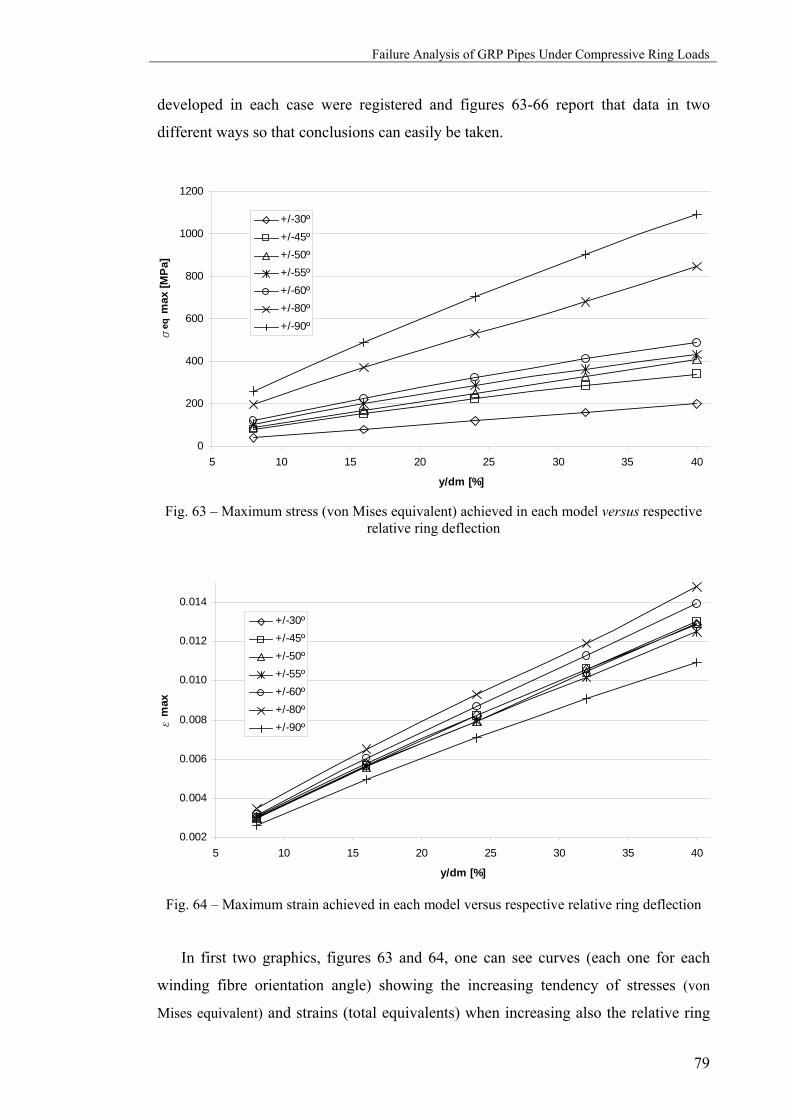
Failure Analysis of GRP Pipes Under Compressive Ring Loads
79
developed in each case were registered and figures 63-66 report that data in two
different ways so that conclusions can easily be taken.
0
200
400
600
800
1000
1200
5 10 15 20 25 30 35 40
y/dm [%]
seq
max
[MPa
]
+/-30º+/-45º+/-50º+/-55º+/-60º+/-80º+/-90º
Fig. 63 – Maximum stress (von Mises equivalent) achieved in each model versus respective
relative ring deflection
0.002
0.004
0.006
0.008
0.010
0.012
0.014
5 10 15 20 25 30 35 40
y/dm [%]
e m
ax
+/-30º+/-45º+/-50º+/-55º+/-60º+/-80º+/-90º
Fig. 64 – Maximum strain achieved in each model versus respective relative ring deflection
In first two graphics, figures 63 and 64, one can see curves (each one for each
winding fibre orientation angle) showing the increasing tendency of stresses (von
Mises equivalent) and strains (total equivalents) when increasing also the relative ring
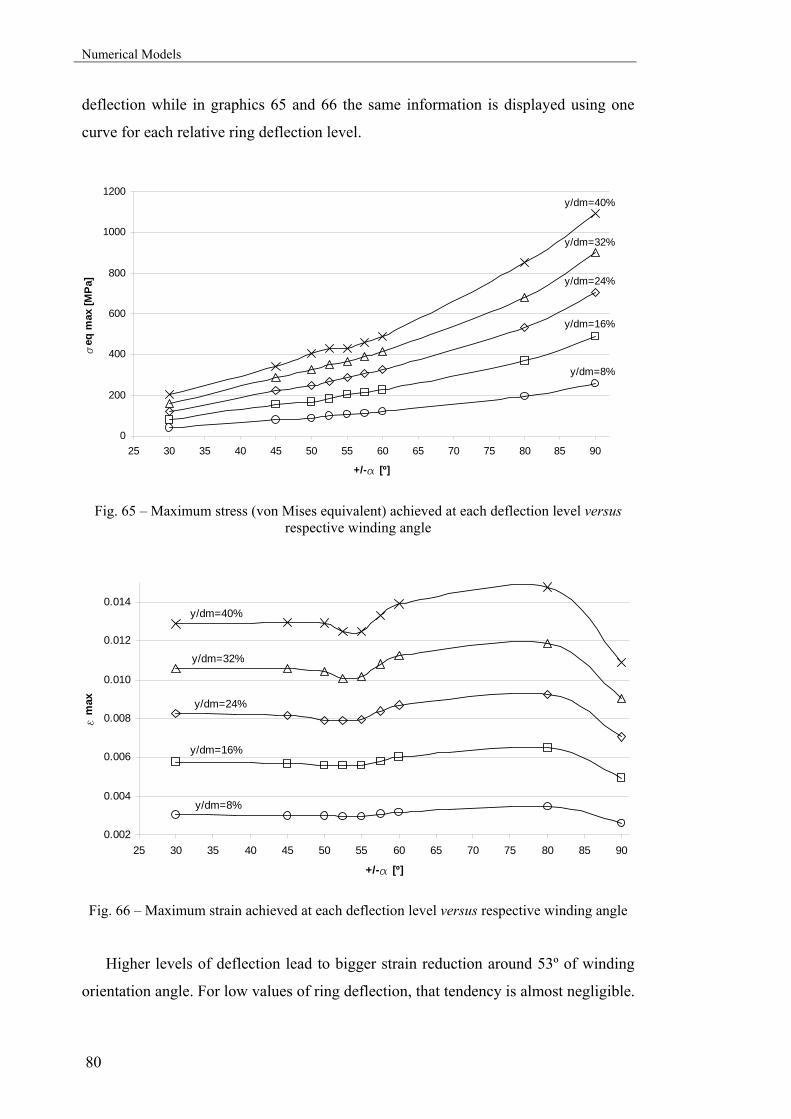
Numerical Models
80
deflection while in graphics 65 and 66 the same information is displayed using one
curve for each relative ring deflection level.
y/dm=8%
y/dm=16%
y/dm=24%
y/dm=32%
y/dm=40%
0
200
400
600
800
1000
1200
25 30 35 40 45 50 55 60 65 70 75 80 85 90
+/-a [º]
seq
max
[MPa
]
Fig. 65 – Maximum stress (von Mises equivalent) achieved at each deflection level versus respective winding angle
y/dm=8%
y/dm=16%
y/dm=24%
y/dm=32%
y/dm=40%
0.002
0.004
0.006
0.008
0.010
0.012
0.014
25 30 35 40 45 50 55 60 65 70 75 80 85 90
+/-a [º]
e m
ax
Fig. 66 – Maximum strain achieved at each deflection level versus respective winding angle
Higher levels of deflection lead to bigger strain reduction around 53º of winding
orientation angle. For low values of ring deflection, that tendency is almost negligible.
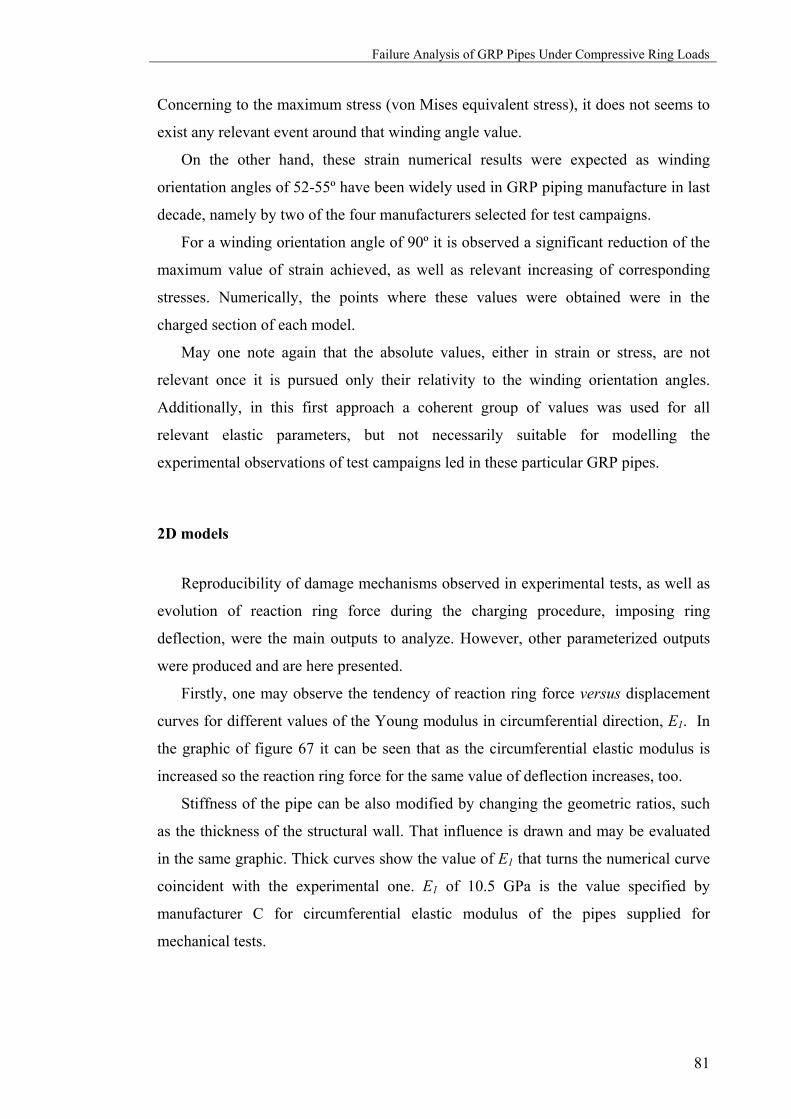
Failure Analysis of GRP Pipes Under Compressive Ring Loads
81
Concerning to the maximum stress (von Mises equivalent stress), it does not seems to
exist any relevant event around that winding angle value.
On the other hand, these strain numerical results were expected as winding
orientation angles of 52-55º have been widely used in GRP piping manufacture in last
decade, namely by two of the four manufacturers selected for test campaigns.
For a winding orientation angle of 90º it is observed a significant reduction of the
maximum value of strain achieved, as well as relevant increasing of corresponding
stresses. Numerically, the points where these values were obtained were in the
charged section of each model.
May one note again that the absolute values, either in strain or stress, are not
relevant once it is pursued only their relativity to the winding orientation angles.
Additionally, in this first approach a coherent group of values was used for all
relevant elastic parameters, but not necessarily suitable for modelling the
experimental observations of test campaigns led in these particular GRP pipes.
2D models
Reproducibility of damage mechanisms observed in experimental tests, as well as
evolution of reaction ring force during the charging procedure, imposing ring
deflection, were the main outputs to analyze. However, other parameterized outputs
were produced and are here presented.
Firstly, one may observe the tendency of reaction ring force versus displacement
curves for different values of the Young modulus in circumferential direction, E1. In
the graphic of figure 67 it can be seen that as the circumferential elastic modulus is
increased so the reaction ring force for the same value of deflection increases, too.
Stiffness of the pipe can be also modified by changing the geometric ratios, such
as the thickness of the structural wall. That influence is drawn and may be evaluated
in the same graphic. Thick curves show the value of E1 that turns the numerical curve
coincident with the experimental one. E1 of 10.5 GPa is the value specified by
manufacturer C for circumferential elastic modulus of the pipes supplied for
mechanical tests.
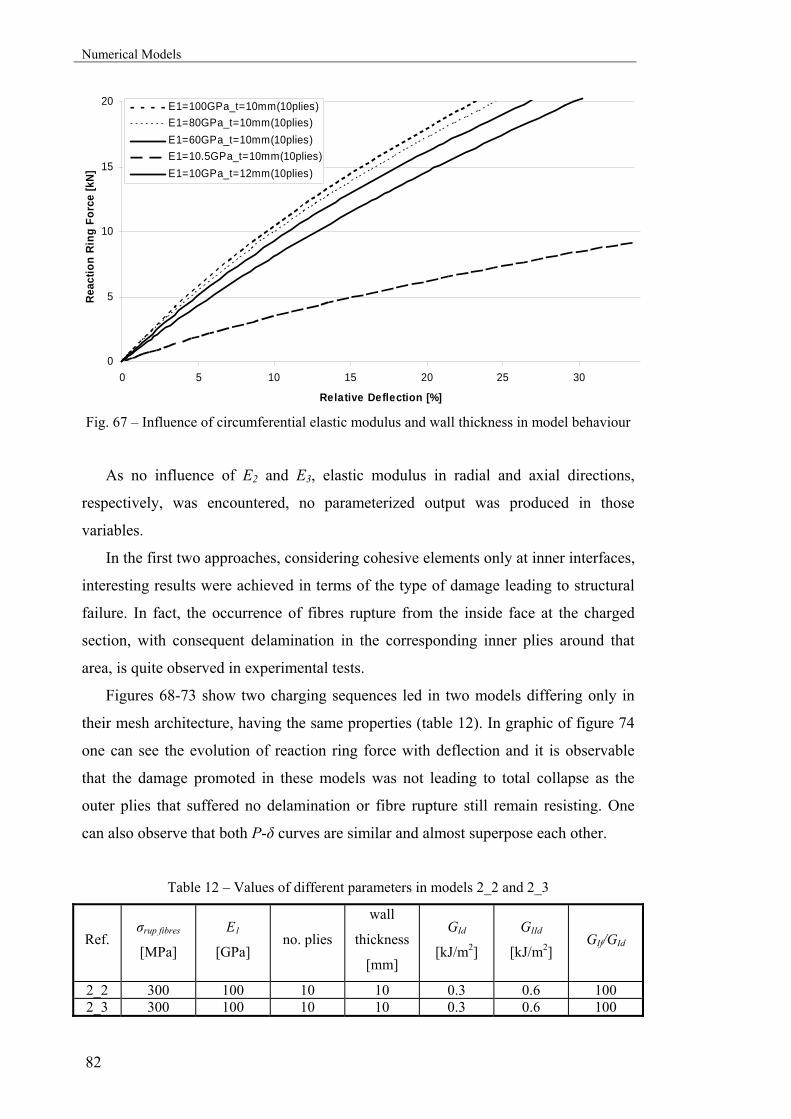
Numerical Models
82
0
5
10
15
20
0 5 10 15 20 25 30
Relative Deflection [%]
Reac
tion
Ring
For
ce [k
N]E1=100GPa_t=10mm(10plies)E1=80GPa_t=10mm(10plies)E1=60GPa_t=10mm(10plies)E1=10.5GPa_t=10mm(10plies)E1=10GPa_t=12mm(10plies)
Fig. 67 – Influence of circumferential elastic modulus and wall thickness in model behaviour
As no influence of E2 and E3, elastic modulus in radial and axial directions,
respectively, was encountered, no parameterized output was produced in those
variables.
In the first two approaches, considering cohesive elements only at inner interfaces,
interesting results were achieved in terms of the type of damage leading to structural
failure. In fact, the occurrence of fibres rupture from the inside face at the charged
section, with consequent delamination in the corresponding inner plies around that
area, is quite observed in experimental tests.
Figures 68-73 show two charging sequences led in two models differing only in
their mesh architecture, having the same properties (table 12). In graphic of figure 74
one can see the evolution of reaction ring force with deflection and it is observable
that the damage promoted in these models was not leading to total collapse as the
outer plies that suffered no delamination or fibre rupture still remain resisting. One
can also observe that both P-δ curves are similar and almost superpose each other.
Table 12 – Values of different parameters in models 2_2 and 2_3
Ref. σrup fibres
[MPa]
E1
[GPa] no. plies
wall
thickness
[mm]
GId
[kJ/m2]
GIId
[kJ/m2] GIf/GId
2_2 300 100 10 10 0.3 0.6 100 2_3 300 100 10 10 0.3 0.6 100
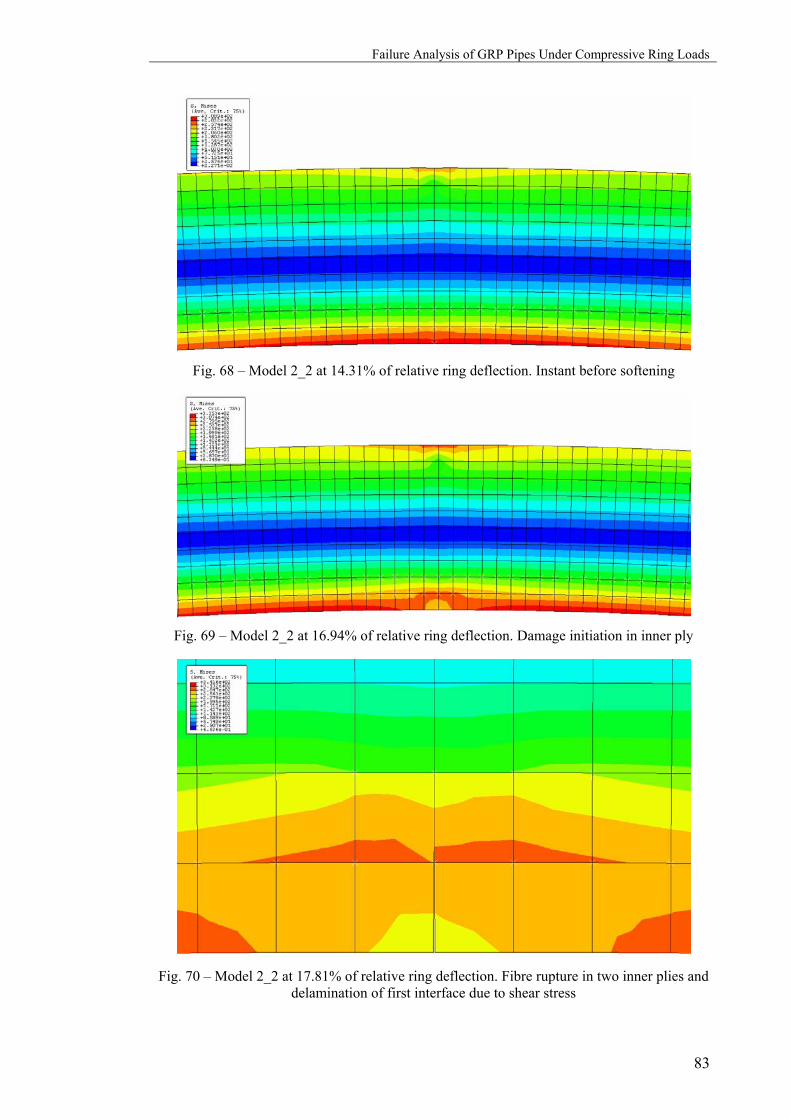
Failure Analysis of GRP Pipes Under Compressive Ring Loads
83
Fig. 68 – Model 2_2 at 14.31% of relative ring deflection. Instant before softening
Fig. 69 – Model 2_2 at 16.94% of relative ring deflection. Damage initiation in inner ply
Fig. 70 – Model 2_2 at 17.81% of relative ring deflection. Fibre rupture in two inner plies and
delamination of first interface due to shear stress
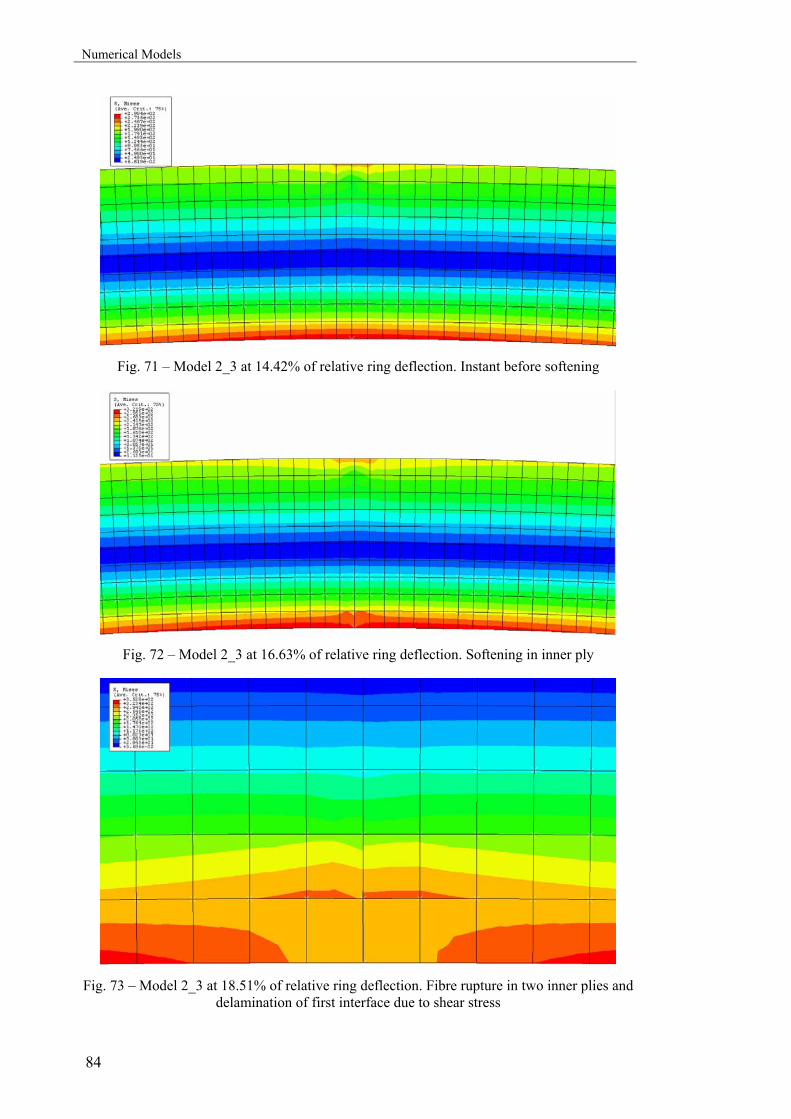
Numerical Models
84
Fig. 71 – Model 2_3 at 14.42% of relative ring deflection. Instant before softening
Fig. 72 – Model 2_3 at 16.63% of relative ring deflection. Softening in inner ply
Fig. 73 – Model 2_3 at 18.51% of relative ring deflection. Fibre rupture in two inner plies and
delamination of first interface due to shear stress
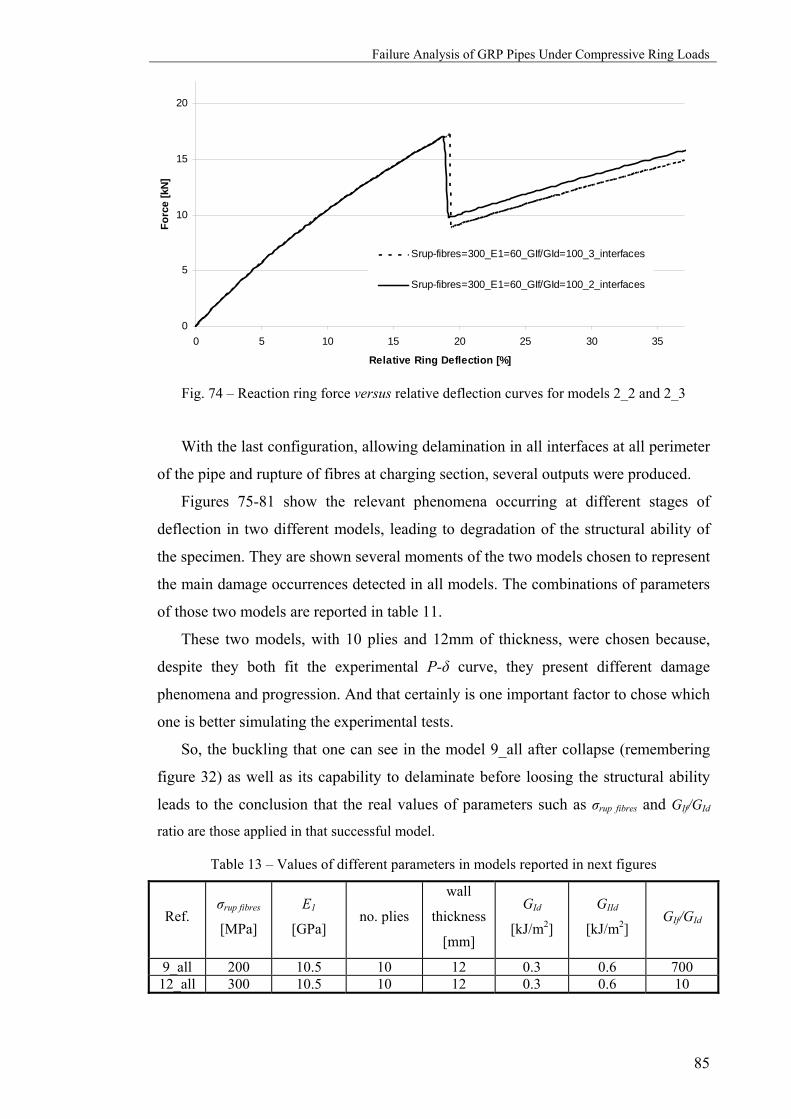
Failure Analysis of GRP Pipes Under Compressive Ring Loads
85
0
5
10
15
20
0 5 10 15 20 25 30 35
Relative Ring Deflection [%]
Forc
e [k
N]
Srup-fibres=300_E1=60_GIf/GId=100_3_interfaces
Srup-fibres=300_E1=60_GIf/GId=100_2_interfaces
Fig. 74 – Reaction ring force versus relative deflection curves for models 2_2 and 2_3
With the last configuration, allowing delamination in all interfaces at all perimeter
of the pipe and rupture of fibres at charging section, several outputs were produced.
Figures 75-81 show the relevant phenomena occurring at different stages of
deflection in two different models, leading to degradation of the structural ability of
the specimen. They are shown several moments of the two models chosen to represent
the main damage occurrences detected in all models. The combinations of parameters
of those two models are reported in table 11.
These two models, with 10 plies and 12mm of thickness, were chosen because,
despite they both fit the experimental P-δ curve, they present different damage
phenomena and progression. And that certainly is one important factor to chose which
one is better simulating the experimental tests.
So, the buckling that one can see in the model 9_all after collapse (remembering
figure 32) as well as its capability to delaminate before loosing the structural ability
leads to the conclusion that the real values of parameters such as σrup fibres and GIf/GId
ratio are those applied in that successful model.
Table 13 – Values of different parameters in models reported in next figures
Ref. σrup fibres
[MPa]
E1
[GPa] no. plies
wall
thickness
[mm]
GId
[kJ/m2]
GIId
[kJ/m2] GIf/GId
9_all 200 10.5 10 12 0.3 0.6 700 12_all 300 10.5 10 12 0.3 0.6 10

Numerical Models
86
Fig. 75 – Entire view of model 9_all at initial stage, at instant before structural collapse and immediately after structural collapse
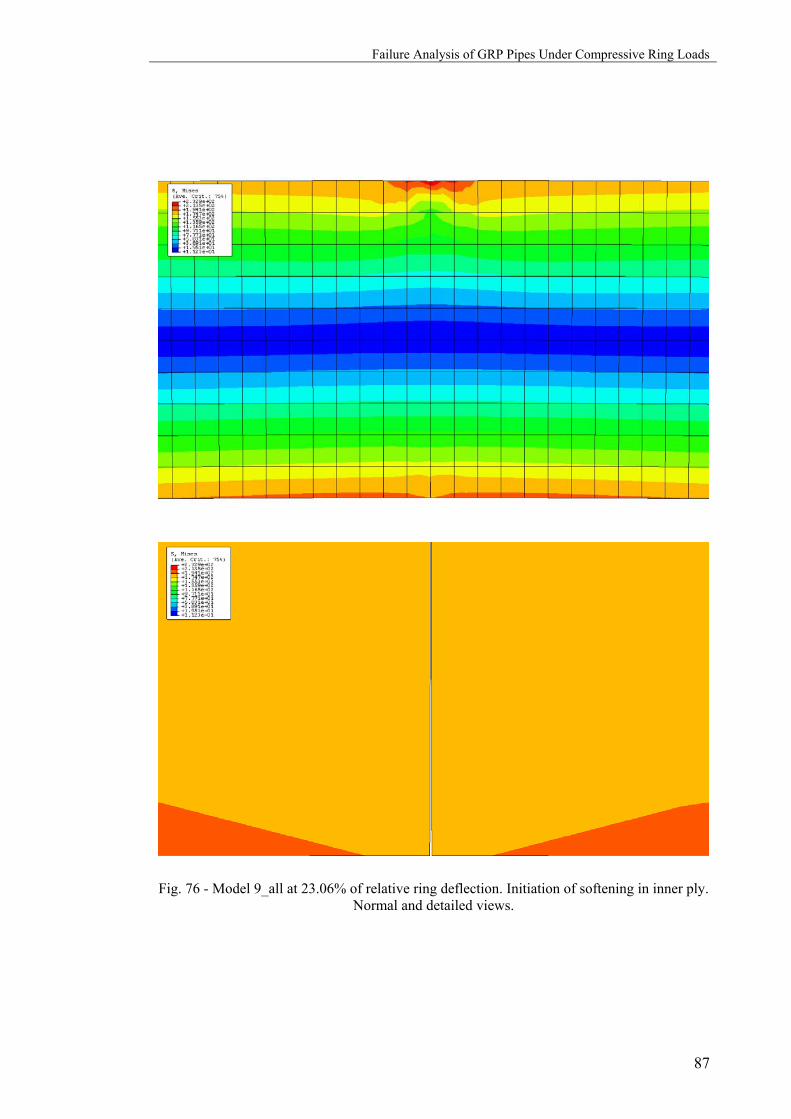
Failure Analysis of GRP Pipes Under Compressive Ring Loads
87
Fig. 76 - Model 9_all at 23.06% of relative ring deflection. Initiation of softening in inner ply. Normal and detailed views.

Numerical Models
88
Fig. 77 - Model 9_all at 35.95% of relative ring deflection. Rupture of fibres in the five inner plies and delamination by shear stress until the 4th inner interface. Normal and detailed views.
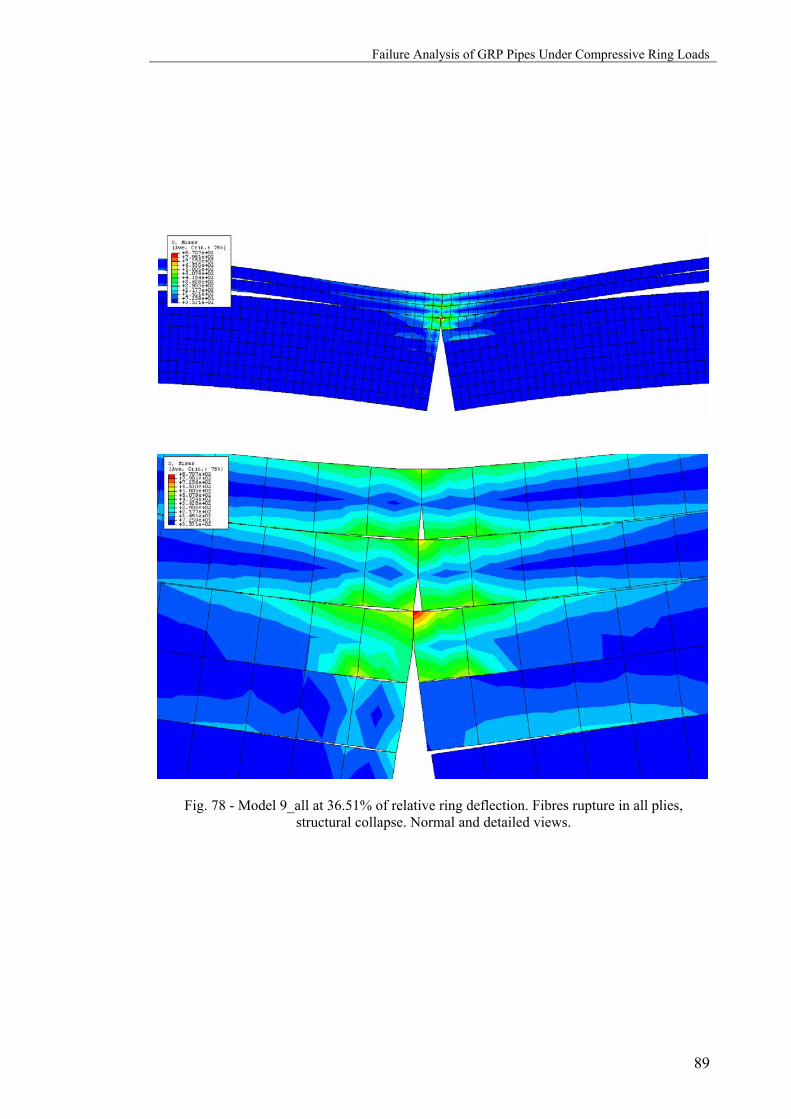
Failure Analysis of GRP Pipes Under Compressive Ring Loads
89
Fig. 78 - Model 9_all at 36.51% of relative ring deflection. Fibres rupture in all plies, structural collapse. Normal and detailed views.
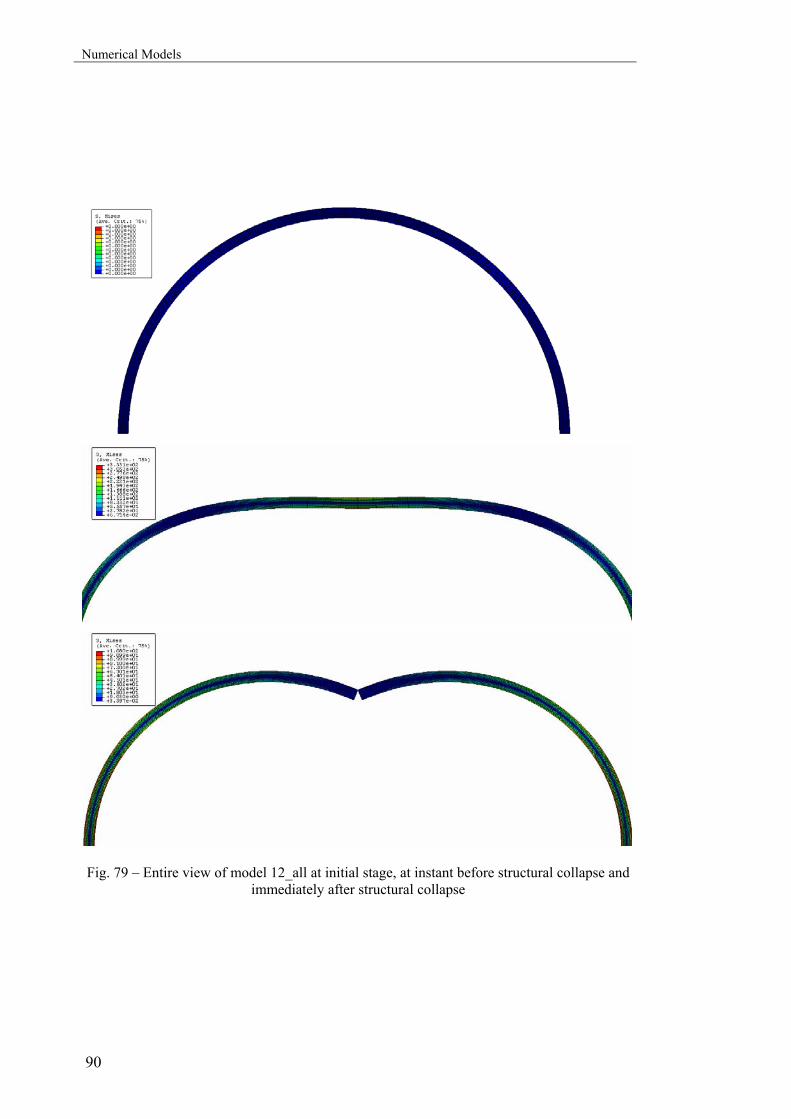
Numerical Models
90
Fig. 79 – Entire view of model 12_all at initial stage, at instant before structural collapse and immediately after structural collapse
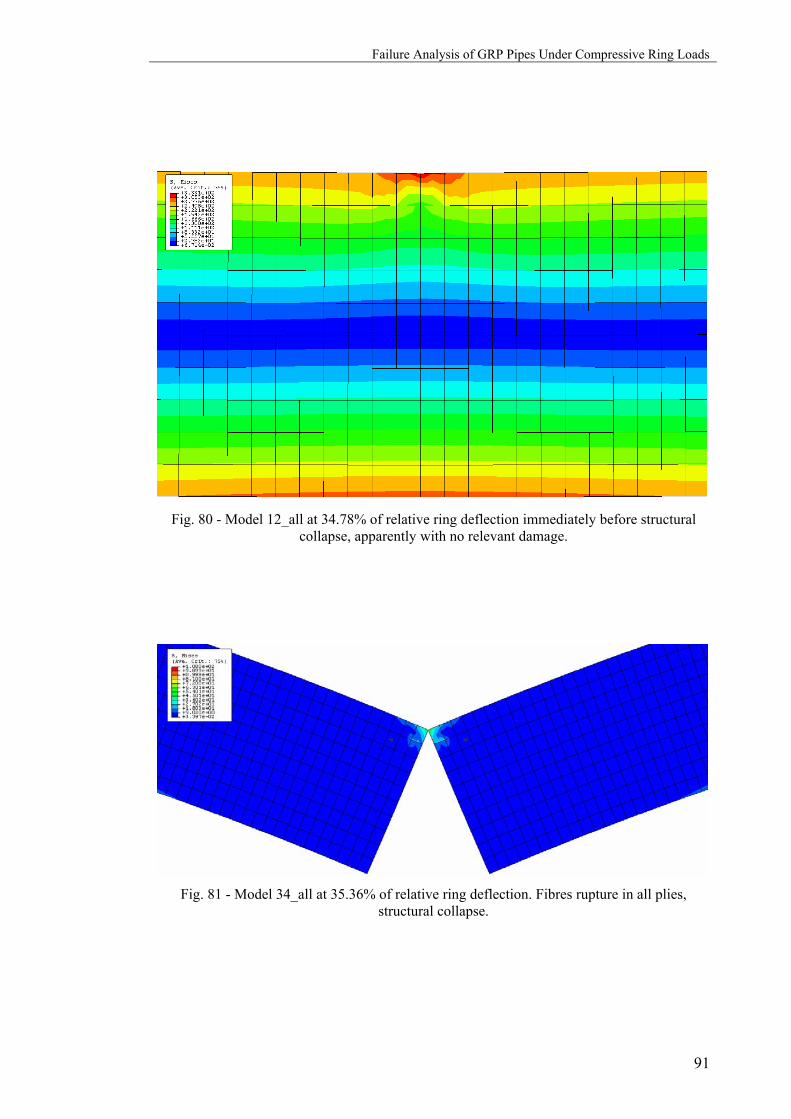
Failure Analysis of GRP Pipes Under Compressive Ring Loads
91
Fig. 80 - Model 12_all at 34.78% of relative ring deflection immediately before structural
collapse, apparently with no relevant damage.
Fig. 81 - Model 34_all at 35.36% of relative ring deflection. Fibres rupture in all plies,
structural collapse.
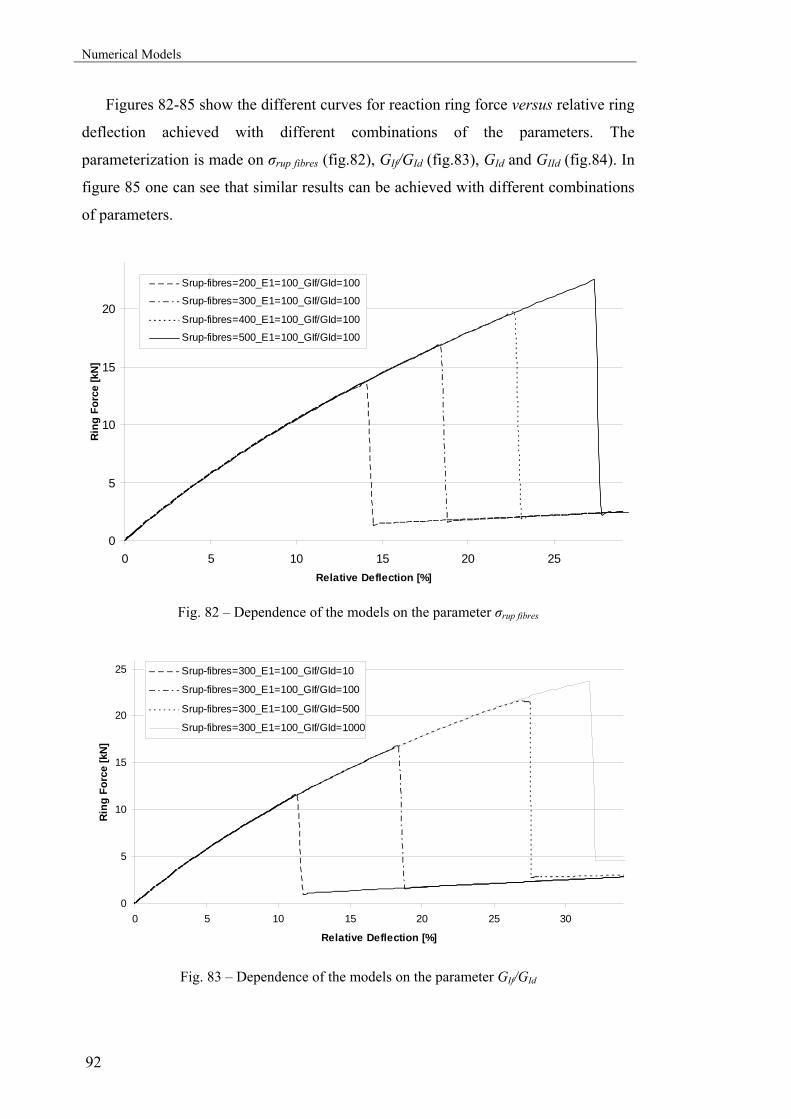
Numerical Models
92
Figures 82-85 show the different curves for reaction ring force versus relative ring
deflection achieved with different combinations of the parameters. The
parameterization is made on σrup fibres (fig.82), GIf/GId (fig.83), GId and GIId (fig.84). In
figure 85 one can see that similar results can be achieved with different combinations
of parameters.
0
5
10
15
20
0 5 10 15 20 25Relative Deflection [%]
Ring
For
ce [k
N]
Srup-fibres=200_E1=100_GIf/GId=100Srup-fibres=300_E1=100_GIf/GId=100
Srup-fibres=400_E1=100_GIf/GId=100Srup-fibres=500_E1=100_GIf/GId=100
Fig. 82 – Dependence of the models on the parameter σrup fibres
0
5
10
15
20
25
0 5 10 15 20 25 30
Relative Deflection [%]
Ring
For
ce [k
N]
Srup-fibres=300_E1=100_GIf/GId=10
Srup-fibres=300_E1=100_GIf/GId=100
Srup-fibres=300_E1=100_GIf/GId=500
Srup-fibres=300_E1=100_GIf/GId=1000
Fig. 83 – Dependence of the models on the parameter GIf/GId

Failure Analysis of GRP Pipes Under Compressive Ring Loads
93
0
5
10
15
20
0 5 10 15 20
Relative Deflection [%]
Ring
For
ce [k
N]
Srup-fibres=500_E1=100_GIf/GId=10_GId=0.3_GIId=0.6
Srup-fibres=500_E1=100_GIf/GId=10_GId=0.15_GIId=0.3
Fig. 84 – Dependence of the models on the parameters GId and GIId
0
5
10
15
20
0 5 10 15 20 25
Relative Deflection [%]
Rin
g Fo
rce
[kN
]
Srup-fibres=200_E1=100_GIf/GId=1000Srup-fibres=400_E1=100_GIf/GId=100Srup-fibres=500_E1=100_GIf/GId=10Srup-fibres=500_E1=80_GIf/GId=10
Fig. 85 – Different combinations of parameters leading to similar results
One can see superposition of curves until failure of models that differ only either
in GIf/GId ratio, σrup fibres or GId. The only parameters that seems to affect global curves
inclination are E1 (fig.67) and wall thickness t. Actually, changing parameters like
GIf/GId ratio, σrup fibres or GId is observed to alter only the collapse point (and respective

Numerical Models
94
collapse load and/or ultimate ring deflection) of that model making no difference in
terms of the initial and intermediate behaviour.
Graphics of figures 86 and 87, show the influence of GIf/GId ratio on collapse
conditions, reaction force and relative ring deflection at failure, by representing their
evolution on models differing only in that parameter. Different curves correspond to
different values of σrup fibres.
5
10
15
20
25
10 100 1000
GIf/GId
Ultim
ate
Reac
tion
Ring
For
ce [k
N]
Srup-fibres=200_E1=100_GId=0.3_GIId=0.6
Srup-fibres=300_E1=100_GId=0.3_GIId=0.6
Srup-fibres=400_E1=100_GId=0.3_GIId=0.6
Srup-fibres=500_E1=100_GId=0.3_GIId=0.6
Fig. 86 – Evolution of ultimate reaction ring force with GIf/GId ratio
5
10
15
20
25
30
10 100 1000
GIf/GId
Ultim
ate
Rela
tive
Ring
Def
lect
ion
[%]
Srup-fibres=200_E1=100_GId=0.3_GIId=0.6
Srup-fibres=300_E1=100_GId=0.3_GIId=0.6
Srup-fibres=400_E1=100_GId=0.3_GIId=0.6
Srup-fibres=500_E1=100_GId=0.3_GIId=0.6
Fig. 87 – Evolution of ultimate deflection with GIf/GId ratio

Failure Analysis of GRP Pipes Under Compressive Ring Loads
95
The increasing tendency of ultimate reaction ring force and ultimate relative ring
deflection with GIf/GId ratio that is observed fits the expectations, once it corresponds
to the necessity of spending more energy to produce rupture of fibres as the value of
GIf (strain energy release rate for rupture of fibres in mode I) increases.
Further considerations on these outputs, as well as comparison between numerical
and experimental results were made and are reported in the next section.


Failure Analysis of GRP Pipes Under Compressive Ring Loads
97
6. Analysis of Results
In this section experimental and numerical results are analyzed in terms of the
relevant conclusions they allow.
Relating to the experimental campaigns, comments shall be done on the pipe
behaviour under ring load or deflection conditions, namely concerning to the
influence of a wet environment and test duration. Differences in the global behaviour
of GRP pipes from different manufacturers and corresponding damage mechanisms,
eventually leading to structural failure, are to be analyzed.
In terms of numerical modeling, the influence of several parameters in the pipe
shape and evolution of curves of ring force versus ring deflections are the main
conclusions to be taken.
Finally, confrontation of numerical and experimental results is operated
accomplishing the main objective of evaluating the reproducibility of GRP pipes
mechanics under ring deflection condition. Therefore, the applicability of numerical
tools, such as FEM, to simulate the ring deflection condition, the damage phenomena,
by inferring coherent groups of values for relevant parameters, is analyzed.
The first idea one may confirm from the mechanical tests is the scatter in results
which denotes the difficulty in establishing a reliable prediction of the long-term
behaviour of GRP pipes once any data analysis is significantly affected by that scatter.
Even the short-term properties, namely within the static tests, show it. This reinforces
the idea of the high dependence of FRP materials properties on their manufacturing
conditions.
Initial ring stiffness, creeping in wet conditions and stress relaxation tests
outputted interesting data as the three procedures respect to different ring compression
conditions. Having not been subjected to previous preconditioning in wet conditions
(they were stored in dry air condition at room temperature) the 5 specimens from
manufacturer C showed relatively coherent properties in initial ring stiffness tests.
However, relevant scatter of results appeared when creeping in wet conditions tests
were led on 23 specimens from the manufacturer C as well. Besides that, scatter can
also be observed in data published by other two manufacturers (A and D) concerning
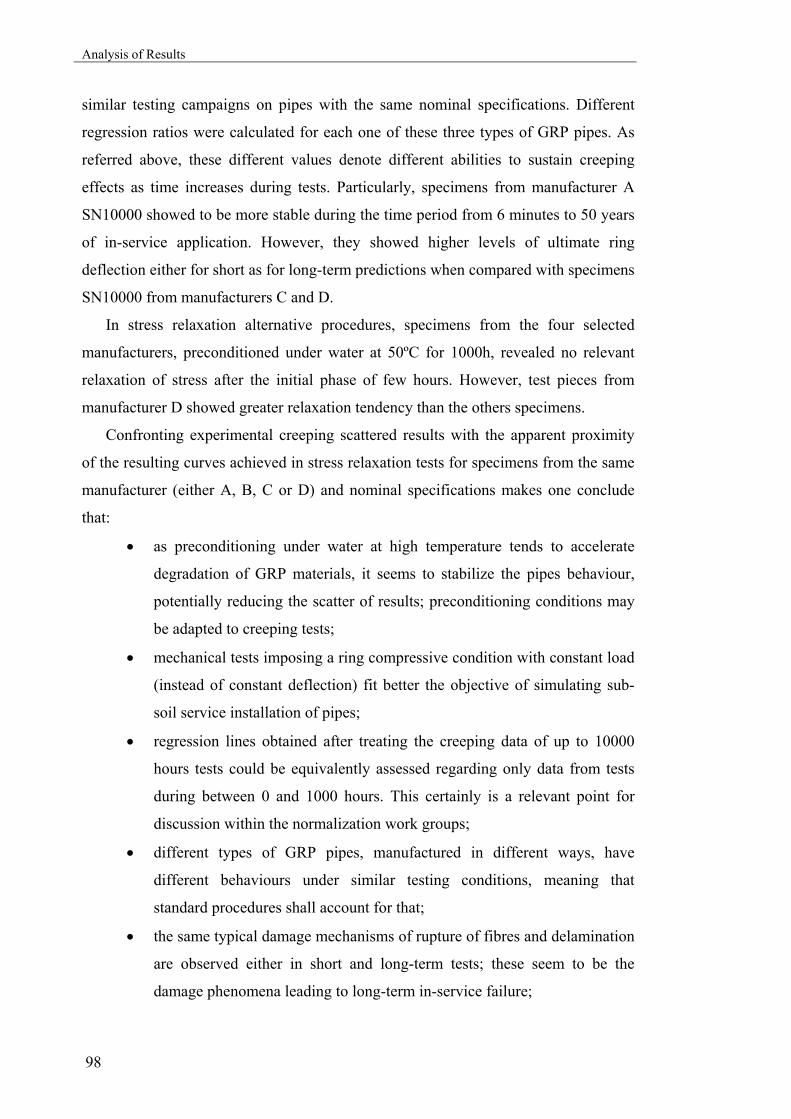
Analysis of Results
98
similar testing campaigns on pipes with the same nominal specifications. Different
regression ratios were calculated for each one of these three types of GRP pipes. As
referred above, these different values denote different abilities to sustain creeping
effects as time increases during tests. Particularly, specimens from manufacturer A
SN10000 showed to be more stable during the time period from 6 minutes to 50 years
of in-service application. However, they showed higher levels of ultimate ring
deflection either for short as for long-term predictions when compared with specimens
SN10000 from manufacturers C and D.
In stress relaxation alternative procedures, specimens from the four selected
manufacturers, preconditioned under water at 50ºC for 1000h, revealed no relevant
relaxation of stress after the initial phase of few hours. However, test pieces from
manufacturer D showed greater relaxation tendency than the others specimens.
Confronting experimental creeping scattered results with the apparent proximity
of the resulting curves achieved in stress relaxation tests for specimens from the same
manufacturer (either A, B, C or D) and nominal specifications makes one conclude
that:
• as preconditioning under water at high temperature tends to accelerate
degradation of GRP materials, it seems to stabilize the pipes behaviour,
potentially reducing the scatter of results; preconditioning conditions may
be adapted to creeping tests;
• mechanical tests imposing a ring compressive condition with constant load
(instead of constant deflection) fit better the objective of simulating sub-
soil service installation of pipes;
• regression lines obtained after treating the creeping data of up to 10000
hours tests could be equivalently assessed regarding only data from tests
during between 0 and 1000 hours. This certainly is a relevant point for
discussion within the normalization work groups;
• different types of GRP pipes, manufactured in different ways, have
different behaviours under similar testing conditions, meaning that
standard procedures shall account for that;
• the same typical damage mechanisms of rupture of fibres and delamination
are observed either in short and long-term tests; these seem to be the
damage phenomena leading to long-term in-service failure;
Failure Analysis of GRP Pipes Under Compressive Ring Loads
99
• experimental observations showed that delamination is dominated by
mode I and/or mode II, while transverse rupture of plies (transversally to
the direction of fibres) occur mostly in mode I.
Introducing changes in actual standards to reduce tests duration will require strong
and reliable regression methods accounting the scatter in data. This turns especially
important when considering the reduction of tested specimens that is another objective
of piping industries.
Generally, the numerical models run, either the 3D or the 2D approaches,
outputted their tendencies and dependencies on several variables on which results
were parameterized.
The 3D models showed that winding angles of around 53º and 90º minimize the
value of maximum strain achieved at the charging section. It was seen that for this
loading configuration of diametrically opposed charged sections a winding orientation
angle of 90º is the best possibility, as far as no relevant solicitation occur in the
longitudinal direction of the pipe. Actually, the use of winding orientation angles of
90º is being an increasing tendency in GRP piping manufacture.
Within the reverse engineering process of sharpening parameters value to obtain
numerical results fitting reasonably the experimental curves one could assess the main
tendencies depending on those parameters:
• the inclination of the reaction ring force versus relative ring deflection
curves is controlled either by E1 (circumferential elastic modulus) and/or
wall thickness;
• the failure point of each model moves forward on that tendency curve
when either GIf/GId ratio and/or σrup fibres;
• values of GId and/or GIId have no visible effect.
One may observe, additionally, that the different behaviour of models having
cohesive elements in the two inner interfaces only at a limited zone around charged
section or in three inner interfaces in all perimeter denote the existence of relevant
softening phenomena in sided regions of the pipe wall.
Numerical modelling of GRP pipes subjected to a ring deflection condition using
FEM tools showed to be an interesting way of simulating these structures.
Additionally, the simplicity of the mesh design makes this a potential method to be
Analysis of Results
100
included in future developments promoted by piping industries or standardization
committees.
Comparison of experimental and numerical data is mainly done in two specific
ways: similarity of the damage mechanisms developed in the two procedures and the
proximity of values achieved for stiffness, ultimate ring deflection and ultimate ring
load.
Concerning to the damage phenomena leading to structural failure, the same
mechanisms are developed either in experimental tests and numerical modelling.
Rupture of fibres and delamination are the relevant occurrences.
Qualitatively, the mechanics of the GRP pipe seems reproducible.
Specimens of manufacturer C were expected to have, according to the
manufacturers specifications a specific ring stiffness of
( )2
3
44
3 /4641051125.0
64500.05225.065.10
mNE
dIES
m
=
−××
==
π
(57)
and, with the values used for circumferential apparent modulus (fitting the
experimental curves) and the wall thickness (experimentally measured), the specific
ring stiffness came
( )2
3
44
3 /49507512.0
64500.0524.065.10
mNE
dIES
m
=
−××
==
π
. (58)
This very good proximity between manufacturer’s information and the values
achieved by integrating our own experimental measurements in the numerical models
certainly is a good sign to the numerical approach and methodology worked out in
this thesis programme. This good correlation makes one think that the 2D modelling
methodology (mesh and geometry design) is acceptable and so it allows the study of
the influence of other relevant parameters (GIf/GId ratio, E2, E3, σrup fibres) as the model
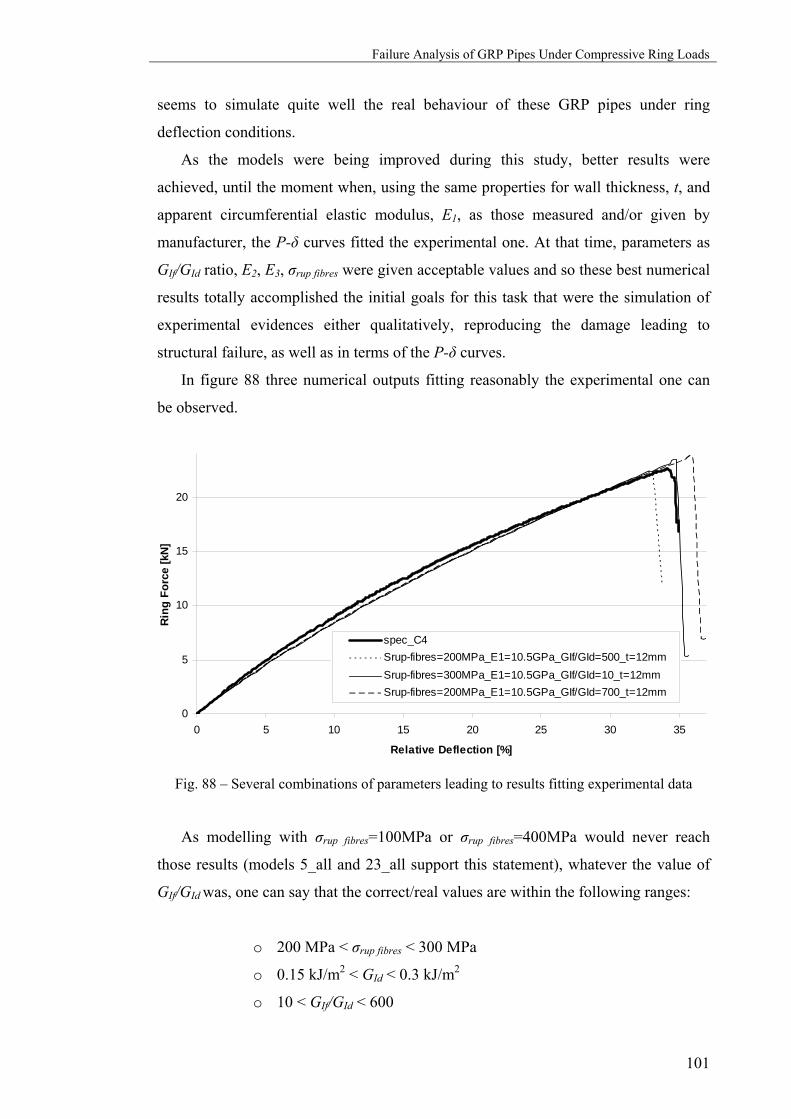
Failure Analysis of GRP Pipes Under Compressive Ring Loads
101
seems to simulate quite well the real behaviour of these GRP pipes under ring
deflection conditions.
As the models were being improved during this study, better results were
achieved, until the moment when, using the same properties for wall thickness, t, and
apparent circumferential elastic modulus, E1, as those measured and/or given by
manufacturer, the P-δ curves fitted the experimental one. At that time, parameters as
GIf/GId ratio, E2, E3, σrup fibres were given acceptable values and so these best numerical
results totally accomplished the initial goals for this task that were the simulation of
experimental evidences either qualitatively, reproducing the damage leading to
structural failure, as well as in terms of the P-δ curves.
In figure 88 three numerical outputs fitting reasonably the experimental one can
be observed.
0
5
10
15
20
0 5 10 15 20 25 30 35
Relative Deflection [%]
Ring
For
ce [k
N]
spec_C4Srup-fibres=200MPa_E1=10.5GPa_GIf/GId=500_t=12mmSrup-fibres=300MPa_E1=10.5GPa_GIf/GId=10_t=12mmSrup-fibres=200MPa_E1=10.5GPa_GIf/GId=700_t=12mm
Fig. 88 – Several combinations of parameters leading to results fitting experimental data
As modelling with σrup fibres=100MPa or σrup fibres=400MPa would never reach
those results (models 5_all and 23_all support this statement), whatever the value of
GIf/GId was, one can say that the correct/real values are within the following ranges:
o 200 MPa < σrup fibres < 300 MPa
o 0.15 kJ/m2 < GId < 0.3 kJ/m2
o 10 < GIf/GId < 600
Analysis of Results
102
Ratios like GIId/GId=0.5 are quite well accepted, specially when studying problems
with nonlinearities [26,27].
According to some authors, and since the exact GId and GIId critical values for the
selected glass/epoxy system are not known, predictions shall be made using typical
values of GId =0.2 kJ/m2 and GIId =1.5 kJ/m2[23].
As no coherent groups of values of GId, GIId and GIf for one same composite
system were found, even when searching for publications on carbon fibre reinforced
plastics (CFRP), one can not assure the reasonability of the values presented for
GIf/GId ratio.
However, the values within the range of 3kJ/m2 to 180kJ/m2 presented for strain
energy release rate in mode I for rupture of fibres, GIf, may be analyzed in a simple
exercise as follows (let’s remember the principle schematized in figure 55):
Assuming, for instance,
• σrup fibres= 300 MPa,
• ε=0.048 (elongation of glass fibre, type E, at total collapse) [28],
• L=0.5mm (thickness of the crack field under analysis, arbitred15)
• δu= ε × L ≈2.4E-5m
the equation 56 shows how can one get an idea of the greatness of the value of GIf
2/6.32
54.263002
mkJEEG ufibresrupIf =
−×=
×≡
δσ (59)
and it confirms once more that, depending on the value of the strain of the fibre (and
even more of the composite ply) at total collapse, the range of values presented in this
work are very acceptable.
15 this value was achieved by experimental observations of the wall section of man. C specimens

Failure Analysis of GRP Pipes Under Compressive Ring Loads
103
7. Conclusion
By the end of this study several conclusions could be made as experimental and
numerical outputs were produced. The main objectives of testing GRP pipes under
compressive ring conditions using different loading configurations, conduct standard
and alternative testing procedures and evaluate the numerical reproducibility of
damage phenomena and global mechanics of the pipe were accomplished.
The comparison of some of the experimental data outputted from the testing
campaigns conducted here with results published by foreign manufacturers relating to
similar campaigns, made the global analysis of GRP pipes behaviour more complete
and profitable.
In another way, supporting numerical procedures in experimental results achieved,
in a typical reverse engineering process, allowed understanding and choosing the
main variables to parameterize the study on.
Globally, the study on the behaviour of GRP pipes under compressive ring loads,
which is one of the most used in-service loading conditions, was led in three ways.
The experimental program intended to evaluate the influence of ageing conditions by
preconditioning test tubes in specific conditions and the interest of applying either
loading or deflection conditions. The development of numerical models had the main
scopes of reproduce damage mechanisms and main static behaviour of the selected
pipes. Confrontation of numerical and experimental results was made iteratively so
that numerical modeling fitted gradually the experimental observations and so it could
be validated.
The relevant evidences and conclusions taken during this work are analyzed in the
previous section, by criticizing the experimental and numerical results as well as by
comparing them up to conclude for the global validaton of the procedures conducted.
As outputted data was analyzed, it is expectable that this study may support future
investigations on this matter, mainly considering the GRP piping industries demands
on lighter standard procedures for certification of products. In this particular area,
work is already being done by technical committees of CEN as well as by the leading
manufacturers of GRP piping systems


Failure Analysis of GRP Pipes Under Compressive Ring Loads
105
8. References
References
[1] – Morgan, R; Dunn, C; Edwards, C; Gap Analysis for Durability of Fiber Reinforced Polymer Composites in Civil Infrastructure – Effects of creep and relaxation (Chap 6), CERF-ASCE, 2001
[2] – Composite Engineering Materials: Guide to Composites, SP systems, 1999 [3] – M. F. S. F. de Moura; J. P. M. Gonçalves; A. T. Marques; P. M. S. T. de Castro;
Prediction of Compressive Strength of Carbon-Epoxy Laminates Containing Delamination by Using a Mixed-Mode Damage Model, Composite Structures, Vol. 50, Nº2, pg. 151-157, 2000
[4] – J. P. M. Gonçalves; M. F. S. F. de Moura; P. M. S. T. de Castro; A. T. Marques; Interface Element Including Point-to-Surface Constraints for Three-Dimensional Problems With Damage Propagation, Engineering Computations: International Journal for Computer-Aided Engineering and Software, Vol. 17, Nº1, pg. 28-47, 2000
[5] – M. F. S. F. de Moura; J. P. M. Gonçalves; A. T. Marques; P. M. S. Tavares de Castro; Modeling Compression Failure After Low Velocity Impact on Laminated Composites Using Interface Elements, Journal of Composite Materials, Vol. 31, Nº 15, pg. 1462-1479, 1997
[6] – Reeder, James R.; Prediction of Long-Term Strength of Thermoplastic Composites Using Time-Temperature Superposition, NASA-Langley Research Center, Hampton, Virginia, 2002
[7] – Camanho, P; Guedes, R M; Notas de apoio à disciplina de materiais compósitos, Curso de mestrado em engenharia mecânica, FEUP-DEMEGI, 2001
[8] – Bai, Jinbo; Mechanical behavior of ±55º filament-wound glass-fibre/epoxy-resin tubes (I, II, III), Composites Science and Technology 57 (141-153), 1997
[9] – Richard, F; Identification du comportement et evaluation de la fiabilité des composites stratifies, thèse nº 769, Université de Franche-Comté, 1999
[10] – Marques, A.T.; de Brito, F.M.; Comparison of methodologies for prediction of long-term properties of GRP pipes, K L Reifsnider, D Dillard, A Cardon, eds., 'Progress in Durability Analysis of Composite Systems; proceedings of the 3rd int conference on the subject DURACOSYS 97’, Blacksburg, VA, USA, 14-17 Sept 1997; A A Balkema, 1998, pp.289-294
[11] – Chouchaoui, C S; Ochoa, O O; Similitude study for a laminated cylindrical tube under tensile, torsion, bending, internal and external pressure.(Part I, PartII), Composite Structures 44 (221-229), 1999
[12] – Parnas, Levend; Katrici, Nuran; Design of fiber-reinforced composite pressure vessels under various loading conditions, Composite Structures, 2002
[13] – Ghorbel, J; Spiteri, P; Durability of closed-end pressurized GRP pipes under hygrothermal conditions (Part I and Part II), Journal of Composite Materials, vol 30 nº14 (1562-1595), 1996
[14] – Ferry, L; Perreux, D; Varchon, D; Le Bras, L; Tensile failure of filament wound pipes under long-term creep loading: a probabilistic analysis, Composites Science and Technology 57 (1281-1288), 1997
[15] – Toutanji, H; Dempsey, S; Stress modeling of pipelines strengthened with advanced composites materials, Thin-Walled Structures 39 (153-165), 2001
[16] – Tarakçioglu, N; Akdemir, A; Avci, A; Strength of filament wound pipes with surface crack, Composites: Part B 32 (131-138), 2001
References
106
[17] – Marques, A. T.; Brito, F. M.; Comparison of methodologies for prediction of long-term properties of GRP pipes, Third International Conference on Progress in Durability Analysis of Composite Systems, 1997
[18] – EN 705, CEN, 1994 [19] – EN 1225, CEN, 1995 [20] – EN 1226, CEN, 1995 [21] – EN 1227, CEN, 1997 [22] – EN 1228, CEN, 1997 [23] – Kashtalyan, M Yu; Soutis, C; Strain energy release rate for off-axis ply cracking in
laminated composites, International Journal of Fracture, no.112, pp L3-L8, 2001 [24] – de Moura, M.F.S.F.; Gonçalves, J.P.M.; Modelling the interaction between matrix
cracking and delamination in carbon-epoxy laminates under low velocity impact; Composites Science and Technology 64, pp 1021-1027, 2004
[25] – Greco, F; Lonetti, P; Zinno, R; An analytical delamination model for laminated plates including bridging effects, International Journal of Solids and Structures 39, pp 2435-2463, 2002
[26] – Morais, A B; Analysis of mode II interlaminar fracture of multidirectional laminates, Composites: Part A, no.35, pp 51-57, 2004
[27] – Buchholz, F G; Rikards, R;; Wang, H; Computational analysis of interlaminar fracture of laminated composites, International Journal of Fracture, no.86, pp 37-57, 1997
[28] – MatWeb, Material Property Data - www.matls.com
Consulted Bibliography [29] – Richard, F; Perreux, D; The safety-factor calibration of laminates for long-term
applications: behaviour model and reliability method, Composites Science and Technology 61 (2087-2094), 2001
[30] – Richard, F; Perreux, D; A reliability method for optimization of [+φ,- φ] fiber reinforced composite pipes, Reliability Engineering & System Safety 68 (53-59), 2000
[31] – Rousseau, J; Perreux, D; The influence of winding patterns on the damage behavior of filament-wound pipes; Composites Science and Technology 59 (1439-1449), 1999
[32] – Kaynak, C; Mat, O; Uniaxial fatigue behavior of filament-wound glass-fiber/epoxy composite tubes, Composites Science and Technology 61 (1833-1840), 2001
[33] – Xia, M; Takayanagi, H; Analysis of transverse loading for laminated cylindrical pipes, Composite Structures 53 (279-285), 2001
[34] – Perreux, D; Joseph, E; The effect of frequency on the fatigue performance of filament-wound pipes under biaxial loading: experimental results and damage model, Composites Science and Technology 57 (353-364), 1997
[35] – Xia, M; Takayanagi, H; Analysis of multi-layered filament-wound composite pipes
under internal pressure, Composite Structures 53 (483-491), 2001 [36] – Jacquemin, F; Vautrin, A; The effect of cyclic hygrothermal conditions on the stresses
near the surface of a thick composite pipe, Composites Science and Technology 62 (567-570), 2002
[37] – Nishizaki, I; Meiarashi, S; Long-term deterioration of GFRP in water and moist environment, Journal of Composites for Construction, February 2002
[38] – Liao, K; Tan, Y; Influence of moisture-induced stress on in situ fiber strength degradation of unidirectional polymer composite, Composites Part B 32 (265-370), 2001
[39] – Perreux, D; Suri, C; A study of the coupling between the phenomena of water absorption and damage in glass/epoxy composite pipes, Composites Science and Technology 57 (1403-1413), 1997
Failure Analysis of GRP Pipes Under Compressive Ring Loads
107
[40] – Perreux, D; Choqueuse, D; Anomalies in moisture absorption of glass fibre reinforced epoxy tubes, Composites Part A 33 (147-154), 2002
[41] – Guedes, R. M.; Long-term behaviour predictions polymeric matrix composite materials, Modelling of sandwich structures and adhesive bonded joints, FEUP
[42] – Young, Warren C.; Roark’s Formulas for stress and strain, 6th edition, McGraw Hill, 1988
[43] – Janson, L.; Plastics pipes for water supply and sewage disposal; Borealis, 3rd ed., Stockholm, 1999
[44] – Sims, Graham; Bishop, Gordon; UK Polymer Composites Systems – Foresight Study and Competitive Analysis, Crown, 2001
[45] – Kim, C W; Hwang, W; Park H C; Han, K S ; Stacking sequence optimization of laminated plates, Composite Structures vol.39, pp 283-288, 1997
[46] – Zhang Y; Wang, S; Petersson B; Large deflection analysis of composite laminates, Journal of Materials Processing Technology, no.138, pp 34-40, 2003
[47] – Lee, C S; Hwang, W.; Park H.C.; Han, K.S.; Failure of carbon/epoxy composite tubes under combined axial and torsional loading. 1. Experimental results and predicion of biaxial strength by the use of neural networks, Composites Science and Technology, no.59, pp 1779-1788, 1999
[48] – Binienda, W K; Robinson, D N; Ruggles, M B; Creep of polymer matrix composites. II: Monkman-Grant failure relationship for transverse isotropy, Journal of Engineering Mechanics, vol.129, no.3, pp 310-315, 2003
[49] – Lee, C S; Hwang, W.; Park H.C.; Han, K.S.; Failure of carbon/epoxy composite tubes under combined axial and torsional loading. 2. Morphology and failure mechanism, Composites Science and Technology, no.59, pp 1789-1804, 1999
[50] – Kashtalyan, M Yu; Soutis, C; Mechanisms of internal damage and their effect on the behaviour and propertie of cross-ply composite laminates, International Applied Mechanics, vol.38, no.6, pp 641-657, 2002
[51] – Kashtalyan, M Yu; Soutis, C; The effect of delaminations induced by transverse cracks and splits on stiffness properties of composite laminates, Composites: Part A, no.31, pp 107-119, 2000
[52] – Carreira, R P; Caron, J F; Diaz Diaz A; Model of multilayered materials for interface stress estimation and validation by finite element calculations, Mechanics of Materials, no.34, pp 217-230, 2002
[53] – Li, C F; Hu, N; Yin, Y J; Sekine, H; Fukunaga, H; Low-velocity impact-induced damage of continuous fiber-reinforced composite laminates. Part I. An FEM numerical model, Composites: Part A, no.33, pp 1055-1062, 2002
[54] – Kashtalyan, M Yu; Soutis, C; Stiffness degradation in cross-ply laminates damaged by transverse cracking and splitting, Composites: Part A, no.31, pp 335-351, 2000
[55] – Demianouchko, E; Bai, J; Stress state analyses of a ±55º filament-wound composite tube with damage effect, Composite Structures, no.37, pp 233-239, 1997
[56] – Hwang, T; Hong, C; Kim, C; Probabilistic deformation and strength prediction for a filament wound pressure vessel, Composite Structures vol.39, pp 283-288, 1997
[57] – Flanagan, G; A general sublaminate analysis method for determining strain energy release rates in composites, Materials Science Corporation, 1998
[58] – O’Brien, T K; PCharacterization, Analysis and prediction of delamination in composites using fracture mechanics, NASA Oral Reference No. ICF100942OR, 2001
[59] – Hwang, T; Hong, C; Kim, C; Probabilistic deformation and strength prediction for a filament wound pressure vessel, Composite Structures vol.39, pp 283-288, 1997
[60] – Pereira, A B; Morais, A B; Mode II interlaminar fracture of glass/epoxy multidirectional laminates, Composites: Part A, no.35, pp 265-272, 2004
[61] – Korjakin, A; Rikards, R; Buchholz, F G; Wang, H; Bledzki, A K; Kessler, A; Comparative study if interlaminar fracture toughness of GFRP with different fiber surface treatments, Polymer Composites, vol.19, no.6, pp 793-806, 1998

References
108
[62] – Golub, V P; Kryzhanovskii, V I; Long-term strength criteria for some polymer materials under a plane stress state, Mechanics of Composite Materials, vol.38, no.6, pp 471-484, 2002
[63] – Mertiny, P; Ellyin, F; LInfluence of the filament winding tension on physical and mechanical properties of reinforced composites, Composites: Part A, no.33, pp 1615-1622, 2002
[64] – Mieras, H J M A; Irrevesible creep of filament-wound glass-reinforced resin pipes, Plastics & Polymers, 1973
[65] – Nishiwaki, T; Yokoyama, A; Maekawa, Z; Hamada, H; Mori, S; A quasi-three-dimensional lateral compressive analysis method for a composite cylinder, Composite Structures, no.32, pp 293-298, 1995
[66] – Nishiwaki, T; Yokoyama, A; Maekawa, Z; Hamada, H; A new numerical modeling for laminated composites, Composite Structures, no.32, pp 641-647, 1995
[67] – Diggwa, A D S; Norman, R H; Mechanism of creep of GRP. 1. Shape of creep curves, Rubber and Plastics Research Association of Great Britain, Research report 193, 1971
[68] – Diggwa, A D S; Norman, R H; Mechanism of creep of GRP. 1. Microfailures, Rubber and Plastics Research Association of Great Britain, Research report 194, 1971
[69] – Sudduth, R D; Development of a simplified relationship between uniaxial creep, stress relaxation, and constant strain-rate results for viscoelastic polymeric materials, Journal of Applied Polymer Science, vol.82, pp 527-540, 2001
[70] – Sudduth, R D; Comparison of the failure conditions for creep, stress relaxation, and constant strain rate measurements to predict pipe burst for two ABS materials using the universal viscoelastic model, Journal of Applied Polymer Science, vol.93, pp 247-260, 2004
[71] – Guedes, R M; Mathematical analysis of energies for viscoelastic materials and energy based failure criteria for creep loading, Mechanics of Time-Dependent Materials, no.8, pp 169-192, 2004
[72] – Robinson, D N; Binienda, W K; Ruggles, M B; Creep of polymer matrix composites. I: Norton/Bailey creep law for transverse isotropy, Journal of Engineering Mechanics, vol.129, no.3, pp 310-315, 2003
the author _____________________________________ Hugo Faria
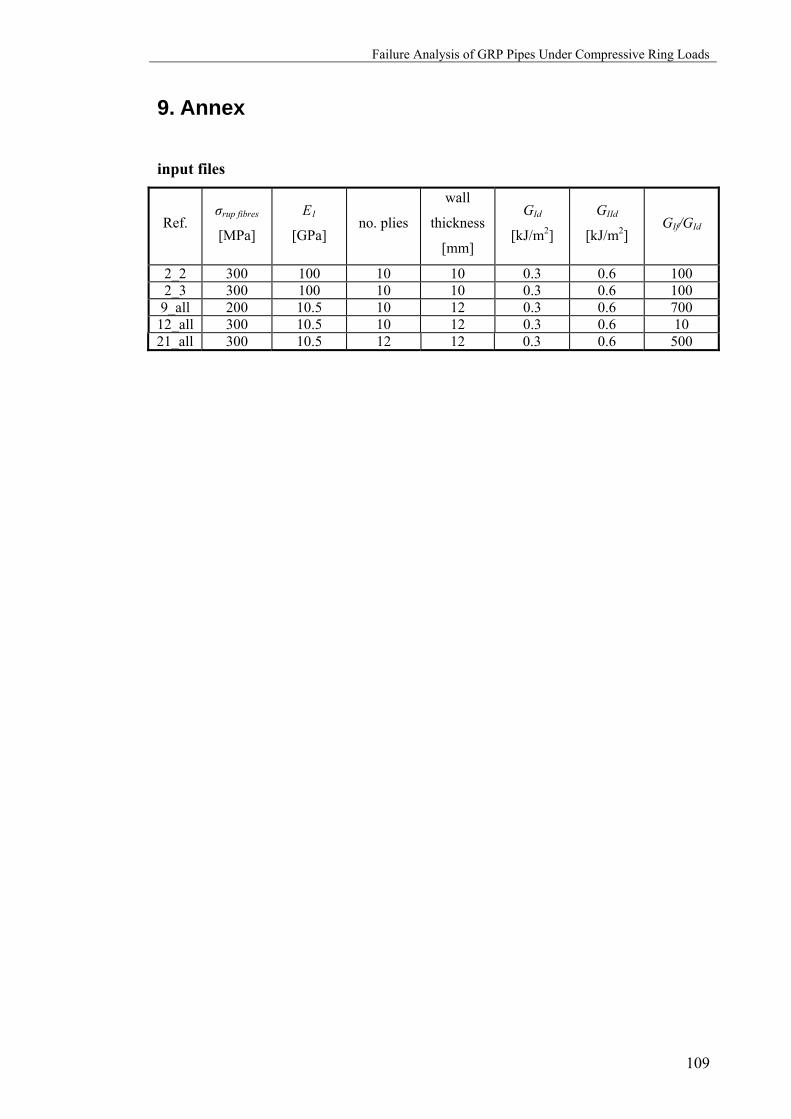
Failure Analysis of GRP Pipes Under Compressive Ring Loads
109
9. Annex
input files
Ref. σrup fibres
[MPa]
E1
[GPa] no. plies
wall
thickness
[mm]
GId
[kJ/m2]
GIId
[kJ/m2] GIf/GId
2_2 300 100 10 10 0.3 0.6 100 2_3 300 100 10 10 0.3 0.6 100
9_all 200 10.5 10 12 0.3 0.6 700 12_all 300 10.5 10 12 0.3 0.6 10 21_all 300 10.5 12 12 0.3 0.6 500

Annex
110
2_2 300 100 10 10 0.3 0.6 100
*HEADING Tubo de DN500 (500mm) ** *NODE 1 10001,-250,0 11801,250,0 210001,-260,0 211801,260,0 ** ** Geração das linhas circulares interior e exterior *NGEN,LINE=C,NSET=LINHA_A 10001,11801,1, , 0., 0., 0., 0., 0., -1 ** *NGEN,LINE=C,NSET=LINHA_B 210001,211801,1, , 0., 0., 0., 0., 0., -1 ** ** Geração de nós entre as linhas ** *NFILL,NSET=ALL LINHA_A,LINHA_B,20,10000 ** *NSET,NSET=ZC1,GENERATE 30800,31001,1 *NSET,NSET=ZC2,GENERATE 50800,51001,1 *NSET,NSET=VERT,GENERATE 10901,50901,10000 ** *NCOPY, CHANGE NUMBER=500000, OLDSET=ZC1, NEWSET=ZC1DUP, SHIFT 0.,0.,0. 0.,0.,0.,0.,0.,10.,0. *NCOPY, CHANGE NUMBER=500000, OLDSET=ZC2, NEWSET=ZC2DUP, SHIFT 0.,0.,0. 0.,0.,0.,0.,0.,10.,0. *NCOPY, CHANGE NUMBER=1000000, OLDSET=VERT, NEWSET=VERTDUP, SHIFT 0.,0.,0. 0.,0.,0.,0.,0.,10.,0. **-------------------------------------------------------- ** Criação dos elementos laterais **-------------------------------------------------------- *ELEMENT,TYPE=CPE8R 100000,10001,10009,30009,30001,10005,20009,30005,20001 200000,11001,11009,31009,31001,11005,21009,31005,21001 3000,50801,50803,70803,70801,50802,60803,70802,60801 1000,10801,10803,530803,530801,10802,20803,530802,20801 1050,10899,1010901,1030901,530899,10900,1020901,530900,20899 1051,10901,10903,530903,530901,10902,20903,530902,20901 *ELGEN,ELSET=ALL 100000,100,8,1,10,20000,1000,1 200000,100,8,1,10,20000,1000,1 3000,100,2,1,8,20000,1000,1 1000,49,2,1,2,20000,1000,1 1050,1,2,1,2,20000,1000,1

Failure Analysis of GRP Pipes Under Compressive Ring Loads
111
1051,50,2,1,2,20000,1000,1 **-------------------------------------------------------- ** Elementos de Interface **-------------------------------------------------------- *USER ELEMENT, TYPE=U1,NODES=6,COORDINATES=2,VARIABLES=6,PROPERTIES=6 1,2 *ELEMENT, TYPE=U1 1,530801,530802,530803,30801,30802,30803 50,530899,530900,1030901,30899,30900,30901 51,530901,530902,530903,30901,30902,30903 201,10901,20901,530901,1010901,1020901,1030901 202,30901,40901,550901,1030901,1040901,1050901 *ELGEN,ELSET=INTERF1 1,49,2,1,2,20000,100 50,2,20000,100 51,50,2,1,2,20000,100 *ELSET, ELSET=INTERF2 201,202 ** Interf1 - Elementos de ligaçao entre camadas *UEL PROPERTY, ELSET=INTERF1 **GIC, GIIC, S11, T13, PEN, WIDTH .3,.6,20,20,1E6,300.0 ** interf2 - Elementos de rotura da camada *UEL PROPERTY, ELSET=INTERF2 **GIC, GIIC, S11, T13, PEN, WIDTH 30,6,300,20,1E6,300.0 **-------------------------------------------------------- ** Propriedades do tubo **-------------------------------------------------------- *SOLID SECTION, MATERIAL=GLASS,ELSET=ALL,ORIENTATION=OR0 300.0 ** *MATERIAL,NAME=GLASS *ELASTIC, TYPE=ENGINEERING CONSTANTS 12000,3800,3800,0.3,0.3,0.4,3200,3200, 4000 *ORIENTATION,NAME=OR0 1,0,0,0,1,0 3,0 ** *NSET, NSET=COSE1 30801 50801 31001 51001 *NSET, NSET=COSE2 530801 550801 531001 551001 *MPC TIE,COSE1,COSE2 ** **-------------------------------------------------------- ** STEP **-------------------------------------------------------- *RESTART,WRITE,OVERLAY **

Annex
112
*STEP,NLGEOM,INC=10000,UNSYMM=YES *STATIC 0.002,1,1E-5,1. **-------------------------------------------------------- ** Condições de Fronteira **-------------------------------------------------------- *NSET, NSET=BOUND1, GENERATE 10001,210001,10000 11801,211801,10000 *NSET, NSET=BOUND2, GENERATE 210901,210901,1 *BOUNDARY BOUND1,2,2 BOUND2,1,1 *BOUNDARY BOUND2,2,2,-200 *OUTPUT,HISTORY,FREQ=1 *NODE OUTPUT,NSET=BOUND1 RF1,RF2,U1, *NODE OUTPUT,NSET=BOUND2 RF2,U2, *OUTPUT,FIELD,FREQ=1 *NODE OUTPUT U, *ELEMENT OUTPUT S, *EL PRINT, FREQ=1 S, *NODE PRINT, TOTALS=YES,NSET=BOUND1 RF, *CONTROLS,PARAMETERS=FIELD,FIELD=DISPLACEMENT .1,1.0 *CONTROLS,PARAMETERS=TIME INCREMENTATION 1500,1500,,1500,1500 *NODE FILE,NSET=BOUND1 RF,U, *NODE FILE,NSET=BOUND2 RF,U, *NODE PRINT,TOTALS=YES,NSET=BOUND1 RF,U, *NODE PRINT,TOTALS=YES,NSET=BOUND2 RF,U, *END STEP

Failure Analysis of GRP Pipes Under Compressive Ring Loads
113
2_3 300 100 10 10 0.3 0.6 100
*HEADING Tubo de DN500 (500mm) ** *NODE 1 10001,-250,0 11801,250,0 210001,-260,0 211801,260,0 ** ** Geração das linhas circulares interior e exterior *NGEN,LINE=C,NSET=LINHA_A 10001,11801,1, , 0., 0., 0., 0., 0., -1 ** *NGEN,LINE=C,NSET=LINHA_B 210001,211801,1, , 0., 0., 0., 0., 0., -1 ** ** Geração de nós entre as linhas ** *NFILL,NSET=ALL LINHA_A,LINHA_B,20,10000 ** *NSET,NSET=INTERCAM1,GENERATE 30001,31801,1 *NSET,NSET=INTERCAM2,GENERATE 50001,51801,1 *NSET,NSET=INTERCAM3,GENERATE 70001,71801,1 *NSET,NSET=VERT,GENERATE 10901,70901,10000 ** *NCOPY, CHANGE NUMBER=500000, OLDSET=INTERCAM1, NEWSET=INTERCAM1DUP, SHIFT 0.,0.,0. 0.,0.,0.,0.,0.,10.,0. *NCOPY, CHANGE NUMBER=500000, OLDSET=INTERCAM2, NEWSET=INTERCAM2DUP, SHIFT 0.,0.,0. 0.,0.,0.,0.,0.,10.,0. *NCOPY, CHANGE NUMBER=500000, OLDSET=INTERCAM3, NEWSET=INTERCAM3DUP, SHIFT 0.,0.,0. 0.,0.,0.,0.,0.,10.,0. *NCOPY, CHANGE NUMBER=1000000, OLDSET=VERT, NEWSET=VERTDUP, SHIFT 0.,0.,0. 0.,0.,0.,0.,0.,10.,0. **-------------------------------------------------------- ** Criação dos elementos laterais **-------------------------------------------------------- *ELEMENT,TYPE=CPE8R 40000,70001,70003,90003,90001,70002,80003,90002,80001 10000,10001,10003,530003,530001,10002,20003,530002,20001 10449,10899,1010901,1030901,530899,10900,1020901,530900,20899 10450,10901,10903,530903,530901,10902,20903,530902,20901

Annex
114
*ELGEN,ELSET=ALL 40000,900,2,1,7,20000,10000,1 10000,449,2,1,3,20000,10000,1 10449,1,2,1,3,20000,10000,1 10450,450,2,1,3,20000,10000,1 **-------------------------------------------------------- ** Elementos de Interface **-------------------------------------------------------- *USER ELEMENT, TYPE=U1,NODES=6,COORDINATES=2,VARIABLES=6,PROPERTIES=6 1,2 *ELEMENT, TYPE=U1 1,530001,530002,530003,30001,30002,30003 450,530899,530900,1030901,30899,30900,30901 451,530901,530902,530903,30901,30902,30903 2701,10901,20901,530901,1010901,1020901,1030901 2702,30901,40901,550901,1030901,1040901,1050901 2703,50901,60901,570901,1050901,1060901,1070901 *ELGEN,ELSET=INTERF1 1,449,2,1,3,20000,900 450,3,20000,900 451,450,2,1,3,20000,900 *ELSET, ELSET=INTERF2 2701,2702,2703 ** Interf1 - Elementos de ligaçao entre camadas *UEL PROPERTY, ELSET=INTERF1 **GIC, GIIC, S11, T13, PEN, WIDTH .3,.6,20,20,1E6,300.0 ** interf2 - Elementos de rotura da camada *UEL PROPERTY, ELSET=INTERF2 **GIC, GIIC, S11, T13, PEN, WIDTH 30,6,300,20,1E6,300.0 **-------------------------------------------------------- ** Propriedades do tubo **-------------------------------------------------------- *SOLID SECTION, MATERIAL=GLASS,ELSET=ALL,ORIENTATION=OR0 300.0 ** *MATERIAL,NAME=GLASS *ELASTIC, TYPE=ENGINEERING CONSTANTS 100000,9000,9000,0.3,0.3,0.4,3200,3200, 4000 *ORIENTATION,NAME=OR0 1,0,0,0,1,0 3,0 ** *NSET, NSET=COSE1 30001 50001 70001 31801 51801 71801 *NSET, NSET=COSE2 530001 550001 570001 531801 551801

Failure Analysis of GRP Pipes Under Compressive Ring Loads
115
571801 *MPC TIE,COSE1,COSE2 ** **-------------------------------------------------------- ** STEP **-------------------------------------------------------- *RESTART,WRITE,OVERLAY ** *STEP,NLGEOM,INC=10000,UNSYMM=YES *STATIC 0.002,1,1E-5,1. **-------------------------------------------------------- ** Condições de Fronteira **-------------------------------------------------------- *NSET, NSET=BOUND1, GENERATE 10001,210001,10000 11801,211801,10000 *NSET, NSET=BOUND2, GENERATE 210901,210901,1 *BOUNDARY BOUND1,2,2 BOUND2,1,1 *BOUNDARY BOUND2,2,2,-100 *OUTPUT,HISTORY,FREQ=1 *NODE OUTPUT,NSET=BOUND1 RF1,RF2,U1, *NODE OUTPUT,NSET=BOUND2 RF2,U2, *OUTPUT,FIELD,FREQ=1 *NODE OUTPUT U, *ELEMENT OUTPUT S, *EL PRINT, FREQ=1 S, *NODE PRINT, TOTALS=YES,NSET=BOUND1 RF, *CONTROLS,PARAMETERS=FIELD,FIELD=DISPLACEMENT .1,1.0 *CONTROLS,PARAMETERS=TIME INCREMENTATION 1500,1500,,1500,1500 *NODE FILE,NSET=BOUND1 RF,U, *NODE FILE,NSET=BOUND2 RF,U, *NODE PRINT,TOTALS=YES,NSET=BOUND1 RF,U, *NODE PRINT,TOTALS=YES,NSET=BOUND2 RF,U, *END STEP

Annex
116
9_all 200 10.5 10 12 0.3 0.6 700 *HEADING Tubo de DN500 (500mm) ** *NODE 1 10001,-250,0 11801,250,0 210001,-262,0 211801,262,0 ** ** Geração das linhas circulares interior e exterior *NGEN,LINE=C,NSET=LINHA_A 10001,11801,1, , 0., 0., 0., 0., 0., -1 ** *NGEN,LINE=C,NSET=LINHA_B 210001,211801,1, , 0., 0., 0., 0., 0., -1 ** ** Geração de nós entre as linhas ** *NFILL,NSET=ALL LINHA_A,LINHA_B,20,10000 ** *NSET,NSET=INTERCAM1,GENERATE 30001,31801,1 *NSET,NSET=INTERCAM2,GENERATE 50001,51801,1 *NSET,NSET=INTERCAM3,GENERATE 70001,71801,1 *NSET,NSET=INTERCAM4,GENERATE 90001,91801,1 *NSET,NSET=INTERCAM5,GENERATE 110001,111801,1 *NSET,NSET=INTERCAM6,GENERATE 130001,131801,1 *NSET,NSET=INTERCAM7,GENERATE 150001,151801,1 *NSET,NSET=INTERCAM8,GENERATE 170001,171801,1 *NSET,NSET=INTERCAM9,GENERATE 190001,191801,1 *NSET,NSET=VERT,GENERATE 10901,210901,10000 ** *NCOPY, CHANGE NUMBER=500000, OLDSET=INTERCAM1, NEWSET=INTERCAM1DUP, SHIFT 0.,0.,0. 0.,0.,0.,0.,0.,10.,0. *NCOPY, CHANGE NUMBER=500000, OLDSET=INTERCAM2, NEWSET=INTERCAM2DUP, SHIFT 0.,0.,0. 0.,0.,0.,0.,0.,10.,0. *NCOPY, CHANGE NUMBER=500000, OLDSET=INTERCAM3, NEWSET=INTERCAM3DUP, SHIFT 0.,0.,0.

Failure Analysis of GRP Pipes Under Compressive Ring Loads
117
0.,0.,0.,0.,0.,10.,0. *NCOPY, CHANGE NUMBER=500000, OLDSET=INTERCAM4, NEWSET=INTERCAM4DUP, SHIFT 0.,0.,0. 0.,0.,0.,0.,0.,10.,0. *NCOPY, CHANGE NUMBER=500000, OLDSET=INTERCAM5, NEWSET=INTERCAM5DUP, SHIFT 0.,0.,0. 0.,0.,0.,0.,0.,10.,0. *NCOPY, CHANGE NUMBER=500000, OLDSET=INTERCAM6, NEWSET=INTERCAM6DUP, SHIFT 0.,0.,0. 0.,0.,0.,0.,0.,10.,0. *NCOPY, CHANGE NUMBER=500000, OLDSET=INTERCAM7, NEWSET=INTERCAM7DUP, SHIFT 0.,0.,0. 0.,0.,0.,0.,0.,10.,0. *NCOPY, CHANGE NUMBER=500000, OLDSET=INTERCAM8, NEWSET=INTERCAM8DUP, SHIFT 0.,0.,0. 0.,0.,0.,0.,0.,10.,0. *NCOPY, CHANGE NUMBER=500000, OLDSET=INTERCAM9, NEWSET=INTERCAM9DUP, SHIFT 0.,0.,0. 0.,0.,0.,0.,0.,10.,0. *NCOPY, CHANGE NUMBER=1000000, OLDSET=VERT, NEWSET=VERTDUP, SHIFT 0.,0.,0. 0.,0.,0.,0.,0.,10.,0. **-------------------------------------------------------- ** Criação dos elementos laterais **-------------------------------------------------------- *ELEMENT,TYPE=CPE8R 100000,190001,190003,210003,210001,190002,200003,210002,200001 100449,190899,1190901,1210901,210899,190900,1200901,210900,200899 100450,190901,190903,210903,210901,190902,200903,210902,200901 10000,10001,10003,530003,530001,10002,20003,530002,20001 10449,10899,1010901,1030901,530899,10900,1020901,530900,20899 10450,10901,10903,530903,530901,10902,20903,530902,20901 *ELGEN,ELSET=ALL 100000,449,2,1,1,20000,10000,1 100450,450,2,1,1,20000,10000,1 10000,449,2,1,9,20000,10000,1 10449,1,2,1,9,20000,10000,1 10450,450,2,1,9,20000,10000,1 *ELSET,ELSET=ALL 100449 **-------------------------------------------------------- ** Elementos de Interface **-------------------------------------------------------- *USER ELEMENT, TYPE=U1,NODES=6,COORDINATES=2,VARIABLES=6,PROPERTIES=6 1,2 *ELEMENT, TYPE=U1 1,530001,530002,530003,30001,30002,30003 450,530899,530900,1030901,30899,30900,30901 451,530901,530902,530903,30901,30902,30903 8101,10901,20901,530901,1010901,1020901,1030901 8102,30901,40901,550901,1030901,1040901,1050901 8103,50901,60901,570901,1050901,1060901,1070901

Annex
118
8104,70901,80901,590901,1070901,1080901,1090901 8105,90901,100901,610901,1090901,1100901,1110901 8106,110901,120901,630901,1110901,1120901,1130901 8107,130901,140901,650901,1130901,1140901,1150901 8108,150901,160901,670901,1150901,1160901,1170901 8109,170901,180901,690901,1170901,1180901,1190901 8110,190901,200901,210901,1190901,1200901,1210901 *ELGEN,ELSET=INTERF1 1,449,2,1,9,20000,900 450,9,20000,900 451,450,2,1,9,20000,900 *ELSET, ELSET=INTERF2 8101,8102,8103,8104,8105,8106,8107,8108,8109,8110 ** Interf1 - Elementos de ligaçao entre camadas *UEL PROPERTY, ELSET=INTERF1 **GIC, GIIC, S11, T13, PEN, WIDTH .3,.6,20,20,1E6,300.0 ** interf2 - Elementos de rotura da camada *UEL PROPERTY, ELSET=INTERF2 **GIC, GIIC, S11, T13, PEN, WIDTH 210,6,200,20,1E6,300.0 **-------------------------------------------------------- ** Propriedades do tubo **-------------------------------------------------------- *SOLID SECTION, MATERIAL=GLASS,ELSET=ALL,ORIENTATION=OR0 300.0 ** *MATERIAL,NAME=GLASS *ELASTIC, TYPE=ENGINEERING CONSTANTS 10500,3800,3800,0.3,0.3,0.4,3200,3200, 4000 *ORIENTATION,NAME=OR0,DEFINITION=OFFSET TO NODES 2,4 3,0 ** ***NSET, NSET=COSE1 **30001 **50001 **70001 **90001 **110001 **130001 **150001 **170001 **190001 **31801 **51801 **71801 **91801 **111801 **131801 **151801 **171801 **191801 ***NSET, NSET=COSE2 **530001 **550001 **570001

Failure Analysis of GRP Pipes Under Compressive Ring Loads
119
**590001 **610001 **630001 **650001 **670001 **690001 **531801 **551801 **571801 **591801 **611801 **631801 **651801 **671801 **691801 ***MPC **TIE,COSE1,COSE2 ** **-------------------------------------------------------- ** STEP **-------------------------------------------------------- *RESTART,WRITE,OVERLAY ** *STEP,NLGEOM,INC=10000,UNSYMM=YES *STATIC 0.002,1,1E-5,0.05 **-------------------------------------------------------- ** Condições de Fronteira **-------------------------------------------------------- *NSET, NSET=BOUND1, GENERATE 10001,210001,10000 510001,710001,10000 11801,211801,10000 511801,711801,10000 *NSET, NSET=BOUND2, GENERATE 210901,210901,1 1210901,1210901,1 *BOUNDARY BOUND1,2,2 BOUND2,1,1 *BOUNDARY BOUND2,2,2,-150 *OUTPUT,HISTORY,FREQ=1 *NODE OUTPUT,NSET=BOUND1 RF1,RF2,U1, *NODE OUTPUT,NSET=BOUND2 RF2,U2, *OUTPUT,FIELD,FREQ=1 *NODE OUTPUT U, *ELEMENT OUTPUT S, *EL PRINT, FREQ=1 S, *NODE PRINT, TOTALS=YES,NSET=BOUND1 RF, *CONTROLS,PARAMETERS=FIELD,FIELD=DISPLACEMENT .1,1.0

Annex
120
*CONTROLS,PARAMETERS=TIME INCREMENTATION 1500,1500,,1500,1500 *NODE FILE,NSET=BOUND1 RF,U, *NODE FILE,NSET=BOUND2 RF,U, *NODE PRINT,TOTALS=YES,NSET=BOUND1 RF,U, *NODE PRINT,TOTALS=YES,NSET=BOUND2 RF,U, *END STEP

Failure Analysis of GRP Pipes Under Compressive Ring Loads
121
12_all 300 10.5 10 12 0.3 0.6 10 *HEADING Tubo de DN500 (500mm) ** *NODE 1 10001,-250,0 11801,250,0 210001,-262,0 211801,262,0 ** ** Geração das linhas circulares interior e exterior *NGEN,LINE=C,NSET=LINHA_A 10001,11801,1, , 0., 0., 0., 0., 0., -1 ** *NGEN,LINE=C,NSET=LINHA_B 210001,211801,1, , 0., 0., 0., 0., 0., -1 ** ** Geração de nós entre as linhas ** *NFILL,NSET=ALL LINHA_A,LINHA_B,20,10000 ** *NSET,NSET=INTERCAM1,GENERATE 30001,31801,1 *NSET,NSET=INTERCAM2,GENERATE 50001,51801,1 *NSET,NSET=INTERCAM3,GENERATE 70001,71801,1 *NSET,NSET=INTERCAM4,GENERATE 90001,91801,1 *NSET,NSET=INTERCAM5,GENERATE 110001,111801,1 *NSET,NSET=INTERCAM6,GENERATE 130001,131801,1 *NSET,NSET=INTERCAM7,GENERATE 150001,151801,1 *NSET,NSET=INTERCAM8,GENERATE 170001,171801,1 *NSET,NSET=INTERCAM9,GENERATE 190001,191801,1 *NSET,NSET=VERT,GENERATE 10901,210901,10000 ** *NCOPY, CHANGE NUMBER=500000, OLDSET=INTERCAM1, NEWSET=INTERCAM1DUP, SHIFT 0.,0.,0. 0.,0.,0.,0.,0.,10.,0. *NCOPY, CHANGE NUMBER=500000, OLDSET=INTERCAM2, NEWSET=INTERCAM2DUP, SHIFT 0.,0.,0. 0.,0.,0.,0.,0.,10.,0. *NCOPY, CHANGE NUMBER=500000, OLDSET=INTERCAM3, NEWSET=INTERCAM3DUP, SHIFT

Annex
122
0.,0.,0. 0.,0.,0.,0.,0.,10.,0. *NCOPY, CHANGE NUMBER=500000, OLDSET=INTERCAM4, NEWSET=INTERCAM4DUP, SHIFT 0.,0.,0. 0.,0.,0.,0.,0.,10.,0. *NCOPY, CHANGE NUMBER=500000, OLDSET=INTERCAM5, NEWSET=INTERCAM5DUP, SHIFT 0.,0.,0. 0.,0.,0.,0.,0.,10.,0. *NCOPY, CHANGE NUMBER=500000, OLDSET=INTERCAM6, NEWSET=INTERCAM6DUP, SHIFT 0.,0.,0. 0.,0.,0.,0.,0.,10.,0. *NCOPY, CHANGE NUMBER=500000, OLDSET=INTERCAM7, NEWSET=INTERCAM7DUP, SHIFT 0.,0.,0. 0.,0.,0.,0.,0.,10.,0. *NCOPY, CHANGE NUMBER=500000, OLDSET=INTERCAM8, NEWSET=INTERCAM8DUP, SHIFT 0.,0.,0. 0.,0.,0.,0.,0.,10.,0. *NCOPY, CHANGE NUMBER=500000, OLDSET=INTERCAM9, NEWSET=INTERCAM9DUP, SHIFT 0.,0.,0. 0.,0.,0.,0.,0.,10.,0. *NCOPY, CHANGE NUMBER=1000000, OLDSET=VERT, NEWSET=VERTDUP, SHIFT 0.,0.,0. 0.,0.,0.,0.,0.,10.,0. **-------------------------------------------------------- ** Criação dos elementos laterais **-------------------------------------------------------- *ELEMENT,TYPE=CPE8R 100000,190001,190003,210003,210001,190002,200003,210002,200001 100449,190899,1190901,1210901,210899,190900,1200901,210900,200899 100450,190901,190903,210903,210901,190902,200903,210902,200901 10000,10001,10003,530003,530001,10002,20003,530002,20001 10449,10899,1010901,1030901,530899,10900,1020901,530900,20899 10450,10901,10903,530903,530901,10902,20903,530902,20901 *ELGEN,ELSET=ALL 100000,449,2,1,1,20000,10000,1 100450,450,2,1,1,20000,10000,1 10000,449,2,1,9,20000,10000,1 10449,1,2,1,9,20000,10000,1 10450,450,2,1,9,20000,10000,1 *ELSET,ELSET=ALL 100449 **-------------------------------------------------------- ** Elementos de Interface **-------------------------------------------------------- *USER ELEMENT, TYPE=U1,NODES=6,COORDINATES=2,VARIABLES=6,PROPERTIES=6 1,2 *ELEMENT, TYPE=U1 1,530001,530002,530003,30001,30002,30003 450,530899,530900,1030901,30899,30900,30901 451,530901,530902,530903,30901,30902,30903 8101,10901,20901,530901,1010901,1020901,1030901 8102,30901,40901,550901,1030901,1040901,1050901

Failure Analysis of GRP Pipes Under Compressive Ring Loads
123
8103,50901,60901,570901,1050901,1060901,1070901 8104,70901,80901,590901,1070901,1080901,1090901 8105,90901,100901,610901,1090901,1100901,1110901 8106,110901,120901,630901,1110901,1120901,1130901 8107,130901,140901,650901,1130901,1140901,1150901 8108,150901,160901,670901,1150901,1160901,1170901 8109,170901,180901,690901,1170901,1180901,1190901 8110,190901,200901,210901,1190901,1200901,1210901 *ELGEN,ELSET=INTERF1 1,449,2,1,9,20000,900 450,9,20000,900 451,450,2,1,9,20000,900 *ELSET, ELSET=INTERF2 8101,8102,8103,8104,8105,8106,8107,8108,8109,8110 ** Interf1 - Elementos de ligaçao entre camadas *UEL PROPERTY, ELSET=INTERF1 **GIC, GIIC, S11, T13, PEN, WIDTH .3,.6,20,20,1E6,300.0 ** interf2 - Elementos de rotura da camada *UEL PROPERTY, ELSET=INTERF2 **GIC, GIIC, S11, T13, PEN, WIDTH 3,6,300,20,1E6,300.0 **-------------------------------------------------------- ** Propriedades do tubo **-------------------------------------------------------- *SOLID SECTION, MATERIAL=GLASS,ELSET=ALL,ORIENTATION=OR0 300.0 ** *MATERIAL,NAME=GLASS *ELASTIC, TYPE=ENGINEERING CONSTANTS 10500,3800,3800,0.3,0.3,0.4,3200,3200, 4000 *ORIENTATION,NAME=OR0,DEFINITION=OFFSET TO NODES 2,4 3,0 ** ***NSET, NSET=COSE1 **30001 **50001 **70001 **90001 **110001 **130001 **150001 **170001 **190001 **31801 **51801 **71801 **91801 **111801 **131801 **151801 **171801 **191801 ***NSET, NSET=COSE2 **530001 **550001

Annex
124
**570001 **590001 **610001 **630001 **650001 **670001 **690001 **531801 **551801 **571801 **591801 **611801 **631801 **651801 **671801 **691801 ***MPC **TIE,COSE1,COSE2 ** **-------------------------------------------------------- ** STEP **-------------------------------------------------------- *RESTART,WRITE,OVERLAY ** *STEP,NLGEOM,INC=10000,UNSYMM=YES *STATIC 0.002,1,1E-5,0.05 **-------------------------------------------------------- ** Condições de Fronteira **-------------------------------------------------------- *NSET, NSET=BOUND1, GENERATE 10001,210001,10000 510001,710001,10000 11801,211801,10000 511801,711801,10000 *NSET, NSET=BOUND2, GENERATE 210901,210901,1 1210901,1210901,1 *BOUNDARY BOUND1,2,2 BOUND2,1,1 *BOUNDARY BOUND2,2,2,-150 *OUTPUT,HISTORY,FREQ=1 *NODE OUTPUT,NSET=BOUND1 RF1,RF2,U1, *NODE OUTPUT,NSET=BOUND2 RF2,U2, *OUTPUT,FIELD,FREQ=1 *NODE OUTPUT U, *ELEMENT OUTPUT S, *EL PRINT, FREQ=1 S, *NODE PRINT, TOTALS=YES,NSET=BOUND1 RF, *CONTROLS,PARAMETERS=FIELD,FIELD=DISPLACEMENT

Failure Analysis of GRP Pipes Under Compressive Ring Loads
125
.1,1.0 *CONTROLS,PARAMETERS=TIME INCREMENTATION 1500,1500,,1500,1500 *NODE FILE,NSET=BOUND1 RF,U, *NODE FILE,NSET=BOUND2 RF,U, *NODE PRINT,TOTALS=YES,NSET=BOUND1 RF,U, *NODE PRINT,TOTALS=YES,NSET=BOUND2 RF,U, *END STEP

Annex
126
21_all 300 10.5 12 12 0.3 0.6 500 *HEADING Tubo de DN500 (500mm) ** *NODE 1 10001,-250,0 11801,250,0 250001,-262,0 251801,262,0 ** ** Geração das linhas circulares interior e exterior *NGEN,LINE=C,NSET=LINHA_A 10001,11801,1, , 0., 0., 0., 0., 0., -1 ** *NGEN,LINE=C,NSET=LINHA_B 250001,251801,1, , 0., 0., 0., 0., 0., -1 **----------------------------------------------------- ** Geração de nós entre as linhas **----------------------------------------------------- *NFILL,NSET=ALL LINHA_A,LINHA_B,24,10000 ** *NSET,NSET=INTERCAM1,GENERATE 30001,31801,1 *NSET,NSET=INTERCAM2,GENERATE 50001,51801,1 *NSET,NSET=INTERCAM3,GENERATE 70001,71801,1 *NSET,NSET=INTERCAM4,GENERATE 90001,91801,1 *NSET,NSET=INTERCAM5,GENERATE 110001,111801,1 *NSET,NSET=INTERCAM6,GENERATE 130001,131801,1 *NSET,NSET=INTERCAM7,GENERATE 150001,151801,1 *NSET,NSET=INTERCAM8,GENERATE 170001,171801,1 *NSET,NSET=INTERCAM9,GENERATE 190001,191801,1 *NSET,NSET=INTERCAM10,GENERATE 210001,211801,1 *NSET,NSET=INTERCAM11,GENERATE 230001,231801,1 *NSET,NSET=VERT,GENERATE 10901,250901,10000 ** *NCOPY, CHANGE NUMBER=500000, OLDSET=INTERCAM1, NEWSET=INTERCAM1DUP, SHIFT 0.,0.,0. 0.,0.,0.,0.,0.,10.,0. *NCOPY, CHANGE NUMBER=500000, OLDSET=INTERCAM2, NEWSET=INTERCAM2DUP, SHIFT

Failure Analysis of GRP Pipes Under Compressive Ring Loads
127
0.,0.,0. 0.,0.,0.,0.,0.,10.,0. *NCOPY, CHANGE NUMBER=500000, OLDSET=INTERCAM3, NEWSET=INTERCAM3DUP, SHIFT 0.,0.,0. 0.,0.,0.,0.,0.,10.,0. *NCOPY, CHANGE NUMBER=500000, OLDSET=INTERCAM4, NEWSET=INTERCAM4DUP, SHIFT 0.,0.,0. 0.,0.,0.,0.,0.,10.,0. *NCOPY, CHANGE NUMBER=500000, OLDSET=INTERCAM5, NEWSET=INTERCAM5DUP, SHIFT 0.,0.,0. 0.,0.,0.,0.,0.,10.,0. *NCOPY, CHANGE NUMBER=500000, OLDSET=INTERCAM6, NEWSET=INTERCAM6DUP, SHIFT 0.,0.,0. 0.,0.,0.,0.,0.,10.,0. *NCOPY, CHANGE NUMBER=500000, OLDSET=INTERCAM7, NEWSET=INTERCAM7DUP, SHIFT 0.,0.,0. 0.,0.,0.,0.,0.,10.,0. *NCOPY, CHANGE NUMBER=500000, OLDSET=INTERCAM8, NEWSET=INTERCAM8DUP, SHIFT 0.,0.,0. 0.,0.,0.,0.,0.,10.,0. *NCOPY, CHANGE NUMBER=500000, OLDSET=INTERCAM9, NEWSET=INTERCAM9DUP, SHIFT 0.,0.,0. 0.,0.,0.,0.,0.,10.,0. *NCOPY, CHANGE NUMBER=500000, OLDSET=INTERCAM10, NEWSET=INTERCAM10DUP, SHIFT 0.,0.,0. 0.,0.,0.,0.,0.,10.,0. *NCOPY, CHANGE NUMBER=500000, OLDSET=INTERCAM11, NEWSET=INTERCAM11DUP, SHIFT 0.,0.,0. 0.,0.,0.,0.,0.,10.,0. *NCOPY, CHANGE NUMBER=1000000, OLDSET=VERT, NEWSET=VERTDUP, SHIFT 0.,0.,0. 0.,0.,0.,0.,0.,10.,0. **-------------------------------------------------------- ** Criação dos elementos regulares **-------------------------------------------------------- *ELEMENT,TYPE=CPE8R 120000,230001,230003,250003,250001,230002,240003,250002,240001 120449,230899,1230901,1250901,250899,230900,1240901,250900,240899 120450,230901,230903,250903,250901,230902,240903,250902,240901 ****100000,190001,190003,210003,210001,190002,200003,210002,200001 ****100449,190899,1190901,1210901,210899,190900,1200901,210900,200899 ****100450,190901,190903,210903,210901,190902,200903,210902,200901 10000,10001,10003,530003,530001,10002,20003,530002,20001 10449,10899,1010901,1030901,530899,10900,1020901,530900,20899 10450,10901,10903,530903,530901,10902,20903,530902,20901 *ELGEN,ELSET=ALL 120000,449,2,1,1,20000,10000,1 120450,449,2,1,1,20000,10000,1 ****100000,449,2,1,1,20000,10000,1

Annex
128
****100450,450,2,1,1,20000,10000,1 10000,449,2,1,11,20000,10000,1 10449,1,2,1,11,20000,10000,1 10450,450,2,1,11,20000,10000,1 *ELSET,ELSET=ALL 120449 ****100449 **-------------------------------------------------------- ** Criação dos Elementos de Interface **-------------------------------------------------------- *USER ELEMENT, TYPE=U1,NODES=6,COORDINATES=2,VARIABLES=6,PROPERTIES=6 1,2 *ELEMENT, TYPE=U1 1,530001,530002,530003,30001,30002,30003 450,530899,530900,1030901,30899,30900,30901 451,530901,530902,530903,30901,30902,30903 9901,10901,20901,530901,1010901,1020901,1030901 9902,30901,40901,550901,1030901,1040901,1050901 9903,50901,60901,570901,1050901,1060901,1070901 9904,70901,80901,590901,1070901,1080901,1090901 9905,90901,100901,610901,1090901,1100901,1110901 9906,110901,120901,630901,1110901,1120901,1130901 9907,130901,140901,650901,1130901,1140901,1150901 9908,150901,160901,670901,1150901,1160901,1170901 9909,170901,180901,690901,1170901,1180901,1190901 9910,190901,200901,710901,1190901,1200901,1210901 9911,210901,220901,730901,1210901,1220901,1230901 9912,230901,240901,750901,1230901,1240901,1250901 ****8101,10901,20901,530901,1010901,1020901,1030901 ****8102,30901,40901,550901,1030901,1040901,1050901 ****8103,50901,60901,570901,1050901,1060901,1070901 ****8104,70901,80901,590901,1070901,1080901,1090901 ****8105,90901,100901,610901,1090901,1100901,1110901 ****8106,110901,120901,630901,1110901,1120901,1130901 ****8107,130901,140901,650901,1130901,1140901,1150901 ****8108,150901,160901,670901,1150901,1160901,1170901 ****8109,170901,180901,690901,1170901,1180901,1190901 ****8110,190901,200901,210901,1190901,1200901,1210901 *ELGEN,ELSET=INTERF1 1,449,2,1,11,20000,900 450,11,20000,900 451,450,2,1,11,20000,900 *ELSET, ELSET=INTERF2 9901,9902,9903,9904,9905,9906,9907,9908,9909,9910,9911,9912 ** Interf1 - Elementos de ligaçao entre camadas *UEL PROPERTY, ELSET=INTERF1 **GIC, GIIC, S11, T13, PEN, WIDTH .3,.6,20,20,1E6,300.0 ** interf2 - Elementos de rotura da camada *UEL PROPERTY, ELSET=INTERF2 **GIC, GIIC, S11, T13, PEN, WIDTH 150,6,300,20,1E6,300.0 **-------------------------------------------------------- ** Propriedades do tubo **-------------------------------------------------------- *SOLID SECTION, MATERIAL=GLASS,ELSET=ALL,ORIENTATION=OR0 300.0 **

Failure Analysis of GRP Pipes Under Compressive Ring Loads
129
*MATERIAL,NAME=GLASS *ELASTIC, TYPE=ENGINEERING CONSTANTS 10500,9000,9000,0.3,0.3,0.4,3200,3200, 4000 *ORIENTATION,NAME=OR0, DEFINITION=OFFSET TO NODES 2,4 3,0 ** *NSET, NSET=COSE1 30001 50001 70001 90001 110001 130001 150001 170001 190001 210001 230001 31801 51801 71801 91801 111801 131801 151801 171801 191801 211801 231801 *NSET, NSET=COSE2 530001 550001 570001 590001 610001 630001 650001 670001 690001 710001 730001 531801 551801 571801 591801 611801 631801 651801 671801 691801 711801 731801 *MPC TIE,COSE1,COSE2 ** **--------------------------------------------------------

Annex
130
** STEP **-------------------------------------------------------- *RESTART,WRITE,OVERLAY ** *STEP,NLGEOM,INC=10000,UNSYMM=YES *STATIC 0.002,1,1E-5,0.05 **-------------------------------------------------------- ** Condições de Fronteira **-------------------------------------------------------- *NSET, NSET=BOUND1, GENERATE 10001,250001,10000 11801,251801,10000 *NSET, NSET=BOUND2, GENERATE 250901,250901,1 1250901,1250901,1 *BOUNDARY BOUND1,2,2 BOUND2,1,1 *BOUNDARY BOUND2,2,2,-150 *OUTPUT,HISTORY,FREQ=1 *NODE OUTPUT,NSET=BOUND1 RF1,RF2,U1, *NODE OUTPUT,NSET=BOUND2 RF2,U2, *OUTPUT,FIELD,FREQ=1 *NODE OUTPUT U, *ELEMENT OUTPUT S, *EL PRINT, FREQ=1 S, *NODE PRINT, TOTALS=YES,NSET=BOUND1 RF, *CONTROLS,PARAMETERS=FIELD,FIELD=DISPLACEMENT .1,1.0 *CONTROLS,PARAMETERS=TIME INCREMENTATION 1500,1500,,1500,1500 *NODE FILE,NSET=BOUND1 RF,U, *NODE FILE,NSET=BOUND2 RF,U, *NODE PRINT,TOTALS=YES,NSET=BOUND1 RF,U, *NODE PRINT,TOTALS=YES,NSET=BOUND2 RF,U, *END STEP