factors leading to older drivers' intersection crashes
TRANSCRIPT
This article was downloaded by: [Nipissing University]On: 18 October 2014, At: 07:52Publisher: Taylor & FrancisInforma Ltd Registered in England and Wales Registered Number: 1072954 Registered office: Mortimer House,37-41 Mortimer Street, London W1T 3JH, UK
Traffic Injury PreventionPublication details, including instructions for authors and subscription information:http://www.tandfonline.com/loi/gcpi20
Factors Leading to Older Drivers' Intersection CrashesKeli A. Braitman a , Bevan B. Kirley a , Susan Ferguson a b & Neil K. Chaudhary ca Insurance Institute for Highway Safety , Arlington, Virginia, USAb Ferguson International , LLC McLean, Virginia, USAc formerly with the Insurance Institute for Highway Safety , Arlington, Virginia, USAd Preusser Research Group, Inc. , Trumbull, Connecticut, USAPublished online: 17 Aug 2007.
To cite this article: Keli A. Braitman , Bevan B. Kirley , Susan Ferguson & Neil K. Chaudhary (2007) Factors Leading to OlderDrivers' Intersection Crashes, Traffic Injury Prevention, 8:3, 267-274, DOI: 10.1080/15389580701272346
To link to this article: http://dx.doi.org/10.1080/15389580701272346
PLEASE SCROLL DOWN FOR ARTICLE
Taylor & Francis makes every effort to ensure the accuracy of all the information (the “Content”) containedin the publications on our platform. However, Taylor & Francis, our agents, and our licensors make norepresentations or warranties whatsoever as to the accuracy, completeness, or suitability for any purpose of theContent. Any opinions and views expressed in this publication are the opinions and views of the authors, andare not the views of or endorsed by Taylor & Francis. The accuracy of the Content should not be relied upon andshould be independently verified with primary sources of information. Taylor and Francis shall not be liable forany losses, actions, claims, proceedings, demands, costs, expenses, damages, and other liabilities whatsoeveror howsoever caused arising directly or indirectly in connection with, in relation to or arising out of the use ofthe Content.
This article may be used for research, teaching, and private study purposes. Any substantial or systematicreproduction, redistribution, reselling, loan, sub-licensing, systematic supply, or distribution in anyform to anyone is expressly forbidden. Terms & Conditions of access and use can be found at http://www.tandfonline.com/page/terms-and-conditions
Traffic Injury Prevention, 8:267–274, 2007Copyright C©© 2007 Taylor & Francis Group, LLCISSN: 1538-9588 print / 1538-957X onlineDOI: 10.1080/15389580701272346
Factors Leading to Older Drivers ’ Intersect ionCrashes
KELI A. BRAITMAN and BEVAN B. KIRLEY
Insurance Institute for Highway Safety, Arlington, Virginia, USA
SUSAN FERGUSON
Ferguson International, LLC McLean, Virginia, USA, formerly with the Insurance Institute for Highway Safety, Arlington,Virginia, USA
NEIL K. CHAUDHARY
Preusser Research Group, Inc., Trumbull, Connecticut, USA
Objectives. Older drivers are overinvolved in intersection crashes compared with younger drivers, but the reasons arenot clearly understood. The purpose of the present study was to identify the factors that lead to older drivers’ intersectioncrashes.
Method. Study participants were composed of two groups of older drivers—ages 70–79 (n = 78) and 80 and older(n = 76)—and a comparison group of drivers ages 35–54 (n = 73); all were at fault in intersection crashes involving nonfatalinjuries. Police crash reports, telephone interviews with at-fault drivers, and photographs of intersections were used todetermine the kinds of driver actions and errors that led to the intersection crashes.
Results. Drivers 80 and older had fewer rear-end crashes than drivers ages 35–54 and 70–79, and both groups of olderdrivers had fewer ran-off-road crashes than drivers ages 35–54. Crashes where drivers failed to yield the right-of-wayincreased with age and occurred mostly at stop sign–controlled intersections, generally when drivers were turning left. Thereasons for failure-to-yield crashes tended to vary by age. Compared with drivers ages 35–54 and 80 and older, drivers ages70–79 made more evaluation errors—seeing another vehicle but misjudging whether there was adequate time to proceed.In contrast, drivers 80 and older predominantly failed to see or detect the other vehicle. Drivers ages 35–54 also tended tomake search errors, but theirs were due more often to distraction.
Conclusions. Factors leading to intersection crashes vary with age, even between two age groups of older drivers. Becausethe number of older drivers is projected to increase, it is important to identify ways to reduce the frequency and severity of theirintersection crashes. Roundabouts and protected left turn lanes at signalized intersections may help to reduce failure-to-yieldcrashes at intersections, especially among older drivers. Crash avoidance systems may help to reduce crashes for drivers ofall ages, but most systems have not been thoroughly investigated using real-world crash data.
Keywords Older Drivers; Intersection Crashes; Crash Typing; Traffic Controls; Roundabouts
INTRODUCTION
By 2030, drivers 65 and older are projected to represent aquarter of the driving age population (Lyman et al., 2002). Com-pared with younger drivers, those 70 and older have lower ratesof police-reported crashes per capita, but crash rates per mile oftravel increase steeply for drivers 75 and older (Insurance Insti-tute for Highway Safety, 2006a; Li et al., 2003; Lyman et al.,2002). In a study of fatal crashes occurring during 1993–1997,
Received 4 December 2006, accepted 11 February 2007.Address correspondence to Keli A. Braitman, Insurance Institute for High-
way Safety, 1005 North Glebe Road, Arlington, VA 22201. E-mail: [email protected]
drivers 75 and older had higher fatal crash rates per vehiclemile traveled compared with all other age groups, particularlyin side impact crashes (Li et al., 2003). Rates of property damageclaims per insured vehicle year begin to rise after about age 65(Highway Loss Data Institute, 2005).
Compared with younger drivers, older drivers are overin-volved in certain types of collisions—angle crashes, overtak-ing or merging crashes, and especially intersection crashes(Mayhew et al., 2006). Among passenger vehicle drivers in-volved in fatal crashes in 2005, the proportion involved inmultiple-vehicle intersection crashes was higher among drivers70 and older (40 percent) than among those ages 35–54(23 percent). Multiple-vehicle intersection crashes accountedfor about half of fatal crashes among drivers 85 and older
267
Dow
nloa
ded
by [
Nip
issi
ng U
nive
rsity
] at
07:
52 1
8 O
ctob
er 2
014
268 K. A. BRAITMAN ET AL.
(Insurance Institute for Highway Safety, 2006b). In a Finnishstudy of fatal crashes involving older drivers at intersections, col-lisions in which drivers approached from right angles were morecommon than either rear-end or head-on collisions (Hakamies-Blomqvist, 1993).
For older drivers, intersection crashes often result from fail-ure to yield the right-of-way (Aizenberg and McKenzie, 1997;Finison and Dubrow, 2002; Griffin, 2004; Kostyniuk et al., 2003;Massie et al., 1993; McGwin and Brown, 1999; Staplin et al.,1998; Zuckier et al., 1999). Older drivers are likely to be involvedin crashes when turning left (Chandraratna et al., 2002; Chan-draratna and Stamatiadis, 2003; Griffin, 2004; Mayhew et al.,2006; Staplin et al., 1998), when traveling straight (Preusseret al., 1998), or when evaluating the gaps between their vehiclesand other vehicles (Chandraratna and Stamatiadis, 2003; Oxleyet al., 2006). A greater percentage of older drivers’ intersectioncrashes occur at stop sign–controlled intersections than at sig-nalized intersections (Oxley et al., 2006; Preusser et al., 1998;Viano and Ridella, 1996).
Driving through intersections is a complex task that requiresdividing attention among multiple pieces of information, per-ceiving and judging dynamic traffic movements, interpretingtraffic signals, and deciding and implementing a course of ac-tion. It is possible that the overrepresentation of older drivers inintersection crashes results from increasing impairments in sen-sory, cognitive, and motor functions. Age-related physical andcognitive declines can include problems in peripheral vision andvisual acuity (Kahn et al., 1977; Tielsch et al., 1990), range ofmotion (e.g., neck movement; Staplin et al., 1998), divided at-tention (McDowd, 1986), and reaction time (Janke, 1994), allof which are relevant to the ability to safely navigate intersec-tions. Using a driving simulator, Caird et al. (2005) found thatdrivers 65 and older were less accurate than younger driversin determining when it was safe to proceed through a busy in-tersection. Using on-road video observations of drivers 61 andolder, Staplin et al. (1998) observed that visual scanning errorsat intersections were common.
Although it is well established that intersection crashes aremore prevalent among older drivers, less is known about the cir-cumstances leading up to the crash. Much of what is known aboutolder drivers’ intersection crashes is from analysis of crash datafiles (Griffin, 2004), on-site crash investigations (Oxley et al.,2006), or on-road video observations (Staplin et al. 1998). Togain a richer understanding of the factors leading to intersec-tion crashes, in-depth interviews were conducted with driversin Connecticut who were at fault in non-fatal injury crashes atintersections. The present study examined these crashes with re-gard to differences in crash types for two groups of older drivers(ages 70–79 and 80 and older) and a comparison group of driversages 35–54. A primary goal was to determine the types of drivererrors that lead to these crashes.
METHODS
Connecticut is similar to the United States as a whole in termsof the proportion of people 70 and older and older drivers’ crash
statistics. Data from the U.S. Census Bureau (2006) indicate theproportion of the population 70 and older in 2000 was 10 percentin Connecticut and 9 percent nationally. The proportion of fatalcrashes involving drivers 70 and older also was similar (9 percentin Connecticut, 10 percent nationally), as was the proportion ofthese crashes occurring at intersections (4 percent in Connecticutand nationally; National Highway Traffic Safety Administration,2006). A benefit of doing the study in Connecticut was thatpolice identify a single factor for a crash and assign it to one ofthe drivers. This assignment was the basis for determining faultfor the crash. Another benefit was the ability to obtain copiesof police crash reports in a timely enough fashion that driverswould be interviewed soon after the crash occurred.
Crashes occurring between August 2003 and October 2004were identified from reports submitted by police agencies to theConnecticut Department of Transportation for the two groupsof older drivers (ages 70–79 and 80 and older) and the com-parison group of drivers ages 35–54. Reports were obtainedfor crashes coded as occurring at intersections on public roads.Only crash reports indicating that at least one occupant sus-tained a nonfatal injury were included. Crashes with fatal in-juries were excluded because the severity of the crash mightpreclude driver interviews. All injury crashes must be reportedby police to the Department of Transportation, whereas moreleeway is allowed with property damage–only crashes. Hence,the study excluded property damage–only crashes because theyare believed to be less completely reported than those involvinginjuries. All crashes of older drivers meeting these criteria wereincluded, and 25 percent of qualifying crashes for the compari-son group were randomly selected to maintain equivalent samplesizes among the age groups. Photographs of intersections weretaken for crashes included in the study.
Crash reports were obtained twice weekly. Phone numberswere obtained from Internet telephone book searches usingdrivers’ names and addresses. Only drivers for whom phonenumbers were obtained remained in the sample.
Initially, comparisons among older drivers were planned be-tween at-fault and not-at-fault drivers. However, the first 41 inter-views with not-at-fault older drivers proved to be uninformative,generally because the drivers had not made a driving error, andso they were discontinued.
Telephone Interviews
All interviews occurred within 3–10 weeks of the crash (mean =6.7 weeks). The interviewer reviewed the crash report and pho-tographs of the intersection prior to the interview. A semistruc-tured interview instrument was used to gather detailed accountsof each crash, particularly the events immediately prior to thecrash. All interviews were audiotaped with driver permission.Three percent of interviewed drivers declined to be recorded,and 3 percent of taped interviews were unusable (e.g., recordermalfunctioned). In these instances, coding was based on the in-terviewer’s detailed summary of the conversation. Almost all(95 percent) of the interviews were conducted by a single inter-viewer. The remaining 5 percent were conducted by two differentinterviewers.
Dow
nloa
ded
by [
Nip
issi
ng U
nive
rsity
] at
07:
52 1
8 O
ctob
er 2
014
FACTORS LEADING TO OLDER DRIVERS’ INTERSECTION CRASHES 269
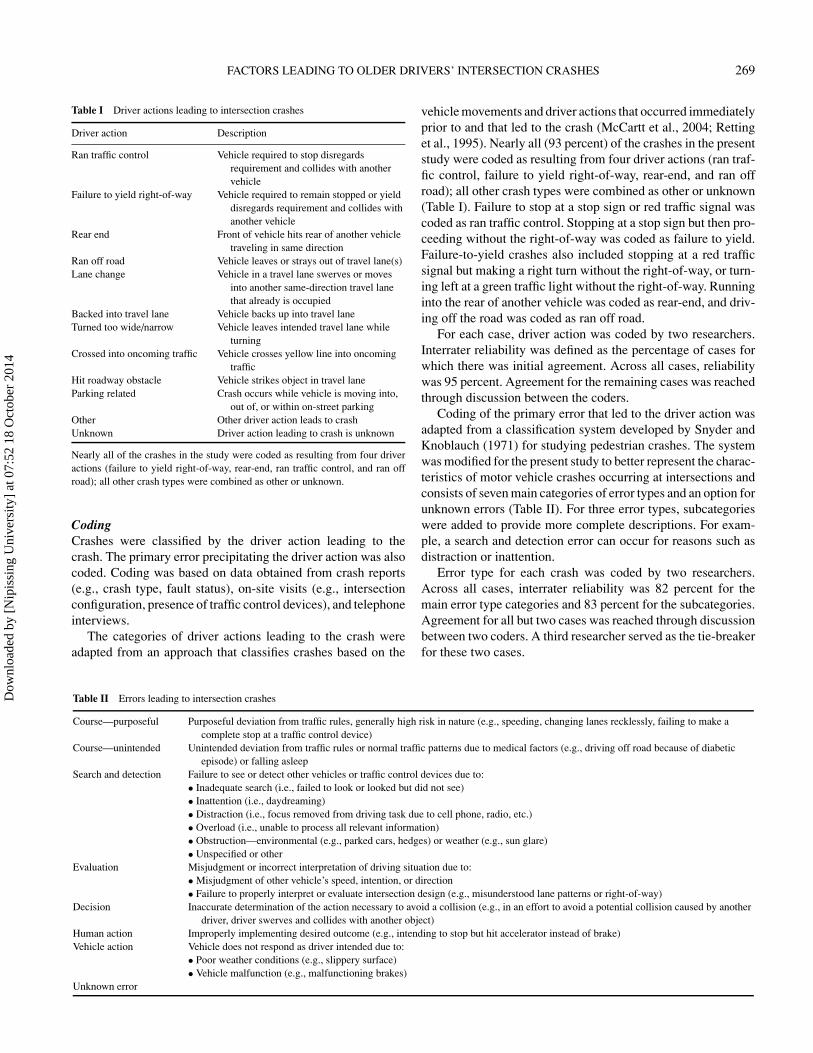
Table I Driver actions leading to intersection crashes
Driver action Description
Ran traffic control Vehicle required to stop disregardsrequirement and collides with anothervehicle
Failure to yield right-of-way Vehicle required to remain stopped or yielddisregards requirement and collides withanother vehicle
Rear end Front of vehicle hits rear of another vehicletraveling in same direction
Ran off road Vehicle leaves or strays out of travel lane(s)Lane change Vehicle in a travel lane swerves or moves
into another same-direction travel lanethat already is occupied
Backed into travel lane Vehicle backs up into travel laneTurned too wide/narrow Vehicle leaves intended travel lane while
turningCrossed into oncoming traffic Vehicle crosses yellow line into oncoming
trafficHit roadway obstacle Vehicle strikes object in travel laneParking related Crash occurs while vehicle is moving into,
out of, or within on-street parkingOther Other driver action leads to crashUnknown Driver action leading to crash is unknown
Nearly all of the crashes in the study were coded as resulting from four driveractions (failure to yield right-of-way, rear-end, ran traffic control, and ran offroad); all other crash types were combined as other or unknown.
Coding
Crashes were classified by the driver action leading to thecrash. The primary error precipitating the driver action was alsocoded. Coding was based on data obtained from crash reports(e.g., crash type, fault status), on-site visits (e.g., intersectionconfiguration, presence of traffic control devices), and telephoneinterviews.
The categories of driver actions leading to the crash wereadapted from an approach that classifies crashes based on the
Table II Errors leading to intersection crashes
Course—purposeful Purposeful deviation from traffic rules, generally high risk in nature (e.g., speeding, changing lanes recklessly, failing to make acomplete stop at a traffic control device)
Course—unintended Unintended deviation from traffic rules or normal traffic patterns due to medical factors (e.g., driving off road because of diabeticepisode) or falling asleep
Search and detection Failure to see or detect other vehicles or traffic control devices due to:• Inadequate search (i.e., failed to look or looked but did not see)• Inattention (i.e., daydreaming)• Distraction (i.e., focus removed from driving task due to cell phone, radio, etc.)• Overload (i.e., unable to process all relevant information)• Obstruction—environmental (e.g., parked cars, hedges) or weather (e.g., sun glare)• Unspecified or other
Evaluation Misjudgment or incorrect interpretation of driving situation due to:• Misjudgment of other vehicle’s speed, intention, or direction• Failure to properly interpret or evaluate intersection design (e.g., misunderstood lane patterns or right-of-way)
Decision Inaccurate determination of the action necessary to avoid a collision (e.g., in an effort to avoid a potential collision caused by anotherdriver, driver swerves and collides with another object)
Human action Improperly implementing desired outcome (e.g., intending to stop but hit accelerator instead of brake)Vehicle action Vehicle does not respond as driver intended due to:
• Poor weather conditions (e.g., slippery surface)• Vehicle malfunction (e.g., malfunctioning brakes)
Unknown error
vehicle movements and driver actions that occurred immediatelyprior to and that led to the crash (McCartt et al., 2004; Rettinget al., 1995). Nearly all (93 percent) of the crashes in the presentstudy were coded as resulting from four driver actions (ran traf-fic control, failure to yield right-of-way, rear-end, and ran offroad); all other crash types were combined as other or unknown(Table I). Failure to stop at a stop sign or red traffic signal wascoded as ran traffic control. Stopping at a stop sign but then pro-ceeding without the right-of-way was coded as failure to yield.Failure-to-yield crashes also included stopping at a red trafficsignal but making a right turn without the right-of-way, or turn-ing left at a green traffic light without the right-of-way. Runninginto the rear of another vehicle was coded as rear-end, and driv-ing off the road was coded as ran off road.
For each case, driver action was coded by two researchers.Interrater reliability was defined as the percentage of cases forwhich there was initial agreement. Across all cases, reliabilitywas 95 percent. Agreement for the remaining cases was reachedthrough discussion between the coders.
Coding of the primary error that led to the driver action wasadapted from a classification system developed by Snyder andKnoblauch (1971) for studying pedestrian crashes. The systemwas modified for the present study to better represent the charac-teristics of motor vehicle crashes occurring at intersections andconsists of seven main categories of error types and an option forunknown errors (Table II). For three error types, subcategorieswere added to provide more complete descriptions. For exam-ple, a search and detection error can occur for reasons such asdistraction or inattention.
Error type for each crash was coded by two researchers.Across all cases, interrater reliability was 82 percent for themain error type categories and 83 percent for the subcategories.Agreement for all but two cases was reached through discussionbetween two coders. A third researcher served as the tie-breakerfor these two cases.
Dow
nloa
ded
by [
Nip
issi
ng U
nive
rsity
] at
07:
52 1
8 O
ctob
er 2
014
270 K. A. BRAITMAN ET AL.
RESULTS
Sample
There were 903 crash reports meeting inclusion criteria for at-fault crashes. Phone numbers were obtained for 398 drivers(44 percent)—162 of 544 drivers ages 35–54 (30 percent),130 of 214 drivers ages 70–79 (61 percent), and 106 of 145drivers 80 and older (73 percent). Interviews were completedfor 227 drivers (73 drivers ages 35–54, 78 drivers ages 70–79,and 76 drivers 80 and older). Among drivers for whom phonenumbers were obtained, the proportion who were contacted andagreed to be interviewed was highest for drivers 80 and older(72 percent) and lowest for drivers ages 35–54 (45 percent). Foreach age group, comparisons were made between interviewedand noninterviewed drivers based on gender, collision type, andcontributing factor (e.g., driving too fast for conditions, follow-ing too closely) as indicated on police crash reports. Amongdrivers 80 and older, 64 percent of those interviewed were malecompared with 43 percent of those not interviewed (χ2(1) = 4.0,p = 0.047). No other significant differences among the three agegroups were found.
Driver Actions Leading to Crashes
The distribution of driver actions leading to intersection crashesby age group for interviewed drivers is shown in Table III. Forall age groups combined, the most frequently occurring driveractions were failure to yield right-of-way (40 percent) and rear-end (38 percent). Failure-to-yield crashes occurred when driversproceeded when they were required to yield the right-of-way(i.e., proceeded at a stop sign after stopping, turned left at a greenlight, or turned right at a red light). All ran-off-road crashes in-volved single vehicles, and crashes resulting from all other driveractions involved two (91 percent) or three (9 percent) vehicles.
There was a significant relationship between age group anddriver action (χ2(10) = 35.7, p < 0.001; Table III). The oldestdrivers (80 and older) were significantly less likely than driversin the other two age groups combined to have rear-end crashes(χ2(1) = 6.5, p = 0.01). Drivers ages 35–54 were more likelythan older drivers in both age groups combined (ages 70–79 and80 and older) to have ran-off-road crashes (χ2(1) = 16.5, p <
0.001). There also was a significant age effect among drivers whofailed to yield the right-of-way; the proportion of these crashesincreased incrementally with age (χ2(2) = 16.2, p < 0.001).
Table III Percent distribution of driver action by age group
Drivers Drivers Driversages 35–54 ages 70–79 ages 80+(n = 73) (n = 78) (n = 76) Total
Ran traffic control 8 8 7 8Rear-end 45 42 26 38Failure to yield 26 37 58 40
right-of-wayRan off road 18 4 1 8Other 1 9 5 5Unknown 1 0 3 1
Total 100 100 100 100
Table IV Percent distribution of driver action by type of traffic control
Stop sign Traffic signal No traffic control(n = 75) (n = 87) (n = 52)
Ran traffic control 7 15 0Rear-end 17 52 40Failure to yield
right-of-way 67 23 35Ran off road 5 2 17Other 3 6 8
Total∗ 100 100 100
∗Total includes unknown driver actions.
Intersection Characteristics
The distribution of driver actions leading to intersection crasheswas consistent across intersection configurations (e.g., four-wayintersection, T intersection) but varied by type of traffic control(χ2(25) = 79.8, p < 0.001; Table IV). Failure-to-yield crasheswere most common (67 percent) at stop sign–controlled inter-sections, but rear-end crashes were most common (52 percent)at signalized intersections. These patterns generally were con-sistent across age groups.
Across all age groups, most failure-to-yield crashes (59 per-cent) occurred at stop sign–controlled intersections. Twenty-twopercent of failure-to-yield crashes occurred at signalized inter-sections, and 20 percent occurred when no traffic control waspresent for the at-fault driver (i.e., driver turned left in front ofoncoming traffic).
Overall, most failure-to-yield crashes (70 percent) occurredwhen drivers were turning left. Traveling straight accounted for18 percent of failure-to-yield crashes overall, and turning rightaccounted for 5 percent, although the direction of travel variedby type of traffic control. At traffic signals, 95 percent of crashesoccurred when drivers were turning left and 5 percent occurredwhen drivers were turning right. At stop signs, 50 percent ofcrashes occurred when drivers were turning left, 31 percent whendrivers were traveling straight, and 7 percent when drivers wereturning right; the remaining crashes were unknown (9 percent) oroccurred when drivers were reversing (2 percent; χ2(8) = 24.8,p = 0.002).
Almost all rear-end crashes (98 percent) occurred whendrivers were traveling straight, and most (81 percent) occurredbefore the intersection. Seventy-two percent of ran-traffic-control crashes occurred at signalized intersections, and 67 per-cent occurred when drivers were traveling straight.
Error Type
The distribution of error types by driver action is shown in Ta-ble V. For all driver action types combined, search and detectionerrors were most frequent (51 percent), followed by evaluationerrors (28 percent). However, there was a significant relation-ship between the type of error and driver action (χ2(35) = 240,p < 0.001). Although search and detection errors were mostfrequent for crashes involving ran traffic control (77 percent)and failure to yield the right-of-way (76 percent), for rear-endcrashes evaluation errors (47 percent) were most common, fol-lowed by search and detection errors (28 percent). Ran-off-road
Dow
nloa
ded
by [
Nip
issi
ng U
nive
rsity
] at
07:
52 1
8 O
ctob
er 2
014
FACTORS LEADING TO OLDER DRIVERS’ INTERSECTION CRASHES 271
Table V Percent distribution of error types by driver action
Ran traffic Rear end Failure to yield Ran off road Other Total∗control (n = 17) (n = 86) right-of-way (n = 92) (n = 17) (n = 12) (n = 227)
Course—purposeful 24 2 2 0 25 5Course—unintended 0 0 0 24 0 2Search and detection 77 28 76 18 42 51Evaluation 0 47 20 12 25 28Decision 0 0 0 6 0 <1Human action 0 13 0 6 0 5Vehicle action 0 6 0 29 0 4Unknown 0 5 2 6 8 5
Total 100 100 100 100 100 100
∗Total includes unknown driver actions.
crashes were due most frequently to vehicle handling errors (e.g.,sliding on slippery surface; 29 percent) or unintended course(24 percent).
The distribution of error types by age group is shown inTable VI. There was a significant relationship between the typeof error and age group (χ2(14) = 50.7, p < 0.001). The oldestdrivers (80 and older) made significantly more search and detec-tion errors (e.g., looked but did not see) than drivers in the othertwo age groups combined (35–54 and 70–79) (χ2(1) = 19.0,p < 0.001). Drivers ages 70–79 made significantly more evalu-ation errors (e.g., thought there was time to proceed in front ofanother vehicle) than drivers in the other two age groups com-bined (35–54 and 80 and older) (χ2(1) = 17.4, p < 0.001), andabout 90 percent of these errors involved misjudging anothervehicle’s actions (e.g., did not expect vehicle to stop, thoughtvehicle was going slower) rather than misjudging intersectiondesign (e.g., misunderstanding lane patterns). Drivers ages 35–54 made more unintended course errors (χ2(2) = 8.6, p = 0.01)and vehicle action errors (χ2(2) = 16.2, p < 0.001) than olderdrivers in both age groups combined (70–79 and 80 and older).Almost all of the vehicle handling errors were made by driversages 35–54 and involved sliding on slippery roads.
The relationship between error type and driver age was ex-amined for the two largest categories of driver actions—failureto yield right-of-way and rear-end crashes (Table VII). Althoughsample size limitations precluded statistical tests for these analy-ses, the patterns were consistent. For both types of driver action,search and detection errors were more common among drivers
Table VI Percent distribution of error types by age group
Drivers Drivers Driversages 35–54 ages 70–79 ages 80+(n = 73) (n = 78) (n = 76)
Course—purposeful 5 5 4Course—unintended 5 0 0Search and detection 45 36 71Evaluation 22 45 16Decision 1 0 0Human action 4 8 4Vehicle action 12 1 0Unknown error 4 5 5
Total 100 100 100
ages 35–54 and 80 and older than among drivers ages 70–79. Incontrast, evaluation errors were made more frequently by driversages 70–79 than by drivers ages 35–54 or 80 and older.
Search and Detection Errors
Of the three main error types with subcategories, only search anddetection errors had sufficient sample sizes within the subcate-gories for analysis by age group. The distribution of the searchand detection error types by age group is shown in Table VIII.Although search and detection errors overall occurred most fre-quently among the oldest drivers (80 and older) and driversages 35–54 (71 and 45 percent, respectively) the distributionof these errors among the subcategories was somewhat differ-ent. Inadequate search errors (i.e., did not see the other vehicle ortraffic control) increased significantly with age (χ2(1) = 11.5,p < 0.01), accounting for 27 percent of search and detection er-rors among drivers ages 35–54 and 65 percent among drivers
Table VII Percent distribution of error types by age group for failure toyield right-of-way and rear-end crashes
Drivers Drivers Driversages 35–54 ages 70–79 ages 80+
Failure to yield right-of-way (n = 19) (n = 29) (n = 44)Course—purposeful 5 0 2Course—unintended 0 0 0Search and detection 84 55 86Evaluation 5 41 12Decision 0 0 0Human action 0 0 0Vehicle action 0 0 0Unknown error 5 3 0
Total 100 100 100
Rear end (n = 33) (n = 33) (n = 20)Course—purposeful 3 3 0Course—unintended 0 0 0Search and detection 30 18 40Evaluation 42 58 35Decision 0 0 0Human action 9 8 4Vehicle action 12 3 0Unknown error 3 3 10
Total 100 100 100
Dow
nloa
ded
by [
Nip
issi
ng U
nive
rsity
] at
07:
52 1
8 O
ctob
er 2
014
272 K. A. BRAITMAN ET AL.
Table VIII Percent distribution of search and detection error types by agegroup
Drivers Drivers Driversages 35–54 ages 70–79 ages 80+(n = 33) (n = 28) (n = 54)
Inadequate search 27 50 65Inattention 18 18 11Distraction 27 11 9Overload 0 0 6Obstruction 21 21 7Unspecified 6 0 2
Total 100 100 100
80 and older. Distraction errors were a factor more often amongyounger drivers (27 percent) than among older drivers in both agegroups combined (11 and 9 percent, respectively; χ2(1) = 5.7,p = 0.02).
DISCUSSION
The overinvolvement of older drivers in intersection crashesis well documented (Mayhew et al., 2006), but less is knownabout the factors leading up to the event. The present studywent beyond police crash reports; photographs of the inter-section were obtained and at-fault drivers were interviewedabout their crashes to gain a better understanding of crashprecursors.
Failure to yield the right-of-way or running into the rear ofanother vehicle accounted for more than three fourths of at-faultintersection crashes for all age groups combined, but there weresignificant differences among age groups. The oldest drivers (80and older) experienced fewer rear-end crashes than drivers in theother two age groups, and both groups of older drivers had fewerran-off-road crashes than drivers ages 35–54. Failure-to-yieldcrashes increased with age and accounted for more than half ofthe crashes involving drivers 80 and older. Other studies alsohave found that the most common error made by older driversis failure to yield the right-of-way (Aizenberg and McKenzie,1997; Finison and Dubrow, 2002; Griffin, 2004; Kostyniuk et al.,2003; McGwin and Brown, 1999; Staplin et al., 1998; Zuckieret al., 1999).
Failure-to-yield crashes occurred most often when driverswere turning left and occurred more frequently at stop signsthan at signalized intersections. Failure-to-yield crashes at traf-fic signals were coded only for drivers turning left or right (go-ing straight through a red light was coded as ran traffic control),whereas failure-to-yield crashes at stop signs were coded fordrivers traveling straight as well as turning left or right. How-ever, even among failure-to-yield crashes when drivers wereturning left or right, a greater percentage occurred at stop signs(45 percent) than at signalized intersections (29 percent). Pre-vious research has shown that failing to yield accounts for agreater proportion of crashes at stop sign–controlled intersec-tions than at signalized intersections (Campbell et al., 2004). As
in the current study, numerous studies also have found that moreintersection crashes among older drivers occur at stop signs thanat traffic signals (e.g., Oxley et al., 2006; Preusser et al., 1998;Viano and Ridella, 1996).
The reasons drivers failed to yield the right-of-way variedby age. Compared with drivers of other ages, drivers ages 70–79 made more evaluation errors in failure-to-yield crashes, andthese errors generally occurred when drivers saw the other ve-hicles but misjudged whether there was enough time to pro-ceed. Hakamies-Blomqvist (1993) speculated that “what mightseem like a faulty observation estimation of the oncoming ve-hicle’s position or speed could as well be a faulty estimate ofthe time needed for the driver’s own actions.” Among drivers 80and older, search errors (e.g., looking but not seeing) predomi-nated in failure-to-yield crashes. This supports earlier researchby Staplin et al. (1998) that found that older drivers have prob-lems adequately scanning busy intersections. Search errors alsowere a large factor in failure-to-yield crashes among driversages 35–54, but their search errors were due more often todistraction.
Among the oldest drivers, failure to see other vehicles may bedue to age-related declines in visual ability or decreased ability toprocess multiple sources of information simultaneously. Visionimpairments increase rapidly with older age, particularly afterage 75 (Friedman et al., 2002). Useful field of view, a measure ofvisual processing speed and divided attention, has been found tobe a significant predictor of future crashes and tends to decreasewith age (Sekuler and Ball, 1986; Sekuler et al., 2000). Rangesof head movements also have been found to decrease with ageand can hinder a driver’s ability to see other vehicles beyondcertain distances (Isler et al., 1997).
Results from the present study should be interpreted in lightof several limitations. First, there was no information on thetypes of roads on which subjects drove or with what frequency,so it could not be determined whether age group differences inerrors were due to differences in exposure or to fundamental agegroup differences in the types of errors made.
Regarding the study sample, a larger percentage of phonenumbers were obtained for older drivers than for the compari-son group of middle-aged drivers. Participation rates also variedamong age groups in that older drivers were much more likelyto agree to be interviewed, so volunteer bias cannot be ruled outas a source of confounding. However, there were no significantdifferences between interviewed and noninterviewed drivers forwhom phone numbers were obtained as a function of collisiontype or factors contributing to the crash as indicated on the policecrash reports.
Given the projected increase in the population of older driversin the coming years, it will become increasingly important toadopt countermeasures to reduce the frequency and severityof their intersection crashes. Failure to yield the right-of-waywas the predominant driver action contributing to intersectioncrashes among drivers of all ages, but especially older drivers.
Findings from this study point to several potential coun-termeasures for reducing older drivers’ intersection crashes.
Dow
nloa
ded
by [
Nip
issi
ng U
nive
rsity
] at
07:
52 1
8 O
ctob
er 2
014
FACTORS LEADING TO OLDER DRIVERS’ INTERSECTION CRASHES 273
Roundabouts may help reduce failure-to-yield crashes fordrivers of all ages because drivers entering a roundabout needonly to look in one direction rather than to evaluate trafficfrom multiple directions. Others have suggested that round-abouts may be a potential solution for intersection crashes amongolder drivers (Oxley et al., 2006). Roundabouts can reducecrashes of all severities by 40 percent and injury crashes by80 percent (Persaud et al., 2001). However, no studies have fo-cused on the effectiveness of roundabouts among older drivers,who may find them difficult to navigate. Research from fo-cus groups and structured interviews with drivers ages 65 andolder suggests that providing older drivers with informationabout direction of traffic movement and how to enter and exitroundabouts will encourage them to choose routes with round-abouts as opposed to conventional intersections (Lord et al., inpress).
At signalized intersections, protected left turn lanes withgreen arrows would eliminate the need for drivers to detect on-coming traffic and judge whether there is available time to turnin front of another vehicle. Bagdade (2004) found that low-costmodifications implemented at intersections, including dedicatedleft turn lanes, resulted in a 13 percent greater reduction in injurycrashes per licensed driver for drivers 65 and older comparedwith drivers ages 25-64.
Crash avoidance technologies (e.g., systems that warn driverswhen it is unsafe to enter an intersection or that provide earlierwarning about the actions of other vehicles) have been sug-gested as means for reducing crashes, particularly those oc-curring at intersections (Hanowski et al., 1995; Parel, 1998;Viano, 1999). However, some researchers caution that olderdrivers may not be able to use these systems as effectively asyounger drivers for a variety of reasons including distraction,confusion, information overload, panic response, or an inabilityto respond quickly enough (Hanowski et al., 1995; Parel, 1998).There is preliminary evidence that rear-end collision avoidancesystems may potentially help to reduce rear-end crashes fordrivers of all ages (Najm et al., 2006), although these systemshave not been thoroughly investigated using real-world crashdata.
Driver retraining and screening tests for functional impair-ments have often been suggested as ways to reduce older drivers’crashes. However, studies of older driver improvement programsor educational initiatives have not been shown to reduce subse-quent crashes among participants relative to comparison groups(Janke, 1994; Kelsey and Janke, 2005; McKnight et al., 1982;Owsley et al., 2004). Some states have studied screening tests toidentify unsafe drivers and findings have been mixed (Ball et al.,2006; Hennessy and Janke, 2005; Langford et al., 2004); it is notclear whether screening tests are sufficiently sensitive to predictfuture crash risk with the accuracy that would be required tojustify suspending license privileges.
Because of the rising numbers of older drivers and their in-creased involvement in intersection crashes, researchers needto address the specific types of problems older drivers experi-ence at intersections and continue to develop countermeasuresto address these needs.
ACKNOWLEDGEMENT
The authors gratefully acknowledge Anne McCartt andAdrian Lund of the Insurance Institute for Highway Safety fortheir helpful reviews and suggestions. This work was supportedby the Insurance Institute for Highway Safety.
REFERENCES
Aizenberg R, McKenzie DM. (1997) Teen and Senior Drivers, Re-port no. CAL-DMV-RSS-93-168, California Department of MotorVehicles, Research and Development Section, Sacramento, CA.
Bagdade JS. (2004) Low Cost Intersection Improvements ReduceCrashes for Senior Drivers, 2004 ITE Annual Meeting and ExhibitCompendium of Technical Papers (CD-ROM), Institute of Trans-portation Engineers, Washington, DC.
Ball, KK, Roenker DL, Wadley VG, Edwards JD, Roth DL, McGwin JrG, Raleigh R, Joyce JJ, Cissell GM, Dube T. (2006) Can High-RiskOlder Drivers Be Identified Through Performance-Based Measuresin a Department of Motor Vehicles Setting? Journal of the AmericanGeriatrics Society, Vol. 54, pp. 77–84.
Caird JK, Edwards CJ, Creaser JI, Jorrey WJ. (2005) Older DriverFailures of Attention at Intersection: Using Change Blindness Meth-ods to Assess Turn Decision Accuracy, Human Factors, Vol. 47,pp. 235–249.
Campbell BN, Smith JD, Najm WG. (2004) Analysis of Fatal CrashesDue to Signal and Stop Sign Violations, Report no. DOT HS-809-779. National Highway Traffic Safety Administration, Washington,DC.
Chandraratna S, Mitchell L, Stamatiadis N. (2002) Evaluation of theTransportation Safety Needs of Older Drivers, Department of CivilEngineering, University of Kentucky, Lexington, KY.
Chandraratna S, Stamatiadis N. (2003) Problem Driving Maneuversof Elderly Drivers, Transportation Research Record, Vol. 1843,pp. 89–95.
Finison KS, Dubrow RB. (2002) A Comparison of Maine CrashesInvolving Older Drivers, Report no. DOT HS-809-407. NationalHighway Traffic Safety Administration, Washington, DC.
Friedman DS, Congdon N, Kempen JM, Tielsch JM. (2002) VisionImpairments in the U.S.: Prevalence of Adult Vision Impairment andAge-Related Eye Disease in America, National Institutes of Health,Bethesda, MD.
Griffin LI III. (2004) Older Driver Involvement in Injury Crashes inTexas, 1975–1999, AAA Foundation for Traffic Safety, Washington,DC.
Hakamies-Blomqvist LE. (1993) Fatal Accidents of Older Drivers, Ac-cident Analysis and Prevention, Vol. 25, pp. 19–27.
Hanowski RJ, Bittner AC, Knipling RR, Byrne EA, Parasuraman R.(1995) Analysis of Older Driver Safety Interventions: A Human Fac-tors Taxonomic Approach, Proceedings of the ITS America Confer-ence, pp. 955–965, ITS America, Washington, DC.
Hennessy DF, Janke MK. (2005) Clearing a Road to Driving Fitnessby Better Assessing Driving Wellness; Development of California’sProspective Three-Tier Driving-Centered Assessment System, Re-port no. CAL-DMV-RSS-05–215. California Department of MotorVehicles, Office of Traffic Safety, Sacramento, CA.
Highway Loss Data Institute. (2005) Insurance Special Report (A-70):Insurance Losses by Driver Age, Arlington, VA.
Insurance Institute for Highway Safety. (2006a) Q&A: Older People(as of May 2005). Arlington, VA. Available at: http://www.iihs.org/research/qanda/older people.html.
Dow
nloa
ded
by [
Nip
issi
ng U
nive
rsity
] at
07:
52 1
8 O
ctob
er 2
014
274 K. A. BRAITMAN ET AL.
Insurance Institute for Highway Safety. (2006b) Fatality Facts 2005:Older People. Arlington, VA. Available at: http://www.iihs.org/research/fatality facts/olderpeople.html.
Isler RB, Parson BS, Hansson GJ. (1997) Age Related Effects of Re-stricted Head Movements on the Useful Field of View of Drivers,Accident Analysis and Prevention, Vol. 6, pp. 793–801.
Janke MK. (1994) Age-Related Disabilities That May Impair Drivingand Their Assessment: Literature Review, Report no. RSS-94-156.Research and Development Section, California Department of MotorVehicles, Sacramento, CA.
Janke MK. (1994) The Mature Driver Improvement Program in Cali-fornia, Transportation Research Record Vol. 1438, pp. 77–83.
Kahn HA, Leibowitz HM, Ganley JP, Kini MM, Colton T, Nicker-son RS, Dawber TR. (1977) The Framingham Eye Study; I. Outlineand Major Prevalence Findings, American Journal of Epidemiology,Vol. 106, pp. 17–32.
Kelsey SL, Janke MK (2005) Pilot Educational Outreach to High-Risk Elderly Drivers, Report no. CAL-DMV-RSS-05-213, CaliforniaDepartment of Motor Vehicles, Office of Traffic Safety, Sacramento,CA.
Kostyniuk LP, Eby DW, Miller LL. (2003) Crash Trends of OlderDrivers in Michigan: 1998–2002, Report no. UMTRI-2003-22,University of Michigan Transportation Research Institute, AnnArbor, MI.
Langford J, Fitzharris M, Newstead S, Koppell S. (2004) Some Conse-quences of Different Older Driver Licensing Procedures in Australia,Accident Analysis and Prevention, Vol. 36, pp. 993–1001.
Li G, Braver ER, Chen L-H. (2003) Fragility versus Excessive CrashInvolvement as Determinants of High Death Rates per Vehicle-Mileof Travel among Older Drivers, Accident Analysis and Prevention,Vol. 35, pp. 227–235.
Lord D, van Schalkwyk I, Chrysler S, Staplin L. (in press) A Strategyto Reduce Older Driver Injuries at Intersections Using More Ac-commodating Roundabout Design Practices, Accident Analysis andPrevention.
Lyman S, Ferguson SA, Braver ER, Williams AF. (2002) Older DriverInvolvements in Police Reported Crashes and Fatal Frashes: Trendsand Projections, Injury Prevention, Vol. 8, pp. 116–120.
Massie DL, Campbell KL, Blower DF. (1993) Development of a Col-lision Typology for Evaluation of Collision Avoidance Strategies,Accident Anaysis and Prevention, Vol. 3, pp. 241–257.
Mayhew DR, Simpson HM, Ferguson SA. (2006) Collisions InvolvingSenior Drivers: High-Risk Conditions and Locations, Traffic InjuryPrevention, Vol. 7, pp. 117–124.
McCartt AT, Shabanova Northrup V, Retting RA. (2004) Types andCharacteristics of Ramp-Related Motor Vehicle Crashes on Urban In-terstate Roadways in Northern Virginia, Journal of Safety Research,Vol. 35, pp. 107–114.
McDowd JM. (1986) The Effects of Age and Extended Practiceon Divided Attention, Journal of Gerontology, Vol. 41, pp. 764–769.
McGwin G Jr, Brown DB. (1999) Characteristics of Traffic Crashesamong Young, Middle-Aged, and Older Drivers, Accident Analysisand Prevention, Vol. 31, pp. 181–198.
McKnight AJ, Simone GA, Weidman JR. (1982) Elderly Driver Re-training, Report no. DOT HS-806-336, National Highway TrafficSafety Administration, Washington, DC.
Najm WG, Stearns MD, Howarth H, Koopmann J, Hitz J. (2006) Evalu-ation of an Automotive Rear-End Collision Avoidance System, Reportno. DOT-HS-810-569, National Highway Traffic Safety Administra-tion, Washington, DC.
National Highway Traffic Safety Administration. (2006) Fatality Anal-ysis Reporting System, 1998–2001, US Department of Transporta-tion, Washington, DC.
Owsley C, McGwin G, Phillips JM, McNeil SF, Stalvey BT. (2004) Im-pact of an Educational Program on the Safety of High-Risk, VisuallyImpaired, Older Drivers, American Journal of Preventive Medicine,Vol. 26, pp. 222–29.
Oxley J, Fildes B, Corben B, Langford J. (2006) Intersection Designfor Older Drivers, Transportation Research Part F, Vol. 9, pp. 335–346.
Parel M. (1998) Helping Older Drivers Benefit from In-Vehicle Tech-nologies, Proceedings of the 16th International Technical Confer-ence on the Enhanced Safety of Vehicles. pp. 438–444. NationalHighway Traffic Safety Administration, Washington, DC.
Persaud BN, Retting RA, Garder PE, Lord D. (2001) Safety Effectof Roundabout Conversions in the United States: Empirical BayesObservational Before-After Study, Transportation Research Record,Vol. 1751, pp. 1–8.
Preusser DF, Williams AF, Ferguson SA, Ulmer RG, Weinstein HB.(1998) Fatal Crash Risk for Older Drivers at Intersections, AccidentAnalysis and Prevention, Vol. 30, pp. 151–159.
Retting RA, Williams AF, Preusser DF, Weinstein HB. (1995) Clas-sifying Urban Crashes for Countermeasure Development, AccidentAnalysis and Prevention, Vol. 27, pp. 283–294.
Sekuler AB, Bennett PJ, Mamelak M. (2000) Effects of Aging onthe Useful Field of View, Experimental Aging Research, Vol. 26,pp. 103–120.
Sekuler R, Ball K. (1986) Visual Localization: Age and Practice, Jour-nal of the Optical Society of American A, Vol. 3, pp. 864–867.
Snyder MB, Knoblauch RL. (1971) Pedestrian Safety: The Identifica-tion of Precipitating Factors and Possible Countermeasures, Reportno. FH-11-7312, National Highway Traffic Safety Administration,Washington, DC.
Staplin L, Lococo KH, McKnight AJ, McKnight AS, Odenheimer GL.(1998) Intersection Negotiation Problems of Older Drivers; Vol-ume II: Background Synthesis on Age and Intersection Driv-ing Difficulties, National Highway Traffic Safety Administration,Washington, DC.
Tielsch JM, Sommer A, Witt K, Katz J, Royall RM. (1990) Blindnessand Visual Impairment in an American Urban Population—The Bal-timore Eye Survey, Archives of Ophthalmology, Vol. 108, pp. 286–290.
US Census Bureau. (2006) Population Estimates, 2000, Washington,DC.
Viano DC. (1999) Vehicle Action Lights: An Approach to IntersectionCrash Avoidance. Journal of Traffic Medicine, Vol. 28, pp. 49–66.
Viano DC, Ridella S. (1996) Significance of Intersection Crashes forOlder Drivers, SAE Technical Paper Series 960457, pp. 115–121.Society of Automotive Engineers, Warrendale, PA.
Zuckier G, Jacobs L, Thibeault L. (1999) Using Linked Data to Eval-uate Motor Vehicle Crashes Involving Elderly Drivers in Connecti-cut, Report no. DOT HS-808-971, National Highway Traffic SafetyAdministration, Washington, DC.
Dow
nloa
ded
by [
Nip
issi
ng U
nive
rsity
] at
07:
52 1
8 O
ctob
er 2
014