factors in huntington’s disease - university of leicester (2).pdf · factors in huntington’s...
TRANSCRIPT

Interrogating the role of splicing
factors in Huntington’s Disease
Thesis submitted for the degree of Doctor
of Philosophy
University of Leicester
By
Gurdeep Kooner BSc
Department of Genetics
University of Leicester
September 2014

Abstract
Huntington’s disease (HD) is a fatal autosomal dominant neurodegenerative disorder
caused by the expansion of a polyglutamine tract in the huntingtin (HTT) protein.
Given the wide range of cellular interactions involving HTT, pathogenesis is attributed
to both disruption of numerous cellular and metabolic pathways, as well as toxic gain-
of-function effects, most notably a propensity of mutant HTT to misfold and
aggregate. mRNA splicing defects have been observed in several neurological diseases,
though the role of splicing in HD pathogenesis is unclear. A recent genetic modifier
screen in baker’s yeast identified several splicing genes which suppress mutant HTT
toxicity when overexpressed. I initially interrogated these candidate genes in
mammalian cell lines to elucidate the mechanism(s) underlying this protection.
Using HD cell models, I have found that overexpression of these splicing genes reduces
the level of caspase3/7 activation, a mark for apoptosis. Furthermore, while I
observed a mutant HTT-induced impairment of splicing, overexpression of the
suppressors failed to ameliorate this defect. However, using automated aggregation
analyses, these suppressors were found to modulate HTT aggregation dynamics- a
possible mechanism of suppression. I have further interrogated these promising
splicing gene hits in the nematode C. elegans, though the results were inconclusive.
While characterising disease-relevant phenotypes in HD model mice, I uncovered a
robust burrowing defect in these mice, which manifested earlier than impairments in
the more widely-used rota-rod locomotor assay. As such, this test could provide a
means of detecting early behavioural dysfunction in HD mouse models.
Finally I sought to optimise intranasal delivery of lentivirus to the brain, as an
alternative to a stereotactic approach. Our results were incredibly variable yet
promising and with further optimisation, this technique could be a viable alternative
to more invasive methods.
Ultimately my work has provided insight into the modulatory potential of splicing
factors in HD.

Acknowledgements
While the past four years have raced by, writing this thesis has felt like a Sisyphean
task. But as I approach completion, I am reminded of the multitude of people who
have helped me to get to this point.
First and foremost, I would like to thank my two supervisors- Dr Flaviano Giorgini,
whose continued support, guidance and mentorship, coupled with his constant
attempts at humour (one day, you’ll genuinely make me laugh) throughout the four
years, has seen me grow into a bonafide scientist- Professor Giovanna Mallucci, whose
guidance and attention-to-detail has greatly enhanced my research.
I would also like to thank the two postdoctoral researcher who were assigned the
unenviable task of guiding me through the first year of my research, and have endured
endless inane questions throughout the subsequent years. Dr Robert Mason, quite
possibly the smartest man I have ever met, has always been on hand to offer advice
and support, to me and the majority of Department of Genetics. Dr Julie Moreno, the
hardest working person I have ever met, who has remained humble despite publishing
incredible work, and all the while has provided unrivalled guidance throughout my
PhD.
I would also like to thank Dr Mark Halliday and Dr Helois Radford for their support
regarding the C. elegans and in vivo work respectively. By extension, I would like to
thank Colin Molloy, Lucy Onion, Alison Smart, and the other animal technicians who
have helped me with all of the varying aspects of the murine work over the past four
years. I would also like to thank Dr Lucia Pinion for all of her help with the Cellomics
work, who was always on hand to prevent the equipment from “going bananas”. I
would like to acknowledge Dr Kees Strattman and Dr David Read for all of their
support and advice regarding microscopy and Jennifer Edwards for performing all of
the histology work.
Finally, I would like to thank everyone in Lab 106/104 in the Department of Genetics
and Lab 605 in the MRC Toxicology, for making both labs a great place to work.

Abbreviations
AD Alzheimer's disease AD Adenovirus ALS Amyptrophic lateral sclerosis APC Anaphase promoting complex APS Ammonium persulphate ASH Amphid sensory neuron H ASI Amphid sensory neuron I
Aβ-42 β-amyloid peptide BBB Blood brain barrier BC200RNA Brain cytoplasmic RNA 200nt BCL-XL B-cell lymphoma extra-large
BCSF Blood cerebrospinal fluid BDNF Brain-derived neurotrophic factor BS Branch site CBP CREB binding protein ClC-1 Chloride channel 1 CMV Cytomegalovirus CNS Central nervous system CNTF ciliary neurotrophic factor CRNKL1 Crooked neck pre-mRNA splicing factor 1 CSF Cerebrospinal fluid CSTF2 Cleavage stimulatory factor 2 CTD C-terminal domain DM1 Myotonic dystrophy type 1
DMEM Dulbecco's modified eagle media DNA Deoxyribonucleic acid DRH-1 Dicer related helicase 1 DTT Dithiothreitol ECL Enhanced chemiluminescence EFTUD2 Elongation factor Tu GTP binding domain containing 2 EGCG Epigallocatechin-gallate EGFP Enhanced green flourescent protein EGO-1 Enhancer of glip 1 EIPA 5-(N-ethyly-N-isopropyl)-amiloride ERI-1 Enhanced RNAi 1 ESE Exonic splicing enhancer
ESS Exonic splicing silencer EV Empty Vector F1 Barbituric acid-like compound
FTDP-17 Frontotemporal dementia with Parkinsonism linkded to chromosome 17
FTLD Frontotemporal lobar degeneration
GABA Rγ2 γ-aminobutyric acid receptor type A γ2 subunit

GAPDH Glyceraldehyde-3-phosphate dehydrogenase
GFP Green flourescent protein GLT1 Glutamate uptake transportes GLYRα2 α2 subunit of glycine receptor GTP Guanosine triphosphate GYR Glycine-tyrosine-arginine rich HAP1 Huntingtin associated protein 1 HD Huntingtons disease
HEAT Huntingtin, elongation factor 3, regulatory A subunit of phosphatase 2A and TORI
HEK293T Human embryonic kidney cells HIP Huntingtin interacting proteins HNRNPF Heterogeneous ribonucleoprotein F HNRNPK Heteregeneous ribonucleoprotein K
HNRNPQ Heterogeneous ribonucleoprotein Q HNRNPU Heterogeneous ribonucleoprotein U HSF1 Heat shock transcription factor 1
HSF25 Heat shock protein 25 HSP40 Heat shock protein 40 HSP70 Heat shock protein 70 HTT Huntingtin IAA Iso amylalcohol IER3 Immediate early response 3 IFT Intraflagellar transport complex IRES Internal ribosome entry point ISE Intronic splicing enhancer
ISS Intronic splicing silencer KH K homology KMO Kynurenine-3-monoxogenase LB Luria Bertani LMWH Low molecular weight heparin LPS Lipopolysaccharide MAPT Microtubule-associated protein tau MBNL1 Muscleblind-like 1 MCC Mucocillary clearance MCS Multiple cloning site MUB Mushroom body expressed NALP1 Pyrin domain containing 1 NGM Nematode growth media
NLS Nuclear localisation signal NMD Nonsense mediated decay NMDAR N-methyl-D-aspartate receptors NOVA-1 Neuro-oncological ventral antigen 1 NRSE Neuron-restrictive silencer elements ORF Open reading frame PABP Poly(A)-binding protein
PACSIN1 Casein kinase 2 substrate in neurons 1
PBS Phosphate buffered saline PCR Polymerase chain reaction PD Parkinson's disease PGRN Survival factor progranulin PHA Phasmid neuron A PHB Phasmid neuron B PND Paraneoplastic neurological disorders PolyP Polyproline PolyQ Polyglutamine POMA Paraneoplastic opsoclonus myoclonus ataxia PQE-1 PolyQ enhancer 1 PSD-95 Post synaptic density 95 PT Polypyrimidine tract
PTC Premature termination codon RDE-1 RNAi deficient 1 RDE-3 RNAi deficient 3 RDE-4 RNAi deficient 4 REST Repressor element 1 silencing transcription factor RFF-1 RNA-dependent RNA polymerase RFP Red fluorescent protein RISC RNA induced silencing complex RML Rocky Mountains Laboratory RNA Ribonucleic acid RNAPII RNA polymerase II RRM RNA recognition motifs
RRM RNA recognition motifs RTN3 Reticulon 3 RT-PCR Reverse transcriptase polymerase chain reaction SAFA Scaffolding attachment factor A SDS Sodium dodecyl sulphate SEM Standard error of mean SFRS3 Splicing factor arginine serine 3 SH3 Src homology 3 SK Human tropomysosin SMA Spinal muscular atrophy SMN Surivival of motor neuron SNAP-25 Synaptosomal-associated protein, 25kDa SnRNP Small nuclear ribonucleoprotein
SNRPB Small nuclear ribonucleoprotein polypeptide B SOD Superoxide dismutase SP1 Specificity protein 1 SV40 Simian virus 40 TARDBP Tranactivation responsive DNA-binding protein 43 TBE Tris-borate-EDTA TDM tetradecylmaltoside
TEMED Tetramethylethylenediamine
TNF-α Tumour necrosis factor alpha TRKB Tropomyosin receptor kinase B TRN2 Transporter importin 2 TRP Tetratricopeptide TSN-1 Tudor staphylococcal nuclease homolog 1 U2AF U2 auxiliary factor UEA I Ulex europeus agglutinin I VIG-1 Vasa intronic gene 1 VP16 Viral transcriptional activator WGA Wheat germ agglutinin WGA-HRP Horseradish peroxidase conjugated wheat germ agglutinin WT Wild-type WW Tryptophan domain
YAC Yeast artifical chromosome
Table of Contents
Chapter 1
General Introduction
1.1 Introduction
1.11 Huntington’s Disease
1.12 Huntingtin
1.13 Normal HTT function and mutant HTT
1.14 HD and protein homeostasis
1.15 Aggregation dynamics
1.16 mRNA splicing and alternative splicing
1.17 mRNA splicing and neurodegenerative
disease
1.18 Project aims
Chapter 2
In vitro validation and characterisation of splicing factors
2.1 Introduction
2.11 Splicing suppressor genes
2.12 Aims
2.2 Materials and methods
2.21 Materials
2.211 Bacterial strains and cell lines
2.212 Constructs
2.212 Media and agar
2.22 Methods
2.221 Generation of overexpression cell lines
2.222 Validation of splicing gene hits
2.223 Characterisation of splicing gene hits
2.23 Statistics
2.3 Results
2.31 Overexpression of several candidate genetic modifiers
suppresses mutant HTT toxicity in mammalian cells.
1
1
2
5
8
10
13
22
25
27
29
38
39
39
39
40
41
42
42
49
52
55
59
59
2.32 Suppressors are overexpressed and localise in the
nucleus
2.33 Mutant HTT causes a polyQ dependent decline in
splicing efficiency and cell viability
2.34 Overexpression of suppressors fails to ameliorate
polyQ dependent splicing defects
2.35 Overexpression of suppressors alters the aggregation
dynamics of mutant HTT
2.36 Overexpression of suppressors brought about changes
in HTT protein levels
2.37 Quantitative real-time PCR revealed changes in
mutant HTT expression with no variation in HTT copy
number between cell lines.
2.4 Discussion
2.5 Future work
Chapter 3
Exploring the role of splicing genes in Huntington’s disease using C. elegans
3.1 Introduction
3.11 The use of C. elegans as a model organism
3.12 C. elegans and RNAi
3.13 C. elegans and Huntington’s disease
3.14 Aims
3.2 Materials and methods
3.21 Materials
3.211 Bacterial strains and nematode strains
3.212 Constructs
3.212 Media and agar
3.22 Methods
3.3 Results
3.31 HD worms do not exhibit the dye-filling defect
3.32 RNAi knockdown of splicing-related suppressors does not
modulate HD phenotypes
63
68
70
73
76
78
83
86
86
88
92
95
96
96
96
96
97
98
101
101
103
60
3.4 Discussion
3.5 Future work
Chapter 4
Testing new behavioural paradigm s in HD models mice
4.1 Introduction
4.11 The use of mouse models in the study of HD
4.12 HD mouse models
4.13 Knockout mouse models
4.14 Knock-in mouse models
4.15 Transgenic mouse models
4.16 Aims
4.2 Materials and methods
4.21 Materials
4.211 Bacterial strain
4.212 Constructs
4.213 Mouse strain
4.22 Methods
4.221 Genotyping
4.222 Lentiviral construction
4.223 Behavioural tests
4.3 Results
4.31 Knock-in exhibit a rota-rod defect at 14 months
4.32 Activity of HdhQ150 knock-in mice begins to deviate from
wild-type after 12 months
4.33 Homozygous HdhQ150 knock-in mice failed to gain
weight during their life span
4.34 Homozygous HdhQ150 mice display a burrowing defect
at 9 month
4.35 CAG tract in HdhQ150 displayed genomic instability
4.4 Discussion
4.5 Future work
114
114
114
115
116
117
120
121
121
121
123
123
124
124
124
128
129
130
131
133
134
135
136
140
108
112

Chapter 5
Validating intranasal delivery in prion infected mice
5.1 Introduction
5.11 Delivery to the CNS
5.12 Intranasal delivery
5.13 Factors affecting intranasal delivery
5.14 Gene therapy and neurodegenerative diseases
5.15 Aims
5.2 Materials and method
5.21 Material
5.211 Lentiviral constructs
5.212 Mouse models
5.22 Methods
5.3 Results
5.31 GFP expression detected in both the cortex and
hippocampus following intranasal delivery of MW1 or EV
into prion infected hemizygous mice
5.32 The MW1 PRNP knockdown lentiviral constructs failed
to significantly reduce prion levels in C57BL6N wild type mice
5.33 PRNP knockdown increased lifespan and a delayed onset of
spongiosis in prion infected homozygous mice.
5.34 Early intranasal treatment of prion infected hemizygous
revealed a delay in spongiosis though no change in synaptic
protein level changes.
5.35 Lowered lentiviral dose, or the use of chitosan, rifampin
and TMD fail to extend survival of prion infected mice
5.36 Treatment of prion infected hemizygous mice with MW1
at 6, 7 and 8 w.p.i increased survival.
5.4 Discussion
5.5 Future work
141
141
142
146
148
150
153
153
153
153
154
162
162
164
130
131
166
167
172
174
177
182

Chapter 6
Concluding remarks
References
186
188
Tables and Figures
Tables
2.1 Primers for amplification of candidate genetic modifiers.
2.2 Sequencing primers for validation of mouse cDNA
overexpression constructs.
2.3 PCR primers to assess overexpression of candidate modifiers.
2.4 Protein sample dilutions and loading volumes.
2.5 Primers to assess HTT construct expression and copy number.
3.1 Worm orthologues of suppressors and PCR primers.
3.2 Quantitative PCR primers.
4.1 List of genotyping primers and melting temperatures.
4.2 List of primers used cloning of EFTUD2, HNRNPF and HNRNPK
into pLENTI vector.
5.1 Clinical signs of prion disease
5.1 Intranasal enhancers.
5.2 List of RT-PCR primer sequences.
43
47
51
55
57
97
100
124
127
152
155
156
Figures
1.1 Schematic diagram of HTT.
1.2 Putative roles of wildtype and mutant HTT in brain-derived
neurotrophic factor (BDNF) synthesis and transport.
1.2 HTT aggregation dynamics.
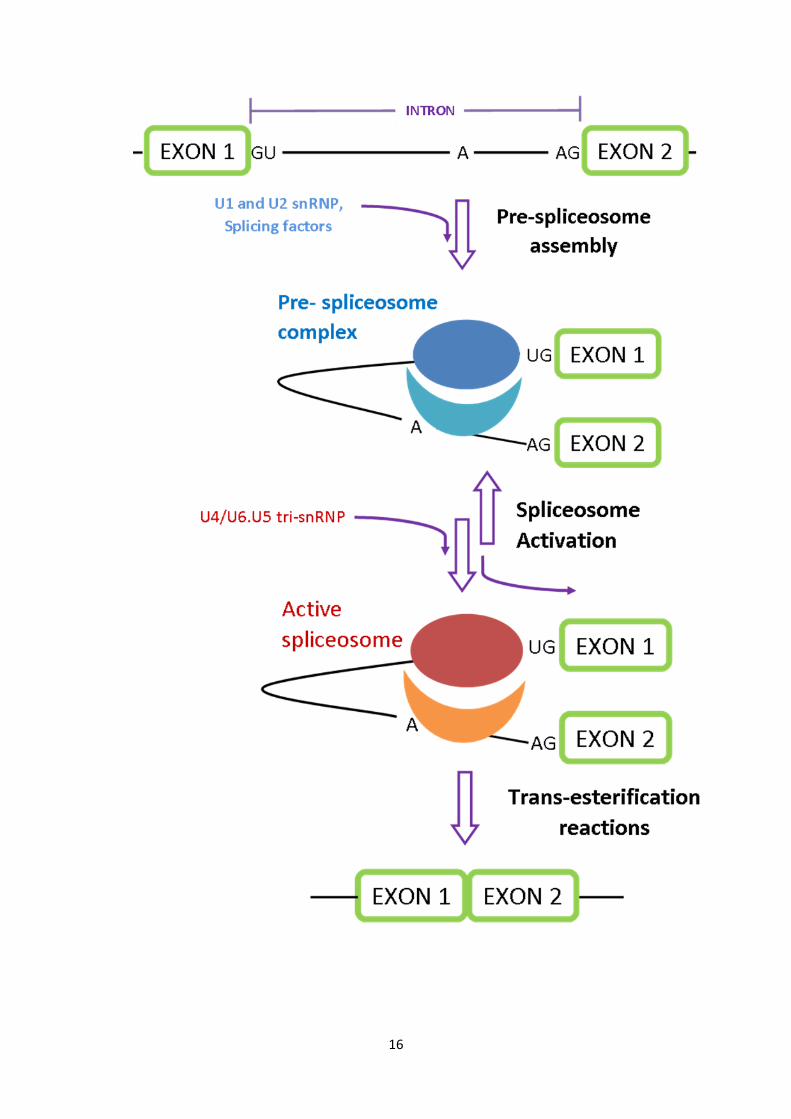
1.3 Pre-mRNA splicing mechanism.
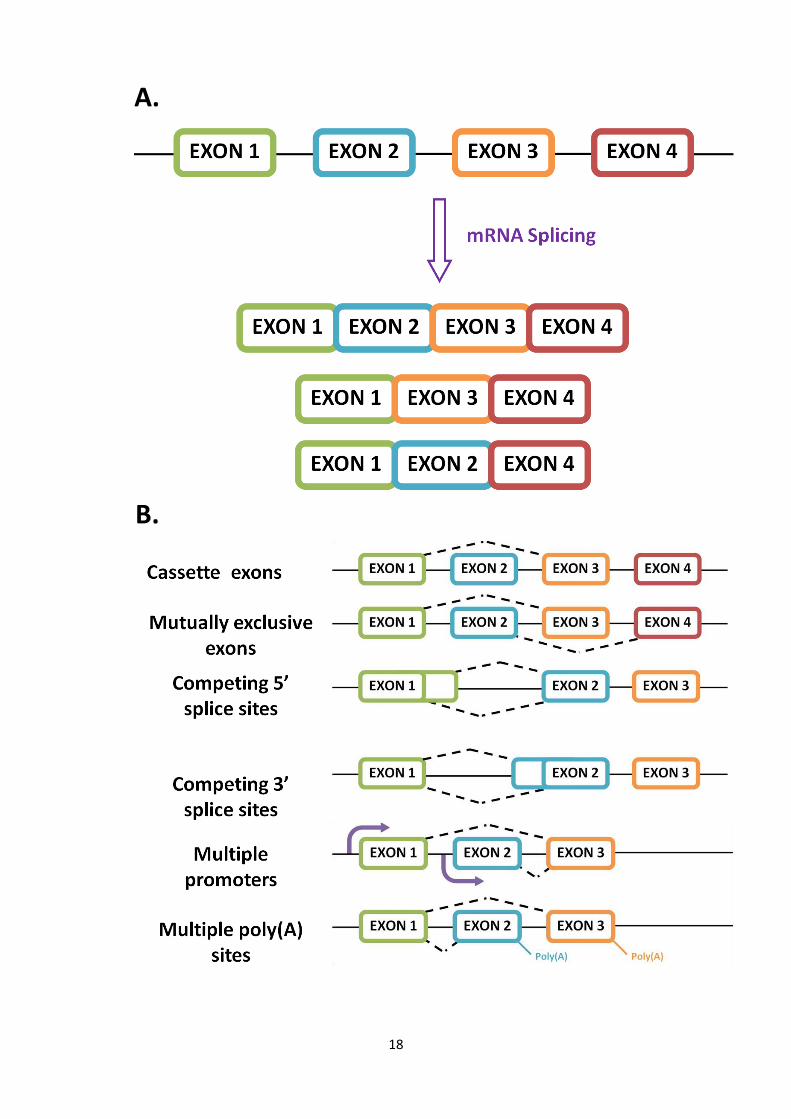
1.4 Alternative splicing.
1.5 Homeostatic regulation of the antagonistic splicing factor families: SR
and hnRNP proteins.
1.6 Splicing of survival of motor neuron 2 (SMN2).
2.1 Schematic representation of the murine structures of each of the
putative HTT suppressor proteins.
2.2 Inducible HTT construct found in the PC-12 cell line.
2.3 Overexpression of several splicing genes modulates caspase activation
in neuronal cells expressing mutant HTT.
2.4 The RFP tagged suppressors localised in the nucleus.
2.5 Validation of suppressor expression.
2.6 Splicing efficiency assay used to ascertain the possibility of splicing
defects in HD.
2.7 Expansion of the HTT polyglutamine tract causes a decline in splicing
efficiency and cell viability 48 hours post transfection.
2.8 Mutant HTT constructs do not significantly change splicing efficiency or cell
viability 24 hours post transfection.
2.9 Overexpression of the candidate genes does not alter splicing efficiency in
HTT97Q cells.
2.10 Cellomics cell identification and analysis.
2.11 Mutant HTT aggregation is significantly altered by overexpression of
splicing genes.
2
6
12
16
18
20
23
28
38
60
62
63
65
66
67
69
70
72
2.12 Mutant HTT levels were elevated in cell lines overexpressing CRNKL,
HNRNPK and TARDBP, and reduced in cells overexpressing EFTUD2 and
HNRNPF.
2.13 Mutant HTT aggregation levels were found to be consistent with the data
derived from the automated cell analysis software.
2.14 Overexpression cell lines display variation in HTT expression relative to
untransfected control cells.
2.15 Stably transfected cell lines exhibit little variation in HTT copy number.
3.1 C. elegans life cyle.
3.2 Schematic, confocal and fluorescence diagrams of C. elegans.
3.3 Schematic of post transcriptional silencing in C. elegans.
3.4 Confocal images of worms following incubation within DiD lipophilic dye.
3.5 Knockdown of target genes failed to exacerbate motor defects in HD
nematode strains.
3.6 Knockdown of target genes does not alter sensitivity defects in HD
nematode strains.
3.7 Knockdown constructs brought about a moderate decrease in expression of
CRNKL and HNRNPF, and an increase in expression of HNRNPK and TARDBP.
4.1 Timeline of behavioural and pathological symptoms exhibited by HD mouse
models.
4.2 Homozygous HdhQ150 knock-in mice display a rota-rod defect at 14
months.
4.3 Homozygous HdhQ150 knock-in mice display defects in locomotion at 12
months.
4.4 Homozygous HdhQ150 knock-in mice display defects in rearing at 12
months.
4.5 Homozygous HdhQ150 knock-in mice fail to gain weight.
4.6 Homozygous HdhQ150 knock-in mice develop a burrowing defect at 9
month.
4.7 The CAG tract found in the HTT gene carried by the HdhQ150 mouse
models was found to be incredibly unstable.
5.1 Intranasal Delivery.
77
88
89
91
102
105
106
107
119
77
130
131
132
133
134
135
143
74
75
77

5.2 Transport of intranasally administered compounds from the nasal
passage to the olfactory and trigeminal nerve bundles.
5.3 GFP is expressed in the hippocampi of mice treated with three doses of
either EV or MW1.
5.4 GFP is expressed in the cortex of mice treated with three doses of
either EV or MW1.
5.5 The MW1 PRNP knockdown construct failed to significantly reduce
prion levels brain regions of wild type C57BL6N mice.
5.6 Treatment of homozygous prion inoculated mice with MW1 lentivirus
at 3 and 4 weeks post inoculation extends life span of some mice.
5. 7 Prion infected homozygous mice treated with MW1 at 3 and 4 weeks
post inoculation displayed a similar degree of spongiosis at 7 weeks
compared to EV treated mice, while terminally ill mice exhibited a reversal
of spongiosis.
5.8 The early treatment of prion inoculated hemizygous mice with MW1
construct at 2, 3 and 7 weeks post inoculation appears to extend life span
of some mice.
5.9 Prion infected hemizygous mice treated with MW1 at 2, 3 and 7 weeks
post inoculation displayed a delay in spongiosis relative to EV treated and
RML only, untreated mice.
5.10 Mice treated with MW1 at 2, 3 and 7 w.p.i displayed no significant
increase in PSD-95 relative to NBH or RML only treated mice at 9 w.p.i.,
though they exhibited a greater level of SNAP-25.
5.11 PrPC levels in mice administered the MW1 lentiviral construct at 2, 3
and 7 w.p.i appeared to be similar to those displayed by RML only treated
mice at 9 w.p.i, while PrPSc
levels seemed to be elevated.
5.12 Prion infected hemizygous mice treated with low doses of MW1 at 4,
5 and 6 weeks post inoculation displayed no significant increase in survival
compared to EV and RML only treated animals
5.13 Treatment of homozygous mice with chitosan, rifampin and TMD
failed to improve the survival of mice intranasally administered with MW1.
145
163
164
165
166
167
168
169
170
171
173
174

5.14 Treatment of hemizygous prion inoculated mice with MW1 at 6, 7 and
8 weeks post inoculation extends life span.
5.15 Prion infected hemizygous mice treated with MW1 and EV at 6, 7 and
8 weeks post inoculation displayed comparable levels of spongiosis relative
to RML only, untreated mice.
175
176
1
Chapter 1
General Introduction
1.1 Introduction
Neurodegenerative diseases are defined as disorders of the nervous system, which are
progressive and lead to a decline in both cognitive and motor functions. These disorders
often stem from either a sporadic or genetic origin, the latter of which has been the
focus of extensive research with the use of many genetic disease models, both in vitro
and in vivo. One of the prominent features of many neurodegenerative diseases is the
misfolding of disease-causing proteins into stable non-native states. Such
conformational changes can yield fibrillar deposits, which accumulate in the cell and
interfere with a multitude of cellular processes, ultimately leading to loss or atrophy of
neuronal cells (Soto, 2003, Forman et al., 2004).
Given the increase in average lifespan, the number of individuals aged over 65 has
risen steadily in recent years, predominantly attributed to medical advances.
Unfortunately this increase is coupled with a higher prevalence of neurodegenerative
diseases, and in turn a greater financial drain on the health service. It is believed that
by 2050, the number of people suffering from disorders such as Alzheimer’s disease,
Parkinson’s disease and other neurodegenerative will triple (Ross and Poirier, 2004).
As such, it is imperative that our understanding of genetic factors influencing onset
and severity of these crippling conditions, as well as the mechanisms underlying
pathogenesis, are dissected.
1.11 Huntington’s Disease
Huntington’s disease (HD) is an autosomal-dominant neurodegenerative disorder,
stemming from the expansion of a CAG repeat (encoding glutamine) within exon one
of the HTT gene located on human chromosome 4 (Landles and Bates, 2004). Repeat
lengths beyond 39, lead to full penetrance of disease symptoms, with age of onset of
this disorder inversely correlated to the number of these repeats (Landles and Bates,
2004, Duyao et al., 1993). The expansion of the CAG tract occurs due to the instability
of the mutated gene during meiosis, with larger amplifications being attributed to the
2
greater mutation rates associated with spermatogenesis, which are subsequently
conveyed to offspring with paternal transmission (Gil and Rego, 2008). As such,
subsequent generations display larger number of repeats relative to their parent,
which combined with an increased disease severity, produce a phenomenon known as
anticipation, (Ridley et al., 1988).
Motor and cognitive dysfunction, progressive dementia and impairment of mental
processes such as reasoning and judgement are all synonymous with HD, with many
motor symptoms being attributed to the selective degeneration of the caudate and
putamen (Zuccato et al., Landles and Bates, 2004). Degeneration predominantly
affects the spiny GABAergic neurons of the striatum, with early neuronal dysfunction
observed in neurons linked to the external regions of the globus pallidus. This
neuronal pathway is believed to suppress unwanted movements following cortical
stimulation, disruption of which leads to chorea, a defining characteristic of this
condition. While striatal degeneration is one of the hallmarks of HD, other brain
regions are also affected, albeit to a much lesser degree than the striatum (Eidelberg
and Surmeier, Walker, 2007).
Expansion of the CAG tract in the HTT gene, results in an extension of the
polyglutamine (polyQ) tract within the encoded protein, huntingtin (HTT). Upon
lengthening of the polyQ domain, the protein gains a propensity to misfold, leading to
the formation of protein aggregates. The presence of such mutant HTT aggregates in
the nucleus as well as the cytoplasm is a hallmark of HD, and is believed to contribute
to disease pathology (Zuccato et al. 2010).
1.12 Huntingtin
HTT is a 348kDa protein consisting of 3144 amino acids, and although ubiquitously
expressed, the normal function of the protein remains contentious (see Figure 1.1)
(Cattaneo et al., 2005). The amino terminal domain (amino acids 1-17) of HTT adopts
an amphipathic α-helical structure and is believed to mediate interactions with
cellular membranes encasing organelles such as the mitochondria, Golgi apparatus
and endoplasmic reticulum (Rockabrand et al., 2007, Atwal et al., 2007). This
membrane targeting capacity is especially important during periods of stress, with

3
phosphorylation of serine residues 13 and 16 inducing a conformational change in the
α-helical structure of this region, and the subsequent targeting of HTT to subregions
within the nucleus. Mutant HTT is found to be hypophosphorylated at these residues,
and as such fails to display this translocatory response to stress. (Atwal et al., 2011).
The amino terminal region is followed by a polyglutamine (polyQ) domain, a salient
feature of HTT that governs its propensity to aggregate in mutant forms. Non-
pathogenic polyQ tracts in HTT adopt an alpha helical structure, a form believed to
elicit interactions between HTT and proteins containing a Src homology 3 (SH3) or
tryptophan (WW) domain, the latter of which is a common feature of several splicing
factors (Lin et al., 2004, Gao et al., 2006b, Bocharova et al., 2009, Bugg et al., 2012,
Chellgren et al., 2006).
The polyQ domain of HTT is adjacent to a variable polyproline (polyP) domain that
conforms to a polyproline II helical structure. This region is implicated in the
enhancement of membrane binding, and acts as a cis-acting modulator of the polyQ
tract structure itself (Kim et al., 2009b, Burke et al., 2013). The polyP domain inhibits
fibrillation by inducing the polyQ tract to adopt a structure similar to its own,
Figure 1.1. Schematic diagram of HTT. The 3144 amino acid protein contains a poly-Q
tract (red rectangle) starting at the eighteenth amino acid from the amino terminus,
this is followed by a proline-rich region (blue rectangle). HTT contains several HEAT
domains (orange rectangles), a nuclear export signal (NES) as well as caspase (blue
arrows) and calpain (purple arrows) cleavage sites. Adapted from (Cattaneo et al.,
2005)

4
preventing the formation of aggregation prone β strand/ β-turn conformations (Poirier
et al., 2005, Darnell et al., 2009). Deletion of this region therefore exacerbates the
aggregation and toxicity of mutant HTT (Dehay and Bertolotti, 2006).
Both polyQ-flanking regions are believed to interact with each other, mediated by
protein kinase C and casein kinase 2 substrate in neurons 1 (PACSIN1) and dependent
on the flexibility of the polyQ region. Expansion of the polyQ tract diminishes the
flexibility of this region, preventing the two flanking regions from interacting. Given
the importance of intramolecular interactions, the loss of flexibility within the polyQ
region is likely to impair its capacity to function and in turn exacerbate HTT
aggregation (Caron et al., 2013).
The HTT protein also possesses three highly conserved clusters made up of
approximately 37 HEAT (huntingtin, elongation factor 3, regulatory A subunit of
phosphatase 2A and TORI) repeats, each of which can adopted an alpha-rod structure.
These repeat sequences facilitate interactions with numerous proteins including
huntingtin interacting proteins (HIP) 1, 4 and huntingtin associated protein 1 (HAP1),
which are involved in neuronal membrane trafficking, a process impaired in HD
(Bossy-Wetzel et al., 2004, Cattaneo et al., 2005). These domains are also capable of
associating with themselves, which may contribute to both intramolecular folding
within HTT and the formation of homodimers through intermolecular interactions
(Palidwor et al., 2009).
The main body of the HTT protein contains at least three caspase and two calpain
cleavage sites, and as such is prone to proteolytic cleavage. Activities of these
respective protease families (caspase 2, 3 and 6, and calpain 1, 5, 7 and 10) increase
with the greater expansion of the polyQ domain, and give rise to small amino-terminal
fragments. These fragments exhibit a greater tendency to form aggregates than the
full length protein and may be a contributing factor in the pathogenesis of HD (Gafni
and Ellerby, 2002, Gafni et al., 2004, Wellington et al., 2002).

5
1.13 Normal HTT function and mutant HTT
HTT is ubiquitously expressed, with higher levels found in the central nervous system
(CNS) and the testes. Within the cell, the protein is localised in both the nucleus and
cytoplasm, associating with the Golgi, the endoplasmic reticulum, as well as being
positioned at synapses (Cattaneo et al., 2005).
Due to the low level of sequence homology when compared to other cellular proteins,
the normal endogenous function of HTT is unclear (Landles and Bates, 2004). Despite
this uncertainty, the presence of HTT within the cell appears to be crucial, as
illustrated by the early embryonic lethality seen in mouse models following loss of the
functional protein (Nasir et al., 1995a). Reduced levels of wild-type HTT also result in
abnormal brain development and neuron loss, thus implicating the HTT protein in
neurogenesis, neuron maturation and apoptosis (Metzler et al., 1999, Auerbach et al.,
2001, Cattaneo et al., 2005).Furthermore increased expression of wild-type HTT,
following toxic stimuli such as ischemic pressure and mutant HTT toxicity, conveys
neuroprotection by reducing apoptosis (Leavitt et al., 2001, Zhang et al., 2003).
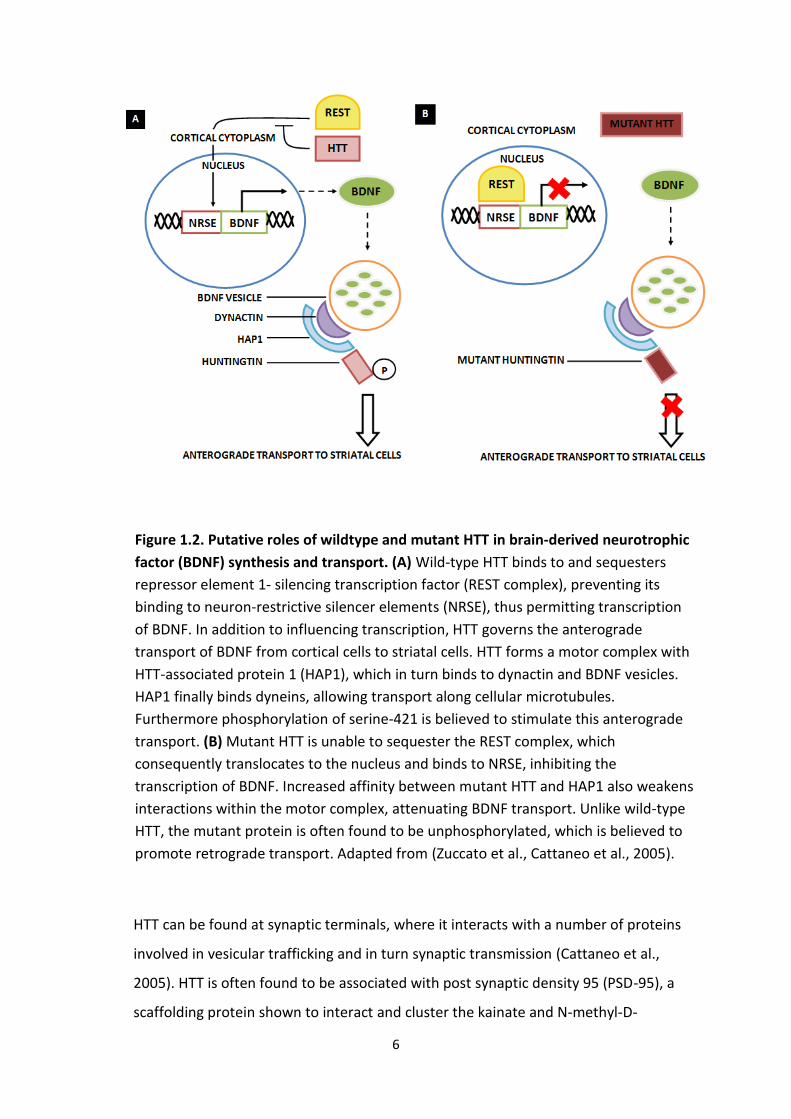
Wild-type HTT interacts with a wide range of cellular proteins as well as influencing
the activity of proteins indirectly. One such protein is brain-derived neurotrophic
factor (BDNF), a protein synthesized in the cortex and transported to striatal neurons
via anterograde transport, where it stimulates the release of glutamate, and thus
promotes neuron survival by preventing excitotoxicity. HTT interacts with BDNF
indirectly, influencing its transport and expression (see Figure 1.2). Consequently a
reduction in the wildtype HTT protein, through depletion or mutation, results in a
parallel reduction in BDNF and in turn striatal degeneration (Gauthier et al., 2004,
Cattaneo et al., 2005).
6
HTT can be found at synaptic terminals, where it interacts with a number of proteins
involved in vesicular trafficking and in turn synaptic transmission (Cattaneo et al.,
2005). HTT is often found to be associated with post synaptic density 95 (PSD-95), a
scaffolding protein shown to interact and cluster the kainate and N-methyl-D-
Figure 1.2. Putative roles of wildtype and mutant HTT in brain-derived neurotrophic
factor (BDNF) synthesis and transport. (A) Wild-type HTT binds to and sequesters
repressor element 1- silencing transcription factor (REST complex), preventing its
binding to neuron-restrictive silencer elements (NRSE), thus permitting transcription
of BDNF. In addition to influencing transcription, HTT governs the anterograde
transport of BDNF from cortical cells to striatal cells. HTT forms a motor complex with
HTT-associated protein 1 (HAP1), which in turn binds to dynactin and BDNF vesicles.
HAP1 finally binds dyneins, allowing transport along cellular microtubules.
Furthermore phosphorylation of serine-421 is believed to stimulate this anterograde
transport. (B) Mutant HTT is unable to sequester the REST complex, which
consequently translocates to the nucleus and binds to NRSE, inhibiting the
transcription of BDNF. Increased affinity between mutant HTT and HAP1 also weakens
interactions within the motor complex, attenuating BDNF transport. Unlike wild-type
HTT, the mutant protein is often found to be unphosphorylated, which is believed to
promote retrograde transport. Adapted from (Zuccato et al., Cattaneo et al., 2005).

7
aspartate receptors (NMDAR), regulating glutamate induced excitatory
neurotransmission. The interaction between HTT and PSD-95 is abrogated in mutated
forms, leading to increased levels of glutamate stimulated excitotoxicity, a major
contributing factor of neurodegeneration seen in HD (Sun et al., 2001).
Glutamate associated excitotoxicity is especially prominent in the medium spiny
neurons of the striatum, a region of the brain shown to be particularly vulnerable
during HD pathogenesis. This vulnerability is believed to arise from a high prevalence
of NMDARs found at the synaptic membrane of these neurons. Excitotoxicity stems
from an excess of extracellular glutamate, chiefly brought about by a reduction in the
glutamate uptake transporter, GLT1 (Miller et al., 2008). The build-up of this
neurotransmitter leads to the continued stimulation of the NMDARs and a persistent
influx of calcium ions. Unable to cope with the large increase in cellular calcium ions,
this class of neuron endures substantial damage through the activation of various
calcium ion dependent pathways (Raymond et al., 2011). This aspect of HD has
become a major target for therapeutic intervention, predominantly via the
modulation of the NMDAR activity. One such method shown to hold promise is the
manipulation of the tryptophan degradation pathway, largely through the inhibition of
one the degradative enzyme, kynurenine-3-monoxogenase (KMO). Genetic and
pharmacological inhibition of KMO has been demonstrated to increase levels of the
neuroprotective NMDAR agonist, kynurenic acid (KA) (Campesan et al., 2011, Zwilling
et al., 2011). This increase in KA is associated with suppression of not only HTT toxicity,
but other forms of neurodegeneration such as Parkinson’s (PD) and Alzheimer’s
disease (AD)(Labbadia and Morimoto, 2013, Zwilling et al., 2011).
Though some symptoms associated with HD are attributed to the loss of endogenous
HTT function, mutated forms of this protein may acquire novel dominant negative
cellular functions. Such toxic gain of function has been shown to disrupt a number of
cellular pathways, either via aberrant interactions with components of these
pathways, or through sequestration (Gil and Rego, 2008). The expanded poly-Q tract
causes the HTT protein to form aggregates, which subsequently sequesters
transcriptional factors possessing glutamine rich regions, such as CREB binding protein
(CBP). Depletion of this histone acetyltransferase CBP leads to a reduction in

8
transcriptional activation of CRE regulated genes, many of which relate to neuronal
survival (Hughes, 2002, Jiang et al., 2006). Aggregated HTT, along with sequestered
cellular proteins, form structures known as inclusion bodies (Rajan et al., 2001).
The soluble mutant forms of HTT, as opposed to the aggregated forms, also hold the
capacity to sequester transcription factors. One such extensively studied protein is
specificity protein 1 (SP1), which reduces the expression of nerve growth factor
receptor and dopamine D2 receptor, both of which are found to be down-regulated in
HD (Dunah et al., 2002, Li et al., 2002)
The toxic gain-of-function theory in regards to HTT is eloquently illustrated by the
conditional model generated by Yamamoto et al. This study showed that a delayed
knockout of the mutated HTT gene, reversed both behavioural deficits and the
formation of inclusion bodies, thus suggesting a constant requirement of the mutated
protein to maintain a HD phenotype (Yamamoto et al., 2000).
1.14 HD and protein homeostasis
The onset of HD is associated with the impairment of numerous pathways and cellular
processes, many relating to protein homeostasis. This encompasses polypeptide
folding, modification and degradation of all proteins within the cell. Disruption of
these crucial cellular functions is brought about in a variety of ways, including the
sequestration and down-regulation of chaperone proteins. During the advancement of
HD there is a gradual decline in chaperone proteins such as DNAJ, heat shock protein
40 (HSP40) and heat shock protein 10 (HSP70), which exacerbates the misfolding of
mutant HTT (Hay et al., 2004). Overexpression of several of these chaperone proteins
has been shown to suppress mutant HTT toxicity, through a reduction in aggregation
coupled with an increase in degradation (Muchowski and Wacker, 2005, Jana et al.,
2000, Kobayashi and Sobue, 2001). Recently heat shock transcription factor 1 (HSF1), a
master transcriptional regulator of several chaperone proteins, has been recognised
as a potential target in the suppression of mutant HTT aggregation. When exposed to
stress, eukaryotic cells can activate the expression of chaperones proteins such as
HSP25, HSP40 and HSP70 through the actions of HSF1. While the upregulation of
single chaperone protein has been shown to be protective, increasing several
9
chaperones simultaneously appears to convey a synergistic protection. (Neef et al.,
2010, Fujikake et al., 2008). Furthermore a number of compounds capable of
activating expression of this therapeutic transcription factor have been identified,
including a barbituric acid-like compound (F1) This compound is believed to not only
reverse defects in protein homeostasis, but also holds the potential to reverse similar
proteomic deficits seen in other neurodegenerative diseases (Neef et al., 2011,
Labbadia and Morimoto, 2013, Anckar and Sistonen, 2011).
In addition to an impairment in protein folding, mutant HTT causes defects in the
ubiquitin proteasome system (UPS), one of the cellular protein degradation systems.
To prevent aberrant functioning, misfolded or damaged proteins are identified by
chaperones proteins and polyubiquitylated by E3 ubiquitin ligases. Proteins possessing
these ubiquitin marks are recognised and subsequently degraded by the large multi-
subunit complex, the proteasome (Mitra and Finkbeiner, 2008). Although mutant HTT
is found to be polyubiquitylated, it fails to undergo degradation and eventually
accumulates in the cytoplasm, leading to a build-up of the aggregated forms. Although
initially believed to directly inhibit the proteasome function, recent studies suggest
that mutant HTT predominantly affects proteostasis through the sequestration of
chaperone proteins (Venkatraman et al., 2004, Hipp et al., 2012). A drop in chaperone
activity is accompanied by an increase in aberrantly folded HTT and also other
misfolded cellular proteins. This loss of protein homeostasis overwhelms the
proteasome, which becomes incapable of coping with the rising number of
polyubquitylated proteins marked for degradation (Hipp et al., 2012). This is
supported by observations derived from conditional HD mouse models. A loss of
mutant HTT expression is believed to provide the proteasome an opportunity to
degrade the surfeit of misfolded proteins, leading to a decline in mutant HTT
inclusions (Yamamoto et al., 2000).
10
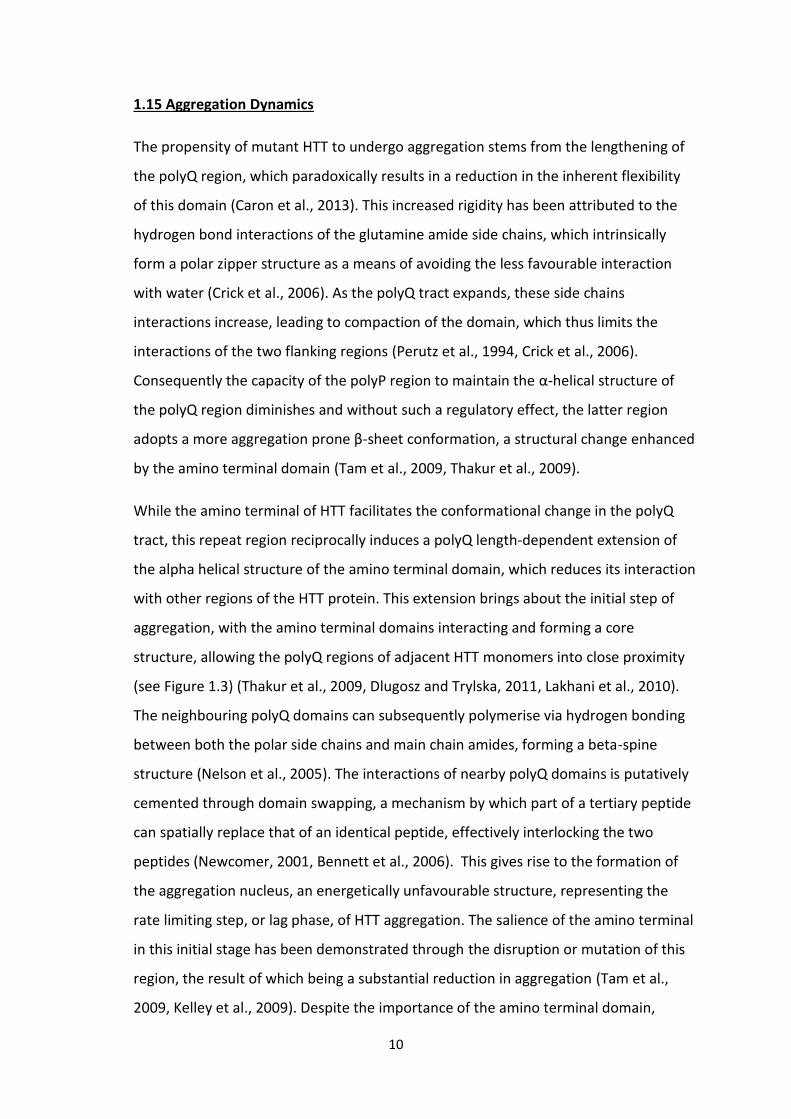
1.15 Aggregation Dynamics
The propensity of mutant HTT to undergo aggregation stems from the lengthening of
the polyQ region, which paradoxically results in a reduction in the inherent flexibility
of this domain (Caron et al., 2013). This increased rigidity has been attributed to the
hydrogen bond interactions of the glutamine amide side chains, which intrinsically
form a polar zipper structure as a means of avoiding the less favourable interaction
with water (Crick et al., 2006). As the polyQ tract expands, these side chains
interactions increase, leading to compaction of the domain, which thus limits the
interactions of the two flanking regions (Perutz et al., 1994, Crick et al., 2006).
Consequently the capacity of the polyP region to maintain the α-helical structure of
the polyQ region diminishes and without such a regulatory effect, the latter region
adopts a more aggregation prone β-sheet conformation, a structural change enhanced
by the amino terminal domain (Tam et al., 2009, Thakur et al., 2009).
While the amino terminal of HTT facilitates the conformational change in the polyQ
tract, this repeat region reciprocally induces a polyQ length-dependent extension of
the alpha helical structure of the amino terminal domain, which reduces its interaction
with other regions of the HTT protein. This extension brings about the initial step of
aggregation, with the amino terminal domains interacting and forming a core
structure, allowing the polyQ regions of adjacent HTT monomers into close proximity
(see Figure 1.3) (Thakur et al., 2009, Dlugosz and Trylska, 2011, Lakhani et al., 2010).
The neighbouring polyQ domains can subsequently polymerise via hydrogen bonding
between both the polar side chains and main chain amides, forming a beta-spine
structure (Nelson et al., 2005). The interactions of nearby polyQ domains is putatively
cemented through domain swapping, a mechanism by which part of a tertiary peptide
can spatially replace that of an identical peptide, effectively interlocking the two
peptides (Newcomer, 2001, Bennett et al., 2006). This gives rise to the formation of
the aggregation nucleus, an energetically unfavourable structure, representing the
rate limiting step, or lag phase, of HTT aggregation. The salience of the amino terminal
in this initial stage has been demonstrated through the disruption or mutation of this
region, the result of which being a substantial reduction in aggregation (Tam et al.,
2009, Kelley et al., 2009). Despite the importance of the amino terminal domain,

11
mutant HTT can also undergo this initial nucleation step via a minor pathway
mediated by the association of beta-sheets of the polyQ domains (Kar et al., 2011,
Jayaraman et al., 2012).
Nucleation leads to the sequential formation of oligomers rich in β-strands, and
subsequently mature amyloid fibrils (Slepko et al., 2006, Kim et al., 2009b). Although
the mechanism underlying the elongation stage of mutant HTT aggregation is widely
debated, some theories suggest the “dock and lock” model, in which monomers bind
to the nucleated intermediate, stimulating an intermolecular conformational change
that “locks” the monomer into the nascent aggregate (Reddy et al., 2009). Other
theories suggest the formation of oligomeric intermediates which come together to
form insoluble rod-like structures or fibrils, with the pool of oligomers diminishing as
the larger fibrils form, at a rate correlating with the length of the polyQ region.
(Legleiter et al., 2010).
The aggregation pathway appears to be devoid of one unifying pathway, instead being
made up of a number of branches leading to the eventual formation of structures of
various sizes and shapes, including amorphous globular aggregates, mature fibrils and
even annular structures. Recent advances in microscopy techniques such as atomic
force microscopy, has provided a means of distinguishing between these various
species on the basis of their morphology, with the potential to examine the different
conditions necessary to bring about such aggregate diversity (Burke et al., 2011,
Polling et al., 2012, Legleiter et al., 2010).
The aggregation pathway gives rise to a number of misfolded aggregate forms, and
although controversial, the soluble oligomers and protofibrils are widely regarded as
the toxic species. These aggregate forms are believed to dictate the survival of
neurons, putatively through generation of reactive oxygen species or initiation of cell
death pathways (Wyttenbach et al., 2002, Arrasate et al., 2004). Inhibition of
oligomerisation, following onset of disease symptoms, has been shown to ameliorate
motor function, survival and also stimulate the clearance of mutant HTT in vivo, thus
emphasising the contribution of oligomerisation in pathogenesis (Sanchez et al.,
2003). The formation of larger insoluble aggregates, or inclusion bodies, may

12
represent a neuroprotective mechanism employed by the cell to reduce the level of
soluble toxic species, while the retained capacity to sequester other cellular proteins
may simply reflect an unavoidable consequence (Arrasate et al., 2004). Indeed, the
presence of these larger aggregates appears to increase the survival of certain cell
lines expressing mutant HTT, compared to cells displaying a diffuse spread of the
oligomeric forms (Arrasate et al., 2004, Bodner et al., 2006).
Figure 1.3. HTT aggregation dynamics. Amplification of the polyQ region within
HTT conveys a propensity to aggregate. Aggregation is believed to take place in an
ordered manner, beginning with the nucleation of monomers, via the region
preceding the poly-Q tract. Nucleation is followed by elongation, ultimately
leading to the formation of mature amyloid fibres. The protofibrils, and to some
extent the oligomers and monomers, are believed to represent the toxic species
implicated in HD, while the mature fibres are potentially neuroprotective. This
pathway contains several of branches, including the formation of large amorphous
aggregates and the more rare annular structure (Adapted from Zuccato et al
(2010) and Polling et al (2012))
13
Given the clear importance of aggregation in the progression of HD, modulating the
dynamics of aggregation, either by encouraging the formation of the mature
aggregates or inhibiting the oligomerisation of the putatively toxic precursor species,
has been shown to hold therapeutic potential. The compound B2 for instance, has
been recognised to diminish pathology in cellular and Drosophilia models of expanded
polyQ disorders and Parkinson’s disease, an effect accompanied by an increase in
inclusion body formation. Although the exact target of the B2 compound is unknown,
authors postulated a possible restoration of proteasomal function (Bodner et al.,
2006, Palazzolo et al., 2010). Other compounds such as green tea (-)- epigallocatechin-
gallate (EGCG), methylene blue and trehalose, have all been shown to inhibit early
aggregation and improve disease relevant phenotypes in numerous HD models. These
potential aggregation suppressors are principally believed stabilise the structure of
mutant HTT, preventing the conformational changes that initiate aggregation
(Ehrnhoefer et al., 2006, Tanaka et al., 2004, Sontag et al., 2012).
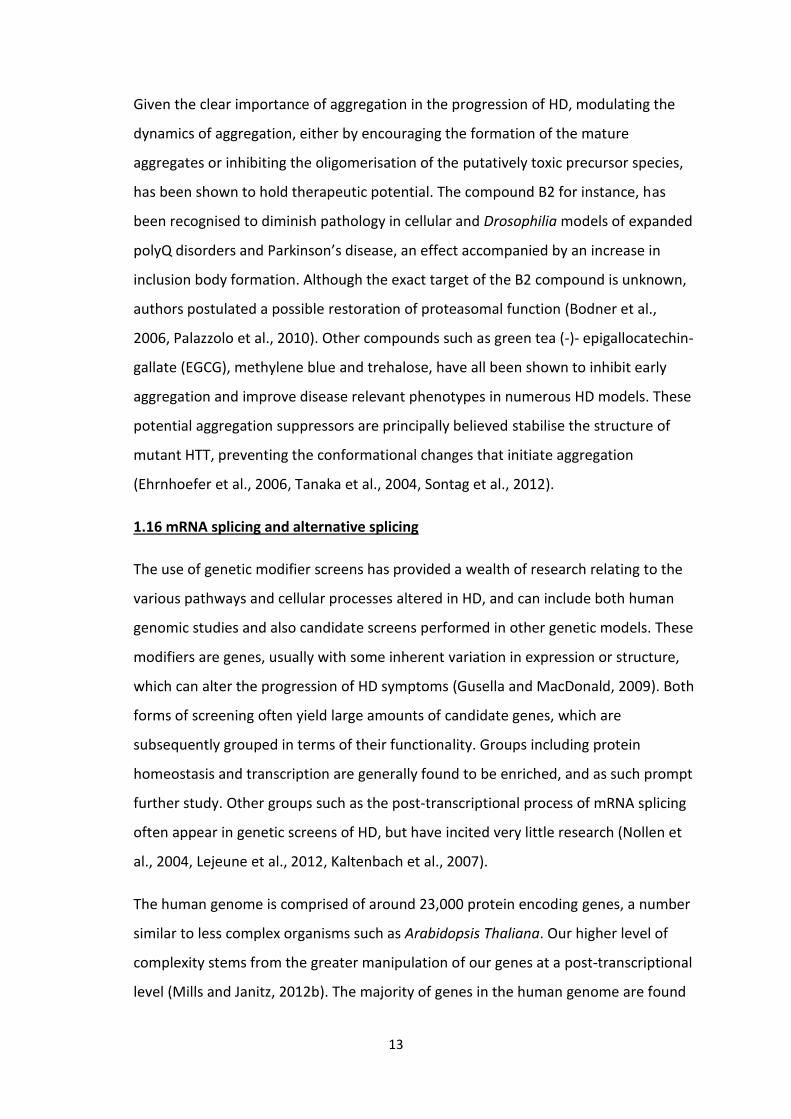
1.16 mRNA splicing and alternative splicing
The use of genetic modifier screens has provided a wealth of research relating to the
various pathways and cellular processes altered in HD, and can include both human
genomic studies and also candidate screens performed in other genetic models. These
modifiers are genes, usually with some inherent variation in expression or structure,
which can alter the progression of HD symptoms (Gusella and MacDonald, 2009). Both
forms of screening often yield large amounts of candidate genes, which are
subsequently grouped in terms of their functionality. Groups including protein
homeostasis and transcription are generally found to be enriched, and as such prompt
further study. Other groups such as the post-transcriptional process of mRNA splicing
often appear in genetic screens of HD, but have incited very little research (Nollen et
al., 2004, Lejeune et al., 2012, Kaltenbach et al., 2007).
The human genome is comprised of around 23,000 protein encoding genes, a number
similar to less complex organisms such as Arabidopsis Thaliana. Our higher level of
complexity stems from the greater manipulation of our genes at a post-transcriptional
level (Mills and Janitz, 2012b). The majority of genes in the human genome are found

14
in a fragmented form, consisting of coding regions known as exons interspersed with
non-coding intron regions. Following transcription, the intronic regions are removed
from nascent pre-mRNA and the exonic regions are brought together to form a
continuous open reading frame via mRNA splicing (Singh and Cooper, 2012, Han et al.,
2011).
mRNA splicing is catalysed by a large dynamic complex known as the spliceosome, the
core of which consists of five small nuclear ribonucleoproteins (snRNP), U1, U2, U4, U5
and U6, in addition to numerous splicing factors such as splicing factor 1 (SF1) and U2
auxiliary factor (U2AF). Assembly of the complex is guided by the presence of the
splice consensus sequences flanking the intronic region (3’ and 5’ splice sites), the
branch site adenosine (BS) found within the body of the intron and a polypyrimidine
tract (PT) found downstream of the BS (Singh and Cooper, 2012). Splicing is further
regulated by the presence of highly variable auxiliary elements found within the intron
and exon units, including intronic splicing silencers (ISS), intronic splicing enhancers
(ISE), exonic splicing silencers (ESS) and exonic splicing enhancers (ESE). Many of these
latter elements serve as binding sites for the multitude of splicing factors involved in
splicing, which not only guide spliceosome formation, but facilitate exon recognition
across intronic regions (Pagani and Baralle, 2004, Berget, 1995, Singh and Cooper,
2012).
Upon the stepwise assembly and activation of the spliceosome, the complex removes
the intronic region and ligates the two adjacent exonic regions via two
transesterification reactions (see Figure 1.4). The resulting excised intron, in the form
of a lariat structure, is subsequently degraded while the spliceosome components
disassemble for further splicing events (Singh and Cooper, 2012, Matlin et al., 2005).
The majority of splicing in humans occurs via the assembly of the major spliceosome
described above, known as the U2 spliceosome pathway. However a minor U12
pathway, which is absent in yeast and nematodes though present in some lower
eukaryotes, accounts for a small fraction of pre-mRNA splicing (humans possess
around 621 introns excised from pre-mRNA with the aid of this pathway) (Will and
Luhrmann, 2005, Lin et al., 2010). The U12 pathway makes use of less stringent splice

15
consensus sequences, and generally targets introns lacking a PT and displaying a BS
site closer to the 3’ splice site compared to the more ubiquitous U2 pathway. This U12
spliceosome consists of homologous snRNPs, with the U1, U2, U4 and U6 proteins of
the U2 spliceosome replaced by U11, U12, U4atac and U6atac respectively (atac
denotes what was initially thought to the be the U12 consensus sequences for the 3’
and 5’ splice sites, but subsequently refuted). Despite the differences, the minor
spliceosome shares many of the auxiliary factors, as well as the U5 snRNP, with its
more abundant sister complex. These similarities provide support for the belief that
this pathway may reflect an early evolutionary form of splicing (Singh and Cooper,
2012, Will and Luhrmann, 2005, Lin et al., 2010).
16

17
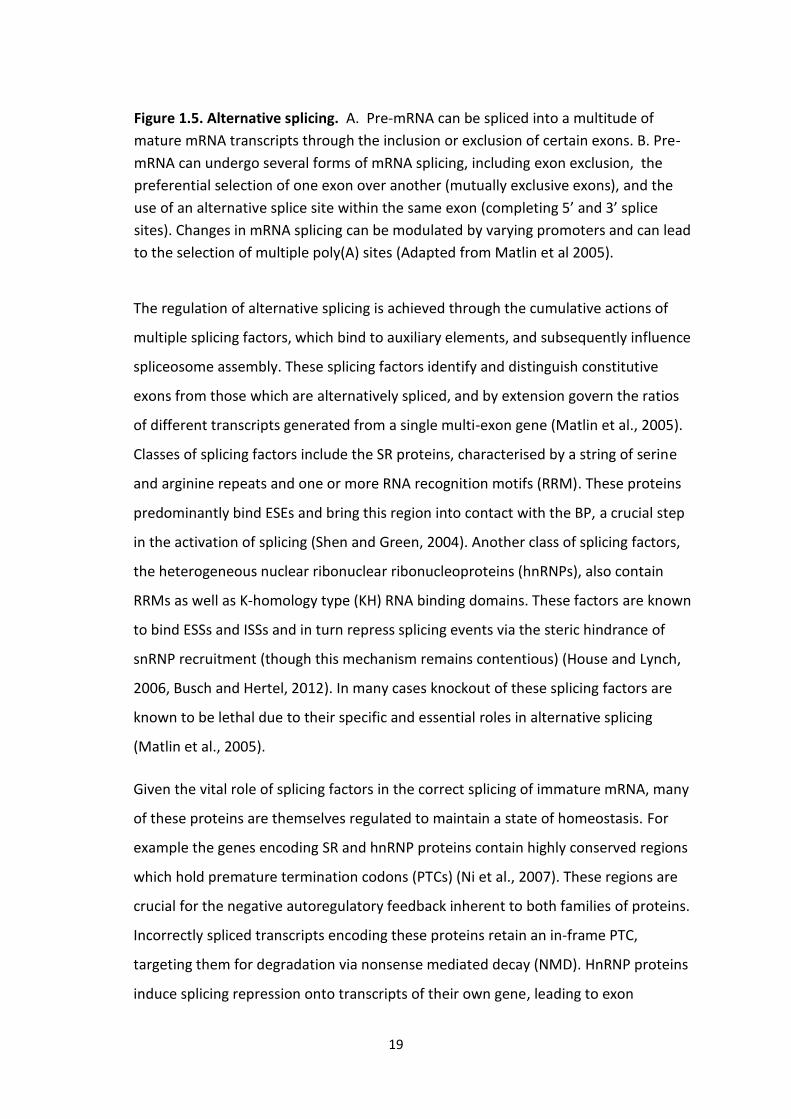
The exclusion or inclusion of different exons during the splicing of pre-mRNA allows
the formation of a myriad of mature mRNA transcripts, each giving rise to protein
isoforms with varying functions or specificities (see Figure 1.5a). This phenomenon is
referred to as alternative splicing, and occurs in approximately 90% of multi-exon
genes (Singh and Cooper, 2012). The variation in transcripts can be attributed to a
number of different alternative splicing events, including mutually exclusive exons and
the use of competing splice sites. Splicing can also act concertedly with the promoters
and end processing sites linked to certain exons, illustrating a regulatory role (see
Figure 1.5b) (Matlin et al., 2005).
Figure 1.4. Pre-mRNA splicing mechanism. Pre-mRNA splicing is achieved through the
actions of a dynamic complex known as the spliceosome. This complex consists of a large
number of components, which affords the spliceosome a high level of specificity in
addition to its catalytic properties, one of the salient constituent groups being the small
nuclear ribonucleoproteins (snRNP). U1snRNP binds to the 5’ splice site (which has a
general GU consensus sequence found in the intronic region), while U2snRNP binds to the
branch site (an unpaired conserved A nucleotide in the intron). Splicing factors serve to
bridge these two snRNPs, allowing for formation of the inactive pre-spliceosome, and in
turn binding of the U4/U6.U5 tri-snRNP. Unbinding of U4 snRNP leads to catalytic
activation of the spliceosome, a two-step reaction in which the 2’ hydroxyl group of the
branch site adenosine, performs a nucleophilic attack onto the 5’ splice site, leading to the
formation of the lariat structure. This structure facilitates the second step of splicing, in
which the 5’ hydroxyl group of the 5’ splice site carries out a second nucleophillic attack
on the 3’ splice, resulting in excision of the intronic region and ligation of the exons.
(Adapted from Wahl, Will et al., 2009)
18
A.
B.
19
The regulation of alternative splicing is achieved through the cumulative actions of
multiple splicing factors, which bind to auxiliary elements, and subsequently influence
spliceosome assembly. These splicing factors identify and distinguish constitutive
exons from those which are alternatively spliced, and by extension govern the ratios
of different transcripts generated from a single multi-exon gene (Matlin et al., 2005).
Classes of splicing factors include the SR proteins, characterised by a string of serine
and arginine repeats and one or more RNA recognition motifs (RRM). These proteins
predominantly bind ESEs and bring this region into contact with the BP, a crucial step
in the activation of splicing (Shen and Green, 2004). Another class of splicing factors,
the heterogeneous nuclear ribonuclear ribonucleoproteins (hnRNPs), also contain
RRMs as well as K-homology type (KH) RNA binding domains. These factors are known
to bind ESSs and ISSs and in turn repress splicing events via the steric hindrance of
snRNP recruitment (though this mechanism remains contentious) (House and Lynch,
2006, Busch and Hertel, 2012). In many cases knockout of these splicing factors are
known to be lethal due to their specific and essential roles in alternative splicing
(Matlin et al., 2005).
Given the vital role of splicing factors in the correct splicing of immature mRNA, many
of these proteins are themselves regulated to maintain a state of homeostasis. For
example the genes encoding SR and hnRNP proteins contain highly conserved regions
which hold premature termination codons (PTCs) (Ni et al., 2007). These regions are
crucial for the negative autoregulatory feedback inherent to both families of proteins.
Incorrectly spliced transcripts encoding these proteins retain an in-frame PTC,
targeting them for degradation via nonsense mediated decay (NMD). HnRNP proteins
induce splicing repression onto transcripts of their own gene, leading to exon
Figure 1.5. Alternative splicing. A. Pre-mRNA can be spliced into a multitude of
mature mRNA transcripts through the inclusion or exclusion of certain exons. B. Pre-
mRNA can undergo several forms of mRNA splicing, including exon exclusion, the
preferential selection of one exon over another (mutually exclusive exons), and the
use of an alternative splice site within the same exon (completing 5’ and 3’ splice
sites). Changes in mRNA splicing can be modulated by varying promoters and can lead
to the selection of multiple poly(A) sites (Adapted from Matlin et al 2005).

20
exclusion which brings a downstream PTC into frame. SR proteins on the other hand
stimulate the inclusion of an additional exon which contains the PTC. In both cases,
the resulting transcripts are broken down and genes downregulated (see Figure 1.6)
(Kalsotra and Cooper, 2011, Ni et al., 2007).
Figure 1.6. Homeostatic regulation of the antagonistic splicing factor families: SR and
hnRNP proteins. The SR and hnRNP protein represent two families of splicing factors,
that have opposing effects on splicing. While the SR proteins generally promote exon
inclusion, the hnRNP proteins stimulate exclusion. Both families utilise a negative
autoregulatory feedback mechanism to maintain the correct levels of their protein
products, and by extension maintain the ratio of transcripts derived from their
respective target genes. Both splicing factor families regulate their own expression by
binding to their own transcripts and stimulating inclusion or exclusion of a crucial
exon. The resulting transcript contains an in-frame premature termination codon (pre-
x), which subsequently signals its degradation via nonsense mediated decay (NMD).
(Adapted from Kalsotra and Cooper (2011))
21
Although splicing factors play a significant role in establishing constitutive and
alternative splicing events, other nuclear processes can also influence mRNA splicing,
one of which being transcription. The initial recruitment of splicing factors, such as
SF2/ASF, to the site of transcription is attributed to the C-terminal domain (CTD) of
RNA polymerase II (RNAPII), with deletion or truncation of this region resulting in a
substantial reduction in mRNA splicing (Caceres and Kornblihtt, 2002, Hirose and
Manley, 2000, Yuryev et al., 1996). Phosphorylation of RNAPII CTD, a step that
prompts transition from the initiation complex to the elongation complex, is required
for the recruitment of splicing factors and the sequential binding the U1 and U2 snRNP
proteins. As the RNAPII moves along its target DNA, the recruited splicing factors may
then serve to identify splice sites on the nascent RNA (Caceres and Kornblihtt, 2002).
The hypophosphorylated form of the CTD is believed to inhibit this initial assembly,
and in turn reduce splicing (Hirose et al., 1999).
The elongation speed of RNAPII has also been postulated to affect splicing, with a
slower progression allowing sufficient time for the identification of exons. Such a slow
rate is conducive to the inclusion of exons, while a faster RNAPII may simply pass over
these alternatively spliced exons (Caceres and Kornblihtt, 2002). This theory has been
supported by work conducted in human cell lines tranfected with a fibronectin
minigene construct containing the alternatively spliced exon, EDI. These cells lines
were subsequently treated with the SV40 T antigen (T-Ag) to slow down the rate of
RNAPII elongation, which significantly increased inclusion of the EDI exon. Conversely
use of a viral transcriptional activator (VP16) to increase elongation rate, prompted
exclusion of the EDI exon (Cramer et al., 1997, Kadener et al., 2001). In vivo, changes
in the elongation rates of RNAPII are determined by the promoter, which is itself
regulated by transcriptional activators. It is therefore feasible that transcriptional
activators may provide a means of regulating splicing via this method (Caceres and
Kornblihtt, 2002).
22
1.17 mRNA splicing and neurodegenerative disease
Alternative splicing of mRNA within the nervous system is a highly regulated process,
given the complex nature of neurons, and the requirement for both spatial and
temporal changes in protein levels. Mutations in splicing sequence (cis-acting) and/or
genes encoding splicing factors (trans-acting) can have a major impact on the
functioning of neurons. Both classes of mutations can greatly and detrimentally
influence the ratio at which the various transcripts are generated from a single
immature mRNA. Indeed aberrant splicing has been seen in some neurodegenerative
diseases, and it is estimated potentially 50% of all genetic disorders stemming from
point mutations may bring about splicing defects (Licatalosi and Darnell, 2006, Matlin
et al., 2005).
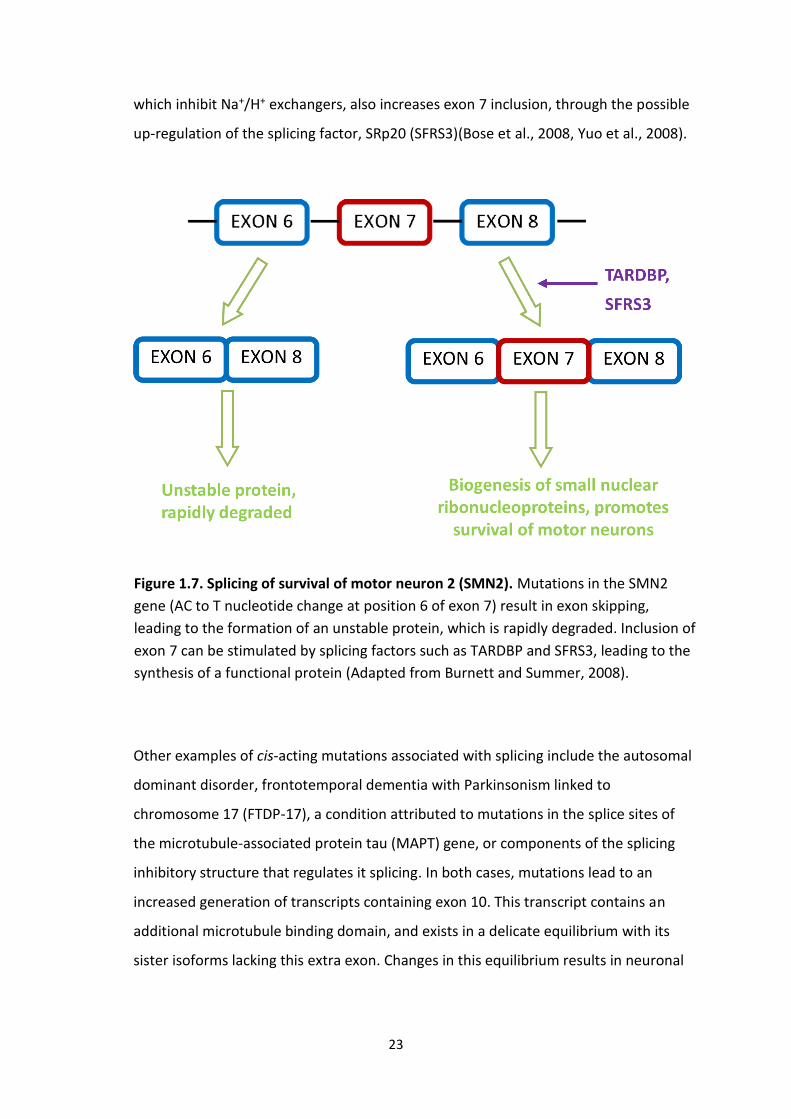
One example of a genetic disorder attributed to a splicing abnormality is spinal
muscular atrophy (SMA), a fatal autosomal recessive disease attributed to the
degeneration of motor neurons. This condition is linked to a deficit in SMN, or survival
of the motor neuron protein which is believed to form a large complex that governs
the biogenesis of small nuclear ribonucleoproteins (snRNP), and in turn RNA
metabolism. Although two genes encode this protein, only the centromeric gene,
SMN1, leads to the formation of an adequate amount of protein. An inherent
mutation in the telomeric gene, SMN2, predominantly gives rise to a transcript lacking
exon 7, encoding a non-functional protein. Disease causing mutations in SMN1 lead to
a reduction in functional protein, a deficiency which is not compensated for by SMN2
(see Figure 1.7) (Dredge et al., 2001, Paushkin et al., 2002). The intrinsic splice
sequences in the SMN2 gene, rendering approximately 80% of transcripts superfluous,
can be overcome by certain splicing factors. For example, over expression of
transactivation responsive DNA-binding protein 43 (TARDBP), has been shown to
stimulate the inclusion of exon 7, in mature SMN2- derived transcripts, increasing the
levels of full length SMN by approximately two-fold. Interestingly TARDBP has recently
generated great interest due to its involvement in other neurodegenerative diseases
including HD, an inference based on colocalization with many disease causing proteins
(Schwab et al., 2008).Chemicals such as 5-(N-ethyl-N-isopropyl)-amiloride (EIPA),
23
which inhibit Na+/H+ exchangers, also increases exon 7 inclusion, through the possible
up-regulation of the splicing factor, SRp20 (SFRS3)(Bose et al., 2008, Yuo et al., 2008).
Other examples of cis-acting mutations associated with splicing include the autosomal
dominant disorder, frontotemporal dementia with Parkinsonism linked to
chromosome 17 (FTDP-17), a condition attributed to mutations in the splice sites of
the microtubule-associated protein tau (MAPT) gene, or components of the splicing
inhibitory structure that regulates it splicing. In both cases, mutations lead to an
increased generation of transcripts containing exon 10. This transcript contains an
additional microtubule binding domain, and exists in a delicate equilibrium with its
sister isoforms lacking this extra exon. Changes in this equilibrium results in neuronal
Figure 1.7. Splicing of survival of motor neuron 2 (SMN2). Mutations in the SMN2
gene (AC to T nucleotide change at position 6 of exon 7) result in exon skipping,
leading to the formation of an unstable protein, which is rapidly degraded. Inclusion of
exon 7 can be stimulated by splicing factors such as TARDBP and SFRS3, leading to the
synthesis of a functional protein (Adapted from Burnett and Summer, 2008).

24
dysfunction and ultimately cell death through a poorly understood mechanism (Lee et
al., 2001, Licatalosi and Darnell, 2006).
Neurological disorders can also arise due to mutations or changes in the expression of
splicing factors. One such example of trans-acting disorders are the paraneoplastic
neurological disorders (PNDs), in which cancer cells present elsewhere in the body
elicits an immune response mounted against antigens found not only on the tumour,
but also regions of the nervous system. Patients develop an autoimmune neurological
disease marked by a substantial neuronal degeneration (Musunuru and Darnell, 2001,
Roberts and Darnell, 2004). Nova is a neuronal splicing regulatory factor implicated in
several forms of PND and act as an antigen during the immune response mounted
against the tumour. This protein regulates the splicing of genes encoding a number of
synaptic proteins involved in synaptic formation and plasticity, which are consequently
downregulated in these disorders (Ule et al., 2006, Musunuru and Darnell, 2001).
Although splicing dysfunction in HD is unclear, recent studies have postulated several
theories by which an expansion in the CAG repeats of the HTT gene can bring about
defects in mRNA splicing. One such theory centres on the role of mutant RNA
transcripts, which are believed to form double stranded structures mediated by the
expanded CAG repeats. Akin to the previously well documented pathogenic role of
expanded CUG repeats in myotonic dystrophy type 1 (DM1), these structures are
thought to bind and sequester certain splicing factors, such as muscleblind-like 1
(MBNL1), and in turn prompt aberrant splicing of genes regulated by these proteins
(Mykowska et al., 2011, Birman, 2008). Furthermore expression of untranslated CAG
repeats in the neurons of Drosophilia has been found to induce motor dysfunction, a
shortened lifespan and brain degeneration, indicating that conditions arising from
nucleotide repeat expansions may by attributed, in part to the toxic properties of the
expanded repeat RNA (Li et al., 2008).
Abnormal splicing of the HTT gene has recently been implicated in HD pathogenesis,
with an expansion of the CAG repeat tract believed to prompt an increased interaction
between HTT RNA transcripts and the splicing factor, SRSF6. (Sathasivam et al., 2013).
This greater affinity stimulates the generation of partially spliced exon 1-intron 1
25
transcripts, containing a conserved translational stop codon within the non-coding
region. As a result, this transcript is translated into the extremely pathogenic exon 1
HTT protein fragment. Such aberrant splicing was shown to be governed by polyQ
length, with knock-in mice expressing repeat lengths of Q50, Q80 and Q100 displaying
much lower levels of the exon 1 transcript relative to animals expressing Q150 and
Q175, a result found to be consistent in juvenile HD patients (Sathasivam et al., 2013).
This study therefore suggests that dysfunctions in mRNA splicing may play a much
more crucial role in HD than previously thought.
1.18 Project aims
This PhD project is based upon a currently unpublished genetic modifier screen carried
out by a member of our research group, Dr Robert Mason. This screen identified ~90
mammalian cDNAs that suppress mutant HTT toxicity when over-expressed in yeast.
After grouping these cDNA hits in terms of their interactions as well as functionality, it
became apparent that many of the genes were key components of physiological
processes such as mRNA processing, apoptosis and energy metabolism. Although the
two latter groups have been studied and documented extensively in relation to HD,
research focused on mRNA processing in HD is fairly sparse (Zuccato et al., 2010).
The overall aims of this project were to validate the splicing cDNA hits in a range of
models, initially using a neuron-like HD cell model derived from a pheochromocytoma
of rat adrenal medulla, PC12 cells. Using this cell line, I generated stable cell lines
overexpressing our splicing gene hits, examined apoptosis with the use of a
luminescence based caspase activation assay, and aggregation dynamics via an
automated imaging based platform. As each of the gene hits have a role in mRNA
splicing, also interrogated these candidates using a dual reporter splicing efficiency
assay.
I also employed a C. elegans HD model to bridge the gap between the PC-12 cell line
and mouse model of HD. This model exhibits neurodegeneration, behavioural deficits,
and formation of mutant HTT aggregates which increase with age. I employed an RNAi
approach to knockdown gene expression of the worm orthologues corresponding to
our candidate genes, and examined for alterations in HD phenotypes, notably motor
26
function and the aggregation, in hopes of providing justification for progression of
promising candidates into mice.
As the ultimate goal with this work is preclinical validation and mechanistic dissection
of HD model mice, I have also undertaken analyses to set the stage for future
work.The most promising of the candidate genes will ultimately be overexpressed in
these murine models to determine whether increased expression ameliorates the HD-
relevant phenotypes. Thus, I have characterised a panel of phenotypes in two HD
mouse models, including a novel behavioural paradigm known as the burrowing assay.
I also performed extensive optimisation of an intranasal delivery technique for
lentiviruses, in order to mediate overexpression of gene candidates.

27
Chapter 2
Exploring the functional role of splicing factors in models of
Huntington’s disease
2.1 Introduction
Gene ontology analysis of hits from the yeast genetic modifier screen carried in the
laboratory by Dr Robert Mason, uncovered nine genes implicated in mRNA splicing
(unpublished; see Chapter 1). Here were aimed to characterise and validate these
splicing genes in our HD cellular models.
The majority of these genes belong to the HNRNP class of splicing factors, with the
remainder largely encoding structural components of the spliceosome. Many of the
splicing factors display similar cellular roles, and as such share some structural
similarities (see Figure 2.1).

28
Figure 2.1. Schematic representation of the murine structures of each of the putative
HTT suppressor proteins. CRNKL1 contains a NLS (nuclear localisation signal) domain, as
well as polyproline region (poly P) and 16 HAT (half a TPR) repeat, the latter of which
facilitate protein to protein interactions within large molecular complexes. EFTUD2 is a
GTPase made up of five domains (G domains). HNRNPF, HNRNPK and HNRNPU contain
either RNA recognition motifs (RRM) or K homology RNA binding domain (KH), all of
which facilitate interactions with RNA transcripts. In addition to its RRM domain,
HNRNPQ also possesses a NLS domain. HNRNPU contains a number of domain relating to
its nuclear function, including a DNA binding SAP (SAF A/B, Acinus, PIAS) domain, an ATP
binding domain, an RNA binding domain rich in arginine and glycine (RGG) and a domain
of unknown function, the SPRY domain. The splicing factor, SFRS3 also contains a single
RRM domain. SNRPB contains a repeat rich regions, which may serve to facilitate protein-
protein interactions. TARDBP contains three RNA binding domains, two RRM and one
RGG domain. All structural information was obtained from the Uniprot database.
29
2.11 Splicing suppressor genes
CRNKL1 (also known as CLF, CRN, Clf1, HCRN, SYF3 and MSTPO21)
The CRNKL1 (crooked neck pre-mRNA splicing factor 1) gene encodes a scaffolding
protein which is essential for spliceosome assembly. In humans, this role is believed to
be mediated by the numerous tetratricopeptide (TRP) motifs present throughout the
body of the protein. These motifs facilitate interactions between the constituent
proteins making up large complexes, such as the anaphase promoting complex (APC)
and indeed the spliceosome (Amada et al., 2003). During spliceosome assembly,
CRNKL is thought to interact with the U4/U5.U6 trimer and the prespliceosome
complex, facilitating the transition to mature spliceosome. Consistent with this role,
deletion or mutation of CRNKL1 results in the accumulation of pre-mRNA in vivo
(Chung et al., 1999, Chung et al., 2002). The importance of this protein during
development has been highlighted by the early embryonic lethality seen in mutant
Drosophila models, an effect attributed to splicing defects that are most prominent in
the central and peripheral nervous systems (Zhang et al., 1991, Amada et al., 2003,
Edenfeld et al., 2006).
EFTUD2 (also known as SNRP116, SNU114, MFDGA, MFDM and U5-116KD)
EFTUD2 (elongation factor Tu GTP binding domain containing 2) encodes the GTPase
Snu114. This protein regulates the unwinding of U4/U6, and therefore catalytic
activation of the spliceosome, and also the disassembly of the active spliceosome
following mRNA splicing (Bartels et al., 2002). In both cases, Snu114 brings about such
changes indirectly, modulating the activity of Brr2p, an ATPase and component of the
U4.U5.U6 trimer (Small et al., 2006). When bound to GTP, Snu114 activates Brr2p,
which in turn stimulates unwinding of U2/U6. Following spliceosome activation, the
GTP is hydrolysed and the GDP-bound Snu114 represses further Brr2p activity,
stabilising the spliceosome’s catalytic core. The sequential excision of the intronic
region signals for a reversion to the GTP bound state of Snu114, thereby lifting the
repression on Brr2p. This stimulates the release of the intron lariat and spliceosome
disassembly (Small et al., 2006, Frazer et al., 2009). Similar to CRNKL1, depletion of
EFTUD2 results in an accumulation of pre-mRNA, thus illustrating an integral role in

30
mRNA splicing (Fabrizio et al., 1997). Mutations in this gene have been identified as
the cause of mandibulofacial dysostosis with microcephaly (MFDM), a condition
synonymous with delays in brain development, a cleft palate and hearing loss (Lines et
al., 2012).
HNRNPF (also known as HNRPF)
HNRNPF encodes HNRNPF, a splicing factor and member of the hnRNP family of
proteins. Like many of the factors belonging to this family, HNRNPF predominantly
stimulates exon inclusion. This splicing factor binds to sequences containing a GGG
motif found at the end of an intron, and working in unison with other HNRNPs, such as
HNRNPA or HNRNPB, which bind to the opposing flanking end of this region. The
concerted actions of these HNRNPs define the intron, and facilitate the “looping out”
of the intron during mRNA splicing (Martinez-Contreras et al., 2006). HNRNPF is
regulated by the posttranslational modification of its GYR (glycine-tyrosine-arginine
rich) domain, a region that governs import into the nucleus via import transporter
importin 2 (Trn2) (Van Dusen et al., 2010). It has been postulated that in addition to
this general role in mRNA splicing, HNRNPF may also serve a more specific role. For
example HNRNPF is a crucial component of the neural-specific complex that regulates
the splicing of the proto-oncogene, c-Src, which encodes tyrosine kinase. In neuronal
cells, c-Src contains an additional SH3 (Src homology 3) domain, and antibody
inhibition of HNRNPF has been shown to lead to the exclusion of the exon encoding
this domain (Roskoski, 2004, Min et al., 1995). However, the functional consequences
of the inclusion of this domain in neuronal cells is unclear.
HNRNPK (also known as CSBP, HNRPK, TUNP, KBBP, NOVA)
HNRNPK encodes HNRNPK, which unlike other member of the HNRNP family has a
multitude of roles in addition to mRNA splicing including chromatin remodelling,
transcription and translation (Bomsztyk et al., 2004). Moreover, protein interaction
studies suggest that only 20% of HNRNPK is present in complexes implicated in RNA
splicing (Mikula et al., 2006). Of this relatively small proportion, HNRNPK regulates the
splicing of a number of genes encoding apoptotic proteins, including pyrin domain
containing 1 (NALP1) and B-cell lymphoma extra-large (BCL-xl) (Venables et al., 2008).

31
For example, HNRNPK was shown to elicit an exon exclusion event in NALP1. In the
case of the anti-apoptotic protein BCL-xl, HNRNPK represses the removal of a short
exon found between exons 2 and 3 (denoted exon 2.1) leading to formation of a pro-
apoptotic protein referred to as BCL-xs, a splicing event stimulated by its sister
protein, HNRNPF (Revil et al., 2009, Garneau et al., 2005). This illustrates the
bidirectional nature of HNRNPK as a splicing effector, and the opposing effects of
members of the HNRNP family (Venables et al., 2008).
Although HNRNPK has been implicated in a number of forms of cancer, including
colorectal cancer and carcinoma, it’s involvement in neurodegeneration has not been
investigated (Roychoudhury and Chaudhuri, 2007, Carpenter et al., 2006). However
several other proteins containing a K homology (KH) RNA-binding domain, a
characteristic feature of HNRNPK, regulate neural specific splicing. For instance the KH
domain contained within neuro-oncological ventral antigen 1 (NOVA-1) protein
regulates the splicing of the α2 subunit of glycine receptor (GlyRα2) and γ-
aminobutyric acid receptor type A γ2 subunit (GABA A Rγ2). Mice lacking NOVA-1
display symptoms similar to those seen in paraneoplastic opsoclonus myoclonus
ataxia (POMA), a condition stemming from a loss of inhibitory regulation of motor
neurons in the brainstem and spinal cord (Musunuru and Darnell, 2001, Dredge et al.,
2001). Further to this, overexpression of KH domain-containing mushroom body
expressed (mub), an essential splicing factor, exacerbates disease phenotypes in a
spinocerebellar ataxia type 1 Drosophila model (Grams and Korge, 1998, Fernandez-
Funez et al., 2000).
While mRNA splicing may be the main function of many of the other member of the
HNRNP family, HNRNPK has primary roles in both transcription and translation. For
example, HNRNPK is involved in the transcriptional regulation of the oncogene, c-myc.
HNRNPK binds to the C-rich (CT) element located upstream of this gene and the
RNAPII machinery, stimulating transcription (Michelotti et al., 1996). Interestingly,
while hnRNPF regulates expression of c-Src at a splicing level, hnRNPK governs the
translation of this enzyme, binding to the 3’ untranslated region of the mRNA and
preventing ribosome formation (Naarmann et al., 2008).

32
HNRNPQ (also known as GRYRBP, SYNCRIP, NSAP1, PP68)
HNRNPQ encodes for HNRNPQ, a splicing factor known predominantly to induce exon
inclusion (Venables et al., 2008). One of the several gene targets linked to HNRNPQ is
SMN2, the inherently mutated gene which is exposed following mutations within its
sister gene, SMN1 in the condition SMA (see Figure 1.7). HNRNPQ binds exon 7 of the
SMN2 mRNA transcripts, and stimulate exon inclusion, leading to the formation of the
functional protein (Chen et al., 2008).
In addition to a role as a splicing factor, hnRNPQ has been implicated in the regulation
of translation and localisation of mRNA transcripts. In the former role, HNRNPQ binds
to the 5’ untranslated region of mature transcripts encoding the tumour suppressor
protein p53, thereby stabilising the RNA for translation and facilitating apoptosis (Kim
et al., 2013). The capacity to bind and stabilise mRNA, as well as non-coding RNA, is of
great importance in neurons, whereby HNRNPQ forms a components of the RNA
granules transported to neuronal dendrites. These structures allow the neuron to
regulate protein synthesis away from the main cell body, and depletion of HNRNPQ
alters the distribution of these granules (Bannai et al., 2004, Chen et al., 2012). For
example, HNRNPQ binds to the mRNA of components making up the Cdc42/N-
WASP/Arp2/3 (cell division control protein 42/ neuronal Wiskott-Aldrich syndrome
protein/ actin-related protein 2/3) complex which governs actin polymerisation, and in
turn migration at the leading edge of neuronal cells. Loss of HNRNPQ alters the
transport of these mRNA transcripts, leading to dispersal throughout the cell body.
Consequently neurons exhibit an altered morphology with an increased degree of
neurite complexity (Chen et al., 2012).
HNRNPQ has also been shown to bind non-coding RNA, such as brain cytoplasmic RNA
200nt (BC200 RNA), a neuron-specific component of mRNA transport complexes
believed to regulate protein synthesis at the dendrites, and thus maintaining synaptic
plasticity (Duning et al., 2008). This short nucleic acid declines with aging, and is
significantly increased and mislocalised in the brains of AD sufferers. These
observations have led some to theorise an ineffective compensatory mechanism
employed by neurons affected by AD, particularly those of the cortex, to stave off

33
synaptic degeneration (Mus et al., 2007). HNRNPQ is postulated to recruit BC200 into
the mRNA complexes, facilitating its transport to the dendrites, and its subsequent
inhibition of translational machinery (Duning et al., 2008). This inhibition is reversed
by poly(A)-binding protein (PABP), which shares the binding site with HNRNPQ,
illustrating potential competition and further translational regulation at the dendrites
(Kondrashov et al., 2005).
HNRNPU (also known as HNRNPU, SAFA, U21.1, RP11-11N7.3)
HNRNPU encodes for the largest member of the HNRNP family, and is confined solely
to the nucleus. It has the capacity to interact with a range of proteins and nucleic acids
as well as the nuclear matrix, leading to its initial characterisation as the nuclear
scaffolding attachment factor A (SAFA). As a nuclear matrix factor, HNRNPU has been
linked to a number of processes including transcription, X chromosome inactivation
and mRNA splicing (Roshon and Ruley, 2005, Hasegawa et al., 2010, Kukalev et al.,
2005). However, while other members of this protein family modulate the splicing of
specific genes, HNRNPU predominantly exerts an effect on splicing at a global level,
regulating the maturation of the U2 snRNP. It is proposed that HNRNPU may govern
the intranuclear transport of this spliceosome component, either by re-directing or
sequestering the protein (Xiao et al., 2012). Depletion of HNRNPU results in an
increase in the pool of U2 snRNP available for incorporation into the spliceosome, as
well as increased levels of both exon inclusion and exon skipping events. These
changes in splicing are thought to be dependent on the relative strength of both the 5’
and 3’ splice sites. During exon definition, the 5’ splice site is believed to influence the
recognition of the upstream 3’ splice site and U2 snRNP binding. Splice sites of equal
strength thereby facilitates exon inclusion, an effect enhanced by increased levels of
U2 snRNP. Conversely a weak 5’ splice site can diminish the recognition of its
corresponding 3’ splice site, leading to exon skipping. This effect is enhanced upon
depletion of HNRNPU and the resulting increase in U2 snRNP. The role of HNRNPU is
therefore crucial in maintaining both the levels of this spliceosome component and
the delicate balance of splicing events that it regulates (Xiao et al., 2012).
34
As a splicing factor, hnRNPU has very few recognised target genes, one of which is
caspase-9. This cysteine protease is a precursor of apoptosis, and is activated by the
apoptosome. Once activated, it triggers a cascade of downstream caspases in the cell
death pathway. Caspase-9 has two splice variants differing at exons 3-6, the inclusion
of these 4 exons leads to the formation of pro-apoptotic caspase-9a isoform, while
exclusion of this cassette generates the anti-apoptotic caspase-9b. HNRNPU binds to
exon 3 of immature mRNA transcripts and stimulate exon inclusion, while binding of
the phosphorylated form of its sister protein, HNRNPL, represses such splicing event
(Vu et al., 2013).
SFRS3 (also known as SRP20, X16)
SFRS3 encodes for the splicing factor SFRS3, a member of the SR family. Like other SR
proteins, SFRS3 contains an RRM domain to facilitate the binding of RNA. This protein
also contains an RS domain, allowing for interaction with other proteins, a crucial
function that defines splice sites for spliceosome binding (Huang and Steitz, 2005).
SFRS3 has been implicated in several cellular processes, including the β-catenin
pathway regulating stem cell regeneration, cellular senescence as well as wound
healing. (Tang et al., 2013, Goncalves et al., 2008, Li-Korotky et al., 2006).
Furthermore, SFRS3 is crucial for the formation of blastocysts during embryonic
development, with mouse embryos mice lacking the gene failing to progress pass the
early morula stage (Jumaa et al., 1999).
While many SR proteins are located in the nucleus, SFRS3 has the capacity to shuttle
between the nucleus and the cytoplasm. SFRS3 may only traverse the nuclear
membrane when attached to intronless mRNA, and mediates this export via its RS
domain (Caceres et al., 1998). Although the role of SFRS3 in the cytoplasm is largely
unknown, given that this splicing factor has been shown to interact with ribosome 80s,
some have speculated a role in coupling splicing to translation (Sanford et al., 2004).
Recently SFRS3 has been linked to AD, regulating the splicing of tropomyosin receptor
kinase B (TrkB), a receptor protein found in the BDNF signalling pathway (Wong et al.,
2012). TrkB exists as three distinct splice variants, the full length protein encoded by
the transcript denoted TrkB-TK+, and two truncated protein forms encoded by
35
transcripts defined as TrkB-TK and TrkB-Shc (Stoilov et al., 2002). The truncated forms
possess either exons 16 or 19 respectively, both of which contain translational stop
signals. While all three proteins retain the capacity to bind BDNF, only the full length
receptor elicits the downstream signalling cascade that promotes neuronal survival
and plasticity. The ratio of the three transcripts is skewed in favour of TrkB-Shc in the
hippocampus of AD sufferers, contributing to the neuronal degeneration. The
increased formation of this variant has been linked to the elevated levels of SFRS3
observed in AD, which stimulates the inclusion of exon 19. Knockdown of this splicing
factor was confirmed to significantly reduce the generation of TrkB-Shc and in turn
rescue disease phenotypes. This demonstrates a role played by splicing in
pathogenesis of AD, and potentially other neurodegenerative diseases (Wong et al.,
2012).
SNRPB (also known as COD, SNRPB1, SMB, SM11)
SNRPB (small nuclear ribonucleoprotein polypeptide B) encodes for SMB, a member of
the Sm family of proteins. This group of proteins are defined by a Sm domain that
facilitates interactions with other members of this family. During formation of the
mature snRNP spliceosomal components, seven Sm proteins, B, D1, D2, D3, E, F and G,
come together to form the snRNP subcore particle, subsequently binding either U1,
U2, U4/U6 or U5 snRNA to form the corresponding snRNPs (Urlaub et al., 2001).
Unlike other higher organisms, which solely express SMB, humans possess two splice
variants of this protein, the second of which being termed SMB’. These two variants
differ only by an additional 9 amino acids found at the carboxy-terminal end of the
SMB’ isoform, which appears to be functionally redundant (Vandam et al., 1989). The
SMB proteins are expressed in all cell types except neuronal cells, where they are
replaced by the orthologous SMN protein, encoded by the paternally imprinted
SNRPN gene. In conditions such as Prader-Willi syndrome, loss of SMN is met by an
upregulation of both SmB and SmB’, thereby compensating for the deficit and
alleviating the phenotype synonymous with this condition (Gray et al., 1999).

36
TARBBP (also known as ALS10, TDP-43)
TARDBP (transactive response region DNA binding protein) encodes for TARDBP, a
member of the HNRNP family of protein found in both the nucleus and the cytoplasm.
This splicing factor binds to more than 6000 RNA transcripts, many of which encodes
for proteins involved in neuronal functioning, including SMN2, myocyte enhancer
factor 2D (MEF2D) and MAP-kinase activating death domain (MADD) (associated with
SMA, PD and AD respectively) (Lee et al., 2012, Tollervey et al., 2011). Knockdown of
TARDBP in the adult mouse brain alters the splicing of more than 1000 mRNA
transcripts, especially those involved in synaptic plasticity and/or involving containing
long introns (Polymenidou et al., 2011). Knockout of the TARDBP gene also causes
early embryonic lethality, illustrating a pivotal role in development (Sephton et al.,
2010).
Following analysis of TARDBP-binding proteins, it became apparent that this protein
possesses a multitude of functions throughout the cell, dependent on cell type and
temporality. These roles including regulation of transcription and translation, in
addition to splicing, and TARDBP may serve to link these processes (Freibaum et al.,
2010, Sephton et al., 2012).
Mutations within the TARDBP gene have been linked to several neurological disorders
that have been grouped under the umbrella term, TDP-43 proteinopathies. In
conditions such as amyotrophic lateral sclerosis (ALS) and frontotemporal lobar
degeneration (FTLD), TARDBP undergoes aberrant post-translational modifications,
including phosphorylation and ubiquitinylation, which subsequently results in its
mislocalisation to the cytoplasm, loss of nuclear function and the formation of
TARDBP aggregates and inclusions (Lee et al., 2012). In common with other
proteinopathies, these inclusions disrupt a myriad of cellular processes and are
compounded further by the autoregulatory properties displayed by this protein. When
TARDBP levels rise above a homeostatic threshold, increased binding to the 3’-UTR of
its own mature transcript reduces mRNA stability and brings about destruction via
nonsense mediated decay (NMD). When mutated forms of the TARDBP aggregate and
37
form inclusion bodies, this autoregulatory mechanism stimulates the increased
synthesis TARDBP, exacerbating its aggregation (Buratti and Baralle, 2011).
Several groups have demonstrated a role of TARDBP in the pathogenesis of other
neurodegenerative diseases, including HD. In neuronal cell models and human brain
tissue TARDBP co-localises with mutant HTT inclusions in the cytoplasm, and this
interaction is facilitated by the glutamine/asparagine (Q/N) rich region located the C-
terminus of TARDBP (Fuentealba et al., 2010). Sequestration away from the nucleus
results in a loss of TARDBP-mediated splicing, which may exacerbate the HD
phenotype (Fuentealba et al., 2010, Schwab et al., 2008). Although overexpression of
TARDBP alone was found to convey some cytotoxicity, due to its own inherent
propensity to aggregate - its overexpression can suppress mutant HTT toxicity by
restoring its nuclear function (Fuentealba et al., 2010). Conversely, TARDBP loss-of-
function mutations in C.elegans and RNAi knockdown in striatal cell lines suppress
mutant HTT toxicity, and delay neuronal degeneration in the former. Although the
mechanism by which a reduction in TARDBP alleviated the HD phenotype in these
models was unclear, suppression was dependent upon the TARDBP-interacting
protein, survival factor progranulin (PGRN) (Tauffenberger et al., 2013).
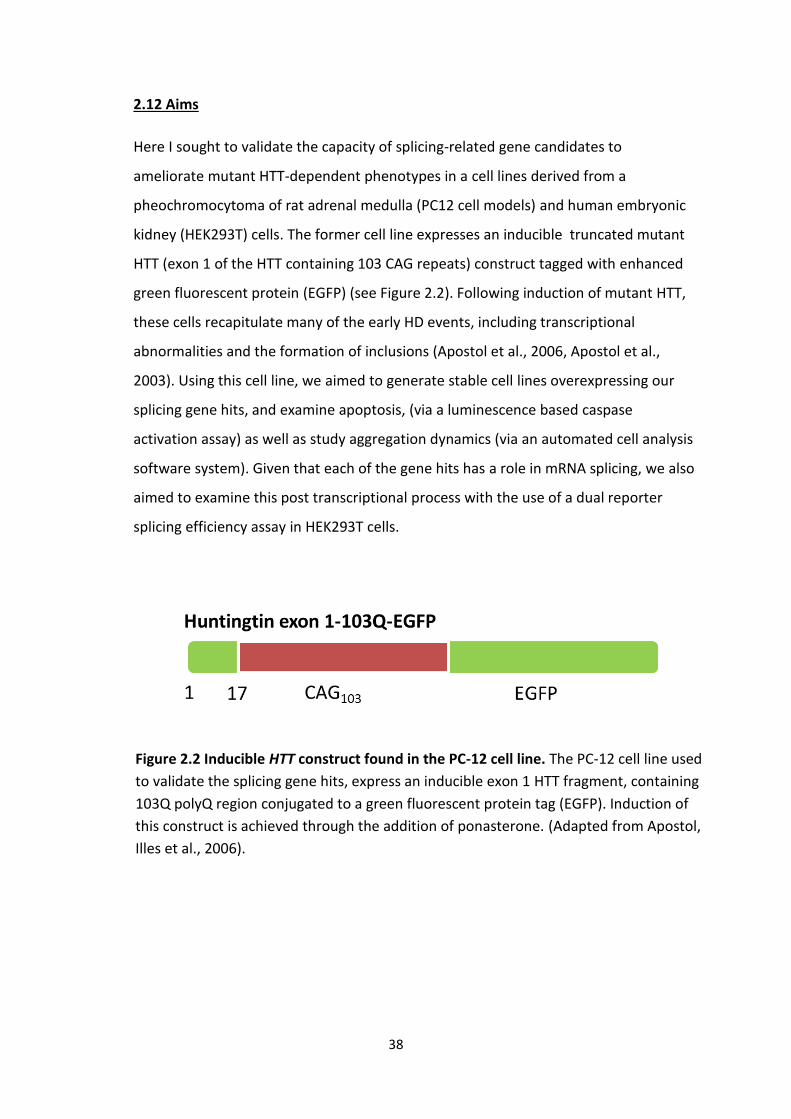
38
2.12 Aims
Here I sought to validate the capacity of splicing-related gene candidates to
ameliorate mutant HTT-dependent phenotypes in a cell lines derived from a
pheochromocytoma of rat adrenal medulla (PC12 cell models) and human embryonic
kidney (HEK293T) cells. The former cell line expresses an inducible truncated mutant
HTT (exon 1 of the HTT containing 103 CAG repeats) construct tagged with enhanced
green fluorescent protein (EGFP) (see Figure 2.2). Following induction of mutant HTT,
these cells recapitulate many of the early HD events, including transcriptional
abnormalities and the formation of inclusions (Apostol et al., 2006, Apostol et al.,
2003). Using this cell line, we aimed to generate stable cell lines overexpressing our
splicing gene hits, and examine apoptosis, (via a luminescence based caspase
activation assay) as well as study aggregation dynamics (via an automated cell analysis
software system). Given that each of the gene hits has a role in mRNA splicing, we also
aimed to examine this post transcriptional process with the use of a dual reporter
splicing efficiency assay in HEK293T cells.
Figure 2.2 Inducible HTT construct found in the PC-12 cell line. The PC-12 cell line used
to validate the splicing gene hits, express an inducible exon 1 HTT fragment, containing
103Q polyQ region conjugated to a green fluorescent protein tag (EGFP). Induction of
this construct is achieved through the addition of ponasterone. (Adapted from Apostol,
Illes et al., 2006).

39
2.2 Materials and methods
2.21 Materials
2.211 Bacterial strains and cell lines
Escherichia coli strain
The DH5α bacterial strain was used during the course of the study, with the genotype:
F– Φ80lacZΔM15 Δ(lacZYA-argF) U169 recA1 endA1 hsdR17 (rK–, mK+) phoA supE44
λ– thi-1 gyrA96 relA1.
PC12 (adrenal gland pheochromocytoma) cell line
The Htt14A2.5 cell line was generated as described in Apostol at el (2003), expressing
an inducible truncated IT15 construct consisting of amino acids 1 to 17, followed by a
103Q poly-glutamine tract, conjugated to an EGFP encoding gene (all of which cloned
into pIND vector) (Apostol et al., 2003).The cells were maintained in 75 cm2 culture
vessels (Cellstar, Greiner) at 37 oC, 5% CO2, in a high glucose (5%) Dulbecco’s modified
eagle media (DMEM) (Life Technologies) supplemented with 10% heat inactivated
fetal bovine serum (FBS) (Life Technologies), 1% penicillin/streptomycin (PAA
LABORATORIES LTD) and 1% L-glutamate (PAA Laboratories Ltd).
Upon reaching 80% confluency, the media was aspirated off the cells and replaced
with 5 mL 2 mM EDTA (pH 8.0) (Gibco) in 1X Phosphate buffered saline (PBS) (PAA
Laboratories Ltd). To facilitate detachment, cells were incubated at room temperature
for several minutes and agitated. 5 mL of media was then added to flasks and 1 ml of
harvested cells transferred to a fresh culture flask, containing 10 ml of media.
HEK293T (human embryonic kidney) cell line
The tetracycline resistant strain of a cell line, first generated by Graham et al (1977), is
derived from primary HEK cells, putatively immature neurons (Graham et al., 1977,
Shaw et al., 2002). Cells were maintained at 37 oC, 5% CO2 in high glucose DMEM,
containing 10% FBS and 1% penicillin/streptomycin and were generously donated by
Dr Miguel Martins, MRC toxicology, Leicester, UK.
40
2.212 Constructs
pIREShyg3 overexpression construct
Genes hit were amplified from a murine cDNA library (pDEST), and cloned into the
multiple-cloning site of the pIREShyg3 vector, fused in frame with a red fluorescent
protein (RFP)-encoding gene. Given the presence of the internal ribosome entry point
(IRES) between the cDNA-RFP open reading frame (ORF) and the hygromycin
resistance gene ORF, the expression of both ORFs were conjugated.
pRRL-cPPT-CMV-X2-PRE-SIN
The pLENTI constructs expressed 25Q, 47Q, 72Q or 97Q exon 1 HTT fragment
conjugated to GFP and were cloned into the vector plasmid with the use of the SmaI
site. The constructs were generated by Chrstine Cheah and Flaviano Giorgini (Kwan et
al., 2012)
TN23 splicing efficiency construct
The splicing efficiency construct encodes β-galactosidase and luciferase reporter genes
which are separated by an intron flanked by recombinant fragments encoding
adenovirus and skeletal muscle isoforms of human tropomyosin. The introns contain
three in-frame translational stop signals, which prevent luciferase expression when
the construct is inadequately spliced. Splicing efficiency can be determined by
analysing the activity of luciferase in relation to the constitutively expressed β -
galactosidase activity (Nasim and Eperon, 2006). The construct was kindly donated by
Professor Ian Eperon, Biochemistry Department, University of Leicester, UK.
pCDNA 3.1 RFP construct
An RFP construct was used during transfection as a control. The construct was
generated by Dr Mariaelena Repici, and kindly donated to this study

41
2.213 Media and agar
Luria-Bertani agar (LB)
E.coli was grown on selective agar plates, consisting of 1% (w/v) tryptone (Oxoid),0.5%
(w/v) yeast extract (Oxoid), 0.5% sodium chloride (Fisher) and 1% agar (Bioline). The
final pH was adjusted to 7.2 and the agar sterilised via autoclaving. Prior to use, and
while in the molten state, the agar was supplemented with ampicillin (Melford), with a
final concentration of 10 μg/mL.
Luria-Bertani media (LB)
The bacterial strain was also grown in liquid media, composed of the same
constituents as the solid media, though lacking agar.

42
2.22 Methods
2.222 Generation of overexpression cell lines
Polymerase chain reaction (PCR)
Gene hits were amplified from a murine cDNA library (generated by Dr Robert Mason),
with primers containing restriction sites allowing cloning into the pIREShyg3 vector
(see Table 2.1) (TARDBP had previously been cloned by Dr Robert Mason). The
amplification, as originally developed in (Mullis and Faloona, 1987), was performed in
a thermocycler (Applied Biosystems 2720 thermocycler and G-storm dual 48 block
thermocycler) with the use of Phusion High Fidelity polymerase (Thermo Scientific)
according to manufacturer guidelines. A typical 50 μL PCR reaction comprised 100 ng
template DNA template; 2.5 μL of forward and reverse primers (Primers were
generated by Sigma-Aldrich, and diluted down to 10 μM stock); 1 μL of dNTP mix (100
mM (Promega)), 10 μL of 5x HF Phusion reaction buffer, 0.5 μL of Phusion enzyme (1
unit) and 32.5 μL of sterile distilled water.
The reaction consisted of an initial denaturation step of 30 seconds at 98 oC, followed
by 35 cycles consisting of 10 seconds at 98 oC, 30 seconds at the temperature stated in
Table 2.1, and a short period (governed by the length of gene, i.e. 30 seconds for every
500 nucleotides) at 72 oC. After cycling, amplification ended with a final 7 minute hold
at 72 oC.
Gel electrophoresis
PCR amplicons were visualised with the use of gel electrophoresis. Given the small
sizes of the fragments, a 0.8% agarose gel was used for the separation. Gels were
made by dissolving agarose (Seakem, Lonza) in 1x Tris-borate-EDTA (TBE) (10x stock
consisted of 108 g Tris, 55 g Boric acid in 900 mL of water, and 40 mL of 0.5 M
Na2EDTA pH8.0) and supplemented with ethidium bromide while in a molten state.
Upon solidification, gels were placed in gel tanks and immersed in 1x TBE. 5x loading
dye (Bioline) was added to samples, and subsequently loaded onto the gel. 5 μL of the
molecular weight marker, Hyperladder I (Bioline) run alongside samples. An electrical
current was applied to the gel to facilitate separation of fragments.

43
PCR clean up
Primers, salts and other PCR reaction components were removed from reactions using
the E.Z.N.A cycle pure kit (Omega Biotek) according to manufacturer guidelines.
Restriction digest
Following validation with the use of gel electrophoresis and the removal of PCR
reaction components, fragments were digested overnight at 37 oC with the
appropriate restriction enzymes (New England Biolabs Ltd. (NEB)) (see Table 2.1). The
42 μL digest reactions typically contained 30 μL of plasmid (approximately 150 ng/μL);
4 μL of the appropriate 10x NEB reaction buffer; 4 μL of 10x NEB bovine serum
albumin (BSA); 2 μL of each of the endonuclease (20 units).
Gene Hit Forward primer (5’-3’)
Reverse primer (5’-3’)
Tm (oC)
Restriction sites
Amplicon size (bp)
CRNKL GATCTGTACAGTCATGGCAGCCTCCACG
AGCTGCTAGCGCAAAAGATGAGGATTCACTCTCATC
54 BsrgI and NheI
2073
EFTUD2 GATCGCTAGCAACATGGATACTGACTTGTATGATG
AGCTCCCGGGGCCATGGGATAATTGAGCACAACATCC
49 NheI and XmaI
2919
HNRNPF GATCTGTACAGATATGATGCTGGGCCCTGAG
AGCTCCCGGGGCATCATATCCGCCCATGCTGT
56 BsgI and XmaI
1248
HNRNPK GATCTGTACAGATATGGAGACCGAACAGCCAGA
AGCTGCTAGCGCGAAAAACTTTCCAGAATACTGCTTCAC
51 BsrgI and NheI
1392
HNRNPQ GATCGCTAGCAACATGGCTACAGAACATGTTAATGG
AGCTCCCGGGGCCTTCCACTGTTGCCCAAAAG
54 NheI and XmaI
1872
HNRNPU GATCTGTACAGATATGAGTTCTTCGCCTGTTA
AGCTGCTAGCGCATAATATCCTTGGTGATAATGCTGAC
50 BsrgI and NheI
2403
SFRS3 GATCTGTACAGATATGCATCGTGATTCCTGTCC
AGCTGCTAGCGCTTTCCTTTCATTTGACCTAGATCGG
54 BsrgI and NheI
495

44
E.coli Transformation
To generate a sufficient quantity of pIREShyg3 for subsequent digestion, the vector
plasmid constructs were initially transformed into chemically competent E.coli for
subsequent plasmid prepartions.
E.coli were made competant using the method described in (Mandel and Higa,
1970).Following growth at 37 oC with agitation, the density of cells was determined
with the use of a spectrophotometer (Spectronic Unicam) at the 600 nm (OD600). Upon
reaching a density of approximately 0.5, cells were centrifuged at 3000 rpm for 10
minute at 4 oC. Cell pellets were washed in ice cold distilled water, suspended in ice
cold 0.1 M CaCl2 (Sigma-Aldrich), and incubated on ice for 90 minutes. Cells were then
centrifuged for a further 5 minutes at 3000 rpm, and re-suspended in 0.1 M CaCl2 15%
glycerol (Fisher Scientific). The suspended cells were stored at -80 oc for further use.
Prior to transformation, competent cells were thawed on ice. 50 ng of plasmid DNA
was added to cells, which were then incubated on ice for 20 minutes. Cells underwent
heat shock at 42 oc for a further 2 minutes, and were subsequently stored on ice for 2
minutes. LB media was added to bacterial samples, which were then incubated at 37
oc to facilitate phenotypic recovery. Finally cells were pelleted at 13000 rpm for 1
minute, re-suspended in sterile distilled water and plated on selective LB plates.
Plasmid extraction
Single colonies were inoculated into 5 mL of liquid LB and grown 37 oC, with agitation
at 220 rpm, overnight. Plasmids were extracted and purified using the E.Z.N.A Plasmid
Miniprep Kit 1 (Omega Biotek) following the instructions supplied by the
manufacturers, and based on the original protocol described in (Birnboim and Doly,
1979).
SNRPB GATCTGTACAGATATGACGGTGGGCAAGAGC
AGCTGCTAGCGCAAGCAGACCTCGCATGCC
57 BsrgI and NheI
696
Table 2.1. Primers for amplification of candidate genetic modifiers. The putative
suppressors were amplified from a mouse cDNA library, using primers containing
restriction sites to allow insertion into the multiple cloning site of the pIREShyg3 vector.
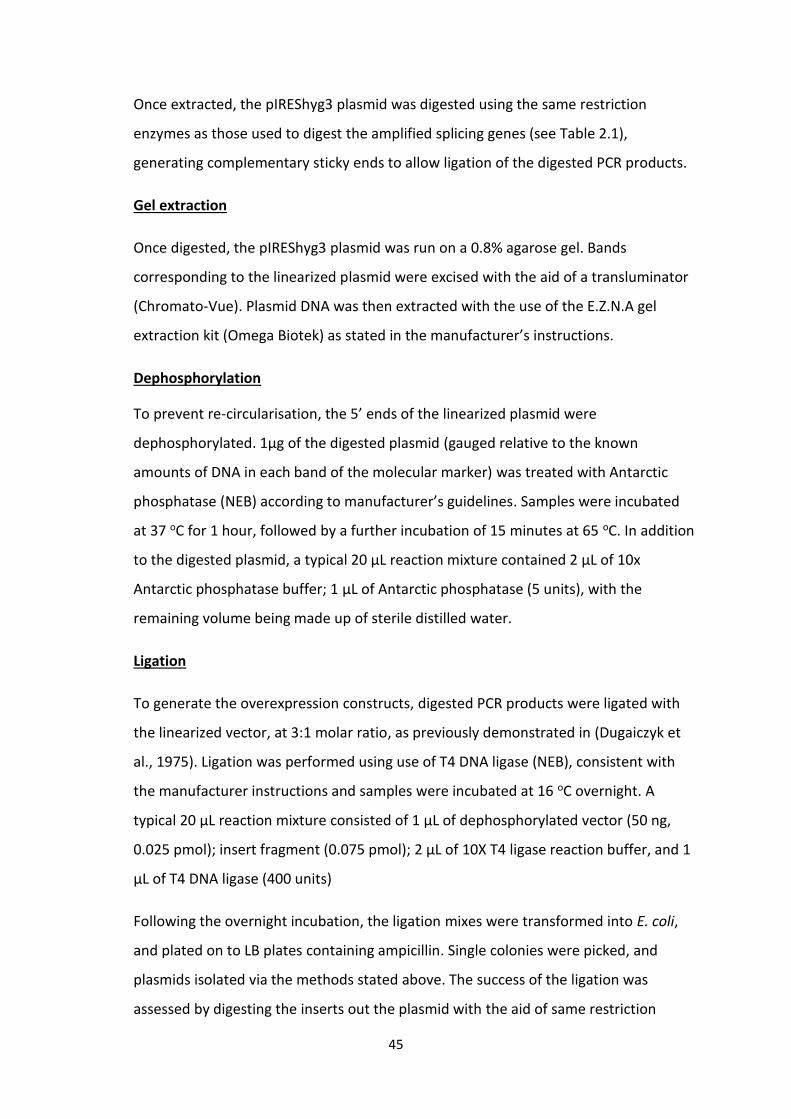
45
Once extracted, the pIREShyg3 plasmid was digested using the same restriction
enzymes as those used to digest the amplified splicing genes (see Table 2.1),
generating complementary sticky ends to allow ligation of the digested PCR products.
Gel extraction
Once digested, the pIREShyg3 plasmid was run on a 0.8% agarose gel. Bands
corresponding to the linearized plasmid were excised with the aid of a transluminator
(Chromato-Vue). Plasmid DNA was then extracted with the use of the E.Z.N.A gel
extraction kit (Omega Biotek) as stated in the manufacturer’s instructions.
Dephosphorylation
To prevent re-circularisation, the 5’ ends of the linearized plasmid were
dephosphorylated. 1μg of the digested plasmid (gauged relative to the known
amounts of DNA in each band of the molecular marker) was treated with Antarctic
phosphatase (NEB) according to manufacturer’s guidelines. Samples were incubated
at 37 oC for 1 hour, followed by a further incubation of 15 minutes at 65 oC. In addition
to the digested plasmid, a typical 20 μL reaction mixture contained 2 μL of 10x
Antarctic phosphatase buffer; 1 μL of Antarctic phosphatase (5 units), with the
remaining volume being made up of sterile distilled water.
Ligation
To generate the overexpression constructs, digested PCR products were ligated with
the linearized vector, at 3:1 molar ratio, as previously demonstrated in (Dugaiczyk et
al., 1975). Ligation was performed using use of T4 DNA ligase (NEB), consistent with
the manufacturer instructions and samples were incubated at 16 oC overnight. A
typical 20 μL reaction mixture consisted of 1 μL of dephosphorylated vector (50 ng,
0.025 pmol); insert fragment (0.075 pmol); 2 μL of 10X T4 ligase reaction buffer, and 1
μL of T4 DNA ligase (400 units)
Following the overnight incubation, the ligation mixes were transformed into E. coli,
and plated on to LB plates containing ampicillin. Single colonies were picked, and
plasmids isolated via the methods stated above. The success of the ligation was
assessed by digesting the inserts out the plasmid with the aid of same restriction

46
enzymes used to generate complementary fragments. Digested samples were run on a
0.8% agarose gel, with samples derived from successful ligations displaying bands
corresponding to both the vector plasmid backbone and the splicing hit cDNA.
Sequencing
Recombinant plasmids were validated by Sanger sequencing. A typical 10 μL reaction
consisted of 300ng of purified plasmid combined with 2 μL of sequencing primers
(1μM stock, with a final concentration of 0.1 μM) (see table 2.2); 2 μL of 5X BigDye
reaction buffer and 1μl of BigDye® Terminator v3.1 ready reaction mix. Samples were
then placed into a thermal cycler (Applied Biosystems 2720 thermocycler) and were
initially denatured for 1 minute at 96 oC, followed by 25 cycles, made up of a 10
seconds at 96 oC; 5 seconds at 50 oC; and 4 minutes at 60 oC, after which samples were
held at 16oc.
To remove excess dye terminator, 10 μL of 0.4% (w/v) sodium dodecyl sulphate (SDS)
(Fisher) was added to samples, and incubated at 95 oC for 10 minutes, followed by a
further 10 minutes hold at 22 oC. Sequencing products were then purified with the aid
of the Performa Gel Filtration Cartridges (EdgeBio). Spin columns were initially
centrifuged at 2800 rpm for 3 minutes to remove storage buffer from the column
matrix. Samples were placed into the columns, which were placed into a fresh
microcentrifuge tube and centrifuged for 2800 rpm for 3 minutes. DNA sequencing
was then performed with the use of the Applied Biosystems 3730 sequencer by the
Protein Nucleic Acid Chemistry Laboratory (PNACL) services available at the University
of Leicester. Sequences were visualised with ApE- A plasmid Editor v1.12 and
compared to those obtained from the Mouse Genome Informatics (MGI) database.
47
Sequencing
Primer
Sequence (5’-3’) Tm (oC)
T7 Forward TAATACGACTCACTATAGGG 48
MRFP Reverse GCCCTCGATCTCGAACTCGTG 60
CRNKL SEQ F1 CGGTGGAGTTTTTTGGGGAT 57
CRNKL SEQ R1 CCTATGGAAGTTCCCAAAGCTC 57
EFTUD2 SEQ F1 TGAAGCTGCCTCCAACAG 56
EFTUD2 SEQ F2 CACATTGAGGTGAATCGTGT 54
HNRNPQ SEQ F1 TGGCAAAGGTAAAAGTGCTG 55
HNRNPU SEQ F1 CTTCTTCCCTTACTATGGAG 50
HNRNPU SEQ F2 AGACAAATGTGTCTGCTGCT 56
Endo-free DNA miniprep
Following examination of the sequencing data, plasmid DNA was purified with the use
of the EZNA Endo-Free Plasmid Mini Kit II. This kit allowed for the removal of
endotoxins for use in cell culture work, most notably the toxic lipopolysaccharides
(LPS) present on the cell surface of the E. coli strain. The purification was carried out
according to manufacturer guidelines.
DNA purification
Upon the removal of endotoxins, samples were further purified and concentrated by
phenol chloroform extraction. Samples were diluted to 400 μL using sterile distilled
water, transferred to screw cap 1.5 mL tubes, and mixed with an equal volume of
phenol: chloroform: Iso amylalcohol (IAA) (this solution consisted of phenol (Fisher
Scientific): cholorform (Fisher Scientific): IAA (Fisher Scientific) mixed at a 25:24:1
ratio). Samples were vortexed, centrifuged at 13,000 rpm for 10 minutes at 4 oC, and
Table 2.2. Sequencing primers for validation of mouse cDNA overexpression
constructs. Recombinant plasmids were sequenced with the use of several primer sets.
Both the T7 Forward and MRFP Reverse oligonucleotides are plasmid specific primers,
annealing to regions flanking the MCS. Several large constructs also required the use of
additional primers, which annealed to regions within the inserted DNA.
48
the aqueous phase removed to a fresh tube. Plasmid DNA was then precipitated by
the addition of 40 μL of 3 M sodium acetate (pH 5.3) (Fisher Scientific) and 800μl of
cold 100% ethanol (Fisher Scientific). Samples were incubated at -20oC for 1 hour
before being centrifuged at 4oC at 13,000 r.p.m for 15 minutes. The pelleted DNA was
washed with 1 mL of 70% ethanol, centrifuged for 5 minutes, and then washed a
second time in the same volume of 70% ethanol. Following a final centrifugation step,
the ethanol was removed and pellets dried at room temperature before being
suspended in 50 μL of cell culture grade water (PAA Laboratories Ltd).
Prior to transfection, the concentration and purity of the plasmid samples was
determined with the use of a nanophotometer (Implen). The quality of samples was
assessed at 260 nm and 280 nm wavelengths, with the ratio of the two used to
measure the purity, i.e. a 260:280 ratio of greater than 1.8 was deemed to be pure
enough for transfection.
Transfection of PC12 cells
Sub-confluent PC12 cultures were harvested and 2 x 10⁵ PC12 cells (cell number was
determined with the use of a cell counter chamber (Hawksley)) seeded into six-well
plates (Greiner) and incubated for 24 hours. Prior to seeding, the plates were coated
with 10% poly-lysine solution (Thermoscientific) diluted in 1x PBS, incubated at 37 oc
for 20 minutes, and subsequently washed several times in 1X PBS. The following day, 4
µg of plasmid DNA was diluted into 400 μL of serum-free media, along with 6 μL of the
TurbofectTM transfection reagent (Fermentas). The mixture was then vortexed for
several seconds, incubated at room temperature for 20 minutes, and added to cells in
a drop-wise manner. After 6 hours, the media was aspirated and replaced with fresh
media.
Alternatively transfection of PC12 cells was achieved via nucleofection (AMAXA). Sub-
confluent cultures were harvested and 2x10⁶ cells centrifuged at 700 rpm for 5
minutes. The resulting pellet was suspended in 2 μg of plasmid DNA diluted in 100 μL
of electroporation transfection solution (Mirus). Cells were transferred into a cuvette
and nucleofected in an AMAXA nucleofector II using programme U-29. Cell were
49
immediately transferred to six-well plates containing 3 mL of pre-warmed media,
which was changed after a further 24 hours.
After 4 days cells were passaged and maintained under selective antibiotics. Media
was supplemented with 200 µg/ml of G418 (PAA laboratories Ltd) and 200 µg/ml of
hyrogromycin B (Invitrogen) to select for the HTT construct and overexpressed cDNA
respectively, and changed every 72 hrs until resistant colonies were formed.
Freezing stable PC12 cell lines
Following several passage stable transformants were frozen for long term storage.
Cells were grown to 80% confluency, and detached using PBS supplemented with 2
mM EDTA. Cells were centrifuged at 700 rpm for 5 minutes, and the pellet suspended
in 2 mL of media/ 10% dimethyl sulfoxide (DMSO) (Sigma-Aldrich). Cells were
aliquoted and stored at -80 oC for long term use.
2.222 Validation of splicing gene hits
Caspase Assay
In order to determine whether overexpression of the splicing genes conveyed the
same suppression of mutant HTT as previously demonstrated in the yeast screen, a
caspase assay was performed on the stable cell lines. Sub-confluent cultures were
harvested and 1 x 10⁴ cells in 200 μL of media seeded in white 96-well plates
(Greiner). After 24 hours, expression of mutant HTT by the addition of of 1 μL of 1 mM
ponasterone in DMSO (working concentration of 5 μM). After an additional 72 hours,
an equal volume of caspase 3/7 Glo® reagent (Promega) was added to each of the
wells, and plates incubated for approximately 2 hours at room temperature.
Luminescence was then measured with FlUOstar Omega mircoplate reader Plate
Reader (BMG LABTECH) using the MARS data analysis software (top optic, emission
filter lens, gain 3600, and positioning delay 0.2). Background luminescence from
capase 3/7 Glo reagent added to media was subtracted from the test values, which
were subsequently normalised to untransfected control cells.
50
RNA isolation
RNA was isolated from PC12 cell lines using the method originally developed by
(Chomczynski and Sacchi, 1987). PC12 cells were seeded in poly-lysine coated 6-well
plates at a seeding density of 2 x 10⁵ cells, and allowed to grow for 72 hours in 3 mL of
growth media. After the 3 days, the media was then removed and replaced with 1 mL
of TRI reagent (Sigma-Aldrich), for 5 minutes. Cell lysates were then transferred to
screw cap 1.5 mL micro-tubes, 0.2 mL of chloroform added, and samples incubated at
room temperature for 15 minutes. Samples were centrifuged for 15 minutes at 13,000
rpm at a temperature of 4 oC, and the RNA-containing upper phase transferred to a
fresh micro-tube, mixed with 0.5 mL of isopropanol (Fisher Scientific) and incubated at
room temperature for 10 minutes. Samples were centrifuged at 13, 000 rpm for 10
minutes, and the pelleted RNA pellet washed twice in 1 mL of 70% ethanol and
centrifuged at 7,500 rpm for 5 minutes. Samples were air dried and suspended in 50
μL RNAase/DNAase-free distilled water (Life Technologies). The concentration and
purity of samples were determined using a nanophotometer.
Reverse Transcription and Quantitative Real-Time PCR (QPCR)
250 ng of isolated RNA was reverse transcribed to form single stranded cDNA, using
the instructions supplied by manufacturers of the ImProm-II™ Reverse Transcription
System kit (Promega). Initial 5 µL reaction mixtures consisting of 250 ng of RNA, 1μL of
Oligo (dT)15 and sterile distilled water were incubated at 70 oC for 10 minutes. Samples
were then supplemented with 4 μL of 25 mM MgCl2, 2 µL Reverse transcription 10X
buffer, 2 μL of 10 mM dNTP mixture, 0.5 µL recombinant RNasin ribonuclease inhibitor
and 1 µL of AMV reverse transcriptase (15 units). The PCR reaction was performed in a
thermocycler (Applied Biosystems 2720 thermocycler), and consisted of three
temperature steps, an initial 5 minute hold at 25 oC to facilitate annealing, a one hour
extension at 42 oC and finally a 15 minute hold at 72 oC to inactivate the reverse
transcriptase enzyme.
Primer sets for qPCR (see Table 2.3) were tested for their specificity and their capacity
to dimerise. 1 μL of serially diluted cDNA samples (12.5 ng/μL, 1.25 ng/μL, 0.125 ng/μL
and 0.0125 ng/μL) was placed into each well of a 96 well real time PCR plate (three

51
experimental repeats per sample). 19 μL of master mix, consisting of 10 μL of Fast
SYBR® Green Master Mix (Applied Biosystems), 7.4 μL of sterile DNAase/RNAase-free
distilled water, 0.8 μL of 10 μM forward and reverse primers, was then added. Plates
were sealed, centrifuged briefly, and analysed with the use of the Applied Biosystems
StepOne™plus Real-Time PCR System and software. Amplification was achieved via an
initial denaturation step at 95oC for 10 minutes, followed by 40 cycles of 3 seconds at
95 oC and 30 seconds at 60 oC, with fluorescence monitored at the elongation stage of
each cycle.
The specificity of the reaction was determined by melt curve analysis. By analysing the
inverse change in fluorescence against the change in temperature, the reaction
products of the amplification can be deduced. The reaction efficiency was examined
by plotting the logarithmic quantity of starting template against the threshold cycle
(Ct). A correlation coefficient of greater than 0.98 was indicative of an efficient
amplification reaction.
Following validation of primer sets, overexpression of candidate modifiers was
determined using the conditions stated above. Amplification was carried out using 10
µM MRFP forward and reverse primers (see Table 3), and data normalised to a
reference gene, PpiB (peptidylprolyl isomerase B) (10 µM forward and reverse
primers).Subsequent quantification of results was performed using the δδCT method
as described in (Pfaffl, 2001)
Primer Sequence (5’-3’) Tm (oc)
mRFP QPCR Forward CGCCTACAAGACCGACATCA 58
mRFP QPCR Reverse CGCTCGTACTGTTCCACGAT 58
Ppib Forward GGCTCCGTTGTCTTCCTTTT 57
Ppib Reverse ACTCGTCCTACAGGTTCGTCTC 59
Table 2.3. PCR primers to assess overexpression of candidate modifiers.
Overexpression of splicing genes was determined via real-time PCR with the use of
primers designed against conjugated mRFP gene. Results were normalised to the
reference gene, PpiB (peptidylprolyl isomerase B).

52
Confocal Microscopy
Confocal microscopy was employed to evaluate the cellular location of RFP tagged
suppressors in PC12 cells. 2 x 10⁴ PC12 cells were seeded onto round poly-L-lysine
coated coverslips (12 mm diameter), in 24-well plates and incubated for 72-hours.
Cells were then fixed with 4% paraformaldehyde (Fison) for 20 minutes at room
temperature and later washed 3 times in 1X PBS containing 0.1% (v/v) Tween 20
(Sigma-Aldrich) (PBST). Cells were then permeabilised in 1X PBS containing 0.5% (v/v)
Triton X-100 (Fisher Scientific) for 10 minutes at room temperature, and washed a
further 3 times in PBST. The fixed PC12 cells were incubated in 4% (w/v) BSA for 10
minutes at room temperature and then for a further hour in 4% BSA supplemented
with 1:200 RFP booster (Chromotek). Cells were washed three times in PBST, each for
a 10 minute period, before being mounted onto slides with the aid of a DAPI (4’, 6-
diamidino-2-phenylindole) containing mounting media (VECTASHIELD®).
Cells were visualised using an Olympus FV1000 confocal microscopy. The DAPI and red
fluorophores were detected with the aid of the UV (405 nm) and red (635 nm) diode
lasers respectively. Images were acquired using a 60X objective lens, a numerical
aperture (NA) of 1.35 and the Z stack function to generate approximately 30 images
(at 0.38μm increments). The clarity of the images was increased with of deconvolution
software, Huygens Essentials (Huygens Software).
2.223 Characterisation of splicing gene hits
Splicing assay
HEK293T cells were seeded in white 96-well flat bottomed plates (Greiner) at a
seeding density of 2.5 x 10⁴ cells per well in 200 μL of growth media and grown for 24
hours. RFP, HTT pLENTI, suppressor cDNA and TN23 constructs were isolated and
purified and as described above and diluted to 100 ng/μL stocks. Cells were
transfected with either 2 or 3 plasmid constructs, with a total amount of 200ng per
well. Constructs were mixed with 0.4 μL of Turbofect transfection reagent
(Fermentas), in a total of 20 μL of serum free media, which was used to transfect cells
per well, as previously described. All transfections were performed in triplicate.
53
Splicing efficiency determined 48 hours after transfection with this use of the Dual-
Light® Combined Reporter Gene Assay System for Detection of Luciferase and beta-
Galactosidase (Applied Biosystems), following the manufacturer instructions supplied
with the kit. Cells were lysed in 25 μL of lysis solution for 10 minutes at room
temperature. The 25 μL of buffer A, containing components required for the enhanced
luciferase reaction, added to each well. Plates were placed in a FLUOstar Omega
mircoplate Reader (BMG LABTECH), and wells injected (at a speed of 310 μL/s) with
100 μL of buffer B, containing luciferin, supplemented with Galacton-Plus substrate at
a 1:100 dilution. Luminescence was measured a 1 second delay (top optic, emission
filter lens, gain 3600, and positioning delay 0.2). The luciferase signal was then allowed
to deteriorate for 1 hour at room temperature prior to measuring β-galactosidase
activity. Accelerator-II solution, containing luminescence enhancer and alkali (the
higher pH is conducive to the β-galactosidase reaction), was then injected into wells
and a second reading taken. Splicing efficiency was determined by calculating the ratio
of luciferase activity to beta-galactosidase.
WST-1 assay
HEK293T cells were transiently transfected in clear 96-well F-bottom plates (Greiner)
as stated above and assessed in terms of cytotoxicity with the WST-1 assay (Roche). 10
μL of WST-1 reagent was added to cells 48 hours after transfection and microplates
incubated at 37 oC, 5% CO2 for 4 hours. Cells were shaken briefly and the absorbance
at 440 nm (path length correction 100 μL, length 3.31mm, position delay 0.2, number
of flashes per well 22) measured using a FLUOstar Omega microplate Reader (BMG
LABTECH). Background absorbance from media treated with WST-1 reagent was
subtracted and samples normalised to untransfected control.
Aggregation studies- Cellomics
PC12 cells were seeded in a poly-lysine treated 24-well plates at a seeding density of 2
x 104 cells in 0.5 mL of culture media, and induced at varying time points (0, 12, 18, 24,
48, and 72 hours) with 5 μM ponasterone. After 72 hours, media were aspirated and
cells fixed 0.5 mL of 4% paraformaldehyde for 20 minutes at room temperature. After
washing in 1X PBS, 0.5 mL of 1 μg/mL Hoechst 33342 (Invitrogen) diluted in 1x PBS

54
was added and samples incubated at room temperature for 15 minutes. Cells were
washed a further 3 times in 1x PBS and stored in 1X PBS at 4 oC.
Fixed cells were analysed using an ArrayScan* Infinity High Content Reader (Thermo
scientific), with Cellomics® one software (Thermo scientific). The Target activation
bioapplication was used to measure fluorescence, fluorescent intensity and variation
in fluorescence intensity (for ~2000 cells). Cells displaying an average intensity greater
than 20 were scored as expressing HTT, while cells exhibiting a variation in intensity of
greater than 200 were scored as containing HTT inclusion bodies or aggregates. Cells
with variation in intensity of less than 200 displayed diffuse expression of HTT.
Dot blots/ Filter trap assay
Mutant HTT protein levels in PC12 cells were assessed using filter retardation assays
(Wanker et al., 1998). Cells were seeded in poly-lysine treated 6-well plates at a
density of 2.5 x 10⁵ in 500 μL cell culture media and induced with 5 μM ponasterone A
after 24 hours. After a further 48 hours, media was aspirated and replaced with 300 μL
of cell lysis-M-regent (Roche) supplemented with 1x EDTA-free protease inhibitor
cocktail (Roche) in 1X PBS. Cells were agitated and lysed for 15 minutes at room
temperature. Following lysis, 0.3 μL (75 units) of Pierce universal nuclease
(Thermoscientific) was added and samples and incubated on ice for 30 minutes to
remove genomic DNA. Protein samples were subsequently quantitated using a
nanophotometer, diluted in 1X PBS containing 2% SDS and 50 mM dithiothreitol (DTT)
(Melford) and boiled at 98 oc for 3 minutes (see Table 4).
Prior to blotting, membranes and 2 pieces of 3MM blotting paper were equilibrated in
0.1% SDS in 1X PBS, and assembled onto the 96-well dot blot apparatus (Geneflow),
which was then connected to the vacuum manifold. Nitrocellulose (0.2 μm,
Whatman), was used to assess total mutant HTT levels, while cellulose acetate
membrane (0.45 μm, Whatman), was used to detect mutant HTT aggregates.
Denatured proteins samples were loaded onto the dot blotter in duplicate (see Table
2.4), and wells washed 4 times with 100 μL of 0.1% SDS. Membrane were air-dried and
blocked with of 3% (w/v) milk (Sigma) in Tris buffered saline (TBS)/Tween (0.605%
(w/v) Tris (Sigma), 0.876% (w/v) sodium chloride (Fisher), pH7.5 containing 0.05% (v/v)
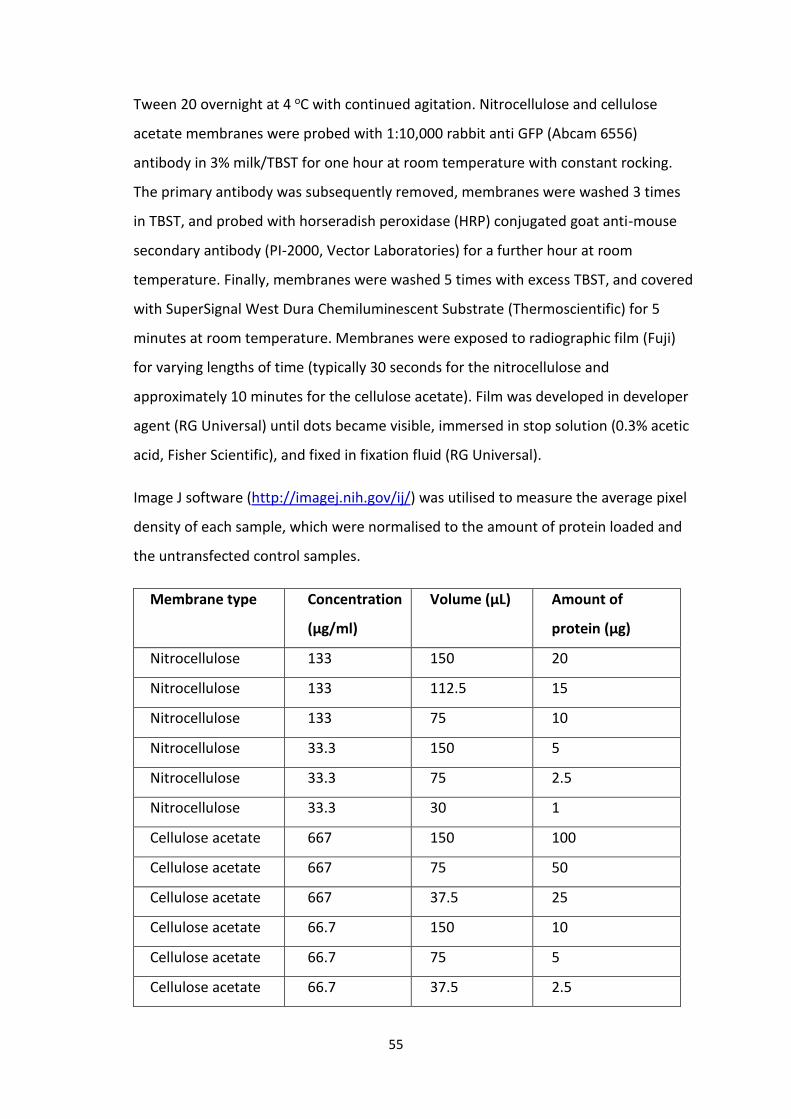
55
Tween 20 overnight at 4 oC with continued agitation. Nitrocellulose and cellulose
acetate membranes were probed with 1:10,000 rabbit anti GFP (Abcam 6556)
antibody in 3% milk/TBST for one hour at room temperature with constant rocking.
The primary antibody was subsequently removed, membranes were washed 3 times
in TBST, and probed with horseradish peroxidase (HRP) conjugated goat anti-mouse
secondary antibody (PI-2000, Vector Laboratories) for a further hour at room
temperature. Finally, membranes were washed 5 times with excess TBST, and covered
with SuperSignal West Dura Chemiluminescent Substrate (Thermoscientific) for 5
minutes at room temperature. Membranes were exposed to radiographic film (Fuji)
for varying lengths of time (typically 30 seconds for the nitrocellulose and
approximately 10 minutes for the cellulose acetate). Film was developed in developer
agent (RG Universal) until dots became visible, immersed in stop solution (0.3% acetic
acid, Fisher Scientific), and fixed in fixation fluid (RG Universal).
Image J software (http://imagej.nih.gov/ij/) was utilised to measure the average pixel
density of each sample, which were normalised to the amount of protein loaded and
the untransfected control samples.
Membrane type Concentration
(μg/ml)
Volume (μL) Amount of
protein (μg)
Nitrocellulose 133 150 20
Nitrocellulose 133 112.5 15
Nitrocellulose 133 75 10
Nitrocellulose 33.3 150 5
Nitrocellulose 33.3 75 2.5
Nitrocellulose 33.3 30 1
Cellulose acetate 667 150 100
Cellulose acetate 667 75 50
Cellulose acetate 667 37.5 25
Cellulose acetate 66.7 150 10
Cellulose acetate 66.7 75 5
Cellulose acetate 66.7 37.5 2.5
56
HTT expression levels via qPCR
PC12 cells were seeded into 6 well plates as stated above, induced after 24 hours and
allowed to grow for a further 48 hours. RNA isolation, primer set validation and
quantitative real-time PCR was performed as previously described, using primers
designed against EGFP tag conjugated to the inducible mutant HTT expressed by this
cell line (see Table 2.5), coupled with the PPIB primers used previously (see Table 2.3)
(Pfaffl, 2001). Results were normalised to both the expression levels of PPIB, and the
untransfected control cells.
Genomic DNA isolation
Quantitative PCR method was used to assess the copy number of the mutant HTT
construct within each of the stably transfected PC12 cell lines. Upon reaching 80%
confluency, cells were lifted from T25 flasks and centrifuged at 700 rpm for 5 minutes,
and the resulting pellet incubated at 56 oc overnight, in 500 µL of lysis buffer,
consisting of: 100 mM NaCl; 10 mM Tris pH 8.0; 25 mM pH 8.0; 0.5% (w/v)SDS and 0.1
mg/mL of proteinase K (New England Biolabs Inc.) (added prior to use). Following lysis,
55 µL of 3 M sodium acetate and 500 µL of phenol: chloroform: IAA was added, and
samples inverted several times. Samples were centrifuged at 13,000 rpm for 10
minutes, and the resulting aqueous layer transferred to a fresh micro-tube, mixed
with 500µl of chloroform and subsequently centrifuged for a further 10 minutes at
13,000 rpm. The aqueous layer was transferred to a fresh 1.5 mL micro-tube, mixed
with 450 µL of isopropanol, and incubated overnight at -20 oC. Precipitated DNA was
then pelleted by centrifugation at 13,000 rpm for 30 minutes at 4 oC, and washed
twice with 70% ethanol. Samples were air dried and re-suspended in 50 μL
RNAase/DNAase-free distilled water (Life Technologies).
Table 2.4. Protein sample dilutions and loading volumes. Protein samples were
diluted down to four concentrations (column 2); two stock solutions were prepared for
both nitrocellulose and cellulose acetate (column 1). Varying volumes of these samples
were loaded onto each of the membranes (column 3) containing varied amounts of
protein (column 4)
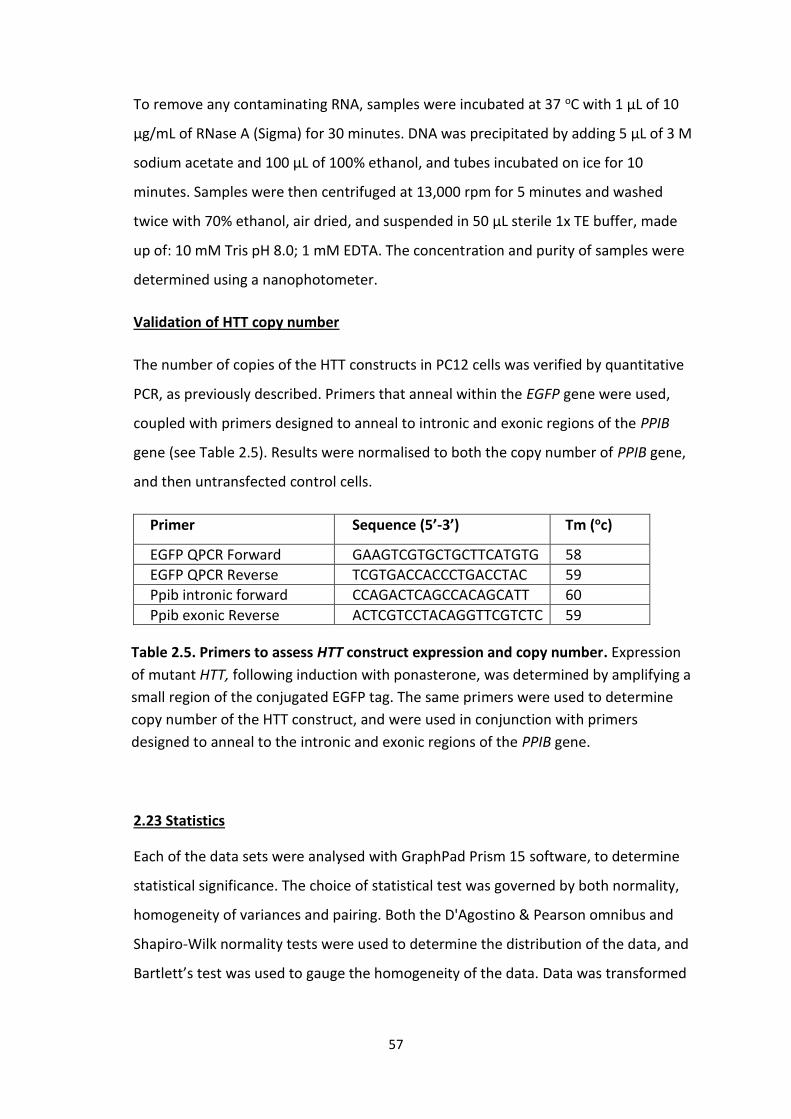
57
To remove any contaminating RNA, samples were incubated at 37 oC with 1 µL of 10
µg/mL of RNase A (Sigma) for 30 minutes. DNA was precipitated by adding 5 µL of 3 M
sodium acetate and 100 µL of 100% ethanol, and tubes incubated on ice for 10
minutes. Samples were then centrifuged at 13,000 rpm for 5 minutes and washed
twice with 70% ethanol, air dried, and suspended in 50 μL sterile 1x TE buffer, made
up of: 10 mM Tris pH 8.0; 1 mM EDTA. The concentration and purity of samples were
determined using a nanophotometer.
Validation of HTT copy number
The number of copies of the HTT constructs in PC12 cells was verified by quantitative
PCR, as previously described. Primers that anneal within the EGFP gene were used,
coupled with primers designed to anneal to intronic and exonic regions of the PPIB
gene (see Table 2.5). Results were normalised to both the copy number of PPIB gene,
and then untransfected control cells.
Primer Sequence (5’-3’) Tm (oc)
EGFP QPCR Forward GAAGTCGTGCTGCTTCATGTG 58
EGFP QPCR Reverse TCGTGACCACCCTGACCTAC 59
Ppib intronic forward CCAGACTCAGCCACAGCATT 60
Ppib exonic Reverse ACTCGTCCTACAGGTTCGTCTC 59
2.23 Statistics
Each of the data sets were analysed with GraphPad Prism 15 software, to determine
statistical significance. The choice of statistical test was governed by both normality,
homogeneity of variances and pairing. Both the D'Agostino & Pearson omnibus and
Shapiro-Wilk normality tests were used to determine the distribution of the data, and
Bartlett’s test was used to gauge the homogeneity of the data. Data was transformed
Table 2.5. Primers to assess HTT construct expression and copy number. Expression
of mutant HTT, following induction with ponasterone, was determined by amplifying a
small region of the conjugated EGFP tag. The same primers were used to determine
copy number of the HTT construct, and were used in conjunction with primers
designed to anneal to the intronic and exonic regions of the PPIB gene.

58
logarithmically when failing to conform to the necessary prerequisites of parametric
analysis.
Following these tests, normally distributed and homogeneous data was analysed via a
two-sample Student t-test (parametric) or a one way ANOVA, while data failing to
display homogeneity and normal distribution after logarithmic transformation was
analysed via the Kruskal-Wallis test and subsequently a pair-wise Mann Whitney test.
In each statistical test a confidence level of 0.05 was used.

59
2.3 Results
2.31 Overexpression of several candidate genetic modifiers suppresses mutant HTT
toxicity in mammalian cells.
The yeast modifier screen performed by our research group identified a number of
genes involved in mRNA splicing, which when overexpressed, suppressed mutant HTT
toxicity. To further validate these hits in a mammalian context, we initially cloned the
nine genes into the pIREShyg3 construct. Genes were inserted into this vector in-
frame and upstream of the RFP gene, thus fluorescently tagging each gene and
facilitating localisation studies. Transcription of the cDNA-RFP ORF was linked to the
hygromycin resistance gene by means of an IRES sequence. We subsequently
generated HTT14A2.5 PC12 cell lines stably overexpressing selected modifiers. These
cells contained a stably integrated HTT103Q exon 1 construct under the control of a
tightly regulated ponasterone A inducible promoter.
After generating these stable cell lines, a caspase 3/7 activation assay was used to
assess the toxicity displayed by these cells in response to the mutant HTT induction.
Given that caspase activation is a precursor of apoptosis, this assay has previously
been used to determine changes in the apoptotic state of cells in response to varying
toxic insults and suppressors(Liu et al., 2004, Ren et al., 2004).
Overexpression of CRNKL, EFTUD2, HNRNPF, HNRNPK and TARDBP reduced levels of
toxicity in relation to untransfected cells. In contrast, cell lines overexpressing
HNRNPQ or SNRNPB demonstrated toxicity levels comparable to this control, which
thus suggests that in mammalian cells overexpression of these gene does not suppress
mutant HTT toxicity. Finally, overexpression of the two remaining splicing genes,
HNRNPU and SFRS, appeared to aggravate toxicity (see Figure 2.3)
Given these results, cell lines overexpressing CRNKL, EFTUD2, HNRNPF, HNRNPK or
TARDBP were examined further to determine the mechanism of suppression.

60
2.32 Suppressors are overexpressed and localise in the nucleus
As a means of gauging cellular location, as well as their possible co-localisation with
mutant HTT, each of the splicing proteins was tagged with mRFP. However given the
inherently weak signal produced by this fluorophore, cells were incubated with an RFP
booster. This booster consisted of a RFP binding protein conjugated to a red
fluorescent ATTO-TEC dye, emitting a stronger and more stable signal.
Supporting their known role in mRNA splicing, all of the proteins were found to reside
in the nucleus (see Figure 2.4). CRNKL and EFTUD2 both localised to distinct areas
Figure 2.3. Overexpression of several splicing genes modulates caspase activation in neuronal cells expressing mutant HTT. Selected splicing genes were stably expressed in PC12 cells containing an inducible HTT exon 1 construct (103Q) (Apostel, Kazantsez at al., 2003). To test for suppression of mutant HTT, a caspase 3/7 activation (a precursor of apoptosis) cytotoxicity assay was performed and results were normalised to the untransfected cells. Overexpression of several genes hits suppressed toxicity, while others exacerbated mutant HTT toxicity. A Kruskal-Wallis test was performed on the data as a whole, resulting in a P<0.0001 (****) (N = 14 for the controls and N = 3-5 for test samples, SEM error bars) . A Mann-Whitney test was carried out on each of the test cell lines relative to the untransfected control cells (*P<0.05 **P<0.01, ***P<0.001).

61
within the nucleus. Unlike the other suppressors, the primary role of these proteins is
the assembly of the spliceosome. As such, the observed structures, reminiscent of
splicing “speckles” described in (Han et al., 2011), may reflect the sub nuclear
locations of mRNA splicing.
HNRNPF and HNRNPK displayed a more diffuse spread throughout the nucleus, a
result consistent with roles in transcription and chromation re-modelling as well as
splicing. In contrast TARDBP localised in discrete sub-nuclear bodies, while retaining
diffuse levels in the rest of the nucleus.
Expression was confirmed via quantitative real-time PCR, with amplification using
primers detecting against the RFP tag. All cell lines displayed RFP expression, levels of
which were normalised to untransfected controls (see Figure 2.5).The cell line
expressing TARDBP displayed the highest level of expression, while cells expressing
CRNKL exhibited the lowest level of expression.
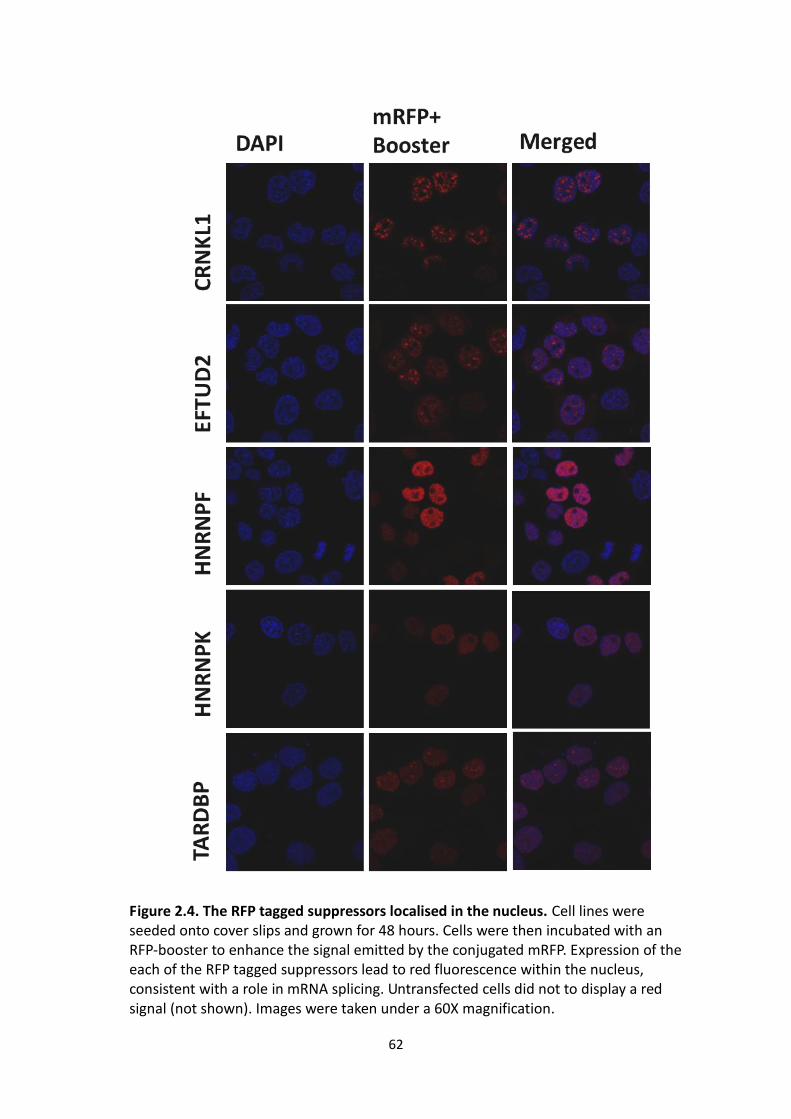
62
Figure 2.4. The RFP tagged suppressors localised in the nucleus. Cell lines were seeded onto cover slips and grown for 48 hours. Cells were then incubated with an RFP-booster to enhance the signal emitted by the conjugated mRFP. Expression of the each of the RFP tagged suppressors lead to red fluorescence within the nucleus, consistent with a role in mRNA splicing. Untransfected cells did not to display a red signal (not shown). Images were taken under a 60X magnification.

63
2.33 Mutant HTT causes a polyQ dependent decline in splicing efficiency and cell
viability
In order to examine the role of mRNA splicing in HD pathogenesis, and by extension
the possible mechanistic route by which our candidate genes conveyed suppression,
we established a splicing efficiency assay in the context of a HD cell model. The
splicing efficiency assay utilised the TN23 construct encoding β-galactosidase and
luciferase, separated by an intron flanked by recombinant fragments encoding
adenovirus (Ad) and skeletal muscle isoforms of human tropomyosin (SK) (see Figure
2.6). The intronic region contained three in-frame translational stop signals (xxx),
which prevented luciferase expression when the construct is inadequately spliced.
Figure 2.5. Validation of suppressor expression. Expression of the suppressors were analysed by measuring levels of the RFP tag by qPCR. The expression levels varied between the different stable cell lines, with the TARDBP expressing cell line displaying the greatest expression level and the CRNKL1 expressing cell line exhibiting the least. A Kruskal-Wallis test was performed on the data as a whole, resulting in a P<0.01 (**). A Mann-Whitney test was carried out on each of the test cell lines relative to the untransfected control cells (P<0.05 *) (SEM error bars, N=3)

64
Splicing efficiency could therefore be determined by analysing the activity of luciferase
in relation to the activity of the constitutively expressed β-galactosidase.
Initially we transiently transfected HEK293T cells with plasmids expressing exon one
HTT fragments of varying polyQ length, as well as the TN23 construct. After 48 hour,
cells were analysed using a dual reporter assay. The results demonstrated a decline in
splicing efficiency in response to increasing polyQ length, an effect coupled with a
mirrored decline in cell viability (see Figure 2.7). The 25Q and 47Q constructs did not
affect mRNA splicing efficiency or cell viability, while the 72Q and 97Q constructs
reduced splicing by ~20%. This splicing defect was associated with a drop in cell
viability of ~50%.
To more precisely determine the onset of the splicing defect, cells were assayed 24
hours post transfection. These assays revealed no significant change in splicing at 24
hours, or polyQ length dependent cell toxicity, suggesting insufficient expression of
these constructs at this time point (see Figure 2.8). Cells appeared to have a
somewhat lower cell viability compared to those transfected with the RFP construct,
though this may simply reflect a recovery state following transfection. Nonetheless,
these data suggest that the toxicity observed and the splicing defects are intimately
linked.

65
Figure 2.6. Splicing efficiency assay used to ascertain the possibility of splicing defects in HD. The splicing efficiency assay utilised a construct encoding β-galactosidase (β-gal) and luciferase which are separated by an intron flanked by recombinant fragments encoding adenovirus (Ad) and skeletal muscle isoforms of human tropomyosin (SK). These fragments contain three in-frame translational stop signals (xxx), which prevent luciferase expression when the construct is inadequately spliced. Splicing efficiency can be determined by analysing the activity of luciferase in relation to the constitutively expressed β -galactosidase activity (Nasim and Eperon, 2006).
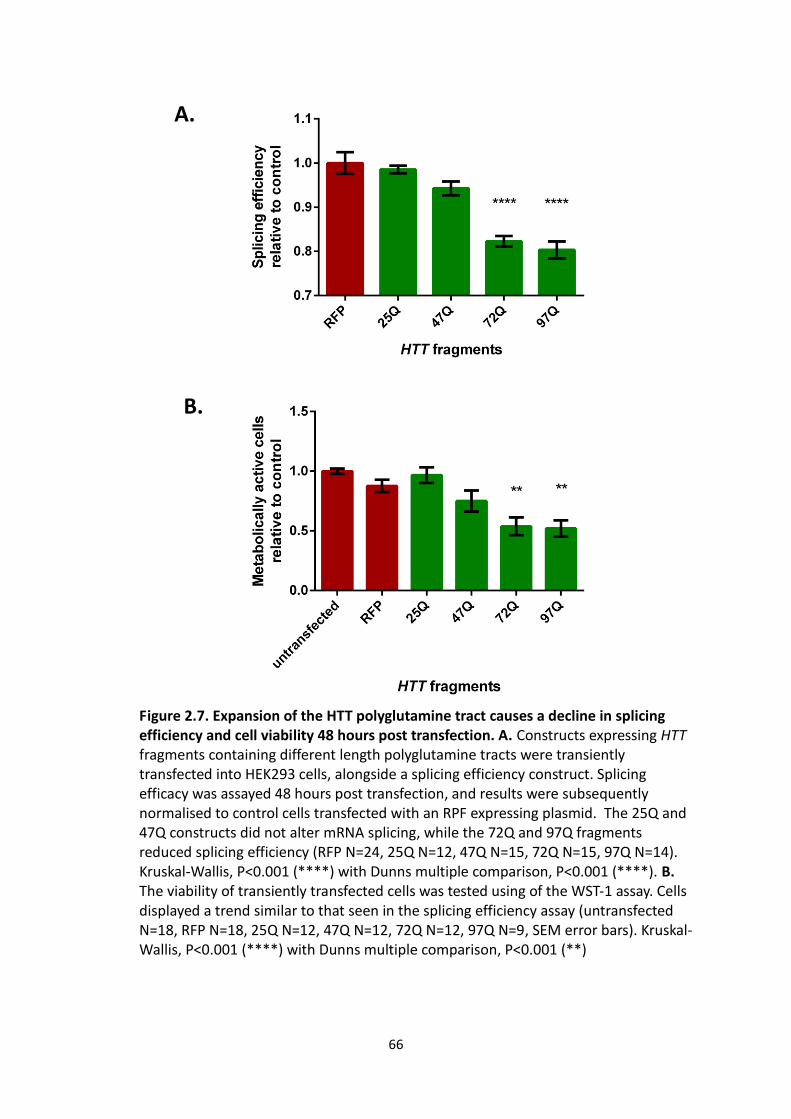
66
A.
B.
Figure 2.7. Expansion of the HTT polyglutamine tract causes a decline in splicing efficiency and cell viability 48 hours post transfection. A. Constructs expressing HTT fragments containing different length polyglutamine tracts were transiently transfected into HEK293 cells, alongside a splicing efficiency construct. Splicing efficacy was assayed 48 hours post transfection, and results were subsequently normalised to control cells transfected with an RPF expressing plasmid. The 25Q and 47Q constructs did not alter mRNA splicing, while the 72Q and 97Q fragments reduced splicing efficiency (RFP N=24, 25Q N=12, 47Q N=15, 72Q N=15, 97Q N=14). Kruskal-Wallis, P<0.001 (****) with Dunns multiple comparison, P<0.001 (****). B. The viability of transiently transfected cells was tested using of the WST-1 assay. Cells displayed a trend similar to that seen in the splicing efficiency assay (untransfected N=18, RFP N=18, 25Q N=12, 47Q N=12, 72Q N=12, 97Q N=9, SEM error bars). Kruskal-Wallis, P<0.001 (****) with Dunns multiple comparison, P<0.001 (**)
67
A.
B.
Figure 2.8. Mutant HTT constructs do not significantly change splicing efficiency or cell viability 24 hours post transfection. A. Constructs expressing HTT fragments containing different length polyglutamine tracts were transiently transfected into HEK293 cells, alongside a splicing efficiency construct. Splicing efficiency was assayed 24 hours post transfection, and results were subsequently normalised to control cells transfected with an RPF plasmid. No significant change in splicing efficiency was observed (RFP N=11, 25Q N=12, 47Q N=12, 72Q N=12, 97Q N=12). Kruskal-Wallis with Dunns multiple comparison. B. Transiently transfected cells were tested in terms of cell viability with the use of the WST-1 assay. Cells failed to display the polyQ length dependent decline in cell viability seen at the 48 hour time point. RFP N=12, 25Q N=12, 47Q N=12, 72Q N=12, 97Q N=12, SEM error bars). Kruskal-Wallis with Dunns multiple comparison P<0.05 (*).

68
2.34 Overexpression of suppressors does not ameliorate polyQ-dependent splicing
defects
We next sought to investigate whether our splicing-related suppressors were capable
of correcting the splicing defect observed in HEK293T cells transfected with mutant
HTT97Q constructs at 48 hours.
When analysing the effect of overexpression on splicing efficiency, we found that in
general our candidate genes did not improve this metric, although overexpression of
CRNKL did appear to reduce splicing by ~12% compared to control cells transfected
with RFP (see Figure 2.9a). Furthermore upon transfection of these suppressors
alongside the HTT fragment constructs, we observed no significant change in the
splicing defect brought about by the 97Q construct (see Figure 2.9b). ~20% drop in
splicing efficacy attributed to expression of the 97Q construct, relative to the
construct containing the shorter HTT fragment, was consistent in all cells co-
transfected with the overexpression constructs. The decline in splicing efficiency due
to CRNKL overexpression remained when transfected into cells along with the 25Q
construct. Interestingly, when co-transfected, the 97Q construct and CRNKL reduced
splicing efficiency in an additive manner, though this was not statistically significant.
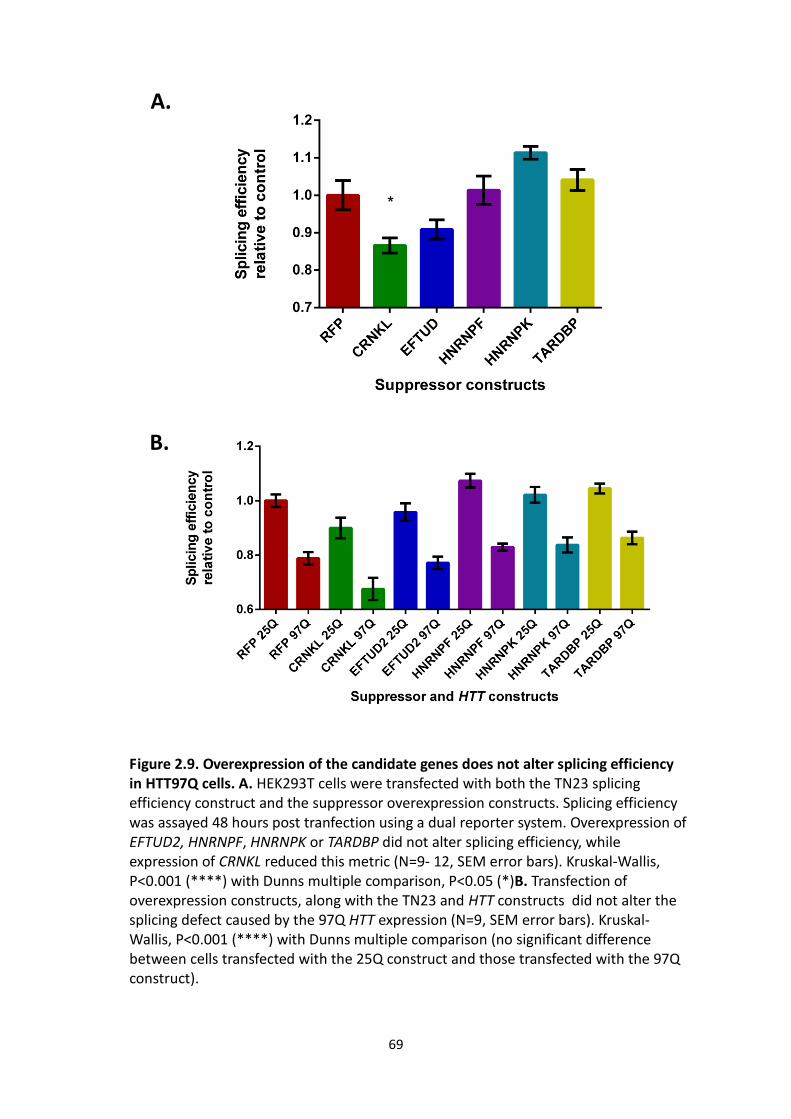
69
B.
Figure 2.9. Overexpression of the candidate genes does not alter splicing efficiency in HTT97Q cells. A. HEK293T cells were transfected with both the TN23 splicing efficiency construct and the suppressor overexpression constructs. Splicing efficiency was assayed 48 hours post tranfection using a dual reporter system. Overexpression of EFTUD2, HNRNPF, HNRNPK or TARDBP did not alter splicing efficiency, while expression of CRNKL reduced this metric (N=9- 12, SEM error bars). Kruskal-Wallis, P<0.001 (****) with Dunns multiple comparison, P<0.05 (*)B. Transfection of overexpression constructs, along with the TN23 and HTT constructs did not alter the splicing defect caused by the 97Q HTT expression (N=9, SEM error bars). Kruskal-Wallis, P<0.001 (****) with Dunns multiple comparison (no significant difference between cells transfected with the 25Q construct and those transfected with the 97Q construct). Expansion of the polyglutamine tract correlates with a decline in splicing efficiency and cell viability 48 hours post transfection. A. Lentiviral constructs expressing htt fragments of with different polyglutamine lengths were transiently transfected into HEK293 cells, alongside the splicing efficiency construct. The splicing efficiency was assay 48 hours post transfection, and results were subsequently normalised to control cells transfected with an RPF plasmid. The 25Q and 47Q constructs do not alter
A.

70
2.35 Overexpression of suppressors alters the aggregation dynamics of mutant HTT
Given that overexpression of our suppressors appeared to have little effect on the
mRNA splicing defect, we next sought to examine whether these suppressors
functioned by altering mutant HTT aggregation dynamics. To do so, we employed the
automated cell analysis apparatus system, Cellomics, to study mutant HTT aggregation
dynamics in PC12 cells expressing candidate modifiers. Prior to analysis, cells were
stained with the nucleus dye- Hoechst 33342 to facilitate cell identification (see Figure
2.10). The Cellomics platform subsequently extrapolated from the nucleus to define
an area encompassing the cytoplasm, which was then analysed in terms of green
fluorescence.
Figure 2.10. Cellomics cell identification and analysis. (A) PC12 cells displayed diffuse expression of the mutant HTT fragment, as well the condensed formation of inclusions bodies, 24 hours after ponasterone induction. (B and C) The Target activation bioapplication identifies the nucleus of the cell with the aid of the DNA binding dye, Hoechst 33342. (D) The software extrapolates the nucleus to define the cell body. (E) The bioapplication analysis measure GFP intensity and identifies large inclusion bodies (labelling in red).

71
Expression of mutant HTT was induced at various time points and its expression and
aggregation examined using the parameters stated in the methods section. An
average green fluorescent intensity threshold was used to distinguish between cells
expressing mutant HTT and those which failed to respond to the inducing agent,
ponasterone A. At 48 hours, approximately 80% of control cells and those
overexpressing CRNKL, HNRNPF and HNRNPK exceeded this threshold, while cell lines
overexpressing TARDBP and EFTUD2 displayed significantly fewer mutant HTT
expressing cells (see Figure 2.11a). In each case the percentage of HTT expressing cells
appeared to plateau by around 48 hours.
By analysing the variation in GFP intensity, cells displaying inclusion bodies or other
large aggregate species were differentiated from those exhibiting a diffuse,
homogeneous expression of mutant HTT. This metric was used to gauge changes in
the aggregation dynamics in response to overexpression of the suppressors. At 48
hours, cells lines over expressing CRNKL, HNRNPK and TARDBP displayed a significantly
greater proportion of cells containing large aggregates/inclusions, indicative of an
accelerated rate of aggregation. In stark contrast, cell lines overexpressing EFTUD2
and HNRNPF both displayed a diminished level of mutant HTT of aggregation relative
to control cells (see Figure 2.11b).
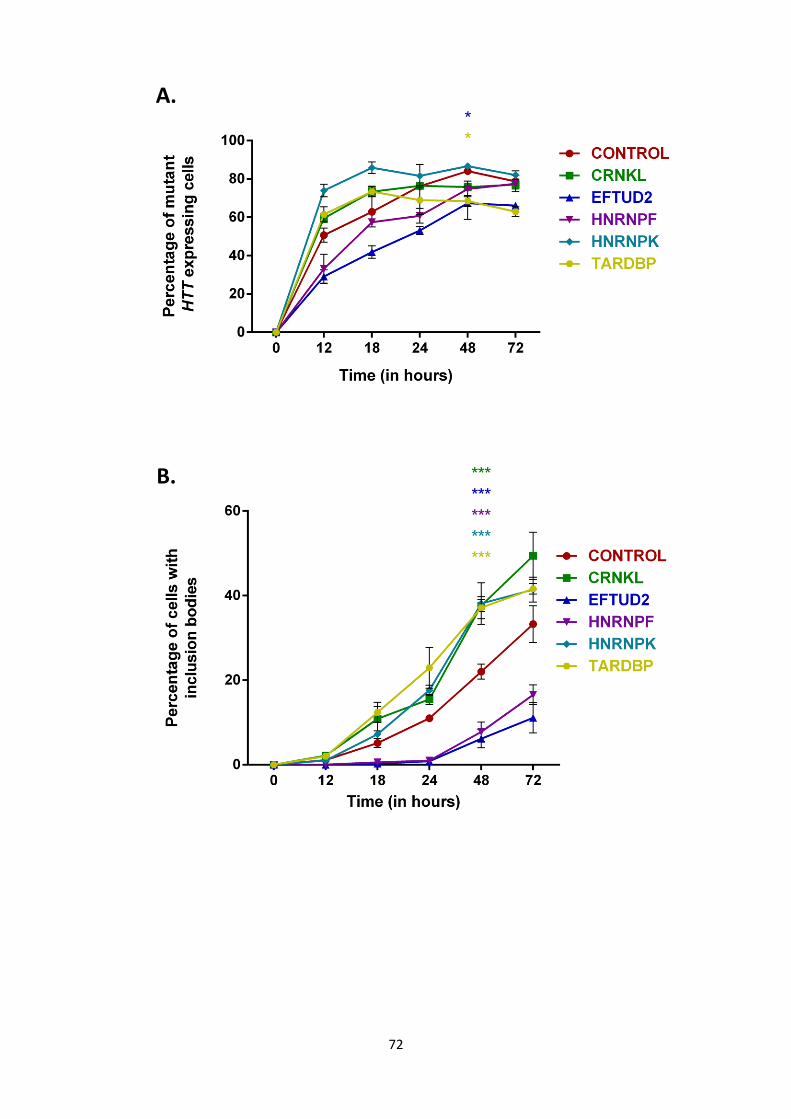
72
A.
B.
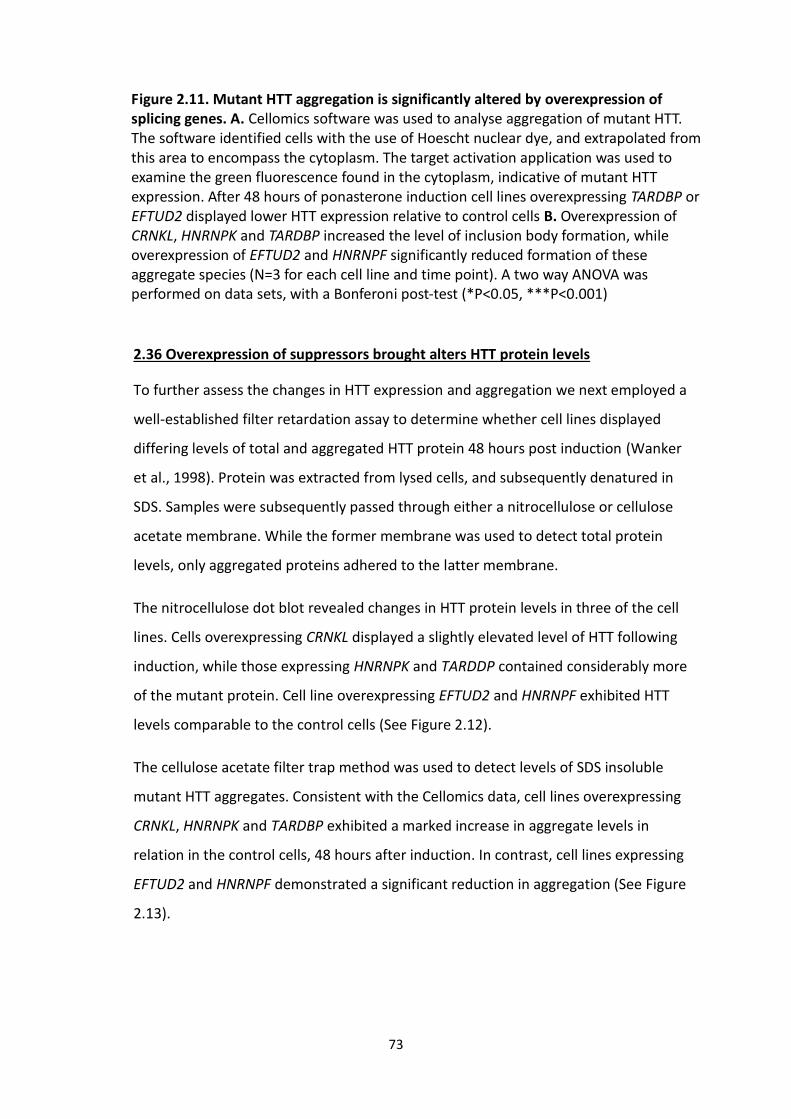
73
2.36 Overexpression of suppressors brought alters HTT protein levels
To further assess the changes in HTT expression and aggregation we next employed a
well-established filter retardation assay to determine whether cell lines displayed
differing levels of total and aggregated HTT protein 48 hours post induction (Wanker
et al., 1998). Protein was extracted from lysed cells, and subsequently denatured in
SDS. Samples were subsequently passed through either a nitrocellulose or cellulose
acetate membrane. While the former membrane was used to detect total protein
levels, only aggregated proteins adhered to the latter membrane.
The nitrocellulose dot blot revealed changes in HTT protein levels in three of the cell
lines. Cells overexpressing CRNKL displayed a slightly elevated level of HTT following
induction, while those expressing HNRNPK and TARDDP contained considerably more
of the mutant protein. Cell line overexpressing EFTUD2 and HNRNPF exhibited HTT
levels comparable to the control cells (See Figure 2.12).
The cellulose acetate filter trap method was used to detect levels of SDS insoluble
mutant HTT aggregates. Consistent with the Cellomics data, cell lines overexpressing
CRNKL, HNRNPK and TARDBP exhibited a marked increase in aggregate levels in
relation in the control cells, 48 hours after induction. In contrast, cell lines expressing
EFTUD2 and HNRNPF demonstrated a significant reduction in aggregation (See Figure
2.13).
Figure 2.11. Mutant HTT aggregation is significantly altered by overexpression of splicing genes. A. Cellomics software was used to analyse aggregation of mutant HTT. The software identified cells with the use of Hoescht nuclear dye, and extrapolated from this area to encompass the cytoplasm. The target activation application was used to examine the green fluorescence found in the cytoplasm, indicative of mutant HTT expression. After 48 hours of ponasterone induction cell lines overexpressing TARDBP or EFTUD2 displayed lower HTT expression relative to control cells B. Overexpression of CRNKL, HNRNPK and TARDBP increased the level of inclusion body formation, while overexpression of EFTUD2 and HNRNPF significantly reduced formation of these aggregate species (N=3 for each cell line and time point). A two way ANOVA was performed on data sets, with a Bonferoni post-test (*P<0.05, ***P<0.001)
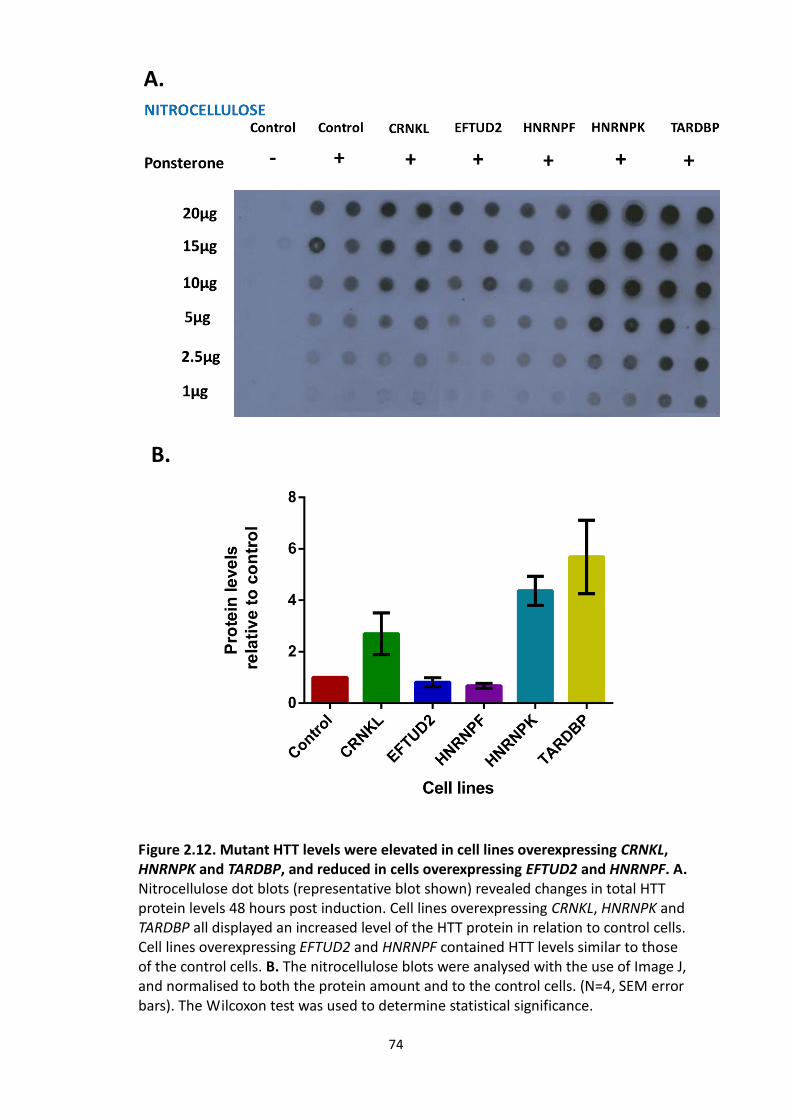
74
A.
B.
Figure 2.12. Mutant HTT levels were elevated in cell lines overexpressing CRNKL, HNRNPK and TARDBP, and reduced in cells overexpressing EFTUD2 and HNRNPF. A. Nitrocellulose dot blots (representative blot shown) revealed changes in total HTT protein levels 48 hours post induction. Cell lines overexpressing CRNKL, HNRNPK and TARDBP all displayed an increased level of the HTT protein in relation to control cells. Cell lines overexpressing EFTUD2 and HNRNPF contained HTT levels similar to those of the control cells. B. The nitrocellulose blots were analysed with the use of Image J, and normalised to both the protein amount and to the control cells. (N=4, SEM error bars). The Wilcoxon test was used to determine statistical significance.
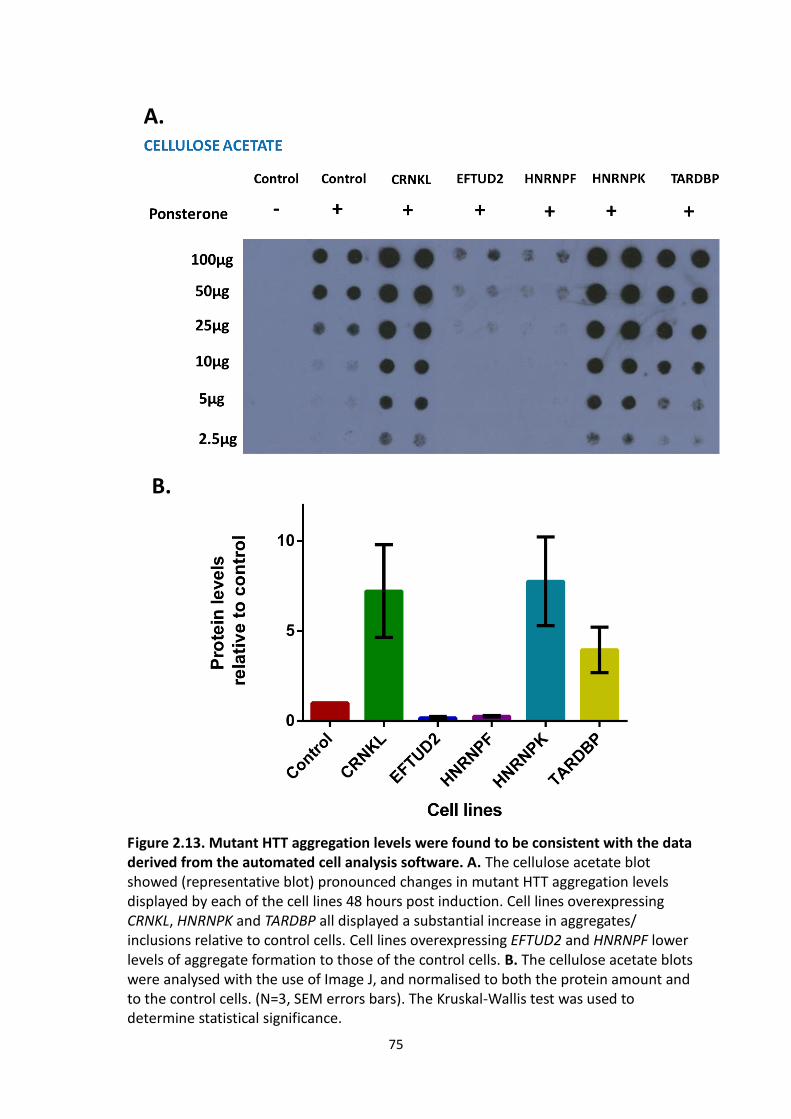
75
A.
B.
Figure 2.13. Mutant HTT aggregation levels were found to be consistent with the data derived from the automated cell analysis software. A. The cellulose acetate blot showed (representative blot) pronounced changes in mutant HTT aggregation levels displayed by each of the cell lines 48 hours post induction. Cell lines overexpressing CRNKL, HNRNPK and TARDBP all displayed a substantial increase in aggregates/ inclusions relative to control cells. Cell lines overexpressing EFTUD2 and HNRNPF lower levels of aggregate formation to those of the control cells. B. The cellulose acetate blots were analysed with the use of Image J, and normalised to both the protein amount and to the control cells. (N=3, SEM errors bars). The Kruskal-Wallis test was used to determine statistical significance.
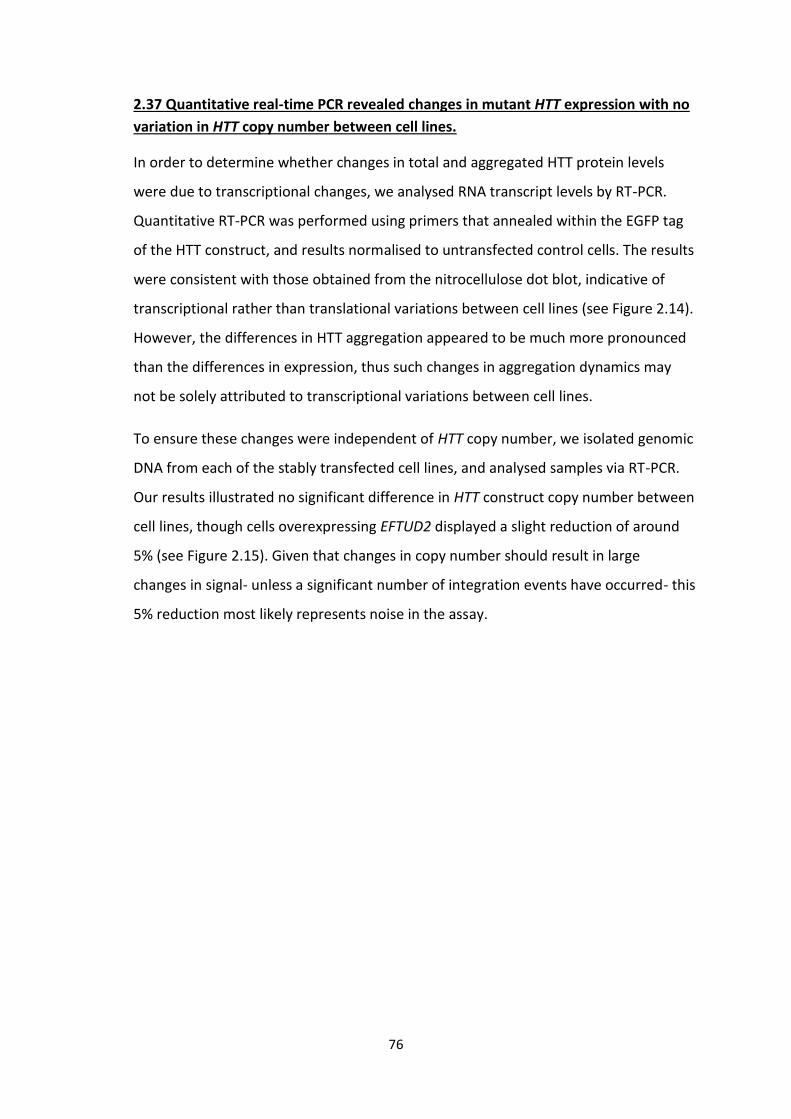
76
2.37 Quantitative real-time PCR revealed changes in mutant HTT expression with no
variation in HTT copy number between cell lines.
In order to determine whether changes in total and aggregated HTT protein levels
were due to transcriptional changes, we analysed RNA transcript levels by RT-PCR.
Quantitative RT-PCR was performed using primers that annealed within the EGFP tag
of the HTT construct, and results normalised to untransfected control cells. The results
were consistent with those obtained from the nitrocellulose dot blot, indicative of
transcriptional rather than translational variations between cell lines (see Figure 2.14).
However, the differences in HTT aggregation appeared to be much more pronounced
than the differences in expression, thus such changes in aggregation dynamics may
not be solely attributed to transcriptional variations between cell lines.
To ensure these changes were independent of HTT copy number, we isolated genomic
DNA from each of the stably transfected cell lines, and analysed samples via RT-PCR.
Our results illustrated no significant difference in HTT construct copy number between
cell lines, though cells overexpressing EFTUD2 displayed a slight reduction of around
5% (see Figure 2.15). Given that changes in copy number should result in large
changes in signal- unless a significant number of integration events have occurred- this
5% reduction most likely represents noise in the assay.
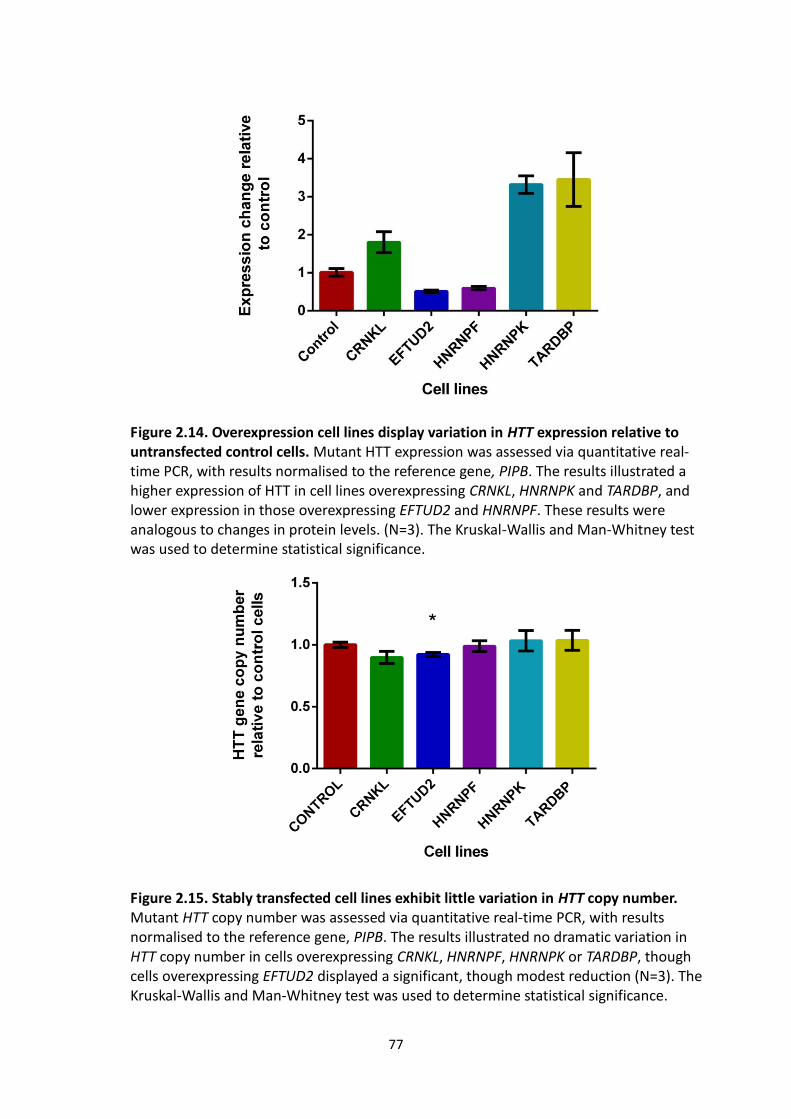
77
Figure 2.14. Overexpression cell lines display variation in HTT expression relative to untransfected control cells. Mutant HTT expression was assessed via quantitative real-time PCR, with results normalised to the reference gene, PIPB. The results illustrated a higher expression of HTT in cell lines overexpressing CRNKL, HNRNPK and TARDBP, and lower expression in those overexpressing EFTUD2 and HNRNPF. These results were analogous to changes in protein levels. (N=3). The Kruskal-Wallis and Man-Whitney test was used to determine statistical significance.
Figure 2.15. Stably transfected cell lines exhibit little variation in HTT copy number. Mutant HTT copy number was assessed via quantitative real-time PCR, with results normalised to the reference gene, PIPB. The results illustrated no dramatic variation in HTT copy number in cells overexpressing CRNKL, HNRNPF, HNRNPK or TARDBP, though cells overexpressing EFTUD2 displayed a significant, though modest reduction (N=3). The Kruskal-Wallis and Man-Whitney test was used to determine statistical significance.
78
2.4 Discussion
Following the generation of stable cell lines overexpressing our gene of interest, we
sought to determine whether these candidates suppressed mutant HTT phenotypes in
mammalian cells, as previously demonstrated in yeast. Our initial cytotoxicity assay
revealed that five of the nine mRNA splicing factors convey suppression in our
mammalian cells line, two did not modulate toxicity relative to untransfected control
cells, and the remaining genes, HNRNPU and SRFS, exacerbated this phenotype.
The mechanisms by which overexpression of both HNRNPU and SRFS increased HTT
induced toxicity in our stable mammalian cells is unclear, and we did not explore this
further during the course of this project. Given that HNRNPU encodes a global splicing
factor, overexpression may have altered the delicate balance of splicing events
regulated by this protein (Xiao et al., 2012). As demonstrated previously,
overexpression of HNRNPU can lead to increased expression of proteins involved in
apoptosis, such as immediate early response (IER3) proteins and tumour necrosis
factor alpha (TNF-α), through the stabilisation of mRNA transcripts (Yugami et al.,
2007). Moreover, HNRNPU overexpression has been shown to enhance splicing of
caspase-9, leading to an increase in the pro-apoptotic splicing variant, caspase-9a. It is
therefore feasible that such effect would induce apoptosis, and in turn influence the
caspase-3/7 assay (Vu et al., 2013). Similarly, overexpression of SFRS has been shown
to cause the aberrant splicing of the gene encoding tropomyosin receptor kinase B
receptor (TrkB), a component of the BDNF signalling pathway. This splicing defect has
been noted in AD, and leads to a reduction in the functional protein, reduced levels of
which have also been observed in HD (Wong et al., 2012, Ginés et al., 2006).
Alternatively, both HNRNPU and SFRS, like the other splicing factors derived from the
initial yeast modifier screen, contain RNA binding domains, which can mediate
aggregation of these proteins (Vanderweyde et al., 2013). Other RNA binding proteins
such as TLS (translocated in liposarcoma), proteins with WW domains, and indeed
TARDBP have been shown to interact with HTT. Therefore it is possible that
overexpression of HNRNPU and SFRS may contribute to HTT aggregation via
sequestration, though further investigation would be required to deduce the correct
79
mechanism/(s) involved (Vanderweyde et al., 2013, Doi et al., 2008, Fuentealba et al.,
2010, Passani et al., 2000).
Of the nine potential suppressor candidates, overexpression of CRNKL, EFTUD2,
HNRNPF, HNRNPK and TARDBP suppressed mutant HTT toxicity. Despite their unifying
role in mRNA splicing, after performing the splicing efficiency assay on cells
transfected with both the suppressors and the HTT constructs, it became apparent
that the mechanisms by which these proteins conveyed suppression was independent
of this post-transcriptional process. Given that our candidate genes were derived
from a yeast genetic modifier screen, an organism in which mRNA splicing is
considered to be a minor process (~3.8% of genes contain introns), it is perhaps
unsurprising these genes act to suppress HTT toxicity via a mechanism other than
splicing (Dujon, 1996, Lopez and Seraphin, 1999). Moreover, as our splicing assay was
based upon the splicing of a single construct, it is feasible that this assay may not be
reflective of global splicing.
We next examined mutant HTT aggregation dynamics by analysing inclusion body
formation with the aid of an automated cell analysis platform. These result suggested
that modulation of aggregation is likely to underline the suppression of toxicity. While
overexpression of CRNKL, HNRNPK, and TARDBP accelerated HTT aggregation,
overexpressing EFTUD2 and HNRNPF delayed aggregation. These results were
confirmed biochemically using filter retardation assays. Further investigation revealed
that such effects were attributed, at least in part, to changes in HTT expression
following induction. Such changes in expression could reflect variation at the
transcriptional level or mRNA stability.
Many of our candidate genes encode for multifunctional proteins, and thus have roles
in addition to mRNA splicing. For example HNRNPK has documented roles in both
mRNA stability and transcription. This nuclear protein has been shown to bind to
promoter regions and alter expression of the regulated gene (Lee et al., 1996,
Ostrowski et al., 2003). The inducible PC12 HD model employed in my study, contains
two stably transfected constructs, one of which encode the ecdysone receptor and the
retinoid X receptor under control of the CMV promoter. The second construct consists

80
of a binding site for the ecdysone-retinoid X receptor heterodimer, which modulates
transcription of the HTT fragment from the HSP minimal promoter when in the
presence of ponasterone A. It is feasible that HNRNPK could bind to either of these
promoter sequences, with overexpression bringing about an increase in transcription
of the genes encoding the receptors or the HTT fragment.
Similarly HNRNPF has been implicated as a negative regulator of polyadenylation.
Working in an antagonistic manner with its sister protein HNRNPH, HNRNPF reduces
gene expression by blocking the binding of cleavage stimulatory factor 2 (CstF2) to
SV40 polyadenylation site (Alkan et al., 2006, Yoshida et al., 1999). CstF2 plays a
crucial role in the polyadenylation of mRNA, and by extension the stability and
translation the mRNA transcripts (MacDonald et al., 1994). Overexpression of HNRNPF
in mammalian cells has previously been shown to reduce the expression of certain
genes, an effect attributed to an altered ratio of HNRNPF to HNRNPH (Veraldi et al.,
2001). Given that both the inherent constructs found in our PC12 cells given rise to
transcripts containing SV40 sequences, it is possible that overexpression of HNRNPF
prevents polyadenylation of these transcripts, leading to a reduction in HTT
expression, a theory consistent with our data.
Surprisingly overexpression of TARDBP was also found to be protective in our
neuronal cell lines. Previous studies conducted in C.elegans and murine models
reported that TARDBP overexpression induced neurological dysfunction and
symptoms synonymous with ALS and frontotemporal lobar degeneration (FTLD) (Tsai
et al., 2010, Ash et al., 2010, Wils et al., 2010). Such contradictory finding may be
attributed to differences in models, or differences in levels of expression. As with the
previous candidate genes, the mechanism surrounding protection appeared to lie at
the transcriptional level. In addition to its role in mRNA splicing, TARDBP has been
linked to transcriptional regulation, modulating assembly of transcription factors,
binding to promoter sequences and promoting mRNA stability (Ou et al., 1995,
Acharya et al., 2006, Strong et al., 2007). It is therefore possible TARBDP may
influence the expression of HTT at any of these transcriptional levels, though further
research would be required to elucidate the precise mechanism.

81
Both EFTUD2 and CRNKL encode for components of the spliceosome, and their
documented functions have been confined to the process of mRNA splicing. It was
therefore somewhat surprising that overexpression of these genes brought about
changes in the expression of the HTT fragment. In both cases depletion or knockout of
the encoded proteins has been shown to have a deleterious effect on splicing, with
lethal or disease-causing consequences (Lines et al., 2012, Frazer et al., 2009, Chung et
al., 2002). In our study, overexpression of CRNKL or EFTUD2, reduced splicing
efficiency by around 13 and 9% respectively (though the latter result failed to achieve
statistical significance). It is therefore possible that overexpression of these genes may
alter splicing of transcription factors, or proteins modulating post-transcriptional
processing such as capping and polyadenylation, ultimately altering expression of our
HTT fragment indirectly. Again, further study is required to determine the mechanisms
by which overexpression of these genes convey suppression against mutant HTT
toxicity in our neuronal cell lines. Interestingly of the our five genes of interest, both
CRNKL and EFTUD2 appear in the HD research crossroads database, and have been
assigned a score of 3, indicating that these genes have a causal relationship with HD,
and as such warrant further study (Kalathur et al., 2012).
Although our results suggest that the candidate genes largely appeared to suppress
mutant HTT via a mechanism independent of mRNA splicing, the splicing efficiency
assay revealed a polyQ length dependent decline in splicing efficiency in HEK293T
cells. Cell transfected with lentiviral constructs expressing 93Q HTT fragments
displayed a 20% drop in splicing efficiency relative to those transfected with the 25Q
construct. As highlighted in Chapter 1, neurodegenerative disorders have recently
been linked to defects in mRNA splicing, though work in the context of HD is scarce.
(Mills and Janitz, 2012b). Given that our splicing efficiency assay is designed to
represent global splicing, a defect in this form of RNA processing is likely to affect the
expression many genes (Licatalosi and Darnell, 2006, Cooper et al., 2009). This was
demonstrated by Jia et al, who found mutations in DNA encoding U2 snRNA, a
component of U2 snRNP, resulted a drop in splicing efficiency of ~28% in vitro (using
the same assay we utilised in our study), as well as global disruption in mRNA splicing
coupled with neurodegeneration (most prominent in the cerebellum) and ataxia in

82
mutant mice (Jia et al., 2012). The same group found many genes encoding mRNA
splicing factors to be greatly enriched in mutant mice, and proposed this to be a
compensatory mechanism to restore the splicing deficit. They further postulated such
attempts may only enhance abnormal splicing patterns seen in disease states (Jia et
al., 2012).
Our results suggest that, similar to the study above, aberrant splicing may play a role
in the neurodegeneration seen in HD. Such claims are supported by recent work
regarding abnormal splicing of genes encoding chloride channel 1 (ClC-1) in the
skeletal muscle of R6/2 mice, and indeed of HTT itself (Sathasivam et al., 2013, Waters
et al., 2013). Furthermore microarray data compiled from both HD patients and
transgenic murine models indicate differential expression of splicing factors in the HD
disease state, while RNAi screens conducted in both C.elegans and Drosophila models
of HD also reveal a significant enrichment in genes relating to RNA splicing (Kalathur
et al., 2012, Nollen et al., 2004, Zhang et al., 2010). Changes in this post-transcriptional
process during disease progression demands greater investigation and may provide
new avenues for therapeutic intervention.
In conclusion, many of our candidate genes modulated aggregation dynamics of
mutant HTT, an affect partly attributed to alterations in the expression of HTT in the
PC12 mammalian cell line. Such expression changes may have been linked to
transcription or post-transcriptional processes. The results derived from our splicing
efficiency assay suggest that aberrant splicing may have a role in the pathogenesis of
HD, a theory consistent with recently published work. The role of mRNA splicing in
disease progression therefore requires substantially more research and may provide
greater insight into this devastating condition.
83
2.5 Future work
Due to time constraints, I was unable to further investigate many of the results
obtained from this portion of the project. For example overexpression of HNRNPU or
SFRS3 exacerbated HTT toxicity in PC12 cells. It is therefore possible that knockdown
of these candidate genes may have a beneficial effect (though as demonstrated in
Chapter 3, such symmetry may not arise).
During the course of the in vitro cellular work, we attempted to examine the co-
localisation of EGFP tagged mutant HTT and the mRFP tagged suppressors. However,
this work was hampered by the extremely strong EGFP signal following HTT
aggregation relative to the weak fluorescent signal emitted by the red fluorophore. In
order to strengthen and shift the red signal further to the far red, I employed an RFP
booster ATTO 594, consisting of an RFP binding protein conjugated to a zwitterionic
dye with an absorbance of 601nm and emission of 627nm. Despite the shift in
fluorescence, the strong signal of the EGFP tag continued to penetrate the red filter,
making differentiation of the two fluorophores difficult. With more time, an
immunocytochemical approach, utilising an RFP-binding primary antibody and far-red
secondary antibody, may sufficiently separate the emissions of the two fluorophores.
Our attempts to elucidate the mechanisms surrounding the protection conveyed
following overexpression of our candidate gene, revealed changes in transcription.
Although transcriptional abnormalities have been noted previously in HD, changes in
the transcription of the HTT gene itself have not (Cha, 2007, Mazarei et al., 2009,
Hodges et al., 2006). Our results could be attributed to global transcriptional changes,
the result of altered mRNA degradation or other post transcriptional processes.
Conversely, given that HTT expression in our cellular model is regulated by a non-
endogenous promoter system, our results may simply reflect the artificial nature of
the experiment. Therefore it is necessary to further examine our candidate genes in a
transcriptional context. This could be achieved via transcriptional profiling of our cells
line in both the induced and repressed states.
Other methods to further explore our results may include the transfection of a
reporter system into our stable PC12 cell lines, using the same promoters as those
84
regulating HTT expression. Variations in the expression of the reporter may reveal
whether our findings are the result of general transcriptional effects of the promoter
or whether this may reflect effects specific to HTT. Furthermore, mRNA stability may
be examined via the isolation of cytoplasmic mRNA and the subsequent analysis using
a qPCR method against HTT. Given that nonsense mediated decay (NMD) occurs in the
cytoplasm, variations in cytoplasmic mRNA levels between cell lines may be indicative
of changes in mRNA degradation (Parker and Sheth, 2007).
One of the more interesting results from this portion of my thesis research came from
analysis of the candidate suppressors using splicing efficiency assays. I found that
transfection of our HTT constructs into HEK293T cells brought about a polyQ length
dependent splicing deficit. Defects in splicing may therefore play a role in the
manifestation and/or progression of HD. Research examining the role of mRNA
splicing in HD pathogenesis is still very much in its infancy, though our work suggests
that it could provide new insight into disease progression. Future work could include
the use of exon arrays and next generation sequencing techniques, such as RNA-seq,
to examine splicing changes of specific genes in HD (Mills and Janitz, 2012a). For
example, the Affymetrix Human Exon Array ST 1.0 consists of 1.4 million probe sets
used to analyse all known and predicted human exons. These probes can be used to
detect the level and relative abundance of different transcript isoforms (Okoniewski et
al., 2007). This technique has been successfully used to examine mRNA splicing
changes arising in certain forms of cancer (Gardina et al., 2006, Thorsen et al., 2008, Xi
et al., 2008).
With advances in next generation sequencing, sequencing of the entire transcriptome
is now possible in the form of RNA-seq. This technique consists of reverse transcribing
an entire population of RNA into cDNA, which is subsequently amplified and
sequenced into reads of approximately 400bps. These short fragments are then
aligned according to a reference and analysed. Similar to the microarray approach, the
RNA-seq technique can be used to determine levels of transcript isoforms, though
with a much higher fidelity (Wang et al., 2009). RNA-seq has been postulated as
means of examining the complex splicing events within brains, and by extension
changes is such events underlying neurological disorders (Sutherland et al., 2011).

85
Finally, in light of recent unpublished work conducted by De Almeida et al, one of
caveats of our splicing efficiency experiment may have been the use of HEK293T cells.
Work conducted by this group have highlighted a divergence in splicing patterns in
HEK293T cells, relative to other commonly used cell lines. As such, it will be necessary
to examine this polyQ length dependent splicing defect in HeLa cells or primary
neurons, as well as in vivo models.
86
Chapter 3
Exploring the role of splicing genes in Huntington’s disease using C. elegans
3.1 Introduction
3.11 The use of C. elegans as a model organism
The potential of Caenorhabitis elegans (C. elegans) as a versatile genetic model was
first highlighted by Sydney Brenner, in his seminal paper entitled “the genetics of
Caenorhabitis elegans”. Brenner described a comprehensive method by which C
.elegans strains were maintained and utilised in both forward genetics and compound
screens, as well as emphasising the advantages of this model over other invertebrate
models such as Drosophilia melanogaster (Brenner, 1974). Since publication, C.
elegans has been extensively studied, revealing a high degree of conservation
between this organism and humans, prompting many to select this model as a means
of bridging the gap between in vitro and in vivo work in rodents (Consortium, 1998).
The ease with which C. elegans can be grown and maintained in a laboratory makes its
extremely attractive as a model organism. Their short generation time, lasting
approximately 3-4 days (see Figure 3.1) and small size, coupled with their capacity to
grow on agar plates surviving on a diet of E. coli, makes this organism ideal for high-
throughput experiments. Furthermore, the transparency inherent to worms
throughout their lifespan allows metabolic processes and multiple cell types to be
viewed in real-time with the use of fluorescent markers (see Figure 3.2). Despite the
advantages of this model, the relative simplicity of their organs and absence of many
molecular pathways can limit comparison to our own physiology (Brignull et al., 2006,
Kaletta and Hengartner, 2006).

87
Figure 3.1. C .elegans life cyle. The C. elegans life span is approximately three to four weeks, with a generation time of around four days. This latter period is made up of an embryonic phase, followed by four larval stages, in which worms shed their cuticle and synthesise a new larval stage specific cuticle. Post embryonic development is prompted by the presence of food, without which, larva have the capacity to inhibit their development, surviving for up to ten days. In the presence of food, larvae begin the developmental process three hours after hatching. The four larval stages (L1-L4) are accompanied by the maturation of the nervous, reproductive and elementary immune (coelomocytes) systems (Wood, 1988). Following the L1 developmental stage, worms can enter the dauer phase, a state of growth arrest in response to overcrowding or scarcity of food, and can remain in this form for up to four months. In the dauer phase animals exhibit a reduced level of locomotion and feeding until favourable conditions are re-established, initiating further larval development (Cassada and Russell, 1975). Upon reaching adulthood, worms are capable of producing oocytes for up to four days, after which they live for an additional ten to fifteen days (Wood, 1988)(Adapted from wormatlas.org).
The rudimentary nervous system of C. elegans consists of a mere 302 neurons, making
it an ideal organism in which to analyse the neural circuitry underlying behaviour (see
Figure 3.2). C. elegans is the only organism to have had its entire nervous system
mapped, a task facilitated by the simplicity of its synaptic connectivity. The majority of
neurons are unbranched forming around 5000 synapses, many of which being dyads
88
or triads (White et al., 1986). Such information is invaluable in deconvoluting our own,
vastly more complex nervous system and in turn understanding diseases of the
nervous system, such as Parkinson’s Disease (PD), Alzheimer’s disease (AD) and
Huntington’s disease (HD)(Kaletta and Hengartner, 2006, Chatterjee and Sinha, 2008,
White et al., 1986).
3.12 C. elegans and RNAi
The potential of C. elegans as a genetic model was further emphasized by the
development of RNA interference (RNAi) technology, the post-transcriptional knock
down of gene expression, which was first described in this nematode. Initial RNAi work
focused on the use of single stranded antisense or sense strand RNA, homologous to a
specific region of a gene, which produced notable, though inconsistent, reduction of
gene expression (Fire et al., 1991, Hunter, 1999). The research spearheaded by
Andrew Fire and Craig C. Mello led to significant advances, revealing the importance
of RNA structure and the greater efficacy of knock down afforded by double stranded
RNA (Fire et al., 1998). It is believed that the variability arising from the use of single
stranded RNA was predominantly attributed to the presence of contaminating
complementary RNA, leading to the formation of a double stranded structure. The use
of purified single stranded RNA was found to result in a significantly lower level of
knock down (Montgomery and Fire, 1998, Hunter, 1999). These studies consolidated
this method as a viable technique for genetic manipulation.

89
Figure 3.2. Schematic, confocal and fluorescence diagrams of C. elegans. C. elegans possesses a simple nervous system comprising of 302 sensory, motor and inter neurons. 282 of these neurons are found along the body of the worm at several ganglia that constitute the somatic nervous system, while the remainder are located within the pharynx forming the pharyngeal nervous system. The nervous system consists of the nerve ring and two parallel nerve cords (dorsal and ventral), which are connected via commissural tracts. The majority of the neuron cell bodies are located in the head, forming large ganglia or the “brain” of the worm. Four sensory neurons are highlighted in the diagram above, the ASH, ASI, PHA and PHB neurons (the majority of the neurons found within C. elegans are paired, though for simplicity both the left and right neurons are referred to as a singular body). The two latter neurons are visible with the use of GFP expressed under a sensory neuron specific promoter (White et al., 1986, Li, 2001, Faber et al., 1999).
Following optimisation of the RNAi structure, Andrew Fire and Lisa Timmons sought to
simplify the RNAi delivery system by utilising the interference effect exhibited by the
dsRNA, i.e. the spreading of the interference from the initial site of injection, a
dispersal which was found to be more pronounced upon ingestion. Feeding worms
with an RNase III deficient E.coli strain containing the RNAi constructs produced large
quantities of the dsRNA following ingestion, which subsequently spread throughout
the animal’s body. The knock down of specific genes was comparable to that
90
generated by direct microinjection, and could be maintained over several generations
by the continued feeding of worms with these RNAi expressing bacteria (Fire et al.,
1998, Timmons et al., 2001, Timmons and Fire, 1998). This method of delivery has a
number of advantages over the more arduous injection technique, most notably the
cost and ease of performing genetic screens, as well as the capacity to alter RNAi
levels to uncover lesser phenotypes attributed to the knockout of pleiotropic genes
(Kamath et al., 2001).
The mechanism of RNAi induced post-transcriptional gene silencing (PTGS) in C.
elegans has yet to be fully characterised, and as such, many of the proteins involved
are unknown. Upon entering the organism, dsRNA is cleaved by the Dicer complex to
form small interference RNA (siRNA). These smaller structures are subsequently
unwound and bind to target mRNA, forming a platform for the assembly of the RNA
induced silencing complex (RISC), which catalyses degradation of mRNA, and in turn
generates genetic knock down (see Figure 3.3) (Grishok, 2005) .

91
Figure 3.3. Schematic of post transcriptional silencing in C. elegans. Upon ingestion dsRNA undergoes cleavage to form primary siRNA. The first step is catalysed by the Dicer complex, consisting of Dicer, a dsRNA specific RNAIII ribonuclease; Rde-1 (RNAi deficient 1), a dsRNA binding protein thought to facilitate transport of the siRNA to the downstream complex; Drh-1(Dicer related helicase 1); and Rde-4 (RNAi deficient 4), a dsRNA binding protein that works in concert with Rde-1 to retain dsRNA for cleavage by Dicer (Tabara et al., 2002, Grishok, 2005). Following cleavage, the siRNA can be degraded by eri-1 (enhanced RNAi 1), an exonuclease found in the gonads and certain neurons, thus antagonising knockdown(Kennedy et al., 2004). Conversely successful knockdown is achieved through unwinding of the siRNA and binding of the resulting single stranded siRNA to target mRNA. This double stranded structure provides an assembly site for the RNA induced silencing complex (RISC), comprising of several components (many unknown) including Tsn-1 (Tudor staphylococcal nuclease homolog 1), a protein containing 5 nuclease domains and Vig-1 (Vasa intronic gene 1), an RNA binding protein. Upon formation, the RISC complex is believed to catalyse the degradation of mRNA (Caudy et al., 2003, Grishok, 2005). In addition to the RISC complex, the single stranded siRNA act as primers for amplification catalysed by RNA dependent-RNA polymerases such as the germ line specific Ego-1 (enhancer of glip 1) or the somatic cell polymerase, Rrf-1 (RNA-dependent RNA polymerase 1). Either of these polymerases forms a complex along with other proteins, such as the polymerase β nucleotidyltransferase, Rde-3 (RNAi deficient 3), to reform the dsRNA, and provide a substrate for Dicer complex(Grishok, 2005). Adapted from (Grishok, 2005)
92
3.13 C. elegans and Huntington’s disease
C. elegans models have provided valuable insight into many neurodegenerative
diseases. The generation of transgenic strains expressing mutant variants of disease
causing genes can often recapitulate the human disease phenotype. Worms
expressing human β-amyloid peptide (Aβ-42), the toxic species attributed to AD, form
amyloid plaques and trigger cellular toxicity in muscle cells (Link, 1995). Over
expression of mutant human α-synuclein, a protein synonymous with PD, leads to loss
of dopaminergic neurons and subsequently motor deficits (Lakso et al., 2003). C.
elegans provides a means of studying the effects of such toxic insults in the context of
a less complex, yet well defined, nervous system compared to higher mammals.
Despite the lack of a worm HTT orthologue, Huntington’s disease (HD) has been
studied in C. elegans with the use of transgenic strains expressing the human gene.
This offers the capacity to dissect the toxic gain-of-function mechanisms underlying
HD pathology. Faber et al first generated such transgenic lines co-expressing GFP and
a human huntingtin fragment with a 150Q tract under a sensory neuron specific
promoter (OSM-10), and observed polyglutamine length-dependent formation of
protein aggregates and neurodegeneration of the ASH, ASI, PHA and PHB neurons (see
Figure 2.2). Toxicity in these strains was assessed through a simple nose touch
sensitivity test and by observing defects in the worm’s capacity to take up a lipophilic
dye via the exposed sensory neuron endings (Faber et al., 1999). The same group
performed genetic screens using these worm strains and found that mutations within
the polyQ enhancer (PQE-1) gene greatly exacerbated the HD phenotype, while
overexpression conveyed protection against neurotoxicity, through an unknown
mechanism (Faber et al., 2002).
Several subsequent genetic screens conducted using C. elegans, have highlighted the
use of this model as a tool for identifying candidates that directly modulate the gain-
of-function mechanisms responsible for mutant HTT toxicity. Such screens have been
made possible with advances in RNA interference (RNAi) technology, which was first
optimised and implemented in C. elegans, and has since proven to be invaluable in
reverse genetics (Brignull et al., 2006, Fire et al., 1998). Several groups have
93
capitalised on the use of this model coupled with RNAi, for example Nollen et al
performed a genome-wide RNAi screen that identified 186 candidate genes, whose
reduced expression enhanced aggregation in transgenic C. elegans strains expressing a
Htt40Q fragment fused to YFP (yellow florescent protein) in body wall muscle cells.
Interestingly many of these disease modifiers were involved in both RNA synthesis and
processing or to protein synthesis and folding. This led the authors to surmise that
aggregation may be attributable to a loss or imbalance of protein homeostasis. This
disequilibrium may be produced by a combination of translational defects and
dysfunctions of upstream biosynthetic processes (Nollen et al., 2004).
More recently, Lejeune et al conducted a similar RNAi screen, in which 6034 genes
were knocked down in a C. elegans strain expressing a 128Q N-terminal huntingtin
fragment in touch receptor neurons (under the mec-3p promoter). Expansion of the
polyglutamine tract resulted in progressive neuron dysfunction leading to an
impairment of the touch response. This screen identified 662 modifiers of neuronal
dysfunction involved in a variety of cellular processes including metabolism,
differentiation, homeostasis and the immune system. Many of these processes have
previously been linked to HD, demonstrating the strength and fidelity of such an
approach in identifying putative therapeutic targets. Interestingly, a third of these
genes had mouse orthologues, 49 of which are transcriptionally dysregulated in the
striatum of two widely used HD mouse models (CHDL knock-in and R6/2 mice). This
study therefore illustrates the use of C. elegans as a means of identifying new
therapeutic targets for HD, as well as validating other genetic models (Lejeune et al.,
2012).
In addition to genetic screens, C. elegans models provide a simple and cost effective
method for testing potential drug candidates. A recent drug screen revealed that
trichostatin A, lithium chloride and mithramycin, compounds previously tested in cell
culture, Drosophilia and mouse models respectively, all supressed polyQ induced
neurotoxicity in HD worms. To understand the mechanisms by which lithium chloride
and mithramycin conveyed neuroprotection, the group performed a starvation assay,
utilising the worm larvae’s capacity to undergo growth arrest in the absence of food.
Although this ability would ordinarily allow the worms to survive for longer periods of

94
time, the group found that this dauer state did not protect the sensory neurons from
the neurotoxic insult of mutant HTT fragments. Both Lithium chloride and
mithramycin promoted neuron survival, despite a lack of growth, suggesting that the
protective properties of the drugs could not be attributed to growth or developmental
pathways. In order to address the possible role of aging in the therapeutic effects of
these compounds, the group also screened the drugs in HD worm strains with a daf-16
null mutation (Voisine et al., 2007). DAF-16 is a transcription factor involved in the
insulin-like pathway, which plays a crucial role in aging. Previous research has shown
that knockdown of this transcription factor exacerbates mutant HTT aggregation and
reduces longevity of C. elegans models of HD, while overexpression extends the
lifespan, suggesting a common DAF-16 target in both aging and mutant HTT
aggregation pathways (Lin et al., 1997, Morley et al., 2002). Both lithium chloride and
mithramycin were found to be neuroprotective in the absence of daf-16, indicating a
daf-16 independent mode of action(Voisine et al., 2007).
Two of the salient features of HD are the formation of aggregates as well as an inverse
correlation between CAG repeats and age of onset. Many studies compare the effects
of very large polyQ tracts relative to shorter, less toxic repeats, with few studies
having examined the transitional cellular changes that occur as these CAG repeats
pass the toxicity threshold. Morley et al generated several worm strains expressing
polyQ-YFP fusion proteins containing varying length expansions (Q29, Q33, Q35, Q40,
Q44, Q64 and Q81) in the body wall muscle cells, and exploited the transparency of C.
elegans to investigate aggregation dynamics. The group found that below 35Q the
fusion proteins displayed a diffuse distribution within the cell, indicative of a soluble
form of the protein, and does not impair motility compared to non-transgenic strains.
Conversely the worms expressing greater than 44Q exhibited large focal aggregates,
correlating with a drastic decline in worm motility. Interestingly, the 40Q strains
displayed an amalgamation of cells, either with a diffuse distribution of the soluble
protein, or aggregates of the insoluble form. In this case motility deficits were
governed by the ratio of these two cell groups, with 40Q worm containing fewer of
the latter cells displaying a phenotype closer to the non-transgenic strain, thus
95
demonstrating the importance of the threshold in dictating a propensity of polyQ
proteins to aggregate (Morley et al., 2002).
With recent advances in RNAi technology coupled with the inherent advantages
associated with this invertebrate system, the use of C. elegans as a model for the
study of HD has only recently been fully realised. The combined work of many groups
has led to the discovery of pathways, genes and drugs that modulate the toxic effects
of mHTT, as well as confirming findings derived from in vitro studies, all of which has
provided new insight into this neurodegenerative disease.
3.14 Aims
Prior to further validation in HD murine models, we chose to refine the list of splicing
candidate genes that arose from the work conducted in HD mammalian cell lines.
Given the simplicity of the organism coupled with the ease of maintenance and
genetic manipulation, C. elegans provided a rapid intermediate to further examine
the mechanistic roots of the suppression, assessing whether knockdown of these
suppressors exacerbated HD-related phenotype, and therefore complement the our
previous work.

96
3.2 Materials and methods
3.21 Materials
3.211 Bacterial strains and nematode strains
Escherichia coli strain
A tetracycline resistant Ht115 (DE3) E.coli strain was used during the course of the
RNAi knockdown analysis, with the genotype: F-, mcrA, mcrB, IN(rrnD-rrnE)1, lambda-,
rnc14::Tn10, DE3 lysogen: lavUV5 promoter –T7 polymerase, IPTG-inducible T7
polymerase, RNase III (-), available from the Caenorhabditis Genetics Center (CGC).
Transgenic C. elegans strains
To assess the effects of depletion of our suppressor genes on HD phenotypes, we
utilised three C. elegans strains, an N2 wild type strain and two transgenic HD strains.
The first of these transgenic strains (osm-10p::GFP + osm-10p::HtnQ150 + Dpy-20(+))
coexpressed a huntingtin fragment containing 150 CAG repeats along with GFP, while
the second strain (osm-10p::GFP + osm-10p::HtnQ150 + Dpy-20(+) pqe-1) additionally
lacked expression of the polyQ enhancer-1 gene (PQE-1), a mutation which
exacerbated the aggregation of the mutant huntingtin fragment and consequently a
more aggressive phenotype. Huntingtin and GFP expression in both transgenic strains
were driven by the sensory neuron specific OSM-10 (osmosensory) promoter, limiting
expression to the ASH, ASHI, PHA and PHB bilateral sensory neurons. The two
transgenic strains were both generated by the Hart lab, and are available from the
CGC (strains HA659 and HA759 respectively) (Faber et al., 1999, Faber et al., 2002).
3.212 Constructs
L4440 Plasmids
The RNAi constructs were generated by Source Biosciences, genomic fragments were
cloned into the worm-specific L4440 vector (Timmons and Fire feeding vector). The
MCS is flanked by two T7 promoter sequences in an inverted orientation.
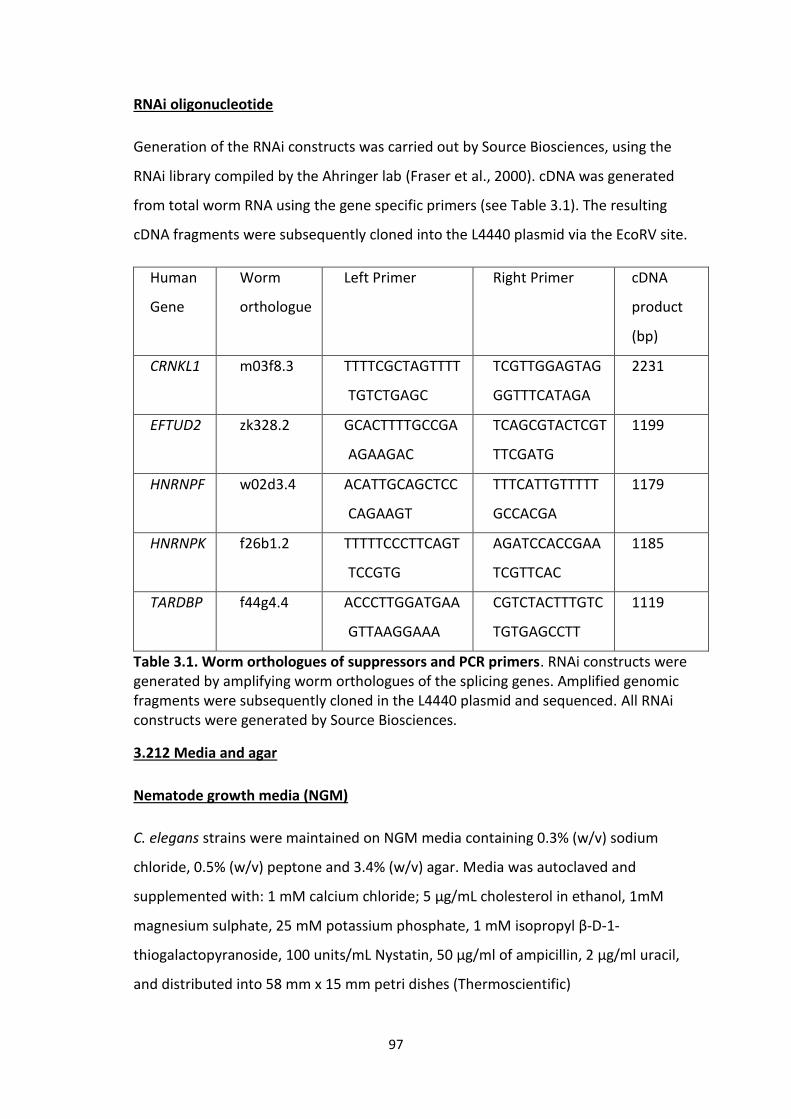
97
RNAi oligonucleotide
Generation of the RNAi constructs was carried out by Source Biosciences, using the
RNAi library compiled by the Ahringer lab (Fraser et al., 2000). cDNA was generated
from total worm RNA using the gene specific primers (see Table 3.1). The resulting
cDNA fragments were subsequently cloned into the L4440 plasmid via the EcoRV site.
Human
Gene
Worm
orthologue
Left Primer Right Primer cDNA
product
(bp)
CRNKL1 m03f8.3 TTTTCGCTAGTTTT
TGTCTGAGC
TCGTTGGAGTAG
GGTTTCATAGA
2231
EFTUD2 zk328.2 GCACTTTTGCCGA
AGAAGAC
TCAGCGTACTCGT
TTCGATG
1199
HNRNPF w02d3.4 ACATTGCAGCTCC
CAGAAGT
TTTCATTGTTTTT
GCCACGA
1179
HNRNPK f26b1.2 TTTTTCCCTTCAGT
TCCGTG
AGATCCACCGAA
TCGTTCAC
1185
TARDBP f44g4.4 ACCCTTGGATGAA
GTTAAGGAAA
CGTCTACTTTGTC
TGTGAGCCTT
1119
Table 3.1. Worm orthologues of suppressors and PCR primers. RNAi constructs were generated by amplifying worm orthologues of the splicing genes. Amplified genomic fragments were subsequently cloned in the L4440 plasmid and sequenced. All RNAi constructs were generated by Source Biosciences.
3.212 Media and agar
Nematode growth media (NGM)
C. elegans strains were maintained on NGM media containing 0.3% (w/v) sodium
chloride, 0.5% (w/v) peptone and 3.4% (w/v) agar. Media was autoclaved and
supplemented with: 1 mM calcium chloride; 5 µg/mL cholesterol in ethanol, 1mM
magnesium sulphate, 25 mM potassium phosphate, 1 mM isopropyl β-D-1-
thiogalactopyranoside, 100 units/mL Nystatin, 50 µg/ml of ampicillin, 2 µg/ml uracil,
and distributed into 58 mm x 15 mm petri dishes (Thermoscientific)
98
RNAi expressing bacteria
RNAi-expressing HT115 bacteria were cultivated on luria Bertani (LB) media
supplemented with: 50 μg/mL Ampicillin; 25 μg/mL carbenicillin and 10 μg/ml
tetracycline. Following selection on LB media, bacteria were cultured in LB broth until
an OD600 of 0.5 and seeded onto NGM plates. Plates were then incubated at 37 oC
overnight prior to the addition of the worm strains.
3.22 Methods
C. elegans husbandry
C. elegans strains were transferred onto NGM plates seeded with RNAi expressing
bacteria and incubated for 72 hours at 19 oC, at which point animals at the L4 stage of
the nematode life cycle were picked and placed onto a fresh bacterial lawn. These
worms were selected every two days and transferred onto fresh NGM plates to
prevent hatching and maturation of progeny, and maintain a group of animals of the
same age. Behavioural assays were conducted after 8 days of aging.
Sensitivity assay
The sensitivity of 8-day old adult hermaphroditic worms was assessed by stroking the
anterior body region corresponding to the location of the ASH sensory neurons. A
positive response to this mechanical stimulus was deemed to be a change in the
direction of movement or a break in locomotion. Animals were trailed ten times using
a Leica M165 FC microscope, and the number of positive responses recorded.
Body bend assay
The frequency of body bends during locomotion was assessed in 8-day old adult
hermaphroditic worms. The number of sine wave movements in a one minute period
was scored using Leica M165 FC microscope.
Dye filling assay
A 2 mg/ml stock of 1,1’-dioctadecylt-3,3,3’,3’-tetramethylindodicarbocyanine
perchlorate (DiD) in dimethyl formamide was diluted 1:200 in M9 buffer (0.3% KH2PO4
99
(w/v), 0.6% Na2HPO4 (w/v), 0.05% NaCl (w/v) and 0.1% NH4Cl (w/v)) and 3 day old
adult worms were incubated in the dilute dye solution for one hour. Animals were
then washed three times in M9 buffer and further destained on bacterial lawn for one
hour. Worms were mounted onto agar pads containing sodium azide, and ASH
neurons visualised at 40X magnification using a fluorescence microscope (Ziess
Axiovert 200M, Zeiss Colibri controller) with the Axiovision 4.8 software (Carl Zeiss).
RNA isolation
The N2 C. elegans strain was grown for 6 days on a bacterial lawn expressing each of
the RNAi constructs or an empty vector control. Following this initial incubation,
worms were pelleted and immersed in a bleach solution (5% (v/v) sodium
hypochlorite and 0.5 M sodium hydroxide) for 5 minutes. This bleach solution lysed all
adult and immature worms, while leaving the incipient eggs undamaged. These eggs
were washed several times in sterile distilled water, plated onto fresh bacterial lawns
and incubated for a further 72 hours at 19 oC. Following this second incubation,
mature 3 day old animals (L4 stage) were lysed in TRI reagent (Sigma), with the
resulting RNA precipitated in 75% ethanol and resuspended in RNase/DNase free
water (see Method and Material, Chapter 1). The integrity of the RNA was
subsequently determined using nanophotometer (Implen) (OD260/OD280 nm
absorption ratio >1.85).
Despite the behavioural assays having been performed on 8 day old worms, the RNA
isolation was carried out on 3 day old animals. After three days, worms mature to
adulthood and become capable of laying eggs. RNA samples taken after this period
would reflect knockdown in worms of varying ages, reducing the overall level of
knockdown observed, as 72hours is required for robust RNAi knockdown (Kamath et
al., 2001) . Conversely aged worms, as used in both of the behavioural tests, would
have yielded an inadequate amount of RNA. The bleaching method used in this study
generates a large number of worms of the same age which produce a sufficient
amount of the RNA for quantitative PCR.

100
Reverse transcription and quantitative PCR
Genetic knockdown of the splicing genes was assessed using real-time quantitative
PCR. 250 ng of RNA was reverse transcribed to form single stranded cDNA using the
ImProm-II™ Reverse Transcription System (Promega). The subsequent analysis was
performed using a Applied Biosystems StepOne™plus Real-Time PCR System coupled
with Fast SYBR® Green Master Mix (Applied Biosystems).Transcripts were amplified
using 0.4 µM forward and reverse primers (see Table 3.2), and data normalised to the
reference gene, which encodes alpha tubulin-4 (F44F4.11). Following optimisation, the
concentration of the primers to amplify the TARDBP transcipts were reduced to 0.1
µM, to lessen primer dimerization. Amplification consisted of a denaturation step at
95 oC for 10 minutes, followed by 40 cycles of 3 seconds at∆ 95 oC and 30 seconds at
60 oC, with fluorescence monitored at the 60 oC stage of each cycle. Subsequent
quantification of results was performed using the ∆∆Ct method as previously
described in (Pfaffl, 2001)
Prior to quantitative PCR, primer specificity and PCR efficiency was validated by
generating melt curves and standard curves respectively.
Primer Primer sequence (5’-3’) Tm (oC)
CRNKL1 C.ELEGANS FORWARD GATGTTACTGGAAGCATGGA 57
CRNKL1 C.ELEGANS REVERSE AGGCATCATAGTTTCAACTCTC 58
HNRNPF C.ELEGANS FORWARD ATGAAGTTCAATGTCGTGGA 57
HNRNPF C.ELEGANS REVERSE GCTTTCGATTCCATTATTTCCG 58
HNRNPK C.ELEGANS FORWARD CGTTTGGAAGATAATTTCTCGG 57
HNRNPK C.ELEGANS REVERSE GATAAGAGCTCCAGCATGTG 58
TARDBP C.ELEGANS FORWARD AGCTGTTCAAGTCGATCCCA 58
TARDBP C.ELEGANS REVERSE GCGGGGCAACAATAACGAAG 58
ALPHA TUBULIN FORWARD CGCCTGGACTACAAGTTTGAC 60
ALPHA TUBULIN REVERSE GCCTCAGTGAACTCTCCCTCT 60
Table 3.2. Quantitative PCR primers. The sequences and annealing temperatures of primers used to assess the knockdown of splicing genes.
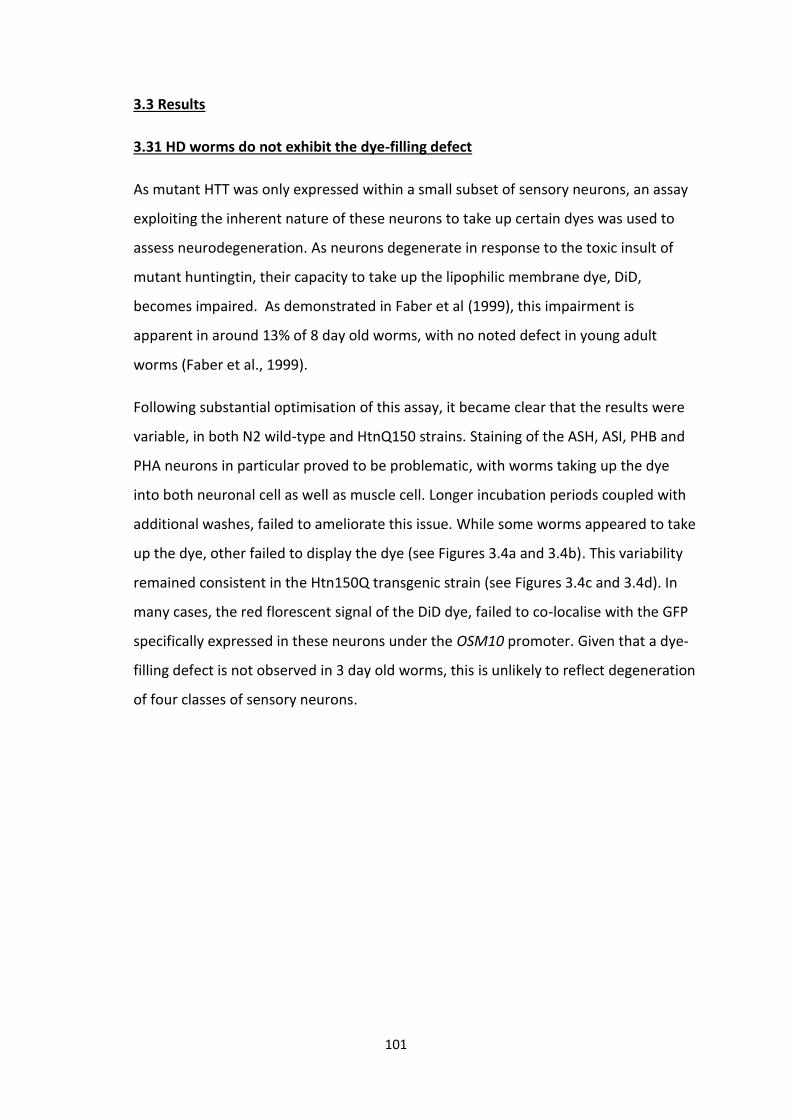
101
3.3 Results
3.31 HD worms do not exhibit the dye-filling defect
As mutant HTT was only expressed within a small subset of sensory neurons, an assay
exploiting the inherent nature of these neurons to take up certain dyes was used to
assess neurodegeneration. As neurons degenerate in response to the toxic insult of
mutant huntingtin, their capacity to take up the lipophilic membrane dye, DiD,
becomes impaired. As demonstrated in Faber et al (1999), this impairment is
apparent in around 13% of 8 day old worms, with no noted defect in young adult
worms (Faber et al., 1999).
Following substantial optimisation of this assay, it became clear that the results were
variable, in both N2 wild-type and HtnQ150 strains. Staining of the ASH, ASI, PHB and
PHA neurons in particular proved to be problematic, with worms taking up the dye
into both neuronal cell as well as muscle cell. Longer incubation periods coupled with
additional washes, failed to ameliorate this issue. While some worms appeared to take
up the dye, other failed to display the dye (see Figures 3.4a and 3.4b). This variability
remained consistent in the Htn150Q transgenic strain (see Figures 3.4c and 3.4d). In
many cases, the red florescent signal of the DiD dye, failed to co-localise with the GFP
specifically expressed in these neurons under the OSM10 promoter. Given that a dye-
filling defect is not observed in 3 day old worms, this is unlikely to reflect degeneration
of four classes of sensory neurons.

102

103
Figure 3.4 Confocal images of worms following incubation within DiD lipophilic dye. Both N2 wild type and HtnQ150 transgenic worms were incubated in the red fluorescent dye DiD, and visualised with the use of florescence microscopy. Sensory neurons with nerve endings exposed to the environment hold the capacity to take up lipophilic dyes such as DiD, an ability abrogated upon neuronal degeneration (A) A subset wild type worms appeared to take up the red lipophilic dye into several of the neurons that make up the nerve ring in the head. However, many of the animals failed to incorporate the compound into the ASH or ASI neurons (the positions of which are indicated by the white boxes). (B) Some worms displayed clear uptake of the dye into these specific sensory neurons (highlighted in the second panel) (C) Similar to the wild type strain, many of the HtnQ150 transgenic worms failed to display uptake of the dye into either of the OSM10::GFP expressing ASH or ASI neurons. (D) Some worms (left worm) displayed a red fluorescence signal overlapping with the green florescence found within these neurons (All images taken at 10x magnification).
3.32 RNAi knockdown of splicing-related suppressors does not modulate HD
phenotypes
To determine the effects of RNAi knockdown of splicing genes in HD worms sensory
neuron functioning (sensitivity) and general movement (bondy bends) was assessed in
8 day old worms maintained on RNAi expressing bacteria. Worms were also grown on
bacteria expressing an empty vector as a control. Initial characterisation of the two HD
strains revealed a subtle sensitivity defect in the HD worms relative to the N2 wild
type strain and a much more prominent decline in the frequency of their movement
(see Figure 3.5 and 3.6).
RNAi constructs were generated by Source Biosciences and although the majority of
their RNAi expressing bacteria appeared to grow well on LB agar, those expressing
EFTUD2 failed to form colonies. After several attempts to grow this particular RNAi
expressing bacterial strain, Source Biosciences admitted they were unable to generate
further constructs, and consequently we were unable to continue with this portion of
the work.
Upon genetic knockdown of each of the remaining splicing genes, it became apparent
that a reduction in their expression brought about little or no change in the behaviour
of both the wild type and transgenic worms. However, prolonged knockdown of
CRNKL proved to be lethal in each of the three C.elegans strains, with the vast majority

104
of worms failing to mature past four to five days. As such these worms were excluded
from behavioural assays.
Results from the sensitivity assay revealed a small drop in sensitivity in the HtnQ150
strain grown on bacteria containing an empty vector, compared to the corresponding
wild type worms, with the HtnQ150 pqe-1KO strain displaying an even greater defect.
Although these results failed to gain statistical significance following an ANOVA, the
trend between the three nematode strains remained consistent following knock down
of each of our splicing genes.
Similar to the results obtained from the sensitivity assay, the HtnQ150 strain exhibited
fewer body bends during a one minute period, indicative of a movement defect. This
defect was once again more conspicuous in the HtnQ150 pqe-1KO strain, a trend
which remained constant despite knock down of each of the splicing genes.
Quantitative PCR was employed to validate the knockdown of our suppressor genes
following prolonged growth of N2 wild type animals on RNAi expressing bacteria. RNA
was extracted from worms after three days of ageing. In each case, changes in gene
expression were normalised to alpha tubulin, and subsequently compared to control
worms fed on bacteria containing an empty vector.
Knockdown of CRNKL and HNRNPF resulted in a fairly modest decrease in gene
expression, approximately 10% and 20% respectively. Conversely knockdown of
HNRNPK and TARDBP caused an unexpected increase in expression of 35-fold and 3-
fold respectively (see Figure 3.7). After performing a paired Wilcoxon test to compare
the RNAi and EV treated worms, the results we not deemed statistically significant.
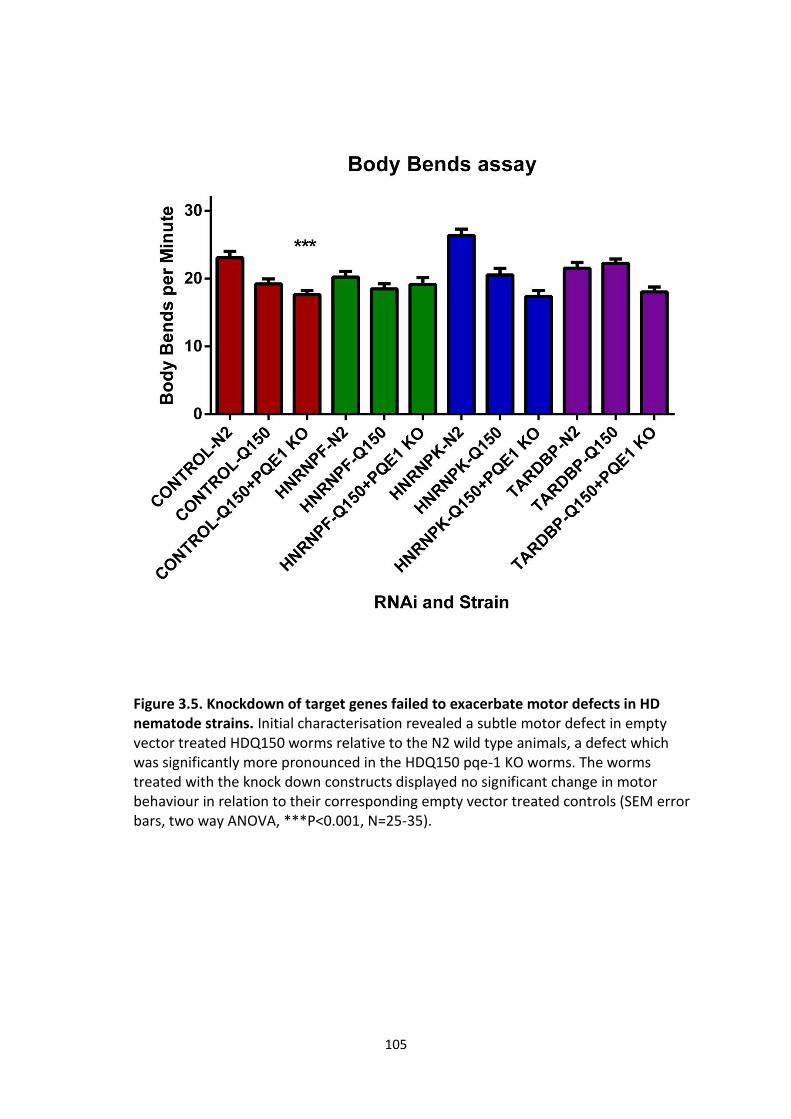
105
Figure 3.5. Knockdown of target genes failed to exacerbate motor defects in HD nematode strains. Initial characterisation revealed a subtle motor defect in empty vector treated HDQ150 worms relative to the N2 wild type animals, a defect which was significantly more pronounced in the HDQ150 pqe-1 KO worms. The worms treated with the knock down constructs displayed no significant change in motor behaviour in relation to their corresponding empty vector treated controls (SEM error bars, two way ANOVA, ***P<0.001, N=25-35).
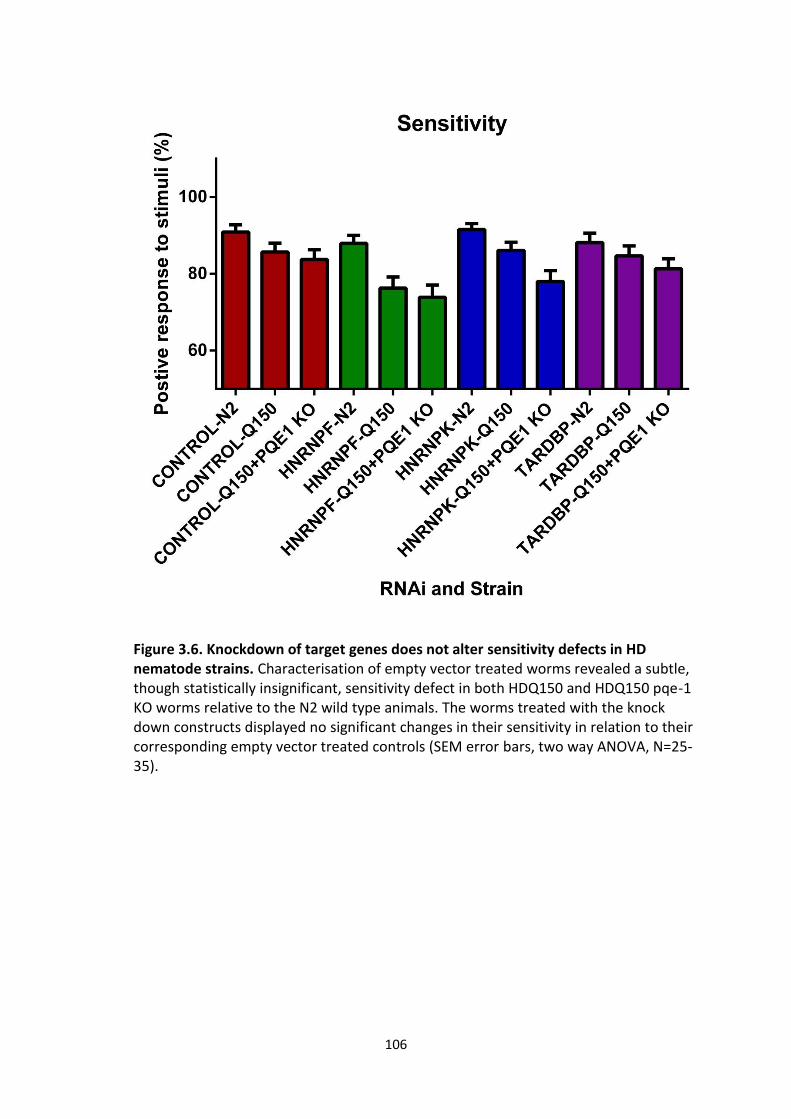
106
Figure 3.6. Knockdown of target genes does not alter sensitivity defects in HD nematode strains. Characterisation of empty vector treated worms revealed a subtle, though statistically insignificant, sensitivity defect in both HDQ150 and HDQ150 pqe-1 KO worms relative to the N2 wild type animals. The worms treated with the knock down constructs displayed no significant changes in their sensitivity in relation to their corresponding empty vector treated controls (SEM error bars, two way ANOVA, N=25-35).

107
Figure 3.7. Knockdown constructs brought about a moderate decrease in expression of CRNKL and HNRNPF, and an increase in expression of HNRNPK and TARDBP. Following propagation of N2 worms on RNAi expressing bacteria for six days, eggs were isoloated and allowed to mature for a further three days. RNA was isolated from three day old worms, and analysed with the use of quantitative PCR. The data was analysed using the ∆∆CT method as described in (Pfaffl, 2001), in which results were initially normalised to an internal control (alpha tubulin), and then to control worms fed bacteria containing an empty vector. Knockdown of both CRNKL and HNRNPF resulted in a drop in expression, 9% and 22% decrease respectively. Surprisingly knockdown of HNRNPK and TARDBP resulted correspondingly in a 32 and 3 fold increase in expression (SEM error bars, N=3, paired Wilcoxon test was performed to compared RNAi treated and EV treated worms).

108
3.4 Discussion
Given the results obtained from the overexpression of our mRNA splicing suppressor
genes in mammalian cells, we hypothesized that knockdown of these genes would
enhance/modulate HD phenotypes in worms. We aimed to knockdown the five genes
which conveyed protection against mutant huntingtin in our PC12 neuronal cell line
(CRNKL, EFTUD2, HNRNPF, HNRNPK and TARDBP). The consequences of knockdown
were to be assessed via sensitivity of the worms to a physical stimulus, and the uptake
of a flourescent dye via the exposed sensory nerve endings, both of which had been
previously been shown to be impaired in HD worms (Faber et al., 1999).
Unfortunately the dye filling assay was hampered by a lack of reproducibility, and
although Faber et al noted the same problem in regards to ASI, PHA and PHB neurons,
they found that the ASH neurons displayed a more consistent uptake of the dye in
wild type worms. However in our study the ASH sensory neurons failed to
reproducibly exhibit this phenotype, despite considerable optimisation, and as such
the assay was dropped.
While conducting the initial characterisation of the sensitivity defects in HD strains, it
became apparent that the HD worms exhibited a more erratic movement pattern
compared to their wild type counterparts. This was confirmed using a simple body
bends assay, which revealed fewer sine wave movements in the HD Q150 worm
strain, a motor defect which was significantly exacerbated in worms lacking the PQE1
gene. Although this particular phenotype has not been observed previously, loss of the
diverse functions of the ASH neurons, which include avoidance of toxic repellents,
osmotic changes and mechanical stimuli, may account for this motor defect (Hilliard et
al., 2005). The direction of nematode movement is reliant on the chemosensory
function of the ASH neurons, coupled with the antagonistic actions of PHA and PHB
neurons. These neurons enable the worms to sense it’s environment and direct it’s
movement away from repellents and towards more favourable conditions (Hilliard et
al., 2002). Given that mutant HTT is expressed in all three of these neurons, ablation
of this interaction may result in disorientation.
109
Work conducted by Fujiwara et al also demonstrated behavioural changes in worms
stemming from defects in their sensory perception. In this study, mutation in the
f38g1.1 genes resulted in restricted movement, known as dwelling behaviour, and
fewer body-bends during forward locomotion. This gene encodes CHE-2, a component
of the intraflagellar transport complex (IFT), which modulates behavioural responses
to sensory inputs. This complex is crucial in the biogenesis of the sensory cilium and
therefore the functioning of the sensory neurons. Mutations in CHE-2 are thought to
result in an increase in cGMP-dependent protein kinase (PKG), a protein implicated in
eliciting dwelling behaviour in both Caenorhabditis elegans and Drosophilia
melanogaster. (Fujiwara et al., 2002, Fitzpatrick and Sokolowski, 2004). Furthermore
HTT has been shown to interact indirectly with components of the IFT, and this in turn
may bring about changes in social behaviour (Haycraft et al., 2003, Gervais et al.,
2002)
Behavioural changes have also been noted following loss of the ASH and ASL neurons,
inw which group-forming worms transform into solitary feeders, a change
accompanied by a drop in locomotion. Although the results of this study
demonstrated the need to disrupt both sets sensory of neurons to bring about a
drastic behavioural change, it is feasible disruption of ASH neurons alone may result in
a more a subtle transition in behaviour (de Bono et al., 2002). Both of these studies
demonstrate the role of sensory neurons in the regulation of nematode behaviour,
and by extension the effects of altering neuron functioning, be it via specific mutations
or the introduction of toxic insults such as mutant HTT.
I was not able to study RNAi knockdown of CRNKL, as worms treated with RNAi
targeting this gene, showed developmental abnormalities, failing to mature beyond 8
days, and as such were excluded from study. Previous work has found that this genes
plays a crucial role in not only mRNA splicing, but embryogenesis and cell cycle
progression, and as such knockout of the gene has been shown to be embryonically
lethal in mice (Zhang et al., 1991, Chung et al., 2002). Genetic knockdown of CRNKL in
various cell lines has failed to result in such lethality, though the effects on an
organism as a whole may be significantly greater than those on a single cell line
(Nybakken et al., 2005, Paulsen et al., 2009).

110
Following a period of knockdown, sensitivity of worms to touch stimuli was assessed
using an assay previously shown to highlight sensory defects in the subset of sensory
neurons expressing mutant huntingtin. We noted a subtle difference in the sensitivity
of wild type worms relative to transgenic strains, with HtnQ150 and HDQ150 PQE-1
KO strains displaying a 5% and 8% decline in sensitivity respectively. These figures are
in stark contrast to those obtained by Faber et al, who noted almost a 50% drop in
sensitivity in HtnQ150 worms compared to N2 controls (Faber et al., 1999). While the
published work made use of around 200 worms, we used 30 to 40 animals during our
experiments. The discrepancy in sensitivity may therefore reflect the low sample size
in our study and by extension the greater polarising effects of the mosaicism inherent
to these transgenic strains (previous work suggests only approximately 75% of ASH
neurons expressed the GFP reporter in transgenic lines).
Depletion of potential mutant HTT suppressors (HNRNPF, HNRNPK and TARDBP) failed
to significantly alter the sensitivity or the motor function of the transgenic worms.
Again, the low animal numbers coupled with the mosaicism displayed by the
transgenic worms, may have diluted any subtle changes in phenotype. On the other
hand, knockdown of our genes simply may not exacerbate the HD phenotype, despite
the beneficial effects brought about by overexpression. Such lack of symmetry has
previously been demonstrated by our group, in which a genome-wide overexpression
suppressor screen performed in yeast, revealed many genes that largely failed to
overlap with those derived from a previous genome-wide deletion screen (Willingham
et al., 2003, Mason et al., 2013).
The validation of RNAi knockdown of the candidate genes using of quantitative RT-PCR
produced some surprising results. Ingestion of RNAi expressing bacteria targeting
CRNKL and HNRNPF resulted in a modest reduction in gene expression, but RNAi
targeting HNRNPK and TARDBP lead to an increase in expression. In both of the latter
cases, the apparent increase in gene expression can be attributed to the amplification
of ingested dsRNA through the actions of RNA-directed RNA polymerase (RdRP) (Sijen
et al., 2001). Detection of this amplified RNA using qPCR can ordinarily be avoided
using primers designed to anneal outside of the cDNA region ligated into the feeding
vector. Unfortunately, given the size of the cDNA regions in relation to the rest of the
111
gene, it was not possible to design primers that not only fell outside of this region but
also spanned exons, a caveat essential to avoid the amplification of unspliced
immature mRNA. Analysis of protein levels following knockdown, via Western blotting
may be a suitable alternative to qPCR.
Ultimately the negative results obtained from the behavioural assays following
depletion of our suppressors may reflect the modest decrease in expression brought
about by the RNAi. Other groups using this ingestion method of knockdown have
reported expression reductions in excess of 50% (Agger et al., 2007, Hansen et al.,
2005). This may be attributed to degradation of the RNAi inducing agent, IPTG, or
possibly insufficient levels of plated bacteria. On the other hand, given the lethal
phenotype brought about by CRNKL1 depletion, the knockdown can be reasoned to
have been somewhat effective.

112
3.5 Future Work
Although the genetic knockdown of our putative suppressor genes yielded largely
negative results, these results could be reinforced by expanding the number of
animals studied. This would diminish the effects of the mosaicism inherent to the
transgenic worm strains. Past studies using C.elegans as a model organism have
utilised hundreds of animals, which allows for the identificaton subtle phenotypes.
Repeating our experiment with a greater number of animals may uncover changes in
sensitivity and body bends following depletion of our suppressors.
The results were further weakened by the sole use of the subjective sensitivity and
body bends assays. Other assays could therefore be used alongside these behavioural
tests. These may include the use of chemical repellent or attractant tests, in which
worms are scored according to their avoidance of a toxic chemical, such as heavy
metals, alkaloids or detergents, or their movement towards attractants such as
chloride ions (Bargmann and Horvitz, 1991, Hilliard et al., 2002). Such assays rely on
the worm’s capacity to utilise it chemosensory, rather than mechanosensory
functions. Given the roles of ASH and ASHI neurons in chemical avoidance and
chemotaxis respectively, as well as the greater OSM-10 expression in ASH neurons, a
chemical repellent test would be expected to illustrate the greater impairment of
sensory neuron function (Faber et al., 1999). However, the mosaic nature of GFP and
HTT expression in the sensory neurons within these transgenic worms could still
potentially skew the results.
One possible solution to the issue regarding the mosaicism exhibited by this particular
transgenic C.elegans strain would be the use of an alternative HD nematode model,
for instance the strain generated by Wang et al expresses mutant HTT in muscle cells.
This model displays significant motor defects due to the large number of mutant HTT
expressing cells, with worms expressing Q74 HTT fragment displaying around a 60%
reduction in body bends in relation to N2 WT animals (Wang et al., 2006). These
worms may therefore exhibit a much greater response to RNAi targeting compared to
worms expressing of mutant HTT in a subset of the sensory neurons (Wang et al.,
2006).

113
Our results could also be explored with the aid of other HD nematode models,
including the ID448 strain developed by Lejune et al (Lejeune et al., 2012). In addition
to expressing a 128Q HTT N-terminal fragment in the nose touch receptors, worms
also carries a mutation in the rrf-3 gene, encoding an RNA-directed RNA polymerase,
and thus rendering the animal hypersensitive to the effects of RNAi (Simmer et al.,
2003, Simmer et al., 2002, Lejeune et al., 2012). Such nematode strains not only
display a significant touch-nose defect and axonal degeneration relative to animals
expressing a 19Q fragment, but exhibit enhanced effects of knock-down that could be
measured by this robust phenotypic read-out (Lejeune et al., 2012).

114
Chapter 4
Testing new behavioural paradigms in HD models mice
4.1 Introduction
4.11 The use of mouse models in the study of HD
Our understanding of human diseases has been greatly enriched by the use of murine
models. Genetically altering animals to express disease-causing genes or treating mice
with compounds to recapitulate disease phenotypes, has provided substantial insight
into the mechanisms underlying pathogenesis. Such advances have been particularly
prominent in the study of genetic neurodegenerative disorders, such as HD and PD
(Levine et al., 2004, Menalled and Chesselet, 2002, Menalled, 2005).
Since identification of the HTT gene in 1993, murine models have been used
extensively in the study of HD, providing a means of validating work conducted in vitro
and in model organisms such as Drosophilia melanogaster and Caenorhabditis
elegans. Given that mice possess far fewer CAG repeats within their own endogenous
copies of the HTT gene, sporadic forms of the condition do not exist, and as such
genetic modification is required to reproduce a phenotype similar to that observed in
human forms of the disease. A multitude of genetic mouse models have been
generated which exhibit some of the characteristics synonymous with HD, though no
one model exhibits the full spectrum of symptoms (Menalled and Chesselet, 2002,
Rubinsztein, 2002).
Genetic mouse models of HD display a range of phenotypes, including motor defects
such as clasping, resting tremors, abnormal gait and hypokinesis, and
neuropathological symptoms including brain atrophy and the formation of
intranuclear inclusions (see Figure 4.1). These features of HD can be assessed with the
aid of behavioural and histological assays.
4.12 HD mouse models
Genetic HD murine models can be divided into three groups: knockout (KO); knock-in
(KI); and transgenic, all of which have inherent advantages and limitations. A knockout
model is defined as an animal in which a gene has been deleted or interrupted,

115
preventing transcription. While insertion of a fragment mutation or a whole human
gene in place of the endogenous mouse gene is referred to as a knock-in model. Such
genes are positioned within the natural genomic context, and are therefore regulated
by endogenous promoters. Transgenic mice are generated by the insertion of a
mutant gene or fragment into the mouse genome at an unknown position. As such,
the animal expresses both the mutant and endogenous genes, with the former being
regulated by an independent promoter (Menalled and Chesselet, 2002)
4.13 Knockout mouse models
Knockout mouse models of HD were generated shortly after identification of the HTT
gene, and revealed a crucial role for HTT in embryogenesis. Mice lacking functional
copies of the HTT gene exhibited post-implantation embryonic lethality, with
developmental defects most evident in the brain (Duyao et al., 1995). Although such
nullzygous mice have provided little insight into HD pathogenesis, the lethal effects
suggest that mutant HTT retains some of the functionality of the wild-type protein,
(White et al., 1997, Duyao et al., 1995). Heterozygous knockout mice mature to
adulthood, although the reduced expression of HTT in these mice causes motor and
cognitive defects similar to those displayed by HD patients. These phenotypes suggest
HTT plays an important role in the correct functioning of the basal ganglia, and that a
reduction in the levels of the functional protein contributes to HD pathology (Duyao et
al., 1995, Nasir et al., 1995b).
Conditional knockout mouse models provide a means of regulating the temporal
and/or spatial expression of mutant HTT, and by extension the study of this protein at
varying point during disease progression. Suppression of mutant HTT expression in the
forebrain 5 days after birth, with the aid of a Camk2a promoter, was shown to result
in neuronal degeneration, early mortality and male sterility, suggestive of a role in not
only neuron maturation but also spermatogenesis (Dragatsis et al., 2000). In contrast,
elimination of mutant HTT in transgenic mice between 18 and 34 weeks of age
reverses HD disease symptoms. Such mice, expressing a chimeric human/mouse exon
one fragment containing a 94 residue polyQ tract driven by a tetracycline regulated
promoter, showed a dramatic loss of neuronal HTT inclusions coupled with a reversal

116
of the clasping phenotype, relative to their “gene-on” counterparts. Such study has
demonstrated that the continued expression of mutant HTT is required to maintain
the disease state (Yamamoto et al., 2000).
4.14 Knock-in mouse models
Although knock-in models of HD provide a faithful representation of the human
disease, phenotypes are often quite subtle, absent or manifest in late adulthood, with
mice having a life span comparable to their of wild-type counterparts (Menalled and
Chesselet, 2002). For example the HdhQ72-80 knock-in mouse lines display no other
phenotypic change in response to an increased polyQ tract other than an elevated
level of aggression, and exhibited no discernable neurological dysfunctions compared
to age-matched wild-type littermates. This was attributed to a greater CAG mutational
threshold in mice, and prompted others to examine much longer repeat lengths
(Shelbourne et al., 1999).
The generation of knock-in mice expressing 94 CAG repeats revealed the presence of
nuclear “microaggregates” in striatal neurons at 6 months and nuclear inclusions at 18
months. Animals also displayed subtle behavioural defects at 2 months in the form of
increased rearing at night and repetitive movement, giving way to reduced locomotion
at 4 months. These polarising behavioural changes from hyperkinesia to hypokinesia
have been observed in human HD sufferers, adding credibility to the model while
illustrating the importance of establishing the correct metrics to uncover subtle
phenotypes (Menalled et al., 2002).
Analysis of the HdhQ111 mouse line revealed nuclear inclusions at 12 months, late-
onset striatal degeneration as well as very subtle motor defects, most notably gait, at
24 months (Wheeler et al., 2000, Wheeler et al., 2002). A further expansion in the
number of CAG repeats in the HdhQ150 mice has provided the most promising of the
HD knock-in models, though different strains can often produce varying results
(Menalled, 2005). Many of these HdhQ150 mouse models typically display significant
motor defects between 16 and 24 months when assessed using behavioural tests such
as the rotarod, balance beam and clasping assays. This decline in motor function is
often correlated with an increased level of striatal atrophy and consequently a

117
reduction in striatal volume (Heng et al., 2007, Lin et al., 2001). These models also
display striatal and hippocampal nuclear inclusions at approximately 6 months, which
are later detected in other regions of brain, including the cerebellum and cortex (Heng
et al., 2007, Sathasivam et al., 2010).
More recently, other metrics have been utilised to study the progression of the
disease in HdhQ150 mouse models. For example, the use of the 3-stage water maze to
assess memory and the pre-pulse inhibition (sensorimotor gating) test to examine the
ability to respond to a stimuli following exposure to a similar, but weaker stimuli, has
uncovered deficits at 4 and 6 months respectively. In both cases, defects become
apparent long before the onset of any motor impairment, and again illustrates the
need to ascertain the most suitable metric to assess the manifestation of the disease
(Brooks et al., 2012).
4.15 Transgenic mouse models
Some of the first genetically manipulated animal models of HD were the transgenic
mice, and are considered to be an attractive model for preclinical trials, given their
short lifespan and well defined, fulminant phenotype (Carter et al., 1999). The R6/2
line, generated shortly after the identification of the HTT gene, is the most widely
used of these models and expresses an N-terminal exon 1 fragment with CAG repeats
ranging from 144 to 150 units (Mangiarini et al., 1996). These mice survive for a period
of up to 5 months, during which they exhibit an aggressive and ultimately debilitating
form of HD, akin to the human disease. Similar to the knock-in mice, this transgenic
line displays a progressive decline in motor function, with onset typically between 8
and 15 weeks, significant brain shrinkage at 12 weeks (with no significant neuronal
loss) and the appearance of nuclear inclusions by as early as 4 weeks (Carter et al.,
1999, Stack et al., 2005, Mangiarini et al., 1996). Furthermore the R2/6 mice display
defects in a myriad of cellular processes synonymous with the human disease,
including transcription, mitochondrial function and vesicle trafficking (Ferrante, 2009).
Such vast changes in cellular functions have been highlighted by microarray data
obtained at varying time points during disease progression, including early decreases
in the expression of components making up the calcium and retinoid signalling
118
pathways involved in synaptic plasticity, neural development and learning (Lane and
Bailey, 2005, Luthi-Carter et al., 2000). The same screen also revealed an early drop in
the expression of enkephalin, a neuropeptide selectively expressed in the medium
spiny neurons of the striatum, the most vulnerable cell type in HD (Luthi-Carter et al.,
2000).
Other HD transgenic lines include the N171-82Q mouse model, which expresses the
first 171 amino acids of mutant HTT (exons 1 and 2) under the mouse prion promoter,
thus restricting expression to the neurons of the CNS. Analogous to the R2/6 line, this
model displays phenotypic changes including failure to gain weight from 2 months,
motor defects from 4 months and a progressive increase in nuclear inclusions within
the striatum, cortex and hippocampus at 4 months, before ultimately succumbing to
the disease at approximately 5 months (Schilling et al., 1999). Unlike other HD mouse
models, the N171-82Q exhibits a significant level of neuronal degeneration in the
striatum, as well as a much higher degree of gliosis compared to that seen in the R6/2
and knock-in mice. This model is therefore more reminiscent of the human disease
and suggestive of a role played by the amino terminal sequence in mediating gliosis
and certain apoptotic pathways (Yu et al., 2003). Although the N171-82Q mouse line is
studied less extensively than the R2/6 mice, its robust phenotypic readouts have made
it an appealing model for a number of drug screens (Zádori et al., 2011, Saydoff et al.,
2006).
While many of the transgenic HD lines express a truncated form of the human gene,
the use of yeast artificial chromosomes (YACs) as a means of integrating a large
amount of genomic information into the mouse genome, has enabled the generation
of YAC HD mouse models, the most promising of which being the YAC128 line. This
mouse expresses full length human HTT under the control of the HTT promoter and
other regulatory sequences, in a spatial and temporal manner akin to the endogenous
mouse own protein (Slow et al., 2003). YAC128 mice generally develop motor defects
at 3 months, with sequential nuclear inclusions and striatal and cortical neuron loss at
around 12 months. This mouse model is predominantly used to examine the
mechanisms underlying disease pathogenesis, given the slower disease progression
relative to other transgenic lines, coupled with a strikingly similarity to the human

119
disease. Such similarities include selective vulnerability of the medium spiny striatal
neurons as well as dysfunction in apoptotic and mitochondrial pathways (Van
Raamsdonk et al., 2007, Fernandes et al., 2007)
While the various mouse models of HD each have intrinsic advantages and limitations,
they have provided a means of examining the many cellular and pathological facets of
HD, and have greatly enhanced our understanding regarding manifestation and
development of this condition (Menalled and Chesselet, 2002).
Figure 4.1. Timeline of behavioural and pathological symptoms exhibited by HD mouse
models. Timeline to illustrate onset of behavioural phenotypes and pathological
symptoms of various transgenic and knock-in mouse models, including rota-rod and
clasping phenotypes, the appearance of intranuclear inclusion, and changes in
transcriptional profiles. Adapted from (Crook and Housman, 2011, Menalled, 2005,
Menalled and Chesselet, 2002)
120
4.16 Aims
Following the work conducted in cellular and nematode models of HD, I wished to
examine our most promising candidate genes in a murine context. Initially work was to
be carried out in the HDhQ150 knock-in mouse model on a pure C57BL/6J background, a
generous gift from Professor Gillian Bates. This mouse line had yet to be fully
characterised in this strain background and as such were studied with the use of a
number of behavioural assays. While the rota-rod assay is used routinely to study
disease progression in HD models, the results are often variable, and as such we
sought to explore other more sensitive behavioural readouts. Ultimately the aim of
this portion of the study was to identify robust phenotypes to be used in the testing of
our candidate genes, and determine whether overexpression in the HD mouse model
conveyed the same suppression of mutant HTT observed in the previous HD models.
121
4.2 Materials and methods
4.21 Material
4.211 Bacterial strain
Escherichia coli strain
The DH5α bacterial strain was used during the course of the study, with the genotype:
F– Φ80lacZΔM15 Δ(lacZYA-argF) U169 recA1 endA1 hsdR17 (rK–, mK+) phoA supE44
λ– thi-1 gyrA96 relA1.
4.212 Constructs
pLENTI-CamKII-RTN3-RVS-GFP-Bsd
The 8991bp lentiviral plasmid consisted of the RTN3 (reticulon 3) gene under the
neuronal CAMKII promoter, as well as a GFP-Blastidicin fusion dual reporter under the
RSV (rous sarcoma virus) promoter. The plasmid was kindly donated by Dr Diego
Peretti, MRC Toxicology Unit, Leicester, UK.
4.213 Mouse strains
HdhQ150 C57Bl/6N knockin mice
Thsee HD mice were bred on a pure C57BL/6N background and were a generous gift
from Prof. Gillian Bates, Kings College, London. Mice expressed a 150 unit CAG repeat
within exon one of the mouse Hdh gene. All studies were conducted on homozygous
and wild type mice, while heterozygous mice were used for breeding. Homozygous
and WT mice were weighed every two weeks.
Tg(HD82GLn)81Dbo/J transgenic mice
These transgenic mice lines were bred on a C57BL/6N C3H mixed background, and
were purchased from the Jackson laboratory, Maine, USA. The mouse line expressed a
171 amino acid N-terminal fragment of human HTT cDNA containing 82 CAG repeats.
Expression was regulated by the mouse prion promoter, thus restricting HTT to the
122
neurons of the CNS. Given the rapid onset of disease phenotypes, hemizygous
offspring were used during the course of the study, which were bred from WT female
mated with male hemizygous mice.
All mice were reared and experimented upon in accordance with the Home Office
approved animal (scientific procedure) act of 1986. Mice were caged in groups of
three to five and provided with food and water ad libitum. The internal environment
was maintained at approximately 21oC on a 12-hour light/dark cycle. Ultimately mice
were sacrificed by cervical dislocation.
PPL 80/2340
PIL 40/10030
3.22 Methods
3.221 Genotyping
DNA was isolated from ear tissue (taken from newly born pups) using the RED Extract-
N-amp kit (Sigma). The isolations were carried our using the protocol supplied with
the kit. Tissue was incubated in 25 µL of extract/ tissue prep mix (4:1 ratio) for 10
minutes at room temperature and incubated at 95 oC for a further 3 minutes. 20 µL of
neutralisation buffer was subsequently added to samples, which were then stored at 4
oC prior to use.
HdhQ150 C57Bl/6N knockin mice
Following isolation of genomic DNA, samples were amplified using primers designed
to anneal to regions flanking the CAG repeats within the murine Htt gene. PCR
reactions were carried out in a thermocycler (Applied Biosystems 2720 thermocycler).
Each 20 µL reaction consisted of 2 µL of tissue digest, 1 µL of each of the forward and
reverse HdQ150 primers (see Table 4.1) (primers were generated by Sigma-Aldrich
and diluted to 10 µM stocks, with a final working concentration 0.05 µM) and 16µl of a
reaction mix. This latter buffer was made up of 8 µL of 5 M Betaine (Sigma-Aldrich), 2
µL of Detloff buffer (150 mM Tris-HCl pH 8.8, 150 mM Tris-HCl pH 9.0, 160 mM
ammonium sulphate, 25 mM magnesium chloride, 1.5 mg/mL BSA and 0.07% β-
123
mercaptoethanol), 1 µL of 2 mM dNTPs (NEB), 0.2 µL Herculase Taq (Agilent) and 4.8
µl of sterile distilled water.
The reaction consisted of an initialization step of 5 minute at 95 oC, followed by 30
cycles of 30 seconds at 94 oC, 30 seconds at 58oC and 30 seconds at 72 oC. After
cycling, amplification ended with a final 5 minute hold at 72 oC.
Following amplification, 3 µL of orange G running dye (Sigma-Aldrich) was added to
the 20 µL PCR reaction mix and subsequently loaded onto a 2% agarose/TAE gel,
alongside a 100 bp DNA ladder (Thermoscientific). Samples derived from WT mice
displayed bands of 278 bp in size, while those originating from knock-in mice gave rise
to bands of 707 bp. Samples obtained from heterozygous mice displayed both bands.
Tg(HD82GLn)81Dbo/J transgenic mice
Genotyping of the transgenic strain was performed using the MyTaqTM Extract-PCR kit
(Bioline), and in line with supplier instructions. Tissue samples were incubated with 20
µL of buffer A, 20 µL of buffer B and 70 µL of sterile DNase-free water at 75oC for 5
minutes. Samples were incubated for a further 10 minutes, at 95oC and subsequently
centrifuged at 13,000 r.p.m for 1 minute. The resulting supernatant was then used for
the PCR reaction, which consisted of 1 µL of genomic DNA containing supernatant, 0.5
µl of each of the four primers (20 µM stock) (see table 4.1), 12.5 µL of Taq HS red mix
and 9.5 µL of sterile DNase-free water.
The amplification reaction was made up of an initial denaturation step of 95 oC for 3
minutes, followed by 30 cycles of a 95 oC hold for 35 seconds, 58 oC for 30 seconds and
72 oC for 45 seconds. After the cycling stage, stages were heated to 72 oC for 2
minutes.
3 µL of orange G dye was added to each of the samples, which were then loaded onto
a 1.5% agarose gel. Samples from hemizygous transgenic mice gave rise to band
equivalent to 250 bp as well as a positive control band at 200 bp, while those from WT
mice displayed only the latter band.
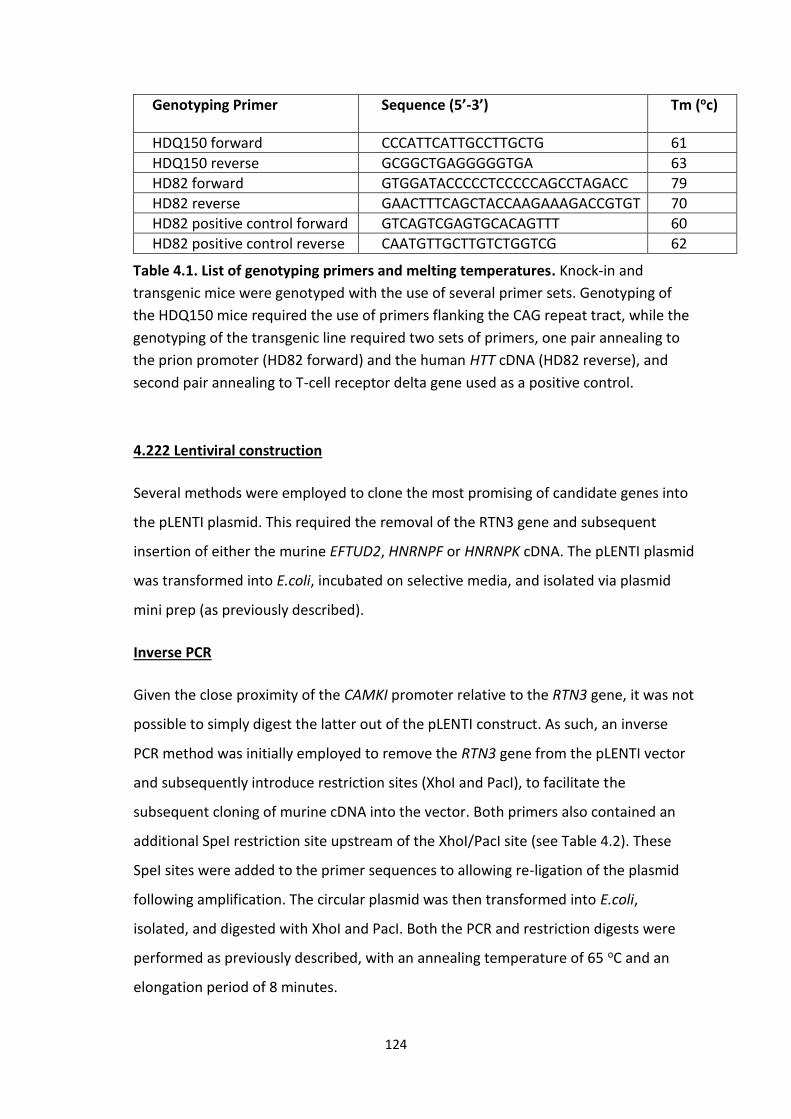
124
Genotyping Primer Sequence (5’-3’)
Tm (oc)
HDQ150 forward CCCATTCATTGCCTTGCTG 61
HDQ150 reverse GCGGCTGAGGGGGTGA 63
HD82 forward GTGGATACCCCCTCCCCCAGCCTAGACC 79
HD82 reverse GAACTTTCAGCTACCAAGAAAGACCGTGT 70
HD82 positive control forward GTCAGTCGAGTGCACAGTTT 60
HD82 positive control reverse CAATGTTGCTTGTCTGGTCG 62
4.222 Lentiviral construction
Several methods were employed to clone the most promising of candidate genes into
the pLENTI plasmid. This required the removal of the RTN3 gene and subsequent
insertion of either the murine EFTUD2, HNRNPF or HNRNPK cDNA. The pLENTI plasmid
was transformed into E.coli, incubated on selective media, and isolated via plasmid
mini prep (as previously described).
Inverse PCR
Given the close proximity of the CAMKI promoter relative to the RTN3 gene, it was not
possible to simply digest the latter out of the pLENTI construct. As such, an inverse
PCR method was initially employed to remove the RTN3 gene from the pLENTI vector
and subsequently introduce restriction sites (XhoI and PacI), to facilitate the
subsequent cloning of murine cDNA into the vector. Both primers also contained an
additional SpeI restriction site upstream of the XhoI/PacI site (see Table 4.2). These
SpeI sites were added to the primer sequences to allowing re-ligation of the plasmid
following amplification. The circular plasmid was then transformed into E.coli,
isolated, and digested with XhoI and PacI. Both the PCR and restriction digests were
performed as previously described, with an annealing temperature of 65 oC and an
elongation period of 8 minutes.
Table 4.1. List of genotyping primers and melting temperatures. Knock-in and
transgenic mice were genotyped with the use of several primer sets. Genotyping of
the HDQ150 mice required the use of primers flanking the CAG repeat tract, while the
genotyping of the transgenic line required two sets of primers, one pair annealing to
the prion promoter (HD82 forward) and the human HTT cDNA (HD82 reverse), and
second pair annealing to T-cell receptor delta gene used as a positive control.
125
Gibson Assembly
After some difficulty with the inverse PCR method, Gibson assembly was employed to
generate lentiviral constructs. This method is based on the assembly of multiple DNA
fragments in an order governed by overlapping regions and was performed in
accordance with supplier instructions (New England Biolabs Inc.).
Sequences for the CAMKII promoter and candidate genes were amplified from the
pLENTI plasmid or the DNA constructs generated in Chapter 2. Primers were designed
with the aid of the NEBuilder for Gibson assembly web tool (www.NEBGibson.com),
and consisted of a gene specific sequence and an overlap sequence of approximately
15-25 bp, homologous to the adjacent fragment (see Table 2).
The pLENTI construct was initially digested with BamHI and XbaI, releasing both the
CAMKI promoter and RTN3 gene. The digested plasmid was loaded onto a 0.8%
agarose gel, and the vector backbone isolated as described previously.
Amplification of the CAMKII promoter sequences made use of the same forward
primer (Primer 3, GA PLENTI-CAMKII FOR) and a gene specific reverse primer
containing an overlapping region homologous to the 5’ end of each candidate genes.
Amplification of the EFTUD2, HNRNPF and HNRNPK required the use of forward
primers consisting of an annealing sequence matching the 5’ end of the cDNA, as well
as an overlap region homologous to the 3’ end of the CAMKI promoter sequence. The
reverse primer contained sequences homologous to the 3’ end of each the cDNA
genes and an overlap region matching the pLENTI plasmid.
Amplification of fragments was performed as previously described. The CAMKII
promoter was amplified using an annealing temperature of 63 oC and an elongation
time of 30 seconds. Amplification of EFTUD2, HNRNPF and HNRNPK required
annealing temperatures and elongation times of: 60 oC and 3 minutes; 64 oC and 1
minute; 64 oC and 1 minute respectively.
Following amplification, PCR samples were digested with DpnI to remove methylated
template DNA. The reaction mix consisted of 8 µL of PCR product, 1 µL of NEBuffer 4
126
and 1 µl of DpnI (New England Biolabs Inc.). Samples were incubated at 37 oC for 30
minutes, and heated to 80 oC for 20 minutes to deactivating the enzyme.
Prior to assembly samples were analysed by agarose gel electrophoresis and the
concentration of each sample estimated by comparison to molecular weight markers
(Hyperladder I). The 20 µL assembly mixture consisted of 25 ng of vector backbone,
150 ng of the CAMKII promoter fragment, 50 ng of the cDNA fragments, 10 µl of 2X
Gibson assembly master mix, and deionised water making up the remainder of the
volume. Samples were incubated at 50 oC for 15 minutes and then stored on ice,
before being transformed into E.coli and grown on a selective LB media.
To confirm the correct integration of fragments into the pLENTI vector, plasmids from
positive colonies were isolated and digested with either NruI or PstI, which cut both
the cDNA and CAMKII promoter fragments. Plasmids containing the HNRNPF or
HNRNPK cDNA were expected to yield bands equating to 1676 bp and 7839 bp, or
1820 bp and 7839 bp when cut with NruI respectively. Constructs containing EFTUD2
were expected to produce bands of 2782 bp and 8404 bp when digested with PstI.
Colonies were further validated via sequencing with the use of primers stated on
Table 4.2.

127
Primer Sequence (5’-3’) Tm (oc)
pLENTI XHO1 AGCTTGATCACTCGAGTCTAGAGTCGACCATAGTGA
67
pLENTI PAC1 GATCACTAGTTTAATTAACTGCCCCCAGAACTAGGGGC
67
GA PLENTI-CAMKII FOR
AAAATTCAAAATTTTATCGGACTTGTGGACTAAGTTTGTTCG
61
GA HNRNPF-CAMKI REV
CAGCATCATCTGCCCCCAGAACTAGGG 66
GA CAMKII-HNRNPF FOR
GGGGGCAGATGATGCTGGGCCCTGAG 65
GA PLENTI-HNRNPF REV
GTCACTATGGTCGACTCTAATCATATCCGCCCATGC
61
GA HNRNPK-CAMKI REV
GTCTCCATCTGCCCCCAGAACTAGGG 66
GA CAMKII-HNRNPK FOR
GGGGGCAGATGGAGACCGAACAGCCA 64
GA PLENTI-HNRNPK REV
GTCACTATGGTCGACTTTAGAAAAACTTTCCAGAATACTGCTTC
61
GA EFTUD-CAMKII REV
AGTATCCATCTGCCCCCAGAACTAGGG 66
GA CAMKI-EFTUD FOR
GGGGGCAGATGGATACTGACTTGTATGATG 57
GA PLENTI-EFTUD REV
GTCACTATGGTCGACTTCACATGGGATAATTGAGC
57
pLENTI seq F GGTACAGTGCAGGGGAAAGAATAG 59
pLENTI seq R GTACAAGAAAGCTGAACGAGAAACG 58
pLENTI HNRNPF seq F
GAAAGCATGGGACACCGGTATATTG 59
pLENTI HNRNPK seq F
AGTGTTTCAGTCCCAGACAGCAGTG 62
Table 4.2. List of primers used cloning of EFTUD2, HNRNPF and HNRNPK into pLENTI
vector. Several methods were employed during the cloning of candidate genes into the
pLENTI plasmid, including inverse PCR with the use of primers 1 and 2. The Gibson
assembly technique was also used to generate the overexpression constructs. Each Gibson
assembly required the amplification of fragments and the addition of overlapping regions.
Each primer consisted of two of three regions, a plasmid specific region (in green), a
CAMKII promoter region (in red) or a gene specific region (in blue) (Primers 3-12).
Sequencing of the constructs was performed with the aid of primers 13 and 14, as well as
primers 15 and 16 for constructs containing the HNRNPF and HNRNPK gene inserts.
128
4.223 Behavioural tests
Rota-rod
Mice were tested on an accelerating rota-rod to assess the decline in motor
coordination during disease progression. All experiments were performed with the aid
of the Mouse Rota-Rod 47600 (Ugo Basille) as described in (Dunham and Miya, 1957,
Jones and Roberts, 1968). Mice were trained at a constant rotational speed of 4 r.p.m.
for 5 minutes, followed by a rest of 30 minutes. Animals subsequently underwent
three trials on the accelerating function, with the speed increasing from 4 to 40 r.p.m
over a 5 minute period. The latency to fall was recorded and mice allowed a 30 minute
recovery time between trials. Each mouse was tested on three consecutive days, and
the average of the 2nd and 3rd day trials plotted.
Burrowing
The innate burrowing behaviour of mice, associated with hippocampal functioning,
was assessed as previously described (Deacon, 2006). Mice were placed in cages with
a clear plastic tube, 20cm long and 6.8cm diameter, raised at one end by 0.3cm and
closed at the opposite end, filled with 140 g of dried food pellets. Tubes were placed
at the far left of the cage and animals were provided with water ad libitum as well as
nesting material. Cages were placed in incubators at a constant temperature of 21oC.
After 2 hours, the weight of the pellets displaced was calculated based on those
remaining in the tube. The tubes, containing the remainder of the pellets were
returned to the cages, and mice were subsequently allowed to burrow overnight, after
which a second reading was recorded.
Activity cage
General locomotion of mice was assessed using AM548 Standard (Dual Layer)
locomotor activity monitors (Linton instrumentation). The apparatus consisted of two
layers (46 cm by 25 cm), each with 24 infrared beams, positioned 4 cm apart. The
lower level monitored X and Y movement, while the upper level was used to measure
Z movement. All movement was monitored and configured by AMONLITE software

129
(MJS technology Limited), which provided data for general movement, speed and
rearing.
Mice were placed in the testing room, and allowed to acclimatize for one hour in
darkness. Animals were then placed into cages, with access to a water source, and
movement recorded every ten minutes over a one hour period in darkness.
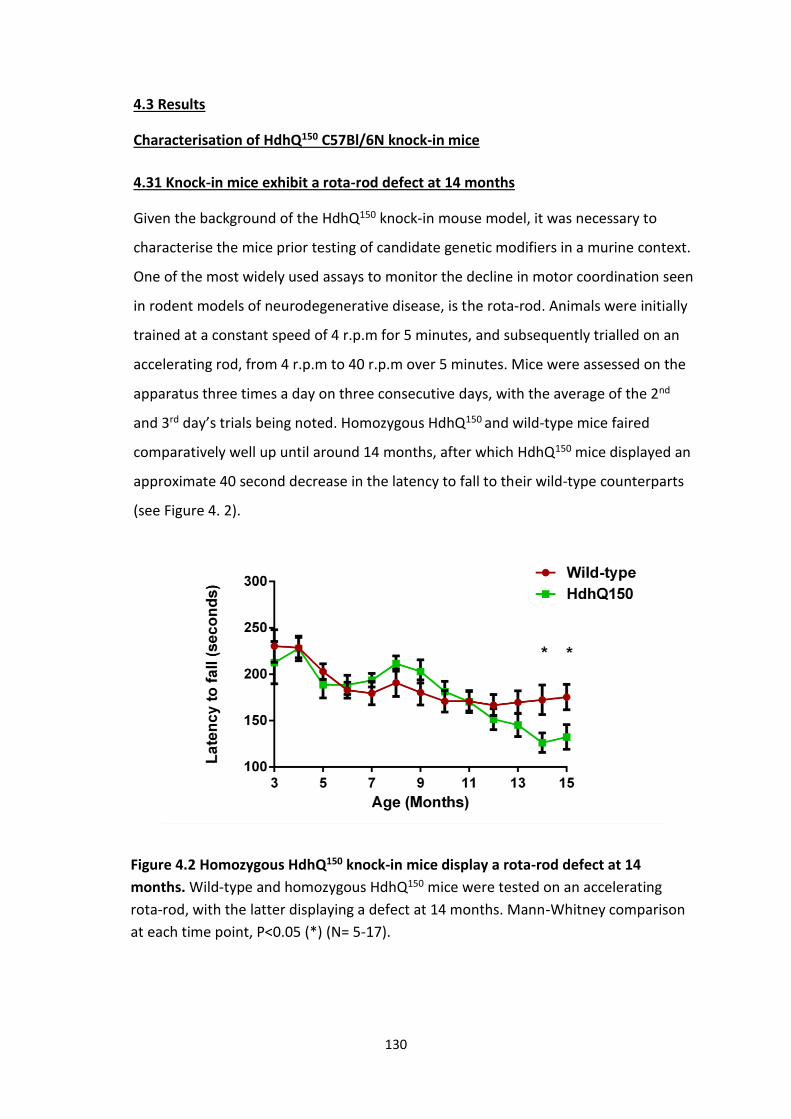
130
4.3 Results
Characterisation of HdhQ150 C57Bl/6N knock-in mice
4.31 Knock-in mice exhibit a rota-rod defect at 14 months
Given the background of the HdhQ150 knock-in mouse model, it was necessary to
characterise the mice prior testing of candidate genetic modifiers in a murine context.
One of the most widely used assays to monitor the decline in motor coordination seen
in rodent models of neurodegenerative disease, is the rota-rod. Animals were initially
trained at a constant speed of 4 r.p.m for 5 minutes, and subsequently trialled on an
accelerating rod, from 4 r.p.m to 40 r.p.m over 5 minutes. Mice were assessed on the
apparatus three times a day on three consecutive days, with the average of the 2nd
and 3rd day’s trials being noted. Homozygous HdhQ150 and wild-type mice faired
comparatively well up until around 14 months, after which HdhQ150 mice displayed an
approximate 40 second decrease in the latency to fall to their wild-type counterparts
(see Figure 4. 2).
Figure 4.2 Homozygous HdhQ150 knock-in mice display a rota-rod defect at 14
months. Wild-type and homozygous HdhQ150 mice were tested on an accelerating
rota-rod, with the latter displaying a defect at 14 months. Mann-Whitney comparison
at each time point, P<0.05 (*) (N= 5-17).
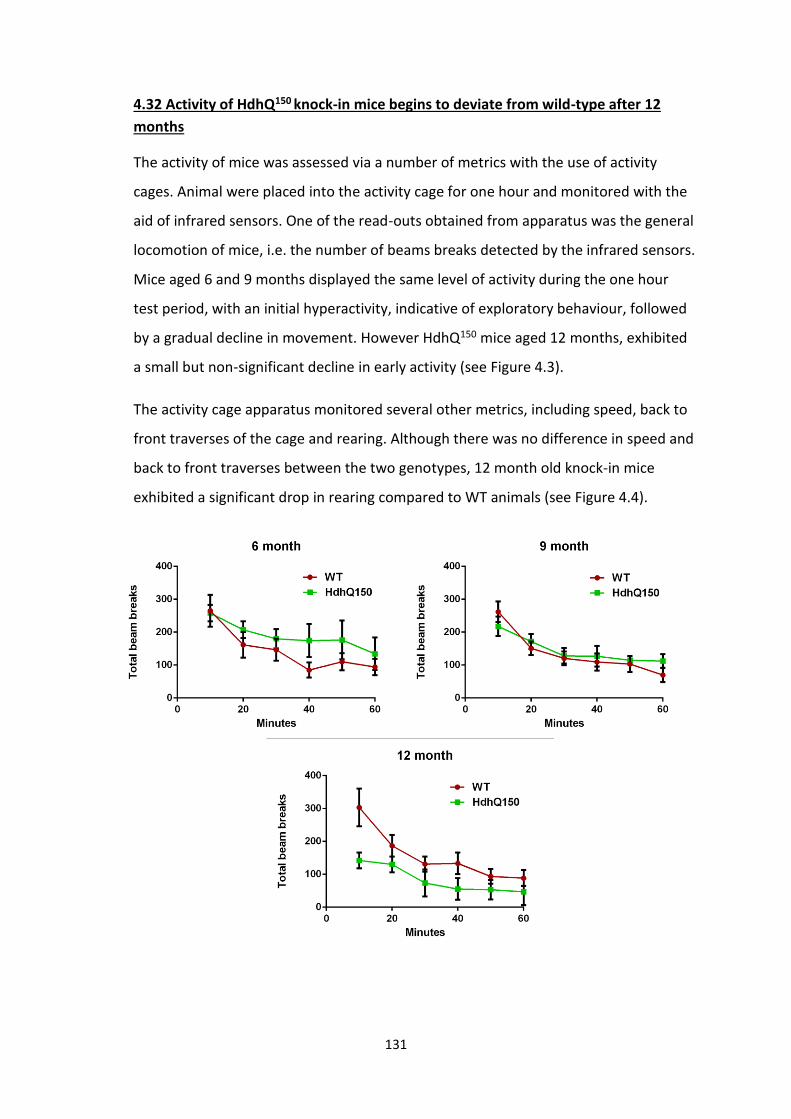
131
4.32 Activity of HdhQ150 knock-in mice begins to deviate from wild-type after 12
months
The activity of mice was assessed via a number of metrics with the use of activity
cages. Animal were placed into the activity cage for one hour and monitored with the
aid of infrared sensors. One of the read-outs obtained from apparatus was the general
locomotion of mice, i.e. the number of beams breaks detected by the infrared sensors.
Mice aged 6 and 9 months displayed the same level of activity during the one hour
test period, with an initial hyperactivity, indicative of exploratory behaviour, followed
by a gradual decline in movement. However HdhQ150 mice aged 12 months, exhibited
a small but non-significant decline in early activity (see Figure 4.3).
The activity cage apparatus monitored several other metrics, including speed, back to
front traverses of the cage and rearing. Although there was no difference in speed and
back to front traverses between the two genotypes, 12 month old knock-in mice
exhibited a significant drop in rearing compared to WT animals (see Figure 4.4).

132
Figure 4.3 Homozygous HdhQ150 knock-in mice display defects in locomotion at 12
months. Mice were assessed in terms of their general locomotion, the number of
beam breaks were recorded every 10 minutes. Both 6 and 9 month homozygous mice
displayed similar activity profiles compared to age-matched WT, on the other hand, 12
month old knock-in mice appeared to display a much lower initial activity. Mann-
Whitney comparison at each time point (N= 3-6).
A. B.
C.

133
4.33 Homozygous HdhQ150 knock-in mice failed to gain weight during their life span
Both WT and homozygous HdhQ150 mice were weighed every two weeks from 9
months until around 18 months, after which the latter mice often displayed
debilitating HD-like symptoms (resting tremors, hypoactivity etc.) and were
consequently culled. Homozygous HdhQ150 mice weighed on average, approximately
30% less than their WT equivalents consistently during this 9 month period (see Figure
4.5). Furthermore there was no significant change in the weight of these homozygous
mice over this period.
Figure 4.4 Homozygous HdhQ150 knock-in mice display defects in rearing at 12 months.
In addition to general locomotion, the movement of mice was analysed in terms of
speed, cage traverses and rearing. Only the latter metric revealed any significant
difference between the two genotypes, which became apparent at 12 months. Mann-
Whitney comparison at each time point (N=3-6).
Figure 4.5 Homozygous HdhQ150 knock-in mice fail to gain weight. Mice were weighed
every two weeks from 9 to 18 months. Homozygous knock-in mice were found to
consistently weigh much less than WT mice over this period. Unpaired T-test of Linear
regression, P<0.0001 (****) (N= 6-16)
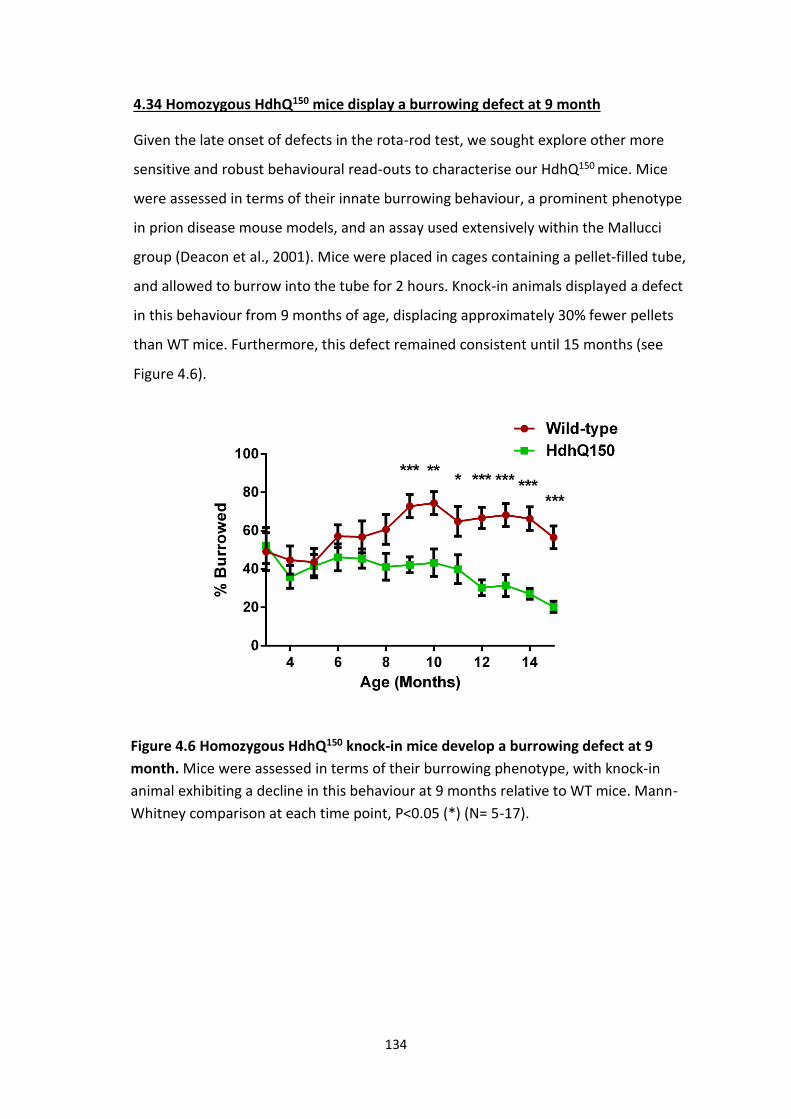
134
4.34 Homozygous HdhQ150 mice display a burrowing defect at 9 month
Given the late onset of defects in the rota-rod test, we sought explore other more
sensitive and robust behavioural read-outs to characterise our HdhQ150 mice. Mice
were assessed in terms of their innate burrowing behaviour, a prominent phenotype
in prion disease mouse models, and an assay used extensively within the Mallucci
group (Deacon et al., 2001). Mice were placed in cages containing a pellet-filled tube,
and allowed to burrow into the tube for 2 hours. Knock-in animals displayed a defect
in this behaviour from 9 months of age, displacing approximately 30% fewer pellets
than WT mice. Furthermore, this defect remained consistent until 15 months (see
Figure 4.6).
Figure 4.6 Homozygous HdhQ150 knock-in mice develop a burrowing defect at 9
month. Mice were assessed in terms of their burrowing phenotype, with knock-in
animal exhibiting a decline in this behaviour at 9 months relative to WT mice. Mann-
Whitney comparison at each time point, P<0.05 (*) (N= 5-17).
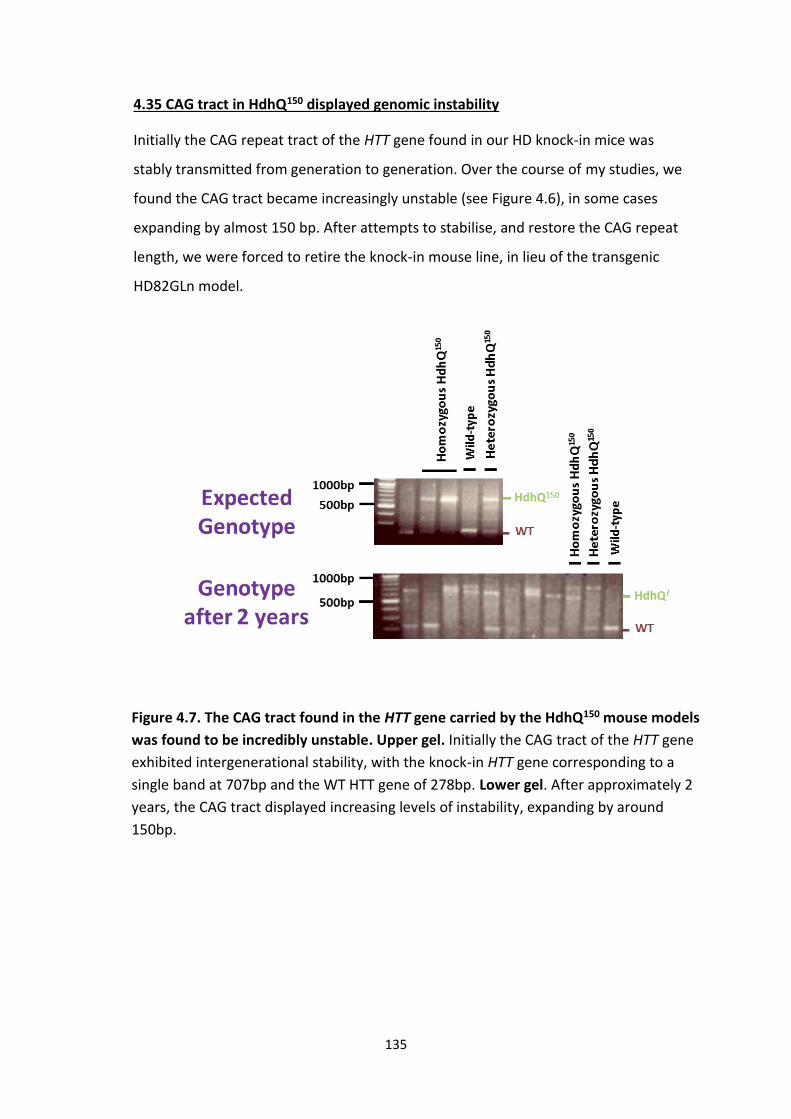
135
4.35 CAG tract in HdhQ150 displayed genomic instability
Initially the CAG repeat tract of the HTT gene found in our HD knock-in mice was
stably transmitted from generation to generation. Over the course of my studies, we
found the CAG tract became increasingly unstable (see Figure 4.6), in some cases
expanding by almost 150 bp. After attempts to stabilise, and restore the CAG repeat
length, we were forced to retire the knock-in mouse line, in lieu of the transgenic
HD82GLn model.
Figure 4.7. The CAG tract found in the HTT gene carried by the HdhQ150 mouse models
was found to be incredibly unstable. Upper gel. Initially the CAG tract of the HTT gene
exhibited intergenerational stability, with the knock-in HTT gene corresponding to a
single band at 707bp and the WT HTT gene of 278bp. Lower gel. After approximately 2
years, the CAG tract displayed increasing levels of instability, expanding by around
150bp.

136
4.4 Discussion
The aims of this portion of the project involved the initial characterisation of murine
models of HD, and the subsequent lentiviral-mediated overexpression of our most
promising candidate genes (see Chapter 2) via stereotaxic injection or intranasal (see
Chapter 5). We employed several behavioural methods during the initial
characterisation of the HdhQ150 knock-in model of HD, including the rota-rod test to
assess motor coordination, widely utilised to study the of degeneration of the basal
ganglia. We also monitored the burrowing behaviour of mice, a phenotype typically
observed in the study of prion disease and other neurological disordered stemming
from the degeneration of the hippocampus. Finally, we employed the open field
locomotor cages to monitor general movement of mice. Given the duration of each
test, all behavioural work was conducted on female mice, as male animals would have
required single housing to prevent sibling aggression.
The results derived from the rota-rod revealed defects in motor coordination fairly
late during disease progression, becoming apparent at around 14 months. This
particular test is especially sensitive to degeneration of the cerebellar and motor
neurons, and while cerebellar degeneration is largely absent in the HD, the latter
occurs late in the disease. Therefore, defects in motor coordination are often subtle in
knock-in models of HD, manifesting much later than other phenotypes (Kennedy et al.,
2003, Hickey and Chesselet, 2011, Hickey et al., 2008).
Although the rota-rod is widely used in the study of HD mouse models, the reliability
of the test is marred by a number of disadvantages and confounding variables. This
has led to the increasing use of more robust assays in place of, or alongside the rota-
rod. Potential problems with the rota-rod assay include the use of an accelerating
function and the need to conduct the study nine times over three consecutive days
(excluding the prerequisite training period), which may introduce the effects of fatigue
and learning to the results (Brooks and Dunnett, 2009). The design of the apparatus
itself may also present further problems, for example, grooves present on the rotating
cylinder can allow mice to grip the rod during the assessment, though this can be
remedied by simply covering these ridges. The most influential factor determining a
137
mouse’s capacity to complete the task is the weight and size of the mouse, with
smaller lighter mice being able to negotiate the rotations much easier than larger
mice. In our study HD knock-in mice were much smaller than their WT counterparts,
likely impacting greatly on our results and possibly masking earlier onset motor
dysfunction (Brooks and Dunnett, 2009, Hickey and Chesselet, 2011). However, the
weight of the homozygous knock-in mice remained unchanged between 8 and 15
months, suggesting the decline in motor co-ordination at 14 months is independent of
weight at this time point.
Given the disadvantages associated with the rota-rod test we also made use of other
behavioural assays to determine whether an early phenotype could be observed. The
results obtained from the burrowing assay, for instance, were somewhat surprising,
with homozygous knock-in mice displaying a clear behavioural defect at 9 months
relative to WT animals. Such innate behaviour has been demonstrated in the context
of prion disease, with prion infection of the hippocampus diminishing this phenotype
(Deacon et al., 2001, Mallucci et al., 2007). Here we demonstrate that burrowing is
impaired much earlier than any motor defect, indicative of a hippocampal deficit in
the early stages of the disease in the HD knock-in model (Deacon et al., 2002).
Although this particular phenotype is novel in the context of HD murine models, early
cognitive dysfunction has been noted in the R2/6 line, manifesting prior to any motor
impairments (Lione et al., 1999, Murphy et al., 2000).
Again, the size of the mouse may be a confounding variable in the interpretation of
our results, with smaller mice unable to displace the pellets given the greater energy
expenditure relative to their size. However, the constant weight of the homozygous
knock-in mice between 9 and 15 months, suggests the burrowing deficit was
independent of weight.
Following the burrowing phenotype, we assessed animal movement with the aid of
open field locomotor cages. This behavioural test holds a number of advantages, most
notably the large amount of data generated from a single one hour exercise. Previous
activity cage studies performed on R6/2 transgenic mice have demonstrated early
defects in rearing and climbing in both male and female mice (Zarringhalam et al.,

138
2012).Our preliminary data demonstrated possible lower levels of initial movement
and fewer acts of rearing in 12 month homozygous knock-in mice compared to age-
matched WT animals, suggestive of reduced exploratory behaviour. Both metrics have
been documented previously in other HD models (Bolivar et al., 2004, Steele et al.,
2007). Unfortunately the small number of mice used in these assay prevented us from
drawing firm conclusions from the data.
This portion of the study was suspended due to intergenerational expansion of the
CAG repeat length. Such mutational instability is fairly common in HD knock-in mice,
with expansion of the CAG tracts length typically being attributed to male
transmission of the mutation, while contraction is observed during female
transmission (Wheeler et al., 1999, Shelbourne et al., 1999). We attempted to
maintain and possibly restore the CAG repeat length through the breeding of
homozygous females expressing the correct mutation with WT animals. The resulting
heterozygous mice were mated to produce further homozygous mice, which
unfortunately also displayed a much larger mutation. Eventually the knock-in mouse
line was retired and substituted with the transgenic HD82Gln line.
The instability associated with the CAG repeat has been linked to the mismatch DNA
repair genes, MSH3 and MSH6. While the former gene is required for the increase in
CAG length, MSH6 prevents contraction from generation to generation, though the
mechanisms surrounding these effects are unclear (Dragileva et al.,
2009).Polymorphisms in the MSH3 gene present in different mouse backgrounds have
been shown to govern the stability of the CAG repeats. For example, animals of a
C57BL/6J background contain polymorphisms in the MSH3 coding region that lead to
much higher levels of the MSH3 protein compared to mice of a BALB/cByJ background
(Tomé et al., 2013). Given that our knock-in mice line was bred on a pure C57BL/6J
background, the changes in CAG repeat length between generations may be
attributed to the expression of higher levels of this DNA repair protein. Although the
knock-in model was unsuitable for our work, it may be of some use in the study of
intergenerational instability.

139
After retiring the HdhQ150 mouse line, we sought to conduct similar behavioural
characterisation using the HD82Gln transgenic model. However, such work was
delayed initially due to re-derivation issues following transfer off all in vivo work to the
University of Leicester’s Central Research Facility. This work was further postponed
due to breeding of transgenic mice with wild-type mice infected with Klebsiella.
However after almost 16 months, behavioural work using this transgenic model was
commenced in June 2014, and although the preliminary results are promising, they
have not been included in this report.
Ultimately the aim of the research project was to overexpress several of our candidate
genes in the HD mouse model. We intended to clone three of our most promising
gene hits, EFTUD2, HNRNPF and HNRNPK into the pLENTI vector, which was to be
packaged into lentiviruses and delivered into our murine models via stereotaxic
injection or intranasal delivery (see Chapter 5). The pLENTI construct (kindly donated
by Dr Diego Peretti) contained the RTN3 gene under the regulation of the CAMKI
promoter. Given the close proximity of the promoter and gene, it was not possible to
simply digest the latter from the plasmid and insert our own genes. Consequently we
attempted an inverse PCR method to amplify the plasmid backbone along with the
promoter sequence, using primers designed to attach additional restriction sites to
the ends of the resulting fragment, facilitating subsequent cloning. However after
several attempts to amplify such a large fragment (approximately 8 kb), including the
use of gradient PCRs and alternative polymerases, we decided to use Gibson assembly
to generate the constructs.
Using the Gibson Assembly method, we amplified our genes of interest and the
CAMKII promoter, generating fragments with overlapping regions. Following
restriction digestion of the pLENTI plasmid to remove the RTN3 gene and adjoining
promoter, these fragments were assembled into the digested plasmid. Assembly
mixes were subsequently transformed into E. coli and plated on selective media. Our
first attempt resulted in a lack of colonies, while our second attempt yielded several
colonies, which contained the intact pLENTI construct containing the RTN3 gene. Due
to time constraints of the project, further attempts to clone our candidate genes into
the pLENTI plasmid could not be made.
140
In conclusion, our characterisation data suggests that the burrowing assay may be a
robust and simple test to determine early behavioural dysfunction. This defect was
shown to become apparent almost half a year prior to the any significant rota-rod
impairment.
4.6 Future work
As stated previously, the ultimate goal of this portion of the study was the lentiviral-
mediated overexpression of our most promising candidate genes in our HD murine
models. Given the time constraints of the project, we were unable to complete the
cloning of EFTUD2, HNRNPF and HNRNPK into the pLENTi plasmid. Were time less of a
factor, we would endeavour to generate our overexpression lentiviral constructs,
either via the Gibson assembly method or another cloning method. Such constructs
would subsequently be administered into the transgenic mice via stereotactic
injection or intranasal delivery (see Chapter 5)
Finally with additional time, we could complete the initial characterisation of the
transgenic mouse model, and determine whether these mice exhibit the same
burrowing defect as seen in our knock-in mouse line.

141
Chapter 5
Validating intranasal delivery in prion infected mice
5.1 Introduction
As mentioned in Chapter 4, the ultimate goal of this project was the identification and
validation of genes found to suppress mutant HTT in yeast. The most promising
candidate genes were to be overexpressed in our HD murine models using a lentiviral
system. Although our group have previously made use of stereotaxis as a means of
delivering such viruses to the CNS, we have sought to explore and optimise alternative
routes, including intranasal delivery.
5.11 Delivery to the CNS
As highlighted in Chapter 3, RNAi technology has become of great importance in the
study of genetics. When utilising RNAi in multicellular organisms, the route by which
constructs are administered can dictate the efficacy of gene expression changes. In C.
elegans, genetic knockdown is achieved through feeding, leading to expression
changes comparable to that brought about via gonadal microinjection. This route of
delivery is not feasible in a murine model, and indeed humans, due to degradation of
constructs in the gastrointestinal tract (Timmons and Fire, 1998, Kamath et al., 2001).
Unfortunately the non-invasive delivery of plasmids, as well as drugs and other
therapeutics compounds, to the CNS of mice and humans is often met with a number
of obstacles, including the blood brain barrier (BBB), the blood cerebrospinal fluid
barrier (BCSF), systemic modification, targeting of specific neurons, and the possibility
of inflammatory responses (Costantini et al., 2000, Alam et al., 2010).
Many non–invasive methods of delivery have been optimised to negotiate these
obstacles, including chemical modification (such as the use of prodrugs), biological
methods (such as antibody conjugation), and carriers systems (for example, the
encapsulation of therapeutic compound in a lipid vesicle). Although these methods
have been shown to be effective in the targeted delivery of therapeutics, they each
have inherent limitations that prevent their widespread use, and consequently
invasive delivery techniques are still often used in scientific research. Such methods
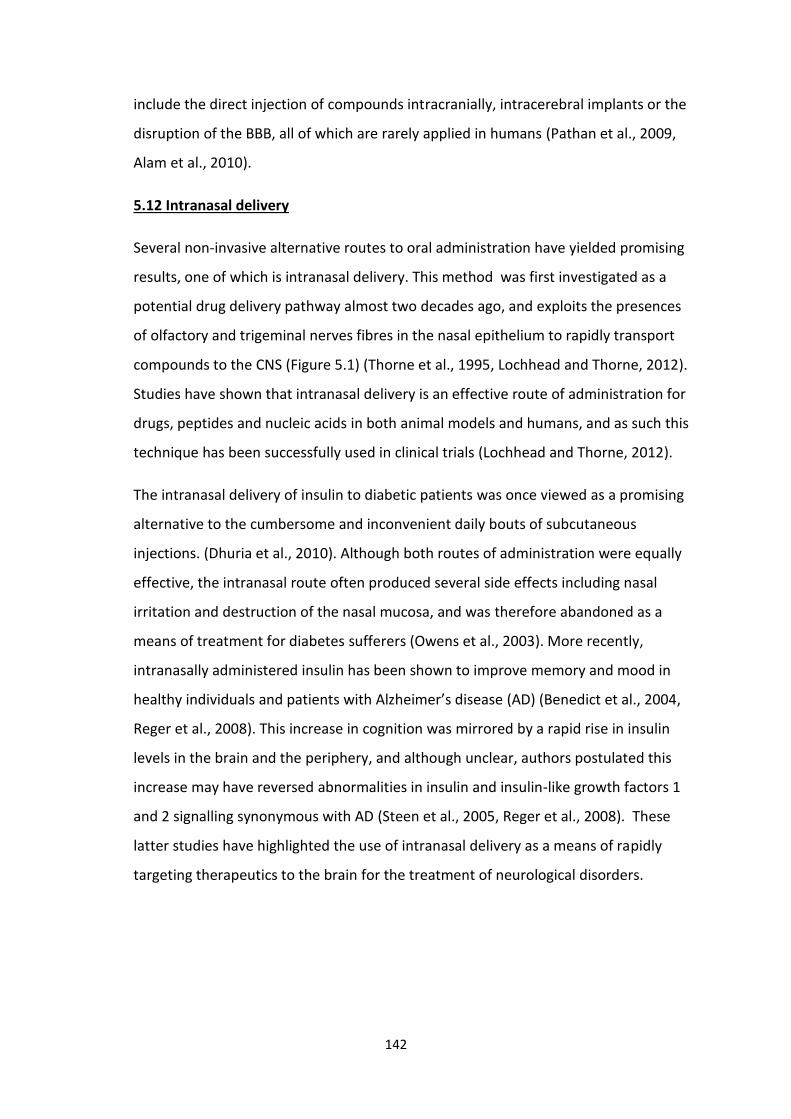
142
include the direct injection of compounds intracranially, intracerebral implants or the
disruption of the BBB, all of which are rarely applied in humans (Pathan et al., 2009,
Alam et al., 2010).
5.12 Intranasal delivery
Several non-invasive alternative routes to oral administration have yielded promising
results, one of which is intranasal delivery. This method was first investigated as a
potential drug delivery pathway almost two decades ago, and exploits the presences
of olfactory and trigeminal nerves fibres in the nasal epithelium to rapidly transport
compounds to the CNS (Figure 5.1) (Thorne et al., 1995, Lochhead and Thorne, 2012).
Studies have shown that intranasal delivery is an effective route of administration for
drugs, peptides and nucleic acids in both animal models and humans, and as such this
technique has been successfully used in clinical trials (Lochhead and Thorne, 2012).
The intranasal delivery of insulin to diabetic patients was once viewed as a promising
alternative to the cumbersome and inconvenient daily bouts of subcutaneous
injections. (Dhuria et al., 2010). Although both routes of administration were equally
effective, the intranasal route often produced several side effects including nasal
irritation and destruction of the nasal mucosa, and was therefore abandoned as a
means of treatment for diabetes sufferers (Owens et al., 2003). More recently,
intranasally administered insulin has been shown to improve memory and mood in
healthy individuals and patients with Alzheimer’s disease (AD) (Benedict et al., 2004,
Reger et al., 2008). This increase in cognition was mirrored by a rapid rise in insulin
levels in the brain and the periphery, and although unclear, authors postulated this
increase may have reversed abnormalities in insulin and insulin-like growth factors 1
and 2 signalling synonymous with AD (Steen et al., 2005, Reger et al., 2008). These
latter studies have highlighted the use of intranasal delivery as a means of rapidly
targeting therapeutics to the brain for the treatment of neurological disorders.
143
Upon inhalation, compounds must penetrate several barriers to reach to the CNS, the
first of which is the epithelial layer lining the nasal passage (see Figure 5.2).
Compounds can traverse this initial barrier in several ways, including transcytosis
through the epithelial cells and paracellular diffusion. The latter of these processes is
hindered by the presence of tight junctions, though transient gaps formed between
adjacent cells, as a result of the continuous turnover of the epithelial cells, can
facilitate paracellular diffusion. Both pathways lead to the transport of substances to
the lamina propria, and subsequent absorption into either the blood vessels (and
systemic circulation) and lymph nodes or diffusion into the olfactory and trigeminal
nerve bundles(Lochhead and Thorne, 2012, Mathison et al., 1998, Kristens.K and
Olsson, 1971). Substances can also enter the olfactory and trigeminal nerve fibres
found interspersed between nasal epithelial cells, via endocytosis (absorptive, fluid
phase and receptor-mediated), resulting in retrograde transport to the olfactory bulbs
and brainstem respectively (Thorne et al., 1995, Lochhead and Thorne, 2012, Baker
and Spencer, 1986).
Figure 5.1. Intranasal Delivery. Following inhalation, substances including drugs, peptides and nucleic acids are capable of traversing the nasal mucosa. Substances can then travel along the olfactory or trigeminal nerve bundles to reach the olfactory bulbs and brainstem respectively, and diffuse throughout the brain. Adapted from (Hashizume et al., 2008)

144
Compounds that are able to cross the nasal epithelium, and avoid absorption into the
general circulation or the lymphatic system can enter the CNS via several potential
routes. The first of these pathways is intracellular transport within the olfactory and
trigeminal nerves, which has been demonstrated with the use of tracers such as
horseradish peroxidase conjugated wheat germ agglutinin (WGA-HRP) (Broadwell and
Balin, 1985, Anton and Peppel, 1991). This form of transport has a speed ranging from
130mm/day to 36mm/day and is largely governed by length and diameter of the axon
(Buchner et al., 1987).
Other routes of entry into the brain include extracellular diffusion along
compartments associated with the olfactory and trigeminal pathways, such as the
connective tissue sheath or via small perineural spaces maintained by tight junction
proteins for nerve fibre regrowth (Jansson and Bjork, 2002, Li et al., 2005). This form
of passive diffusion can lead to transport rates ranging from approximately 67mm/day
to 4mm/day and is largely dictated by the diffusion coefficient of the compound
(Thorne et al., 2004). Substances capable of diffusing into the connective tissue may
subsequently pass into small fluid filled spaces, such as the perineural and
perivascular spaces, running parallel to the olfactory and trigeminal nerves. Whilst
contained within these spaces, compounds are prone to convective bulk flow, which
can rapidly bring them into close proximity to the brain, at a rate of approximately
200μm/min (Bradbury et al., 1981, Ichimura et al., 1991). For instance the perineural
spaces surrounding the olfactory nerve passes through the cribiform plate, draining
into the cerebrospinal fluid (CSF) surrounding the brain. Given the speed at which
many substances administered intranasally are detected in the brain, it believed that
bullk flow is the predominant mode of transport for many compounds administered
via the nasal route (Lochhead and Thorne, 2012, Dhuria et al., 2010).
Upon reaching the olfactory bulbs and brainstem, compounds may spread throughout
the brain intracellularly from the peripheral olfactory and trigeminal neurons to the
second order neurons located within the brain, or travel extracellularly utilising the
bulk flow system within the cerebral perivascular and interstitial spaces(Dhuria et al.,
2010, Lochhead and Thorne, 2012). Recently the rostral migratory stream, the route
by which neuroblasts travel from the subventricular region of the brain to the

145
olfactory bulbs, has also been linked to the retrograde distribution of compounds
entering the olfactory bulbs. Disruption of this stream was found to reduce the levels
of intranasally administered calcitonin and erythropoietin in the brain (Scranton et al.,
2011).
Figure 5.2. Transport of intranasally administered compounds from the nasal passage to the olfactory and trigeminal nerve bundles. Compounds entering the nasal passage can traverse the nasal mucosa, via: 1. Intracellular transport within the olfactory and trigeminal nerve fibres; 2. Transcellular transport through the epithelial cells; 3. Paracellular transport between adjacent epithelial cells. Upon passing through this first barrier, compounds may reach the brain via: 4. Diffusion along the compartments lining the olfactory and trigeminal pathways; 5. Axonal transport within the olfactory and trigeminal neurons; 6. Bulk flow within the perivascular and perineural spaces. Adapted from (Lochhead and Thorne, 2012).

146
5.13 Factors affecting intranasal delivery
A number of factors must be taken into consideration, when administering
compounds intranasally, the first of which being the technique or application method.
Many studies utilising the nasal route to convey compounds to the brain have simply
used a pipette to place a small droplet of liquid onto the entrance of the nasal passage
of anesthetised mice or rats, allowing the sedated animal to inhale the solution. This is
generally performed over a 20 minute period, placing droplets onto alternate nostrils
and allowing around 2 minutes between doses for the liquid to penetrate the nasal
mucosa (Dhuria et al., 2010). Using this method has an inherent limitation, the
olfactory mucosa is a small region located at the top of the nasal cavity, and can be
difficult to reach simply by applying a small volume of liquid to the nostril. Head
position can therefore dictate the efficacy of this technique. Intranasal studies
performed on rats has demonstrated the importance of head position. Rodents placed
in the supine position, either at 70o or 90o, lead to a greater intranasal delivery of
steroid hormones into the CSF, compared to that achieved with a 90o upright position.
Although the supine position at 70o and 90o were both shown to be lead to transport
to the CSF, several studies have used a 0o position to avoid build-up of compounds in
the oesophagus and trachea (van den Berg et al., 2002).
Another factor influencing the efficiency of intranasal delivery is the volume of the
compound administered relative to the capacity of the nasal cavity. For example, the
size of an adult mouse’s nasal cavity is approximately 0.032 cm3, with the ideal volume
for delivery of compounds being between 3 and 4µL. High volumes of compound can
accumulate in the nasopharynx, and cause respiratory difficulty, while lower volumes
may be insufficient to reach the brain and elicit the desired effect (Dhuria et al., 2010,
Gross et al., 1982).
Given the role of the nasal mucosa in the defence against inhaled toxins, intranasally
administered compounds must overcome the body’s protective systems, including the
mucocilliary clearance mechanisms, efflux transport proteins, and the presence of
tight junctions. All of these protective mechanisms can be surmounted by altering the
formulation of the intranasally administered mixture (Pires et al., 2009).
147
The mucocilllary clearance (MCC) system significantly hinders the transport of
intranasally delivered compounds by reducing their residence time in the nasal
mucosa. The MCC consists of a mucus layer covering the nasal mucosa, which traps
foreign agents and subsequently transports them along the nasal pharynx to the
gastrointestinal tract with the aid of cilia. The action of the MCC is dependent on the
abundance and movement frequency of the cilia and the viscoelasticity of the mucus.
A greater number of cilia coupled with a viscous mucus lining results in a greater
clearance of foreign substances (Pires et al., 2009, Dhuria et al., 2010). The actions of
the MCC can be delayed with the use of mucoadhesives, which can increase the
contact time of administered compounds with the nasal epithelia, allowing for greater
levels of diffusion across this first membrane barrier. One such mucoadhesive is
chitosan, a cationic polysaccharide that forms electrostatic interactions with the
negatively charged epithelial cells, allowing compounds administered intranasally to
adhere to the nasal epithelial lining for a greater period of time. Chitosan is also
believed to disrupt the tight junctions in place between adjacent epithelial cells, thus
promoting paracellular transport (Yu et al., 2004, Vaka et al., 2009). The addition of
chitosan has been shown to particularly effective in the transport of naked plasmid
DNA. Given its positive charge, chitosan induces a conformation change in the plasmid
structure, forcing the DNA to adopt a compact structure that facilitates absorption
through the mucosa (MacLaughlin et al., 1998, Iqbal et al., 2003).
Other approaches to counteract the actions of the MCC, includes the use of
engineered nanoparticles conjugated to ligands with the capacity to bind to specific
cell types. Formulations containing nanoparticles attached to Ulex europeus
agglutinin I (UEA I), significantly increased delivery to the brain (Gao et al., 2007). This
ligand group binds to receptors found in the olfactory epithelium and facilitate
penetration of this initial barrier, therefore enhancing delivery to the CNS via the
olfactory route (Gao et al., 2007). Nanoparticles attached to wheat germ agglutinin
(WGA), have been found to bind receptors found throughout the nasal epithelia,
resulting in enhanced transport of compounds to both the CNS and systemic
circulation (Gao et al., 2006a).
148
The limited permeability of the nasal mucosa can greatly hamper the transport of
intranasally administered compounds to the CNS. One strategy to overcome this
barrier is the use of non-ionic surfactants that transiently disrupt the nasal epithelial
membrane, putatively via membrane fluidization, increasing transcellular and possibly
paracellular transport. For example alkylglucoside tetradecylmaltoside (TDM),
increases nasal uptake of both low molecular weight heparin (LMWH) and
fluoresceine-isothiocyanate labelled insulin (Arnold et al., 2002, Arnold et al., 2004).
The latter experiment noted a greater number of internalised vesicles upon addition
of TDM, and attributed the enhanced absorption of insulin to a higher rate of
endocytosis, leading to both a greater uptake and the removal of cilia from the apical
membrane(Arnold et al., 2004).
Blood flow surrounding the nasal passage purportedly influences the uptake of
intranasally administered compounds. While blood flow is crucial in maintaining the
diffusion gradient at the nasal epithelium and thus facilitating the diffusion of these
compounds across this initial barrier, a strong blood flow can result in increased level
of systemic clearance (Dhuria et al., 2010). Treatment with vasoconstrictors such as
phenylephrine reduces absorption into the blood, and increases transport via the
olfactory nerve pathway (Dhuria et al., 2009).
Although the intranasal route has several advantages over systemic delivery, the vast
majority of compounds administered by this method travels to the brain via
extracellular pathways, so the BBB can still poses a major obstacle (Graff and Pollack,
2003). The P-glycoprotein efflux system found within the BBB attenuates the
movement of a wide range of substances such as drugs, antibiotics and antivirals.
Studies have shown that intranasal pre-treatment with P-glycoprotein inhibitors, such
as rifampin, can greatly enhance the brain uptake (Padowski and Pollack, 2010).
5.14 Gene therapy and Neurodegenerative diseases
The use of intranasal delivery as a means of inducing changes in gene expression
within the brain has been studied by few groups. Despite the scarcity of research,
these recent studies have highlighted the potential use of this technique for gene
therapy of CNS disorders (Kim et al., 2009a, Renner et al., 2012).
149
Gene therapy is defined as the delivery of nucleic acid to treat or prevent disease, and
has often been touted as a potential treatment for inherited disorders (Nanou and
Azzouz, 2009). Although preliminary work suggests great promise, progress has been
hampered by a number of issues, including the stability and expression duration of
transgenes, cell specific targeting, possible toxicity and the delivery route. Many of
these matters have been addressed by utilising the appropriate vector system and
altering such vectors to minimise unintentional side effects (Ralph et al., 2006). Of the
various vehicles used to convey nucleic acids to target tissue, the lentiviral system, a
form of retrovirus, has been used extensively. Advantage of this system over others,
include the large capacity for cloning, targeting of both dividing and non-dividing cells
as well as stable long-term expression (Azzouz, 2006). Lentiviral vectors can also be
pseudotyped to a variety of envelope proteins, thus manipulating the tissue specificity
or tropism of the vector (Nanou and Azzouz, 2009).
Work is underway to determine the therapeutic implications of gene therapy in the
treatment of neurodegenerative diseases, with several lines of research currently
entering clinical human trials. One particularly promising preclinical study was that
carried out by Azzouz et al, who made use of a lentiviral vector based on the equine
infectious anemia virus to treat a toxin-induced rat model of PD, a condition
predominantly affecting the dopaminergic neurons found within the striatum. The
vector expressed tyrosine hydroxylase, aromatic amino acid dopa decarboxylase and
GTP cyclohydrolase, enzymes involved in dopamine synthesis, in a single transcript.
Following stereotaxic injection, the construct was found to be stably expressed in
striatal tissue, leading to increased dopamine synthesis and reversal of behavioural
defects (Azzouz et al., 2002).
The potential use of gene therapy in the treatment of HD has been illustrated in
several studies. For example, de Almeida et al found overexpression of ciliary
neurotrophic factor (CNTF), a nerve growth factor involved in inflammation, to be
neuroprotective in a toxin induced HD rat model. Animals injected stereotaxically with
lentiviral construct displayed improvements in behavioural defects coupled with
significantly reduced striatal lesions following administration of quinolinic acid, which
produced HD-like symptoms (de Almeida et al., 2001). Further studies conducted in

150
the transgenic YAC72 HD mouse model revealed improvements in behaviour, as well
as a stable expression of CNTF almost a year after stereotaxic injection of the lentiviral
construct (Zala et al., 2004).
The most striking example to illustrate the potential of gene therapy comes from
studies of amyotrophic lateral sclerosis (ALS), a neurodegenerative condition
characterised by the loss of motor neurons of the spinal cord, brainstem and motor
cortex. Genetic forms of the disease caused by mutations in the gene encoding Cu/Zn
superoxide dismutase I (SOD), an enzyme that catalyzes the conversion of superoxide
radicals to oxygen and hydrogen peroxide. Simultaneous research conducted by both
Ralph et al and Raoul et al, found that RNAi knock down of SOD via lentiviral-mediated
injections into muscle and spinal tissue of ALS mouse models respectively,
substantially delayed onset of the condition, with the former group reporting an 80%
increase in survival (Ralph et al., 2005, Raoul et al., 2005).
As of 2013 over 1800 gene therapy clinical trials were underway or had been
completed. The number of studies in phase II/III of clinical trials has steadily increased
by over 25% since 2004, with two studies relating to haemophilia D and lipoprotein
lipase deficiency, in phase IV. Although the use of gene therapy as a means of treating
or preventing neurodegenerative diseases is in its infancy, the progress made to date,
is promising (Ginn et al., 2013).
5.15 Aims
Many gene therapy studies have involved the injection of viral vector into target
tissue, which although effective, is inappropriate for human treatment. The aims of
this portion of the project centre on the validation of intranasal delivery as a means of
conveying lentiviral constructs to the brain, with the ultimate goal of delivery of
constructs to overexpress candidate HD modifiers. While my own research focuses on
HD, this work was conducted in the context of prion disease, using a well-established
mouse model as a paradigm for neurodegeneration.
151
Prion disease, or transmissible spongiform encephalopathy, is a rare
neurodegenerative condition characterised by the formation of large vacuoles, or
spongiforms within the brain, leading to neuronal loss and a mirrored decline in
mental and physical capabilities (see Table 5.1) (Wadsworth and Collinge, 2011). The
disease is attributed to conformational changes in the prion protein (PrP), which arise
sporadically, accounting for ~85% of human cases, or through autosomal dominant
mutations in the PRNP gene. Such changes gives rise to the infectious agent, PrPSc, a
protease-resistant protein which holds the capacity to convert the host-encoded PrPC
into toxic prion species, and leading to the formation of aggregates inclusions
(Wadsworth and Collinge, 2011, Prusiner, 1991). The mechanisms by which prions are
able to propagate are contentious, though the continued presence of the
endogeneous PrPC species appears to be crucial, with prion-null mice displaying a
resistant to prion infection (Büeler et al., 1993). This has been further illustrated
following generation of a transgenic mouse line expressing PrpC under control of the
Cre-lox system. Depletion of the neuronal prion protein following inoculation with
infected brain homogenate, was found to halt disease progression and substantially
extend lifespan relative to those mice with a sustained expression of the protein
(Mallucci et al., 2003). Such work provided the foundation for further therapeutic
research using lentiviral-mediated RNAi constructs against PRNP. Single stereotaxic
treatment with RNAi constructs into the hippocampus of infected mice was found to
reduce spongiosis and neuronal loss and extended lifespan by 24% compared to
untreated mice (White et al., 2008a).

152
Symptom type Description
Behavioural Aggression; anxiety; depression; loss of inhibition and judgement
Communication Slurred speech; repetition; loss of reading and writing ability
Memory Loss of both short and long term memory; loss of recognition
Cognition Reduction in intellect; lack of awareness
Movement Ataxia; loss of gait; jerky movements; tremors; rigidity
Perception Double vision; cortical blindness; hallucinations;
Seizures Late onset seizures
Table 5.1. Clinical signs of prion disease. Adapted from
http://www.prion.ucl.ac.uk/clinic-services/information/signs-and-symptoms/
Here I aimed to the conduct similar experiments to determine whether the intranasal
delivery may prove to be a viable alternative method to stereotaxic injection, using
the prion disease as a paradigm for neurodegeneration. Ultimately the technique was
to be employed in the lentiviral-mediated overexpression of our suppressor in HD
mouse models.

153
5.2 Material and Methods
5.21 Materials
5.211 Lentiviral constructs
MW1/EV
Lentiviral constructs were generated as described in (White et al 2008). The pLL3.7
lentiviral plasmid consisted of an siRNA sequence (21 nucleotide inverse repeat and 9
nucleotide loop) against PRNP, downstream of the U6 promoter, as well as the EGFP
encoding gene under the control of a CMV promoter. A construct, lacking the siRNA
sequence was also used during this study as a control. Virus production was carried
out by GenTarget Inc. The company provided packaged virus particles, pseudotyped
with VSV-G (vesicular stomatitis virus glycoprotein) proteins, at a titer of 107 IFUs
(infection function units).
5.212 Mouse models
C57BL/6N mice
Wild-type mice were purchased from Charles River Laboratories, and reared and
experimented upon in accordance with the Home Office approved animal (scientific
procedure) act of 1986. Mice were caged in groups of three to five and provided with
food and water ad libitum. The internal environment was maintained at approximately
21 oC on a 12-hour light/dark cycle. Mice were sacrificed by cervical dislocation.
Tg37 homozygous/hemizygous mice
Tg37 mice over-expressing the Prnp gene were used during the course of the study
(Mallucci, Ratte et al., 2002). These mice had been generated via the microinjection
the mouse Prnp transgene flanked by loxP sites into FVB Prnp0/0 (prion null) mice. The
transgenic mouse line expressed approximately 5-7 copies of the transgene, leading to
a Prnp expression of around 3-4 fold greater than wild type mice.
154
5.22 Methods
Prion inoculation
Animals were inoculated with 30 µL of 1% RML (Rocky Mountain Laboratories) brain
homogenate, derived from the scrapies prion strain PDG 586, or NBH (normal brain
homogenate), which served as a control. Inoculations were performed intracerebrally,
with hemizygous and homozygous mice succumbing to the prion infection at around 7
and 12 weeks post inoculation respectively (Chandler, 1961, Mallucci et al., 2003).
Inoculations were carried out by the research assistant Nicholas Verity.
Stereotaxic injection
Animals were anesthetised with the use of isoflurane (3% ATM for approximately 2
minutes in a closed chamber), and injected with 2 µL of 2 x 10⁷ IFU into the CA1 region
of the hippocampus (2 mm posterior to bregma, 1.5-3 mm lateral and 1.8-2 mm
ventrals). Injections were performed by the research assistant Nicholas Verity.
Intranasal lentivirus Delivery
Four month old wild type mice (C57BL/6N mice) were initially anesthetised with the
use of isoflurane and remained under a lower dose during intranasal delivery (2%
ATM, via a hose system). Mice were placed into cushioned cradles with their heads
elevated to 70o in the supine position. Body temperature was maintained with the aid
of a heat pad at 37 oC. A total of 84 µL of either the MW1 or EV lentivirus (106 TU/mL)
was administered in 12 µL doses in alternate nostrils, with a two minute break
between each dose. Mice were administered with the lentivirus either on a single day,
or received the same dose on a weekly basis for three consecutive weeks. Mice were
sacrificed 14 days after their final lentiviral dose, and subsequently dissected for tissue
samples in order to analyse PRNP levels via quantitative PCR.
A similar experiment was conducted on tg37 mice, which were inoculated with either
RML or NBH at 3 weeks of age. Mice were administered with the MW1/EV lentivirus
intranasally at various time points post inoculation, and as above received a varied
number of doses (single day, weekly). Mice were examined carefully until they
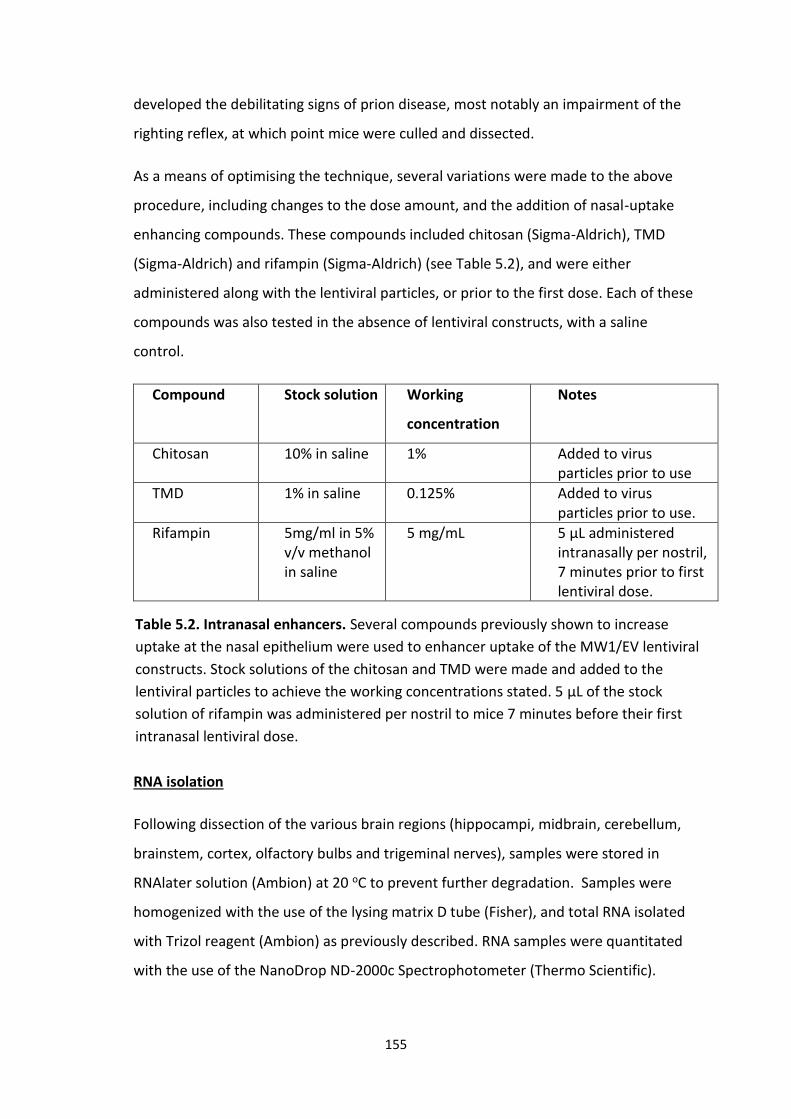
155
developed the debilitating signs of prion disease, most notably an impairment of the
righting reflex, at which point mice were culled and dissected.
As a means of optimising the technique, several variations were made to the above
procedure, including changes to the dose amount, and the addition of nasal-uptake
enhancing compounds. These compounds included chitosan (Sigma-Aldrich), TMD
(Sigma-Aldrich) and rifampin (Sigma-Aldrich) (see Table 5.2), and were either
administered along with the lentiviral particles, or prior to the first dose. Each of these
compounds was also tested in the absence of lentiviral constructs, with a saline
control.
Compound Stock solution Working
concentration
Notes
Chitosan 10% in saline 1% Added to virus particles prior to use
TMD 1% in saline 0.125% Added to virus particles prior to use.
Rifampin 5mg/ml in 5% v/v methanol in saline
5 mg/mL 5 µL administered intranasally per nostril, 7 minutes prior to first lentiviral dose.
RNA isolation
Following dissection of the various brain regions (hippocampi, midbrain, cerebellum,
brainstem, cortex, olfactory bulbs and trigeminal nerves), samples were stored in
RNAlater solution (Ambion) at 20 oC to prevent further degradation. Samples were
homogenized with the use of the lysing matrix D tube (Fisher), and total RNA isolated
with Trizol reagent (Ambion) as previously described. RNA samples were quantitated
with the use of the NanoDrop ND-2000c Spectrophotometer (Thermo Scientific).
Table 5.2. Intranasal enhancers. Several compounds previously shown to increase
uptake at the nasal epithelium were used to enhancer uptake of the MW1/EV lentiviral
constructs. Stock solutions of the chitosan and TMD were made and added to the
lentiviral particles to achieve the working concentrations stated. 5 µL of the stock
solution of rifampin was administered per nostril to mice 7 minutes before their first
intranasal lentiviral dose.
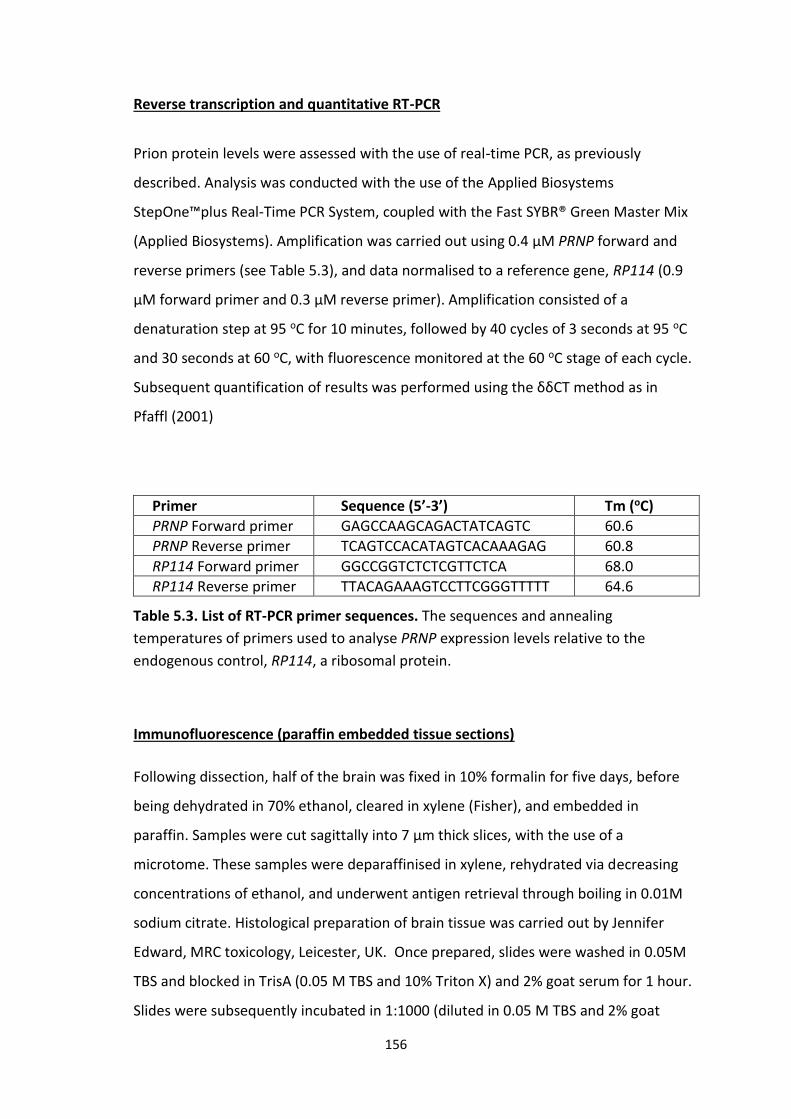
156
Reverse transcription and quantitative RT-PCR
Prion protein levels were assessed with the use of real-time PCR, as previously
described. Analysis was conducted with the use of the Applied Biosystems
StepOne™plus Real-Time PCR System, coupled with the Fast SYBR® Green Master Mix
(Applied Biosystems). Amplification was carried out using 0.4 µM PRNP forward and
reverse primers (see Table 5.3), and data normalised to a reference gene, RP114 (0.9
µM forward primer and 0.3 µM reverse primer). Amplification consisted of a
denaturation step at 95 oC for 10 minutes, followed by 40 cycles of 3 seconds at 95 oC
and 30 seconds at 60 oC, with fluorescence monitored at the 60 oC stage of each cycle.
Subsequent quantification of results was performed using the δδCT method as in
Pfaffl (2001)
Primer Sequence (5’-3’) Tm (oC)
PRNP Forward primer GAGCCAAGCAGACTATCAGTC 60.6
PRNP Reverse primer TCAGTCCACATAGTCACAAAGAG 60.8
RP114 Forward primer GGCCGGTCTCTCGTTCTCA 68.0
RP114 Reverse primer TTACAGAAAGTCCTTCGGGTTTTT 64.6
Immunofluorescence (paraffin embedded tissue sections)
Following dissection, half of the brain was fixed in 10% formalin for five days, before
being dehydrated in 70% ethanol, cleared in xylene (Fisher), and embedded in
paraffin. Samples were cut sagittally into 7 µm thick slices, with the use of a
microtome. These samples were deparaffinised in xylene, rehydrated via decreasing
concentrations of ethanol, and underwent antigen retrieval through boiling in 0.01M
sodium citrate. Histological preparation of brain tissue was carried out by Jennifer
Edward, MRC toxicology, Leicester, UK. Once prepared, slides were washed in 0.05M
TBS and blocked in TrisA (0.05 M TBS and 10% Triton X) and 2% goat serum for 1 hour.
Slides were subsequently incubated in 1:1000 (diluted in 0.05 M TBS and 2% goat
Table 5.3. List of RT-PCR primer sequences. The sequences and annealing
temperatures of primers used to analyse PRNP expression levels relative to the
endogenous control, RP114, a ribosomal protein.

157
serum) rabbit anti-GFP (Abcam ab290) overnight at 4oC. Slides were then washed 3
times in TBST and incubated in 1:1000 dilution of secondary antibody, an AlexaFlour
488 conjugated goat anti-rabbit antibody (Invitrogen) for one hour in the dark. Finally
slides were washed and mounted with the aid of mounting media (VECTASHIELD®).
Images were taken with the use of a fluorescence microscope (Ziess Axiovert 200M,
Zeiss Colibri controller), through a 10X magnification, using Axiovision 4.8 software
(Carl Zeiss)
Haematoxylin and eosin staining
Paraffin-embedded brain slices were stained with the nuclear dye, haematoxylin and
cytoplasmic protein dye, eosin. Slides were prepared and rehydrated as stated above.
Slides were then washed in distilled water for 3 minutes, and incubated in Harris’
Hematoxylin (Sigma-Aldrich) for 15 minutes. Slides were further washed in distilled
water for 1 minutes, incubated in 1% HCl for 15 seconds, and washed in water for 9
minutes. This was followed by a 3 minutes incubation in 1% aqueous Eosin Y (Sigma-
Aldrich), a 2 minute wash in water, a 5 minute incubation in 70% IMS, and finally a 7
minute incubation in xylene. Slide were mounted in the synthetic resin, DPX
(distyrene, plasticizer and xylene) (Sigma-Aldrich), and allowed to dry. Histology work
was performed by Jennifer Edward, MRC toxicology, Leicester, UK.
Brain homogenisation
Following dissection, hippocampal tissue was isolated and stored at -80 oC until
required. Prior to immunoblotting, hippocampal tissue was homogenised with the aid
of a hand-held micro-grinder in 200 µL of 2X homogenisation buffer (100 mM Tris
pH8.0; 300 mM sodium chloride; 4 mM EDTA; 2mM magnesium chloride; 200mM
sodium fluoride (Sigma-Aldrich); 20% (v/v) glycerol; 2% (v/v)Triton X-100; 2% (w/v)
sodium deoxycholate (Sigma-Aldrich); 0.2% SDS; and 0.25 M sucrose). Following
homogenisation, 200 µL of lysis buffer (0.25 M sucrose, 50 mM TRIS pH 7.4, 1 mM
EDTA, phos-STOP tablet (Roche) (one tablet per 10 mL of buffer), 1X complete
protease inhibitor (Roche)) was added to samples. Protein samples were stored on ice
for 10 minutes, centrifuged at 13,000 r.p.m for 10 minutes at 4 oC, and the
supernatant stored at -80 oC for further use.

158
Protein quantitation
Protein concentration was assayed using 10X Coomassie blue based Bradford reagent
(Bio-Rad). 1 µL of protein samples was mixed with 1 mL of 1X Bradford reagent to
form a homogenous blue solution. Samples were placed into clear polystyrene
cuvettes (Bio-Rad) and the absorbance at 595 nm determined using of the
Biophotometer Spectrometer (Eppendorf).
Preparation of protein samples for immunoblotting
To analyse the levels of PrpC, PrpSc and several synaptic proteins in the hippocampus
of RML/NBH infected mice, an immunoblot technique was employed. Samples were
prepared specifically for each of the three blots, for example 20 µg of samples
intended to determine synaptic protein levels, were diluted in 15 µL of sterile distilled
water. For the analysis of prion levels ~20 µg protein was diluted in 20 µL of
homogenisation buffer for PrpC and PrpSc blots, with the samples for the latter blot
being treated with 1µl of µg/µL proteinase K and incubated at 37 oC for 1 hour. 4 µL of
5x SDS loading dye (0.25% (w/v) bromophenol blue; 10% (w/v) SDS; 10 mM DTT; 20%
(v/v) glycerol; 0.2 M Tris-HCl pH 6.8), was added to all samples and heated at 95oC
prior polyacrylamide gel eletrophoresis.
SDS-Polyacrylamide gel electrophoresis and transfer
Following denaturation, protein samples were separated by gel electrophoresis.
Samples to determine synaptic proteins levels were separated on a 10%
polyacrylamide gel, while PrP were separated on 12% gels. The 10% resolving gel
solution was made up of: 4ml of distilled water; 2.5 mL 1.5 M Tris pH 8.8; 3.3 mL of
30% acrylamide/bisacrylamide 37.5:1 (Geneflow); 100 µLof 10% (w/v) SDS; 100 µL of
10% (w/v) ammonium persulphate (APS) (Sigma-Aldrich); 10 µL
Tetramethylethylenediamine (TEMED) (National Diagnostics). The 12% resolving gel
solution was made up of: 3.3 mL of distilled water; 2.5 mL 1.5M Tris pH 8.8; 4 mL of
30% acrylamide/bisacrylamide 37.5:1; 100 µL of 10% (w/v) SDS; 100 µL of 10% (w/v)
APS; 10 µL TEMED. In both cases the stacking gel solution comprised of: 3 mL of
distilled water; 1.26 mL of 0.25 M Tris pH6.8; 660 µL 30% acrylamide/bisacrylamide

159
37.5:1; 50 µL of 10% (w/v) SDS; 50 µL of 10% (w/v) APS; 5 µL TEMED (the APS and
TEMED were added prior to use).
Once set, the gel was secured into the electrode assembly, which was in turn placed
into the running tank. Sufficient 1X Running buffer (25 mM Tris; 192 mM glycine; 0.1%
(w/v) SDS), was poured into the tank, to cover the top of the wells. Samples pipetted
(long stemmed tips) into the wells, along with 5 µL of Spectra Multicolour broad range
protein ladder (Thermoscientific). An electrical current of 120V was applied to the gel
for 90 minutes to facilitate separation of proteins.
After sufficient separation of proteins, the electrode assembly was dismantled. The gel
was carefully layered on to the gel holder cassette (Bio-Rad) along with foam pads,
blotting paper and nitrocellulose membrane (Whatman) with a pore size of 0.2 μm
(Amersham) (layer consisted of a foam pad, blotting paper, gel, nitrocellulose
membrane, 2nd blotting paper, 2nd foam pad). Once assembled, the cassette was
placed into the electrode assembly (with current flowing from the negative electrode
through the gel and in turn the membrane). The electrode assembly was placed into
the transfer tank, which was subsequently filled with 1X transfer buffer, made up of:
12 mM Tris, 96 mM glycine (Fisher) and 20% methanol. An electrical current of 150V
was applied to the transfer cassette for 90 minutes.
Immunoblotting
Following transfer of protein from the gel to nitrocellulose, membranes were
incubated for 2 minutes in 0.1% (v/v) Ponceau S (Acros) in 5% acetic acid, to ensure
transfer of proteins. Membranes were then washed thoroughly in distilled water.
Synaptic protein blots were blocked in 5% milk in TBST for 1 hour at room
temperature, and then incubated overnight at 4 oC with constant rocking, in 5% milk
supplemented with the primary antibodies, 1 in 10,000 mouse anti-GAPDH
(glyceraldehyde 3-phosphate dehydrogenase) (monoclonal, Santa Cruz 32233), 1 in
10,000 rabbit anti-SNAP-25 (synaptosomal-associated protein 25) (polyclonal, Abcam
5666) and 1 in 1000 mouse anti-PSD-95 (post synaptic density-95) (polyclonal, BD
transduction laboratories 610496). Membranes were rinsed three times with TBST,
160
and then washed a further three times, each for 5 minutes. The membranes were
subsequently probed with 1 in 10,000 goat anti-rabbit and anti-mouse horse radish
peroxidase (HRP) conjugated secondary antibodies (Dako), for 1 hour at room
temperature, followed by five 5 minute washes in TBST. Finally membranes were
covered with ECL Primer Western blotting detection reagent (Amersham) and
incubated for 5 minutes. The membranes were subsequently exposed to radiographic
film (Fuji) for varying lengths of time in dark conditions (typically 2 minutes). Film was
developed in developer agent (RG Universal) until bands became visible, immersed in
stop solution (0.3% acetic acid, Fisher Scientific), and finally fixed with the use of
fixation fluid (RG Universal).
Both of the PrP blots were initially incubated overnight in PBST, and then probed with
1 in 10,000 mouse anti-prion ICSM35 primary antibody (monoclonal, D-gen 0130-
03501) in PBST for 1 hour at room temperature. Membranes were the washed three
times in PBST, and incubated with PBST containing 1 in 10000 goat anti-mouse HRP
conjugated secondary antibody for a further hour at room temperature. Membranes
were washed 5 times with PBST, and incubated in Pierce ECL Western blotting
substrate (Thermoscientific) for 5 minutes. Blots were developed as stated above.
Image J was used to measure the average pixel density of each protein band, and in
the case of the synaptic proteins blot, samples were normalised to the GAPDH levels.
PrPC blots were stripped (see below), probed with tubulin, and normalised to this
internal control.
Stripping of immunoblot membranes
PrPC blots were incubated in stripping buffer (2% SDS; 100 mM 2-mercaptoethanol;
and 62.5 mM Tris pH6.8), at 50 oC for 30 minutes with occasional shaking. Membranes
were washed three times in TBST, and subsequently blocked in 3% BSA in TBST for an
hour at room temperature. The membranes were incubated with 1 in 5000 mouse
anti-tubulin antibody in 3% BSA over night at 4 oC. Following incubation, blots were
washed three times in TBST, and probed with1 in 10000 goat anti-mouse HRP
conjugated secondary antibody in 3% BSA for a further hour at room temperature.
Finally membranes were washed a further 5 times in TBST, incubated in ECL Primer

161
immunoblotting detection reagent (Amersham) for 5 minutes and developed as stated
above.
162
5.3 Results
5.31 GFP expression detected in both the cortex and hippocampus following
intranasal delivery of MW1 or EV into prion infected hemizygous mice
Previous work conducted in prion infected tg37 models of prion disease, revealed a
reversal of the prion disease phenotype in animals treated stereotactically with the
MW1 PRNP knockdown lentivirus (White et al., 2008b). We sought to determine
whether the therapeutic benefits of treating prion inoculated hemizygous mice with
this construct could be achieved when administered via a nasal route. Animals were
administered either the MW1 or EV lentivirus at 6, 7 and 8 weeks post inoculation
(w.p.i). Mice were culled via cervical dislocation upon manifestation of prion disease
symptoms, notably a loss of the righting reflex. Interestingly immunohistochemistry
against the GFP gene marker found in both lentivirus, revealed significant expression
of the constructs in both the hippocampal and cortical cells of terminally ill mice
treated intranasally at these timepoints compared to untreated RML only animals (see
Figures 5.3 and 5.4). As illustrated in the hippocampal images, greater expression of
GFP was detected in CA3 the regions of the hippocampus relative to the CA1 and
dentate gyrus. Images of the cortex showed a more even spread of GFP containing
cells throughout this region of the brain. Given that the shRNA and GFP expression are
regulated by different promoters, expression of the latter is only surrogate indicator of
knockdown, though these results indicate that both MW1 and EV are able to reach
these brain regions following intranasal delivery.

163
Figure 5.3. GFP is expressed in the hippocampi of mice treated with three doses of either EV or MW1. Prion infected mice were intranasally treated with either the MW1 or EV lentiviral construct at 6, 7 and 8 w.p.i. Both constructs expressed GFP, which was detected using of rabbit anti-GFP and goat anti-rabbit (conjugated to an AlexaFluor 488). Images were taken at 10X magnification of the whole hippocampus, as well as a 40X magnification of the CA3 region.

164
5.32 The MW1 Prnp knockdown lentiviral constructs failed to significantly reduce
prion levels in C57BL6N wild type mice
To determine the effectiveness of the intranasally administered MW1 lentiviral
construct in eliciting knock down of mouse Prnp expression, we intranasally
administered this virus or an empty vector (EV) viral control into C57BL6N WT mice.
Such work was conducted in parallel to that of prion infected transgenic mice, though
given the period of prion incubation, expression work was carried out in these WT
mice. Animals were sacrificed 14 days after treatment and the brainstem, cortex,
Figure 5.4 GFP is expressed in the cortex of mice treated with three doses of either EV or MW1. Prion infected mice were intranasally treated with either the MW1 or EV lentiviral construct at 6, 7 and 8 w.p.i. Both constructs expressed GFP, which detected using rabbit anti-GFP and goat anti-rabbit (conjugated to an AlexaFluor 488). Images were taken at both a 10X and 40X magnification.
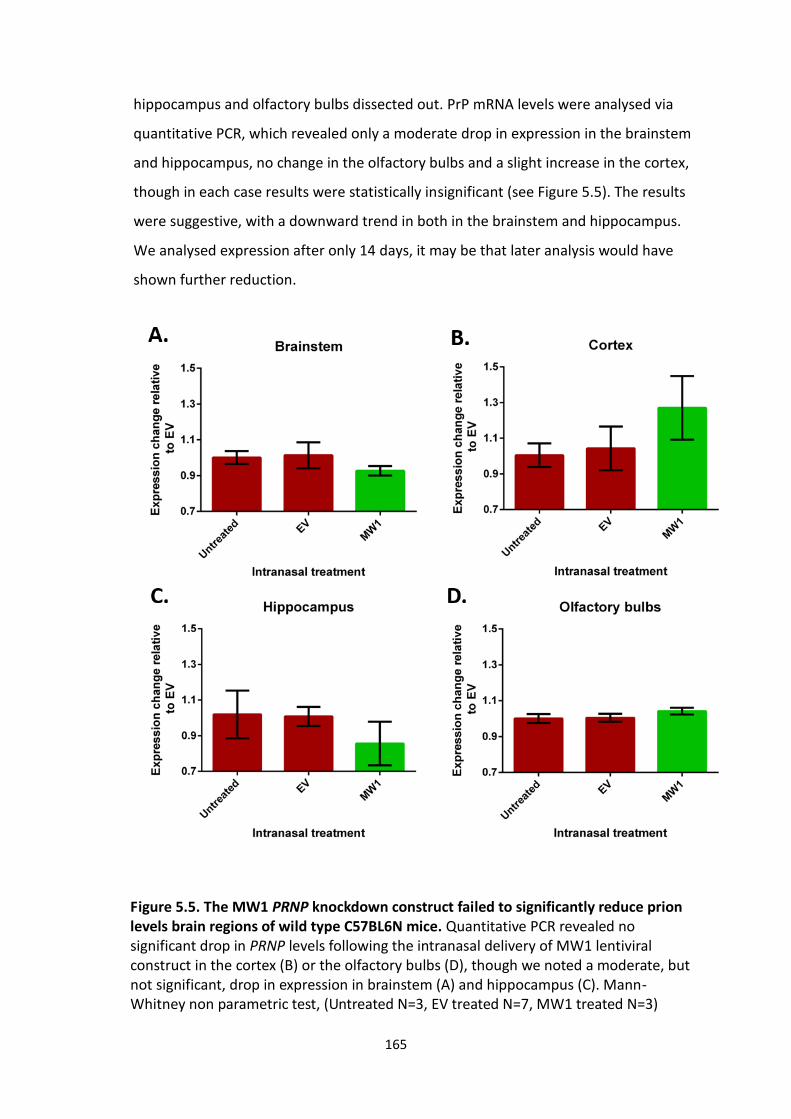
165
hippocampus and olfactory bulbs dissected out. PrP mRNA levels were analysed via
quantitative PCR, which revealed only a moderate drop in expression in the brainstem
and hippocampus, no change in the olfactory bulbs and a slight increase in the cortex,
though in each case results were statistically insignificant (see Figure 5.5). The results
were suggestive, with a downward trend in both in the brainstem and hippocampus.
We analysed expression after only 14 days, it may be that later analysis would have
shown further reduction.
Figure 5.5. The MW1 PRNP knockdown construct failed to significantly reduce prion levels brain regions of wild type C57BL6N mice. Quantitative PCR revealed no significant drop in PRNP levels following the intranasal delivery of MW1 lentiviral construct in the cortex (B) or the olfactory bulbs (D), though we noted a moderate, but not significant, drop in expression in brainstem (A) and hippocampus (C). Mann-Whitney non parametric test, (Untreated N=3, EV treated N=7, MW1 treated N=3)

166
5.33 Prnp knockdown increased lifespan and a delayed onset of spongiosis in prion
infected homozygous mice.
Previously in the Mallucci group, analysis of PRNP expression changes via qPCR
following delivery of the MW1 lentivirus was been found to be very variable in
individual mice, while the collective in vivo effects of knockdown, such as survival and
burrowing were unequivocal. Therefore despite no significant changes in PRNP
expression following intranasal delivery of the MW1 lentivirus into C57BL6N WT mice,
we continued to administer the construct into the tg37 prion model. MW1 or an EV
was administered to homozygous mice at 3, 4 and 5 w.p.i of prion infected brain
homogenate (MW1 was administered only twice during this period). Mice were
subsequently monitored daily until they exhibited confirmatory symptoms of prion
disease. Although not statistically significant, we noted an increase in the survival of
mice treated with the MW1 lentivirus at 3 and 4 w.p.i relative to those delivered EV
(see Figure 5.6). Furthermore, haematoxylin and eosin staining of brain slices derived
from terminally ill mice treated at 3 and 4 w.p.i, as well as those animals culled at 7
w.p.i, revealed a reversal of spongiosis in mice administered MW1 relative to those
animals treated with EV (see Figure 5.7).
Figure 5.6. Treatment of homozygous prion inoculated mice with MW1 lentivirus at 3 and 4 weeks post inoculation extends life span of some mice. Mice were treated with a single, double or triple of the MW1, between 3 and 5 weeks post inoculation. Several of the mice administered the lentivirus at 3 and 4 w.p.i inoculation appeared to survive much longer than those of given the empty vector (EV). Mantel-Cox test (EV 3, 4, 5 w.p.i N=3, MW1 3 and 4 w.p.i N=3)

167
5.34 Early intranasal treatment of prion infected hemizygous mice revealed a delay
in spongiosis though no change in synaptic protein level changes.
Following the promising work conducted in the homozygous tg37 mice, we performed
the same study in hemizygous mice. Animals were treated with three doses of EV or
MW1 between 2 and 7 w.p.i with mice. Those mice treated at 2, 3 and 7 w.p.i
appeared to survive significantly longer than prion infected mice (RML only), though
exhibited a survival comparable to EV treated animals (see Figure 5.8).
Figure 5.7. Prion infected homozygous mice treated with MW1 at 3 and 4 weeks post inoculation displayed a similar degree of spongiosis at 7 weeks compared to EV treated mice, while terminally ill mice exhibited a reversal of spongiosis. Prion infected mice treated with either MW1 or EV were sacrificed at 7 w.p.i or upon exhibiting confirmatory signs of prion sickness. The brains of animals were dissected, sectioned, and stained with haematoxylin and eosin. At 7 w.p.i, the hippocampus, especially the CA3 region, of the mice treated with MW1 revealed a comparable level of spongiosis to those animals treated with EV. In contrast, brain sections derived from terminally ill mice displayed a reversal in spongiosis, with some mice administered MW1 exhibiting no visible vacuoles. Images taken at 5X magnification.

168
Haematoxylin and eosin staining of brain slices derived from the terminally ill mice
administered lentiviral constructs at 2, 3 and 7 weeks revealed a postponement of
spongiosis in mice treated with MW1, exhibiting an largely intact hippocampal ribbon
structure compared to untreated or EV treated animals. (see Figure 5.9).
To further determine the effectiveness of the intranasal delivery of MW1 at these
time points, we sacrificed mice at 9 w.p.i, dissected the hippocampal tissue and
analysed the levels of the synaptic proteins, SNAP-25 and PSD-95 (see Figure 5.10).
Our results demonstrated no significant change in PSD-95 levels in mice treated with
MW1 relative to tissue derived from animals inoculated with NBH or RML only and
then culled at 9.w.p.i, with both of the latter displaying similar protein levels. All three
of these groups exhibited much higher levels of PSD-95 than terminally ill RML only
treated mice. Levels of SNAP-25 were inconsistent with previous work conducted in
the Mallucci group , while MW1 treated mice exhibited much higher levels of this
synaptic protein than untreated prion infected mice taken at both 9 w.p.i and
Figure 5.8. The early treatment of prion inoculated hemizygous mice with MW1 construct at 2, 3 and 7 weeks post inoculation appears to extend life span of some mice. Mice were treated with three doses of the MW1 or EV between 2 and 7 weeks post inoculation. While mice treated with MW1 at 2, 3 and 7 w.p.i appeared to survive much longer than untreated animals (RML only), their survival was comparable to that of mice administered EV. Mantel-Cox test (RML only N=7, EV 2, 3 and 7 w.p.i N=3, MW1 2, 3 and 7 w.p.i N=5)
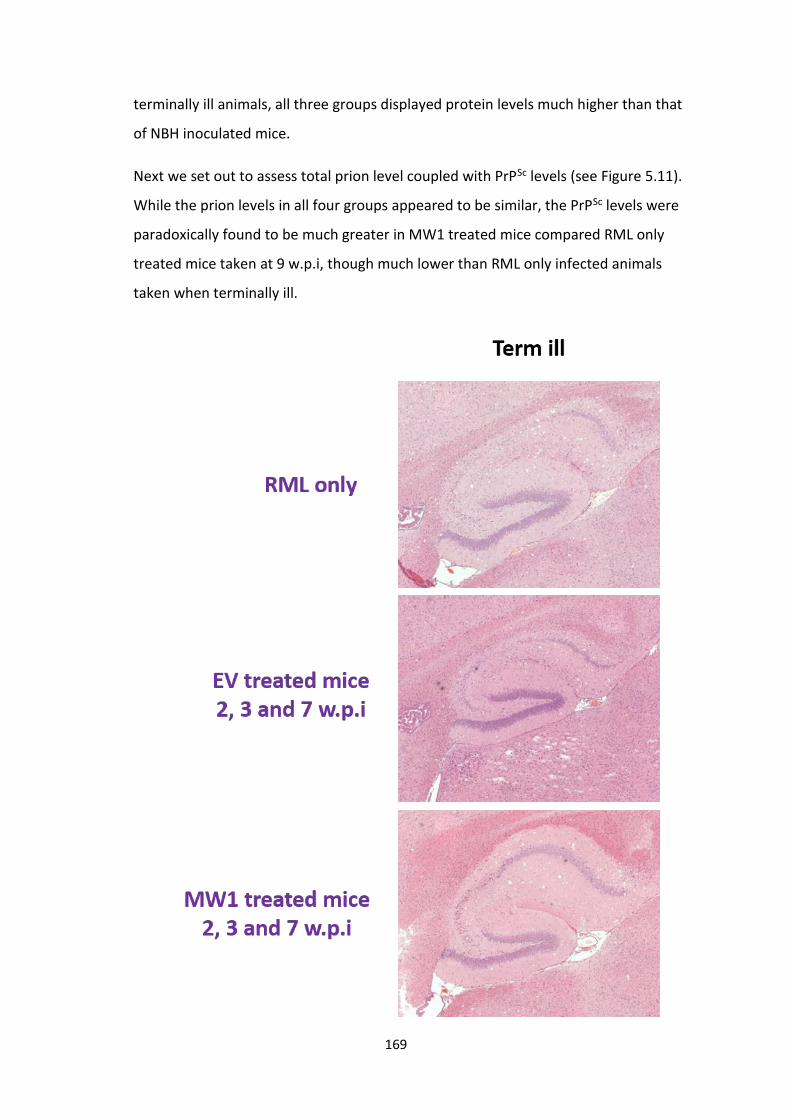
169
terminally ill animals, all three groups displayed protein levels much higher than that
of NBH inoculated mice.
Next we set out to assess total prion level coupled with PrPSc levels (see Figure 5.11).
While the prion levels in all four groups appeared to be similar, the PrPSc levels were
paradoxically found to be much greater in MW1 treated mice compared RML only
treated mice taken at 9 w.p.i, though much lower than RML only infected animals
taken when terminally ill.

170
Figure 5.9. Prion infected hemizygous mice treated with MW1 at 2, 3 and 7 weeks post inoculation displayed a delay in spongiosis relative to EV treated and RML only, untreated mice. Prion infected mice treated with either MW1, EV or left untreated were sacrificed once confirmatory signs of prion sickness became apparent. The brains of animals were dissected, sectioned, and stained with haematoxylin and eosin. The hippocampal ribbon (CA1 and CA3 regions) appeared to be intact in some mice administered MW1 compared to EV and RML only treated mice. Images taken at 5X magnification.
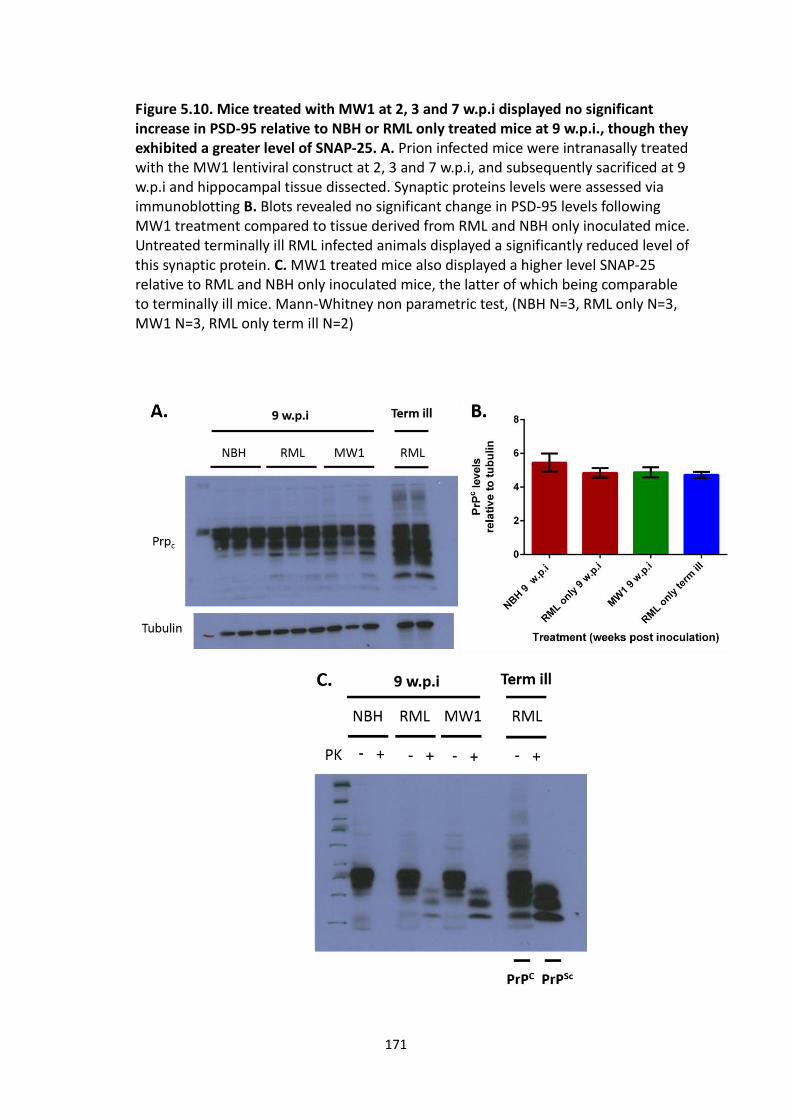
171
Figure 5.10. Mice treated with MW1 at 2, 3 and 7 w.p.i displayed no significant increase in PSD-95 relative to NBH or RML only treated mice at 9 w.p.i., though they exhibited a greater level of SNAP-25. A. Prion infected mice were intranasally treated with the MW1 lentiviral construct at 2, 3 and 7 w.p.i, and subsequently sacrificed at 9 w.p.i and hippocampal tissue dissected. Synaptic proteins levels were assessed via immunoblotting B. Blots revealed no significant change in PSD-95 levels following MW1 treatment compared to tissue derived from RML and NBH only inoculated mice. Untreated terminally ill RML infected animals displayed a significantly reduced level of this synaptic protein. C. MW1 treated mice also displayed a higher level SNAP-25 relative to RML and NBH only inoculated mice, the latter of which being comparable to terminally ill mice. Mann-Whitney non parametric test, (NBH N=3, RML only N=3, MW1 N=3, RML only term ill N=2)

172
5.35 Lowered lentiviral dose, or the use of chitosan, rifampin and TMD did not
extend survival of prion infected mice
In order to optimise the intranasal delivery of the MW1 lentivirus, we attempted to
lower the dose of the virus from 12 µL per nostril, with a total volume of 96 µL, to 4 µL
per nostril and a total volumeof 32 µL, as this had previously be shown to prevent
drainage into the trachea and increase uptake at the nasal epithelium (Dhuria et al.,
2010). We administered EV and MW1 intranasally into prion infected hemizygous
mice at 4, 5 and 6 w.p.i, and also stereotactically injected 96µl into mice at 4 w.p.i to
provide comparison. Such optimisation failed to extend the lifespan of hemizygous
prion infected mice relative to RML only treated mice or those administered EV
intranasally, while those mice injected with the MW1 lentivirus stereotaxically
displayed increased survival, though this increase was not statistically different to RML
only treated animals (see Figure 5.12).
Figure 5.11- PrPC levels in mice administered the MW1 lentiviral construct at 2, 3 and
7 w.p.i appeared to be similar to those displayed by RML only treated mice at 9 w.p.i,
while PrPSc
levels seemed to be elevated. A. Mice were inoculated with either NBH or RML, with the latter administered the MW1 or left untreated (RML only). All mice were sacrificed 9 w.p.i, and hippocampal tissue dissected and analysed via western blotting. The mouse prion protein was identified with the aid of the ICSM35 antibody. B. All RML infected mice displayed prion levels equivalent than those inoculated with NBH. C. Protein samples were treated with proteinase K (PK) prior to loading, with PrpSc species being resistant to such treatment. Mice administered with MW1 exhibited
higher levels PrPSc
, compared to both RML only treated mice and NBH inoculated animals. Mann-Whitney non parametric test, (NBH N=3, RML only N=3, MW1 N=3, RML only term ill N=2)

173
My second attempt at optimisation involved delivering the lentivirus together with
compounds believed to enhance uptake at the nasal epithelium. These included the
mucoadhesive chitosan, the permeation enhancer, TMD and the P-glycoprotein efflux
inhibitor rifampin. While delivery of MW1 with chitosan and rifampin failed to extend
the lifespan of homozygous prion infected mice, TMD combined with the lentivirus
was initially found to extend survival by several days relative to control animals
treated with the compound and EV (see Figure 5.13). However a follow up experiment
making use of TMD failed to yield a consistent result, and when combined with the
previous data, any significant extension in survival was lost.
Figure 5.12- Prion infected hemizygous mice treated with low doses of MW1 at 4, 5 and 6 weeks post inoculation displayed no significant increase in survival compared to EV and RML only treated animals. Prion infected mice were administered with a lower dose (4 µL per nostril, with a total of 32 µL) of either the MW1 or EV. In parallel, a small cohort of mice was stereotaxically injected with either of the constructs as a means of comparison. Animals injected with the MW1 virus displayed the longest survival, while intranasal delivery of the same construct led to no extension in survival compared to EV treated and RML only untreated mice. Mantel-Cox test (MW1 intranasal N=10, EV intranasal N=4, RML only N=5, MW1 injection N=8, EV injection N=3)

174
5.36 Treatment of prion infected hemizygous mice with MW1 at 6, 7 and 8 w.p.i
increased survival.
Following the promising results obtained in the previous set of experiments, we aimed
to determine whether a later dose of the MW1 knockdown lentivirus, could bring
about a greater therapeutic effect than that seen when administered between 2 and 7
w.p.i. Animals were treated with MW1 or EV between 6 and 8 w.p.i, receiving either
one to two doses. As in the previous experiment, mice were culled upon displaying
confirmatory prion disease signs. Mice treated with MW1 at 6, 7 and 8 w.p.i survived
appreciably longer than those left untreated or administered the EV, with some mice
Figure 5.13 Treatment of homozygous mice with chitosan, rifampin and TMD failed to improve the survival of mice intranasally administered with MW1. Mice were treated with either A. chitosan, B.rifampin, or C. TMD prior to, or alongside the intranasal delivery of the MW1 or EV lentiviral constructs at 2 and 3 w.p.i. In all cases, those treated with the MW1 construct failed to display any significant increase in survival relative to mice given EV or saline. Mantel-Cox test (chitosan + saline N=2, chitosan + EV-3, chitosan + MW1 N=3, rifampin + saline N=2, rifampin + EV N=3, rifampin + MW1 N=2, TMD + saline N=5, TMD + EV N=5, TMD + MW1 N=7)

175
surviving on average 5 days longer than RML only infected mice (see Figure 5.14).
Furthermore, there appeared to be no marked difference between mice receiving two
or three doses of the MW1 lentivirus. In contrast to the study conducted on
homozygous mice, haematoxylin and eosin staining of brain slices derived from
terminally ill hemizygous mice revealed similar levels of spongiosis in EV, MW1 treated
and untreated mice (Figure 5.15).
Figure 5.14. Treatment of hemizygous prion inoculated mice with MW1 at 6, 7 and 8 weeks post inoculation extends life span. Mice were treated with either a double or triple doses of the MW1 construct between 6 and 8 weeks post inoculation. Mice administered the lentivirus at 6, 7 and 8 weeks post weeks inoculation survived significantly longer than those of given the empty vector (EV) as well as RML only treated animals. Mantel-Cox test, P< 0.05 (*) (EV 6, 7 and 8 w.p.i N=3, RML only N=2, MW1 6, 7 and 8 w.p.i N=3)
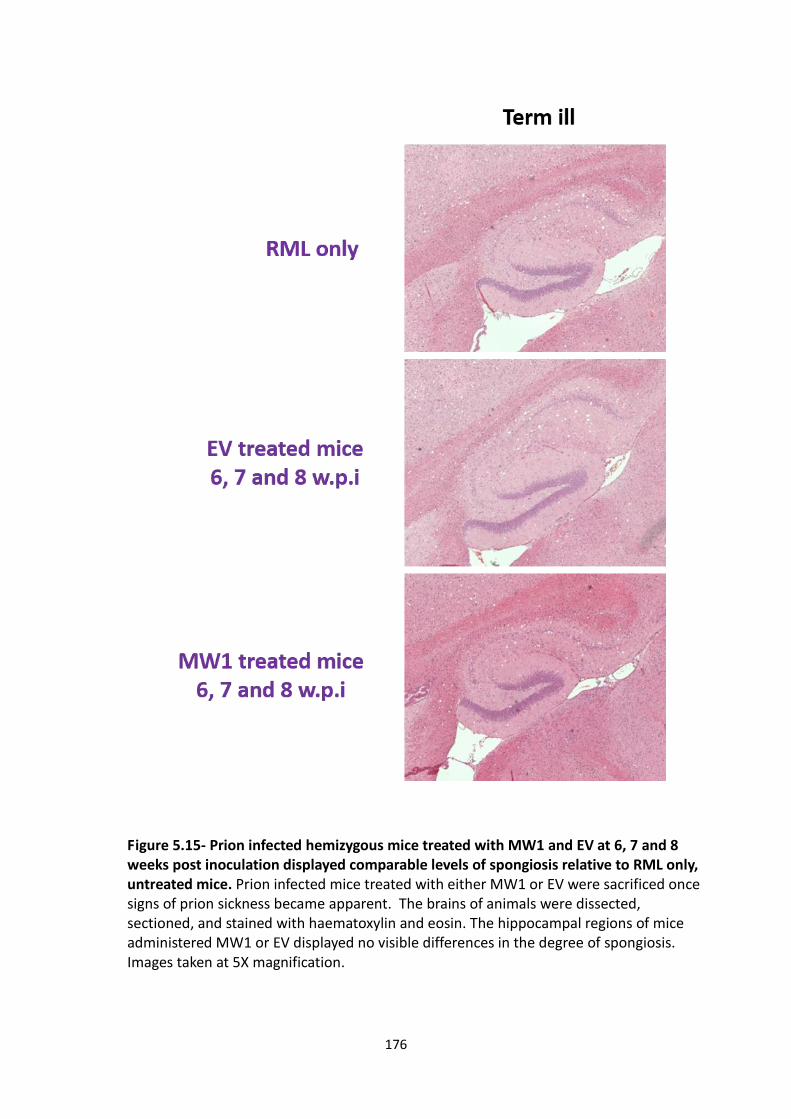
176
Figure 5.15- Prion infected hemizygous mice treated with MW1 and EV at 6, 7 and 8 weeks post inoculation displayed comparable levels of spongiosis relative to RML only, untreated mice. Prion infected mice treated with either MW1 or EV were sacrificed once signs of prion sickness became apparent. The brains of animals were dissected, sectioned, and stained with haematoxylin and eosin. The hippocampal regions of mice administered MW1 or EV displayed no visible differences in the degree of spongiosis. Images taken at 5X magnification.

177
5. 4 Discussion
Intranasal delivery has recently grown in popularity as a means of conveying
compounds and gene vectors to the brain. The key advantages of this technique over
more invasive methods include the penetration of the BBB coupled with the ease of
administration, as well as the potential for long term therapy (Kulkarni et al., 2013).
Several lines of research have sought to combine this method with gene therapy, the
results of which hold great promise in the treatment of CNS disorders (Jiang et al.,
2012, Kim et al., 2009a, Kanazawa et al., 2013).
The aim of this portion of the research centred on the optimisation of intranasal
delivery as a means of delivering lentiviral constructs to the CNS, providing an
alternative route than the more invasive stereotaxic approach. Such work was
conducted in the context of a model of the neurodegenerative condition prion
disease, with the ultimate goal of using the same technique to overexpress our
splicing suppressor genes in the HD82Gln transgenic model of HD.
The study was designed to mimic the work carried out by White et al (2008), who
noted an 80% knockdown in PRNP levels following the stereotaxic injection of the
MW1 lentiviral construct into the hippocampus of wild-type mice (White et al.,
2008b). We did not observe a significant knockdown of Prnp by qPCR following
intranasal delivery of the construct, which may be due to the more diffuse spread of
the lentivirus associated with this delivery method, in contrast to the highly targeted
stereotaxic technique. As previously demonstrated, this widespread effect will have
reduced the number of transfected cells, resulting in a diminished level of vector
integration copy number and in turn a lower expression of the shRNA (Zielske et al.,
2004).
Despite the lack of statistical significance, the results derived from qPCR data
illustrated a modest drop in PRNP expression in both the hippocampus and the
brainstem following MW1 treatment, but no such change in the olfactory bulbs. This
may be indicative of the principal route of entry into the brain, with a greater influx of
lentiviral particles via the trigeminal route. This is supported by the work conducted by
Thorne et al, who found insulin-like growth factor levels to be 10 fold greater in the

178
trigeminal nerves relative to the olfactory bulbs, following intranasal delivery of the
compound into adult rats (Thorne et al., 2004). However given the shorter distance
from the nasal mucosa to the olfactory bulbs, the majority of studies making use of
this technique have noted a substantially larger concentration of intranasally
administered compounds in the olfactory bulbs compared to the brainstem (Dufes et
al., 2003, Johnson et al., 2010). This suggests that differences in the administered
compound, such as lipophilicity and molecular weight, may influence the route by
which they gain entry into the brain (Kulkarni et al., 2013).
Stereotaxic injection of MW1 into the hippocampus of prion infected tg37 hemizygous
mice had previously been shown to extend lifespan by ~24% relative to the EV treated
counterparts (White et al., 2008b). We performed similar experiments on both
homozygous and hemizygous mice, with the aim of testing whether this approach
emulated these results using the intranasal delivery method.
The work conducted in the prion infected tg37 homozygous mice revealed some,
albeit statistically insignificant, extension in survival following intranasal treatment
with the MW1 lentivirus at 3 and 4 w.p.i, with mice surviving on average 4.2 days
longer than those animals treated with EV. Some mice survived over a week longer
than control mice, a considerable extension given that untreated infected
homozygotes generally survive for 9 w.p.i before succumbing to prion sickness.
Furthermore, increased survival was coupled with a delayed onset of hippocampal
spongiosis in terminally ill mice, suggesting that intranasal administration of the MW1
lentivirus may have hindered disease.
We next sought to determine whether protection could be achieved in the
hemizygous transgenic mouse line. These mice displayed a less fulminant phenotype
in response to prion infection, allowing us to examine the best times points to
administer the MW1 virus in relation to disease progression. While mice treated with
MW1 between 2 and 7 w.p.i survived much longer than RML only treated animals,
these mice displayed a survival comparable to those animals administered EV. Upon
examination of brains derived from terminally ill mice we largely observed a delayed
spongiosis in mice treated with MW1, relative to RML only and EV treated animals.

179
PrPSc and synaptic proteins levels were similar in both EV and MW1 treated and
untreated mice at 9 w.p.i.. Surprisingly these PrPSc and synaptic protein levels were
comparable to those animals inoculated with normal brain homogenate (NBH),
suggesting further repeats of this experiment are warranted.
These results are in contrast to previous research conducted by the Mallucci group, in
which prion infection brought about a 50% decline in both SNAP-25 and PSD-95 levels
at 9 w.p.i compared to NBH treated animals. This deficit was abolished by stereotaxic
injection of the MW1 lentivirus into the hippocampus (Moreno et al., 2012). Such
findings were attributed to the induction of the unfolded protein response (UPR), a
direct consequence of prion protein accumulation. The UPR was found to be mediated
by the eukaryotic translation initiation factor, eIF2α-P. Upon stimulation of the UPR,
global translation is repressed, leading to a reduction in synaptic proteins and in turn a
loss of synaptic plasticity. Such synaptic dysfunction was restored through the
inhibition of eIF2α-P or knockdown of the prion protein with the MW1 lentivirus. Our
results suggest that intranasal delivery of the MW1 virus into the brain fails to
sufficiently knockdown PRNP to elicit the therapeutic effects seen when administered
via a stereotactic approach.
To enhance the uptake of the lentivirus, we employed several strategies to either
transiently alter the morphology of the nasal mucosa or increase the residence time of
intranasally administered compounds within the nasal cavity. One such method
included the use of a lower volume of intranasally delivered lentiviral constructs, as
previous research has demonstrated doses above 3-4µL would often lead to drainage
into the nasalphaynx and consequently respiratory difficulties (Dhuria et al., 2010). We
reduced our doses to 4µL, with a total volume of 32µL per day, but failed to observe
any significant change in survival or burrowing behaviour in hemizygous mice treated
with MW1 at 4, 5 and 6 w.p.i. Next we made use of compounds which increase
uptake at the nasal mucosa. These compounds included chitosan, a mucoadhesive
shown reduce mucocillary clearance while temporarily disrupting tight junctions at the
nasal epithelium; TMD, a permeation enhancer thought to alter the fluid state of the
membrane; and rifampin, an inhibitor of the efflux system found at the nasal mucosa
(Illum, 2007, Iqbal et al., 2003, Arnold et al., 2002, Arnold et al., 2004, Graff and

180
Pollack, 2003, Padowski and Pollack, 2010). Homozygous mice administered with the
MW1 virus alongside chitosan, rifampin or TMD at 2 and 3 w.p.i, all failed to display
any extension in life span. We can thus conclude that these compounds failed to
enhance uptake of our lentivirus to the brain.
We also sought to determine whether a later treatment of prion infected tg37
hemizygous with MW1 could produce survival results similar to though seen in the
homozygous transgenic model. Such work yielded promising results, with mice
treated with MW1 at 6, 7 and 8 w.p.i displaying a life span extended by 3 days, though
no reduction in spongiosis was observed. Additionally, immunohistochemistry
performed on tissue derived from these mice, revealed considerable GFP expression in
the hippocampus and cortex, illustrating the successful spread of both the MW1 and
EV constructs upon entering the brain.
Our results indicate a greater penetrance of virus into the brain, when administered at
later time points of disease progression. This may be attributed to several
observations relating to the widespread effects of prion infection. One of the key
features of prion particle infectivity is the capacity to spread via neural pathways.
Intracerebral prion infection has previously been shown to spread to the olfactory
bulbs, and sequentially to the olfactory epithelium via retrograde transport (DeJoia et
al., 2006). Prion deposits have been observed in the olfactory receptor neurons,
leading to degeneration and loss of these infected neurons, an effect coupled with
shedding of prion particles and further transmission (Corona et al., 2009, Bessen et
al., 2010) Additionally, recent structural studies of the prion protein has revealed a
membrane binding capacity, which can disrupt membrane stability and consequently
increase permeability (Sonkina et al., 2010). It is therefore feasible that prion induced
degeneration of olfactory and trigeminal nerve endings, or other neurons along these
pathways, may be conducive to nasal uptake. This may be brought about by an
increased permeability or through the transient gaps generated within the nasal
mucosa following loss of the olfactory nerves fibres.
Furthermore, work conducted by Van Den Pol et al and Lemiale et al showed
retrograde transport of intranasally administered viruses via the olfactory nerves, and

181
while both groups found evidence of their respective viruses reaching the olfactory
bulbs, neither reported further transport past this region of the brain (van den Pol et
al., 2002, Lemiale et al., 2003). The latter group found that the GFP-expressing
rhabdovirus was incapable of escaping the olfactory bulbs, and was eventually
expunged after 8 days post infection. This effect was attributed to activation of the
innate and specific immune response within the olfactory system (Reiss et al., 1998,
van den Pol et al., 2002).
In prion disease, the immune system, especially dendritic cells of the peripheral
lymphoid tissue are vulnerable to infection, given their high expression of the prion
protein and inability to mount a defensive attack against the infectious particles
(Brown et al., 1999, Glatzel and Aguzzi, 2000). Infected cells not only harbour the toxic
PrPSc particles, which induce conversion of host cell PrPC peptides, but also migrate
into the CNS (Aucouturier et al., 2000, Aguzzi et al., 2003, Aucouturier and Carnaud,
2002, Rosicarelli et al., 2005). This mechanism is crucial for prion entry into the brain
following infection and is observed throughout the course of disease pathogenesis,
including in those animals inoculated intracerebrally (Aguzzi et al., 2003, Bradford and
Mabbott, 2012). The migration of these cells has been postulated as a potential route
of entry for therapeutics into the prion-infected brain, and may facilitate the entry of
our intranasally administered virus (Rosicarelli et al., 2005).
Our results suggest that the lentivirus administered intranasally into hemizygous mice
at early points during prion disease progression, may fail to traverse the nasal
epithelium and/or enter the brain due to the healthy state of neuron endings and
early infection of the immune system. At later time points these neurons may have
been sufficiently degenerated to facilitate penetrance of our lentiviral constructs. The
subsequent entry into the brain may have been enhanced by the migratory influx of
infected dendritic cells in the CNS. Despite expression of the GFP reporter within the
hippocampus and cortex, we failed to observe any substantial extension in survival or
a reduction in spongiosis in hemizygous mice treated with MW1 at a later time point,
suggesting Prnp was not appreciably knocked down. This most likely reflects the lower
concentration of lentivirus reaching these regions of the brain compared to that

182
achieved with the aid of stereotaxis. This is consistent with the low level of PRNP
knockdown seen in wild type mice administered the MW1.
Recently intranasal delivery has been extensively investigated due to the multitude of
advantages stated earlier, and has been used to convey drugs, plasmids and other
compounds to the CNS. Delivery of our lentivirus appeared to be incredibly variable,
and although we attempted to optimise the technique within this study, our results
indicate that further optimisation is still required to obtain a much greater degree of
consistency between experiments. Regardless, our results demonstrate much promise
for the technique as a viable alternative to more invasive methods. Unfortunately
given the time constraints of the project, it was not possible to further investigate this
technique.
5.5 Future work
Since starting this project almost four years ago, intranasal delivery has grown in
popularity, especially as a means of targeting the brain (Kulkarni et al., 2013). During
this time, we have endeavoured to integrate current findings and variations regarding
the technique into our research. In many cases such variations did not increase
delivery of our lentivirus to the CNS, or more specifically alter the prion disease
phenotype.
In order to optimise this technique, we must gain a greater understanding of the
various routes from the nasal cavity to the brain. Such knowledge could be achieved
by analysing GFP reporter levels in the olfactory and brainstem regions at various time
points following intranasal delivery. By assessing the speed at which the lentivirus
reaches these regions, we could deduce not only the principal route by which it travels
to the brain, but also the form of transport. For example intraneuronal transport is
believed to be much slower than passive diffusion along the connective tissue
ensheathed around the olfactory and trigeminal neurons, which in turn conveys
compounds at a much slower rate than the convective bulk flow along the fluid filled
perineural spaces that run parallel to these neurons (Thorne et al., 2004). By
establishing the predominant route of entry into the brain, it may be possible to
modify the technique to enhance transport along such route.
183
Upon reaching the brain, the olfactory immune system has been shown to hamper the
progress of viruses past the olfactory bulbs. Immunodeficient mice virally infected via
the nasal route display a much greater degree of infectivity (Reiss et al., 1998,
Huneycutt et al., 1993). Treatment with immunosuppressants prior to intranasal
delivery of our lentivirus may therefore significantly increase the spread from the
olfactory bulbs. Although use of immunosuppressant drugs has been shown to be
therapeutic in some prion mouse models, such treatment fails to alter disease
progression in animals inoculated intracerebrally with prion infected brain
homogenate, and thus no confounding affects should occur by this approach (Aguzzi,
2003, Aucouturier and Carnaud, 2002, Aguzzi and Sigurdson, 2004).
Despite our failed attempts to enhance intranasal delivery with the aid of compounds
including chitosan, rifampin and TMD, formulations of the intranasally administered
substances and delivery conditions are crucial in obtaining optimal uptake at the nasal
mucosa. A multitude of compounds have been demonstrated to enhance nasal
uptake, these include methylcellulose and poly (acrylic acid), emulsifying agents that,
like chitosan, increase the residence time of nasal administered compounds in the
nasal cavity, and in turn impede mucociliary clearance (Vyas et al., 2006, Dhuria et al.,
2010). Compounds such as cyclodextrins have also been shown to increase nasal
uptake by solubilising nasal membrane proteins and enhancing permeability (Shao et
al., 1992, Nonaka et al., 2008). In contrast, the vasoconstrictor phenylephrine, reduces
blood flow to the nasal mucosa, thus limiting absorption of intranasally administered
substances into systemic circulation (Dhuria et al., 2009). Other compounds have also
been shown to impede uptake at the brain, including isoflurane gas, the anaesthetic
used during the delivery of our lentivirus. Animals are reported to display a 25%
reduction in brain uptake while in the anesthetised state (Toyama et al., 2004). In
future experiments we could assess such variations, not only in formulation, but also
by our choice of anaesthetic.
Currently much of the work regarding intranasal delivery and genetic knockdown has
made use of siRNA. Although siRNA has a much more transient effect than shRNA,
several groups have administered covalently modified siRNA with improved stability
and knockdown duration into rodents via the nasal passage. For example, the work

184
conducted by Renner et al and Kim et al have both demonstrated the efficacy of
intranasal delivery of naked siRNA, with the latter study reporting 70% knockdown in
both the amygdala and hypothalamus 12 hours after administration (Kim et al., 2009a,
Renner et al., 2012). More recently, siRNA was found to form stable complexes with
copolymers of poly (ethylene glycol), poly (ɛ-caprolactone) and the cell-penetrating
peptide Tat (MPEG-PCL-Tat), derived from HIV-Tat. Uptake of siRNA at the nasal
mucosa was significantly enhanced owing to the unique penetrating capacity of the
Tat peptide (Kanazawa et al., 2013). In addition to siRNA, the MPEG-PCL-Tat
copolymers enhance uptake of plasmid DNA, drugs, and combinations of all three.
(Tanaka et al., 2010, Kanazawa et al., 2013). As such, a similar system may be utilised
to enhance delivery of our PRNP knockdown construct, though the size of the
lentivirus may hinder formation of the complexes.
One of the main issues arising from our study was the diffuse expression of our
intranasally administered shRNA compared to results obtained with the more targeted
stereotaxic approach. This wider expression likely brought about a low copy number
integration, mirrored by a lower expression of the shRNA. This may have produced an
insufficient level of knockdown to elicit significant changes in our behavioural and
analytical metrics. Although increased doses of our lentivirus would increase
knockdown, it would not be financially feasible given the expense of generating
sufficient lentivirus particles. A cheaper alternative is the use of siRNA, which, as
stated above can yield robust knockdown (Renner et al., 2012, Kim et al., 2009a).
Although siRNA produces a transient knockdown effect, typically lasting only a few
days, chemical and covalent modifications, such as those seen in Dharmacon siSTABLE
constructs, can greatly enhance the stability and duration of the knockdown (Rao et
al., 2009, Renner et al., 2012). Furthermore, siRNA can be administered intranasally in
conjunction with the MPEG-PCL-Tat copolymers system mentioned above. Such work
has been conducted in rats with malignant glioma, whereby siRNA against the
oncogene Raf-1 was administered intranasally daily for one week, and thereby
increased in survival by almost 50% (Kanazawa et al., 2014). In light of these results,
daily doses of siRNA against the PRNP gene in our transgenic prion lines could

185
represent an easy and cost effective method of achieving sufficient knockdown to
alter disease progression.

186
Chapter 6
Concluding Remarks
During my doctoral research, I have worked to validate and characterise nine mRNA
splicing genes, previously shown to suppress mutant HTT in a yeast genetic modifier
screen. After generating overexpression constructs for each of these gene, I stably
transfected the constructs into our mammalian PC12 cell line. Subsequent cytotoxicity
assays revealed five of these candidate genes (CRNKL, EFTUD2, HNRNPF, HNRNPK and
TARDDP) to be protective when expressed alongside mutant HTT. Two of the gene hits
did not alter toxicity (HNRNPQ and SNRNB), while overexpression of the remaining
candidate genes exacerbated toxicity (HNRNPU and SFRS3).
The five protective genes were further investigated in order to determine the
mechanisms by which they suppress mutant HTT phenotypes. The suppressors were
found to modulate aggregation dynamics – while overexpression of HNRNPF, HNRNPK
and TARDDP acceleration aggregation, overexpression of CRNKL and EFTUD2 reduced
aggregation. Such changes in aggregation were mirrored by changes in mutant HTT
expression. It is feasible that overexpression of our candidate genes may alter global
transcription, mRNA stability or simply transcription from our inducible system,
though further investigation is required.
In addition to aggregation, I examined the role of mRNA splicing as a possible
mechanism to account for the protection observed in our mammalian cells. Although
it appeared that this post transcriptional process played no role in the protection
conveyed by our candidate genes, our splicing efficiency assay uncovered a polyQ
length dependent splicing defect - a result consistent with emerging research
implicating such defect in HD pathogenesis.
The more promising candidates were further interrogated in C. elegans models of HD.
RNAi mediated knockdown of our suppressor genes in nematodes failed to alter
mutant HTT induced behavioural phenotypes, though knockdown of CRNKL was
found to be lethal.

187
Ultimately I aimed to overexpress the most promising candidate genes in the brain of
HD mouse models via a lentiviral expression system, unfortunately this was not
possible due to time constraints. However, while characterising our HD knock-in
model mice, we identified a burrowing defect that manifested much earlier than
impairments on the more conventional rota-rod assay. As such, the burrowing
phenotype could be a robust and simple test in the study of HD in mice models.
Finally I explored an alternative, non-stereotactic method of administering lentiviruses
to the murine brain. To this end, I employed an intranasal method, in which the
viruses are delivered to the nasal mucosa, and travel in a retrograde manner within or
alongside the trigeminal and olfactory nerves, ultimately entering the brain via the
brainstem and olfactory bulbs respectively. I performed this work using a well-
established prion disease paradigm of neurodegeneration. This study made use of a
lentivirus to knockdown the PRP gene, an effect previously shown to stave, and to
some extent, reverse progression of prion disease. Although our results were more
variable compared to the stereotactic injection of the lentivirus, we showed
unequivocally that the virus had indeed reached the brain with the aid of a GFP
reporter. Interestingly, the results appeared to be dependent on the stage of prion
disease. Although these results were promising, further optimisation is required to
determine whether intranasal delivery could be a viable alternative to stereotactic
injection.
In summation, my work has provided insight into the modulatory potential of splicing
factors in HD, and thus contributing to the growing body of research linking splicing
and the pathogenesis of this devastating disorder.

188
References
ACHARYA, K. K., GOVIND, C. K., SHORE, A. N., STOLER, M. H. & REDDI, P. P. 2006. < i> cis</i>-Requirement for the maintenance of round spermatid-specific transcription. Developmental Biology, 295, 781-790.
AGGER, K., CLOOS, P. A. C., CHRISTENSEN, J., PASINI, D., ROSE, S., RAPPSILBER, J., ISSAEVA, I., CANAANI, E., SALCINI, A. E. & HELIN, K. 2007. UTX and JMJD3 are histone H3K27 demethylases involved in HOX gene regulation and development. Nature, 449, 731-U10.
AGUZZI, A. 2003. Prions and the immune system: a journey through gut, spleen, and nerves. Advances in immunology, 81, 123-171.
AGUZZI, A., HEPPNER, F. L., HEIKENWALDER, M., PRINZ, M., MERTZ, K., SEEGER, H. & GLATZEL, M. 2003. Immune system and peripheral nerves in propagation of prions to CNS. British medical bulletin, 66, 141-159.
AGUZZI, A. & SIGURDSON, C. J. 2004. Antiprion immunotherapy: to suppress or to stimulate? Nature Reviews Immunology, 4, 725-736.
ALAM, M. I., BEG, S., SAMAD, A., BABOOTA, S., KOHLI, K., ALI, J., AHUJA, A. & AKBAR, M. 2010. Strategy for effective brain drug delivery. European Journal of Pharmaceutical Sciences, 40, 385-403.
ALKAN, S., MARTINCIC, K. & MILCAREK, C. 2006. The hnRNPs F and H2 bind to similar sequences to influence gene expression. Biochem. J, 393, 361-371.
AMADA, N., TEZUKA, T., MAYEDA, A., ARAKI, K., TAKEI, N., TODOKORO, K. & NAWA, H. 2003. A novel rat orthologue and homologue for the Drosophila crooked neck gene in neural stem cells and their immediate descendants. Journal of Biochemistry, 133, 615-623.
ANCKAR, J. & SISTONEN, L. 2011. Regulation of HSF1 Function in the Heat Stress Response: Implications in Aging and Disease. In: KORNBERG, R. D., RAETZ, C. R. H., ROTHMAN, J. E. & THORNER, J. W. (eds.) Annual Review of Biochemistry, Vol 80. Palo Alto: Annual Reviews.
ANTON, F. & PEPPEL, P. 1991. CENTRAL PROJECTIONS OF TRIGEMINAL PRIMARY AFFERENTS INNERVATING THE NASAL-MUCOSA - A HORSERADISH-PEROXIDASE STUDY IN THE RAT. Neuroscience, 41, 617-628.
APOSTOL, B. L., ILLES, K., PALLOS, J., BODAI, L., WU, J., STRAND, A., SCHWEITZER, E. S., OLSON, J. M., KAZANTSEV, A., MARSH, J. L. & THOMPSON, L. M. 2006. Mutant huntingtin alters MAPK signaling pathways in PC12 and striatal cells: ERK1/2 protects against mutant huntingtin-associated toxicity. Human Molecular Genetics, 15, 273-285.
APOSTOL, B. L., KAZANTSEV, A., RAFFIONI, S., ILLES, K., PALLOS, J., BODAI, L., SLEPKO, N., BEAR, J. E., GERTLER, F. B., HERSCH, S., HOUSMAN, D. E., MARSH, J. L. & THOMPSON, L. M. 2003. A cell-based assay for aggregation inhibitors as therapeutics of polyglutamine-repeat disease and validation in Drosophila. Proceedings of the National Academy of Sciences of the United States of America, 100, 5950-5955.
ARNOLD, J., AHSAN, F., MEEZAN, E. & PILLION, D. J. 2002. Nasal administration of low molecular weight heparin. Journal of Pharmaceutical Sciences, 91, 1707-1714.
ARNOLD, J. J., AHSAN, F., MEEZAN, E. & PILLION, D. J. 2004. Correlation of tetradecylmaltoside induced increases in nasal peptide drug delivery with morphological changes in nasal epithelial cells. Journal of Pharmaceutical Sciences, 93, 2205-2213.
ARRASATE, M., MITRA, S., SCHWEITZER, E. S., SEGAL, M. R. & FINKBEINER, S. 2004. Inclusion body formation reduces levels of mutant huntingtin and the risk of neuronal death. Nature, 431, 805-810.
ASH, P. E., ZHANG, Y.-J., ROBERTS, C. M., SALDI, T., HUTTER, H., BURATTI, E., PETRUCELLI, L. & LINK, C. D. 2010. Neurotoxic effects of TDP-43 overexpression in C. elegans. Human Molecular Genetics, 19, 3206-3218.
189
ATWAL, R. S., DESMOND, C. R., CARON, N., MAIURI, T., XIA, J. R., SIPIONE, S. & TRUANT, R. 2011. Kinase inhibitors modulate huntingtin cell localization and toxicity. Nature Chemical Biology, 7, 453-460.
ATWAL, R. S., XIA, J., PINCHEV, D., TAYLOR, J., EPAND, R. M. & TRUANT, R. 2007. Huntingtin has a membrane association signal that can modulate huntingtin aggregation, nuclear entry and toxicity. Human Molecular Genetics, 16, 2600-2615.
AUCOUTURIER, P. & CARNAUD, C. 2002. The immune system and prion diseases: a relationship of complicity and blindness. Journal of leukocyte biology, 72, 1075-1083.
AUCOUTURIER, P., CARP, R. I., CARNAUD, C. & WISNIEWSKI, T. 2000. Prion diseases and the immune system. Clinical Immunology, 96, 79-85.
AUERBACH, W., HURLBERT, M. S., HILDITCH-MAGUIRE, P., WADGHIRI, Y. Z., WHEELER, V. C., COHEN, S. I., JOYNER, A. L., MACDONALD, M. E. & TURNBULL, D. H. 2001. The HD mutation causes progressive lethal neurological disease in mice expressing reduced levels of huntingtin. Human Molecular Genetics, 10, 2515-2523.
AZZOUZ, M. 2006. Gene Therapy for ALS: progress and prospects. Biochimica et Biophysica Acta (BBA)-Molecular Basis of Disease, 1762, 1122-1127.
AZZOUZ, M., MARTIN-RENDON, E., BARBER, R. D., MITROPHANOUS, K. A., CARTER, E. E., ROHLL, J. B., KINGSMAN, S. M., KINGSMAN, A. J. & MAZARAKIS, N. D. 2002. Multicistronic lentiviral vector-mediated striatal gene transfer of aromatic L-amino acid decarboxylase, tyrosine hydroxylase, and GTP cyclohydrolase I induces sustained transgene expression, dopamine production, and functional improvement in a rat model of Parkinson's disease. Journal of Neuroscience, 22, 10302-10312.
BAKER, H. & SPENCER, R. F. 1986. TRANS-NEURONAL TRANSPORT OF PEROXIDASE-CONJUGATED WHEAT-GERM-AGGLUTININ (WGA-HRP) FROM THE OLFACTORY EPITHELIUM TO THE BRAIN OF THE ADULT-RAT. Experimental Brain Research, 63, 461-473.
BANNAI, H., FUKATSU, K., MIZUTANI, A., NATSUME, T., IEMURA, S., IKEGAMI, T., INOUIE, T. & MIKOSHIBA, K. 2004. An RNA-interacting protein, SYNCRIP (heterogeneous nuclear ribonuclear protein Q1/NSAP1) is a component of mRNA granule transported with inositol 1,4,5-trisphosphate receptor type 1 mRNA in neuronal dendrites. Journal of Biological Chemistry, 279, 53427-53434.
BARGMANN, C. I. & HORVITZ, H. R. 1991. CHEMOSENSORY NEURONS WITH OVERLAPPING FUNCTIONS DIRECT CHEMOTAXIS TO MULTIPLE CHEMICALS IN C-ELEGANS. Neuron, 7, 729-742.
BARTELS, C., KLATT, C., LUHRMANN, R. & FABRIZIO, P. 2002. The ribosomal translocase homologue Snu114p is involved in unwinding U4/U6 RNA during activation of the spliceosome. EMBO Reports, 3, 875-880.
BENEDICT, C., HALLSCHMID, M., HATKE, A., SCHULTES, B., FEHM, H. L., BORN, J. & KERN, W. 2004. Intranasal insulin improves memory in humans. Psychoneuroendocrinology, 29, 1326-1334.
BENNETT, M. J., SAWAYA, M. R. & EISENBERG, D. 2006. Deposition diseases and 3D domain swapping. Structure, 14, 811-824.
BERGET, S. M. 1995. EXON RECOGNITION IN VERTEBRATE SPLICING. Journal of Biological Chemistry, 270, 2411-2414.
BESSEN, R. A., SHEARIN, H., MARTINKA, S., BOHARSKI, R., LOWE, D., WILHAM, J. M., CAUGHEY, B. & WILEY, J. A. 2010. Prion shedding from olfactory neurons into nasal secretions. PLoS pathogens, 6, e1000837.
BIRMAN, S. 2008. Neurodegeneration: RNA turns number one suspect in polyglutamine diseases. Current Biology, 18, R659-R661.
BIRNBOIM, H. C. & DOLY, J. 1979. RAPID ALKALINE EXTRACTION PROCEDURE FOR SCREENING RECOMBINANT PLASMID DNA. Nucleic Acids Research, 7, 1513-1523.

190
BOCHAROVA, N., CHAVE-COX, R., SOKOLOV, S., KNORRE, D. & SEVERIN, F. 2009. Protein aggregation and neurodegeneration: Clues from a yeast model of Huntington's disease. Biochemistry-Moscow, 74, 231-234.
BODNER, R. A., OUTEIRO, T. F., ALTMANN, S., MAXWELL, M. M., CHO, S. H., HYMAN, B. T., MCLEAN, P. J., YOUNG, A. B., HOUSMAN, D. E. & KAZANTSEV, A. G. 2006. Pharmacological promotion of inclusion formation: A therapeutic approach for Huntington's and Parkinson's diseases. Proceedings of the National Academy of Sciences of the United States of America, 103, 4246-4251.
BOLIVAR, V. J., MANLEY, K. & MESSER, A. 2004. Early exploratory behavior abnormalities in R6/1 Huntington's disease transgenic mice. Brain Research, 1005, 29-35.
BOMSZTYK, K., DENISENKO, O. & OSTROWSKI, J. 2004. HnRNP K: One protein multiple processes. Bioessays, 26, 629-638.
BOSE, J. K., WANG, I. F., HUNG, L., TARN, W. Y. & SHEN, C. K. J. 2008. TDP-43 Overexpression Enhances Exon 7 Inclusion during the Survival of Motor Neuron Pre-mRNA Splicing. Journal of Biological Chemistry, 283, 28852-28859.
BOSSY-WETZEL, E., SCHWARZENBACHER, R. & LIPTON, S. A. 2004. Molecular pathways to neurodegeneration. Nature Medicine, 10, S2-S9.
BRADBURY, M. W. B., CSERR, H. F. & WESTROP, R. J. 1981. DRAINAGE OF CEREBRAL INTERSTITIAL FLUID INTO DEEP CERVICAL LYMPH OF THE RABBIT. American Journal of Physiology, 240, F329-F336.
BRADFORD, B. M. & MABBOTT, N. A. 2012. Prion disease and the innate immune system. Viruses, 4, 3389-3419.
BRENNER, S. 1974. GENETICS OF CAENORHABDITIS-ELEGANS. Genetics, 77, 71-94. BRIGNULL, H. R., MORLEY, J. F., GARCIA, S. M. & MORIMOTO, R. I. 2006. Modeling polyglutamine
pathogenesis in C-elegans. In: KHETERPAL, I. & WETZEL, R. (eds.) Amyloid, Prions, and Other Protein Aggregates, Pt B. San Diego: Elsevier Academic Press Inc.
BROADWELL, R. D. & BALIN, B. J. 1985. ENDOCYTIC AND EXOCYTIC PATHWAYS OF THE NEURONAL SECRETORY PROCESS AND TRANSSYNAPTIC TRANSFER OF WHEAT-GERM AGGLUTININ-HORSERADISH PEROXIDASE INVIVO. Journal of Comparative Neurology, 242, 632-650.
BROOKS, S., HIGGS, G., JONES, L. & DUNNETT, S. B. 2012. Longitudinal analysis of the behavioural phenotype in Hdh((CAG)150) Huntington's disease knock-in mice. Brain Research Bulletin, 88, 182-188.
BROOKS, S. P. & DUNNETT, S. B. 2009. Tests to assess motor phenotype in mice: a user's guide. Nature Reviews Neuroscience, 10, 519-529.
BROWN, K., STEWART, K., RITCHIE, D., MABBOTT, N., WILLIAMS, A., FRASER, H., MORRISON, W. & BRUCE, M. 1999. Scrapie replication in lymphoid tissues depends on prion protein-expressing follicular dendritic cells. Nature Medicine, 5, 1308-1312.
BUCHNER, K., SEITZTUTTER, D., SCHONITZER, K. & WEISS, D. G. 1987. A QUANTITATIVE STUDY OF ANTEROGRADE AND RETROGRADE AXONAL-TRANSPORT OF EXOGENOUS PROTEINS IN OLFACTORY NERVE C-FIBERS. Neuroscience, 22, 697-707.
BÜELER, H., AGUZZI, A., SAILER, A., GREINER, R.-A., AUTENRIED, P., AGUET, M. & WEISSMANN, C. 1993. Mice devoid of PrP are resistant to scrapie. Cell, 73, 1339-1347.
BUGG, C. W., ISAS, J. M., FISCHER, T., PATTERSON, P. H. & LANGEN, R. 2012. Structural Features and Domain Organization of Huntingtin Fibrils. Journal of Biological Chemistry, 287, 31739-31746.
BURATTI, E. & BARALLE, F. E. 2011. TDP-43: new aspects of autoregulation mechanisms in RNA binding proteins and their connection with human disease. Febs Journal, 278, 3530-3538.
BURKE, K. A., GODBEY, J. & LEGLEITER, J. 2011. Assessing mutant huntingtin fragment and polyglutamine aggregation by atomic force microscopy. Methods, 53, 275-284.
191
BURKE, K. A., KAUFFMAN, K. J., UMBAUGH, C. S., FREY, S. L. & LEGLEITER, J. 2013. The Interaction of Polyglutamine Peptides with Lipid Membranes Is Regulated by Flanking Sequences Associated with Huntingtin. Journal of Biological Chemistry, 288, 14993-15005.
BUSCH, A. & HERTEL, K. J. 2012. Evolution of SR protein and hnRNP splicing regulatory factors. Wiley Interdisciplinary Reviews-Rna, 3, 1-12.
CACERES, J. F. & KORNBLIHTT, A. R. 2002. Alternative splicing: multiple control mechanisms and involvement in human disease. Trends in Genetics, 18, 186-193.
CACERES, J. F., SCREATON, G. R. & KRAINER, A. R. 1998. A specific subset of SR proteins shuttles continuously between the nucleus and the cytoplasm. Genes & Development, 12, 55-66.
CAMPESAN, S., GREEN, E. W., BREDA, C., SATHYASAIKUMAR, K. V., MUCHOWSKI, P. J., SCHWARCZ, R., KYRIACOU, C. P. & GIORGINI, F. 2011. The Kynurenine Pathway Modulates Neurodegeneration in a Drosophila Model of Huntington's Disease. Current Biology, 21, 961-966.
CARON, N. S., DESMOND, C. R., XIA, J. R. & TRUANT, R. 2013. Polyglutamine domain flexibility mediates the proximity between flanking sequences in huntingtin. Proceedings of the National Academy of Sciences of the United States of America, 110, 14610-14615.
CARPENTER, B., MCKAY, M., DUNDAS, S. R., LAWRIE, L. C., TELFER, C. & MURRAY, G. I. 2006. Heterogeneous nuclear ribonucleoprotein K is over expressed, aberrantly localised and is associated with poor prognosis in colorectal cancer. British Journal of Cancer, 95, 921-927.
CARTER, R. J., LIONE, L. A., HUMBY, T., MANGIARINI, L., MAHAL, A., BATES, G. P., DUNNETT, S. B. & MORTON, A. J. 1999. Characterization of progressive motor deficits in mice transgenic for the human Huntington’s disease mutation. The Journal of neuroscience, 19, 3248-3257.
CASSADA, R. C. & RUSSELL, R. L. 1975. DAUERLARVA, A POST-EMBRYONIC DEVELOPMENTAL VARIANT OF NEMATODE CAENORHABDITIS-ELEGANS. Developmental Biology, 46, 326-342.
CATTANEO, E., ZUCCATO, C. & TARTARI, M. 2005. Normal huntingtin function: An alternative approach to Huntington's disease. Nature Reviews Neuroscience, 6, 919-930.
CAUDY, A. A., KETTING, R. F., HAMMOND, S. M., DENLI, A. M., BATHOORN, A. M. P., TOPS, B. B. J., SILVA, J. M., MYERS, M. M., HANNON, G. J. & PLASTERK, R. H. A. 2003. A micrococcal nuclease homologue in RNAi effector complexes. Nature, 425, 411-414.
CHA, J.-H. J. 2007. Transcriptional signatures in Huntington's disease. Progress in Neurobiology, 83, 228-248.
CHANDLER, R. 1961. Encephalopathy in mice produced by inoculation with scrapie brain material. The Lancet, 277, 1378-1379.
CHATTERJEE, N. & SINHA, S. 2008. Understanding the mind of a worm: hierarchical network structure underlying nervous system function in C. elegans. In: BANERJEE, R. & CHAKRABARTI, B. K. (eds.) Models of Brain and Mind: Physical, Computational and Psychological Approaches. Amsterdam: Elsevier Science Bv.
CHELLGREN, B. W., MILLER, A. F. & CREAMER, T. P. 2006. Evidence for polyproline II helical structure in short polyglutamine tracts. Journal of Molecular Biology, 361, 362-371.
CHEN, H. H., CHANG, J. G., LU, R. M., PENG, T. Y. & TARN, W. Y. 2008. The RNA Binding Protein hnRNP Q Modulates the Utilization of Exon 7 in the Survival Motor Neuron 2 (SMN2) Gene. Molecular and Cellular Biology, 28, 6929-6938.
CHEN, H. H., YU, H. I., CHIANG, W. C., LIN, Y. D., SHIA, B. C. & TARN, W. Y. 2012. hnRNP Q Regulates Cdc42-Mediated Neuronal Morphogenesis. Molecular and Cellular Biology, 32, 2224-2238.
CHOMCZYNSKI, P. & SACCHI, N. 1987. SINGLE-STEP METHOD OF RNA ISOLATION BY ACID GUANIDINIUM THIOCYANATE PHENOL CHLOROFORM EXTRACTION. Analytical Biochemistry, 162, 156-159.
CHUNG, S. Y., MCLEAN, M. R. & RYMOND, B. C. 1999. Yeast ortholog of the Drosophila crooked neck protein promotes spliceosome assembly through stable U4/U6.U5 snRNP addition. Rna-a Publication of the Rna Society, 5, 1042-1054.
192
CHUNG, S. Y., ZHOU, Z. L., HUDDLESTON, K. A., HARRISON, D. A., REED, R., COLEMAN, T. A. & RYMOND, B. C. 2002. Crooked neck is a component implicated in the of the human spliceosome and splicing process. Biochimica Et Biophysica Acta-Gene Structure and Expression, 1576, 287-297.
CONSORTIUM, C. E. S. 1998. Genome sequence of the nematode C-elegans: A platform for investigating biology. Science, 282, 2012-2018.
COOPER, T. A., WAN, L. & DREYFUSS, G. 2009. RNA and disease. Cell, 136, 777-793. CORONA, C., PORCARIO, C., MARTUCCI, F., IULINI, B., MANEA, B., GALLO, M., PALMITESSA, C.,
MAURELLA, C., MAZZA, M. & PEZZOLATO, M. 2009. Olfactory system involvement in natural scrapie disease. Journal of virology, 83, 3657-3667.
COSTANTINI, L. C., BAKOWSKA, J. C., BREAKEFIELD, X. O. & ISACSON, O. 2000. Gene therapy in the CNS. Gene Therapy, 7, 93-109.
CRAMER, P., PESCE, C. G., BARALLE, F. E. & KORNBLIHTT, A. R. 1997. Functional association between promoter structure and transcript alternative splicing. Proceedings of the National Academy of Sciences of the United States of America, 94, 11456-11460.
CRICK, S. L., JAYARAMAN, M., FRIEDEN, C., WETZEL, R. & PAPPU, R. V. 2006. Fluorescence correlation spectroscopy shows that monomeric polyglutamine molecules form collapsed structures in aqueous solutions. Proceedings of the National Academy of Sciences of the United States of America, 103, 16764-16769.
CROOK, Z. R. & HOUSMAN, D. 2011. Huntington's disease: can mice lead the way to treatment? Neuron, 69, 423-435.
DARNELL, G. D., DERRYBERRY, J., KURUTZ, J. W. & MEREDITH, S. C. 2009. Mechanism of Cis-Inhibition of PolyQ Fibrillation by PolyP: PPII Oligomers and the Hydrophobic Effect. Biophysical Journal, 97, 2295-2305.
DE ALMEIDA, L. P., ZALA, D., AEBISCHER, P. & DEGLON, N. 2001. Neuroprotective effect of a CNTF-expressing lentiviral vector in the quinolinic acid rat model of Huntington's disease. Neurobiology of Disease, 8, 433-446.
DE BONO, M., TOBIN, D. M., DAVIS, M. W., AVERY, L. & BARGMANN, C. I. 2002. Social feeding in Caenorhabditis elegans is induced by neurons that detect aversive stimuli. Nature, 419, 899-903.
DEACON, R. M. 2006. Burrowing in rodents: a sensitive method for detecting behavioral dysfunction. Nature Protocols, 1, 118-121.
DEACON, R. M., CROUCHER, A. & RAWLINS, J. N. P. 2002. Hippocampal cytotoxic lesion effects on species-typical behaviours in mice. Behavioural brain research, 132, 203-213.
DEACON, R. M., RALEY, J. M., PERRY, V. H. & RAWLINS, J. N. P. 2001. Burrowing into prion disease. Neuroreport, 12, 2053-2057.
DEHAY, B. & BERTOLOTTI, A. 2006. Critical role of the proline-rich region in Huntingtin for aggregation and cytotoxicity in yeast. Journal of Biological Chemistry, 281, 35608-35615.
DEJOIA, C., MOREAUX, B., O'CONNELL, K. & BESSEN, R. A. 2006. Prion infection of oral and nasal mucosa. Journal of virology, 80, 4546-4556.
DHURIA, S. V., HANSON, L. R. & FREY, W. H. 2009. Novel Vasoconstrictor Formulation to Enhance Intranasal Targeting of Neuropeptide Therapeutics to the Central Nervous System. Journal of Pharmacology and Experimental Therapeutics, 328, 312-320.
DHURIA, S. V., HANSON, L. R. & FREY, W. H. 2010. Intranasal Delivery to the Central Nervous System: Mechanisms and Experimental Considerations. Journal of Pharmaceutical Sciences, 99, 1654-1673.
DLUGOSZ, M. & TRYLSKA, J. 2011. Secondary Structures of Native and Pathogenic Huntingtin N-Terminal Fragments. Journal of Physical Chemistry B, 115, 11597-11608.
DOI, H., OKAMURA, K., BAUER, P. O., FURUKAWA, Y., SHIMIZU, H., KUROSAWA, M., MACHIDA, Y., MIYAZAKI, H., MITSUI, K. & KUROIWA, Y. 2008. RNA-binding protein TLS is a major nuclear
193
aggregate-interacting protein in huntingtin exon 1 with expanded polyglutamine-expressing cells. Journal of Biological Chemistry, 283, 6489-6500.
DRAGATSIS, I., LEVINE, M. S. & ZEITLIN, S. 2000. Inactivation of Hdh in the brain and testis results in progressive neurodegeneration and sterility in mice. Nature Genetics, 26, 300-306.
DRAGILEVA, E., HENDRICKS, A., TEED, A., GILLIS, T., LOPEZ, E. T., FRIEDBERG, E. C., KUCHERLAPATI, R., EDELMANN, W., LUNETTA, K. L. & MACDONALD, M. E. 2009. Intergenerational and striatal CAG repeat instability in Huntington's disease knock-in mice involve different DNA repair genes. Neurobiology of Disease, 33, 37-47.
DREDGE, B. K., POLYDORIDES, A. D. & DARNELL, R. B. 2001. The splice of life: Alternative splicing and neurological disease. Nature Reviews Neuroscience, 2, 43-50.
DUFES, C., OLIVIER, J.-C., GAILLARD, F., GAILLARD, A., COUET, W. & MULLER, J.-M. 2003. Brain delivery of vasoactive intestinal peptide (VIP) following nasal administration to rats. International Journal of Pharmaceutics, 255, 87-97.
DUGAICZYK, A., BOYER, H. W. & GOODMAN, H. M. 1975. LIGATION OF ECORI ENDONUCLEASE-GENERATED DNA FRAGMENTS INTO LINEAR AND CIRCULAR STRUCTURES. Journal of Molecular Biology, 96, 171-&.
DUJON, B. 1996. The yeast genome project: what did we learn? Trends in Genetics, 12, 263-270. DUNAH, A. W., JEONG, H., GRIFFIN, A., KIM, Y. M., STANDAERT, D. G., HERSCH, S. M., MOURADIAN,
M. M., YOUNG, A. B., TANESE, N. & KRAINC, D. 2002. Sp1 and TAFII130 transcriptional activity disrupted in early Huntington's disease. Science, 296, 2238-2243.
DUNHAM, N. & MIYA, T. 1957. A note on a simple apparatus for detecting neurological deficit in rats and mice. Journal of the American Pharmaceutical Association, 46, 208-209.
DUNING, K., BUCK, F., BAMEKOW, A. & KREMERSKOTHEN, J. 2008. SYNCRIP, a component of dendritically localized mRNPs, binds to the translation regulator BC200 RNA. Journal of Neurochemistry, 105, 351-359.
DUYAO, M., AMBROSE, C., MYERS, R., NOVELLETTO, A., PERSICHETTI, F., FRONTALI, M., FOLSTEIN, S., ROSS, C., FRANZ, M., ABBOTT, M., GRAY, J., CONNEALLY, P., YOUNG, A., PENNEY, J., HOLLINGSWORTH, Z., SHOULSON, I., LAZZARINI, A., FALEK, A., KOROSHETZ, W., SAX, D., BIRD, E., VONSATTEL, J., BONILLA, E., ALVIR, J., CONDE, J. B., CHA, J. H., DURE, L., GOMEZ, F., RAMOS, M., SANCHEZRAMOS, J., SNODGRASS, S., DEYOUNG, M., WEXLER, N., MOSCOWITZ, C., PENCHASZADEH, G., MACFARLANE, H., ANDERSON, M., JENKINS, B., SRINIDHI, J., BARNES, G., GUSELLA, J. & MACDONALD, M. 1993. TRINUCLEOTIDE REPEAT LENGTH INSTABILITY AND AGE-OF-ONSET IN HUNTINGTONS-DISEASE. Nature Genetics, 4, 387-392.
DUYAO, M. P., AUERBACH, A. B., RYAN, A., PERSICHETTI, F., BARNES, G. T., MCNEIL, S. M., GE, P., VONSATTEL, J.-P., GUSELLA, J. F. & JOYNER, A. L. 1995. Inactivation of the mouse Huntington's disease gene homolog Hdh. Science, 269, 407-410.
EDENFELD, G., VOLOHONSKY, G., KRUKKERT, K., NAFFIN, E., LAMMEL, U., GRIMM, A., ENGELEN, D., REUVENY, A., VOLK, T. & KLAMBT, C. 2006. The splicing factor crooked neck associates with the RNA-binding protein HOW to control glial cell maturation in Drosophila. Neuron, 52, 969-980.
EHRNHOEFER, D. E., DUENNWALD, M., MARKOVIC, P., WACKER, J. L., ENGEMANN, S., ROARK, M., LEGLEITER, J., MARSH, J. L., THOMPSON, L. M., LINDQUIST, S., MUCHOWSKI, P. J. & WANKER, E. E. 2006. Green tea (-)-epigallocatechin-gallate modulates early events in huntingtin misfolding and reduces toxicity in Huntington's disease models. Human Molecular Genetics, 15, 2743-2751.
EIDELBERG, D. & SURMEIER, D. J. Brain networks in Huntington disease. Journal of Clinical Investigation, 121, 484-492.
FABER, P. W., ALTER, J. R., MACDONALD, M. E. & HART, A. C. 1999. Polyglutamine-mediated dysfunction and apoptotic death of a Caenorhabditis elegans sensory neuron. Proceedings of the National Academy of Sciences of the United States of America, 96, 179-184.

194
FABER, P. W., VOISINE, C., KING, D. C., BATES, E. A. & HART, A. C. 2002. Glutamine/proline-rich PQE-1 proteins protect Caenorhabditis elegans neurons from huntingtin polyglutamine neurotoxicity. Proceedings of the National Academy of Sciences of the United States of America, 99, 17131-17136.
FABRIZIO, P., LAGGERBAUER, B., LAUBER, J., LANE, W. S. & LUHRMANN, R. 1997. An evolutionarily conserved U5 snRNP-specific protein is a GTP-binding factor closely related to the ribosomal translocase EF-2. Embo Journal, 16, 4092-4106.
FERNANDES, H. B., BAIMBRIDGE, K. G., CHURCH, J., HAYDEN, M. R. & RAYMOND, L. A. 2007. Mitochondrial sensitivity and altered calcium handling underlie enhanced NMDA-induced apoptosis in YAC128 model of Huntington's disease. The Journal of neuroscience, 27, 13614-13623.
FERNANDEZ-FUNEZ, P., NINO-ROSALES, M. L., DE GOUYON, B., SHE, W. C., LUCHAK, J. M., MARTINEZ, P., TURIEGANO, E., BENITO, J., CAPOVILLA, M., SKINNER, P. J., MCCALL, A., CANAL, I., ORR, H. T., ZOGHBI, H. Y. & BOTAS, J. 2000. Identification of genes that modify ataxin-1-induced neurodegeneration. Nature, 408, 101-106.
FERRANTE, R. J. 2009. Mouse models of Huntington's disease and methodological considerations for therapeutic trials. Biochimica et Biophysica Acta (BBA)-Molecular Basis of Disease, 1792, 506-520.
FIRE, A., ALBERTSON, D., HARRISON, S. W. & MOERMAN, D. G. 1991. PRODUCTION OF ANTISENSE RNA LEADS TO EFFECTIVE AND SPECIFIC-INHIBITION OF GENE-EXPRESSION IN C-ELEGANS MUSCLE. Development, 113, 503-514.
FIRE, A., XU, S. Q., MONTGOMERY, M. K., KOSTAS, S. A., DRIVER, S. E. & MELLO, C. C. 1998. Potent and specific genetic interference by double-stranded RNA in Caenorhabditis elegans. Nature, 391, 806-811.
FITZPATRICK, M. J. & SOKOLOWSKI, M. B. 2004. In search of food: Exploring the evolutionary link between cGMP-dependent protein kinase (PKG) and behaviour. Integrative and Comparative Biology, 44, 28-36.
FORMAN, M. S., TROJANOWSKI, J. Q. & LEE, V. M. 2004. Neurodegenerative diseases: a decade of discoveries paves the way for therapeutic breakthroughs. Nature Medicine, 10, 1055-1063.
FRASER, A. G., KAMATH, R. S., ZIPPERLEN, P., MARTINEZ-CAMPOS, M., SOHRMANN, M. & AHRINGER, J. 2000. Functional genomic analysis of C-elegans chromosome I by systematic RNA interference. Nature, 408, 325-330.
FRAZER, L. N., LOVELL, S. C. & O'KEEFE, R. T. 2009. Analysis of Synthetic Lethality Reveals Genetic Interactions Between the GTPase Snu114p and snRNAs in the Catalytic Core of the Saccharomyces cerevisiae Spliceosome. Genetics, 183, 497-515.
FREIBAUM, B. D., CHITTA, R. K., HIGH, A. A. & TAYLOR, J. P. 2010. Global Analysis of TDP-43 Interacting Proteins Reveals Strong Association with RNA Splicing and Translation Machinery. Journal of Proteome Research, 9, 1104-1120.
FUENTEALBA, R. A., UDAN, M., BELL, S., WEGORZEWSKA, I., SHAO, J., DIAMOND, M. I., WEIHL, C. C. & BALOH, R. H. 2010. Interaction with Polyglutamine Aggregates Reveals a Q/N-rich Domain in TDP-43. Journal of Biological Chemistry, 285, 26304-26314.
FUJIKAKE, N., NAGAI, Y., POPIEL, H. A., OKAMOTO, Y., YAMAGUCHI, M. & TODA, T. 2008. Heat shock transcription factor 1-activating compounds suppress polyglutamine-induced neurodegeneration through induction of multiple molecular chaperones. Journal of Biological Chemistry, 283, 26188-26197.
FUJIWARA, M., SENGUPTA, P. & MCINTIRE, S. L. 2002. Regulation of body size and behavioral state of C-elegans by sensory perception and the EGL-4 cGMP-dependent protein kinase. Neuron, 36, 1091-1102.
GAFNI, J. & ELLERBY, L. M. 2002. Calpain activation in Huntington's disease. Journal of Neuroscience, 22, 4842-4849.

195
GAFNI, J., HERMEL, E., YOUNG, J. E., WELLINGTON, C. L., HAYDEN, M. R. & ELLERBY, L. M. 2004. Inhibition of calpain cleavage of huntingtin reduces toxicity - Accumulation of calpain/caspase fragments in the nucleus. Journal of Biological Chemistry, 279, 20211-20220.
GAO, X. L., CHEN, J., TAO, W. X., ZHU, J. H., ZHANG, Q. Z., CHEN, H. Z. & JIANG, X. G. 2007. UEA I-bearing nanoparticles for brain delivery following intranasal administration. International Journal of Pharmaceutics, 340, 207-215.
GAO, X. L., TAO, W. X., LU, W., ZHANG, Q. Z., ZHANG, Y., JIANG, X. G. & FU, S. K. 2006a. Lectin-conjugated PEG-PLA nanoparticles: Preparation and brain delivery after intranasal administration. Biomaterials, 27, 3482-3490.
GAO, Y. G., YAN, X. Z., SONG, A. X., CHANG, Y. G., GAO, X. C., JIANG, N., ZHANG, Q. & HU, H. Y. 2006b. Structural insights into the specific binding of huntingtin proline-rich region with the SH3 and WW domains. Structure, 14, 1755-1765.
GARDINA, P. J., CLARK, T. A., SHIMADA, B., STAPLES, M. K., YANG, Q., VEITCH, J., SCHWEITZER, A., AWAD, T., SUGNET, C. & DEE, S. 2006. Alternative splicing and differential gene expression in colon cancer detected by a whole genome exon array. Bmc Genomics, 7, 325.
GARNEAU, D., REVIL, T., FISETTE, J. F. & CHABOT, B. 2005. Heterogeneous nuclear ribonucleoprotein F/H proteins modulate the alternative splicing of the apoptotic mediator Bcl-x. Journal of Biological Chemistry, 280, 22641-22650.
GAUTHIER, L. R., CHARRIN, B. C., BORRELL-PAGES, M., DOMPIERRE, J. P., RANGONE, H., CORDELIERES, F. P., DE MEY, J., MACDONALD, M. E., LESSMANN, V., HUMBERT, S. & SAUDOU, F. 2004. Huntingtin controls neurotrophic support and survival of neurons by enhancing BDNF vesicular transport along microtubules. Cell, 118, 127-138.
GERVAIS, F. G., SINGARAJA, R., XANTHOUDAKIS, S., GUTEKUNST, C. A., LEAVITT, B. R., METZLER, M., HACKAM, A. S., TAM, J., VAILLANCOURT, J. P., HOUTZAGER, V., RASPER, D. M., ROY, S., HAYDEN, M. R. & NICHOLSON, D. W. 2002. Recruitment and activation of caspase-8 by the Huntingtin-interacting protein Hip-1 and a novel partners Hippi. Nature Cell Biology, 4, 95-105.
GIL, J. M. & REGO, A. C. 2008. Mechanisms of neurodegeneration in Huntington's disease. European Journal of Neuroscience, 27, 2803-2820.
GINÉS, S., BOSCH, M., MARCO, S., GAVALDÀ, N., DÍAZ‐HERNÁNDEZ, M., LUCAS, J. J., CANALS, J. M. & ALBERCH, J. 2006. Reduced expression of the TrkB receptor in Huntington's disease mouse models and in human brain. European Journal of Neuroscience, 23, 649-658.
GINN, S. L., ALEXANDER, I. E., EDELSTEIN, M. L., ABEDI, M. R. & WIXON, J. 2013. Gene therapy clinical trials worldwide to 2012–an update. The journal of gene medicine, 15, 65-77.
GLATZEL, M. & AGUZZI, A. 2000. PrPC expression in the peripheral nervous system is a determinant of prion neuroinvasion. Journal of General Virology, 81, 2813-2821.
GONCALVES, V., MATOS, P. & JORDAN, P. 2008. The beta-catenin/TCF4 pathway modifies alternative splicing through modulation of SRp20 expression. Rna-a Publication of the Rna Society, 14, 2538-2549.
GRAFF, C. L. & POLLACK, G. M. 2003. P-glycoprotein attenuates brain uptake of substrates after nasal instillation. Pharmaceutical Research, 20, 1225-1230.
GRAHAM, F. L., SMILEY, J., RUSSELL, W. C. & NAIRN, R. 1977. CHARACTERISTICS OF A HUMAN CELL LINE TRANSFORMED BY DNA FROM HUMAN ADENOVIRUS TYPE-5. Journal of General Virology, 36, 59-72.
GRAMS, R. & KORGE, G. 1998. The mub gene encodes a protein containing three KH domains and is expressed in the mushroom bodies of Drosophila melanogaster. Gene, 215, 191-201.
GRAY, T. A., SMITHWICK, M. J., SCHALDACH, M. A., MARTONE, D. L., GRAVES, J. A. M., MCCARREY, J. R. & NICHOLLS, R. D. 1999. Concerted regulation and molecular evolution of the duplicated SNRPB '/B and SNRPN loci. Nucleic Acids Research, 27, 4577-4584.
GRISHOK, A. 2005. RNAi mechanisms in Caenorhabditis elegans. Febs Letters, 579, 5932-5939.
196
GROSS, E. A., SWENBERG, J. A., FIELDS, S. & POPP, J. A. 1982. COMPARATIVE MORPHOMETRY OF THE NASAL CAVITY IN RATS AND MICE. Journal of Anatomy, 135, 83-88.
GUSELLA, J. F. & MACDONALD, M. E. 2009. Huntington's disease: the case for genetic modifiers. Genome Med, 1, 80.
HAN, J. H., XIONG, J., WANG, D. & FU, X. D. 2011. Pre-mRNA splicing: where and when in the nucleus. Trends in Cell Biology, 21, 336-343.
HANSEN, M., HSU, A. L., DILLIN, A. & KENYON, C. 2005. New genes tied to endocrine, metabolic, and dietary regulation of lifespan from a Caenorhabditis elegans genomic RNAi screen. Plos Genetics, 1, 119-128.
HASEGAWA, Y., BROCKDORFF, N., KAWANO, S., TSUTUI, K., TSUTUI, K. & NAKAGAWA, S. 2010. The Matrix Protein hnRNP U Is Required for Chromosomal Localization of Xist RNA. Developmental Cell, 19, 469-476.
HASHIZUME, R., OZAWA, T., GRYAZNOV, S. M., BOLLEN, A. W., LAMBORN, K. R., FREY, W. H. & DEEN, D. F. 2008. New therapeutic approach for brain tumors: Intranasal delivery of telomerase inhibitor GRN163. Neuro-oncology, 10, 112-120.
HAY, D. G., SATHASIVAM, K., TOBABEN, S., STAHL, B., MARBER, M., MESTRIL, R., MAHAL, A., SMITH, D. L., WOODMAN, B. & BATES, G. P. 2004. Progressive decrease in chaperone protein levels in a mouse model of Huntington's disease and induction of stress proteins as a therapeutic approach. Human Molecular Genetics, 13, 1389-1405.
HAYCRAFT, C. J., SCHAFER, J. C., ZHANG, Q. H., TAULMAN, P. D. & YODER, B. K. 2003. Identification of CHE-13, a novel intraflagellar transport protein required for cilia formation. Experimental Cell Research, 284, 251-263.
HENG, M. Y., TALLAKSEN-GREENE, S. J., DETLOFF, P. J. & ALBIN, R. L. 2007. Longitudinal evaluation of the Hdh (CAG) 150 knock-in murine model of Huntington's disease. The Journal of neuroscience, 27, 8989-8998.
HICKEY, M. A. & CHESSELET, M.-F. 2011. Behavioral Assessment of Genetic Mouse Models of Huntington’s Disease. Animal Models of Movement Disorders. Springer.
HICKEY, M. A., KOSMALSKA, A., ENAYATI, J., COHEN, R., ZEITLIN, S., LEVINE, M. S. & CHESSELET, M.-F. 2008. Extensive early motor and non-motor behavioral deficits are followed by striatal neuronal loss in knock-in Huntington's disease mice. Neuroscience, 157, 280-295.
HILLIARD, M. A., APICELLA, A. J., KERR, R., SUZUKI, H., BAZZICALUPO, P. & SCHAFER, W. R. 2005. In vivo imaging of C-elegans ASH neurons: cellular response and adaptation to chemical repellents. Embo Journal, 24, 63-72.
HILLIARD, M. A., BARGMANN, C. I. & BAZZICALUPO, P. 2002. C-elegans responds to chemical repellents by integrating sensory inputs from the head and the tail. Current Biology, 12, 730-734.
HIPP, M. S., PATEL, C. N., BERSUKER, K., RILEY, B. E., KAISER, S. E., SHALER, T. A., BRANDEIS, M. & KOPITO, R. R. 2012. Indirect inhibition of 26S proteasome activity in a cellular model of Huntington's disease. Journal of Cell Biology, 196, 573-587.
HIROSE, Y. & MANLEY, J. L. 2000. RNA polymerase II and the integration of nuclear events. Genes & Development, 14, 1415-1429.
HIROSE, Y., TACKE, R. & MANLEY, J. L. 1999. Phosphorylated RNA polymerase II stimulates pre-mRNA splicing. Genes & Development, 13, 1234-1239.
HODGES, A., STRAND, A. D., ARAGAKI, A. K., KUHN, A., SENGSTAG, T., HUGHES, G., ELLISTON, L. A., HARTOG, C., GOLDSTEIN, D. R. & THU, D. 2006. Regional and cellular gene expression changes in human Huntington's disease brain. Human Molecular Genetics, 15, 965-977.
HOUSE, A. E. & LYNCH, K. W. 2006. An exonic splicing silencer represses spliceosome assembly after ATP-dependent exon recognition. Nature Structural & Molecular Biology, 13, 937-944.
HUANG, Y. Q. & STEITZ, J. A. 2005. SRprises along a messenger's journey. Molecular Cell, 17, 613-615.

197
HUGHES, R. E. 2002. Polyglutamine disease: Acetyltransferases awry. Current Biology, 12, R141-R143.
HUNEYCUTT, B., BI, Z., AOKI, C. & REISS, C. 1993. Central neuropathogenesis of vesicular stomatitis virus infection of immunodeficient mice. Journal of virology, 67, 6698-6706.
HUNTER, C. P. 1999. Genetics: A touch of elegance with RNAi. Current Biology, 9, R440-R442. ICHIMURA, T., FRASER, P. A. & CSERR, H. F. 1991. DISTRIBUTION OF EXTRACELLULAR TRACERS IN
PERIVASCULAR SPACES OF THE RAT-BRAIN. Brain Research, 545, 103-113. ILLUM, L. 2007. Nanoparticulate systems for nasal delivery of drugs: a real improvement over simple
systems? Journal of Pharmaceutical Sciences, 96, 473-483. IQBAL, M., LIN, W., JABBAL-GILL, I., DAVIS, S. S., STEWARD, M. W. & ILLUM, L. 2003. Nasal delivery of
chitosan-DNA plasmid expressing epitopes of respiratory syncytial virus (RSV) induces protective CTL responses in BALB/c mice. Vaccine, 21, 1478-1485.
JANA, N. R., TANAKA, M., WANG, G. H. & NUKINA, N. 2000. Polyglutamine length-dependent interaction of Hsp40 and Hsp70 family chaperones with truncated N-terminal huntingtin: their role in suppression of aggregation and cellular toxicity. Human Molecular Genetics, 9, 2009-2018.
JANSSON, B. & BJORK, E. 2002. Visualization of in vivo olfactory uptake and transfer using fluorescein dextran. Journal of Drug Targeting, 10, 379-386.
JAYARAMAN, M., MISHRA, R., KODALI, R., THAKUR, A. K., KOHARUDIN, L. M. I., GRONENBORN, A. M. & WETZEL, R. 2012. Kinetically Competing Huntingtin Aggregation Pathways Control Amyloid Polymorphism and Properties. Biochemistry, 51, 2706-2716.
JIA, Y., MU, J. C. & ACKERMAN, S. L. 2012. Mutation of a U2 snRNA gene causes global disruption of alternative splicing and neurodegeneration. Cell, 148, 296-308.
JIANG, H. B., POIRIER, M. A., LIANG, Y. D., PEI, Z., WEISKITTEL, C. E., SMITH, W. W., DEFRANCO, D. B. & ROSS, C. A. 2006. Depletion of CBP is directly caused by mutant huntingtin. Neurobiology of Disease, 23, 543-551.
JIANG, Y., WEI, N., ZHU, J., ZHAI, D., WU, L., CHEN, M., XU, G. & LIU, X. 2012. A new approach with less damage: intranasal delivery of tetracycline-inducible replication-defective herpes simplex virus type-1 vector to brain. Neuroscience, 201, 96-104.
JOHNSON, N. J., HANSON, L. R. & FREY, W. H. 2010. Trigeminal pathways deliver a low molecular weight drug from the nose to the brain and orofacial structures. Molecular pharmaceutics, 7, 884-893.
JONES, B. & ROBERTS, D. 1968. The quantitative measurement of motor inco‐ordination in naive mice using an accelerating rotarod. Journal of Pharmacy and Pharmacology, 20, 302-304.
JUMAA, H., WEI, G. & NIELSEN, P. J. 1999. Blastocyst formation is blocked in mouse embryos lacking the splicing factor SRp20. Current Biology, 9, 899-902.
KADENER, S., CRAMER, P., NOGUES, G., CAZALLA, D., DE LA MATA, M., FEDEDA, J. P., WERBAJH, S. E., SREBROW, A. & KORNBLIHTT, A. R. 2001. Antagonistic effects of T-Ag and VP16 reveal a role for RNA pol II elongation on alternative splicing. Embo Journal, 20, 5759-5768.
KALATHUR, R. K. R., HERNÁNDEZ-PRIETO, M. A. & FUTSCHIK, M. E. 2012. Huntington's Disease and its therapeutic target genes: a global functional profile based on the HD Research Crossroads database. BMC neurology, 12, 47.
KALETTA, T. & HENGARTNER, M. O. 2006. Finding function in novel targets: C-elegans as a model organism. Nature Reviews Drug Discovery, 5, 387-398.
KALSOTRA, A. & COOPER, T. A. 2011. Functional consequences of developmentally regulated alternative splicing. Nature Reviews Genetics, 12, 715-729.
KALTENBACH, L. S., ROMERO, E., BECKLIN, R. R., CHETTIER, R., BELL, R., PHANSALKAR, A., STRAND, A., TORCASSI, C., SAVAGE, J. & HURLBURT, A. 2007. Huntingtin interacting proteins are genetic modifiers of neurodegeneration. Plos Genetics, 3, e82.

198
KAMATH, R. S., MARTINEZ-CAMPOS, M., ZIPPERLEN, P., FRASER, A. G. & AHRINGER, J. 2001. Effectiveness of specific RNA-mediated interference through ingested double-stranded RNA in Caenorhabditis elegans. Genome biology, 2, RESEARCH0002.
KANAZAWA, T., AKIYAMA, F., KAKIZAKI, S., TAKASHIMA, Y. & SETA, Y. 2013. Delivery of siRNA to the brain using a combination of nose-to-brain delivery and cell-penetrating peptide-modified nano-micelles. Biomaterials, 34, 9220-9226.
KANAZAWA, T., MORISAKI, K., SUZUKI, S. & TAKASHIMA, Y. 2014. Prolongation of Life in Rats with Malignant Glioma by Intranasal siRNA/Drug Codelivery to the Brain with Cell-Penetrating Peptide-Modified Micelles. Molecular pharmaceutics, 11, 1471-1478.
KAR, K., JAYARAMAN, M., SAHOO, B., KODALI, R. & WETZEL, R. 2011. Critical nucleus size for disease-related polyglutamine aggregation is repeat-length dependent. Nature Structural & Molecular Biology, 18, 328-+.
KELLEY, N. W., HUANG, X. H., TAM, S., SPIESS, C., FRYDMAN, J. & PANDE, V. S. 2009. The Predicted Structure of the Headpiece of the Huntingtin Protein and Its Implications on Huntingtin Aggregation. Journal of Molecular Biology, 388, 919-927.
KENNEDY, L., EVANS, E., CHEN, C.-M., CRAVEN, L., DETLOFF, P. J., ENNIS, M. & SHELBOURNE, P. F. 2003. Dramatic tissue-specific mutation length increases are an early molecular event in Huntington disease pathogenesis. Human Molecular Genetics, 12, 3359-3367.
KENNEDY, S., WANG, D. & RUVKUN, G. 2004. A conserved siRNA-degrading RNase negatively regulates RNA interference in C-elegans. Nature, 427, 645-649.
KIM, D. Y., KIM, W., LEE, K. H., KIM, S. H., LEE, H. R., KIM, H. J., JUNG, Y., CHOI, J. H. & KIM, K. T. 2013. hnRNP Q regulates translation of p53 in normal and stress conditions. Cell Death and Differentiation, 20, 226-234.
KIM, I.-D., KIM, S.-W. & LEE, J.-K. 2009a. Gene knockdown in the olfactory bulb, amygdala, and
hypothalamus by intranasal siRNA administration. 대한해부학회지 제, 42. KIM, M. W., CHELLIAH, Y., KIM, S. W., OTWINOWSKI, Z. & BEZPROZVANNY, I. 2009b. Secondary
Structure of Huntingtin Amino-Terminal Region. Structure, 17, 1205-1212. KOBAYASHI, Y. & SOBUE, G. 2001. Protective effect of chaperones on polyglutamine diseases. Brain
Research Bulletin, 56, 165-168. KONDRASHOV, A. V., KIEFMANN, M., EBNET, K., KHANAM, T., MUDDASHETTY, R. S. & BROSIUS, J.
2005. Inhibitory effect of naked neural BC1 RNA or BC200 RNA on eukaryotic in vitro translation systems is reversed by poly(A)-binding protein (PABP). Journal of Molecular Biology, 353, 88-103.
KRISTENS.K & OLSSON, Y. 1971. UPTAKE OF EXOGENOUS PROTEINS IN MOUSE OLFACTORY CELLS. Acta Neuropathologica, 19, 145-&.
KUKALEV, A., NORD, Y., PALMBERG, C., BERGMAN, T. & PERCIPALLE, P. 2005. Actin and hnRNP U cooperate for productive transcription by RNA polymerase II. Nature Structural & Molecular Biology, 12, 238-244.
KULKARNI, K., BHAMBERE, T., CHAUDHARY, G., TALELE, S. & MOGHAL, R. 2013. Brain Targetting through Intranasal Route. Brain, 5, 1441-1450.
KWAN, W., TRAGER, U., DAVALOS, D., CHOU, A., BOUCHARD, J., ANDRE, R., MILLER, A., WEISS, A., GIORGINI, F., CHEAH, C., MOLLER, T., STELLA, N., AKASSOGLOU, K., TABRIZI, S. J. & MUCHOWSKI, P. J. 2012. Mutant huntingtin impairs immune cell migration in Huntington disease. Journal of Clinical Investigation, 122, 4737-4747.
LABBADIA, J. & MORIMOTO, R. I. 2013. Huntington's disease: underlying molecular mechanisms and emerging concepts. Trends in Biochemical Sciences, 38, 378-385.
LAKHANI, V. V., DING, F. & DOKHOLYAN, N. V. 2010. Polyglutamine Induced Misfolding of Huntingtin Exon1 is Modulated by the Flanking Sequences. Plos Computational Biology, 6.
LAKSO, M., VARTIAINEN, S., MOILANEN, A. M., SIRVIO, J., THOMAS, J. H., NASS, R., BLAKELY, R. D. & WONG, G. 2003. Dopaminergic neuronal loss and motor deficits in Caenorhabditis elegans overexpressing human alpha-synuclein. Journal of Neurochemistry, 86, 165-172.
199
LANDLES, C. & BATES, G. P. 2004. Huntingtin and the molecular pathogenesis of Huntington's disease. Fourth in molecular medicine review series. EMBO Reports, 5, 958-963.
LANE, M. A. & BAILEY, S. J. 2005. Role of retinoid signalling in the adult brain. Progress in Neurobiology, 75, 275-293.
LEAVITT, B. R., GUTTMAN, J. A., HODGSON, J. G., KIMEL, G. H., SINGARAJA, R., VOGL, A. W. & HAYDEN, M. R. 2001. Wild-type huntingtin reduces the cellular toxicity of mutant huntingtin in vivo. American Journal of Human Genetics, 68, 313-324.
LEE, E. B., LEE, V. M. Y. & TROJANOWSKI, J. Q. 2012. Gains or losses: molecular mechanisms of TDP43-mediated neurodegeneration. Nature Reviews Neuroscience, 13, 38-50.
LEE, M.-H., MORI, S. & RAYCHAUDHURI, P. 1996. trans-Activation by the hnRNP K protein involves an increase in RNA synthesis from the reporter genes. Journal of Biological Chemistry, 271, 3420-3427.
LEE, V. M. Y., GOEDERT, M. & TROJANOWSKI, J. Q. 2001. Neurodegenerative tauopathies. Annual Review of Neuroscience, 24, 1121-1159.
LEGLEITER, J., MITCHELL, E., LOTZ, G. P., SAPP, E., NG, C., DIFIGLIA, M., THOMPSON, L. M. & MUCHOWSKI, P. J. 2010. Mutant Huntingtin Fragments Form Oligomers in a Polyglutamine Length-dependent Manner in Vitro and in Vivo. Journal of Biological Chemistry, 285, 14777-14790.
LEJEUNE, F. X., MESROB, L., PARMENTIER, F., BICEP, C., VAZQUEZ-MANRIQUE, R. P., PARKER, J. A., VERT, J. P., TOURETTE, C. & NERI, C. 2012. Large-scale functional RNAi screen in C. elegans identifies genes that regulate the dysfunction of mutant polyglutamine neurons. Bmc Genomics, 13.
LEMIALE, F., KONG, W.-P., AKYÜREK, L. M., LING, X., HUANG, Y., CHAKRABARTI, B. K., ECKHAUS, M. & NABEL, G. J. 2003. Enhanced mucosal immunoglobulin A response of intranasal adenoviral vector human immunodeficiency virus vaccine and localization in the central nervous system. Journal of virology, 77, 10078-10087.
LEVINE, M. S., CEPEDA, C., HICKEY, M. A., FLEMING, S. M. & CHESSELET, M.-F. 2004. Genetic mouse models of Huntington's and Parkinson's diseases: illuminating but imperfect. Trends in neurosciences, 27, 691-697.
LI-KOROTKY, H. S., HEBDA, P. A., KELLY, L. A., LO, C. Y. & DOHAR, J. E. 2006. Identification of a pre-mRNA splicing factor, arginine/serine-rich 3 (Sfrs3), and its co-expression with fibronectin in fetal and postnatal rabbit airway mucosal and skin wounds. Biochimica Et Biophysica Acta-Molecular Basis of Disease, 1762, 34-45.
LI, C. 2001. Caenorhabditis elegans Nervous System. eLS. John Wiley & Sons, Ltd. LI, L.-B., YU, Z., TENG, X. & BONINI, N. M. 2008. RNA toxicity is a component of ataxin-3 degeneration
in Drosophila. Nature, 453, 1107-1111. LI, S. H., CHENG, A. L., ZHOU, H., LAM, S., RAO, M., LI, H. & LI, X. J. 2002. Interaction of Huntington
disease protein with transcriptional activator Sp1. Molecular and Cellular Biology, 22, 1277-1287.
LI, Y., FIELD, P. M. & RAISMAN, G. 2005. Olfactory ensheathing cells and olfactory nerve fibroblasts maintain continuous open channels for regrowth of olfactory nerve fibres. Glia, 52, 245-251.
LICATALOSI, D. D. & DARNELL, R. B. 2006. Splicing regulation in neurologic disease. Neuron, 52, 93-101.
LIN, C.-H., TALLAKSEN-GREENE, S., CHIEN, W.-M., CEARLEY, J. A., JACKSON, W. S., CROUSE, A. B., REN, S., LI, X.-J., ALBIN, R. L. & DETLOFF, P. J. 2001. Neurological abnormalities in a knock-in mouse model of Huntington’s disease. Human Molecular Genetics, 10, 137-144.
LIN, C. F., MOUNT, S. M., JARMOLOWSKI, A. & MAKALOWSKI, W. 2010. Evolutionary dynamics of U12-type spliceosomal introns. Bmc Evolutionary Biology, 10.
LIN, K., DORMAN, J. B., RODAN, A. & KENYON, C. 1997. daf-16: An HNF-3/forkhead family member that can function to double the life-span of Caenorhabditis elegans. Science, 278, 1319-1322.
200
LIN, K. T., LU, R. M. & TARN, W. Y. 2004. The WW domain-containing proteins interact with the early spliceosome and participate in pre-mRNA splicing in vivo. Molecular and Cellular Biology, 24, 9176-9185.
LINES, M. A., HUANG, L. J., SCHWARTZENTRUBER, J., DOUGLAS, S. L., LYNCH, D. C., BEAULIEU, C., GUION-ALMEIDA, M. L., ZECHI-CEIDE, R. M., GENER, B., GILLESSEN-KAESBACH, G., NAVA, C., BAUJAT, G., HORN, D., KINI, U., CALIEBE, A., ALANAY, Y., UTINE, G. E., LEV, D., KOHLHASE, J., GRIX, A. W., LOHMANN, D. R., HEHR, U., BOHM, D., MAJEWSKI, J., BULMAN, D. E., WIECZOREK, D., BOYCOTT, K. M. & CONSORTIUM, F. C. 2012. Haploinsufficiency of a Spliceosomal GTPase Encoded by EFTUD2 Causes Mandibulofacial Dysostosis with Microcephaly. American Journal of Human Genetics, 90, 369-377.
LINK, C. D. 1995. EXPRESSION OF HUMAN BETA-AMYLOID PEPTIDE IN TRANSGENIC CAENORHABDITIS-ELEGANS. Proceedings of the National Academy of Sciences of the United States of America, 92, 9368-9372.
LIONE, L. A., CARTER, R. J., HUNT, M. J., BATES, G. P., MORTON, A. J. & DUNNETT, S. B. 1999. Selective discrimination learning impairments in mice expressing the human Huntington's disease mutation. The Journal of neuroscience, 19, 10428-10437.
LIU, D., LI, C., CHEN, Y., BURNETT, C., LIU, X. Y., DOWNS, S., COLLINS, R. D. & HAWIGER, J. 2004. Nuclear import of proinflammatory transcription factors is required for massive liver apoptosis induced by bacterial lipopolysaccharide. Journal of Biological Chemistry, 279, 48434-48442.
LOCHHEAD, J. J. & THORNE, R. G. 2012. Intranasal delivery of biologics to the central nervous system. Advanced Drug Delivery Reviews, 64, 614-628.
LOPEZ, P. J. & SERAPHIN, B. 1999. Genomic-scale quantitative analysis of yeast pre-mRNA splicing: implications for splice-site recognition. Rna, 5, 1135-1137.
LUTHI-CARTER, R., STRAND, A., PETERS, N. L., SOLANO, S. M., HOLLINGSWORTH, Z. R., MENON, A. S., FREY, A. S., SPEKTOR, B. S., PENNEY, E. B. & SCHILLING, G. 2000. Decreased expression of striatal signaling genes in a mouse model of Huntington’s disease. Human Molecular Genetics, 9, 1259-1271.
MACDONALD, C. C., WILUSZ, J. & SHENK, T. 1994. The 64-kilodalton subunit of the CstF polyadenylation factor binds to pre-mRNAs downstream of the cleavage site and influences cleavage site location. Molecular and Cellular Biology, 14, 6647-6654.
MACLAUGHLIN, F. C., MUMPER, R. J., WANG, J. J., TAGLIAFERRI, J. M., GILL, I., HINCHCLIFFE, M. & ROLLAND, A. P. 1998. Chitosan and depolymerized chitosan oligomers as condensing carriers for in vivo plasmid delivery. Journal of Controlled Release, 56, 259-272.
MALLUCCI, G., DICKINSON, A., LINEHAN, J., KLÖHN, P.-C., BRANDNER, S. & COLLINGE, J. 2003. Depleting neuronal PrP in prion infection prevents disease and reverses spongiosis. Science, 302, 871-874.
MALLUCCI, G. R., WHITE, M. D., FARMER, M., DICKINSON, A., KHATUN, H., POWELL, A. D., BRANDNER, S., JEFFERYS, J. G. & COLLINGE, J. 2007. Targeting cellular prion protein reverses early cognitive deficits and neurophysiological dysfunction in prion-infected mice. Neuron, 53, 325-335.
MANDEL, M. & HIGA, A. 1970. CALCIUM-DEPENDENT BACTERIOPHAGE DNA INFECTION. Journal of Molecular Biology, 53, 159-&.
MANGIARINI, L., SATHASIVAM, K., SELLER, M., COZENS, B., HARPER, A., HETHERINGTON, C., LAWTON, M., TROTTIER, Y., LEHRACH, H. & DAVIES, S. W. 1996. Exon 1 of the< i> HD</i> Gene with an Expanded CAG Repeat Is Sufficient to Cause a Progressive Neurological Phenotype in Transgenic Mice. Cell, 87, 493-506.
MARTINEZ-CONTRERAS, R., FISETTE, J. F., NASIM, F. H., MADDEN, R., CORDEAU, M. & CHABOT, B. 2006. Intronic binding sites for hnRNP A/B and hnRNP F/H proteins stimulate pre-mRNA splicing. Plos Biology, 4, 172-185.

201
MASON, R. P., CASU, M., BUTLER, N., BREDA, C., CAMPESAN, S., CLAPP, J., GREEN, E. W., DHULKHED, D., KYRIACOU, C. P. & GIORGINI, F. 2013. Glutathione peroxidase activity is neuroprotective in models of Huntington's disease. Nature Genetics, 45, 1249-1254.
MATHISON, S., NAGILLA, R. & KOMPELLA, U. B. 1998. Nasal route for direct delivery of solutes to the central nervous system: Fact or fiction? Journal of Drug Targeting, 5, 415-441.
MATLIN, A. J., CLARK, F. & SMITH, C. W. J. 2005. Understanding alternative splicing: Towards a cellular code. Nature Reviews Molecular Cell Biology, 6, 386-398.
MAZAREI, G., NEAL, S. J., BECANOVIC, K., LUTHI-CARTER, R., SIMPSON, E. M. & LEAVITT, B. R. 2009. Expression analysis of novel striatal-enriched genes in Huntington disease. Human Molecular Genetics, ddp527.
MENALLED, L. B. 2005. Knock-in mouse models of Huntington's disease. NeuroRx, 2, 465-470. MENALLED, L. B. & CHESSELET, M.-F. 2002. Mouse models of Huntington's disease. Trends in
pharmacological sciences, 23, 32-39. MENALLED, L. B., SISON, J. D., WU, Y., OLIVIERI, M., LI, X.-J., LI, H., ZEITLIN, S. & CHESSELET, M.-F.
2002. Early motor dysfunction and striosomal distribution of huntingtin microaggregates in Huntington's disease knock-in mice. The Journal of neuroscience, 22, 8266-8276.
METZLER, M., CHEN, N. S., HELGASON, C. D., GRAHAM, R. K., NICHOL, K., MCCUTCHEON, K., NASIR, J., HUMPHRIES, R. K., RAYMOND, L. A. & HAYDEN, M. R. 1999. Life without Huntington: Normal differentiation into functional neurons. Journal of Neurochemistry, 72, 1009-1018.
MICHELOTTI, E. F., MICHELOTTI, G. A., ARONSOHN, A. I. & LEVENS, D. 1996. Heterogeneous nuclear ribonucleoprotein K is a transcription factor. Molecular and Cellular Biology, 16, 2350-2360.
MIKULA, M., DZWONEK, A., KARCZMARSKI, J., RUBEL, T., DADLEZ, M., WYRWICZ, L. S., BOMSZTYK, K. & OSTROWSKI, J. 2006. Landscape of the hnRNP K protein-protein interactome. Proteomics, 6, 2395-2406.
MILLER, B. R., DORNER, J. L., SHOU, M., SARI, Y., BARTON, S. J., SENGELAUB, D. R., KENNEDY, R. T. & REBEC, G. V. 2008. Up-regulation of GLT1 expression increases glutamate uptake and attenuates the Huntington's disease phenotype in the R6/2 mouse. Neuroscience, 153, 329-337.
MILLS, J. D. & JANITZ, M. 2012a. Alternative splicing of mRNA in the molecular pathology of neurodegenerative diseases. Neurobiology of Aging, 33, 1012. e11-1012. e24.
MILLS, J. D. & JANITZ, M. 2012b. Alternative splicing of mRNA in the molecular pathology of neurodegenerative diseases. Neurobiology of Aging, 33.
MIN, H. S., CHAN, R. C. & BLACK, D. L. 1995. THE GENERALLY EXPRESSED HNRNP-F IS INVOLVED IN A NEURAL-SPECIFIC PRE-MESSENGER-RNA SPLICING EVENT. Genes & Development, 9, 2659-2671.
MITRA, S. & FINKBEINER, S. 2008. The ubiquitin-proteasome pathway in Huntington's disease. Thescientificworldjournal, 8, 421-433.
MONTGOMERY, M. K. & FIRE, A. 1998. Double-stranded RNA as a mediator in sequence-specific genetic silencing and co-suppression. Trends in Genetics, 14, 255-258.
MORENO, J. A., RADFORD, H., PERETTI, D., STEINERT, J. R., VERITY, N., MARTIN, M. G., HALLIDAY, M., MORGAN, J., DINSDALE, D. & ORTORI, C. A. 2012. Sustained translational repression by eIF2 [agr]-P mediates prion neurodegeneration. Nature, 485, 507-511.
MORLEY, J. F., BRIGNULL, H. R., WEYERS, J. J. & MORIMOTO, R. I. 2002. The threshold for polyglutamine-expansion protein aggregation and cellular toxicity is dynamic and influenced by aging in Caenorhabditis elegans. Proceedings of the National Academy of Sciences of the United States of America, 99, 10417-10422.
MUCHOWSKI, P. J. & WACKER, J. L. 2005. Modulation of neurodegeneration by molecular chaperones. Nature Reviews Neuroscience, 6, 11-22.
MULLIS, K. B. & FALOONA, F. A. 1987. SPECIFIC SYNTHESIS OF DNA INVITRO VIA A POLYMERASE-CATALYZED CHAIN-REACTION. Methods in Enzymology, 155, 335-350.

202
MURPHY, K. P., CARTER, R. J., LIONE, L. A., MANGIARINI, L., MAHAL, A., BATES, G. P., DUNNETT, S. B. & MORTON, A. J. 2000. Abnormal synaptic plasticity and impaired spatial cognition in mice transgenic for exon 1 of the human Huntington's disease mutation. The Journal of neuroscience, 20, 5115-5123.
MUS, E., HOF, P. R. & TIEDGE, H. 2007. Dendritic BC200 RNA in aging and in Alzheimer's disease. Proceedings of the National Academy of Sciences of the United States of America, 104, 10679-10684.
MUSUNURU, K. & DARNELL, R. B. 2001. Paraneoplastic neurologic disease antigens: RNA-binding proteins and signaling proteins in neuronal degeneration. Annual Review of Neuroscience, 24, 239-262.
MYKOWSKA, A., SOBCZAK, K., WOJCIECHOWSKA, M., KOZLOWSKI, P. & KRZYZOSIAK, W. J. 2011. CAG repeats mimic CUG repeats in the misregulation of alternative splicing. Nucleic Acids Research, 39, 8938-8951.
NAARMANN, I. S., HARNISCH, C., FLACH, N., KREMMER, E., KUHN, H., OSTARECK, D. H. & OSTARECK-LEDERER, A. 2008. mRNA silencing in human erythroid cell maturation - Heterogeneous nuclear ribonucleoprotein K controls the expression of its regulator c-Src. Journal of Biological Chemistry, 283, 18461-18472.
NANOU, A. & AZZOUZ, M. 2009. Gene therapy for neurodegenerative diseases based on lentiviral vectors. Progress in brain research, 175, 187-200.
NASIM, M. T. & EPERON, I. C. 2006. A double-reporter splicing assay for determining splicing efficiency in mammalian cells. Nature Protocols, 1, 1022-1028.
NASIR, J., FLORESCO, S., O'KUSKY, J., DIEWERT, V., RICHMAN, J., ZEISLER, J., BOROWSKI, A., MCTZLER, M., GRAHAM, R., MARTH, J., PHILLIPS, A. & HAYDEN, M. 1995a. Targeted disruption of the Huntington's disease gene results in embryonic lethality in homozygotes and behavioral and neuropathological defects in heterozygotes. American Journal of Human Genetics, 57, A51.
NASIR, J., FLORESCO, S. B., O'KUSKY, J. R., DIEWERT, V. M., RICHMAN, J. M., ZEISLER, J., BOROWSKI, A., MARTH, J. D., PHILLIPS, A. G. & HAYDEN, M. R. 1995b. Targeted disruption of the Huntington's disease gene results in embryonic lethality and behavioral and morphological changes in heterozygotes. Cell, 81, 811-823.
NEEF, D. W., JAEGER, A. M. & THIELE, D. J. 2011. Heat shock transcription factor 1 as a therapeutic target in neurodegenerative diseases. Nature Reviews Drug Discovery, 10, 930-944.
NEEF, D. W., TURSKI, M. L. & THIELE, D. J. 2010. Modulation of Heat Shock Transcription Factor 1 as a Therapeutic Target for Small Molecule Intervention in Neurodegenerative Disease. Plos Biology, 8.
NELSON, R., SAWAYA, M. R., BALBIRNIE, M., MADSEN, A. O., RIEKEL, C., GROTHE, R. & EISENBERG, D. 2005. Structure of the cross-beta spine of amyloid-like fibrils. Nature, 435, 773-778.
NEWCOMER, M. E. 2001. Trading places. Nature Structural Biology, 8, 282-284. NI, J. Z., GRATE, L., DONOHUE, J. P., PRESTON, C., NOBIDA, N., O'BRIEN, G., SHIUE, L., CLARK, T. A.,
BLUME, J. E. & ARES, M. 2007. Ultraconserved elements are associated with homeostatic control of splicing regulators by alternative splicing and nonsense-mediated decay. Genes & Development, 21, 708-718.
NOLLEN, E. A. A., GARCIA, S. M., VAN HAAFTEN, G., KIM, S., CHAVEZ, A., MORIMOTO, R. I. & PLASTERK, R. H. A. 2004. Genome-wide RNA interference screen identifies previously undescribed regulators of polyglutamine aggregation. Proceedings of the National Academy of Sciences of the United States of America, 101, 6403-6408.
NONAKA, N., FARR, S. A., KAGEYAMA, H., SHIODA, S. & BANKS, W. A. 2008. Delivery of galanin-like peptide to the brain: targeting with intranasal delivery and cyclodextrins. Journal of Pharmacology and Experimental Therapeutics, 325, 513-519.
NYBAKKEN, K., VOKES, S. A., LIN, T. Y., MCMAHON, A. P. & PERRIMON, N. 2005. A genome-wide RNA interference screen in Drosophila melanogaster cells for new components of the Hh signaling pathway. Nature Genetics, 37, 1323-1332.

203
OKONIEWSKI, M. J., HEY, Y., PEPPER, S. D. & MILLER, C. J. 2007. High correspondence between Affymetrix exon and standard expression arrays. Biotechniques, 42, 181.
OSTROWSKI, J., KAWATA, Y., SCHULLERY, D. S., DENISENKO, O. N. & BOMSZTYK, K. 2003. Transient recruitment of the hnRNP K protein to inducibly transcribed gene loci. Nucleic Acids Research, 31, 3954-3962.
OU, S., WU, F., HARRICH, D., GARCÍA-MARTÍNEZ, L. F. & GAYNOR, R. B. 1995. Cloning and characterization of a novel cellular protein, TDP-43, that binds to human immunodeficiency virus type 1 TAR DNA sequence motifs. Journal of virology, 69, 3584-3596.
OWENS, D. R., ZINMAN, B. & BOLLI, G. 2003. Alternative routes of insulin delivery. Diabetic Medicine, 20, 886-898.
PADOWSKI, J. M. & POLLACK, G. M. 2010. Examination of the Ability of the Nasal Administration Route to Confer a Brain Exposure Advantage for Three Chemical Inhibitors of P-Glycoprotein. Journal of Pharmaceutical Sciences, 99, 3226-3233.
PAGANI, F. & BARALLE, F. E. 2004. Genomic variants in exons and introns: identifying the splicing spoilers. Nature Reviews Genetics, 5, 389-U2.
PALAZZOLO, I., NEDELSKY, N. B., ASKEW, C. E., HARMISON, G. G., KASANTSEV, A. G., TAYLOR, J. P., FISCHBECK, K. H. & PENNUTO, M. 2010. B2 Attenuates Polyglutamine-Expanded Androgen Receptor Toxicity in Cell and Fly Models of Spinal and Bulbar Muscular Atrophy. Journal of Neuroscience Research, 88, 2207-2216.
PALIDWOR, G. A., SHCHERBININ, S., HUSKA, M. R., RASKO, T., STELZL, U., ARUMUGHAN, A., FOUIIE, R., PORRAS, P., SANCHEZ-PULIDO, L., WANKER, E. E. & ANDRADE-NAVARRO, M. A. 2009. Detection of Alpha-Rod Protein Repeats Using a Neural Network and Application to Huntingtin. Plos Computational Biology, 5.
PARKER, R. & SHETH, U. 2007. P bodies and the control of mRNA translation and degradation. Molecular Cell, 25, 635-646.
PASSANI, L. A., BEDFORD, M. T., FABER, P. W., MCGINNIS, K. M., SHARP, A. H., GUSELLA, J. F., VONSATTEL, J.-P. & MACDONALD, M. E. 2000. Huntingtin’s WW domain partners in Huntington’s disease post-mortem brain fulfill genetic criteria for direct involvement in Huntington’s disease pathogenesis. Human Molecular Genetics, 9, 2175-2182.
PATHAN, S. A., IQBAL, Z., ZAIDI, S. M. A., TALEGAONKAR, S., VOHRA, D., JAIN, G. K., AZEEM, A., JAIN, N., LALANI, J. R., KHAR, R. K. & AHMAD, F. J. 2009. CNS drug delivery systems: novel approaches. Recent patents on drug delivery & formulation, 3, 71-89.
PAULSEN, R. D., SONI, D. V., WOLLMAN, R., HAHN, A. T., YEE, M. C., GUAN, A., HESLEY, J. A., MILLER, S. C., CROMWELL, E. F., SOLOW-CORDERO, D. E., MEYER, T. & CIMPRICH, K. A. 2009. A Genome-wide siRNA Screen Reveals Diverse Cellular Processes and Pathways that Mediate Genome Stability. Molecular Cell, 35, 228-239.
PAUSHKIN, S., GUBITZ, A. K., MASSENET, S. & DREYFUSS, G. 2002. The SMN complex, an assemblyosome of ribonucleoproteins. Current Opinion in Cell Biology, 14, 305-312.
PERUTZ, M. F., JOHNSON, T., SUZUKI, M. & FINCH, J. T. 1994. GLUTAMINE REPEATS AS POLAR ZIPPERS - THEIR POSSIBLE ROLE IN INHERITED NEURODEGENERATIVE DISEASES. Proceedings of the National Academy of Sciences of the United States of America, 91, 5355-5358.
PFAFFL, M. W. 2001. A new mathematical model for relative quantification in real-time RT-PCR. Nucleic Acids Research, 29.
PIRES, A., FORTUNA, A., ALVES, G. & FALCAO, A. 2009. Intranasal Drug Delivery: How, Why and What for? Journal of Pharmacy and Pharmaceutical Sciences, 12, 288-311.
POIRIER, M. A., JIANG, H. & ROSS, C. A. 2005. A structure-based analysis of huntingtin mutant polyglutamine aggregation and toxicity: evidence for a compact beta-sheet structure. Human Molecular Genetics, 14, 765-774.
POLLING, S., HILL, A. F. & HATTERS, D. M. 2012. Polyglutamine aggregation in Huntington and related diseases. Advances in experimental medicine and biology, 769, 125-40.
204
POLYMENIDOU, M., LAGIER-TOURENNE, C., HUTT, K. R., HUELGA, S. C., MORAN, J., LIANG, T. Y., LING, S. C., SUN, E., WANCEWICZ, E., MAZUR, C., KORDASIEWICZ, H., SEDAGHAT, Y., DONOHUE, J. P., SHIUE, L., BENNETT, C. F., YEO, G. W. & CLEVELAND, D. W. 2011. Long pre-mRNA depletion and RNA missplicing contribute to neuronal vulnerability from loss of TDP-43. Nature Neuroscience, 14, 459-U92.
PRUSINER, S. B. 1991. Molecular biology of prion diseases. Science, 252, 1515-1522. RAJAN, R. S., ILLING, M. E., BENCE, N. F. & KOPITO, R. R. 2001. Specificity in intracellular protein
aggregation and inclusion body formation. Proceedings of the National Academy of Sciences of the United States of America, 98, 13060-13065.
RALPH, G., BINLEY, K., WONG, L., AZZOUZ, M. & MAZARAKIS, N. 2006. Gene therapy for neurodegenerative and ocular diseases using lentiviral vectors. Clinical Science, 110, 37-46.
RALPH, G. S., RADCLIFFE, P. A., DAY, D. M., CARTHY, J. M., LEROUX, M. A., LEE, D. C., WONG, L.-F., BILSLAND, L. G., GREENSMITH, L. & KINGSMAN, S. M. 2005. Silencing mutant SOD1 using RNAi protects against neurodegeneration and extends survival in an ALS model. Nature Medicine, 11, 429-433.
RAO, D. D., VORHIES, J. S., SENZER, N. & NEMUNAITIS, J. 2009. siRNA vs. shRNA: similarities and differences. Advanced Drug Delivery Reviews, 61, 746-759.
RAOUL, C., ABBAS-TERKI, T., BENSADOUN, J.-C., GUILLOT, S., HAASE, G., SZULC, J., HENDERSON, C. E. & AEBISCHER, P. 2005. Lentiviral-mediated silencing of SOD1 through RNA interference retards disease onset and progression in a mouse model of ALS. Nature Medicine, 11, 423-428.
RAYMOND, L. A., ANDRE, V. M., CEPEDA, C., GLADDING, C. M., MILNERWOOD, A. J. & LEVINE, M. S. 2011. PATHOPHYSIOLOGY OF HUNTINGTON'S DISEASE: TIME-DEPENDENT ALTERATIONS IN SYNAPTIC AND RECEPTOR FUNCTION. Neuroscience, 198, 252-273.
REDDY, G., STRAUBB, J. E. & THIRUMALAI, D. 2009. Dynamics of locking of peptides onto growing amyloid fibrils. Proceedings of the National Academy of Sciences of the United States of America, 106, 11948-11953.
REGER, M. A., WATSON, G. S., GREEN, P. S., BAKER, L. D., CHOLERTON, B., FISHEL, M. A., PLYMATE, S. R., CHERRIER, M. M., SCHELLENBERG, G. D., FREY, W. H. & CRAFT, S. 2008. Intranasal insulin administration dose-dependently modulates verbal memory and plasma amyloid-beta in memory-impaired older adults. Journal of Alzheimers Disease, 13, 323-331.
REISS, C. S., PLAKHOV, I. V. & KOMATSU, T. 1998. Viral Replication in Olfactory Receptor Neurons and Entry into the Olfactory Bulb and Braina. Annals of the New York Academy of Sciences, 855, 751-761.
REN, Y.-G., WAGNER, K. W., KNEE, D. A., AZA-BLANC, P., NASOFF, M. & DEVERAUX, Q. L. 2004. Differential regulation of the TRAIL death receptors DR4 and DR5 by the signal recognition particle. Molecular biology of the cell, 15, 5064-5074.
RENNER, D. B., FREY II, W. H. & HANSON, L. R. 2012. Intranasal delivery of siRNA to the olfactory bulbs of mice< i> via</i> the olfactory nerve pathway. Neuroscience letters, 513, 193-197.
REVIL, T., PELLETIER, J., TOUTANT, J., CLOUTIER, A. & CHABOT, B. 2009. Heterogeneous Nuclear Ribonucleoprotein K Represses the Production of Pro-apoptotic Bcl-x(S) Splice Isoform. Journal of Biological Chemistry, 284, 21458-21467.
RIDLEY, R. M., FRITH, C. D., CROW, T. J. & CONNEALLY, P. M. 1988. ANTICIPATION IN HUNTINGTONS-DISEASE IS INHERITED THROUGH THE MALE LINE BUT MAY ORIGINATE IN THE FEMALE. Journal of Medical Genetics, 25, 589-595.
ROBERTS, W. K. & DARNELL, R. B. 2004. Neuroimmunology of the paraneoplastic neurological degenerations. Current Opinion in Immunology, 16, 616-622.
ROCKABRAND, E., SLEPKO, N., PANTALONE, A., NUKALA, V. N., KAZANTSEV, A., MARSH, J. L., SULLIVAN, P. G., STEFFAN, J. S., SENSI, S. L. & THOMPSON, L. M. 2007. The first 17 amino acids of Huntingtin modulate its sub-cellular localization, aggregation and effects on calcium homeostasis. Human Molecular Genetics, 16, 61-77.

205
ROSHON, M. J. & RULEY, H. E. 2005. Hypomorphic mutation in hnRNP U results in post-implantation lethality. Transgenic Research, 14, 179-192.
ROSICARELLI, B., SERAFINI, B., SBRICCOLI, M., LU, M., CARDONE, F., POCCHIARI, M. & ALOISI, F. 2005. Migration of dendritic cells into the brain in a mouse model of prion disease. Journal of neuroimmunology, 165, 114-120.
ROSKOSKI, R. 2004. Src protein-tyrosine kinase structure and regulation. Biochemical and Biophysical Research Communications, 324, 1155-1164.
ROSS, C. A. & POIRIER, M. A. 2004. Protein aggregation and neurodegenerative disease. ROYCHOUDHURY, P. & CHAUDHURI, K. 2007. Evidence for heterogeneous nuclear ribonucleoprotein
K overexpression in oral squamous cell carcinoma. British Journal of Cancer, 97, 574-575. RUBINSZTEIN, D. C. 2002. Lessons from animal models of Huntington's disease. Trends in Genetics,
18, 202-209. SANCHEZ, I., MAHLKE, C. & YUAN, J. Y. 2003. Pivotal role of oligomerization in expanded
polyglutamine neurodegenerative disorders. Nature, 421, 373-379. SANFORD, J. R., GRAY, N. K., BECKMANN, K. & CACERES, J. F. 2004. A novel role for shuttling SR
proteins in mRNA translation. Genes & Development, 18, 755-768. SATHASIVAM, K., LANE, A., LEGLEITER, J., WARLEY, A., WOODMAN, B., FINKBEINER, S., PAGANETTI,
P., MUCHOWSKI, P. J., WILSON, S. & BATES, G. P. 2010. Identical oligomeric and fibrillar structures captured from the brains of R6/2 and knock-in mouse models of Huntington's disease. Human Molecular Genetics, 19, 65-78.
SATHASIVAM, K., NEUEDER, A., GIPSON, T. A., LANDLES, C., BENJAMIN, A. C., BONDULICH, M. K., SMITH, D. L., FAULL, R. L. M., ROOS, R. A. C., HOWLAND, D., DETLOFF, P. J., HOUSMAN, D. E. & BATES, G. P. 2013. Aberrant splicing of HTT generates the pathogenic exon 1 protein in Huntington disease. Proceedings of the National Academy of Sciences of the United States of America, 110, 2366-2370.
SAYDOFF, J. A., GARCIA, R. A., BROWNE, S. E., LIU, L., SHENG, J., BRENNEMAN, D., HU, Z., CARDIN, S., GONZALEZ, A. & VON BORSTEL, R. W. 2006. Oral uridine pro-drug PN401 is neuroprotective in the R6/2 and N171-82Q mouse models of Huntington's disease. Neurobiology of Disease, 24, 455-465.
SCHILLING, G., BECHER, M. W., SHARP, A. H., JINNAH, H. A., DUAN, K., KOTZUK, J. A., SLUNT, H. H., RATOVITSKI, T., COOPER, J. K. & JENKINS, N. A. 1999. Intranuclear inclusions and neuritic aggregates in transgenic mice expressing a mutant N-terminal fragment of huntingtin. Human Molecular Genetics, 8, 397-407.
SCHWAB, C., ARAI, T., HASEGAWA, M., YU, S. & MCGEER, P. L. 2008. Colocalization of Transactivation-Responsive DNA-Binding Protein 43 and Huntingtin in Inclusions of Huntington Disease. Journal of Neuropathology and Experimental Neurology, 67, 1159-1165.
SCRANTON, R. A., FLETCHER, L., SPRAGUE, S., JIMENEZ, D. F. & DIGICAYLIOGLU, M. 2011. The Rostral Migratory Stream Plays a Key Role in Intranasal Delivery of Drugs into the CNS. Plos One, 6.
SEPHTON, C. F., CENIK, B., CENIK, B. K., HERZ, J. & YU, G. 2012. TDP-43 in central nervous system development and function: clues to TDP-43-associated neurodegeneration. Biological Chemistry, 393, 589-594.
SEPHTON, C. F., GOOD, S. K., ATKIN, S., DEWEY, C. M., MAYER, P., HERZ, J. & YU, G. 2010. TDP-43 Is a Developmentally Regulated Protein Essential for Early Embryonic Development. Journal of Biological Chemistry, 285, 6826-6834.
SHAO, Z., KRISHNAMOORTHY, R. & MITRA, A. K. 1992. Cyclodextrins as nasal absorption promoters of insulin: mechanistic evaluations. Pharmaceutical Research, 9, 1157-1163.
SHAW, G., MORSE, S., ARARAT, M. & GRAHAM, F. L. 2002. Preferential transformation of human neuronal cells by human adenoviruses and the origin of HEK 293 cells. Faseb Journal, 16, 869-+.
SHELBOURNE, P. F., KILLEEN, N., HEVNER, R. F., JOHNSTON, H. M., TECOTT, L., LEWANDOSKI, M., ENNIS, M., RAMIREZ, L., LI, Z. & IANNICOLA, C. 1999. A Huntington's disease CAG expansion

206
at the murine Hdh locus is unstable and associated with behavioural abnormalities in mice. Human Molecular Genetics, 8, 763-774.
SHEN, H. H. & GREEN, M. R. 2004. A pathway of sequential arginine-serine-rich domain-splicing signal interactions during mammalian spliceosome assembly. Molecular Cell, 16, 363-373.
SIJEN, T., FLEENOR, J., SIMMER, F., THIJSSEN, K. L., PARRISH, S., TIMMONS, L., PLASTERK, R. H. A. & FIRE, A. 2001. On the role of RNA amplification in dsRNA-triggered gene silencing. Cell, 107, 465-476.
SIMMER, F., MOORMAN, C., VAN DER LINDEN, A. M., KUIJK, E., VAN DEN BERGHE, P. V., KAMATH, R. S., FRASER, A. G., AHRINGER, J. & PLASTERK, R. H. 2003. Genome-wide RNAi of C. elegans using the hypersensitive rrf-3 strain reveals novel gene functions. Plos Biology, 1, e12.
SIMMER, F., TIJSTERMAN, M., PARRISH, S., KOUSHIKA, S. P., NONET, M. L., FIRE, A., AHRINGER, J. & PLASTERK, R. H. 2002. Loss of the Putative RNA-Directed RNA Polymerase RRF-3 Makes< i> C</i>.< i> elegans</i> Hypersensitive to RNAi. Current Biology, 12, 1317-1319.
SINGH, R. K. & COOPER, T. A. 2012. Pre-mRNA splicing in disease and therapeutics. Trends in Molecular Medicine, 18, 472-482.
SLEPKO, N., BHATTACHARYYA, A. M., JACKSON, G. R., STEFFAN, J. S., MARSH, J. L., THOMPSON, L. M. & WETZEL, R. 2006. Normal-repeat-length polyglutamine peptides accelerate aggregation nucleation and cytotoxicity of expanded polyglutamine proteins. Proceedings of the National Academy of Sciences of the United States of America, 103, 14367-14372.
SLOW, E. J., VAN RAAMSDONK, J., ROGERS, D., COLEMAN, S. H., GRAHAM, R. K., DENG, Y., OH, R., BISSADA, N., HOSSAIN, S. M. & YANG, Y.-Z. 2003. Selective striatal neuronal loss in a YAC128 mouse model of Huntington disease. Human Molecular Genetics, 12, 1555-1567.
SMALL, E. C., LEGGETT, S. R., WINANS, A. A. & STALEY, J. P. 2006. The EF-G-like GTPase Snu114p regulates spliceosome dynamics mediated by Brr2p, a DExD/H box ATPase. Molecular Cell, 23, 389-399.
SONKINA, S., TUKHFATULLINA, I. I., BENSENY‐CASES, N., IONOV, M., BRYSZEWSKA, M., SALAKHUTDINOV, B. A. & CLADERA, J. 2010. Interaction of the prion protein fragment PrP 185–206 with biological membranes: effect on membrane permeability. Journal of Peptide Science, 16, 342-348.
SONTAG, E. M., LOTZ, G. P., AGRAWAL, N., TRAN, A., ARON, R., YANG, G., NECULA, M., LAU, A., FINKBEINER, S., GLABE, C., MARSH, J. L., MUCHOWSKI, P. J. & THOMPSON, L. M. 2012. Methylene Blue Modulates Huntingtin Aggregation Intermediates and Is Protective in Huntington's Disease Models. Journal of Neuroscience, 32, 11109-11119.
SOTO, C. 2003. Unfolding the role of protein misfolding in neurodegenerative diseases. Nature Reviews Neuroscience, 4, 49-60.
STACK, E. C., KUBILUS, J. K., SMITH, K., CORMIER, K., DEL SIGNORE, S. J., GUELIN, E., RYU, H., HERSCH, S. M. & FERRANTE, R. J. 2005. Chronology of behavioral symptoms and neuropathological sequela in R6/2 Huntington's disease transgenic mice. Journal of Comparative Neurology, 490, 354-370.
STEELE, A. D., JACKSON, W. S., KING, O. D. & LINDQUIST, S. 2007. The power of automated high-resolution behavior analysis revealed by its application to mouse models of Huntington's and prion diseases. Proceedings of the National Academy of Sciences, 104, 1983-1988.
STEEN, E., TERRY, B. M., RIVERA, E. J., CANNON, J. L., NEELY, T. R., TAVARES, R., XU, X. J., WANDS, J. R. & DE LA MONTE, S. M. 2005. Impaired insulin and insulin-like growth factor expression and signaling mechanisms in Alzheimer's disease - is this type 3 diabetes? Journal of Alzheimers Disease, 7, 63-80.
STOILOV, P., CASTREN, E. & STAMM, S. 2002. Analysis of the human TrkB gene genomic organization reveals novel TrkB isoforms, unusual gene length, and splicing mechanism. Biochemical and Biophysical Research Communications, 290, 1054-1065.
207
STRONG, M. J., VOLKENING, K., HAMMOND, R., YANG, W., STRONG, W., LEYSTRA-LANTZ, C. & SHOESMITH, C. 2007. TDP43 is a human low molecular weight neurofilament (< i> h</i> NFL) mRNA-binding protein. Molecular and Cellular Neuroscience, 35, 320-327.
SUN, Y., SAVANENIN, A., REDDY, P. H. & LIU, Y. F. 2001. Polyglutamine-expanded Huntingtin promotes sensitization of N-methyl-D-aspartate receptors via post-synaptic density 95. Journal of Biological Chemistry, 276, 24713-24718.
SUTHERLAND, G. T., JANITZ, M. & KRIL, J. J. 2011. Understanding the pathogenesis of Alzheimer’s disease: will RNA‐Seq realize the promise of transcriptomics? Journal of Neurochemistry, 116, 937-946.
TABARA, H., YIGIT, E., SIOMI, H. & MELLO, C. C. 2002. The dsRNA binding protein RDE-4 interacts with RDE-1, DCR-1, and a DExX-box helicase to direct RNAi in C-elegans. Cell, 109, 861-871.
TAM, S., SPIESS, C., AUYEUNG, W., JOACHIMIAK, L., CHEN, B., POIRIER, M. A. & FRYDMAN, J. 2009. The chaperonin TRiC blocks a huntingtin sequence element that promotes the conformational switch to aggregation. Nature Structural & Molecular Biology, 16, 1279-U98.
TANAKA, K., KANAZAWA, T., SHIBATA, Y., SUDA, Y., FUKUDA, T., TAKASHIMA, Y. & OKADA, H. 2010. Development of cell-penetrating peptide-modified MPEG-PCL diblock copolymeric nanoparticles for systemic gene delivery. International Journal of Pharmaceutics, 396, 229-238.
TANAKA, M., MACHIDA, Y., NIU, S. Y., IKEDA, T., JANA, N. R., DOI, H., KUROSAWA, M., NEKOOKI, M. & NUKINA, N. 2004. Trehalose alleviates polyglutamine-mediated pathology in a mouse model of Huntington disease. Nature Medicine, 10, 148-154.
TANG, Y., HORIKAWA, I., AJIRO, M., ROBLES, A. I., FUJITA, K., MONDAL, A. M., STAUFFER, J. K., ZHENG, Z. M. & HARRIS, C. C. 2013. Downregulation of splicing factor SRSF3 induces p53 beta, an alternatively spliced isoform of p53 that promotes cellular senescence. Oncogene, 32, 2792-2798.
TAUFFENBERGER, A., CHITRAMUTHU, B. P., BATEMAN, A., BENNETT, H. P. J. & PARKER, J. A. 2013. Reduction of polyglutamine toxicity by TDP-43, FUS and progranulin in Huntington's disease models. Human Molecular Genetics, 22, 782-794.
THAKUR, A. K., JAYARAMAN, M., MISHRA, R., THAKUR, M., CHELLGREN, V. M., BYEON, I. J. L., ANJUM, D. H., KODALI, R., CREAMER, T. P., CONWAY, J. F., GRONENBORN, A. M. & WETZEL, R. 2009. Polyglutamine disruption of the huntingtin exon 1 N terminus triggers a complex aggregation mechanism. Nature Structural & Molecular Biology, 16, 380-389.
THORNE, R. G., EMORY, C. R., ALA, T. A. & FREY, W. H. 1995. QUANTITATIVE-ANALYSIS OF THE OLFACTORY PATHWAY FOR DRUG-DELIVERY TO THE BRAIN. Brain Research, 692, 278-282.
THORNE, R. G., PRONK, G. J., PADMANABHAN, V. & FREY, W. H. 2004. Delivery of insulin-like growth factor-I to the rat brain and spinal cord along olfactory and trigeminal pathways following intranasal administration. Neuroscience, 127, 481-496.
THORSEN, K., SØRENSEN, K. D., BREMS-ESKILDSEN, A. S., MODIN, C., GAUSTADNES, M., HEIN, A.-M. K., KRUHØFFER, M., LAURBERG, S., BORRE, M. & WANG, K. 2008. Alternative splicing in colon, bladder, and prostate cancer identified by exon array analysis. Molecular & Cellular Proteomics, 7, 1214-1224.
TIMMONS, L., COURT, D. L. & FIRE, A. 2001. Ingestion of bacterially expressed dsRNAs can produce specific and potent genetic interference in Caenorhabditis elegans. Gene, 263, 103-112.
TIMMONS, L. & FIRE, A. 1998. Specific interference by ingested dsRNA. Nature, 395, 854-854. TOLLERVEY, J. R., CURK, T., ROGELJ, B., BRIESE, M., CEREDA, M., KAYIKCI, M., KONIG, J.,
HORTOBAGYI, T., NISHIMURA, A. L., ZUPUNSKI, V., PATANI, R., CHANDRAN, S., ROT, G., ZUPAN, B., SHAW, C. E. & ULE, J. 2011. Characterizing the RNA targets and position-dependent splicing regulation by TDP-43. Nature Neuroscience, 14, 452-U180.
TOMÉ, S., MANLEY, K., SIMARD, J. P., CLARK, G. W., SLEAN, M. M., SWAMI, M., SHELBOURNE, P. F., TILLIER, E. R., MONCKTON, D. G. & MESSER, A. 2013. MSH3 polymorphisms and protein levels affect CAG repeat instability in Huntington's disease mice. Plos Genetics, 9, e1003280.
208
TOYAMA, H., ICHISE, M., LIOW, J.-S., VINES, D. C., SENECA, N. M., MODELL, K. J., SEIDEL, J., GREEN, M. V. & INNIS, R. B. 2004. Evaluation of anesthesia effects on [< sup> 18</sup> F] FDG uptake in mouse brain and heart using small animal PET. Nuclear medicine and biology, 31, 251-256.
TSAI, K.-J., YANG, C.-H., FANG, Y.-H., CHO, K.-H., CHIEN, W.-L., WANG, W.-T., WU, T.-W., LIN, C.-P., FU, W.-M. & SHEN, C.-K. J. 2010. Elevated expression of TDP-43 in the forebrain of mice is sufficient to cause neurological and pathological phenotypes mimicking FTLD-U. The Journal of experimental medicine, 207, 1661-1673.
ULE, J., STEFANI, G., MELE, A., RUGGIU, M., WANG, X. N., TANERI, B., GAASTERLAND, T., BLENCOWE, B. J. & DARNELL, R. B. 2006. An RNA map predicting Nova-dependent splicing regulation. Nature, 444, 580-586.
URLAUB, H., RAKER, V. A., KOSTKA, S. & LUHRMANN, R. 2001. Sm protein-Sm site RNA interactions within the inner ring of the spliceosomal snRNP core structure. Embo Journal, 20, 187-196.
VAKA, S. R. K., SAMMETA, S. M., DAY, L. B. & MURTHY, S. N. 2009. Delivery of Nerve Growth Factor to Brain Via Intranasal Administration and Enhancement of Brain Uptake. Journal of Pharmaceutical Sciences, 98, 3640-3646.
VAN DEN BERG, M. P., ROMEIJN, S. G., VERHOEF, J. C. & MERKUS, F. 2002. Serial cerebrospinal fluid sampling in a rat model to study drug uptake from the nasal cavity. Journal of Neuroscience Methods, 116, 99-107.
VAN DEN POL, A. N., DALTON, K. P. & ROSE, J. K. 2002. Relative neurotropism of a recombinant rhabdovirus expressing a green fluorescent envelope glycoprotein. Journal of virology, 76, 1309-1327.
VAN DUSEN, C. M., YEE, L., MCNALLY, L. M. & MCNALLY, M. T. 2010. A Glycine-Rich Domain of hnRNP H/F Promotes Nucleocytoplasmic Shuttling and Nuclear Import through an Interaction with Transportin 1. Molecular and Cellular Biology, 30, 2552-2562.
VAN RAAMSDONK, J. M., WARBY, S. C. & HAYDEN, M. R. 2007. Selective degeneration in YAC mouse models of Huntington disease. Brain Research Bulletin, 72, 124-131.
VANDAM, A., WINKEL, I., ZIJLSTRABAALBERGEN, J., SMEENK, R. & CUYPERS, H. T. 1989. CLONED HUMAN SNRNP PROTEIN-B AND PROTEIN-B' DIFFER ONLY IN THEIR CARBOXY-TERMINAL PART. Embo Journal, 8, 3853-3860.
VANDERWEYDE, T., YOUMANS, K., LIU-YESUCEVITZ, L. & WOLOZIN, B. 2013. Role of stress granules and RNA-binding proteins in neurodegeneration: a mini-review. Gerontology, 59, 524-533.
VENABLES, J. P., KOH, C. S., FROEHLICH, U., LAPOINTE, E., COUTURE, S., INKEL, L., BRAMARD, A., PAQUET, E. R., WATIER, V., DURAND, M., LUCIER, J. F., GERVAIS-BIRD, J., TREMBLAY, K., PRINOS, P., KLINCK, R., ABOU ELELA, S. & CHABOT, B. 2008. Multiple and specific mRNA processing targets for the major human hnRNP proteins. Molecular and Cellular Biology, 28, 6033-6043.
VENKATRAMAN, P., WETZEL, R., TANAKA, M., NUKINA, N. & GOLDBERG, A. L. 2004. Eukaryotic proteasomes cannot digest polyglutamine sequences and release them during degradation of polyglutamine-containing proteins. Molecular Cell, 14, 95-104.
VERALDI, K. L., ARHIN, G. K., MARTINCIC, K., CHUNG-GANSTER, L.-H., WILUSZ, J. & MILCAREK, C. 2001. hnRNP F influences binding of a 64-kilodalton subunit of cleavage stimulation factor to mRNA precursors in mouse B cells. Molecular and Cellular Biology, 21, 1228-1238.
VOISINE, C., VARMA, H., WALKER, N., BATES, E. A., STOCKWELL, B. R. & HART, A. C. 2007. Identification of Potential Therapeutic Drugs for Huntington's Disease using Caenorhabditis elegans. Plos One, 2.
VU, N. T., PARK, M. A., SHULTZ, J. C., GOEHE, R. W., HOEFERLIN, L. A., SHULTZ, M. D., SMITH, S. A., LYNCH, K. W. & CHALFANT, C. E. 2013. hnRNP U Enhances Caspase-9 Splicing and Is Modulated by AKT-dependent Phosphorylation of hnRNP L. Journal of Biological Chemistry, 288, 8575-8584.

209
VYAS, T., TIWARI, S. B. & AMIJI, M. M. 2006. Formulation and physiological factors influencing CNS delivery upon intranasal administration. Critical Reviews™ in Therapeutic Drug Carrier Systems, 23.
WADSWORTH, J. D. & COLLINGE, J. 2011. Molecular pathology of human prion disease. Acta Neuropathologica, 121, 69-77.
WALKER, F. O. 2007. Huntington's disease. Lancet, 369, 218-228. WANG, H., LIM, P. J., VOGEL, B. E. & MONTEIRO, M. J. 2006. Suppression of polyglutamine-induced
toxicity in cell and animal models of Huntington's disease by ubiquilin. Human Molecular Genetics, 15, 1025-1041.
WANG, Z., GERSTEIN, M. & SNYDER, M. 2009. RNA-Seq: a revolutionary tool for transcriptomics. Nature Reviews Genetics, 10, 57-63.
WANKER, E. E., SCHERZINGER, E., HEISER, V., SITTLER, A., EICKHOFF, H. & LEHRACH, H. 1998. Membrane filter assay for detection of amyloid-like polyglutamine-containing protein aggregates. Methods in Enzymology, 309, 375-386.
WATERS, C. W., VARUZHANYAN, G., TALMADGE, R. J. & VOSS, A. A. 2013. Huntington disease skeletal muscle is hyperexcitable owing to chloride and potassium channel dysfunction. Proceedings of the National Academy of Sciences, 110, 9160-9165.
WELLINGTON, C. L., ELLERBY, L. M., GUTEKUNST, C. A., ROGERS, D., WARBY, S., GRAHAM, R. K., LOUBSER, O., VAN RAAMSDONK, J., SINGARAJA, R., YANG, Y. Z., GAFNI, J., BREDESEN, D., HERSCH, S. M., LEAVITT, B. R., ROY, S., NICHOLSON, D. W. & HAYDEN, M. R. 2002. Caspase cleavage of mutant huntingtin precedes neurodegeneration in Huntington's disease. Journal of Neuroscience, 22, 7862-7872.
WHEELER, V. C., AUERBACH, W., WHITE, J. K., SRINIDHI, J., AUERBACH, A., RYAN, A., DUYAO, M. P., VRBANAC, V., WEAVER, M. & GUSELLA, J. F. 1999. Length-dependent gametic CAG repeat instability in the Huntington's disease knock-in mouse. Human Molecular Genetics, 8, 115-122.
WHEELER, V. C., GUTEKUNST, C.-A., VRBANAC, V., LEBEL, L.-A., SCHILLING, G., HERSCH, S., FRIEDLANDER, R. M., GUSELLA, J. F., VONSATTEL, J.-P. & BORCHELT, D. R. 2002. Early phenotypes that presage late-onset neurodegenerative disease allow testing of modifiers in Hdh CAG knock-in mice. Human Molecular Genetics, 11, 633-640.
WHEELER, V. C., WHITE, J. K., GUTEKUNST, C.-A., VRBANAC, V., WEAVER, M., LI, X.-J., LI, S.-H., YI, H., VONSATTEL, J.-P. & GUSELLA, J. F. 2000. Long glutamine tracts cause nuclear localization of a novel form of huntingtin in medium spiny striatal neurons in HdhQ92 and HdhQ111 knock-in mice. Human Molecular Genetics, 9, 503-513.
WHITE, J. G., SOUTHGATE, E., THOMSON, J. N. & BRENNER, S. 1986. THE STRUCTURE OF THE NERVOUS-SYSTEM OF THE NEMATODE CAENORHABDITIS-ELEGANS. Philosophical Transactions of the Royal Society of London Series B-Biological Sciences, 314, 1-340.
WHITE, J. K., AUERBACH, W., DUYAO, M. P., VONSATTEL, J.-P., GUSELLA, J. F., JOYNER, A. L. & MACDONALD, M. E. 1997. Huntingtin is required for neurogenesis and is not impaired by the Huntington's disease CAG expansion. Nature Genetics, 17, 404-410.
WHITE, M. D., FARMER, M., MIRABILE, I., BRANDNER, S., COLLINGE, J. & MALLUCCI, G. R. 2008a. Single treatment with RNAi against prion protein rescues early neuronal dysfunction and prolongs survival in mice with prion disease. Proceedings of the National Academy of Sciences, 105, 10238-10243.
WHITE, M. D., FARMER, M., MIRABILE, I., BRANDNER, S., COLLINGE, J. & MALLUCCI, G. R. 2008b. Single treatment with RNAi against prion protein rescues early neuronal dysfunction and prolongs survival in mice with prion disease. Proceedings of the National Academy of Sciences of the United States of America, 105, 10238-10243.
WILL, C. L. & LUHRMANN, R. 2005. Splicing of a rare class of introns by the U12-dependent spliceosome. Biological Chemistry, 386, 713-724.
210
WILLINGHAM, S., OUTEIRO, T. F., DEVIT, M. J., LINDQUIST, S. L. & MUCHOWSKI, P. J. 2003. Yeast genes that enhance the toxicity of a mutant huntingtin fragment or α-synuclein. Science, 302, 1769-1772.
WILS, H., KLEINBERGER, G., JANSSENS, J., PERESON, S., JORIS, G., CUIJT, I., SMITS, V., CEUTERICK-DE GROOTE, C., VAN BROECKHOVEN, C. & KUMAR-SINGH, S. 2010. TDP-43 transgenic mice develop spastic paralysis and neuronal inclusions characteristic of ALS and frontotemporal lobar degeneration. Proceedings of the National Academy of Sciences, 107, 3858-3863.
WONG, J., GARNER, B., HALLIDAY, G. M. & KWOK, J. B. J. 2012. Srp20 regulates TrkB pre-mRNA splicing to generate TrkB-Shc transcripts with implications for Alzheimer's disease. Journal of Neurochemistry, 123, 159-171.
WOOD, W. B. 1988. 1 Introduction to C. elegans Biology. Cold Spring Harbor Monograph Archive, 17, 1-16.
WYTTENBACH, A., SAUVAGEOT, O., CARMICHAEL, J., DIAZ-LATOUD, C., ARRIGO, A. P. & RUBINSZTEIN, D. C. 2002. Heat shock protein 27 prevents cellular polyglutamine toxicity and suppresses the increase of reactive oxygen species caused by huntingtin. Human Molecular Genetics, 11, 1137-1151.
XI, L., FEBER, A., GUPTA, V., WU, M., BERGEMANN, A. D., LANDRENEAU, R. J., LITLE, V. R., PENNATHUR, A., LUKETICH, J. D. & GODFREY, T. E. 2008. Whole genome exon arrays identify differential expression of alternatively spliced, cancer-related genes in lung cancer. Nucleic Acids Research, 36, 6535-6547.
XIAO, R., TANG, P., YANG, B., HUANG, J., ZHOU, Y., SHAO, C. W., LI, H. R., SUN, H., ZHANG, Y. & FU, X. D. 2012. Nuclear Matrix Factor hnRNP U/SAF-A Exerts a Global Control of Alternative Splicing by Regulating U2 snRNP Maturation. Molecular Cell, 45, 656-668.
YAMAMOTO, A., LUCAS, J. J. & HEN, R. 2000. Reversal of neuropathology and motor dysfunction in a conditional model of Huntington's disease. Cell, 101, 57-66.
YOSHIDA, T., KOKURA, K., MAKINO, Y., OSSIPOW, V. & TAMURA, T. A. 1999. Heterogeneous nuclear RNA‐ribonucleoprotein F binds to DNA via an oligo (dG)‐motif and is associated with RNA polymerase II. Genes to Cells, 4, 707-719.
YU, S. Y., ZHAO, Y., WU, F. L., ZHANG, X., LU, W. L., ZHANG, H. & ZHANG, Q. 2004. Nasal insulin delivery in the chitosan solution: in vitro and in vivo studies. International Journal of Pharmaceutics, 281, 11-23.
YU, Z.-X., LI, S.-H., EVANS, J., PILLARISETTI, A., LI, H. & LI, X.-J. 2003. Mutant huntingtin causes context-dependent neurodegeneration in mice with Huntington's disease. The Journal of neuroscience, 23, 2193-2202.
YUGAMI, M., KABE, Y., YAMAGUCHI, Y., WADA, T. & HANDA, H. 2007. hnRNP-U enhances the expression of specific genes by stabilizing mRNA. Febs Letters, 581, 1-7.
YUO, C. Y., LIN, H. H., CHANG, Y. S., YANG, W. K. & CHANG, J. G. 2008. 5-(N-ethyl-N-isopropyl)-amiloride enhances SMN2 Exon 7 inclusion and protein expression in spinal muscular atrophy cells. Annals of Neurology, 63, 26-34.
YURYEV, A., PATTURAJAN, M., LITINGTUNG, Y., JOSHI, R. V., GENTILE, C., GEBARA, M. & CORDEN, J. L. 1996. The C-terminal domain of the largest subunit of RNA polymerase II interacts with a novel set of serine/arginine-rich proteins. Proceedings of the National Academy of Sciences of the United States of America, 93, 6975-6980.
ZÁDORI, D., NYIRI, G., SZŐNYI, A., SZATMÁRI, I., FÜLÖP, F., TOLDI, J., FREUND, T. F., VÉCSEI, L. & KLIVÉNYI, P. 2011. Neuroprotective effects of a novel kynurenic acid analogue in a transgenic mouse model of Huntington’s disease. Journal of neural transmission, 118, 865-875.
ZALA, D., BENSADOUN, J.-C., PEREIRA DE ALMEIDA, L., LEAVITT, B. R., GUTEKUNST, C.-A., AEBISCHER, P., HAYDEN, M. R. & DÉGLON, N. 2004. Long-term lentiviral-mediated expression of ciliary neurotrophic factor in the striatum of Huntington's disease transgenic mice. Experimental neurology, 185, 26-35.
211
ZARRINGHALAM, K., KA, M., KOOK, Y.-H., TERRANOVA, J. I., SUH, Y., KING, O. D. & UM, M. 2012. An open system for automatic home-cage behavioral analysis and its application to male and female mouse models of Huntington's disease. Behavioural brain research, 229, 216-225.
ZHANG, K., SMOUSE, D. & PERRIMON, N. 1991. THE CROOKED NECK GENE OF DROSOPHILA CONTAINS A MOTIF FOUND IN A FAMILY OF YEAST-CELL CYCLE GENES. Genes & Development, 5, 1080-1091.
ZHANG, S., BINARI, R., ZHOU, R. & PERRIMON, N. 2010. A genomewide RNA interference screen for modifiers of aggregates formation by mutant Huntingtin in Drosophila. Genetics, 184, 1165-1179.
ZHANG, Y. U., LI, M. W., DROZDA, M., CHEN, M. H., REN, S. J., SANCHEZ, R. O. M., LEAVITT, B. R., CATTANEO, E., FERRANTE, R. J., HAYDEN, M. R. & FRIEDLANDER, R. M. 2003. Depletion of wild-type huntingtin in mouse models of neurologic diseases. Journal of Neurochemistry, 87, 101-106.
ZIELSKE, S. P., LINGAS, K. T., LI, Y. & GERSON, S. L. 2004. Limited lentiviral transgene expression with increasing copy number in an MGMT selection model: lack of copy number selection by drug treatment. Molecular Therapy, 9, 923-931.
ZUCCATO, C., VALENZA, M. & CATTANEO, E. 2010. Molecular mechanisms and potential therapeutical targets in Huntington's disease. Physiological Reviews, 90, 905-981.
ZWILLING, D., HUANG, S. Y., SATHYASAIKUMAR, K. V., NOTARANGELO, F. M., GUIDETTI, P., WU, H. Q., LEE, J., TRUONG, J., ANDREWS-ZWILLING, Y., HSIEH, E. W., LOUIE, J. Y., WU, T., SCEARCE-LEVIE, K., PATRICK, C., ADAME, A., GIORGINI, F., MOUSSAOUI, S., LAUE, G., RASSOULPOUR, A., FLIK, G., HUANG, Y. D., MUCHOWSKI, J. M., MASLIAH, E., SCHWARCZ, R. & MUCHOWSKI, P. J. 2011. Kynurenine 3-Monooxygenase Inhibition in Blood Ameliorates Neurodegeneration. Cell, 145, 863-874.