factors affecting teachers’ adoption of technology in classrooms: does school size matter?
TRANSCRIPT

HSIN-KAI WUj, YING-SHAO HSU and FU-KWUN HWANG
FACTORS AFFECTING TEACHERS’ ADOPTION OF TECHNOLOGY
IN CLASSROOMS: DOES SCHOOL SIZE MATTER?
Received 9 June 2006; accepted 27 September 2006
ABSTRACT. Researchers in educational technology have searched for factors to explain
teachers_ acceptance and resistance to using technology for instruction. Among the many
identified factors, however, organizational and school factors have not yet been explored
and discussed. This study investigates the effects of school size on science and
mathematics teachers_ adoption of technology in classrooms. Using national survey data
collected from 940 science and mathematics teachers at junior high schools in Taiwan,
we employed factor analyses, log-linear analyses, and three-way ANOVA techniques to
examine interactions among school factors and teacher factors. Results obtained from the
log-linear analyses suggested that both the interactions of school region with school size
and school size with technology users were needed to explain teachers_ use of
educational technology in classrooms. It appears that teachers at small schools were
more likely to use technology for instructional purposes. Additionally, results of the
study revealed that teachers at small schools tended to have positive attitudes toward
technology use and that among users of educational technology in southern Taiwan,
teachers at small schools designed and used significantly more instructional activities
with technology. This study suggests that small schools provide a better environment for
science and mathematics teachers to implement educational technology in instruction.
KEY WORDS: adoption of technology, classroom instruction, school size
INTRODUCTION
Integrating technology into instruction has been viewed as a key idea in
current education reform in many countries (Demetriadis, Barbas,
Molohides, Palaigeorgious, Psillos, Vlahavas et al., 2003; Lim & Hang,
2003; National Research Council, 1996; van Braak, 2001). Investment in
educational technology continues to increase and new technologies such
as computers, televisions, video players, and projectors have been intro-
duced into classrooms. However, most teachers do not use these tech-
nologies in classrooms as frequently as policy makers and researchers
expect (Cuban, 1986). Even though some teachers integrate technology
into instruction, their use is not innovative but to sustain their existing
practice (Cuban, Kirkpatrick & Peck, 2001; Zhao & Frank, 2003).Numerous researchers have searched for factors to explain teachers_
acceptance and resistance to using technology for instruction. Various
jAuthor for Correspondence.
International Journal of Science and Mathematics Education (2007) 6: 63Y85# National Science Council, Taiwan (2007)

factors that are closely related to teachers_ adoption of technology have
been found and examined. These factors include: teachers_ beliefs and
attitude about technology (Dwyer, Ringstaff & Sandholtz, 1991; Gallini &
Barron, 2001; Windschitl & Sahl, 2002), school support and resources
(Czerniak, Haney, Lumpe & Beck, 1999), school culture (Demetriadis
et al., 2003; Zhao, Pugh, Sheldon & Byers, 2002), collegiality among
teachers (Becker, 1994), characteristics of technology (Gbomita, 1997),
and subject taught (Becker & Ravitz, 1999; van Braak, 2001; Yaghi,
2001). Although these studies seem to provide a comprehensive list of
factors, some factors and issues that have been identified by research on
educational reform have not been discussed and analyzed. For example,
lessons learned from recent research on educational reform have raised
an issue of school size to prominence (Hargreaves & Fink, 2000; Lee &
Smith, 1997). Compared with small schools, large schools are usually
more bureaucratic and provide lower levels of social support and in-
timacy among teachers and students (Lee & Loeb, 2000). This in turn
may become a barrier to the procurement of social and technical re-
sources and affect teachers_ enactment of innovative practices such as
integrating technology into instruction. Reducing school size is also one
of the eight key reform tasks in Taiwan (Ministry of Education [MOE],
2006) but no empirical research has been done to examine the impact of
school size on teaching and learning in Taiwan (Huang, 1999). In this
study, therefore, school size is considered as a factor that can potentially
affect teachers_ use of educational technology in classrooms.In order to explore interactions among school and teacher factors that
affect teachers_ use of educational technology in classrooms, we
conducted a national, representative survey in Taiwan and collected data
from over nine hundred science and mathematics teachers in junior high
schools. Two research questions guided the study: (1) Do junior high
school region and size affect science and mathematics teachers_ use of
technology? (2) Do junior high school region, size, and teachers_ use of
technology affect teachers_ beliefs, attitudes, practices, and needs
concerning educational technology? The results can provide policy and
practical suggestions for implementing educational technology in schools.
BACKGROUND
Factors Affecting Teachers_ Adoption of Technology
A review of the literature on technology and learning has concluded that
educational technology has great potential to enhance student achieve-
HSIN-KAI WU ET AL.64

ment when it is used appropriately (Kozma, 1991; Wu & Shah, 2004). In
this study, educational technology refers to a range of digital hardware
and software used to support teaching and learning, including desktop,
laptop, and handheld computers and applications. Regardless of the
potential educational benefits, however, computer usage in classrooms
remains disappointingly low. Technology has usually been used for
supporting teachers_ existing practice (Cuban et al., 2001; Loveless,
1996) instead of enacting innovative practice such as creating funda-
mentally different learning environments in classrooms (Dwyer et al.,
1991). To understand how technology can be effectively used in class-
rooms, numerous researchers have searched for factors (e.g., teachers_beliefs, school culture, and teachers_ computer literacy) to explain teachers_acceptance and resistance to using technology for instruction. Based on the
characteristics of these factors, they can be categorized into three domains:
teacher, technology, and context.Factors in the first domain include those that are strongly associated
with individual teachers_ affection, abilities, and skills. A number of
studies indicated that teachers_ pedagogical beliefs about learners and
technology contribute significantly to the success of classroom technol-
ogy innovations (Gbomita, 1997; Windschitl & Sahl, 2002). Teachers
who believe that technology can more effectively achieve teaching goals
than conventional teaching methods are more likely to adopt technology
into instruction (Czerniak et al., 1999). Additionally, teachers_ techno-
logical skills (e.g., technology proficiency and computer literacy) are
critical for successful implementation of classroom technology (Zhao et
al., 2002). Teachers should understand the enabling conditions of certain
technologies in order to engage students in technology-based learning
activities successfully. Teachers who have lower technology proficiency
are usually not willing and have less confidence to use technology for
teaching (Windschitl & Sahl, 2002).The characteristics of technology also shape teachers_ adoption deci-
sions. For example, van Braak (2001) showed that teachers are reluctant
to use computer-mediated communication technology when they realize
that there is a mismatch between the nature of the communication tech-
nology and their teaching practice. Thus, factors in the second domain
concern the nature of technology itself (e.g., the degree of technology
innovativeness and the characteristics of computers) and its relationship
to existing teaching practice (Gbomita, 1997). For a successful technol-
ogy implementation to happen, the type of technology and its underlying
nature should be aligned with the existing teaching methods and school
culture (Zhao et al., 2002). If the technology innovation deviates from
TEACHERS, ADOPTION OF TECHNOLOGY 65

the status quo, teachers have to change the structure of their classes or
practice in order to accommodate innovative technology.A third set of factors that affect teachers_ adoption of technology in
classrooms is associated with the context in which the innovations take
place. The contextual factors include collegiality among teachers (Becker,
1994), social support and resources (Czerniak et al., 1999), and school
culture (Zhao et al., 2002). It has been found that collegiality among
teachers plays a critical role in helping computer-using teachers develop
high-quality practice with technology (Windschitl & Sahl, 2002). In
Becker (1994), a majority of exemplary computer-using teachers
(particularly those teaching science and English) worked in a school
with many other computer-using teachers. In addition to social support
from colleagues, perceived support from the school influences teachers_adoption decision. Czerniak et al. (1999) found that although many
teachers share beliefs that educational technology could promote
learning and that the use of technology is desirable, they are reluctant
to use educational technology because of insufficient support and
resources provided by schools. Another contextual factor is school
culture that refers to the common set of values, beliefs, and practices of
the teachers and administrators at a school. Technology is likely to be
implemented at schools where the use of technology is consistent with
the existing beliefs and practices of school members (Zhao et al., 2002).When taken together, the studies reviewed above seem to provide a
comprehensive list of factors. But a closer look reveals that few studies
systematically investigated the interactions among factors and that
organizational structures have not yet been taken into account in the
context domain. Drawing upon research in history and sociology of
education, some researchers suggested that adoption of educational
technology in classrooms involves complex interplays across human,
technological, and organizational structures (Cohen, 1987; Kerr, 1996).
One structural factor found to have impact on students_ achievement and
teachers_ attitude is school size (Lee & Loeb, 2000). In attempting to
incorporate educational technology into a broader educational reform
context, this study takes structural factors such as school size and school
region into consideration and explores how these school factors interact
with teachers_ adoption of technology in classrooms.
Research on School Size
Extending existing empirical work on school structure and organization,
research on the issue of school size has received considerable attention in
HSIN-KAI WU ET AL.66

recent years (Fritzberg, 2001; Hargreaves & Fink, 2000; Lee & Smith,
1997). A traditional view of school structure supports large and compre-
hensive schools because teachers can specialize in specific fields, more
types of courses can be offered, and school savings increase through
reduced redundancy (Buzacott, 1982). Yet, recent studies have contradicted
this traditional view. The findings regarding students_ achievement
consistently support the idea that smaller elementary and secondary schools
do better to help disadvantaged students excel (Howley, 1996; Lee & Loeb,
2000; Lee & Smith, 1997). A smaller school has various advantages to
support learning such as facilitating personalized social interactions, promot-
ing intimacy among school members, increasing accessibility of resources, and
enhancing collective responsibility (Fritzberg, 2001; Lee & Loeb, 2000).However, the research on school size has long emphasized its effects on
students. Little is known about whether school size has an impact on
teachers. One exception is the study conducted by Lee & Loeb (2000).
They found that teachers at small elementary schools have a more
positive attitude about their responsibility for students_ learning, which
in turn influences student learning. This suggests that to better
understand how school size affects learning, research on school
organization should not ignore its potential impact on teachers_ practice,
attitude, and perceived support.Additionally, Bsmall classes, small schools^ has been one of the most
important educational policies in Taiwan since 1998 (MOE, 2006). The
Commission on Educational Reform in Taiwan believed that this policy
could help students have access to more educational resources and a
better quality of classroom instruction. Yet, no empirical evidence was
provided to support the policy. In this study, therefore, school size is
considered as an important factor that can potentially affect teachers_ use
of educational technology in classrooms. Using national survey data
collected from over nine hundred science and mathematics teachers in
Taiwan, we explore interactions among school and teacher factors. Our
findings will inform researchers and policy makers about the impact of
school size on teachers and their teaching practices.
METHODS
Sample
The population under investigation consisted of all science and
mathematics teachers actively teaching in junior high schools (age range
13Y15 years) in Taiwan. The stratified random sampling strategy was
TEACHERS, ADOPTION OF TECHNOLOGY 67

employed to select the sample. Because school region and school size
could affect budgetary decisions, urban schools located in northern
Taiwan tended to have more financial and technical resources to support
the adoption of computers. Thus, the key strata of interest in our analysis
were: school region (northern, central, southern, or eastern) and school
size (large, medium, or small). Size of the school was determined by the
number of classes in the school: large (having more than 37 classes [over
1300 students]), medium (having 16Y36 classes [560Y1300 students]),
and small (less than 15 classes [560 students or less]).Among the total of 892 junior high schools in Taiwan, approximately
11% of them (99 schools) were selected. Of the 2,019 questionnaires
mailed out, 1,002 replies from 82 schools were received (82.8% school
response rate and 49.6% teacher response rate). The distribution of
responding teachers is shown in Table I. The teacher response rate
ranged from 34% to 76% across regions and school sizes. Responses
with missing values were removed from the sample and the final
statistics were examined for 940 respondents.
Instrument
A questionnaire was developed to collect information on teachers_ use of
technology in classrooms. Some of the items were selected from various
existing questionnaires that focused on teachers_ beliefs and attitudes
toward using computers in classrooms (Becker, 1994; Czerniak et al.,
1999). The questionnaire content was divided into four sections: (1)
demographic data of teachers, (2) experiences in technology use for
instructional purposes, (3) opinions about professional development for
technology-based instruction, and (4) attitudes and beliefs about
technology-based learning and instruction. Demographic data of teachers
included information about age, gender, years of teaching, school size
and school region. In the second section, the response format was yes/no
to indicate whether the respondent was a user or a non-user of
technology for instructional purposes. Items in the latter two sections
were rated on a 5-point Likert-type scale from 1 (strongly disagree) to 5
(strongly agree) and factor analytical techniques were used to determine
the underlying structure of teachers_ responses to items in these two
sections.Principal axis factor analysis with varimax rotations was employed.
Both the Kaiser-Meyer-Olkin measure of sampling adequacy (0.898) and
Bartlett test of sphericity (c2(496, N=940)=4931.98, pG0.0001) were
significant, indicating that factor analysis was suitable in the sample. By
HSIN-KAI WU ET AL.68

TA
BL
EI
Th
ed
istr
ibu
tio
no
fre
spo
nd
ing
teac
her
s
Nu
mb
ero
fsc
ho
ols
Nu
mb
ero
fte
ach
ers
To
tal
Mai
led
Res
po
nd
edR
esp
on
sera
teM
aile
dR
espo
nd
edR
espo
nse
rate
Fin
alsa
mple
No
rth
ern
Lar
ge
13
11
41
28
6%
55
52
39
43
%2
06
Med
ium
11
31
31
18
5%
20
71
17
57
%1
17
Sm
all
90
10
88
0%
78
46
59
%4
2
Cen
tral
Lar
ge
72
99
10
0%
38
51
90
49
%1
79
Med
ium
95
99
10
0%
17
61
17
66
%1
16
Sm
all
77
97
78
%8
64
85
6%
44
So
uth
ern
Lar
ge
62
64
67
%2
13
72
34
%6
5
Med
ium
75
97
78
%1
46
86
59
%8
4
Sm
all
78
96
67
%5
62
54
5%
25
Eas
tern
Lar
ge
91
11
00
%3
32
57
6%
24
Med
ium
23
32
67
%4
91
83
7%
17
Sm
all
67
76
86
%3
52
36
6%
21
To
tal
89
29
98
28
3%
20
19
10
06
50
%9
40
TEACHERS, ADOPTION OF TECHNOLOGY 69

using the Cattell_s scree test and examining the factor loadings of the
items, we removed seven items from the questionnaire, and five factors
emerged. According to the items correlating with the factors, we
assigned a descriptive name to each of the factors. These factors were:
(1) teaching practices with technology (e.g., I have designed activities
that allowed students to learn through the Internet), (2) attitudes toward
technology-based instruction (e.g., I think technology is helpful for my
teaching), (3) beliefs about technology-based instruction (e.g., I believe
that technology-based instruction will promote students_ motivation), (4)
needs for professional development in technology-based instruction (e.g.,
I hope that teacher workshops can provide more real-world examples of
technology-based instruction), and (5) technical and personnel resources
available in school (e.g., In my school, the technology facilities are
adequate for technology-based instruction.). The factor loadings of the
32 items ranged from 0.84 to 0.45 (see details in Table VI, Appendix A).
Scale reliability was evaluated using Cronbach_s alpha. The internal
consistency of the instrument was high (alpha=0.90).
Data Analysis
The Statistical Package for Social Science (SPSS 12.0 for Windows) was
used to analyze the data. Because of the large sample size (N = 940), the
statistical coefficients for evaluating the data were set at .05 for the level of
significance and 95% for the confidence interval. The five factors emerging
from the factor analysis were combined with two demographic factors
(school region and school size) and a user factor (educational technology
user or non-user). We used descriptive statistical techniques, factor
analyses, log-linear analyses, and 3-way ANOVA techniques to examine
correlations and interactions among variables and factors. Log-linear model
techniques allowed for testing the various contributions of school region,
school size and their interactions in explaining whether teachers were users
or non-users of educational technology. Three-way ANOVA techniques
were employed to examine the effects of school region, school size, and
teachers_ use of educational technology on the dependent measures
(including practice, attitude, belief, need, and school resource).
RESULTS
The results are presented in three sections. The first section shows the
descriptive statistics associated with three factors (school size, school
HSIN-KAI WU ET AL.70

region, and use of educational technology) and five dependent measures
(teacher practice, attitude, belief, need, and school resource). In the
second section, results of log-linear analyses are presented and
interactive effects among school size, school region, and teachers_ use
of educational technology are shown. The third section outlines the
effects of school size, school region, and use of educational technology
on the five dependent measures.
Descriptive Analyses
Because of the high population density in northern and central Taiwan,
74.9% of the participants came from these two regions (see Table II).
Less than 7% of the participants came from the eastern region which was
considerably less urbanized compared with the other three regions.
Additionally, over 80% of the participants taught at large and medium-
sized schools. Approximate 50% of the teachers taught at large schools,
while 14% taught at small schools.According to the participants_ responses on the second section of the
questionnaire (e.g., experiences in technology use for instructional
purposes), 65.2% of the teachers in this sample have used technology
for instructional purposes, and were identified as users of educational
technology in this study. Across regions and school sizes, the users of
educational technology ranged from 56.9% to 83.3%. It seems that
participating teachers who taught at small schools were more likely to
use educational technology (Figure 1). The significance of the tendency
will be later examined by log-linear analyses.Table III outlines the mean scale scores and standard deviations for
technology users_ and non-users_ practices, attitudes, beliefs, needs, and
resources. Compared with the teachers at medium-sized and large
schools, the teachers at small schools tended to have higher mean scores
on all of the dependent measures. It is not surprising that users of edu-
cational technology seemed to hold more positive beliefs and attitudes
toward technology and have more resources to support technology-based
instruction. Yet, the mean scores on teachers_ needs were high for both
users and non-users. This indicates that a majority of participating
teachers felt a need for professional development opportunities in order
to gain experience and resources about technology-based instruction.There were intercorrelations among teachers_ practices, attitudes,
beliefs, needs, and resources (Table IV). The values of the Pearson
correlation coefficient ranged from 0.633 to 0.100 and revealed high
positive correlations among practice, attitude, and belief.
TEACHERS, ADOPTION OF TECHNOLOGY 71

TA
BL
EII
Des
crip
tiv
est
atis
tics
of
sch
oo
lre
gio
n,
sch
oo
lsi
ze,
and
teac
her_s
use
of
tech
no
log
y
Sch
oo
lre
gio
n
Sch
oo
lsi
ze(N
=9
40
)
Lar
ge
Med
ium
Sm
all
n
%w
ith
in
sch
ool
size
%o
fto
tal
n
%w
ith
in
sch
oo
lsi
ze%
of
tota
ln
%w
ith
in
sch
ool
size
%o
fto
tal
No
rth
ern
20
62
1.9
1%
11
71
2.4
5%
42
4.4
7%
Use
r1
37
66
.5%
14
.57
%8
37
0.9
%8
.83%
35
83
.3%
3.7
2%
No
n-u
ser
69
33
.5%
7.3
4%
34
29
.1%
3.6
2%
71
6.7
%0
.74%
Cen
tral
17
91
9.0
4%
11
61
2.3
4%
44
4.6
8%
Use
r1
03
57
.5%
10
.96
%6
85
8.6
%7
.23%
33
75
.0%
3.5
1%
No
n-u
ser
76
42
.5%
8.0
9%
48
41
.1%
5.1
1%
11
25
.0%
1.1
7%
So
uth
ern
65
6.9
1%
84
8.9
4%
25
2.6
6%
Use
r3
75
6.9
%3
.94%
56
66
.7%
5.9
6%
18
72
.0%
1.9
1%
No
n-u
ser
28
43
.1%
2.9
8%
28
33
.3%
2.9
8%
72
8.0
%0
.74%
Eas
tern
24
2.5
5%
17
1.8
1%
21
2.2
3%
Use
r1
56
2.5
%1
.60%
12
70
.6%
1.2
8%
16
76
.2%
1.7
0%
No
n-u
ser
93
7.5
%0
.96%
52
9.4
%0
.53%
52
3.8
%0
.53%
HSIN-KAI WU ET AL.72

Log-Linear Analyses
For our analysis of teachers_ use of technology, the potential interactive
effects of school region and school size were considered. We analyzed 4
(region)�3 (size)�2 (technology use) contingency tables by using
hierarchical log-linear analyses (Agresti, 1990; Salter, 2003). The
analyses tested various hierarchical models, starting with simple main
effects and working up to two-way interactions, a combination of two-
way interaction, and more complex three-way interaction until the model
which best described the data was identified. Results of log-linear
analyses indicated that in addition to the saturated model (combining the
three-way interaction, two-way interactions, and main effects), three of
the log-linear models seemed to offer promising fits to the observed data.
The most parsimonious model was: constant+school region�school
size+school size�user (G2(9, N = 940) = 9.616, p = 0.382). The likelihood
ratio chi-square indicated that a combination of the two-way interactions
40
45
50
55
60
65
70
75
80
85
90
Northern Central Southern Eastern
School Region
% w
ithin
Sch
ool S
ize
small
mediumlarge
Figure 1. The percentage of technology users (within the same school size) at small,
medium-sized, and large schools in the northern, central, southern, and eastern regions
TEACHERS, ADOPTION OF TECHNOLOGY 73

was not significantly different from the saturated model in accounting for
the distribution of teachers_ use of technology in classrooms.To identify outliers, we used residual analyses to examine where the
parsimonious model was not fitting well. In the model, technology non-
users at medium-sized schools in the central region were slightly over
represented (adjusted deviance residual = 1.236), while technology non-
users at large schools in the northern region were slightly under
represented. Yet, none of the absolute adjusted deviance residuals were
significant (absolute residuals ranging from 1.236 to 0.056), so overall
TABLE III
Mean scale scores and standard deviations for teachers_ practices, attitudes, beliefs,
needs, and resources (N=940)
Condition
Practice Attitude Belief Need Resource
Mean SD Mean SD Mean SD Mean SD Mean SD
Northern
Large 2.90 0.76 3.62 0.60 3.40 0.62 3.99 0.59 3.19 0.74
Medium 3.05 0.73 3.60 0.54 3.36 0.60 4.06 0.57 3.15 0.67
Small 3.19 0.60 3.87 0.49 3.60 0.61 4.14 0.55 3.16 0.71
Central
Large 2.85 0.77 3.67 0.51 3.45 0.59 3.95 0.52 3.13 0.73
Medium 2.98 0.71 3.71 0.54 3.47 0.56 3.98 0.55 3.11 0.69
Small 3.09 0.53 3.77 0.41 3.57 0.54 3.97 0.53 3.50 0.71
Southern
Large 2.73 0.61 3.60 0.48 3.40 0.67 4.04 0.56 3.06 0.69
Medium 2.81 0.78 3.57 0.57 3.43 0.65 3.87 0.62 3.03 0.75
Small 3.13 0.85 3.84 0.60 3.50 0.77 3.98 0.46 2.90 0.77
Eastern
Large 3.06 0.91 3.70 0.66 3.38 0.57 4.08 0.60 3.25 0.70
Medium 2.94 0.78 3.66 0.64 3.48 0.47 4.00 0.56 3.32 0.45
Small 3.10 0.59 3.77 0.48 3.55 0.61 4.15 0.52 3.16 0.58
Total
Northern 2.98 0.74 3.64 0.57 3.41 0.61 4.03 0.58 3.17 0.71
Central 2.93 0.72 3.70 0.51 3.47 0.57 3.97 0.53 3.17 0.73
Southern 2.83 0.74 3.62 0.55 3.43 0.67 3.95 0.58 3.02 0.73
Eastern 3.04 0.77 3.71 0.59 3.47 0.56 4.08 0.56 3.24 0.59
Total
Large 2.87 0.75 3.64 0.55 3.42 0.61 3.99 0.56 3.15 0.73
Medium 2.96 0.74 3.64 0.55 3.42 0.59 3.98 0.58 3.11 0.69
Small 3.13 0.63 3.81 0.48 3.56 0.62 4.06 0.52 3.22 0.73
Total
User 3.19 0.63 3.76 0.52 3.54 0.57 4.01 0.55 3.21 0.72
Non-user 2.46 0.69 3.49 0.55 3.25 0.62 3.97 0.58 3.03 0.69
HSIN-KAI WU ET AL.74

the model was a well-fitting one. Parameter estimates showed that all
combinations of interacting values were significantly contributing to the
explanation of the distribution of data except [school region = sou-
thern]�[school size = small] (Z = 0.589, p = 0.556) and [school region =
eastern]�[school size = medium] (Z = 0.550, p = 0.583). On the other
hand, the highest Z values on [school region = northern]�[school size =
large] (Z = 9.831, p G .001) and [school region=central]�[school size =
large] (Z = 9.297, p G.001) showed that the two combinations contributed
the most to the overall strength of the relationships in the distribution.Results obtained from the log-linear analyses suggested that both
the interactions of school region with school size and school size
with technology users were needed to explain teachers_ use of
educational technology. The school region affected school size indepen-
dent of technology use and the school size affected technology use
independent of school region. That is, the distribution of large, medium-
sized, and small schools was strongly associated with where the school
was located, but school region did not affect technology use. On the
other hand, the school size factor played an important role in explaining
the observed data. Size of the school had significant impact on teachers_use of technology; teachers at small schools were more likely to use
technology for instructional purposes. To further explore interactions
between school size and teacher factors, below we examine the effects of
school size on teachers_ practices, attitudes, beliefs, needs, and resources.
Effects of School Region, School Size, And Use of Educational
Technology
In order to examine the effects of school region, school size, and teachers_use of educational technology on the dependent measures (including
teacher practice, attitude, belief, need, and school resource), a 4 (region)�
TABLE IV
Correlation matrix for the five teacher factors (N=940)
Pearson correlation Practice Attitude Belief Need Resource
Practice 1
Attitude 0.460** 1
Belief 0.430** 0.633** 1
Need 0.112** 0.315** 0.238** 1
Resource 0.274** 0.266** 0.175** 0.100** 1
**Correlation is significant at the 0.01 level (2-tailed).
TEACHERS, ADOPTION OF TECHNOLOGY 75

3 (size)�2 (technology use) three-way ANOVA was performed. Table III
presents the means and standard deviations for the dependent measures.
Table V summarizes the 3-way ANOVA results for school region, school
size, and technology use.
INTERACTION EFFECT. There was no significant 2-way interaction
(see Table V). There was, however, a significant 3-way interaction on
teachers_ practice, multivariate F (6, 916) = 2.374, pG .05. A series of 2-
way ANOVA tests were computed to investigate the nature of the
interaction. Two simple interaction effects were significant: school
size�technology use at schools in the southern region F(2, 168) = 4.517,
p G .05, and school region�technology use at small schools F(3, 124) =
3.182, p G .05. The profile plots (Figure 2) indicated that users and non-
users of educational technology in southern Taiwan displayed opposite
tendencies in terms of their teaching practice and that users at small
schools in this region expressed stronger agreement on items regarding
the implementation of instructional technology. Similarly, users and non-
users of educational technology at small schools demonstrated distinct
patterns across regions in terms of their teaching practices (Figure 2).Additional follow-up tests were conducted to examine where the
significant differences lay. For technology users in the southern region,
school size had a significant simple main effect on teaching practice F(2,
TABLE V
Summary of three-way ANOVA results for school region, school size, and use of
educational technology
Condition
Practice Attitude Belief Need Resource
F p F p F p F p F p
Main effect
School region 2.00 0.11 0.49 0.69 0.36 0.78 1.70 0.16 4.36 0.00**
School size 1.36 0.26 3.21 0.04* 0.96 0.38 0.78 0.46 0.07 0.93
Technology use 128.09 0.00** 27.85 0.00** 25.72 0.00** 0.35 0.55 11.29 0.00**
Interaction
Region�Size 0.85 0.54 0.57 0.75 0.20 0.98 1.17 0.32 1.72 0.11
Region�User 1.56 0.20 0.74 0.53 0.34 0.80 1.16 0.33 2.05 0.11
Size�User 0.30 0.74 1.23 0.29 0.81 0.45 0.16 0.85 0.07 0.93
Region�Size � User
2.37 0.03* 1.66 0.13 0.86 0.53 0.62 0.72 0.13 0.99
*pG.05, **pG.01
HSIN-KAI WU ET AL.76

108) = 5.130, p G .01 and post-hoc tests showed that users of educational
technology at small schools enacted more technology-based practices
than users at large schools. But the school size factor did not affect non-
users_ practice in the southern region.
MAIN EFFECTS. Results of the three-way ANOVA revealed a significant
main effect for school size on attitude (F(2, 916) = 3.21, p G .05 ). Post-hoc
testing showed that school size did not affect the amount of technical and
personnel resource available to participating teachers, but influenced
teachers_ attitude toward technology-based instruction. Compared to the
participants teaching at medium-sized (M = 3.64) and large schools (M =
3.64), teachers at small schools (M = 3.81) showed significantly more
positive attitude toward the use of technology in classrooms (both pG.01).There were also statistically significant main effects for the technology
user/non-user on attitude (F(1, 916) = 27.85, p G .01), belief (F(1, 916) =
25.72, p G .01), and resource (F(1, 916) = 11.29, pG.01). Compared with
non-users of educational technology, users held more positive attitudes
and beliefs about technology use in classrooms, and had more technical
and personnel resources to support technology-based instruction.
DISCUSSION
School Size and Teachers_ Use of Technology
Schools are social organizations where the particulars of organizational
structures shape and constrain members_ (including both teachers and
students) action (Kerr, 1996). This study focuses on one of the structural
characteristicsVschool size, and examines whether this structural factor
influenced teachers_ use of educational technology in classrooms.
Results obtained from log-linear analyses and 3-way ANOVA consis-
tently show that small schools provide a better environment for
supporting science and mathematics teachers to implement technology
innovations. The results not only echo the findings of research on the
topic of school size (Lee & Loeb, 2000), but also expands the body of
research in two ways. First, while previous studies on school size
generally targeted its effects on high school students (Howley, 1996),
this study considered the effects of school size on junior high school
teachers. The results indicate that school size has both main and
interaction effects on teaching. Secondly, this study included a broader
set of teacher factors and associated the school size factor with teachers_practices and perceived school resources. We find that the size of school
TEACHERS, ADOPTION OF TECHNOLOGY 77

(a)
(b)
2
2.2
2.4
2.6
2.8
3
3.2
3.4
3.6
Northern Central Southern Eastern
School Region (Small Schools)
Pra
ctic
e
User
Non-user
2
2.2
2.4
2.6
2.8
3
3.2
3.4
3.6
Large Medium Small
School Size (Southern)
Pra
ctic
eUser
Non-user
HSIN-KAI WU ET AL.78

does not affect school resources perceived by teachers but teachers_attitudes toward the use of educational technology.
Why do more teachers at small schools in Taiwan use technology for
classroom instruction? We provide two possible explanations. The first
explanation is related to collegiality among teachers. Cheng and Wong
(1996) indicated that teachers in East Asia highly value personal
relationships and are sensitive about how they are viewed by colleagues,
students and parents as compared to their counterparts in the West.
Taiwanese teachers might change their attitude towards technology and
be more willing to use technology for teaching if other teachers do so.
And teachers at small schools might have more contact with other
computer-using teachers. Therefore, a possible mechanism of the school
size effect might be that a smaller school would enhance collegiality
among teachers (Fitzgerald, 1997). Through frequent interactions with
computer-using teachers, teachers who are not users of educational
technology are more likely to have positive attitudes toward technology
and initiate change in their teaching practice. This in turn increases the
percentage of computer-using teachers at small schools.A possible relation between school size and school culture might provide
another explanation. In Taiwan, large schools are usually Bstar schools^that attract students from across the city or the town because graduates
from these schools score high on senior high school entrance exam-
inations. As Aldridge, Fraser & Huang (2001) found, compared to
Australian teachers, teachers in Taiwan are more reluctant to use teaching
methods that were not teacher-centered and lecture-based because lecture-
based methods are the most efficient way to cover the content in the given
time frame. In star schools, the school culture is more competitive, and
science and mathematics teachers are usually pressured by school
administrators and parents to cover all the content and to push students
toward higher goals and better test results. The examination-driven culture
at large schools might discourage teachers to adopt various teaching
methods and implement technological innovations in classrooms.Both explanations can be examined by future research. To investigate
whether/how small schools enhance collegiality among teachers and
whether/how school culture at small schools encourages educational
innovations, researchers can observe interactions among school mem-
bers, and interview teachers, administrators, and parents from schools
with different sizes. Ethnographic methods used by Windschitl and Sahl
Figure 2. Profile plots of technology use for (a) schools in southern Taiwan, and (b)
small schools across regions
R
TEACHERS, ADOPTION OF TECHNOLOGY 79

(2002) might be useful to investigate complex relationships among
collegiality, school size, school culture, and technology usage.
Factors Affect Teachers’ Use of Technology in Classrooms
Five teacher factors (i.e., practice, attitude, belief, need, and resource)
were identified and examined in this study. Similar to earlier findings
reported by Haney, Czerniak & Lumpe (1996), this study finds that
teachers_ implementation of technology innovation was positively
correlated with teachers_ attitudes and beliefs about educational technol-
ogy. But positive attitudes and beliefs were not sufficient for teachers to
integrate technology into instruction. The results demonstrated a signif-
icant difference in perceived social support and school resources between
users and non-users of educational technology. This suggests that teachers
need adequate technological facilities and sufficient technical support for
successful implementation of classroom technology. Additionally, al-
though approximately 65% of the teachers in this study have used
technology for instructional purposes, they still had strong need for
professional development opportunities. A majority of teachers in this
sample indicated their interests in gaining practical knowledge about using
educational technology in classrooms. Teaching workshops should
consider providing more real-world examples of technology-based
instruction and more classroom observation opportunities.
Limitations of the Study
There are limitations of the study that derive from the methods. First, the
data were collected in Taiwan so the results should not be generalized to
other countries where the educational systems are very different from
Taiwan. Second, although the questionnaire provided definitions of some
keywords (e.g., telecommunication and technology), when answering the
questionnaire teachers might hold different interpretations about educa-
tional technology, integrating technology in classroom instruction, and
learning with technologies. Their interpretations could influence their
responses. Additionally, the quantitative methods used in the study
cannot address questions such as: What is the nature of technology-based
learning tasks used by these teachers? What pedagogical practices are
used by the teachers? These limitations provide opportunities for follow-
up studies. We will interview some of the teachers from the two groups
(i.e., users and non-users of educational technology) about their
definitions and perceptions of integrating technology in classroom
HSIN-KAI WU ET AL.80

instruction, observe their pedagogical practices, and combine quantita-
tive and qualitative data to understand why they do or do not use
technology in their classrooms.
CONCLUSIONS AND IMPLICATIONS
The study situates the issue of teachers_ adoption of technology into the
ongoing discourse about the impact of the school structures on teaching
and learning and investigates the effects of school size on science and
mathematics teachers_ adoption of technology in classrooms. Results
obtained from the log-linear analyses suggested that school size had
significant impact on teachers_ use of technology, and teachers at small
schools were more likely to use technology for instructional purposes.
Additionally, results of the three-way ANOVA revealed that among
users of educational technology in the southern region, users who taught
at small schools reported significantly more use of educational
technology and that teachers at small schools tended to have positive
attitudes toward technology use. Taken together, these results suggest
that small schools provide a better environment for science and
mathematics teachers to integrate technology into instruction.To encourage teachers at large schools to use educational technology,
administrators at large schools might consider providing more curricu-
lum flexibilities and encouraging teachers to use different teaching
methods. Having opportunities to team up with other computer-using
teachers might also encourage teachers at large schools to have positive
attitudes toward technology and initiate change in their teaching
practices. This study also provides evidence to support the policy of
Bsmall classes, small schools^ in Taiwan. The Ministry of Education in
Taiwan should continue implementing the policy, consider reducing
school size in big cities, and coordinate professional development
workshops on educational technology.
ACKNOWLEDGEMENT
This work was supported by the National Science Council of Taiwan
under NSC92-2511-S-003-053. The authors wish to thank Tai-Yih Tso
and Yun-Ta Chang for their invaluable assistance and support in
developing the questionnaire and collecting data.
TEACHERS, ADOPTION OF TECHNOLOGY 81

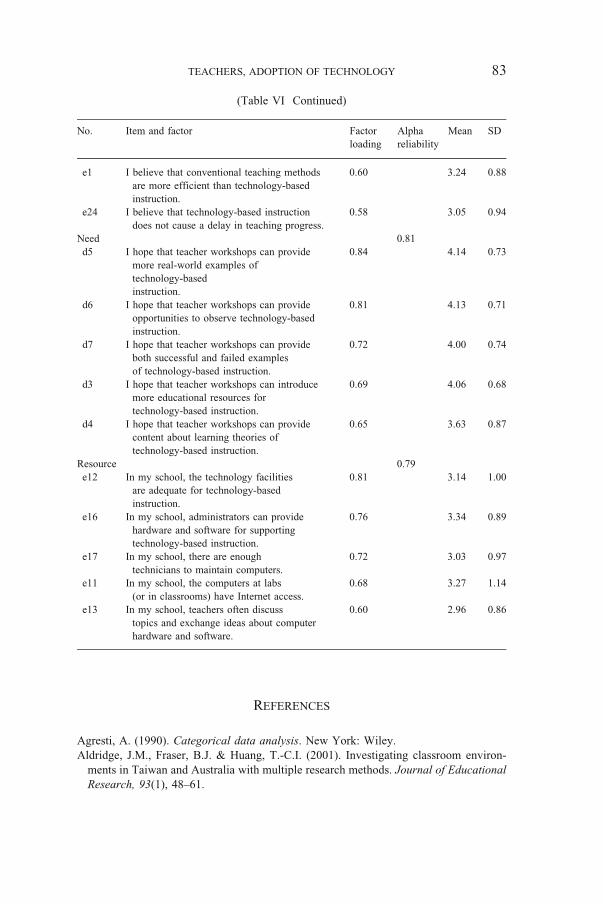
APPENDIX
TABLE VI
Questionnaire items and factor loadings
No. Item and factor Factor
loading
Alpha
reliability
Mean SD
Practice 0.90
e35 I have designed activities that allowed
students to learn through the Internet.
0.82 2.73 1.04
e36 I have had students learn collaboratively
through the Internet.
0.80 2.66 1.01
e37 I have used the Internet to support
individual learning.
0.78 2.49 0.98
e33 I have used computers and the Internet to
collect and grade students_ assignments.
0.75 2.97 1.12
e34 I have used computer applications to create
pictures, videos and animations and used
them in classrooms.
0.72 3.18 1.07
e29 I have developed teaching strategies
for technology-based instruction.
0.69 2.79 0.93
e32 I have used educational software to
promote learning.
0.69 3.16 1.08
e30 I have used computers to play videos
in classrooms.
0.63 3.21 1.09
e28 I have used the Internet to discuss
with other teachers.
0.61 2.94 0.97
e4 I have confidence with integrating
technology into instruction successfully.
0.45 3.24 0.82
Attitude 0.86 3.66
e21 I should create different teaching strategies
for technology-based instruction.
0.84 3.64 0.70
e22 I should develop different assessment strategies
for technology-based instruction.
0.82 3.63 0.71
e20 Using technology can help me share my
teaching experiences with others.
0.63 3.48 0.72
e19 I think technology is helpful for my teaching. 0.57 3.49 0.74
e10 I am willing to follow school policy on
implementing technology-based instruction.
0.56 3.72 0.72
e9 I think technology-based instruction is one
of the future trends in education.
0.53 3.90 0.76
e7 I like to search courses-related information
on the Internet.
0.51 3.77 0.84
Belief 0.81
e26 I believe that technology-based instruction
can improve learning achievement.
0.79 3.42 0.81
e25 I believe that technology-based teaching can
promote students_ motivation.
0.75 3.71 0.72
e27 I believe that technology-based instruction can
make my teaching lively and energetic.
0.68 3.78 0.72
HSIN-KAI WU ET AL.82
REFERENCES
Agresti, A. (1990). Categorical data analysis. New York: Wiley.
Aldridge, J.M., Fraser, B.J. & Huang, T.-C.I. (2001). Investigating classroom environ-
ments in Taiwan and Australia with multiple research methods. Journal of Educational
Research, 93(1), 48Y61.
e1 I believe that conventional teaching methods
are more efficient than technology-based
instruction.
0.60 3.24 0.88
e24 I believe that technology-based instruction
does not cause a delay in teaching progress.
0.58 3.05 0.94
Need 0.81
d5 I hope that teacher workshops can provide
more real-world examples of
technology-based
instruction.
0.84 4.14 0.73
d6 I hope that teacher workshops can provide
opportunities to observe technology-based
instruction.
0.81 4.13 0.71
d7 I hope that teacher workshops can provide
both successful and failed examples
of technology-based instruction.
0.72 4.00 0.74
d3 I hope that teacher workshops can introduce
more educational resources for
technology-based instruction.
0.69 4.06 0.68
d4 I hope that teacher workshops can provide
content about learning theories of
technology-based instruction.
0.65 3.63 0.87
Resource 0.79
e12 In my school, the technology facilities
are adequate for technology-based
instruction.
0.81 3.14 1.00
e16 In my school, administrators can provide
hardware and software for supporting
technology-based instruction.
0.76 3.34 0.89
e17 In my school, there are enough
technicians to maintain computers.
0.72 3.03 0.97
e11 In my school, the computers at labs
(or in classrooms) have Internet access.
0.68 3.27 1.14
e13 In my school, teachers often discuss
topics and exchange ideas about computer
hardware and software.
0.60 2.96 0.86
(Table VI Continued)
No. Item and factor Factor
loading
Alpha
reliability
Mean SD
TEACHERS, ADOPTION OF TECHNOLOGY 83

Becker, H.J. (1994). How exemplary computer-using teachers differ from other teachers:
Implications for realizing the potential of computers in schools. Journal of Research in
Computing in Education, 26(3), 291Y321.
Becker, H.J. & Ravitz, J. (1999). The influence of computer and Internet use on teachers_pedagogical practices and perceptions. Journal of Research on Computing in
Education, 31(4), 356Y385.
Buzacott, J.A. (1982). Scale in production systems. New York: Pergamon.
Cheng, K.-M. & Wong, K.-C. (1996). School effectiveness in East Asia. Journal of
Educational Administration, 34(5), 32Y49.
Cohen, D.K. (1987). Educational technology, policy, and practice. Educational
Evaluation and Policy Analysis, 9(2), 153Y170.
Cuban, L. (1986). Teachers and machines: The classroom use of technology since 1920.
New York: Teachers College Press.
Cuban, L., Kirkpatrick, H. & Peck, C. (2001). High access and low use of technologies in
high school classrooms: Explaining an apparent paradox. American Educational
Research Journal, 38(4), 813Y834.
Czerniak, C.M., Haney, J.J., Lumpe, A.T. & Beck, J. (1999). Teachers_ beliefs about
using educational technology in the science classroom. International Journal of
Educational Technology, 1(2).
Demetriadis, S., Barbas, A., Molohides, A., Palaigeorgious, G., Psillos, D., Vlahavas, I.,
et al. (2003). BCulture in negotiation[: Teachers_ acceptance/resistance attitudes
considering the infusion of technology into schools. Computers and Education, 41,
19Y37.
Dwyer, D.C., Ringstaff, C. & Sandholtz, J.H. (1991). Changes in teachers_ beliefs and
practices in technology-rich classrooms. Educational Leadership, May, 45Y52.
Fitzgerald, M.A. (1997). Misinformation on the Internet: Applying evaluation skills to
online information. Emergency Librarian, 24(3), 9Y14.
Fritzberg, G.J. (2001). From rhetoric to reality: Opportunity-to-learn standards and the
integrity of American public school reform. Teacher Education Quarterly, 28(1),
169Y187.
Gallini, J.K. & Barron, D. (2001). Participants_ perceptions of web-infused environ-
ments: A survey of teaching beliefs, learning approaches, and communication. Journal
of Research on Technology in Education, 34(2), 139Y156.
Gbomita, V. (1997). The adoption of microcomputers for instruction: Implications for
emerging instructional media implementation. British Journal of Educational
Technology, 28(20), 87Y101.
Haney, J.J., Czerniak, C.M. & Lumpe, A.T. (1996). Teachers_ beliefs and intentions
regarding the implementation of science education reform strands. Journal of Research
in Science Teaching, 33, 971Y993.
Hargreaves, A. & Fink, D. (2000). The three dimensions of reform. Educational
Leadership, 57(7), 30Y33.
Howley, C. (1996). Compounding disadvantage: The effects of school and district size on
student achievement in West Virginia. Journal of Research in Rural Education, 12(1).
Huang, H.-M. (1999). Educational reform in Taiwan: A brighter American moon?
International Journal of Educational Reform, 8(2), 145Y153.
Kerr, S.T. (1996). Toward a sociology of educational technology. In D.H. Jonassen (Ed.),
The Handbook of Research for Educational Communications Technology
(pp. 143Y169). New York: Simon & Schuster MacMillan.
HSIN-KAI WU ET AL.84

Kozma, R.B. (1991). Learning with media. Review of Educational Research, 61(2),
179Y211.
Lee, V.E. & Loeb, S. (2000). School size in Chicago elementary schools: Effects on
teachers_ attitudes and students_ achievement. American Educational Research
Journal, 37(1), 3Y31.
Lee, V.E. & Smith, J.B. (1997). High school size: Which works best and for whom?
Educational Evaluation and Policy Analysis, 19(3), 205Y228.
Lim, C.P. & Hang, D. (2003). An activity theory approach to research of ICT integration
in Singapore school. Computers and Education, 41, 49Y63.
Loveless, T. (1996). Why aren_t computers used more in schools? Educational Policy,
10(4), 448Y467.
Ministry of Education. (2006). An introduction of the Ministry of Education of the R.O.C.
Retrieved August 20, 2006 from http://140.111.1.22/english/home_ministry.htm
National Research Council. (1996). National Science Education Standards. Washington,
DC: National Academy Press.
Salter, D.W. (2003). Log-linear techniques for the analysis of categorical data: A
demonstration with the Myers-Briggs type indicator. Measurement and Evaluation in
Counseling and Development, 36(2), 106Y121.
van Braak, J. (2001). Factors influencing the use of computer mediated communication
by teachers in secondary schools. Computers and Education, 36, 41Y57.
Windschitl, M. & Sahl, K. (2002). Tracing teachers_ use of technology in a laptop
computer school: the interplay of teacher beliefs, social dynamics, and institutional
culture. American Educational Research Journal, 39(1), 165Y205.
Wu, H.-K. & Shah, P. (2004). Exploring visuospatial thinking in chemistry learning.
Science Education, 88, 465Y492.
Yaghi, H.M. (2001). Subject matter as a factor in educational computing by teachers in
international settings. Journal of Educational Computing Research, 24(2), 139Y154.
Zhao, Y. & Cziko, G.A. (2001). Teacher adoption of technology: A perceptual control
theory perspective. Journal of Technology and Teacher Education, 9(1), 5Y30.
Zhao, Y. & Frank, K.A. (2003). Factors affecting technology uses in schools: An
ecological perspective. American Educational Research Journal, 40(4), 807Y840.
Zhao, Y., Pugh, K., Sheldon, S. & Byers, J.L. (2002). Conditions for classroom
technology innovations. Teachers College Record, 104(3), 482Y515.
Graduate Institute of Science Education, National Taiwan Normal University
P.O. Box 97Y27, Taipei, 11699 Taiwan, Republic of China
TEACHERS, ADOPTION OF TECHNOLOGY 85