fact book dutchess spring 2003 – spring 2012 · fact book dutchess spring 2003 – spring 2012...
TRANSCRIPT
Fact Book Dutchess Spring 2003 – Spring 2012
Community College Institutional Research, Planning & Assessment
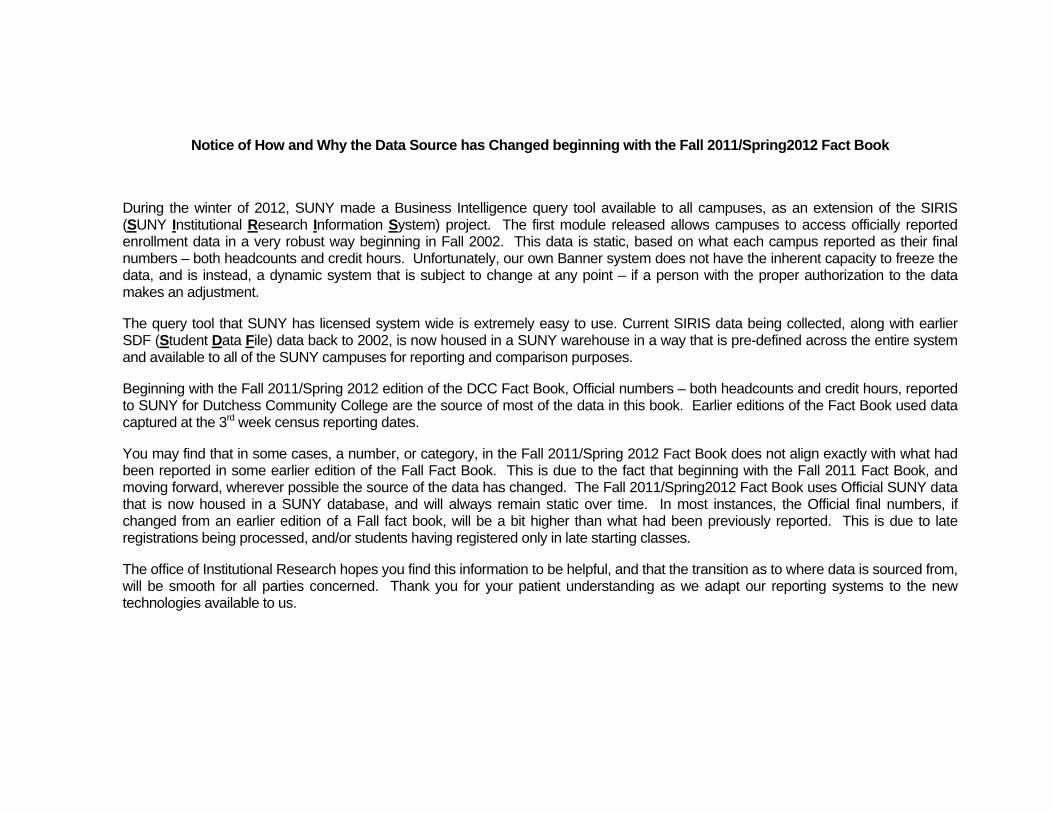
Notice of How and Why the Data Source has Changed beginning with the Fall 2011/Spring2012 Fact Book
During the winter of 2012, SUNY made a Business Intelligence query tool available to all campuses, as an extension of the SIRIS (SUNY Institutional Research Information System) project. The first module released allows campuses to access officially reported enrollment data in a very robust way beginning in Fall 2002. This data is static, based on what each campus reported as their final numbers – both headcounts and credit hours. Unfortunately, our own Banner system does not have the inherent capacity to freeze the data, and is instead, a dynamic system that is subject to change at any point – if a person with the proper authorization to the data makes an adjustment.
The query tool that SUNY has licensed system wide is extremely easy to use. Current SIRIS data being collected, along with earlier SDF (Student Data File) data back to 2002, is now housed in a SUNY warehouse in a way that is pre-defined across the entire system and available to all of the SUNY campuses for reporting and comparison purposes.
Beginning with the Fall 2011/Spring 2012 edition of the DCC Fact Book, Official numbers – both headcounts and credit hours, reported to SUNY for Dutchess Community College are the source of most of the data in this book. Earlier editions of the Fact Book used data captured at the 3rd week census reporting dates.
You may find that in some cases, a number, or category, in the Fall 2011/Spring 2012 Fact Book does not align exactly with what had been reported in some earlier edition of the Fall Fact Book. This is due to the fact that beginning with the Fall 2011 Fact Book, and moving forward, wherever possible the source of the data has changed. The Fall 2011/Spring2012 Fact Book uses Official SUNY data that is now housed in a SUNY database, and will always remain static over time. In most instances, the Official final numbers, if changed from an earlier edition of a Fall fact book, will be a bit higher than what had been previously reported. This is due to late registrations being processed, and/or students having registered only in late starting classes.
The office of Institutional Research hopes you find this information to be helpful, and that the transition as to where data is sourced from, will be smooth for all parties concerned. Thank you for your patient understanding as we adapt our reporting systems to the new technologies available to us.
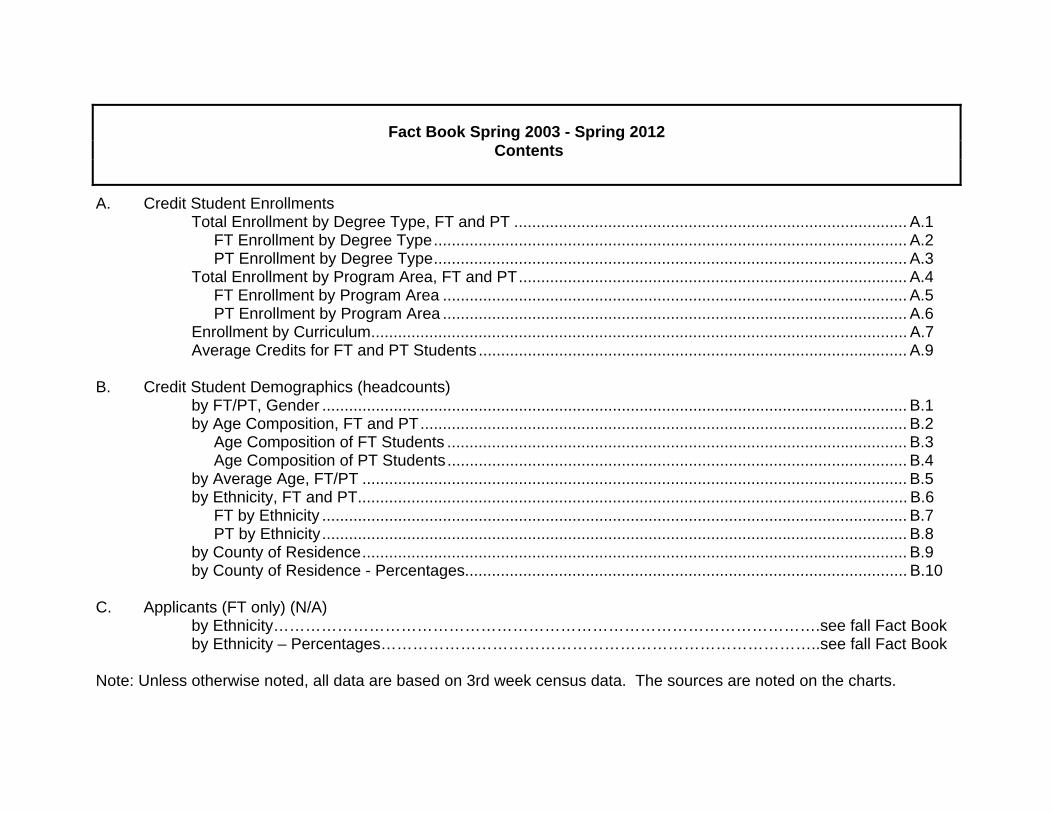
Fact Book Spring 2003 - Spring 2012 Contents
A. Credit Student Enrollments Total Enrollment by Degree Type, FT and PT ........................................................................................ A.1 FT Enrollment by Degree Type .......................................................................................................... A.2 PT Enrollment by Degree Type .......................................................................................................... A.3 Total Enrollment by Program Area, FT and PT ....................................................................................... A.4 FT Enrollment by Program Area ........................................................................................................ A.5 PT Enrollment by Program Area ........................................................................................................ A.6 Enrollment by Curriculum ........................................................................................................................ A.7 Average Credits for FT and PT Students ................................................................................................ A.9 B. Credit Student Demographics (headcounts) by FT/PT, Gender ................................................................................................................................... B.1 by Age Composition, FT and PT ............................................................................................................. B.2 Age Composition of FT Students ....................................................................................................... B.3 Age Composition of PT Students ....................................................................................................... B.4 by Average Age, FT/PT .......................................................................................................................... B.5 by Ethnicity, FT and PT ........................................................................................................................... B.6 FT by Ethnicity ................................................................................................................................... B.7 PT by Ethnicity ................................................................................................................................... B.8 by County of Residence .......................................................................................................................... B.9 by County of Residence - Percentages ................................................................................................... B.10 C. Applicants (FT only) (N/A) by Ethnicity………………………………………………………………………………………….see fall Fact Book by Ethnicity – Percentages………………………………………………………………………..see fall Fact Book Note: Unless otherwise noted, all data are based on 3rd week census data. The sources are noted on the charts.
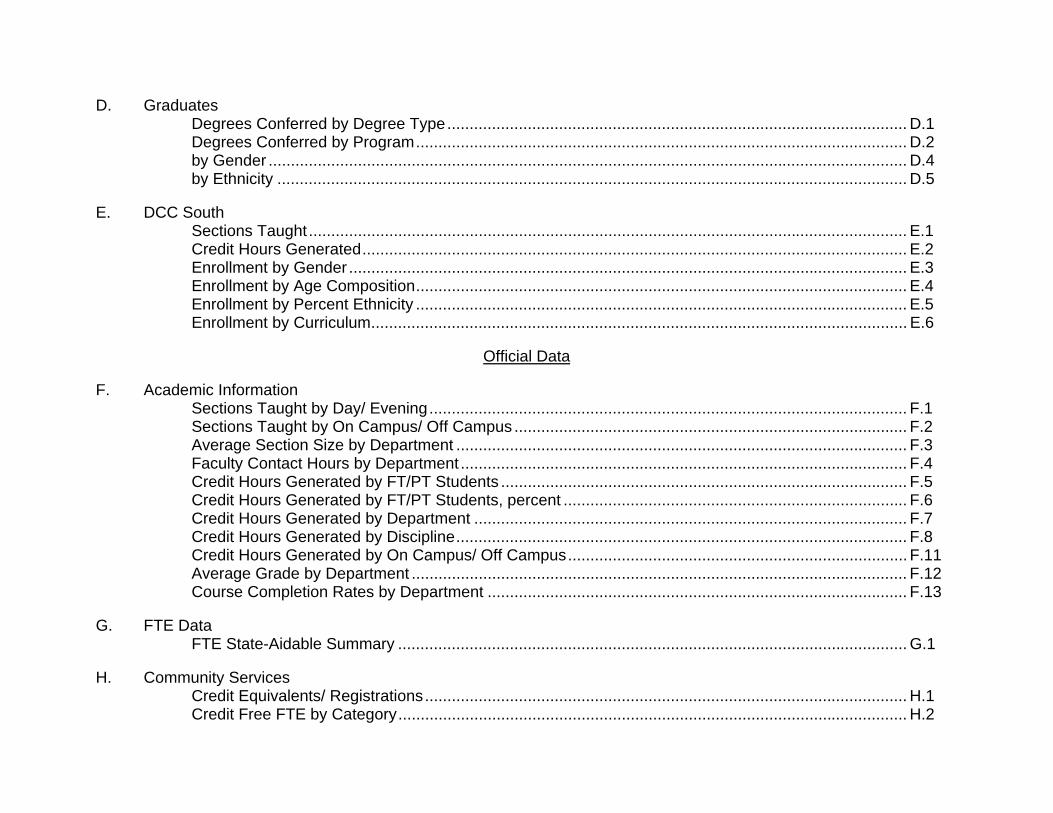
D. Graduates Degrees Conferred by Degree Type ....................................................................................................... D.1 Degrees Conferred by Program .............................................................................................................. D.2 by Gender ............................................................................................................................................... D.4 by Ethnicity ............................................................................................................................................. D.5 E. DCC South Sections Taught ...................................................................................................................................... E.1 Credit Hours Generated .......................................................................................................................... E.2 Enrollment by Gender ............................................................................................................................. E.3 Enrollment by Age Composition .............................................................................................................. E.4 Enrollment by Percent Ethnicity .............................................................................................................. E.5 Enrollment by Curriculum ........................................................................................................................ E.6
Official Data
F. Academic Information Sections Taught by Day/ Evening ........................................................................................................... F.1 Sections Taught by On Campus/ Off Campus ........................................................................................ F.2 Average Section Size by Department ..................................................................................................... F.3 Faculty Contact Hours by Department .................................................................................................... F.4 Credit Hours Generated by FT/PT Students ........................................................................................... F.5 Credit Hours Generated by FT/PT Students, percent ............................................................................. F.6 Credit Hours Generated by Department ................................................................................................. F.7 Credit Hours Generated by Discipline ..................................................................................................... F.8 Credit Hours Generated by On Campus/ Off Campus ............................................................................ F.11 Average Grade by Department ............................................................................................................... F.12 Course Completion Rates by Department .............................................................................................. F.13 G. FTE Data FTE State-Aidable Summary .................................................................................................................. G.1 H. Community Services Credit Equivalents/ Registrations ............................................................................................................ H.1 Credit Free FTE by Category .................................................................................................................. H.2
19501,1152110 #DIV/0!1224 #DIV/0!258 #DIV/0!336 #DIV/0!
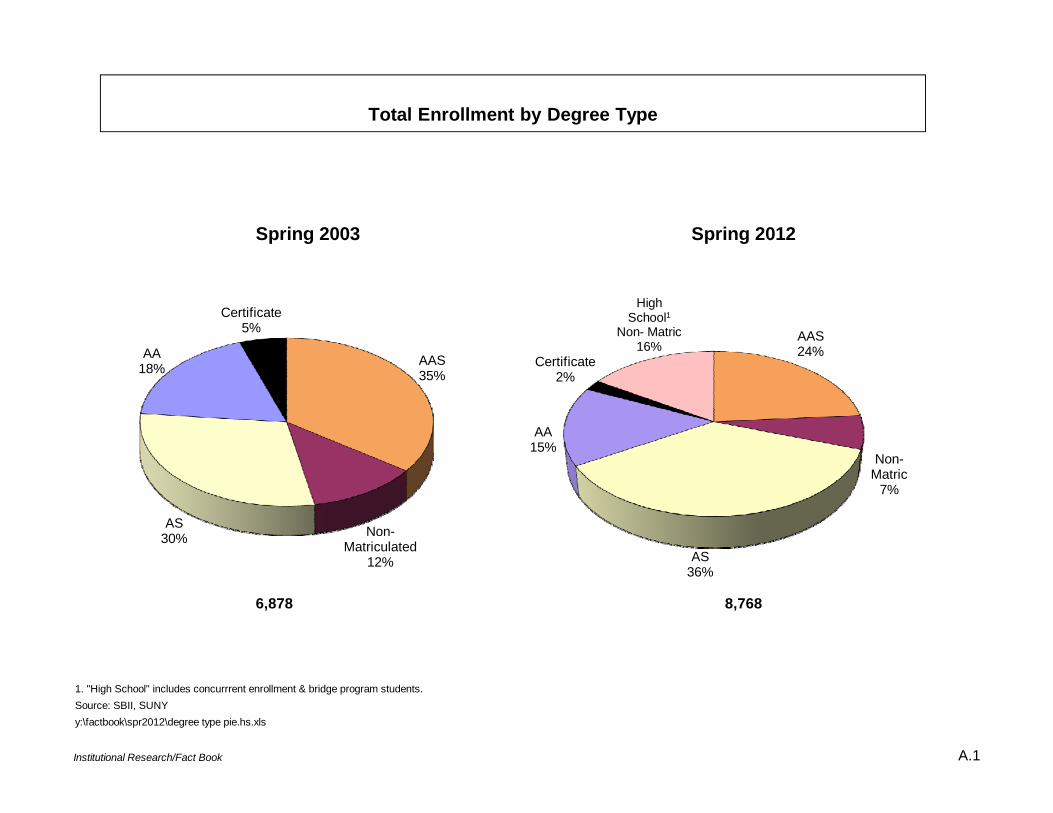
1. "High School" includes concurrrent enrollment & bridge program students.Source: SBII, SUNYy:\factbook\spr2012\degree type pie.hs.xls
Spring 2012Spring 2003
6,878 8,768
AAS35%
Non-Matriculated
12%
AS30%
AA18%
Certificate5%
Total Enrollment by Degree Type
AAS24%
Non-Matric
7%
AS36%
AA15%
Certificate2%
High School1
Non- Matric16%
Institutional Research/Fact Book A.1
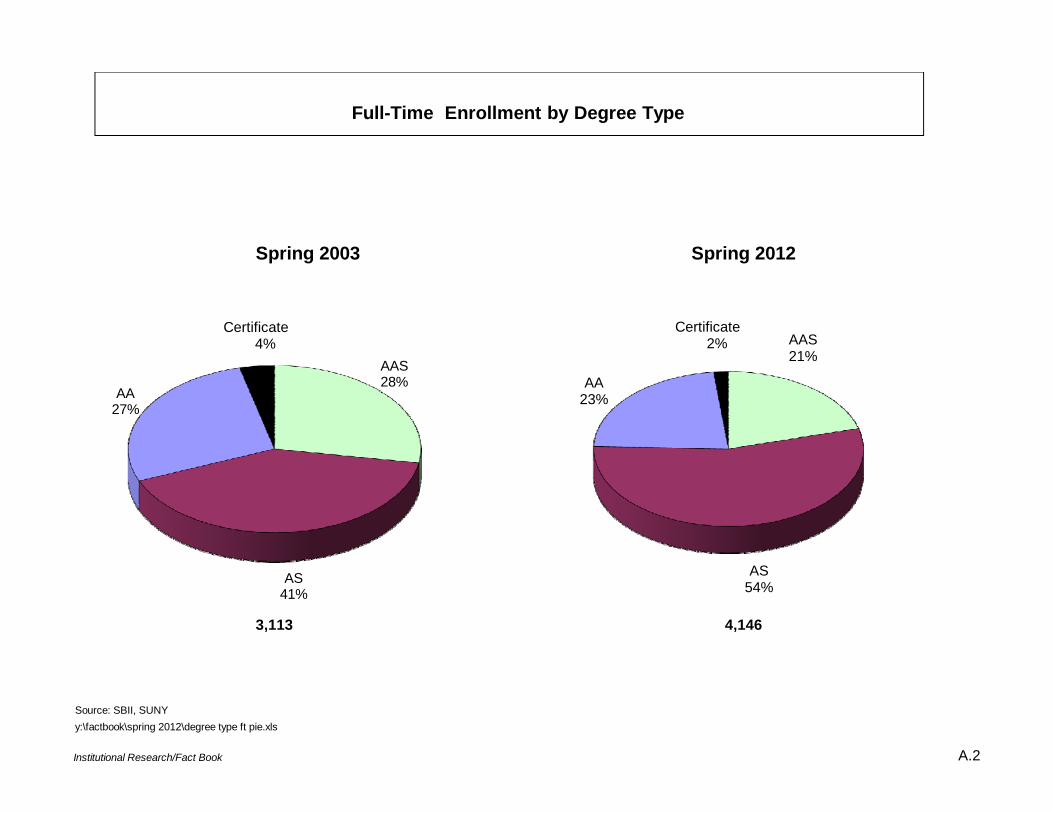
Source: SBII, SUNYy:\factbook\spring 2012\degree type ft pie.xls
3,113 4,146
Spring 2012Spring 2003
AAS28%
AS41%
AA27%
Certificate4% AAS
21%
AS54%
AA23%
Certificate2%
Full-Time Enrollment by Degree Type
Institutional Research/Fact Book A.2
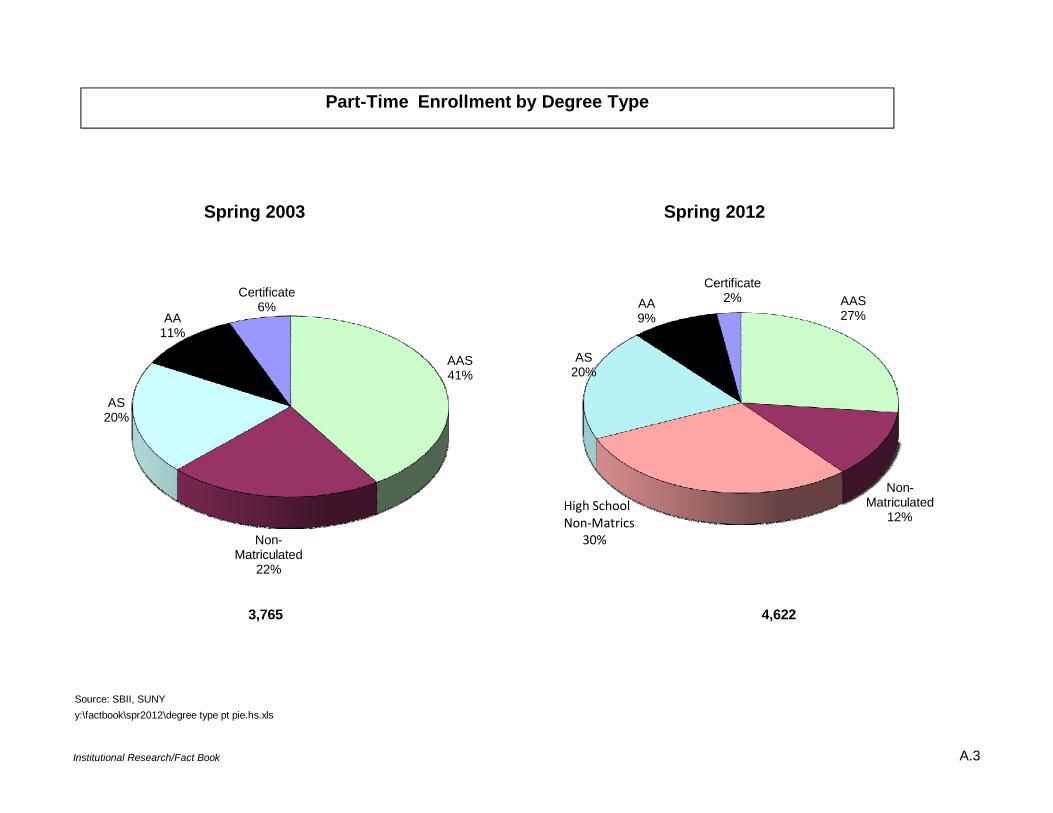
Spring 2003
Source: SBII, SUNYy:\factbook\spr2012\degree type pt pie.hs.xls
Spring 2012
3,765 4,622
AAS41%
Non-Matriculated
22%
AS20%
AA11%
Certificate6% AAS
27%
Non-Matriculated
12%
AS20%
AA 9%
Certificate2%
High SchoolNon‐Matrics
30%
Part-Time Enrollment by Degree Type
Institutional Research/Fact Book A.3

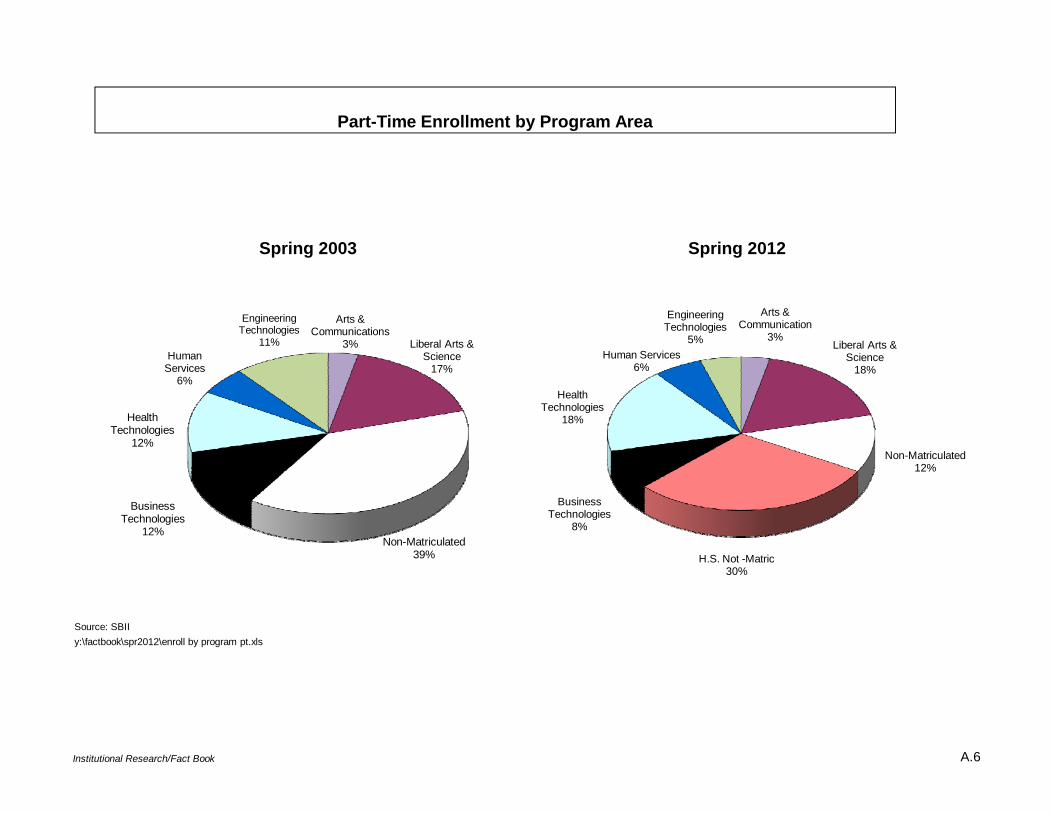
Spring 2003 Spring 2012
Source: SBII, SUNYy:\factbook\spr 2012\enroll by program pie.xls
Liberal Arts & Science33%
Non-Matriculated12%High School Non-
Matricsn/a
Health Technologies11%
Health Technologies12%
Human Services9%
Engineering Technologies
10%
Arts & Communications
7%
Arts & Communications
6%
Liberal Arts & Science
30%
Non-Matriculated7%
High School Non-Matrics
16%
Business Technologies
11%
HealthTechnologies
13%
Human Services11%
Engineering Technologies
6%
Total Enrollment by Program Area
BusinessTechnologies
17%
Institutional Research/Fact Book A.4
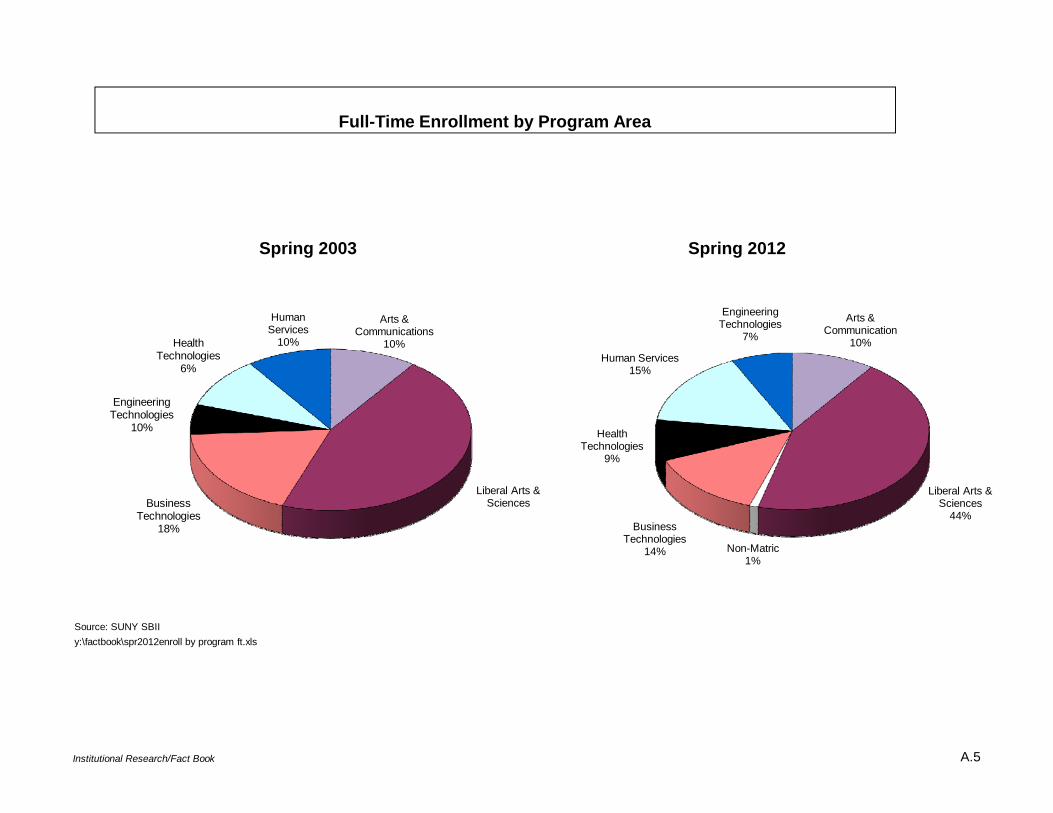
Spring 2003 Spring 2012
Source: SUNY SBIIy:\factbook\spr2012enroll by program ft.xls
Engineering Technologies
10%
Business Technologies
18%
Health Technologies
6%
Human Services
10%
Liberal Arts &Sciences
Arts &Communications
10%
Arts & Communication
10%
Liberal Arts &Sciences
44%
Non-Matric1%
Business Technologies
14%
Health Technologies
9%
Human Services15%
Engineering Technologies
7%
Full-Time Enrollment by Program Area
Institutional Research/Fact Book A.5
Spring 2003 Spring 2012
Source: SBIIy:\factbook\spr2012\enroll by program pt.xls
Non-Matriculated39%
Business Technologies
12%
Health Technologies
12%
Engineering Technologies
11%Human
Services6%
Liberal Arts &Science
17%
Arts &Communications
3%
Arts & Communication
3%Liberal Arts &
Science18%
Non-Matriculated12%
H.S. Not -Matric30%
Business Technologies
8%
Health Technologies
18%
Human Services6%
Engineering Technologies
5%
Part-Time Enrollment by Program Area
Institutional Research/Fact Book A.6
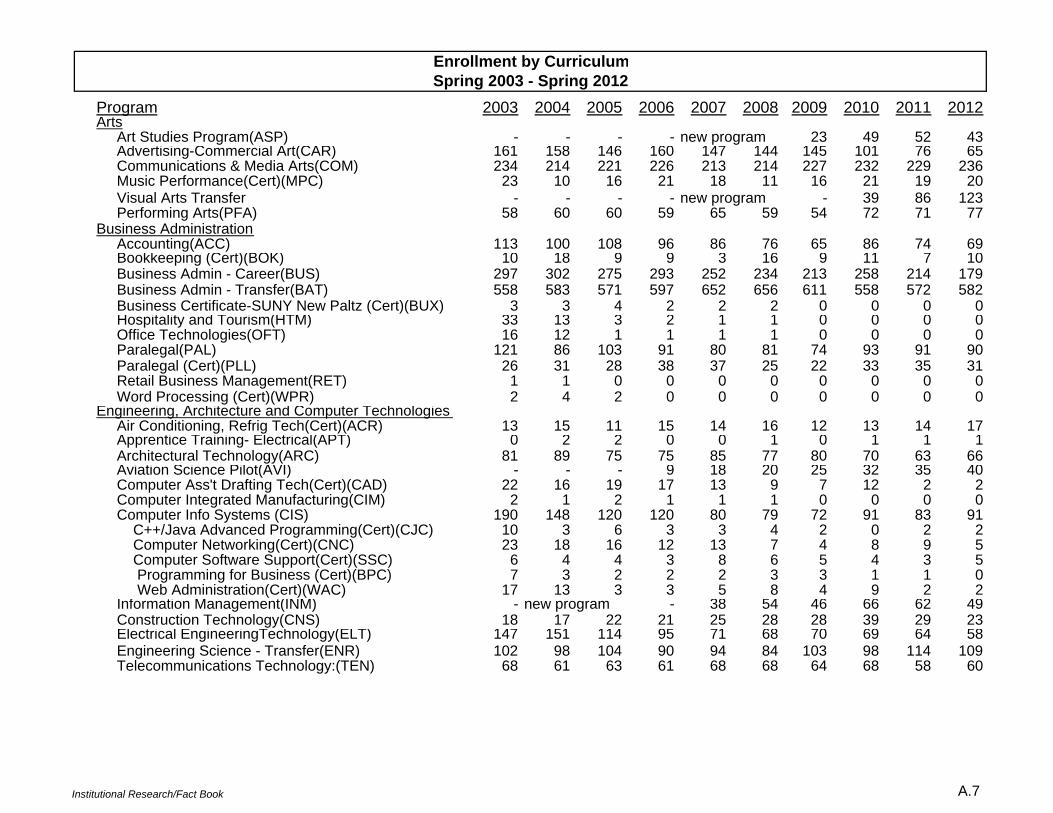
Enrollment by CurriculumSpring 2003 - Spring 2012
Program 2003 2004 2005 2006 2007 2008 2009 2010 2011 2012Arts Art Studies Program(ASP) - - - - new program 23 49 52 43 Advertising-Commercial Art(CAR) 161 158 146 160 147 144 145 101 76 65 Communications & Media Arts(COM) 234 214 221 226 213 214 227 232 229 236 Music Performance(Cert)(MPC) 23 10 16 21 18 11 16 21 19 20 Visual Arts Transfer - - - - new program - 39 86 123 Performing Arts(PFA) 58 60 60 59 65 59 54 72 71 77Business Administration Accounting(ACC) 113 100 108 96 86 76 65 86 74 69 Bookkeeping (Cert)(BOK) 10 18 9 9 3 16 9 11 7 10 Business Admin - Career(BUS) 297 302 275 293 252 234 213 258 214 179 Business Admin - Transfer(BAT) 558 583 571 597 652 656 611 558 572 582 Business Certificate-SUNY New Paltz (Cert)(BUX) 3 3 4 2 2 2 0 0 0 0 Hospitality and Tourism(HTM) 33 13 3 2 1 1 0 0 0 0 Office Technologies(OFT) 16 12 1 1 1 1 0 0 0 0 Paralegal(PAL) 121 86 103 91 80 81 74 93 91 90 Paralegal (Cert)(PLL) 26 31 28 38 37 25 22 33 35 31 Retail Business Management(RET) 1 1 0 0 0 0 0 0 0 0 Word Processing (Cert)(WPR) 2 4 2 0 0 0 0 0 0 0Engineering, Architecture and Computer Technologies Air Conditioning, Refrig Tech(Cert)(ACR) 13 15 11 15 14 16 12 13 14 17 Apprentice Training- Electrical(APT) 0 2 2 0 0 1 0 1 1 1 Architectural Technology(ARC) 81 89 75 75 85 77 80 70 63 66 Aviation Science Pilot(AVI) - - - 9 18 20 25 32 35 40 Computer Ass't Drafting Tech(Cert)(CAD) 22 16 19 17 13 9 7 12 2 2 Computer Integrated Manufacturing(CIM) 2 1 2 1 1 1 0 0 0 0 Computer Info Systems (CIS) 190 148 120 120 80 79 72 91 83 91 C++/Java Advanced Programming(Cert)(CJC) 10 3 6 3 3 4 2 0 2 2 Computer Networking(Cert)(CNC) 23 18 16 12 13 7 4 8 9 5 Computer Software Support(Cert)(SSC) 6 4 4 3 8 6 5 4 3 5 Programming for Business (Cert)(BPC) 7 3 2 2 2 3 3 1 1 0 Web Administration(Cert)(WAC) 17 13 3 3 5 8 4 9 2 2 Information Management(INM) - new program - 38 54 46 66 62 49 Construction Technology(CNS) 18 17 22 21 25 28 28 39 29 23 Electrical EngineeringTechnology(ELT) 147 151 114 95 71 68 70 69 64 58 Engineering Science - Transfer(ENR) 102 98 104 90 94 84 103 98 114 109 Telecommunications Technology:(TEN) 68 61 63 61 68 68 64 68 58 60
Institutional Research/Fact Book A.7
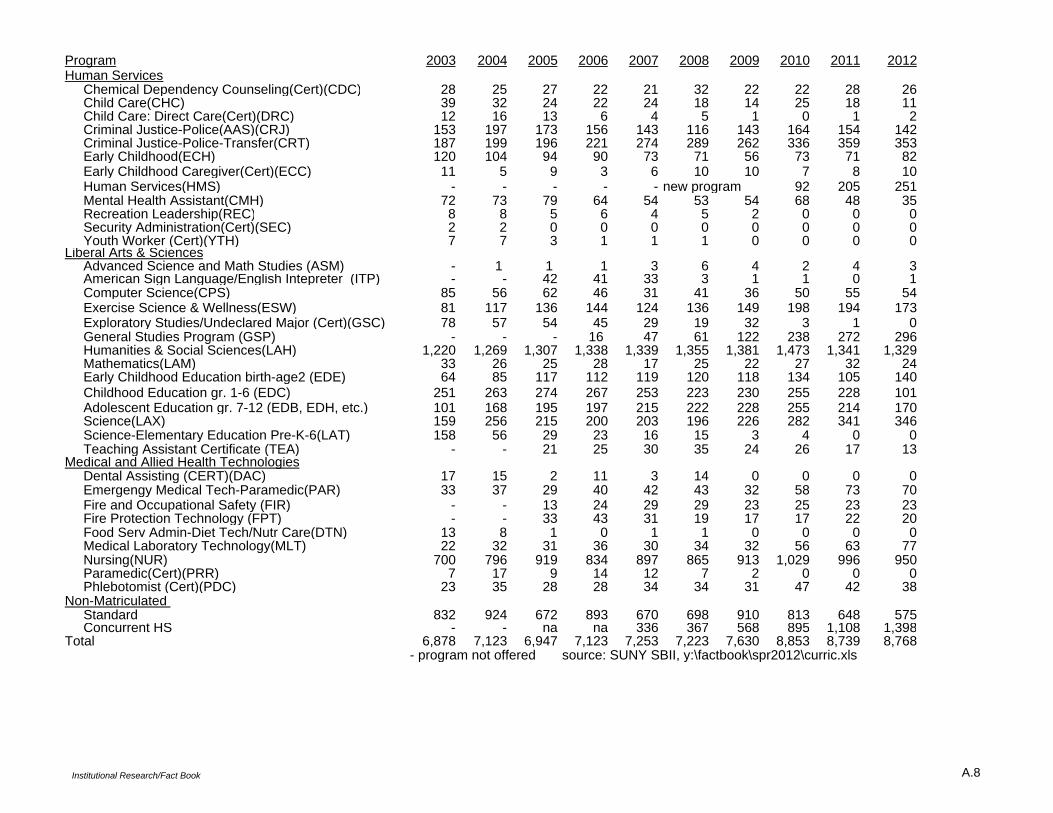
Program 2003 2004 2005 2006 2007 2008 2009 2010 2011 2012Human Services Chemical Dependency Counseling(Cert)(CDC) 28 25 27 22 21 32 22 22 28 26 Child Care(CHC) 39 32 24 22 24 18 14 25 18 11 Child Care: Direct Care(Cert)(DRC) 12 16 13 6 4 5 1 0 1 2 Criminal Justice-Police(AAS)(CRJ) 153 197 173 156 143 116 143 164 154 142 Criminal Justice-Police-Transfer(CRT) 187 199 196 221 274 289 262 336 359 353 Early Childhood(ECH) 120 104 94 90 73 71 56 73 71 82 Early Childhood Caregiver(Cert)(ECC) 11 5 9 3 6 10 10 7 8 10 Human Services(HMS) - - - - - new program 92 205 251 Mental Health Assistant(CMH) 72 73 79 64 54 53 54 68 48 35 Recreation Leadership(REC) 8 8 5 6 4 5 2 0 0 0 Security Administration(Cert)(SEC) 2 2 0 0 0 0 0 0 0 0 Youth Worker (Cert)(YTH) 7 7 3 1 1 1 0 0 0 0Liberal Arts & Sciences Advanced Science and Math Studies (ASM) - 1 1 1 3 6 4 2 4 3 American Sign Language/English Intepreter (ITP) - - 42 41 33 3 1 1 0 1 Computer Science(CPS) 85 56 62 46 31 41 36 50 55 54 Exercise Science & Wellness(ESW) 81 117 136 144 124 136 149 198 194 173 Exploratory Studies/Undeclared Major (Cert)(GSC) 78 57 54 45 29 19 32 3 1 0 General Studies Program (GSP) - - - 16 47 61 122 238 272 296 Humanities & Social Sciences(LAH) 1,220 1,269 1,307 1,338 1,339 1,355 1,381 1,473 1,341 1,329 Mathematics(LAM) 33 26 25 28 17 25 22 27 32 24 Early Childhood Education birth-age2 (EDE) 64 85 117 112 119 120 118 134 105 140 Childhood Education gr. 1-6 (EDC) 251 263 274 267 253 223 230 255 228 101 Adolescent Education gr. 7-12 (EDB, EDH, etc.) 101 168 195 197 215 222 228 255 214 170 Science(LAX) 159 256 215 200 203 196 226 282 341 346 Science-Elementary Education Pre-K-6(LAT) 158 56 29 23 16 15 3 4 0 0 Teaching Assistant Certificate (TEA) - - 21 25 30 35 24 26 17 13Medical and Allied Health Technologies Dental Assisting (CERT)(DAC) 17 15 2 11 3 14 0 0 0 0 Emergengy Medical Tech-Paramedic(PAR) 33 37 29 40 42 43 32 58 73 70 Fire and Occupational Safety (FIR) - - 13 24 29 29 23 25 23 23 Fire Protection Technology (FPT) - - 33 43 31 19 17 17 22 20 Food Serv Admin-Diet Tech/Nutr Care(DTN) 13 8 1 0 1 1 0 0 0 0 Medical Laboratory Technology(MLT) 22 32 31 36 30 34 32 56 63 77 Nursing(NUR) 700 796 919 834 897 865 913 1,029 996 950 Paramedic(Cert)(PRR) 7 17 9 14 12 7 2 0 0 0 Phlebotomist (Cert)(PDC) 23 35 28 28 34 34 31 47 42 38Non-Matriculated Standard 832 924 672 893 670 698 910 813 648 575 Concurrent HS - - na na 336 367 568 895 1,108 1,398Total 6,878 7,123 6,947 7,123 7,253 7,223 7,630 8,853 8,739 8,768
- program not offered source: SUNY SBII, y:\factbook\spr2012\curric.xls
Institutional Research/Fact Book A.8
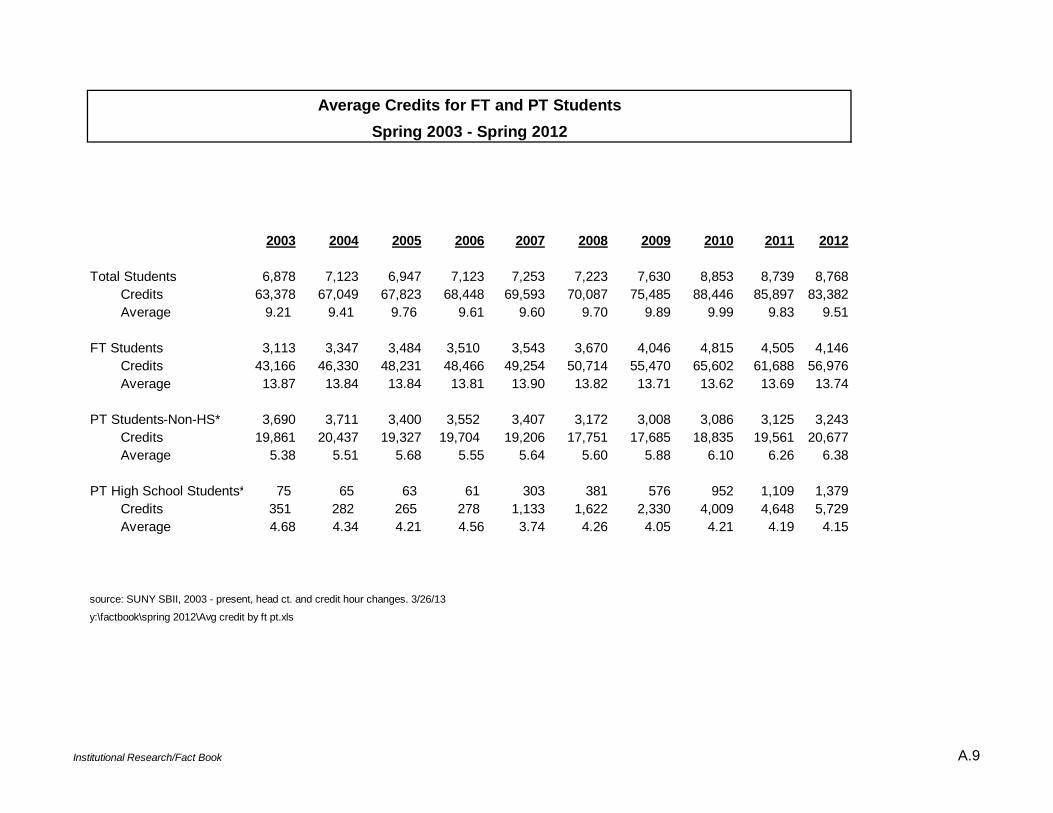
Average Credits for FT and PT StudentsSpring 2003 - Spring 2012
2003 2004 2005 2006 2007 2008 2009 2010 2011 2012
Total Students 6,878 7,123 6,947 7,123 7,253 7,223 7,630 8,853 8,739 8,768 Credits 63,378 67,049 67,823 68,448 69,593 70,087 75,485 88,446 85,897 83,382 Average 9.21 9.41 9.76 9.61 9.60 9.70 9.89 9.99 9.83 9.51
FT Students 3,113 3,347 3,484 3,510 3,543 3,670 4,046 4,815 4,505 4,146 Credits 43,166 46,330 48,231 48,466 49,254 50,714 55,470 65,602 61,688 56,976 Average 13.87 13.84 13.84 13.81 13.90 13.82 13.71 13.62 13.69 13.74
PT Students-Non-HS* 3,690 3,711 3,400 3,552 3,407 3,172 3,008 3,086 3,125 3,243 Credits 19,861 20,437 19,327 19,704 19,206 17,751 17,685 18,835 19,561 20,677 Average 5.38 5.51 5.68 5.55 5.64 5.60 5.88 6.10 6.26 6.38
PT High School Students* 75 65 63 61 303 381 576 952 1,109 1,379 Credits 351 282 265 278 1,133 1,622 2,330 4,009 4,648 5,729 Average 4.68 4.34 4.21 4.56 3.74 4.26 4.05 4.21 4.19 4.15
source: SUNY SBII, 2003 - present, head ct. and credit hour changes. 3/26/13
y:\factbook\spring 2012\Avg credit by ft pt.xls
Institutional Research/Fact Book A.9
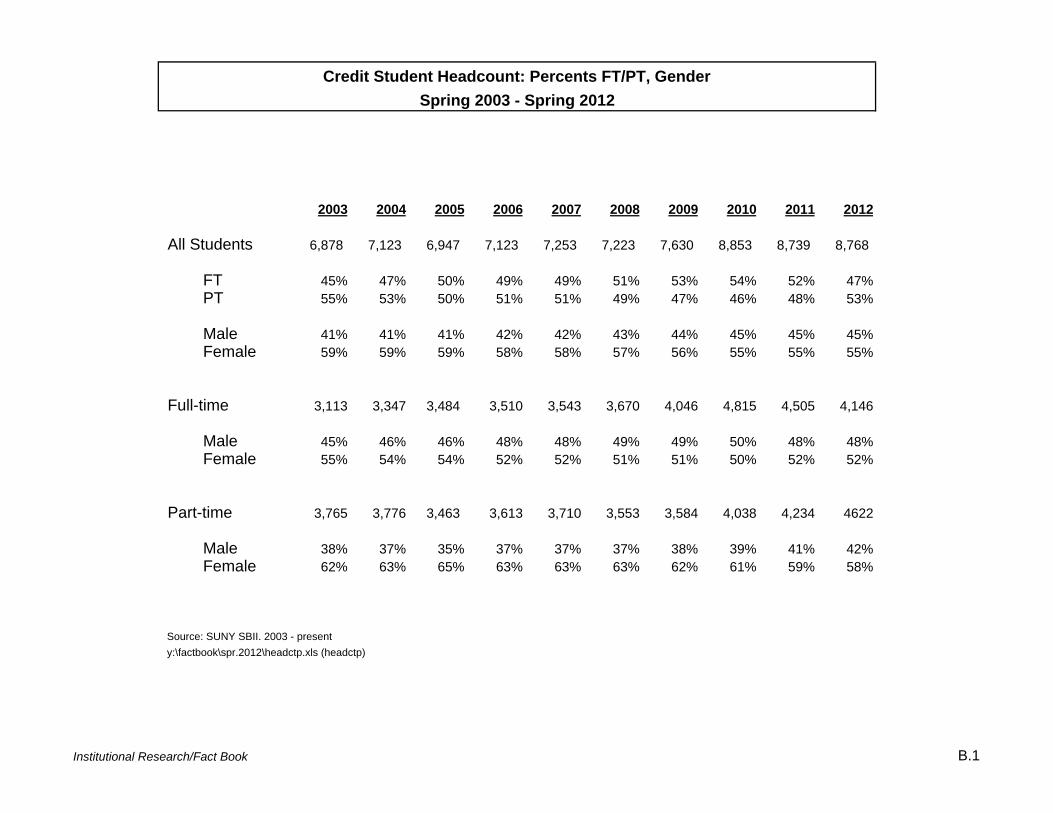
Credit Student Headcount: Percents FT/PT, GenderSpring 2003 - Spring 2012
2003 2004 2005 2006 2007 2008 2009 2010 2011 2012
All Students 6,878 7,123 6,947 7,123 7,253 7,223 7,630 8,853 8,739 8,768
FT 45% 47% 50% 49% 49% 51% 53% 54% 52% 47% PT 55% 53% 50% 51% 51% 49% 47% 46% 48% 53%
Male 41% 41% 41% 42% 42% 43% 44% 45% 45% 45% Female 59% 59% 59% 58% 58% 57% 56% 55% 55% 55%
Full-time 3,113 3,347 3,484 3,510 3,543 3,670 4,046 4,815 4,505 4,146
Male 45% 46% 46% 48% 48% 49% 49% 50% 48% 48% Female 55% 54% 54% 52% 52% 51% 51% 50% 52% 52%
Part-time 3,765 3,776 3,463 3,613 3,710 3,553 3,584 4,038 4,234 4622
Male 38% 37% 35% 37% 37% 37% 38% 39% 41% 42% Female 62% 63% 65% 63% 63% 63% 62% 61% 59% 58%
Source: SUNY SBII. 2003 - presenty:\factbook\spr.2012\headctp.xls (headctp)
Institutional Research/Fact Book B.1
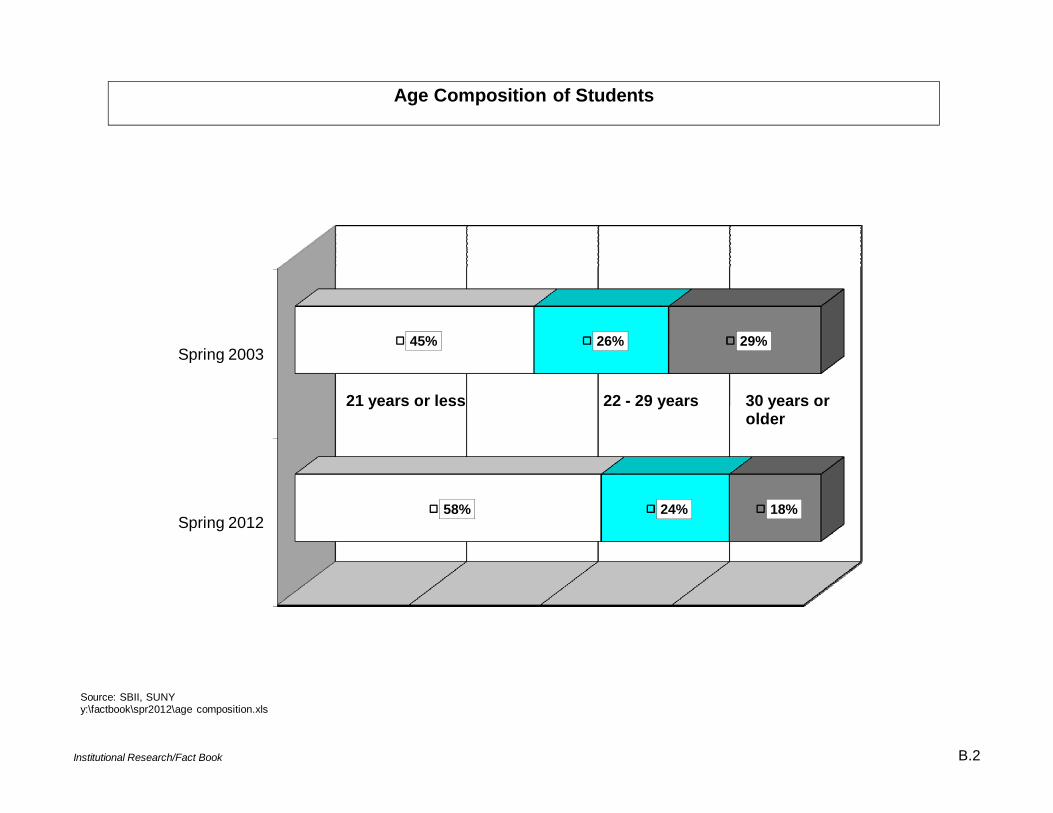
Institutional Research/Fact Book B.2
Spring 2003
Spring 2012
45%
58%
26%
24%
29%
18%
Source: SBII, SUNYy:\factbook\spr2012\age composition.xls
Age Composition of Students
21 years or less 22 - 29 years 30 years or older
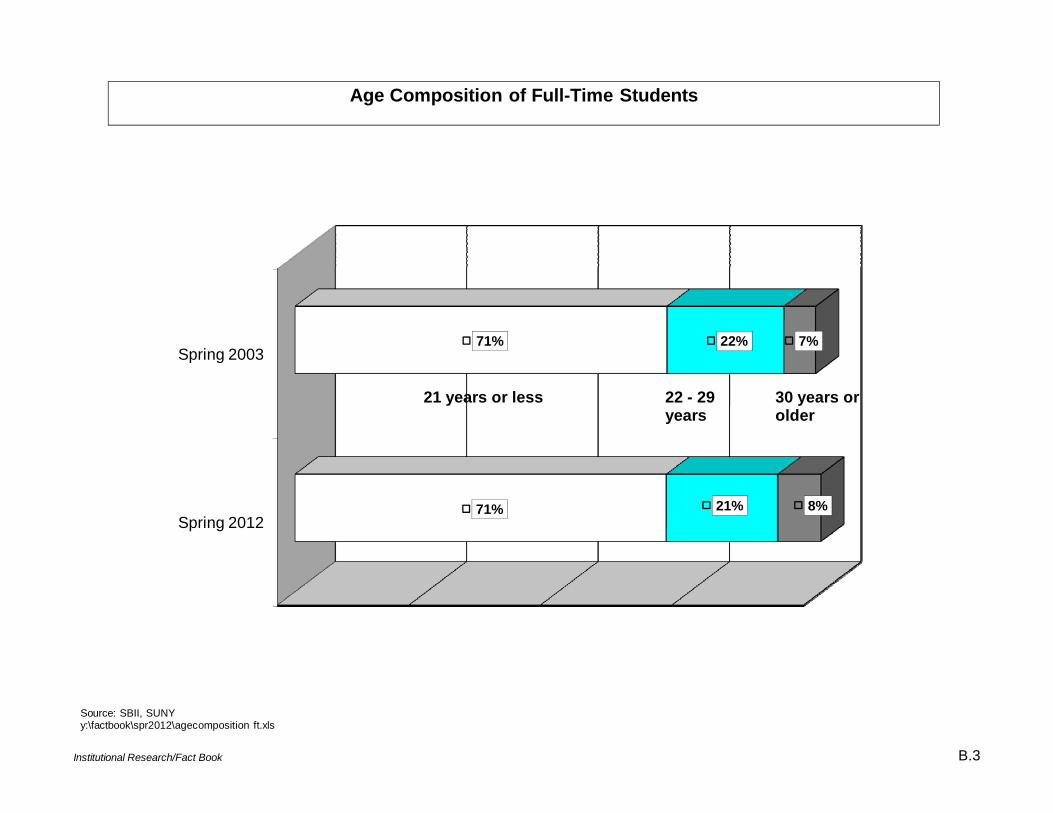
Institutional Research/Fact Book B.3
Spring 2003
Spring 2012
71%
71%
22%
21%
7%
8%
Source: SBII, SUNYy:\factbook\spr2012\agecomposition ft.xls
Age Composition of Full-Time Students
21 years or less 22 - 29 years
30 years or older
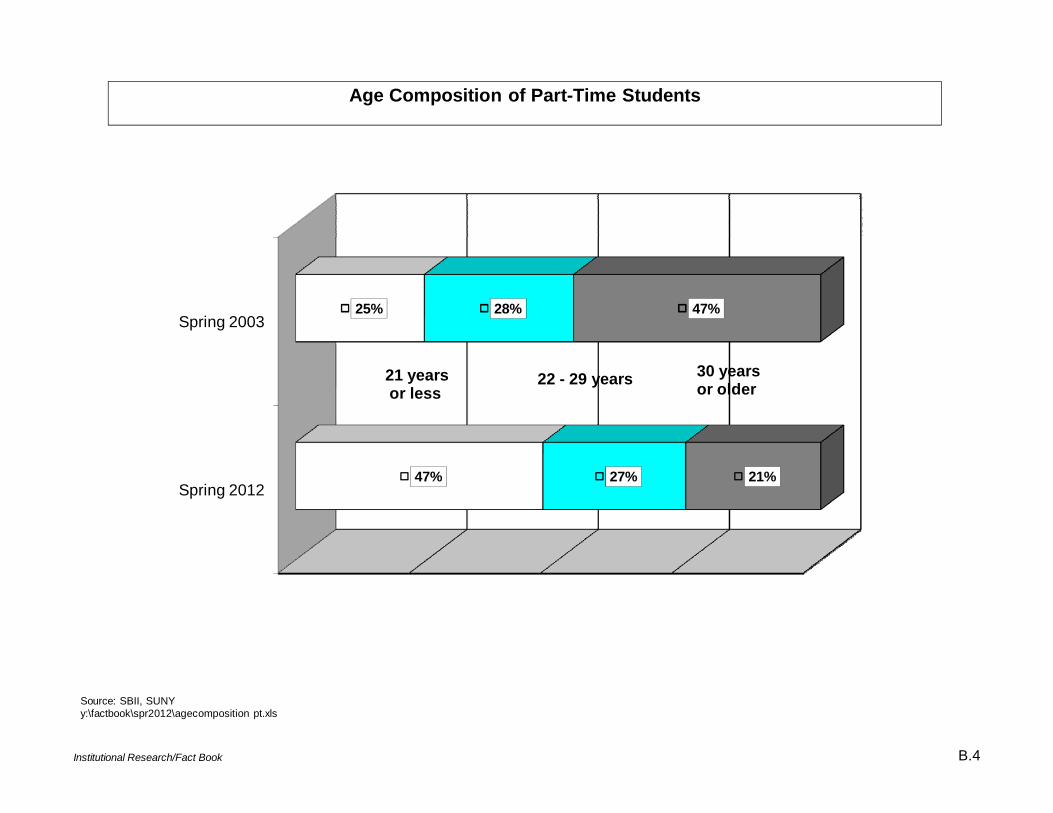
Institutional Research/Fact Book B.4
Spring 2003
Spring 2012
25%
47%
28%
27%
47%
21%
Source: SBII, SUNYy:\factbook\spr2012\agecomposition pt.xls
Age Composition of Part-Time Students
21 yearsor less
22 - 29 years 30 years or older
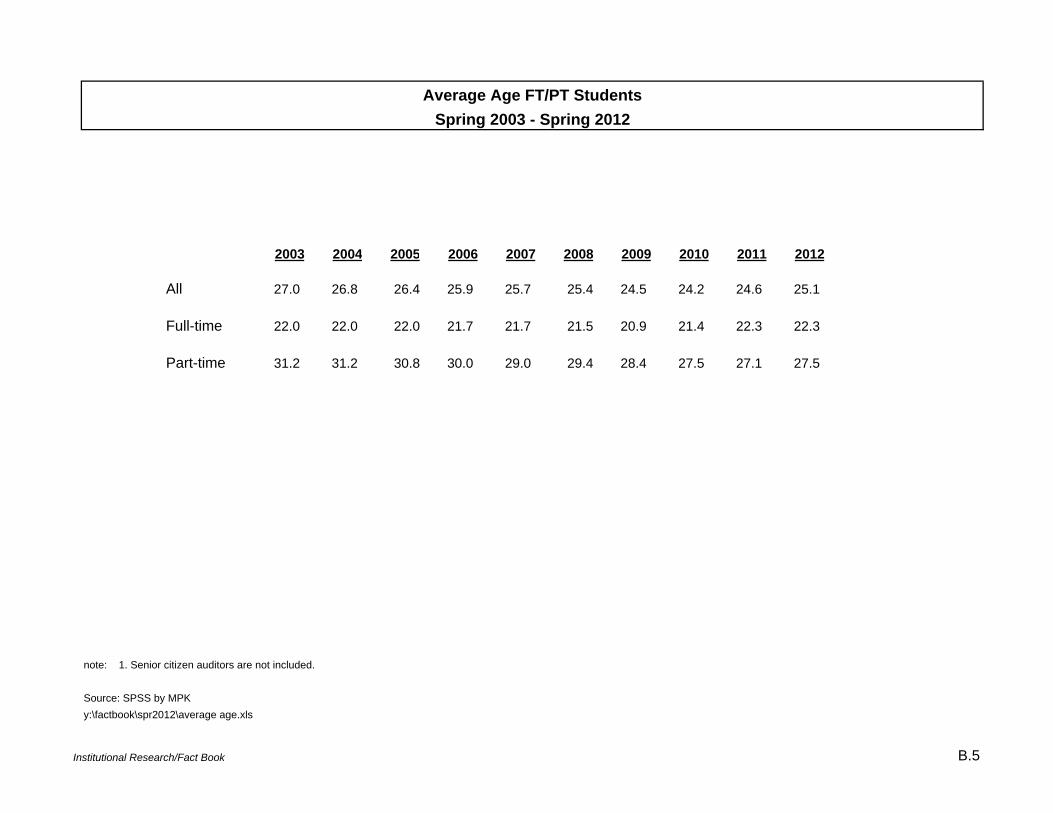
Average Age FT/PT StudentsSpring 2003 - Spring 2012
2003 2004 2005 2006 2007 2008 2009 2010 2011 2012
All 27.0 26.8 26.4 25.9 25.7 25.4 24.5 24.2 24.6 25.1
Full-time 22.0 22.0 22.0 21.7 21.7 21.5 20.9 21.4 22.3 22.3
Part-time 31.2 31.2 30.8 30.0 29.0 29.4 28.4 27.5 27.1 27.5
note: 1. Senior citizen auditors are not included.
Source: SPSS by MPKy:\factbook\spr2012\average age.xls
Institutional Research/Fact Book B.5
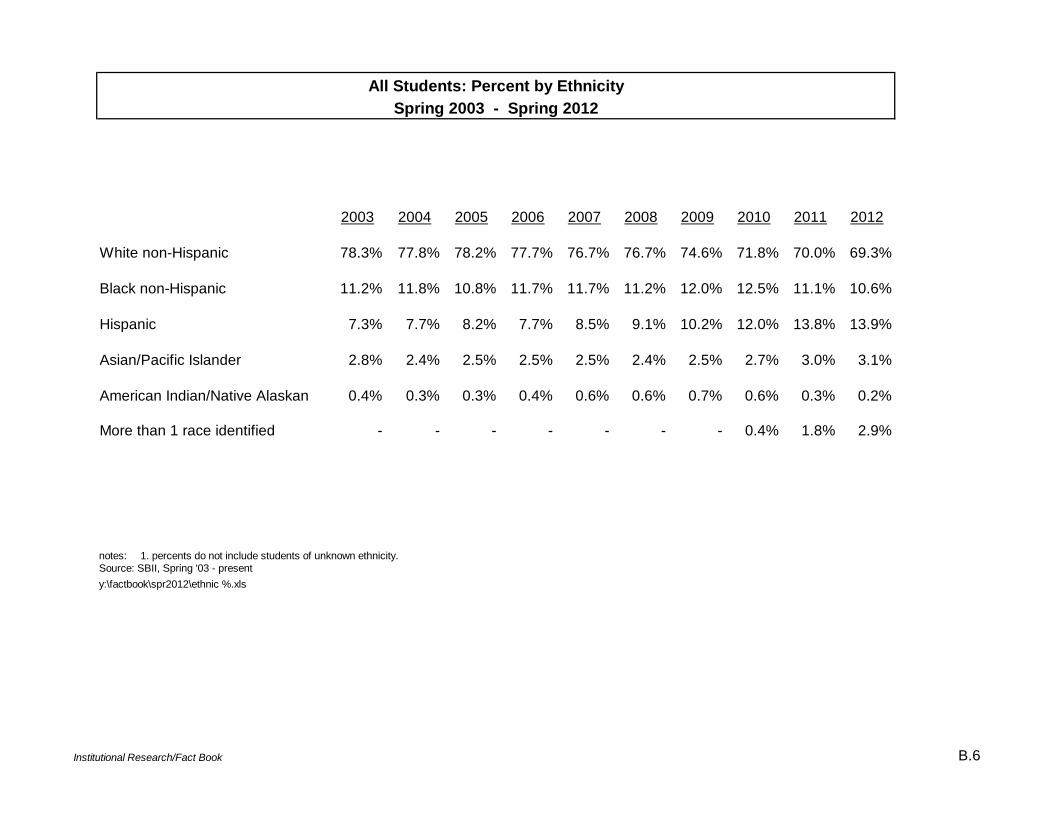
All Students: Percent by EthnicitySpring 2003 - Spring 2012
2003 2004 2005 2006 2007 2008 2009 2010 2011 2012
White non-Hispanic 78.3% 77.8% 78.2% 77.7% 76.7% 76.7% 74.6% 71.8% 70.0% 69.3%
Black non-Hispanic 11.2% 11.8% 10.8% 11.7% 11.7% 11.2% 12.0% 12.5% 11.1% 10.6%
Hispanic 7.3% 7.7% 8.2% 7.7% 8.5% 9.1% 10.2% 12.0% 13.8% 13.9%
Asian/Pacific Islander 2.8% 2.4% 2.5% 2.5% 2.5% 2.4% 2.5% 2.7% 3.0% 3.1%
American Indian/Native Alaskan 0.4% 0.3% 0.3% 0.4% 0.6% 0.6% 0.7% 0.6% 0.3% 0.2%
More than 1 race identified - - - - - - - 0.4% 1.8% 2.9%
notes: 1. percents do not include students of unknown ethnicity.Source: SBII, Spring '03 - presenty:\factbook\spr2012\ethnic %.xls
Institutional Research/Fact Book B.6
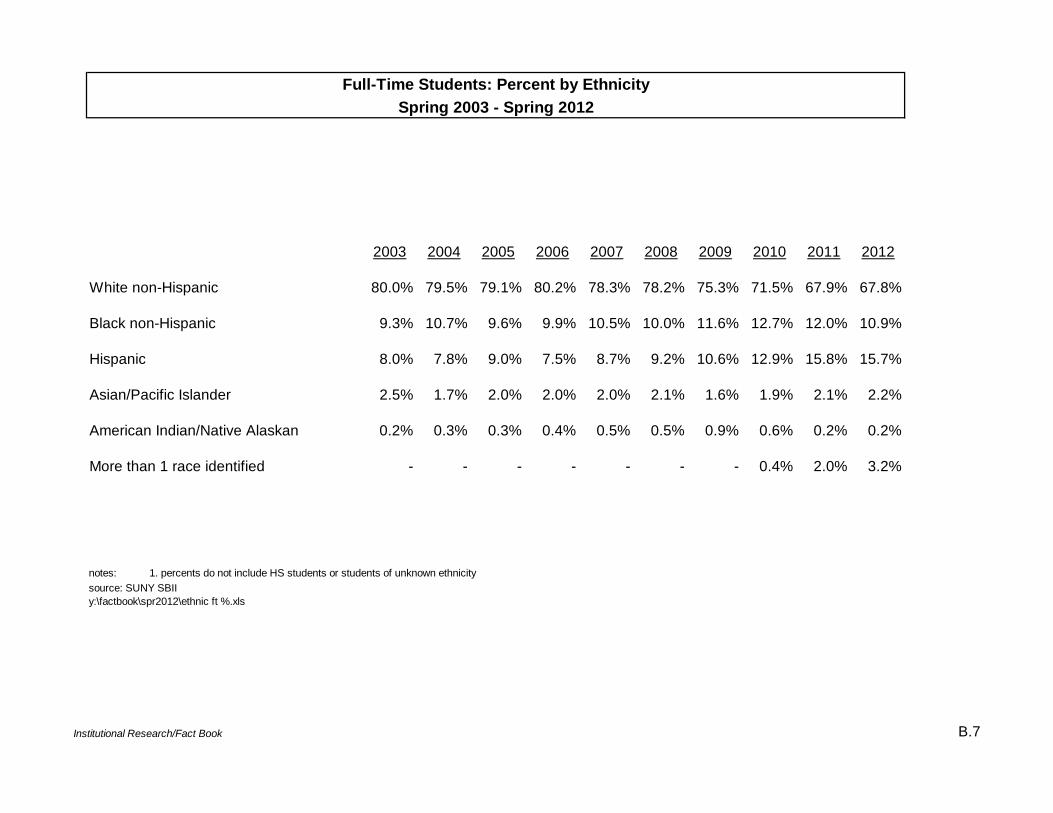
Full-Time Students: Percent by EthnicitySpring 2003 - Spring 2012
2003 2004 2005 2006 2007 2008 2009 2010 2011 2012
White non-Hispanic 80.0% 79.5% 79.1% 80.2% 78.3% 78.2% 75.3% 71.5% 67.9% 67.8%
Black non-Hispanic 9.3% 10.7% 9.6% 9.9% 10.5% 10.0% 11.6% 12.7% 12.0% 10.9%
Hispanic 8.0% 7.8% 9.0% 7.5% 8.7% 9.2% 10.6% 12.9% 15.8% 15.7%
Asian/Pacific Islander 2.5% 1.7% 2.0% 2.0% 2.0% 2.1% 1.6% 1.9% 2.1% 2.2%
American Indian/Native Alaskan 0.2% 0.3% 0.3% 0.4% 0.5% 0.5% 0.9% 0.6% 0.2% 0.2%
More than 1 race identified - - - - - - - 0.4% 2.0% 3.2%
notes: 1. percents do not include HS students or students of unknown ethnicitysource: SUNY SBIIy:\factbook\spr2012\ethnic ft %.xls
Institutional Research/Fact Book B.7
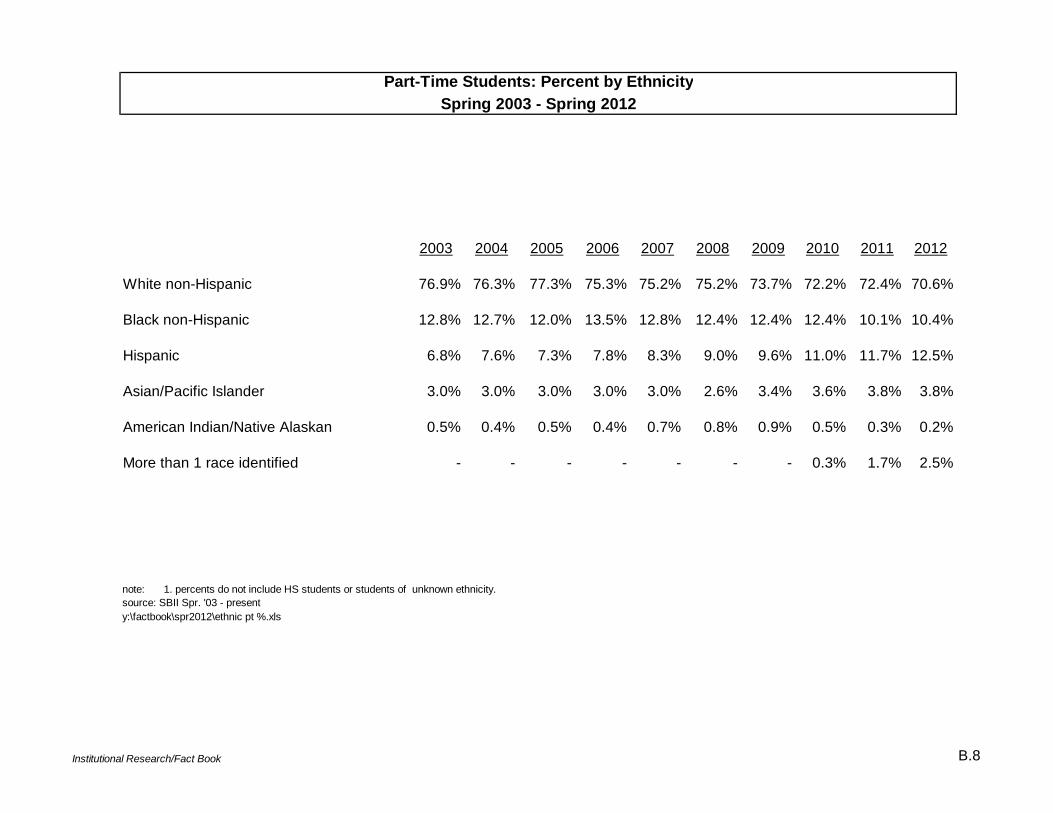
Part-Time Students: Percent by EthnicitySpring 2003 - Spring 2012
2003 2004 2005 2006 2007 2008 2009 2010 2011 2012
White non-Hispanic 76.9% 76.3% 77.3% 75.3% 75.2% 75.2% 73.7% 72.2% 72.4% 70.6%
Black non-Hispanic 12.8% 12.7% 12.0% 13.5% 12.8% 12.4% 12.4% 12.4% 10.1% 10.4%
Hispanic 6.8% 7.6% 7.3% 7.8% 8.3% 9.0% 9.6% 11.0% 11.7% 12.5%
Asian/Pacific Islander 3.0% 3.0% 3.0% 3.0% 3.0% 2.6% 3.4% 3.6% 3.8% 3.8%
American Indian/Native Alaskan 0.5% 0.4% 0.5% 0.4% 0.7% 0.8% 0.9% 0.5% 0.3% 0.2%
More than 1 race identified - - - - - - - 0.3% 1.7% 2.5%
note: 1. percents do not include HS students or students of unknown ethnicity.source: SBII Spr. '03 - presenty:\factbook\spr2012\ethnic pt %.xls
Institutional Research/Fact Book B.8
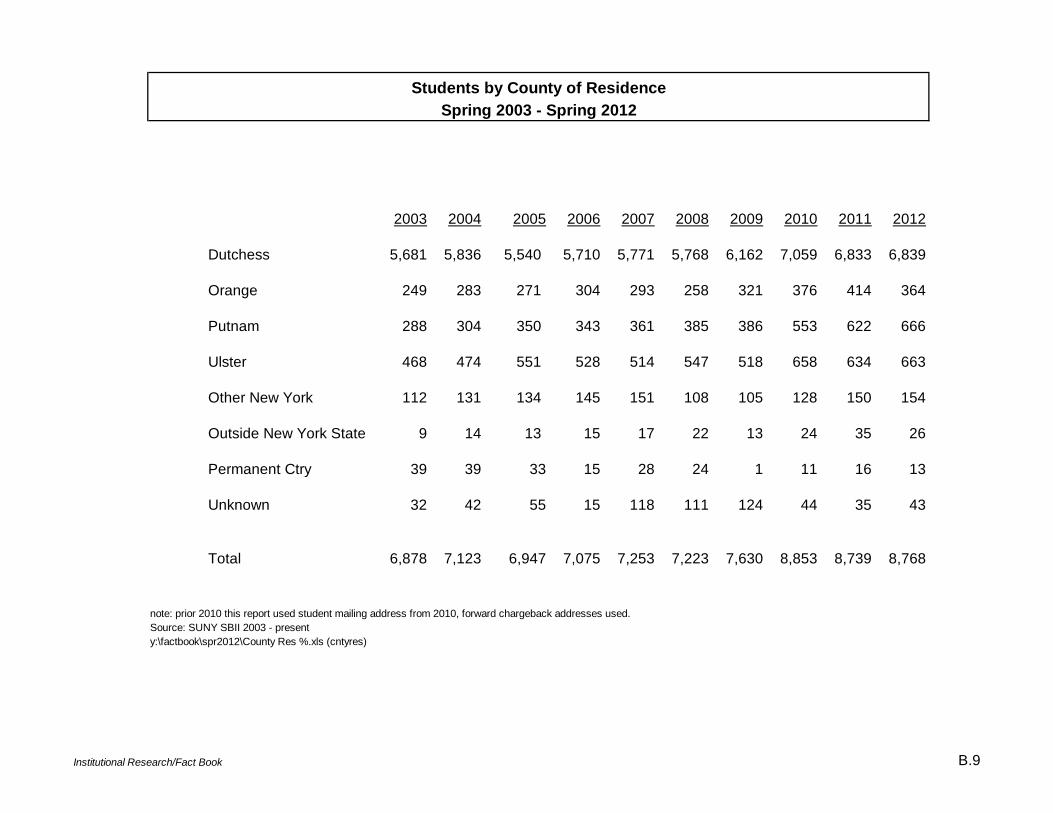
Students by County of ResidenceSpring 2003 - Spring 2012
2003 2004 2005 2006 2007 2008 2009 2010 2011 2012
Dutchess 5,681 5,836 5,540 5,710 5,771 5,768 6,162 7,059 6,833 6,839
Orange 249 283 271 304 293 258 321 376 414 364
Putnam 288 304 350 343 361 385 386 553 622 666
Ulster 468 474 551 528 514 547 518 658 634 663
Other New York 112 131 134 145 151 108 105 128 150 154
Outside New York State 9 14 13 15 17 22 13 24 35 26
Permanent Ctry 39 39 33 15 28 24 1 11 16 13
Unknown 32 42 55 15 118 111 124 44 35 43
Total 6,878 7,123 6,947 7,075 7,253 7,223 7,630 8,853 8,739 8,768
note: prior 2010 this report used student mailing address from 2010, forward chargeback addresses used.Source: SUNY SBII 2003 - presenty:\factbook\spr2012\County Res %.xls (cntyres)
Institutional Research/Fact Book B.9
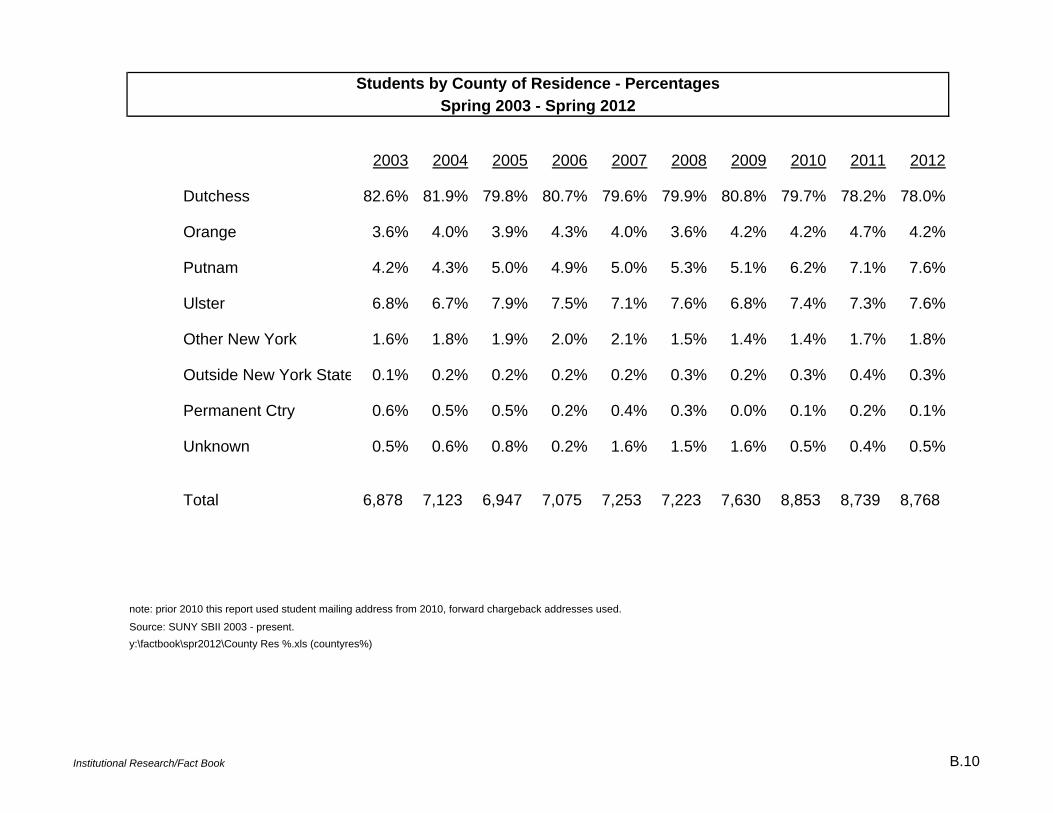
Students by County of Residence - PercentagesSpring 2003 - Spring 2012
2003 2004 2005 2006 2007 2008 2009 2010 2011 2012
Dutchess 82.6% 81.9% 79.8% 80.7% 79.6% 79.9% 80.8% 79.7% 78.2% 78.0%
Orange 3.6% 4.0% 3.9% 4.3% 4.0% 3.6% 4.2% 4.2% 4.7% 4.2%
Putnam 4.2% 4.3% 5.0% 4.9% 5.0% 5.3% 5.1% 6.2% 7.1% 7.6%
Ulster 6.8% 6.7% 7.9% 7.5% 7.1% 7.6% 6.8% 7.4% 7.3% 7.6%
Other New York 1.6% 1.8% 1.9% 2.0% 2.1% 1.5% 1.4% 1.4% 1.7% 1.8%
Outside New York State 0.1% 0.2% 0.2% 0.2% 0.2% 0.3% 0.2% 0.3% 0.4% 0.3%
Permanent Ctry 0.6% 0.5% 0.5% 0.2% 0.4% 0.3% 0.0% 0.1% 0.2% 0.1%
Unknown 0.5% 0.6% 0.8% 0.2% 1.6% 1.5% 1.6% 0.5% 0.4% 0.5%
Total 6,878 7,123 6,947 7,075 7,253 7,223 7,630 8,853 8,739 8,768
note: prior 2010 this report used student mailing address from 2010, forward chargeback addresses used.
Source: SUNY SBII 2003 - present.y:\factbook\spr2012\County Res %.xls (countyres%)
Institutional Research/Fact Book B.10
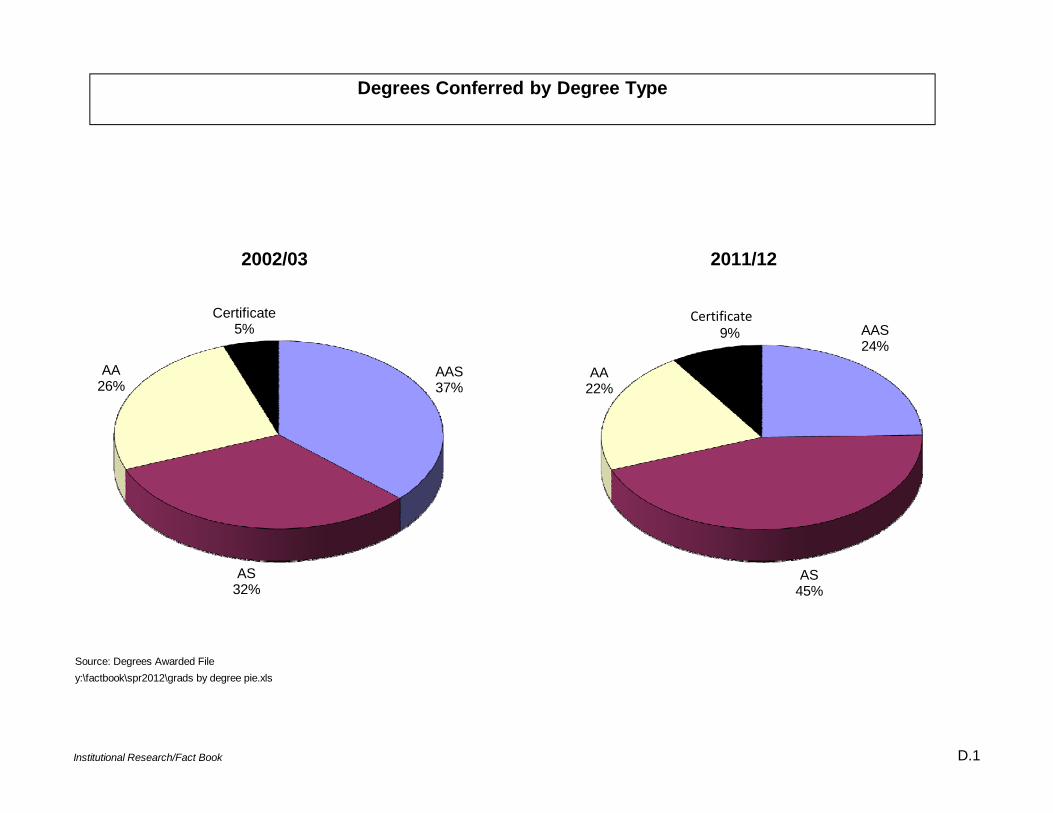
Source: Degrees Awarded Filey:\factbook\spr2012\grads by degree pie.xls
2002/03 2011/12
AAS37%
AS32%
AA26%
Certificate5% AAS
24%
AS45%
AA22%
Certificate10%
Degrees Conferred by Degree Type
Certificate9%
Institutional Research/Fact Book D.1
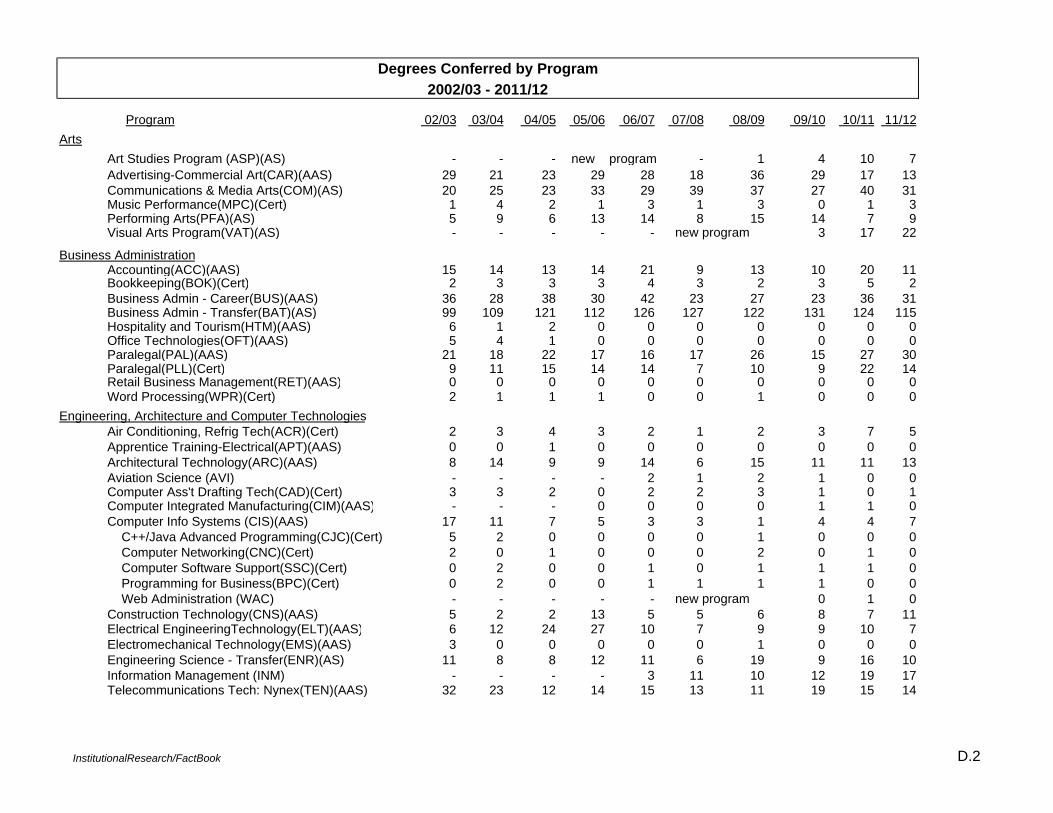
Degrees Conferred by Program2002/03 - 2011/12
Program 02/03 03/04 04/05 05/06 06/07 07/08 08/09 09/10 10/11 11/12Arts
Art Studies Program (ASP)(AS) - - - new program - 1 4 10 7 Advertising-Commercial Art(CAR)(AAS) 29 21 23 29 28 18 36 29 17 13 Communications & Media Arts(COM)(AS) 20 25 23 33 29 39 37 27 40 31 Music Performance(MPC)(Cert) 1 4 2 1 3 1 3 0 1 3 Performing Arts(PFA)(AS) 5 9 6 13 14 8 15 14 7 9 Visual Arts Program(VAT)(AS) - - - - - 3 17 22
Business Administration Accounting(ACC)(AAS) 15 14 13 14 21 9 13 10 20 11 Bookkeeping(BOK)(Cert) 2 3 3 3 4 3 2 3 5 2 Business Admin - Career(BUS)(AAS) 36 28 38 30 42 23 27 23 36 31 Business Admin - Transfer(BAT)(AS) 99 109 121 112 126 127 122 131 124 115 Hospitality and Tourism(HTM)(AAS) 6 1 2 0 0 0 0 0 0 0 Office Technologies(OFT)(AAS) 5 4 1 0 0 0 0 0 0 0 Paralegal(PAL)(AAS) 21 18 22 17 16 17 26 15 27 30 Paralegal(PLL)(Cert) 9 11 15 14 14 7 10 9 22 14 Retail Business Management(RET)(AAS) 0 0 0 0 0 0 0 0 0 0 Word Processing(WPR)(Cert) 2 1 1 1 0 0 1 0 0 0
Engineering, Architecture and Computer Technologies Air Conditioning, Refrig Tech(ACR)(Cert) 2 3 4 3 2 1 2 3 7 5 Apprentice Training-Electrical(APT)(AAS) 0 0 1 0 0 0 0 0 0 0 Architectural Technology(ARC)(AAS) 8 14 9 9 14 6 15 11 11 13 Aviation Science (AVI) - - - - 2 1 2 1 0 0 Computer Ass't Drafting Tech(CAD)(Cert) 3 3 2 0 2 2 3 1 0 1 Computer Integrated Manufacturing(CIM)(AAS) - - - 0 0 0 0 1 1 0 Computer Info Systems (CIS)(AAS) 17 11 7 5 3 3 1 4 4 7 C++/Java Advanced Programming(CJC)(Cert) 5 2 0 0 0 0 1 0 0 0 Computer Networking(CNC)(Cert) 2 0 1 0 0 0 2 0 1 0 Computer Software Support(SSC)(Cert) 0 2 0 0 1 0 1 1 1 0 Programming for Business(BPC)(Cert) 0 2 0 0 1 1 1 1 0 0 Web Administration (WAC) - - - - - 0 1 0 Construction Technology(CNS)(AAS) 5 2 2 13 5 5 6 8 7 11 Electrical EngineeringTechnology(ELT)(AAS) 6 12 24 27 10 7 9 9 10 7 Electromechanical Technology(EMS)(AAS) 3 0 0 0 0 0 1 0 0 0 Engineering Science - Transfer(ENR)(AS) 11 8 8 12 11 6 19 9 16 10 Information Management (INM) - - - - 3 11 10 12 19 17 Telecommunications Tech: Nynex(TEN)(AAS) 32 23 12 14 15 13 11 19 15 14
new program
new program
InstitutionalResearch/FactBook D.2
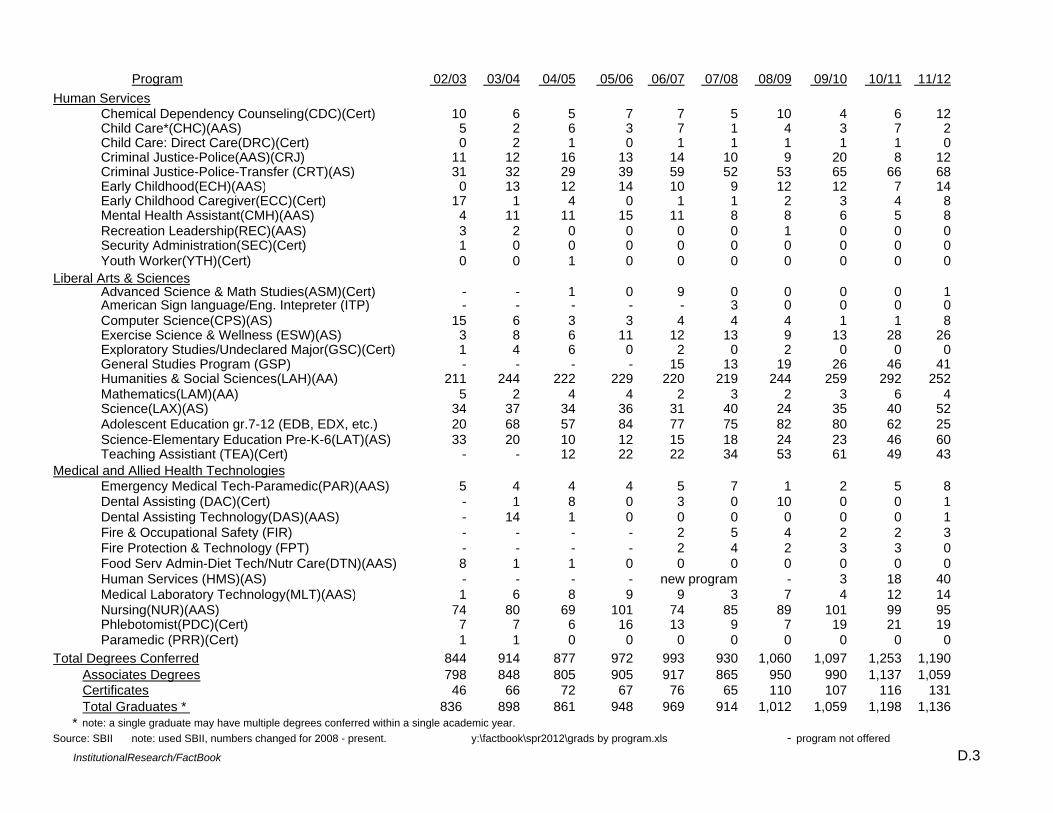
Program 02/03 03/04 04/05 05/06 06/07 07/08 08/09 09/10 10/11 11/12Human Services
Chemical Dependency Counseling(CDC)(Cert) 10 6 5 7 7 5 10 4 6 12 Child Care*(CHC)(AAS) 5 2 6 3 7 1 4 3 7 2 Child Care: Direct Care(DRC)(Cert) 0 2 1 0 1 1 1 1 1 0 Criminal Justice-Police(AAS)(CRJ) 11 12 16 13 14 10 9 20 8 12 Criminal Justice-Police-Transfer (CRT)(AS) 31 32 29 39 59 52 53 65 66 68 Early Childhood(ECH)(AAS) 0 13 12 14 10 9 12 12 7 14 Early Childhood Caregiver(ECC)(Cert) 17 1 4 0 1 1 2 3 4 8 Mental Health Assistant(CMH)(AAS) 4 11 11 15 11 8 8 6 5 8 Recreation Leadership(REC)(AAS) 3 2 0 0 0 0 1 0 0 0 Security Administration(SEC)(Cert) 1 0 0 0 0 0 0 0 0 0 Youth Worker(YTH)(Cert) 0 0 1 0 0 0 0 0 0 0
Liberal Arts & Sciences Advanced Science & Math Studies(ASM)(Cert) - - 1 0 9 0 0 0 0 1 American Sign language/Eng. Intepreter (ITP) - - - - - 3 0 0 0 0 Computer Science(CPS)(AS) 15 6 3 3 4 4 4 1 1 8 Exercise Science & Wellness (ESW)(AS) 3 8 6 11 12 13 9 13 28 26 Exploratory Studies/Undeclared Major(GSC)(Cert) 1 4 6 0 2 0 2 0 0 0 General Studies Program (GSP) - - - - 15 13 19 26 46 41 Humanities & Social Sciences(LAH)(AA) 211 244 222 229 220 219 244 259 292 252 Mathematics(LAM)(AA) 5 2 4 4 2 3 2 3 6 4 Science(LAX)(AS) 34 37 34 36 31 40 24 35 40 52 Adolescent Education gr.7-12 (EDB, EDX, etc.) 20 68 57 84 77 75 82 80 62 25 Science-Elementary Education Pre-K-6(LAT)(AS) 33 20 10 12 15 18 24 23 46 60 Teaching Assistiant (TEA)(Cert) - - 12 22 22 34 53 61 49 43
Medical and Allied Health Technologies Emergency Medical Tech-Paramedic(PAR)(AAS) 5 4 4 4 5 7 1 2 5 8 Dental Assisting (DAC)(Cert) - 1 8 0 3 0 10 0 0 1 Dental Assisting Technology(DAS)(AAS) - 14 1 0 0 0 0 0 0 1 Fire & Occupational Safety (FIR) - - - - 2 5 4 2 2 3 Fire Protection & Technology (FPT) - - - - 2 4 2 3 3 0 Food Serv Admin-Diet Tech/Nutr Care(DTN)(AAS) 8 1 1 0 0 0 0 0 0 0 Human Services (HMS)(AS) - - - - new program - 3 18 40 Medical Laboratory Technology(MLT)(AAS) 1 6 8 9 9 3 7 4 12 14 Nursing(NUR)(AAS) 74 80 69 101 74 85 89 101 99 95 Phlebotomist(PDC)(Cert) 7 7 6 16 13 9 7 19 21 19 Paramedic (PRR)(Cert) 1 1 0 0 0 0 0 0 0 0
Total Degrees Conferred 844 914 877 972 993 930 1,060 1,097 1,253 1,190Associates Degrees 798 848 805 905 917 865 950 990 1,137 1,059Certificates 46 66 72 67 76 65 110 107 116 131Total Graduates * 836 898 861 948 969 914 1,012 1,059 1,198 1,136
* note: a single graduate may have multiple degrees conferred within a single academic year.Source: SBII note: used SBII, numbers changed for 2008 - present. y:\factbook\spr2012\grads by program.xls - program not offered
InstitutionalResearch/FactBook D.3
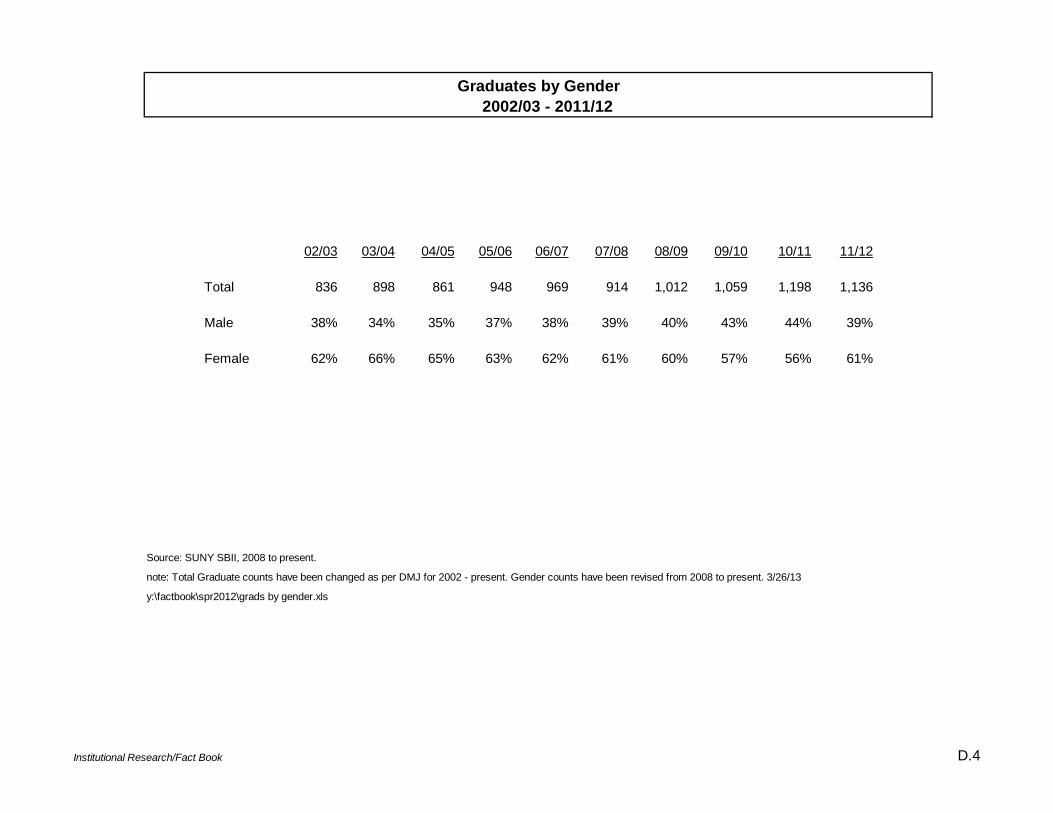
Graduates by Gender 2002/03 - 2011/12
02/03 03/04 04/05 05/06 06/07 07/08 08/09 09/10 10/11 11/12
Total 836 898 861 948 969 914 1,012 1,059 1,198 1,136
Male 38% 34% 35% 37% 38% 39% 40% 43% 44% 39%
Female 62% 66% 65% 63% 62% 61% 60% 57% 56% 61%
Source: SUNY SBII, 2008 to present.
note: Total Graduate counts have been changed as per DMJ for 2002 - present. Gender counts have been revised from 2008 to present. 3/26/13
y:\factbook\spr2012\grads by gender.xls
Institutional Research/Fact Book D.4
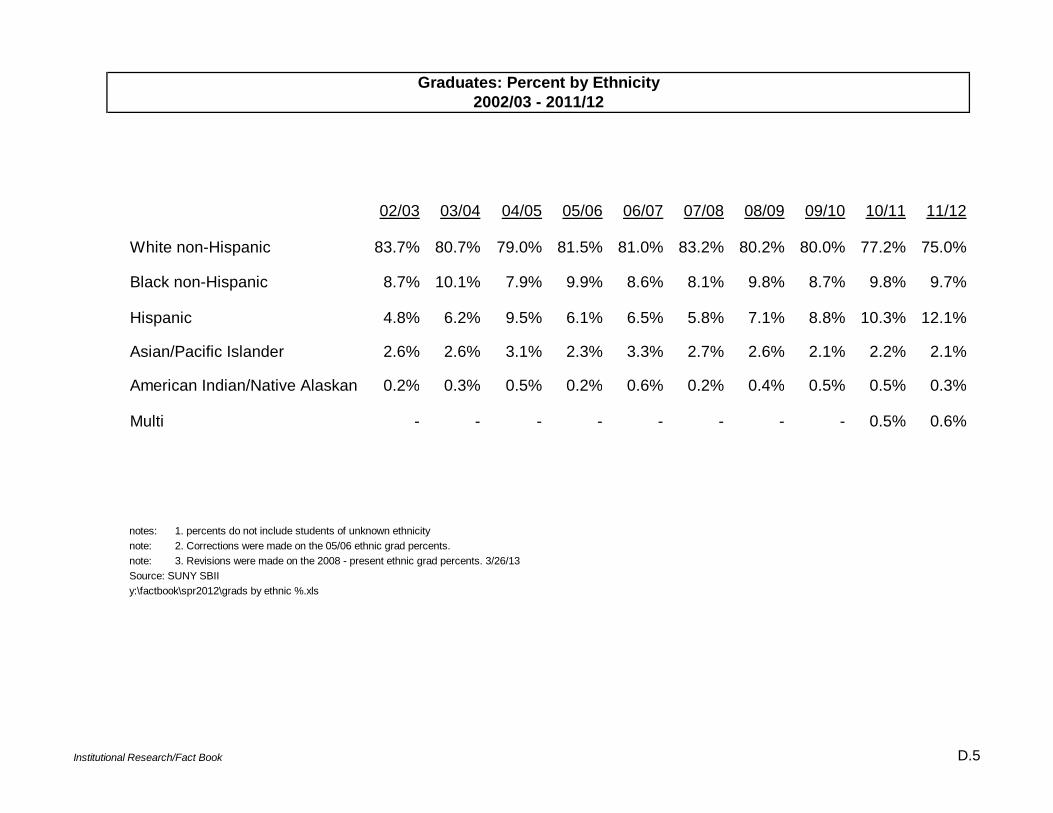
Graduates: Percent by Ethnicity2002/03 - 2011/12
02/03 03/04 04/05 05/06 06/07 07/08 08/09 09/10 10/11 11/12
White non-Hispanic 83.7% 80.7% 79.0% 81.5% 81.0% 83.2% 80.2% 80.0% 77.2% 75.0%
Black non-Hispanic 8.7% 10.1% 7.9% 9.9% 8.6% 8.1% 9.8% 8.7% 9.8% 9.7%
Hispanic 4.8% 6.2% 9.5% 6.1% 6.5% 5.8% 7.1% 8.8% 10.3% 12.1%
Asian/Pacific Islander 2.6% 2.6% 3.1% 2.3% 3.3% 2.7% 2.6% 2.1% 2.2% 2.1%
American Indian/Native Alaskan 0.2% 0.3% 0.5% 0.2% 0.6% 0.2% 0.4% 0.5% 0.5% 0.3%
Multi - - - - - - - - 0.5% 0.6%
notes: 1. percents do not include students of unknown ethnicitynote: 2. Corrections were made on the 05/06 ethnic grad percents.note: 3. Revisions were made on the 2008 - present ethnic grad percents. 3/26/13Source: SUNY SBIIy:\factbook\spr2012\grads by ethnic %.xls
Institutional Research/Fact Book D.5
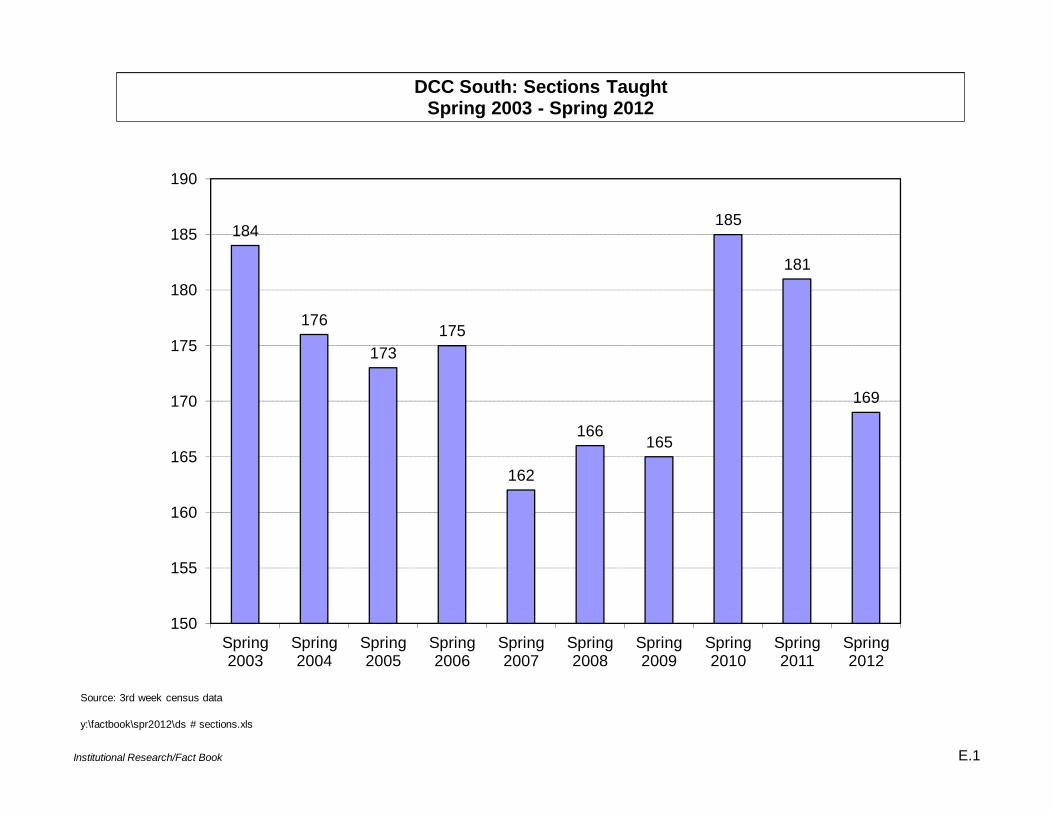
Institutional Research/Fact Book E.1
184
176
173175
162
166165
185
181
169
150
155
160
165
170
175
180
185
190
Spring 2003
Spring 2004
Spring 2005
Spring 2006
Spring 2007
Spring 2008
Spring 2009
Spring 2010
Spring 2011
Spring 2012
DCC South: Sections TaughtSpring 2003 - Spring 2012
y:\factbook\spr2012\ds # sections.xls
Source: 3rd week census data
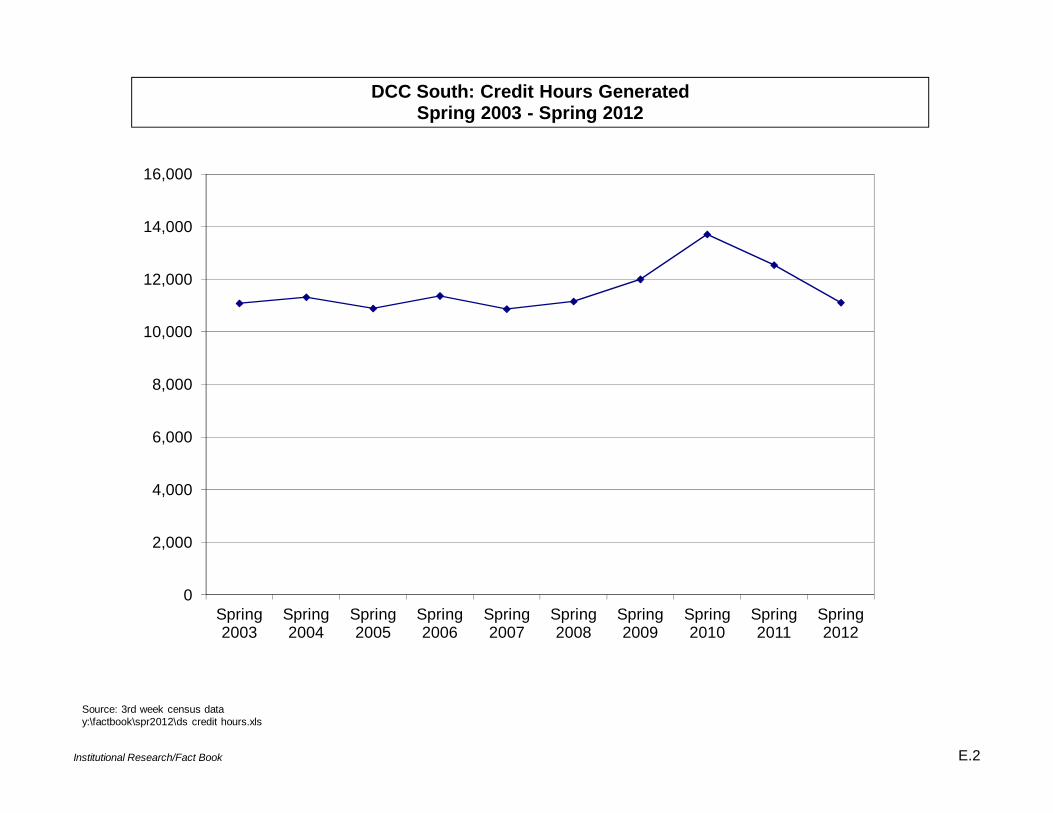
Institutional Research/Fact Book E.2
0
2,000
4,000
6,000
8,000
10,000
12,000
14,000
16,000
Spring 2003
Spring 2004
Spring 2005
Spring 2006
Spring 2007
Spring 2008
Spring 2009
Spring 2010
Spring 2011
Spring 2012
DCC South: Credit Hours GeneratedSpring 2003 - Spring 2012
Source: 3rd week census datay:\factbook\spr2012\ds credit hours.xls
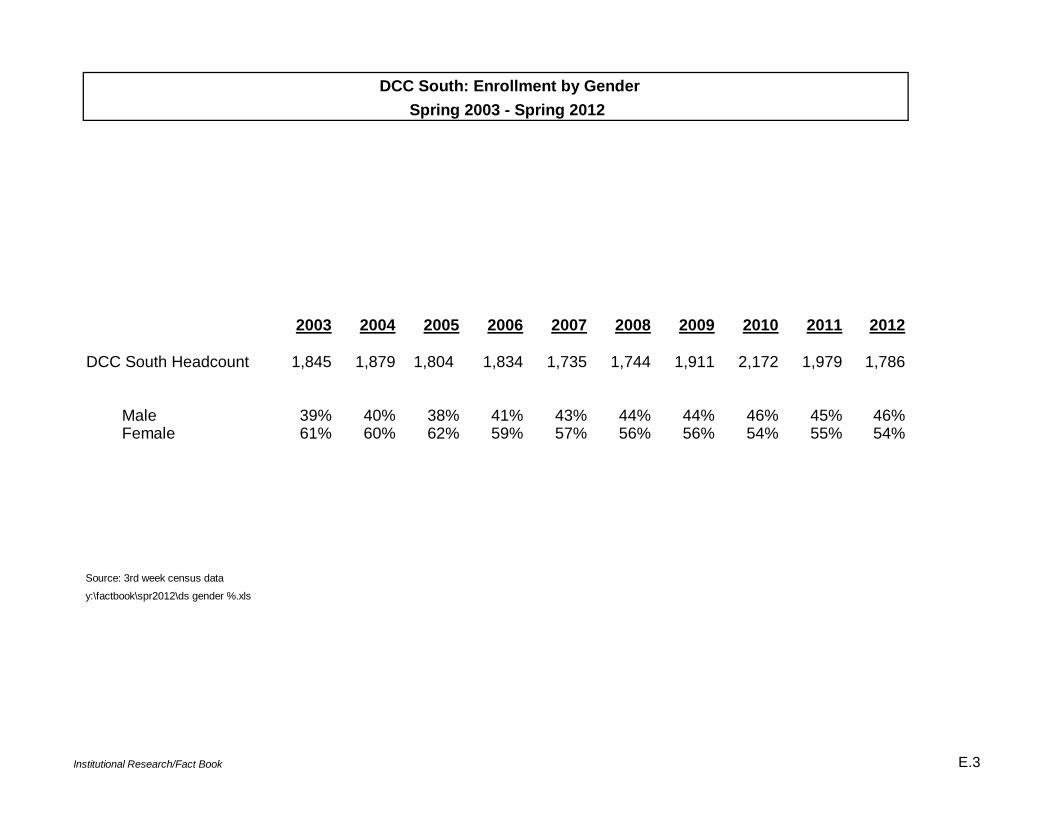
DCC South: Enrollment by Gender Spring 2003 - Spring 2012
2003 2004 2005 2006 2007 2008 2009 2010 2011 2012
DCC South Headcount 1,845 1,879 1,804 1,834 1,735 1,744 1,911 2,172 1,979 1,786
Male 39% 40% 38% 41% 43% 44% 44% 46% 45% 46% Female 61% 60% 62% 59% 57% 56% 56% 54% 55% 54%
Source: 3rd week census data
y:\factbook\spr2012\ds gender %.xls
Institutional Research/Fact Book E.3
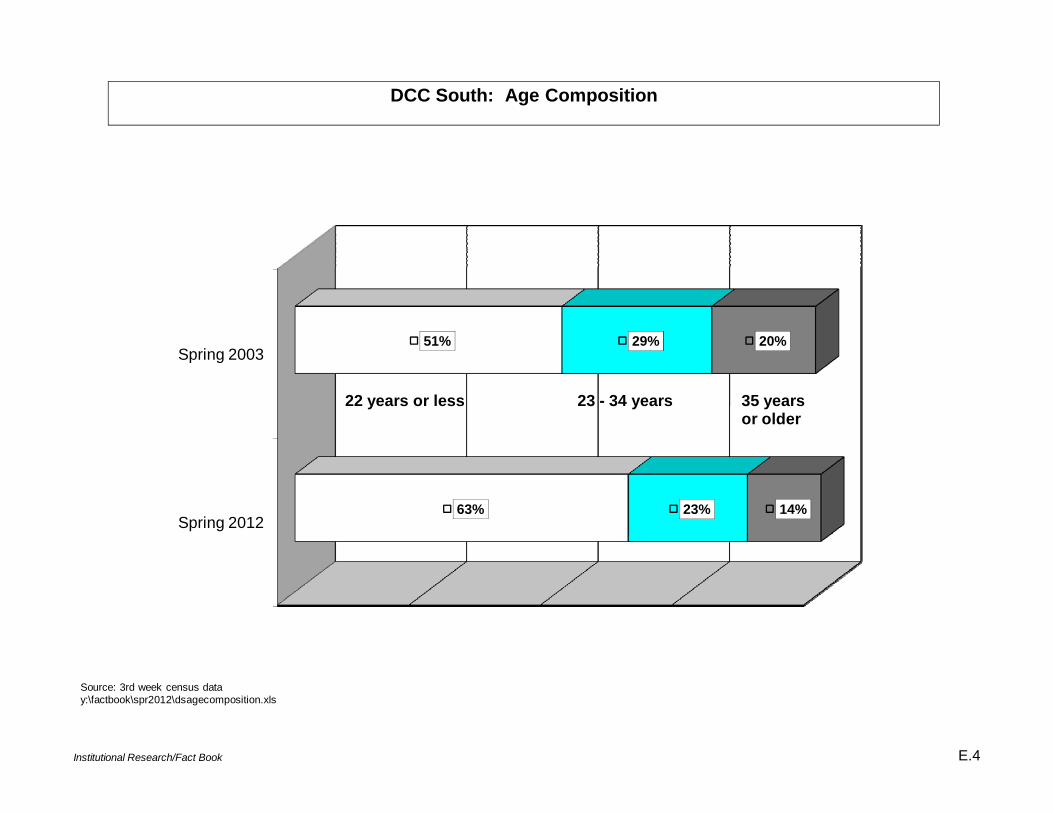
Institutional Research/Fact Book E.4
Spring 2003
Spring 2012
51%
63%
29%
23%
20%
14%
Source: 3rd week census datay:\factbook\spr2012\dsagecomposition.xls
DCC South: Age Composition
22 years or less 23 - 34 years 35 years or older
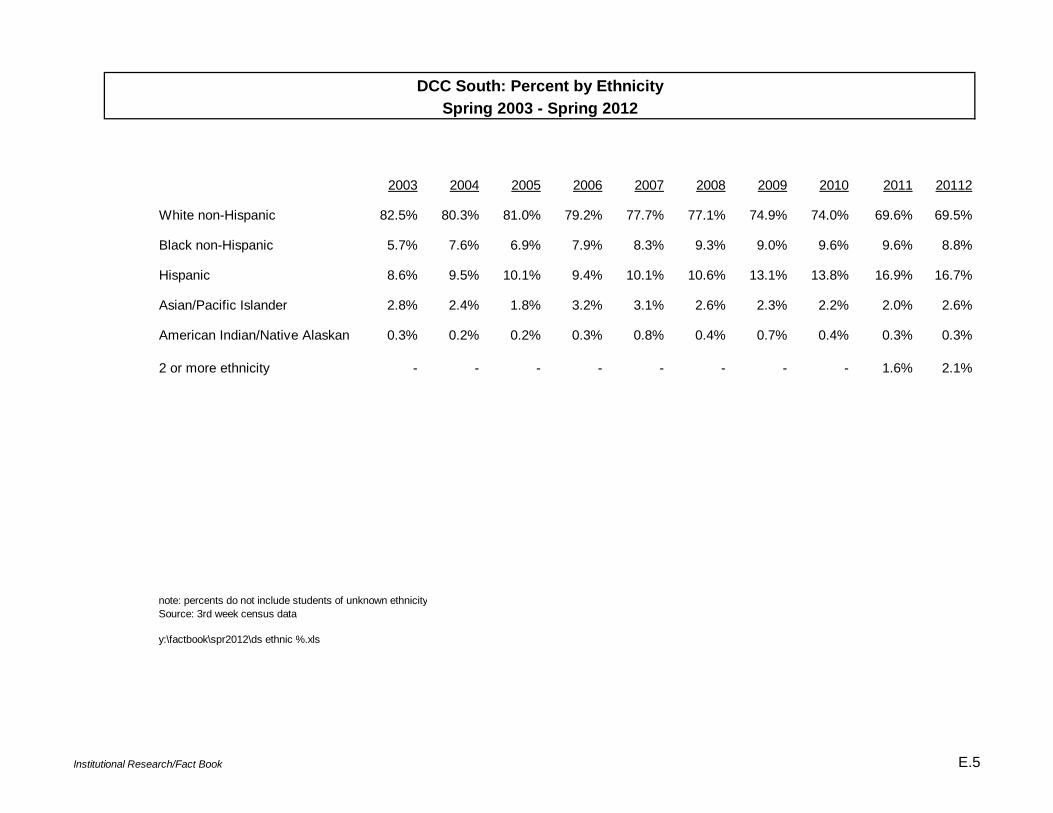
DCC South: Percent by EthnicitySpring 2003 - Spring 2012
2003 2004 2005 2006 2007 2008 2009 2010 2011 20112
White non-Hispanic 82.5% 80.3% 81.0% 79.2% 77.7% 77.1% 74.9% 74.0% 69.6% 69.5%
Black non-Hispanic 5.7% 7.6% 6.9% 7.9% 8.3% 9.3% 9.0% 9.6% 9.6% 8.8%
Hispanic 8.6% 9.5% 10.1% 9.4% 10.1% 10.6% 13.1% 13.8% 16.9% 16.7%
Asian/Pacific Islander 2.8% 2.4% 1.8% 3.2% 3.1% 2.6% 2.3% 2.2% 2.0% 2.6%
American Indian/Native Alaskan 0.3% 0.2% 0.2% 0.3% 0.8% 0.4% 0.7% 0.4% 0.3% 0.3%
2 or more ethnicity - - - - - - - - 1.6% 2.1%
note: percents do not include students of unknown ethnicitySource: 3rd week census data
y:\factbook\spr2012\ds ethnic %.xls
Institutional Research/Fact Book E.5
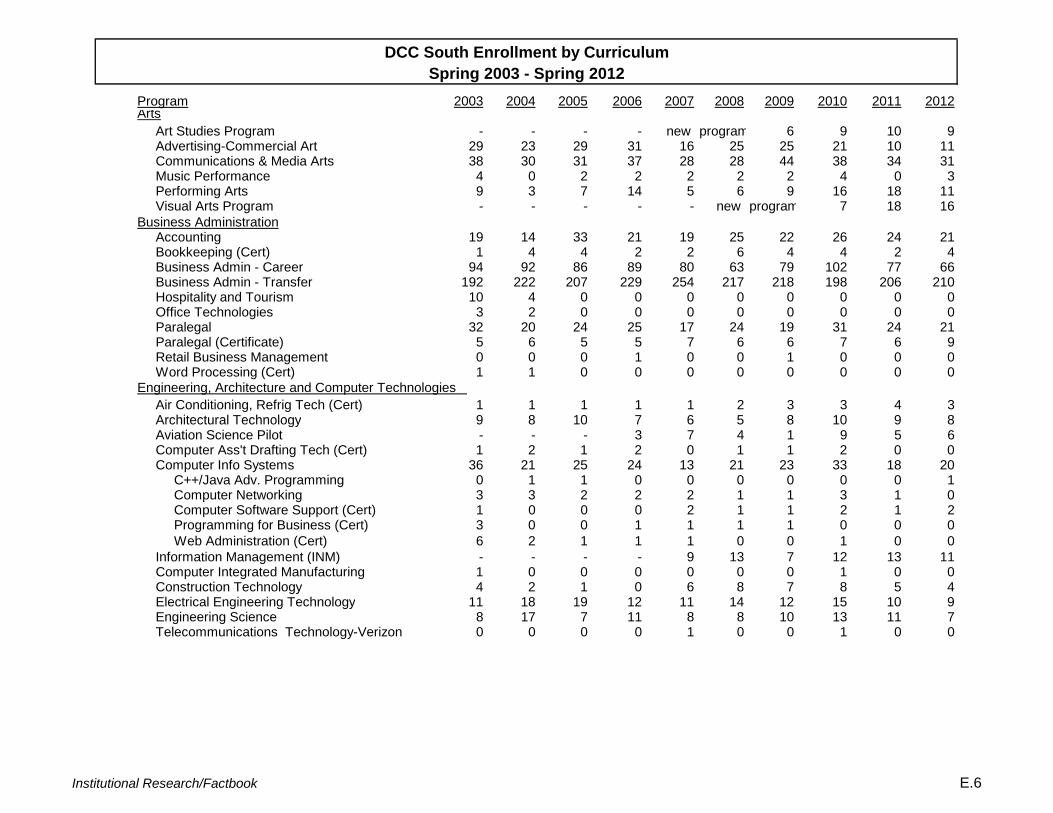
DCC South Enrollment by CurriculumSpring 2003 - Spring 2012
Program 2003 2004 2005 2006 2007 2008 2009 2010 2011 2012Arts Art Studies Program - - - - new program 6 9 10 9 Advertising-Commercial Art 29 23 29 31 16 25 25 21 10 11 Communications & Media Arts 38 30 31 37 28 28 44 38 34 31 Music Performance 4 0 2 2 2 2 2 4 0 3 Performing Arts 9 3 7 14 5 6 9 16 18 11 Visual Arts Program - - - - - new program 7 18 16Business Administration Accounting 19 14 33 21 19 25 22 26 24 21 Bookkeeping (Cert) 1 4 4 2 2 6 4 4 2 4 Business Admin - Career 94 92 86 89 80 63 79 102 77 66 Business Admin - Transfer 192 222 207 229 254 217 218 198 206 210 Hospitality and Tourism 10 4 0 0 0 0 0 0 0 0 Office Technologies 3 2 0 0 0 0 0 0 0 0 Paralegal 32 20 24 25 17 24 19 31 24 21 Paralegal (Certificate) 5 6 5 5 7 6 6 7 6 9 Retail Business Management 0 0 0 1 0 0 1 0 0 0 Word Processing (Cert) 1 1 0 0 0 0 0 0 0 0Engineering, Architecture and Computer Technologies Air Conditioning, Refrig Tech (Cert) 1 1 1 1 1 2 3 3 4 3
Architectural Technology 9 8 10 7 6 5 8 10 9 8 Architectural Technology 9 8 10 7 6 5 8 10 9 8 Aviation Science Pilot - - - 3 7 4 1 9 5 6 Computer Ass't Drafting Tech (Cert) 1 2 1 2 0 1 1 2 0 0 Computer Info Systems 36 21 25 24 13 21 23 33 18 20 C++/Java Adv. Programming 0 1 1 0 0 0 0 0 0 1 Computer Networking 3 3 2 2 2 1 1 3 1 0 Computer Software Support (Cert) 1 0 0 0 2 1 1 2 1 2 Programming for Business (Cert) 3 0 0 1 1 1 1 0 0 0 Web Administration (Cert) 6 2 1 1 1 0 0 1 0 0 Information Management (INM) - - - - 9 13 7 12 13 11 Computer Integrated Manufacturing 1 0 0 0 0 0 0 1 0 0 Construction Technology 4 2 1 0 6 8 7 8 5 4 Electrical Engineering Technology 11 18 19 12 11 14 12 15 10 9 Engineering Science 8 17 7 11 8 8 10 13 11 7 Telecommunications Technology-Verizon 0 0 0 0 1 0 0 1 0 0
Institutional Research/Factbook E.6
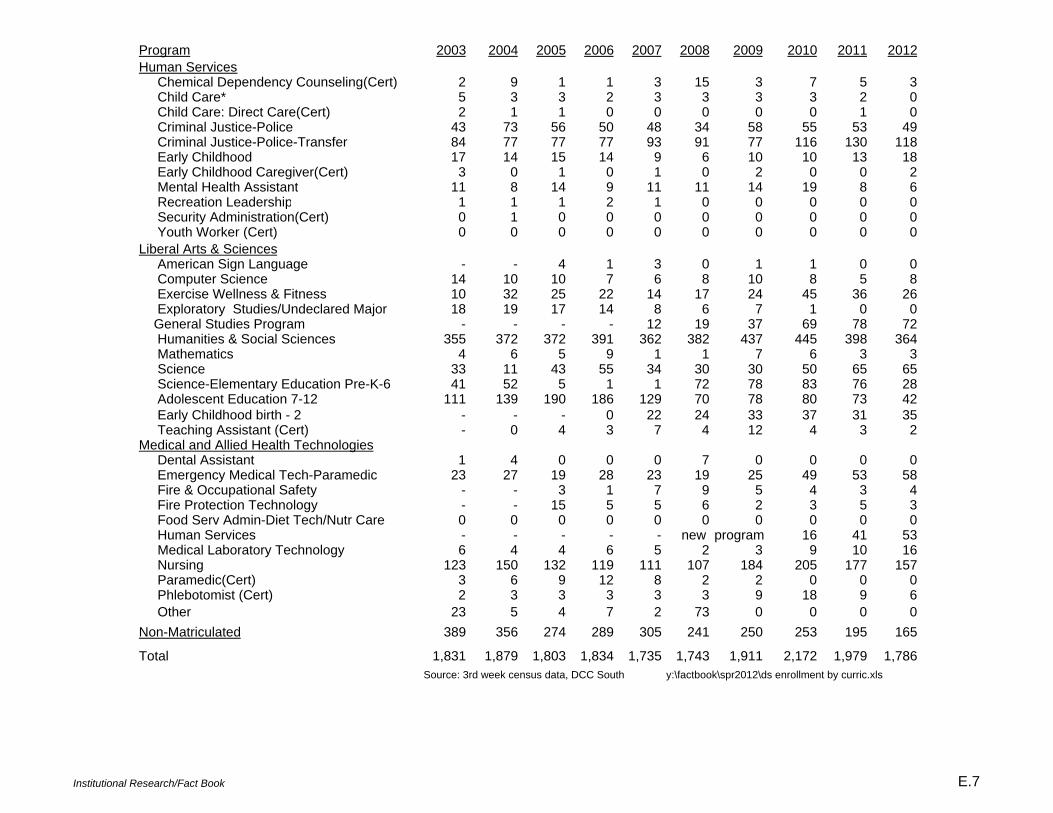
Program 2003 2004 2005 2006 2007 2008 2009 2010 2011 2012Human Services Chemical Dependency Counseling(Cert) 2 9 1 1 3 15 3 7 5 3 Child Care* 5 3 3 2 3 3 3 3 2 0 Child Care: Direct Care(Cert) 2 1 1 0 0 0 0 0 1 0 Criminal Justice-Police 43 73 56 50 48 34 58 55 53 49 Criminal Justice-Police-Transfer 84 77 77 77 93 91 77 116 130 118 Early Childhood 17 14 15 14 9 6 10 10 13 18 Early Childhood Caregiver(Cert) 3 0 1 0 1 0 2 0 0 2 Mental Health Assistant 11 8 14 9 11 11 14 19 8 6 Recreation Leadership 1 1 1 2 1 0 0 0 0 0 Security Administration(Cert) 0 1 0 0 0 0 0 0 0 0 Youth Worker (Cert) 0 0 0 0 0 0 0 0 0 0Liberal Arts & Sciences American Sign Language - - 4 1 3 0 1 1 0 0 Computer Science 14 10 10 7 6 8 10 8 5 8 Exercise Wellness & Fitness 10 32 25 22 14 17 24 45 36 26 Exploratory Studies/Undeclared Major 18 19 17 14 8 6 7 1 0 0 General Studies Program - - - - 12 19 37 69 78 72 Humanities & Social Sciences 355 372 372 391 362 382 437 445 398 364 Mathematics 4 6 5 9 1 1 7 6 3 3 Science 33 11 43 55 34 30 30 50 65 65 Science-Elementary Education Pre-K-6 41 52 5 1 1 72 78 83 76 28 Adolescent Education 7-12 111 139 190 186 129 70 78 80 73 42 Early Childhood birth - 2 - - - 0 22 24 33 37 31 35 Teaching Assistant (Cert) - 0 4 3 7 4 12 4 3 2Medical and Allied Health Technologies Dental Assistant 1 4 0 0 0 7 0 0 0 0 Emergency Medical Tech-Paramedic 23 27 19 28 23 19 25 49 53 58 Fire & Occupational Safety - - 3 1 7 9 5 4 3 4 Fire Protection Technology - - 15 5 5 6 2 3 5 3 Food Serv Admin-Diet Tech/Nutr Care 0 0 0 0 0 0 0 0 0 0 Human Services - - - - - new program 16 41 53 Medical Laboratory Technology 6 4 4 6 5 2 3 9 10 16 Nursing 123 150 132 119 111 107 184 205 177 157 Paramedic(Cert) 3 6 9 12 8 2 2 0 0 0 Phlebotomist (Cert) 2 3 3 3 3 3 9 18 9 6 Other 23 5 4 7 2 73 0 0 0 0Non-Matriculated 389 356 274 289 305 241 250 253 195 165
Total 1,831 1,879 1,803 1,834 1,735 1,743 1,911 2,172 1,979 1,786Source: 3rd week census data, DCC South y:\factbook\spr2012\ds enrollment by curric.xls
Institutional Research/Fact Book E.7
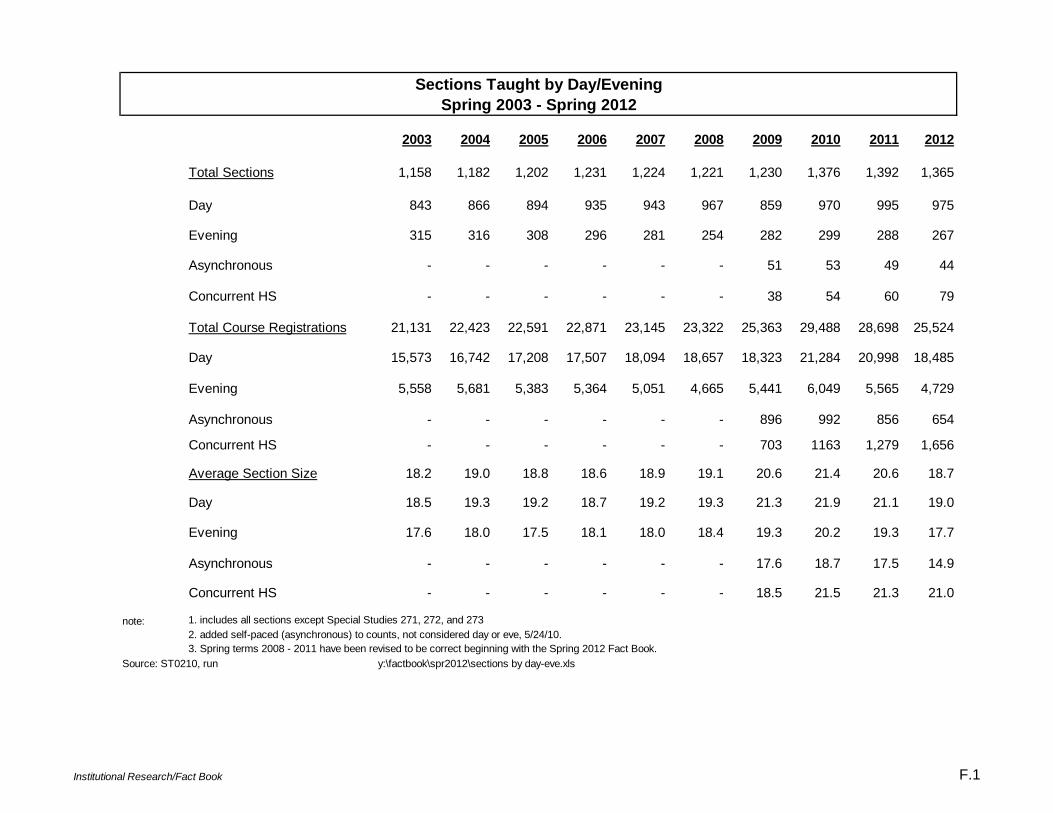
Sections Taught by Day/EveningSpring 2003 - Spring 2012
2003 2004 2005 2006 2007 2008 2009 2010 2011 2012
Total Sections 1,158 1,182 1,202 1,231 1,224 1,221 1,230 1,376 1,392 1,365
Day 843 866 894 935 943 967 859 970 995 975
Evening 315 316 308 296 281 254 282 299 288 267
Asynchronous - - - - - - 51 53 49 44
Concurrent HS - - - - - - 38 54 60 79
Total Course Registrations 21,131 22,423 22,591 22,871 23,145 23,322 25,363 29,488 28,698 25,524
Day 15,573 16,742 17,208 17,507 18,094 18,657 18,323 21,284 20,998 18,485
Evening 5,558 5,681 5,383 5,364 5,051 4,665 5,441 6,049 5,565 4,729
Asynchronous - - - - - - 896 992 856 654
Concurrent HS - - - - - - 703 1163 1,279 1,656
Average Section Size 18.2 19.0 18.8 18.6 18.9 19.1 20.6 21.4 20.6 18.7
Day 18.5 19.3 19.2 18.7 19.2 19.3 21.3 21.9 21.1 19.0
Evening 17.6 18.0 17.5 18.1 18.0 18.4 19.3 20.2 19.3 17.7
Asynchronous - - - - - - 17.6 18.7 17.5 14.9
Concurrent HS - - - - - - 18.5 21.5 21.3 21.0
note: 1. includes all sections except Special Studies 271, 272, and 2732. added self-paced (asynchronous) to counts, not considered day or eve, 5/24/10.3. Spring terms 2008 - 2011 have been revised to be correct beginning with the Spring 2012 Fact Book.
Source: ST0210, run y:\factbook\spr2012\sections by day-eve.xls
Institutional Research/Fact Book F.1
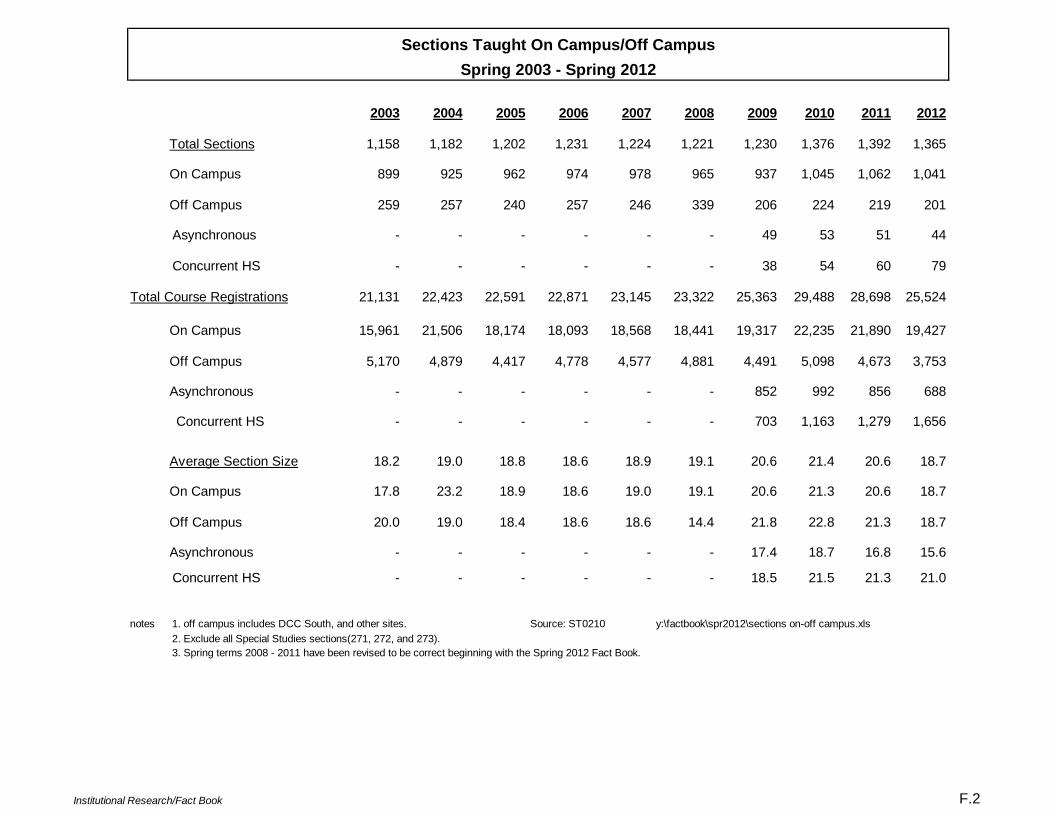
Sections Taught On Campus/Off CampusSpring 2003 - Spring 2012
2003 2004 2005 2006 2007 2008 2009 2010 2011 2012
Total Sections 1,158 1,182 1,202 1,231 1,224 1,221 1,230 1,376 1,392 1,365
On Campus 899 925 962 974 978 965 937 1,045 1,062 1,041
Off Campus 259 257 240 257 246 339 206 224 219 201
Asynchronous - - - - - - 49 53 51 44
Concurrent HS - - - - - - 38 54 60 79
Total Course Registrations 21,131 22,423 22,591 22,871 23,145 23,322 25,363 29,488 28,698 25,524
On Campus 15,961 21,506 18,174 18,093 18,568 18,441 19,317 22,235 21,890 19,427
Off Campus 5,170 4,879 4,417 4,778 4,577 4,881 4,491 5,098 4,673 3,753
Asynchronous - - - - - - 852 992 856 688
Concurrent HS - - - - - - 703 1,163 1,279 1,656
Average Section Size 18.2 19.0 18.8 18.6 18.9 19.1 20.6 21.4 20.6 18.7
On Campus 17.8 23.2 18.9 18.6 19.0 19.1 20.6 21.3 20.6 18.7
Off Campus 20.0 19.0 18.4 18.6 18.6 14.4 21.8 22.8 21.3 18.7
Asynchronous - - - - - - 17.4 18.7 16.8 15.6
Concurrent HS - - - - - - 18.5 21.5 21.3 21.0
notes 1. off campus includes DCC South, and other sites. Source: ST0210 y:\factbook\spr2012\sections on-off campus.xls 2. Exclude all Special Studies sections(271, 272, and 273). 3. Spring terms 2008 - 2011 have been revised to be correct beginning with the Spring 2012 Fact Book.
Institutional Research/Fact Book F.2
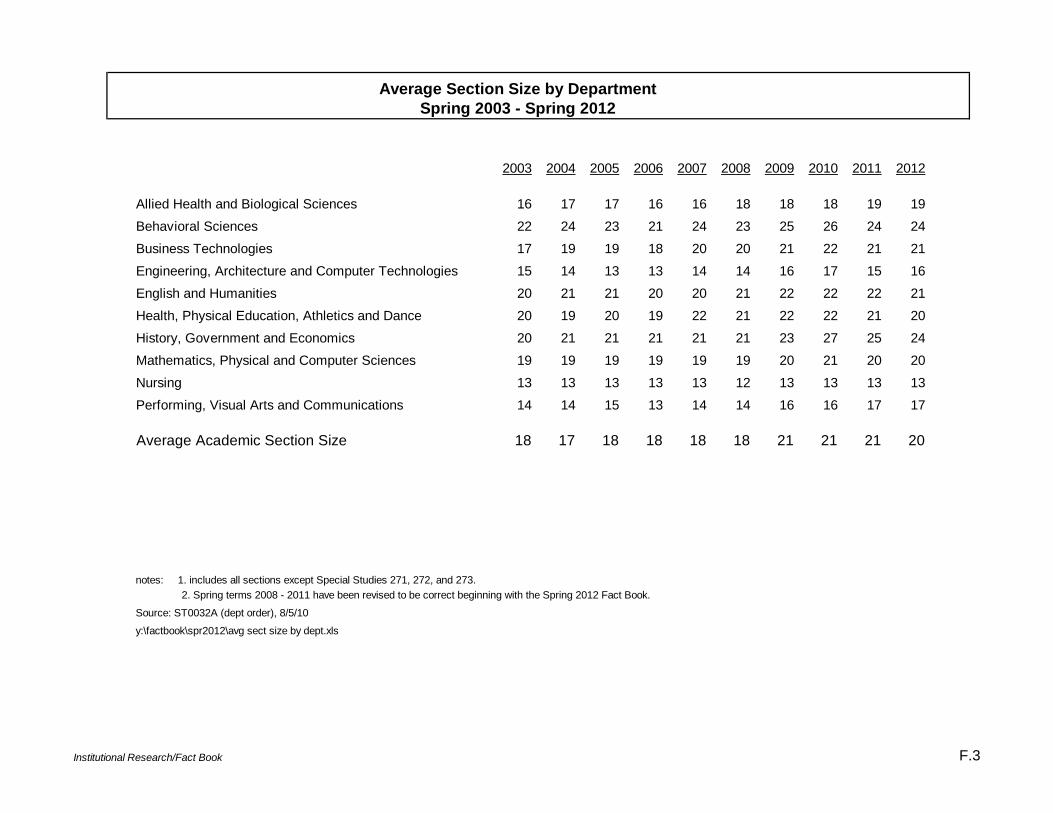
Average Section Size by DepartmentSpring 2003 - Spring 2012
2003 2004 2005 2006 2007 2008 2009 2010 2011 2012
Allied Health and Biological Sciences 16 17 17 16 16 18 18 18 19 19
Behavioral Sciences 22 24 23 21 24 23 25 26 24 24
Business Technologies 17 19 19 18 20 20 21 22 21 21
Engineering, Architecture and Computer Technologies 15 14 13 13 14 14 16 17 15 16
English and Humanities 20 21 21 20 20 21 22 22 22 21
Health, Physical Education, Athletics and Dance 20 19 20 19 22 21 22 22 21 20
History, Government and Economics 20 21 21 21 21 21 23 27 25 24
Mathematics, Physical and Computer Sciences 19 19 19 19 19 19 20 21 20 20
Nursing 13 13 13 13 13 12 13 13 13 13
Performing, Visual Arts and Communications 14 14 15 13 14 14 16 16 17 17
Average Academic Section Size 18 17 18 18 18 18 21 21 21 20
notes: 1. includes all sections except Special Studies 271, 272, and 273. 2. Spring terms 2008 - 2011 have been revised to be correct beginning with the Spring 2012 Fact Book.
Source: ST0032A (dept order), 8/5/10
y:\factbook\spr2012\avg sect size by dept.xls
Institutional Research/Fact Book F.3
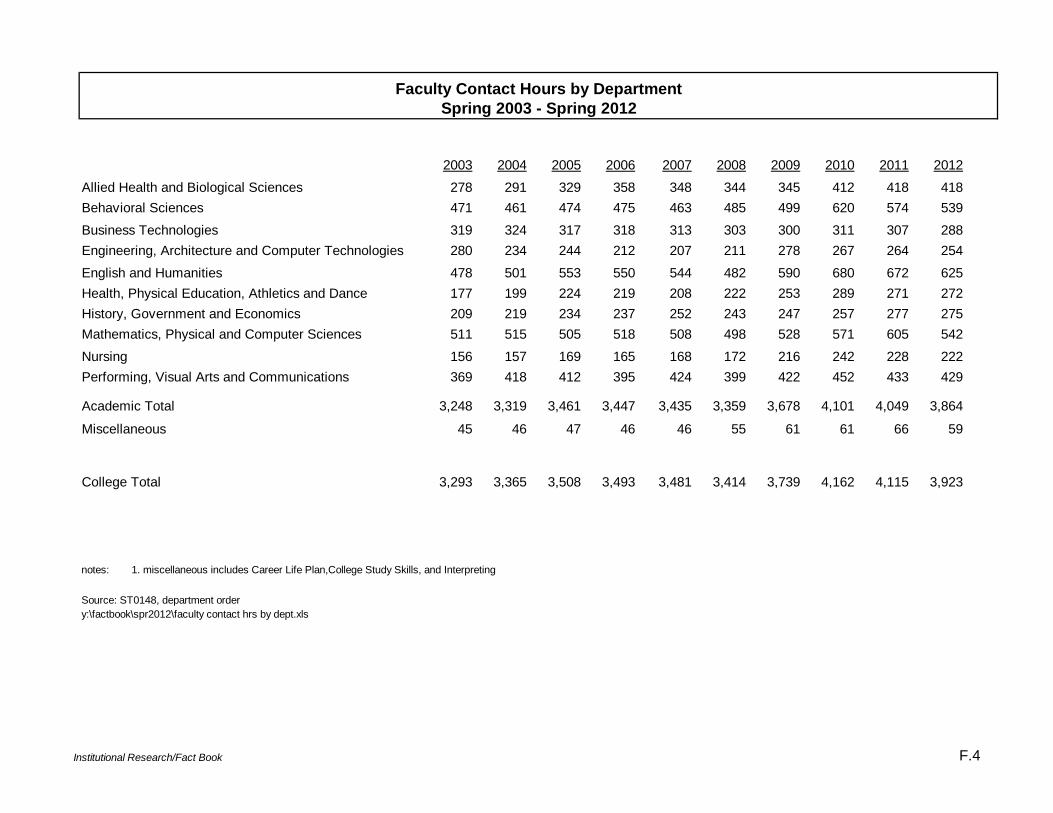
Faculty Contact Hours by DepartmentSpring 2003 - Spring 2012
2003 2004 2005 2006 2007 2008 2009 2010 2011 2012
Allied Health and Biological Sciences 278 291 329 358 348 344 345 412 418 418Behavioral Sciences 471 461 474 475 463 485 499 620 574 539
Business Technologies 319 324 317 318 313 303 300 311 307 288Engineering, Architecture and Computer Technologies 280 234 244 212 207 211 278 267 264 254
English and Humanities 478 501 553 550 544 482 590 680 672 625Health, Physical Education, Athletics and Dance 177 199 224 219 208 222 253 289 271 272History, Government and Economics 209 219 234 237 252 243 247 257 277 275Mathematics, Physical and Computer Sciences 511 515 505 518 508 498 528 571 605 542
Nursing 156 157 169 165 168 172 216 242 228 222Performing, Visual Arts and Communications 369 418 412 395 424 399 422 452 433 429
Academic Total 3,248 3,319 3,461 3,447 3,435 3,359 3,678 4,101 4,049 3,864
Miscellaneous 45 46 47 46 46 55 61 61 66 59
College Total 3,293 3,365 3,508 3,493 3,481 3,414 3,739 4,162 4,115 3,923
notes: 1. miscellaneous includes Career Life Plan,College Study Skills, and Interpreting
Source: ST0148, department ordery:\factbook\spr2012\faculty contact hrs by dept.xls
Institutional Research/Fact Book F.4
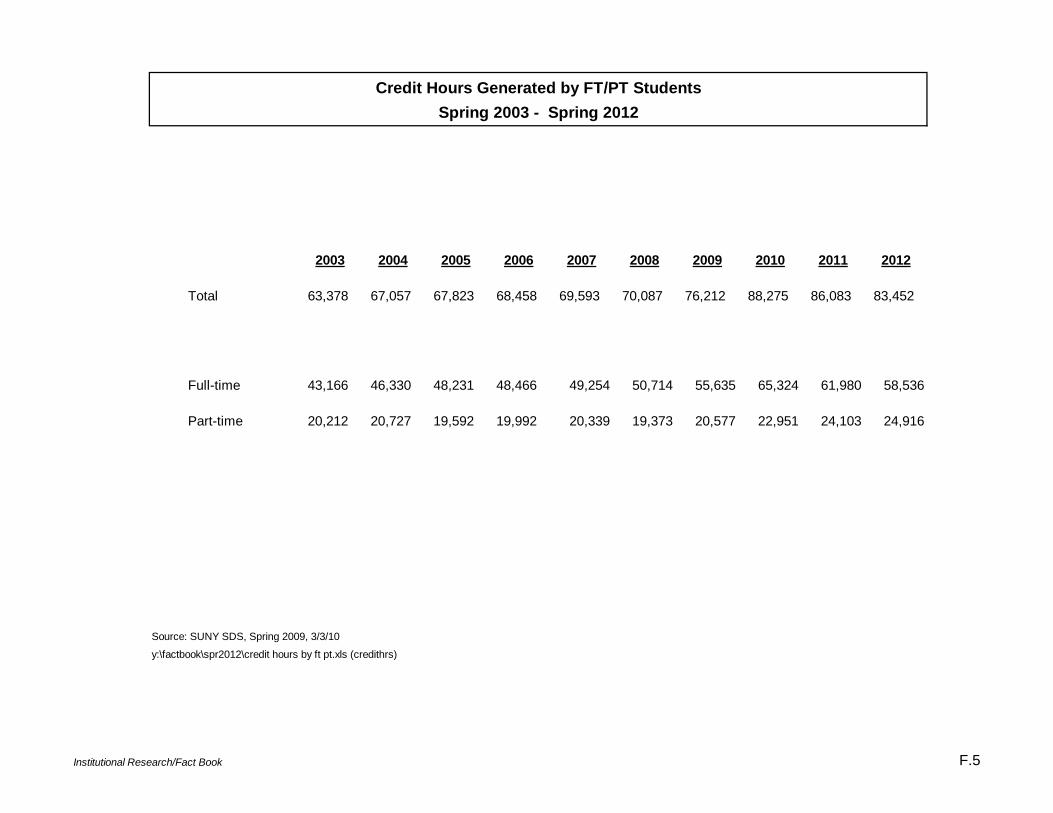
Credit Hours Generated by FT/PT StudentsSpring 2003 - Spring 2012
2003 2004 2005 2006 2007 2008 2009 2010 2011 2012
Total 63,378 67,057 67,823 68,458 69,593 70,087 76,212 88,275 86,083 83,452
Full-time 43,166 46,330 48,231 48,466 49,254 50,714 55,635 65,324 61,980 58,536
Part-time 20,212 20,727 19,592 19,992 20,339 19,373 20,577 22,951 24,103 24,916
Source: SUNY SDS, Spring 2009, 3/3/10
y:\factbook\spr2012\credit hours by ft pt.xls (credithrs)
Institutional Research/Fact Book F.5
Institutional Research/Fact Book F.6
0
10
20
30
40
50
60
70
80
90
2003 2004 2005 2006 2007 2008 2009 2010 2011 2012
Cre
dit H
ours
(Tho
usan
ds)
Part-time Full-time
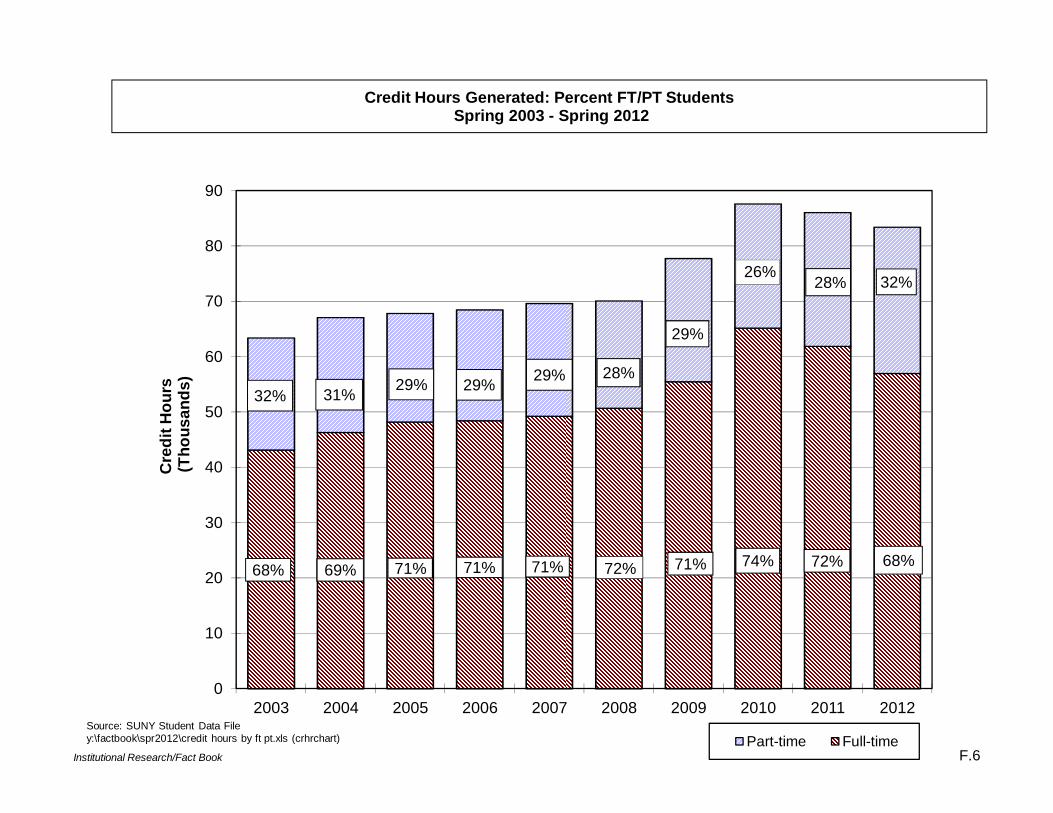
Credit Hours Generated: Percent FT/PT StudentsSpring 2003 - Spring 2012
Source: SUNY Student Data Filey:\factbook\spr2012\credit hours by ft pt.xls (crhrchart)
68% 69% 71% 71% 71%
32% 31% 29% 29% 29%
26%
72%
28%
72%
29%
71%
28%
74%
32%
68%
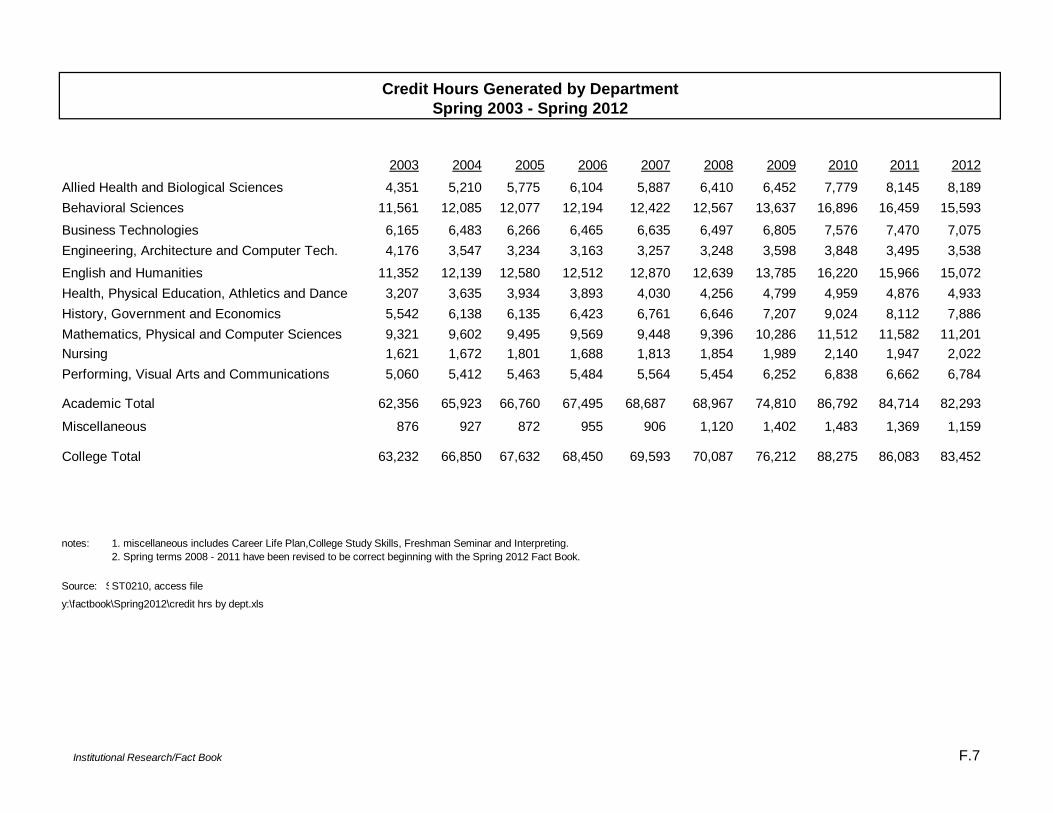
Credit Hours Generated by DepartmentSpring 2003 - Spring 2012
2003 2004 2005 2006 2007 2008 2009 2010 2011 2012
Allied Health and Biological Sciences 4,351 5,210 5,775 6,104 5,887 6,410 6,452 7,779 8,145 8,189Behavioral Sciences 11,561 12,085 12,077 12,194 12,422 12,567 13,637 16,896 16,459 15,593
Business Technologies 6,165 6,483 6,266 6,465 6,635 6,497 6,805 7,576 7,470 7,075Engineering, Architecture and Computer Tech. 4,176 3,547 3,234 3,163 3,257 3,248 3,598 3,848 3,495 3,538
English and Humanities 11,352 12,139 12,580 12,512 12,870 12,639 13,785 16,220 15,966 15,072Health, Physical Education, Athletics and Dance 3,207 3,635 3,934 3,893 4,030 4,256 4,799 4,959 4,876 4,933History, Government and Economics 5,542 6,138 6,135 6,423 6,761 6,646 7,207 9,024 8,112 7,886Mathematics, Physical and Computer Sciences 9,321 9,602 9,495 9,569 9,448 9,396 10,286 11,512 11,582 11,201Nursing 1,621 1,672 1,801 1,688 1,813 1,854 1,989 2,140 1,947 2,022Performing, Visual Arts and Communications 5,060 5,412 5,463 5,484 5,564 5,454 6,252 6,838 6,662 6,784
Academic Total 62,356 65,923 66,760 67,495 68,687 68,967 74,810 86,792 84,714 82,293
Miscellaneous 876 927 872 955 906 1,120 1,402 1,483 1,369 1,159
College Total 63,232 66,850 67,632 68,450 69,593 70,087 76,212 88,275 86,083 83,452
notes: 1. miscellaneous includes Career Life Plan,College Study Skills, Freshman Seminar and Interpreting.2. Spring terms 2008 - 2011 have been revised to be correct beginning with the Spring 2012 Fact Book.
Source: SST0210, access file
y:\factbook\Spring2012\credit hrs by dept.xls
Institutional Research/Fact Book F.7
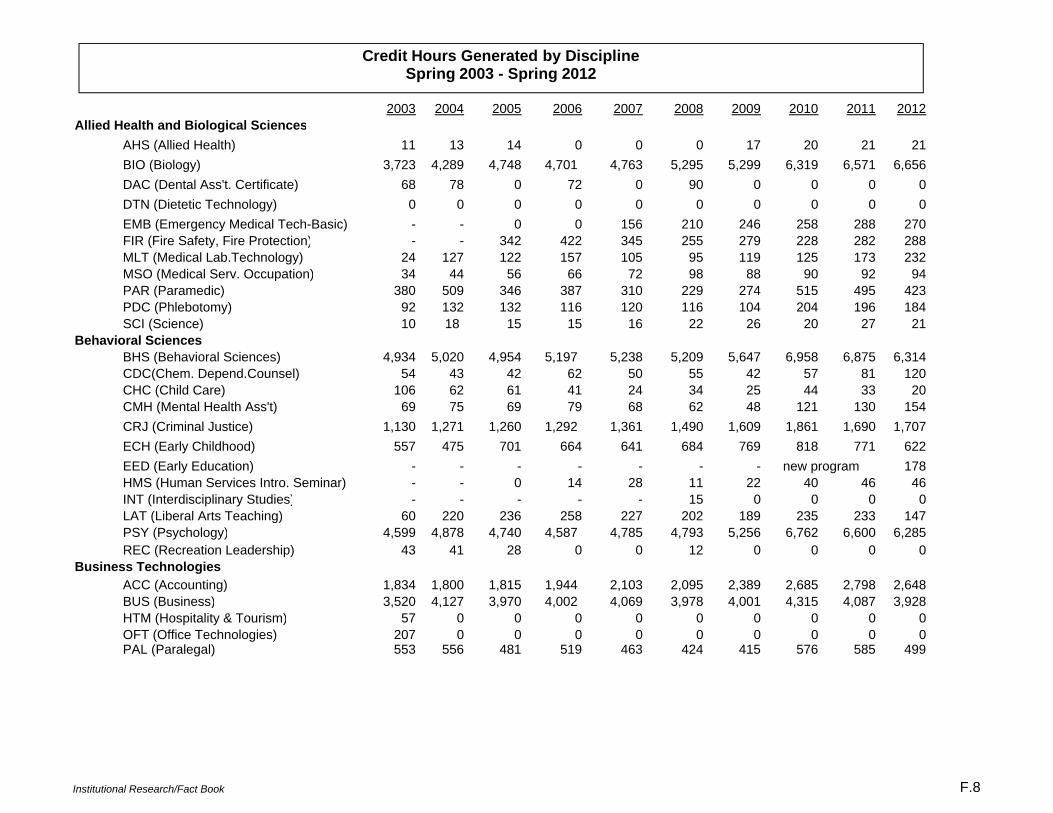
2003 2004 2005 2006 2007 2008 2009 2010 2011 2012Allied Health and Biological Sciences
AHS (Allied Health) 11 13 14 0 0 0 17 20 21 21BIO (Biology) 3,723 4,289 4,748 4,701 4,763 5,295 5,299 6,319 6,571 6,656DAC (Dental Ass't. Certificate) 68 78 0 72 0 90 0 0 0 0DTN (Dietetic Technology) 0 0 0 0 0 0 0 0 0 0EMB (Emergency Medical Tech-Basic) - - 0 0 156 210 246 258 288 270FIR (Fire Safety, Fire Protection) - - 342 422 345 255 279 228 282 288MLT (Medical Lab.Technology) 24 127 122 157 105 95 119 125 173 232MSO (Medical Serv. Occupation) 34 44 56 66 72 98 88 90 92 94PAR (Paramedic) 380 509 346 387 310 229 274 515 495 423PDC (Phlebotomy) 92 132 132 116 120 116 104 204 196 184SCI (Science) 10 18 15 15 16 22 26 20 27 21
Behavioral SciencesBHS (Behavioral Sciences) 4,934 5,020 4,954 5,197 5,238 5,209 5,647 6,958 6,875 6,314CDC(Chem. Depend.Counsel) 54 43 42 62 50 55 42 57 81 120CHC (Child Care) 106 62 61 41 24 34 25 44 33 20CMH (Mental Health Ass't) 69 75 69 79 68 62 48 121 130 154CRJ (Criminal Justice) 1,130 1,271 1,260 1,292 1,361 1,490 1,609 1,861 1,690 1,707ECH (Early Childhood) 557 475 701 664 641 684 769 818 771 622EED (Early Education) - - - - - - - 178HMS (Human Services Intro. Seminar) - - 0 14 28 11 22 40 46 46INT (Interdisciplinary Studies) - - - - - 15 0 0 0 0LAT (Liberal Arts Teaching) 60 220 236 258 227 202 189 235 233 147PSY (Psychology) 4,599 4,878 4,740 4,587 4,785 4,793 5,256 6,762 6,600 6,285REC (Recreation Leadership) 43 41 28 0 0 12 0 0 0 0
Business TechnologiesACC (Accounting) 1,834 1,800 1,815 1,944 2,103 2,095 2,389 2,685 2,798 2,648BUS (Business) 3,520 4,127 3,970 4,002 4,069 3,978 4,001 4,315 4,087 3,928HTM (Hospitality & Tourism) 57 0 0 0 0 0 0 0 0 0OFT (Office Technologies) 207 0 0 0 0 0 0 0 0 0PAL (Paralegal) 553 556 481 519 463 424 415 576 585 499
new program
Credit Hours Generated by DisciplineSpring 2003 - Spring 2012
Institutional Research/Fact Book F.8
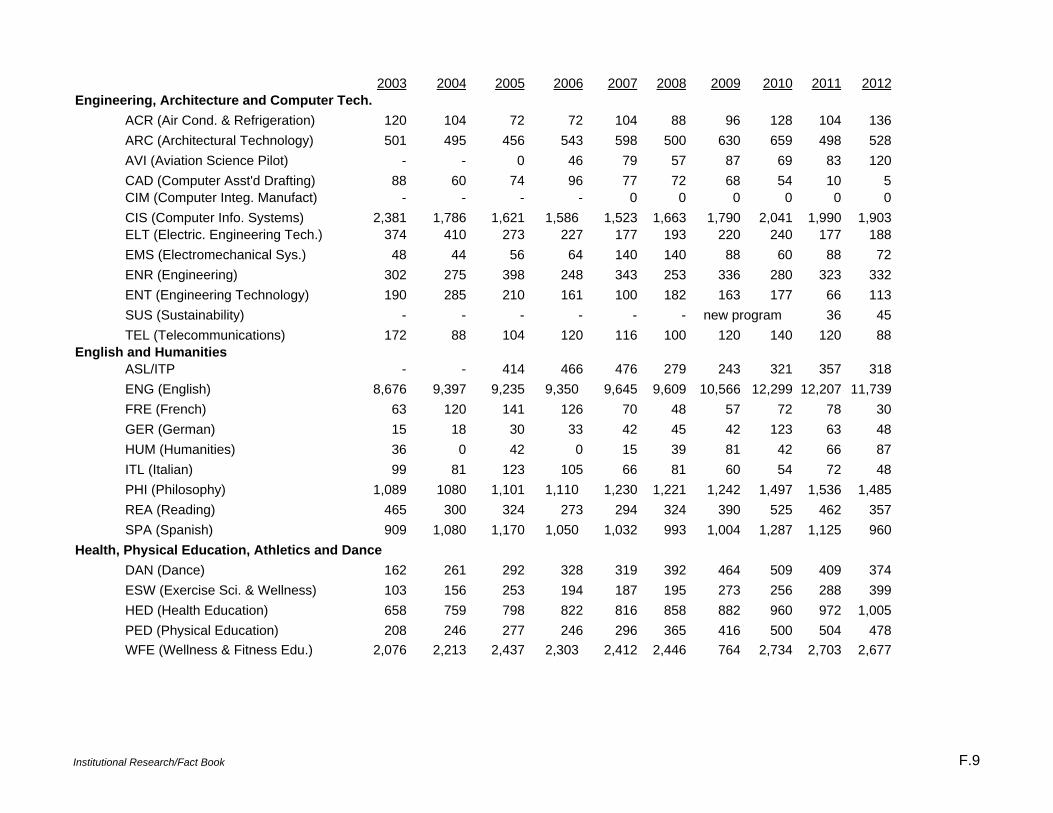
2003 2004 2005 2006 2007 2008 2009 2010 2011 2012Engineering, Architecture and Computer Tech.
ACR (Air Cond. & Refrigeration) 120 104 72 72 104 88 96 128 104 136ARC (Architectural Technology) 501 495 456 543 598 500 630 659 498 528AVI (Aviation Science Pilot) - - 0 46 79 57 87 69 83 120CAD (Computer Asst'd Drafting) 88 60 74 96 77 72 68 54 10 5CIM (Computer Integ. Manufact) - - - - 0 0 0 0 0 0CIS (Computer Info. Systems) 2,381 1,786 1,621 1,586 1,523 1,663 1,790 2,041 1,990 1,903ELT (Electric. Engineering Tech.) 374 410 273 227 177 193 220 240 177 188EMS (Electromechanical Sys.) 48 44 56 64 140 140 88 60 88 72ENR (Engineering) 302 275 398 248 343 253 336 280 323 332ENT (Engineering Technology) 190 285 210 161 100 182 163 177 66 113SUS (Sustainability) - - - - - - 36 45TEL (Telecommunications) 172 88 104 120 116 100 120 140 120 88
English and HumanitiesASL/ITP - - 414 466 476 279 243 321 357 318ENG (English) 8,676 9,397 9,235 9,350 9,645 9,609 10,566 12,299 12,207 11,739FRE (French) 63 120 141 126 70 48 57 72 78 30GER (German) 15 18 30 33 42 45 42 123 63 48HUM (Humanities) 36 0 42 0 15 39 81 42 66 87ITL (Italian) 99 81 123 105 66 81 60 54 72 48PHI (Philosophy) 1,089 1080 1,101 1,110 1,230 1,221 1,242 1,497 1,536 1,485REA (Reading) 465 300 324 273 294 324 390 525 462 357SPA (Spanish) 909 1,080 1,170 1,050 1,032 993 1,004 1,287 1,125 960
Health, Physical Education, Athletics and DanceDAN (Dance) 162 261 292 328 319 392 464 509 409 374ESW (Exercise Sci. & Wellness) 103 156 253 194 187 195 273 256 288 399HED (Health Education) 658 759 798 822 816 858 882 960 972 1,005PED (Physical Education) 208 246 277 246 296 365 416 500 504 478WFE (Wellness & Fitness Edu.) 2,076 2,213 2,437 2,303 2,412 2,446 764 2,734 2,703 2,677
new program
Institutional Research/Fact Book F.9
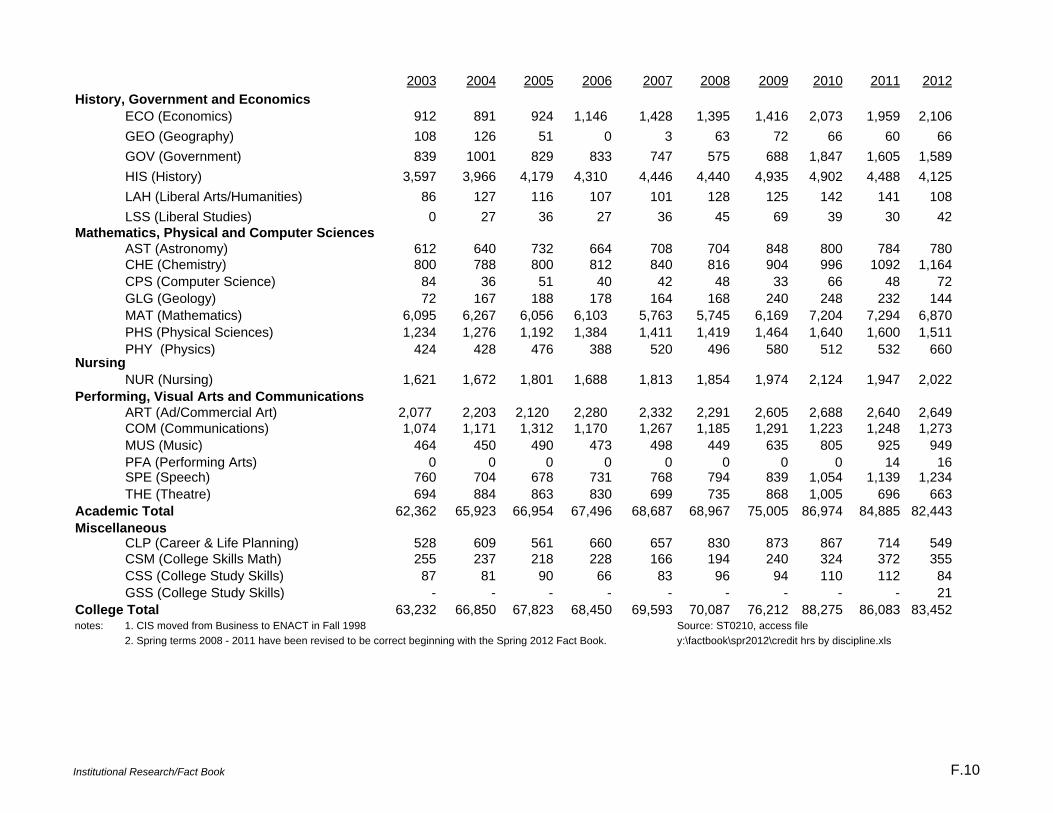
2003 2004 2005 2006 2007 2008 2009 2010 2011 2012History, Government and Economics
ECO (Economics) 912 891 924 1,146 1,428 1,395 1,416 2,073 1,959 2,106GEO (Geography) 108 126 51 0 3 63 72 66 60 66GOV (Government) 839 1001 829 833 747 575 688 1,847 1,605 1,589HIS (History) 3,597 3,966 4,179 4,310 4,446 4,440 4,935 4,902 4,488 4,125LAH (Liberal Arts/Humanities) 86 127 116 107 101 128 125 142 141 108LSS (Liberal Studies) 0 27 36 27 36 45 69 39 30 42
Mathematics, Physical and Computer SciencesAST (Astronomy) 612 640 732 664 708 704 848 800 784 780CHE (Chemistry) 800 788 800 812 840 816 904 996 1092 1,164CPS (Computer Science) 84 36 51 40 42 48 33 66 48 72GLG (Geology) 72 167 188 178 164 168 240 248 232 144MAT (Mathematics) 6,095 6,267 6,056 6,103 5,763 5,745 6,169 7,204 7,294 6,870PHS (Physical Sciences) 1,234 1,276 1,192 1,384 1,411 1,419 1,464 1,640 1,600 1,511PHY (Physics) 424 428 476 388 520 496 580 512 532 660
NursingNUR (Nursing) 1,621 1,672 1,801 1,688 1,813 1,854 1,974 2,124 1,947 2,022
Performing, Visual Arts and CommunicationsART (Ad/Commercial Art) 2,077 2,203 2,120 2,280 2,332 2,291 2,605 2,688 2,640 2,649COM (Communications) 1,074 1,171 1,312 1,170 1,267 1,185 1,291 1,223 1,248 1,273MUS (Music) 464 450 490 473 498 449 635 805 925 949PFA (Performing Arts) 0 0 0 0 0 0 0 0 14 16SPE (Speech) 760 704 678 731 768 794 839 1,054 1,139 1,234THE (Theatre) 694 884 863 830 699 735 868 1,005 696 663
Academic Total 62,362 65,923 66,954 67,496 68,687 68,967 75,005 86,974 84,885 82,443Miscellaneous
CLP (Career & Life Planning) 528 609 561 660 657 830 873 867 714 549CSM (College Skills Math) 255 237 218 228 166 194 240 324 372 355CSS (College Study Skills) 87 81 90 66 83 96 94 110 112 84GSS (College Study Skills) - - - - - - - - - 21
College Total 63,232 66,850 67,823 68,450 69,593 70,087 76,212 88,275 86,083 83,452notes: 1. CIS moved from Business to ENACT in Fall 1998 Source: ST0210, access file
2. Spring terms 2008 - 2011 have been revised to be correct beginning with the Spring 2012 Fact Book. y:\factbook\spr2012\credit hrs by discipline.xls
Institutional Research/Fact Book F.10
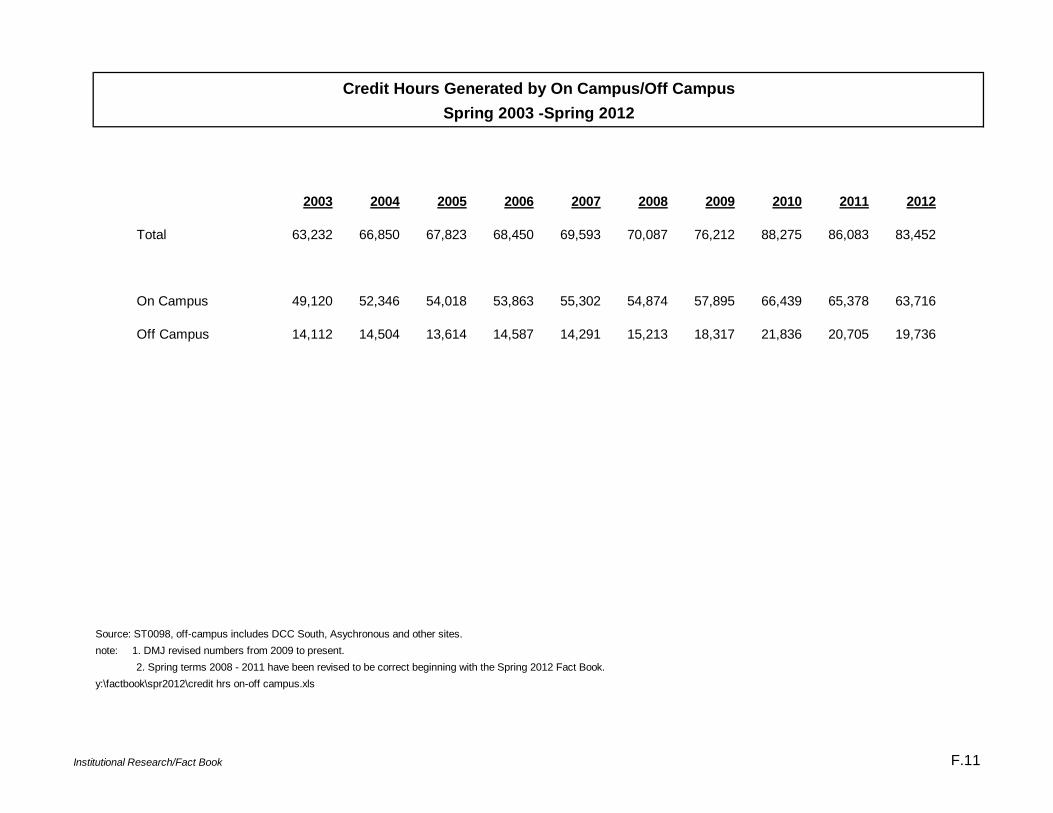
Credit Hours Generated by On Campus/Off CampusSpring 2003 -Spring 2012
2003 2004 2005 2006 2007 2008 2009 2010 2011 2012
Total 63,232 66,850 67,823 68,450 69,593 70,087 76,212 88,275 86,083 83,452
On Campus 49,120 52,346 54,018 53,863 55,302 54,874 57,895 66,439 65,378 63,716
Off Campus 14,112 14,504 13,614 14,587 14,291 15,213 18,317 21,836 20,705 19,736
Source: ST0098, off-campus includes DCC South, Asychronous and other sites.note: 1. DMJ revised numbers from 2009 to present.
2. Spring terms 2008 - 2011 have been revised to be correct beginning with the Spring 2012 Fact Book.y:\factbook\spr2012\credit hrs on-off campus.xls
Institutional Research/Fact Book F.11
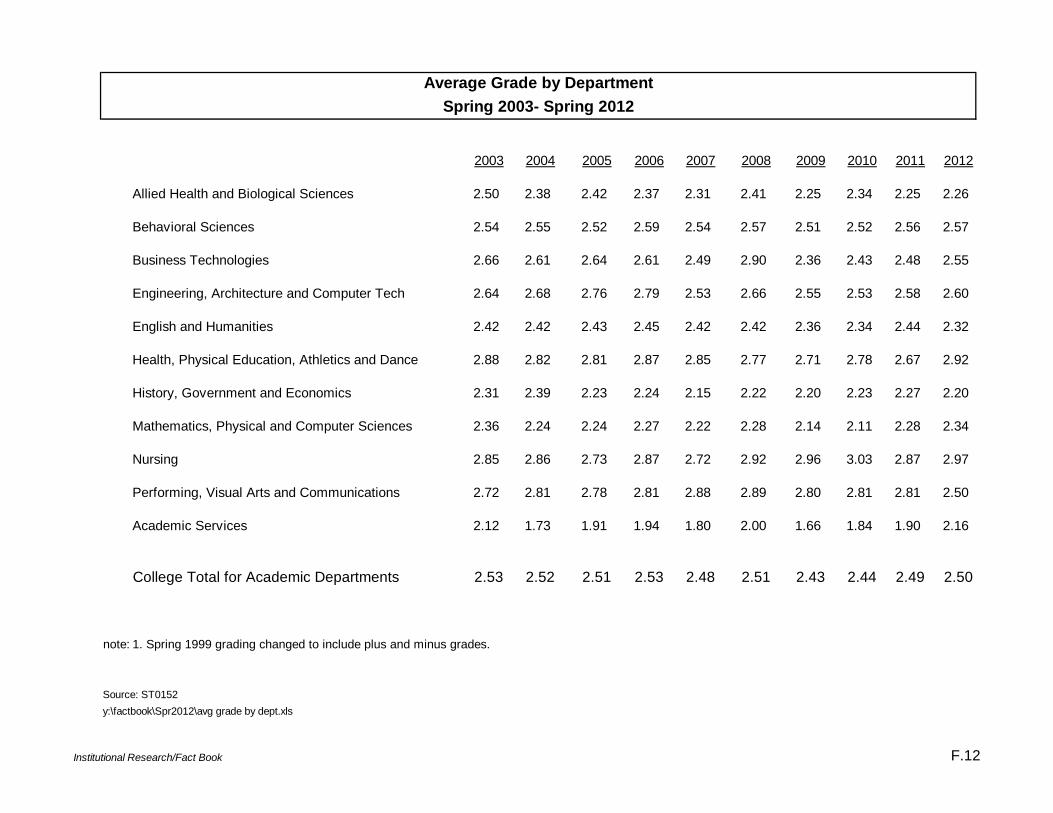
Average Grade by DepartmentSpring 2003- Spring 2012
2003 2004 2005 2006 2007 2008 2009 2010 2011 2012
Allied Health and Biological Sciences 2.50 2.38 2.42 2.37 2.31 2.41 2.25 2.34 2.25 2.26
Behavioral Sciences 2.54 2.55 2.52 2.59 2.54 2.57 2.51 2.52 2.56 2.57
Business Technologies 2.66 2.61 2.64 2.61 2.49 2.90 2.36 2.43 2.48 2.55
Engineering, Architecture and Computer Tech 2.64 2.68 2.76 2.79 2.53 2.66 2.55 2.53 2.58 2.60
English and Humanities 2.42 2.42 2.43 2.45 2.42 2.42 2.36 2.34 2.44 2.32
Health, Physical Education, Athletics and Dance 2.88 2.82 2.81 2.87 2.85 2.77 2.71 2.78 2.67 2.92
History, Government and Economics 2.31 2.39 2.23 2.24 2.15 2.22 2.20 2.23 2.27 2.20
Mathematics, Physical and Computer Sciences 2.36 2.24 2.24 2.27 2.22 2.28 2.14 2.11 2.28 2.34
Nursing 2.85 2.86 2.73 2.87 2.72 2.92 2.96 3.03 2.87 2.97
Performing, Visual Arts and Communications 2.72 2.81 2.78 2.81 2.88 2.89 2.80 2.81 2.81 2.50
Academic Services 2.12 1.73 1.91 1.94 1.80 2.00 1.66 1.84 1.90 2.16
College Total for Academic Departments 2.53 2.52 2.51 2.53 2.48 2.51 2.43 2.44 2.49 2.50
note: 1. Spring 1999 grading changed to include plus and minus grades.
Source: ST0152y:\factbook\Spr2012\avg grade by dept.xls
Institutional Research/Fact Book F.12
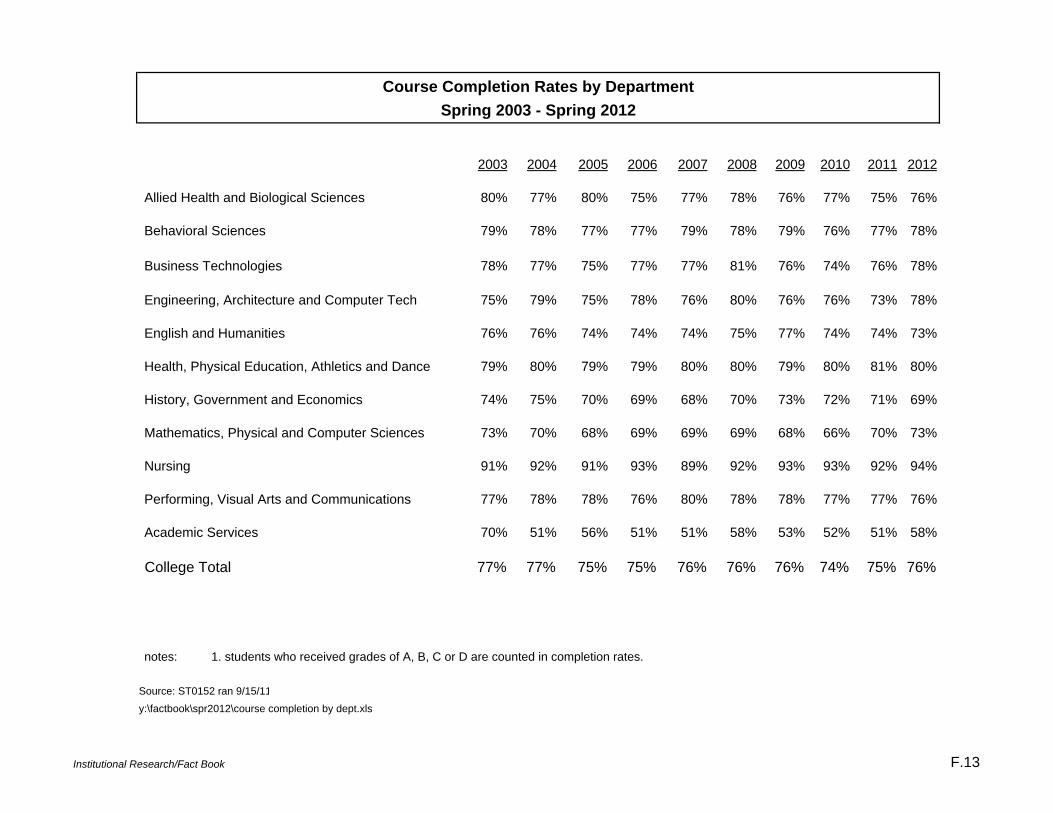
Course Completion Rates by DepartmentSpring 2003 - Spring 2012
2003 2004 2005 2006 2007 2008 2009 2010 2011 2012
Allied Health and Biological Sciences 80% 77% 80% 75% 77% 78% 76% 77% 75% 76%
Behavioral Sciences 79% 78% 77% 77% 79% 78% 79% 76% 77% 78%
Business Technologies 78% 77% 75% 77% 77% 81% 76% 74% 76% 78%
Engineering, Architecture and Computer Tech 75% 79% 75% 78% 76% 80% 76% 76% 73% 78%
English and Humanities 76% 76% 74% 74% 74% 75% 77% 74% 74% 73%
Health, Physical Education, Athletics and Dance 79% 80% 79% 79% 80% 80% 79% 80% 81% 80%
History, Government and Economics 74% 75% 70% 69% 68% 70% 73% 72% 71% 69%
Mathematics, Physical and Computer Sciences 73% 70% 68% 69% 69% 69% 68% 66% 70% 73%
Nursing 91% 92% 91% 93% 89% 92% 93% 93% 92% 94%
Performing, Visual Arts and Communications 77% 78% 78% 76% 80% 78% 78% 77% 77% 76%
Academic Services 70% 51% 56% 51% 51% 58% 53% 52% 51% 58%
College Total 77% 77% 75% 75% 76% 76% 76% 74% 75% 76%
notes: 1. students who received grades of A, B, C or D are counted in completion rates.
Source: ST0152 ran 9/15/11
y:\factbook\spr2012\course completion by dept.xls
Institutional Research/Fact Book F.13
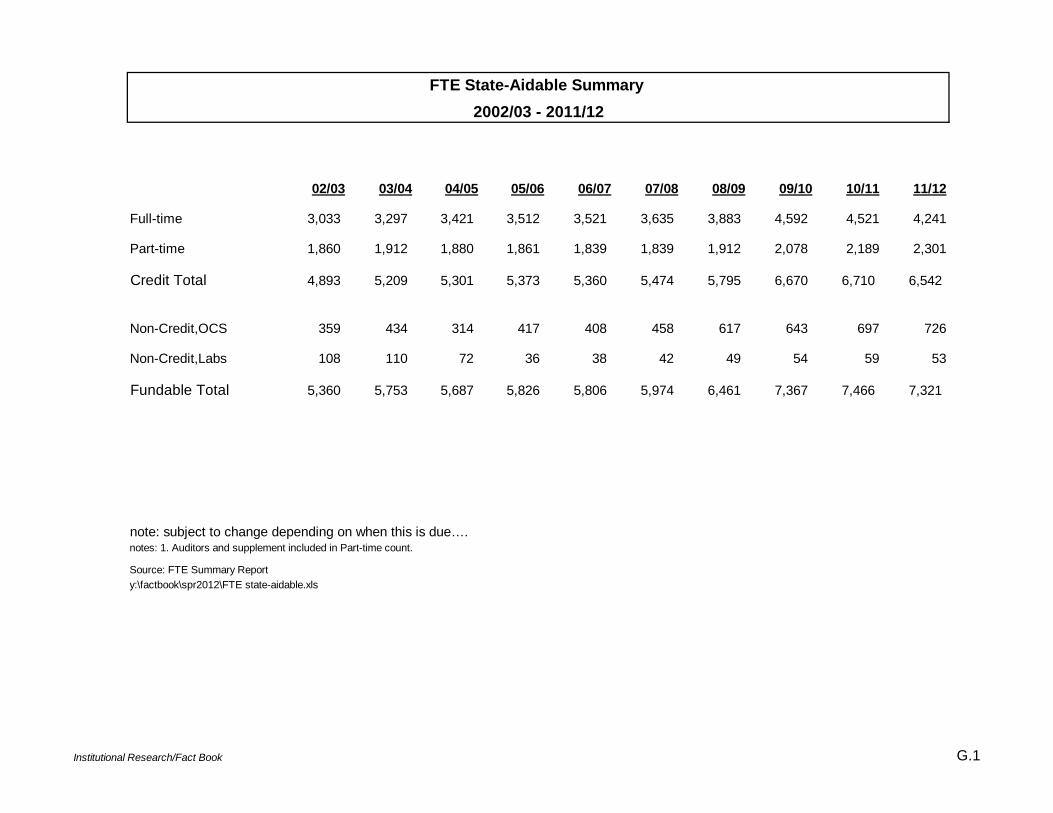
FTE State-Aidable Summary 2002/03 - 2011/12
02/03 03/04 04/05 05/06 06/07 07/08 08/09 09/10 10/11 11/12
Full-time 3 ,033 3,297 3,421 3,512 3,5 21 3 ,635 3,883 4,592 4,521 4,241
Part-time 1 ,860 1,912 1,880 1,861 1,8 39 1 ,839 1,912 2,078 2,189 2,301
Credit Total 4 ,893 5,209 5,301 5,373 5,3 60 5 ,474 5,795 6,670 6,710 6,542
Non-Credit,OCS 359 434 314 417 4 08 458 617 643 697 726
Non-Credit,Labs 108 110 72 36 38 42 49 54 59 53
Fundable Total 5 ,360 5,753 5,687 5,826 5,8 06 5 ,974 6,461 7,367 7,466 7,321
note: subject to change depending on when this is due….notes: 1. Auditors and supplement included in Part-time count.
Source: FTE Summary Reporty:\factbook\spr2012\FTE state-aidable.xls
Institutional Research/Fact Book G.1
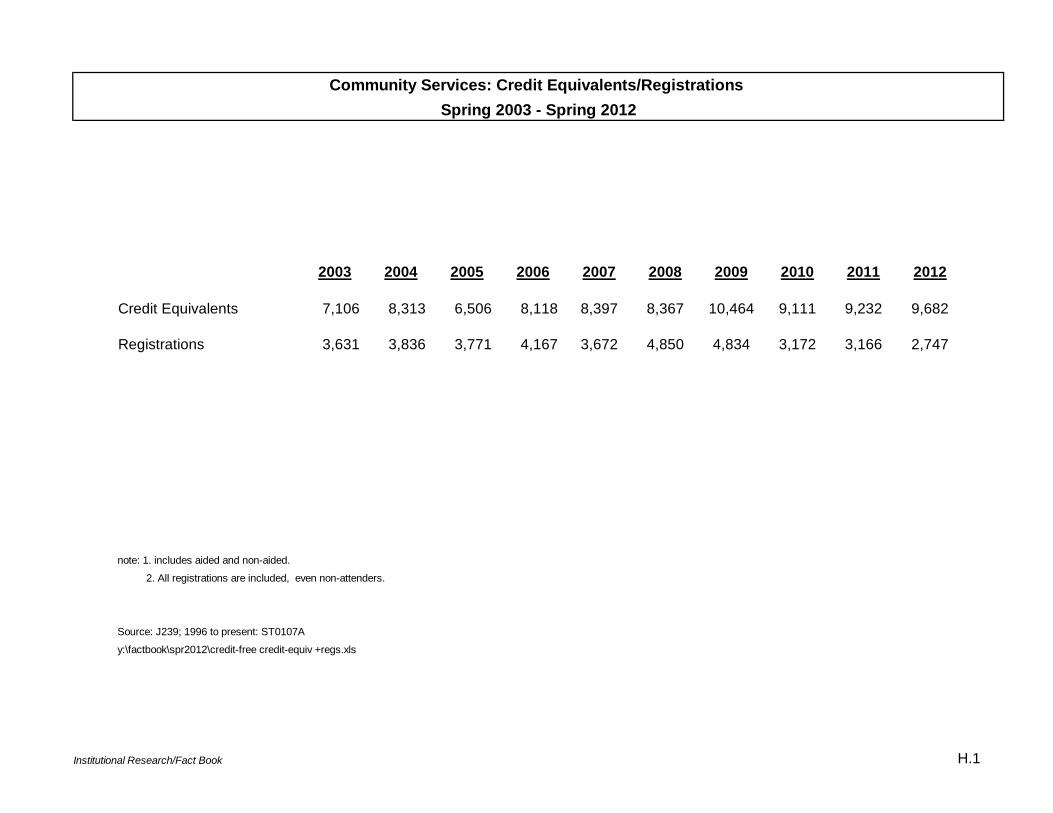
Community Services: Credit Equivalents/Registrations Spring 2003 - Spring 2012
2003 2004 2005 2006 2007 2008 2009 2010 2011 2012
Credit Equivalents 7,106 8,313 6,506 8,118 8,397 8,367 10,464 9,111 9,232 9,682
Registrations 3,631 3,836 3,771 4,167 3,672 4,850 4,834 3,172 3,166 2,747
note: 1. includes aided and non-aided.
2. All registrations are included, even non-attenders.
Source: J239; 1996 to present: ST0107A
y:\factbook\spr2012\credit-free credit-equiv +regs.xls
Institutional Research/Fact Book H.1
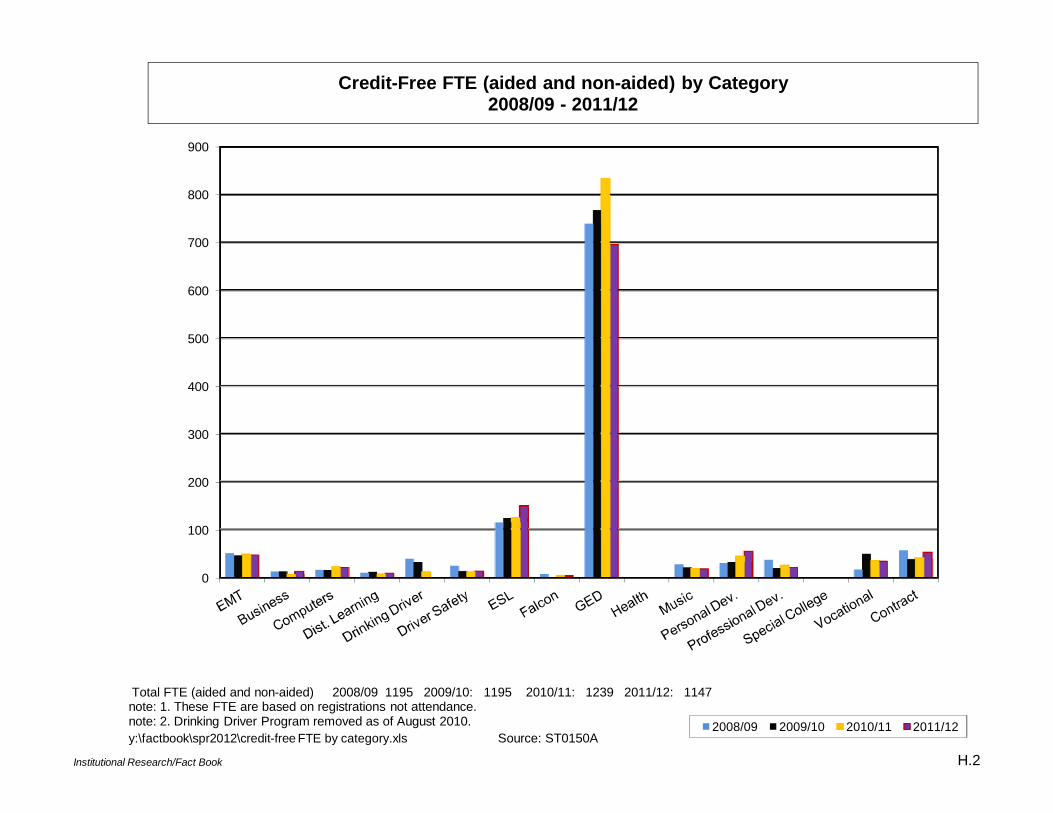
Institutional Research/Fact Book H.2
0
100
200
300
400
500
600
700
800
900
2008/09 2009/10 2010/11 2011/12
Credit-Free FTE (aided and non-aided) by Category2008/09 - 2011/12
Total FTE (aided and non-aided) 2008/09 1195 2009/10: 1195 2010/11: 1239 2011/12: 1147note: 1. These FTE are based on registrations not attendance. note: 2. Drinking Driver Program removed as of August 2010.y:\factbook\spr2012\credit-free FTE by category.xls Source: ST0150A
Reader Comment Form
The Office of Institutional Research, Planning and Assessment want to evaluate the usefulness of its publications, and therefore we ask that you take a few moments to give us your impressions of the Fact Book. Your comments will be used to help modify future publications in order to meet your needs. Please answer the questions below and return the survey via campus mail to the Office of Institutional Research, Planning and Assessment. All responses are confidential. 1. To what extent was the information presented in the Fact Book useful to you?
Not Useful Somewhat Useful Very Useful 1 2 3 4 5
2. Please briefly describe the purposes for which you use/will use the information in the Fact Book. 3. How would you rate the clarity of the following items within the Fact Book?
Not Clear Somewhat Clear Very Clear Graphs 1 2 3 4 5 Data Tables 1 2 3 4 5 Overall Presentation 1 2 3 4 5
4. How can the Fact Book be improved? (Format, graphs, new information, etc.) Please return to Institutional Research, Planning and Assessment. Thank you for your time and effort.