eye health needs assessment bristol, north somerset, somerset … · eye health needs assessment...
TRANSCRIPT
Eye Health Needs Assessment
Bristol, North Somerset, Somerset
and South Gloucestershire (BNSSSG)
Lucy McCann, Public Health Specialty Registrar
March 2015
2
Contents
Executive summary .............................................................................................................................. 4
Costs .................................................................................................................................................. 4
Major eye conditions ........................................................................................................................ 4
Children and young people ............................................................................................................. 5
Service provision .............................................................................................................................. 5
Recommendations ........................................................................................................................... 5
Glossary of eye conditions .................................................................................................................. 7
Age-related macular degeneration ................................................................................................ 7
Blindness ........................................................................................................................................... 7
Cataract ............................................................................................................................................. 7
Diabetic retinopathy ......................................................................................................................... 7
Drusen ................................................................................................................................................ 7
Glaucoma .......................................................................................................................................... 7
Uncorrected refractive error ............................................................................................................ 8
1. Introduction ....................................................................................................................................... 9
1.1 Public health importance of sight loss and eye health ......................................................... 9
1.2 Importance of a health needs assessment ............................................................................ 9
1.3 Purpose ....................................................................................................................................... 9
2. Key National Drivers and Policy .................................................................................................. 11
2.1 UK vision strategy .................................................................................................................... 11
2.2 Public health outcomes framework ....................................................................................... 11
2.3 NHS outcomes framework 2012/13 ...................................................................................... 12
2.4 Quality Innovation Productivity and Prevention (QIPP) Programme ............................... 12
2.5 NHS England ‘Call to Action’: Improving eye health and reducing sight loss ................ 12
2.6 Royal College of General Practitioners (RCGP) Clinical Priority Programme ............... 13
2.7 WHO Vision 2020 .................................................................................................................... 13
2.8 CCG Outcomes Framework/Local CCG priorities .............................................................. 13
3. Population Characteristics of BNSSSG and Health Determinants ........................................ 14
3.1 Age ............................................................................................................................................. 14
3.2 Gender ...................................................................................................................................... 15
3.4 Ethnicity ..................................................................................................................................... 15
3.5 Lifestyle factors ........................................................................................................................ 16
3.6 Deprivation ................................................................................................................................ 16
3
3.7 Co-morbidities .......................................................................................................................... 16
3.7.1 Learning disabilities ......................................................................................................... 17
3.7.2 Dementia ........................................................................................................................... 18
3.7.3 Falls .................................................................................................................................... 18
3.7.4 Depression ........................................................................................................................ 18
3.7.5 Stroke ................................................................................................................................. 18
4. Incidence and Prevalence of Partial Sight and Blindness ....................................................... 20
5. Cost of eye care ............................................................................................................................. 23
6. Eye conditions ................................................................................................................................ 25
6.1 Age related macular degeneration ........................................................................................ 25
6.2 Glaucoma .................................................................................................................................. 27
6.3 Cataract ..................................................................................................................................... 29
6.4 Diabetic eye disease ............................................................................................................... 30
6.5 Low vision ................................................................................................................................. 31
6.6 Uncorrected refractive error ................................................................................................... 32
7. Children and Young People ......................................................................................................... 34
8. Current Activities, Service Provision and Assets ...................................................................... 37
8.1 Sight tests ................................................................................................................................. 37
8.2 Hospital activity ........................................................................................................................ 38
8.3 Primary care ............................................................................................................................. 39
8.4 Additional information and data ............................................................................................. 39
9. Patient voice ................................................................................................................................... 40
10. Recommendations/priorities ...................................................................................................... 41
11. Data sources ................................................................................................................................ 42
12. Acknowledgements ..................................................................................................................... 43
13. References ................................................................................................................................... 44
Appendix 1: Supplementary data ..................................................................................................... 47
4
Executive summary
There are an estimated 46,080 people living with sight loss in BNSSSG, far more than the
7,565 which are registered. One of the major risk factors for sight loss is age; in view of
current population trends towards an ageing population, estimates suggest there could be
over 70,000 people living with sight loss in the area by 2030. In addition to age, when
considering the health needs of this population, various other factors should be taken into
account; these include ethnicity, smoking, deprivation and obesity. The latter of these could
place huge demand on health services if obesity continues to rise at the current rate.
Sight loss is also associated with a number of co-morbidities, for example, stroke,
neurological conditions, learning disabilities, dementia, falls and depression. Poorer health
outcomes are often seen in people who are affected by these conditions and are visually
impaired compared to those who have the condition but are not visually impaired. Therefore,
reducing avoidable sight loss, ensuring rapid diagnosis, appropriate and timely treatment
and suitable support is vital.
Costs The costs of visual impairment are high and include not only the direct costs associated with
healthcare, such as inpatient and outpatient expenditure, prescribing, general ophthalmic
services and expenditure associated with injurious falls, but also the indirect costs, such as
unpaid care, adaptations and unemployment. Programme budgeting data suggest total
healthcare expenditure for BNSSSG was £58.4 million in 2012/13, whilst the indirect costs of
sight loss have been estimated at £107 million.
Major eye conditions The major sight conditions in the UK are: age-macular degeneration (AMD), glaucoma,
diabetic retinopathy and cataract.
• AMD is the leading cause of certifiable sight loss, with 46% of new Certificate of
Visual Impairments (CVIs) attributed to AMD in people aged 65 and over in 2011/12.
There are an estimated 12,495 cases of AMD in BNSSSG, approximately two-thirds
of which are “wet” AMD, which is about 1.8% of the population aged 50 and over.
• Glaucoma is an asymptomatic disease (in its early stages) that damages the optic
nerve and can lead to blindness. Estimates suggest there may be around 12,549
people in BNSSSG with glaucoma, a further 47,449 suspected cases and 26,651
people with ocular hypertension, which is a condition that increases the risk of
developing glaucoma.
5
• Surgical cataract prevalence has been estimated at 14,650 for BNSSSG. The
condition was responsible for 57% of all ophthalmic inpatient admissions in 2012/13.
• Diabetic retinopathy is a complication of diabetes and estimates suggest there were
25,101 adults living with the condition across BNSSSG in 2011 and this is expected
to rise by 11% by 2020, a rate of increase above the national average. Given the
current and ongoing rise of diabetes in the UK, diabetic retinopathy is expected to
have a major impact on eye services in the future. Diabetic retinopathy screening is
an effective way of detecting the disease as early as possible; screening levels
across BNSSSG ranged from 83.3% to 92.3% in 2011/12.
Low vision and uncorrected refractive error are two additional conditions of importance in
eye health. Estimates suggest there may be almost 20,000 people with impaired vision
(binocular acuity <6/18) and approximately 16,000 people with low vision (binocular acuity
<6/18 to 3/60) living in BNSSSG. It is thought uncorrected refractive error in people aged
over 60 affect anywhere between 7,000 and 24,000 people.
Children and young people Children with vision impairment have different needs from adults with sight loss. There were
350 children (aged <18) registered as blind or partially sighted as of March 2014, however
this figure is likely to be an underestimate due to issues with registration data; estimates
suggest the actual number could be over 50% higher. Data on sight tests show that only
one-quarter of children under 16 received an NHS sight test in 2013/14, meaning that may
be a number of children with some degree of undiagnosed and uncorrected visual
impairment.
Service provision There are a range of service providers that provide eye services across BNSSSG, including
optometrists, ophthalmology departments/hospitals, GPs, community and voluntary sector
and social care. Some hospital data is included in this report. Hospital activity data found
that there were over 13,000 finished admission episodes with a primary diagnosis of
‘Diseases of the eye and adnexa’ across the four main providers in BNSSSG in 2012/13.
Recommendations This report presents a rapid health needs assessment of eye health in BNSSSG. Further
data are required to provide a more complete overview for each CCG, however this report
provides an overview across the whole BNSSSG area and some key recommendations
have been identified. The primary recommendation is that each local areas uses the data
6
presented in this report to inform their Joint Strategic Needs Assessment (JSNA) with
supplementary data from local services.
A number of additional issues have been identified for consideration when developing
strategies and plans relating to eye health:
• Early detection is a priority;
• Increasing ageing population and increase in diabetes;
• Equity of access;
• Good quality support services, including rehabilitation;
• Mapping of eye health services;
• Identify areas of best practice;
• Link with other relevant strategies.
7
Glossary of eye conditions
Age-related macular degeneration
Patients with AMD lose their central vision so tasks that involve detail like reading and face
recognition become difficult if not impossible. Peripheral vision is usually preserved. There
are two types of AMD, commonly known as “dry” and “wet”.
Whilst there is no suitable treatment for dry AMD at present, the National Institute for Health
and Care Excellence (NICE) has confirmed that in some cases of wet AMD, treatment by
injection with an anti VEGF agent Ranibizumab (Lucentis) or Aflibercept (Eylea) can reduce
loss of vision (NICE 2008, 2013).1
Blindness
An inability to see or absence or loss of sight severe enough for someone to be unable to
perform any work for which eyesight is essential.2
Cataract
A cataract is the development of irregularities in the structure of the crystalline lens that
leads to a reduction of transparency.1 The symptoms most commonly reported are blurry
vision, problems with light, ‘faded’ colours, double or multiple vision.3
Diabetic retinopathy
A complication of diabetes mellitus, usually affecting both eyes. As the disease progresses,
some of the blood vessels that nourish the retina are blocked or become leaky, causing
vision loss through either proliferative retinopathy or macular oedema.3
Drusen
Drusen (singular, "druse") are tiny yellow or white accumulations of extracellular material
that build up between Bruch's membrane and the retinal pigment epithelium (RPE) of the
retina. The presence of a few small drusen is normal with advancing age and drusen alone
do not usually cause vision loss. However, the presence of larger and more numerous
drusen at the macula is a common early sign of age-related macular degeneration (AMD).4
Glaucoma
Glaucoma refers to a group of conditions characterised by visual field loss, and pathological
changes in the optic nerve head. There may also be raised intra-ocular pressure (IOP) as in
Chronic Open Angle Glaucoma (COAG) which is a common form of the condition. Sight loss
in glaucoma is not reversible.
8
Ocular hypertension (OHT) refers to patients who have raised IOP but do not have any sign
of glaucomatous damage at the optic nerve head or visual field loss. Patients diagnosed with
OHT require ongoing monitoring as they have significantly increased risk of developing
COAG later.
Glaucoma suspects may have early signs of optic nerve damage but may not yet exhibit
detectable field loss. They may or may not have raised IOP. The onset of glaucoma is
gradual.1
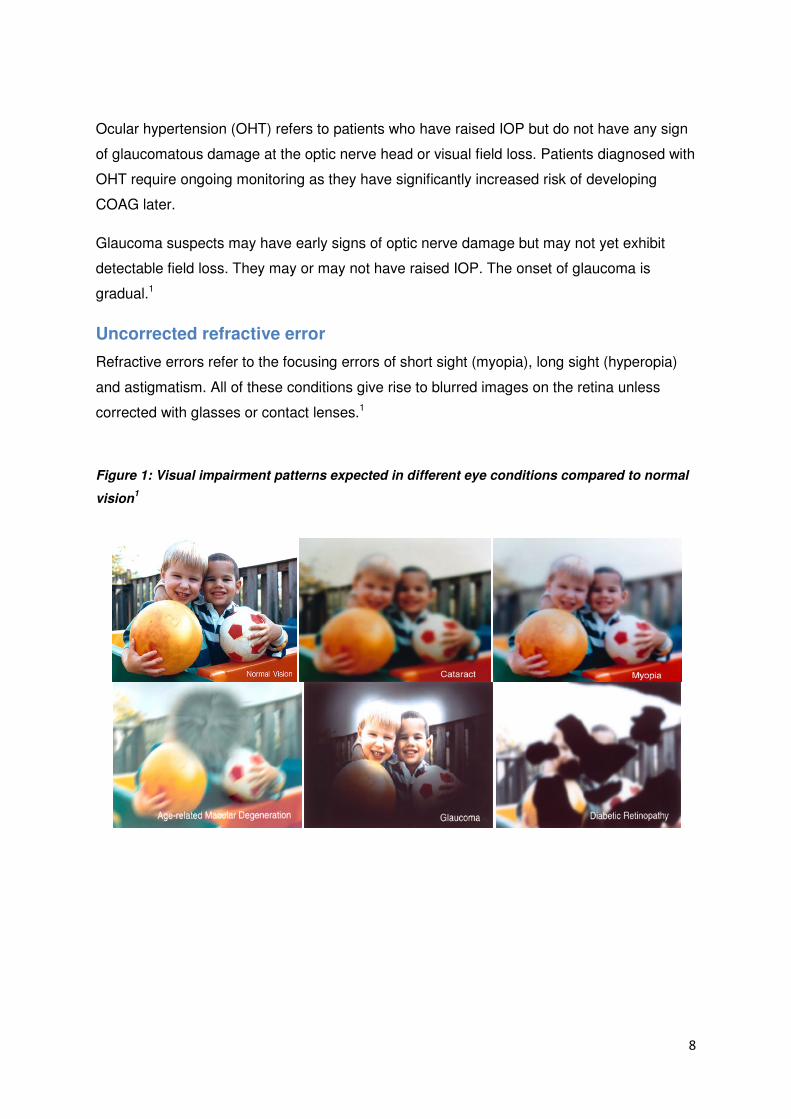
Uncorrected refractive error
Refractive errors refer to the focusing errors of short sight (myopia), long sight (hyperopia)
and astigmatism. All of these conditions give rise to blurred images on the retina unless
corrected with glasses or contact lenses.1
Figure 1: Visual impairment patterns expected in different eye conditions compared to normal
vision1
9
1. Introduction
1.1 Public health importance of sight loss and eye health
More than 1.8 million people are estimated to be living with sight loss in the UK and this is
expected to double by 2050.3 Often associated with increasing age, sight loss and conditions
affecting the eye will increase as a result of the UK’s ageing population. This has
implications in terms of costs, not just the direct health care costs but also indirect costs
such as unpaid care, adaptations and unemployment, not to mention the huge personal and
social costs to the individual.
The major sight conditions in the UK are age-related macular degeneration (AMD),
glaucoma, diabetic retinopathy and cataracts.3 Uncorrected refractive error also cause
potentially registrable levels of visual impairment which can be improved with appropriate
refractive correction (i.e. spectacles or contact lenses). These conditions lead to visual
impairment (i.e. partial sight or blindness) if undetected but could be prevented if diagnosed
and managed appropriately. Evidence suggests that over 50 per cent of sight loss is due to
preventable or treatable causes.5
There are a number of risk factors associated with sight loss, including age, gender,
smoking, obesity and deprivation. Additionally, there are several co-morbidities which are
important considerations in assessing the health needs of this population.
1.2 Importance of a health needs assessment
A health needs assessment is a systematic process to assess the health issues facing a
population, leading to agreed priorities and resource allocation that will improve health and
reduce inequalities in a particular area.6
Needs assessments are a vital part of the commissioning cycle. Given the current numbers
affected by sight loss and the estimated future projects, identifying the needs of these people
and those at risk are central to the planning for local support and preventative services.
1.3 Purpose
This document will present the findings of a “rapid”i health needs assessment of eye health
and sight loss for the Bristol, North Somerset, Somerset and South Gloucestershire
(BNSSSG) area. As noted above, this is not a comprehensive need assessment and
therefore it is intended that this needs assessment provides baseline epidemiological data to
inform local Joint Strategic Needs Assessments (JSNAs) and other local service planning.
i Report will be a “rapid” needs assessment as it draws on existing data and the timescales are relatively short
10
There is limited information included on local service provision, user need and patient voice
and it is therefore anticipated that commissioning areas carry out local work to supplement
the information in this document in order to produce locally agreed priorities and resource
allocation to improve health and inequalities relating to eye health for that area.
11
2. Key National Drivers and Policy
A number of policy drivers for producing an eye health needs assessment in BNSSSG have
been identified. These are discussed in further detail below.
2.1 UK vision strategy
The UK vision strategy was launched in 2008 in response to the World Health Assembly
Resolution of 2003, which urged the development and implementation of plans to tackle
vision impairment, now known as VISION 2020 plans.7
In June 2013, the Strategy was refreshed and the 2013-2018 Strategy was launched, with
the following outcomes:
1. Everyone in the UK looks after their eyes and their sight;
2. Everyone with an eye condition receives timely treatment and, if permanent sight loss
occurs, early and appropriate services and support are available and accessible to
all;
3. A society in which people with sight loss can fully participate.
2.2 Public health outcomes framework
The Public Health Outcomes Framework Healthy lives, Healthy people: Improving outcomes
and supporting transparency, sets out a vision for public health, desired outcomes and the
indicators that will help us understand how well public health is being improved and
protected.8
Four objectives have been identified in order to achieve the overall outcomes of increased
life expectancy and reduced differences in life expectancy and healthy life expectancy
between communities. As part of the objective to “reduce the numbers of people living with
preventable ill health and people dying prematurely, while reducing the gap between
communities”, one of the indicators included relates to preventable sight loss:
Proportion of Certificate of Visual Impairment (CVI) registrations that are due to age related
macular degeneration (AMD), glaucoma and diabetic retinopathy
There are a further four indicators in the framework which may also be assisted by
improvements in eye health:
• Falls and Injuries in the over 65s;
• Hip fractures in the over 65s;
• Self reported well being;
• Health related quality of life for older people.
12
2.3 NHS outcomes framework 2013/14
The NHS Outcomes Framework sets five "domains" through which the effectiveness of
health care will be measured:
• Domain 1 Preventing people from dying prematurely
• Domain 2 Enhancing quality of life for people with long-term conditions
• Domain 3 Helping people to recover from episodes of ill health or following injury
• Domain 4 Ensuring that people have a positive experience of care
• Domain 5 Treating and caring for people in a safe environment and protecting them
from avoidable harm
The UK Vision Strategy Project Team state that reducing avoidable sight loss and improving
eye health contributes to each of these, either directly or indirectly.9
2.4 Quality Innovation Productivity and Prevention (QIPP) Programme
The Quality, Innovation, Productivity and Prevention (QIPP) was initiated by the Department
of Health to provide a central resource of evidence showing how to improve quality whilst
making efficiency savings.10
Ophthalmology is an area which may benefit from development under the Quality Innovation
Productivity and Prevention (QIPP) programme. There is scope to optimise use of the
available workforce and improve treatment pathways for patients as outlined by the National
Eyecare Steering Group 1st Report.11
2.5 NHS England ‘Call to Action’: Improving eye health and reducing
sight loss
In 2014, NHS England launched a consultation exercise focused on improving eye health
and the provision of NHS eye health services, specifically early accurate detection by
primary services and effective management in the community. The work complements NHS
England’s wider ambitions to build primary care services at scale, and for NHS England and
CCGs to commission together where appropriate, focused on the needs of specific
communities.12 The consultation closed on September 12 2014 and seven key themes have
been identified:
1. IT and communication as a barrier to improving efficiency and quality of eye care;
2. Developing clinical leadership and changing organizational culture;
3. Developing pathways;
4. Making better use of existing skills and extending the scope and role of non-medical
personnel;
13
5. Reviewing General Ophthalmic Services and exploring new contractual opportunities;
6. Improving case management and more patient centric care;
7. Improving accessibility to sight tests, especially for at risk and vulnerable groups.
2.6 Royal College of General Practitioners (RCGP) Clinical Priority
Programme
The RCGP selects clinical areas to raise their profile and increase awareness both within
general practice and across primary care. Each year the College selects a number of clinical
areas or aspects of care to become UK wide RCGP clinical priorities for between 3 and 5
years duration. Eye Health has been made a priority for April 2013-March 2016. The priority
aims to reduce preventable sight loss amongst the ageing population across the UK and
improve eye referral to eye care services of any patient with signs of “correctable” sight loss.
The priority will enable more patients with unpreventable sight loss to maintain their
independence for longer in addition to having measurable gains in other health indicators.13
2.7 WHO Vision 2020
Vision 2020 is a global initiative that aims to eliminate avoidable blindness by the year 2020.
It was launched on 18 February 1999 by the World Health Organization together with the
more than 20 international non-governmental organisations involved in eye care and
prevention and management of blindness that comprise the International Agency for the
Prevention of Blindness (IAPB). VISION 2020 is a partnership that provides guidance,
technical and resource support to countries that have formally adopted its agenda.14
Three objectives have been identified:
• Increase awareness, within key audiences, of the causes of avoidable blindness and
the solutions to the problem;
• Advocate for and secure the necessary resources to implement the WHO Global
Action Plan 2014-19; and
• Facilitate the planning, development and implementation of national VISION
2020/Eye Health programmes in all countries.
2.8 CCG Outcomes Framework/Local CCG priorities
The CCG outcomes indicators have been selected on the basis that they help contribute to
better outcomes across the five domains of the NHS Outcomes Framework (see Section
2.3). The indicators are useful for CCGs and Health and Wellbeing Boards in identifying local
priorities for quality improvement.
14
3. Population Characteristics of BNSSSG and Health Determinants
There are strong links between sight loss and other health determinants; these are therefore
an important consideration in assessing the needs of the population of BNSSSG in relation
to eye health.
Where data in this section are presented at BNSSSG level but available at CCG level, this
additional data is provided in Appendix 1.
3.1 Age
BNSSSG covers a population of approximately 1.46 million people. The prevalence of many
eye diseases increases with increasing age. Figure 2 presents population estimates from the
Office for National Statistics (ONS) for BNSSSG for 2014 and projections for 2030. The
proportion of people aged over 60 in BNSSSG in 2014 (24.9%) is higher than the England
average (22.9%). By 2030, it is predicted that the proportion of people aged over 60 in
BNSSSG will have risen to 29.9%. The proportion of people over 80 is expected to increase
by over 50% to 8.4%, which will be higher than the England average (7.5%).
Figure 2: Percentage population split by age in BNSSSG in a) 2014 and b) 2030
compared with England average (bold outlines)
Data source: Office for National Statistics (ONS)
0 2 4 6 8
90+85-8980-8475-7970-7465-6960-6455-5950-5445-4940-4435-3930-3425-2920-2415-1910-14
5-90-4
%
Age
grou
p (y
ears
)
2014
0 2 4 6 8
90+85-8980-8475-7970-7465-6960-6455-5950-5445-4940-4435-3930-3425-2920-2415-1910-14
5-90-4
%
Age
grou
p (y
ears
)
2030
15
It should be noted that the combined profile for the whole of BNSSSG does conceal some
large differences in distribution of age between some localities. For example, the proportion
of the population aged over 60 in 2030 is estimated to range from 19.6% in Bristol to 36.9%
in Somerset.
3.2 Gender
Women have a longer life expectancy than men resulting in a higher number of women
affected by certain eye health conditions than men, such as AMD.
3.4 Ethnicity
Ethnicity has been identified as a risk factor for eye health and therefore consideration of the
different ethnic groups within BNSSSG is important (figure 3). People of African-Caribbean
origin have been found to be at an increased risk of developing glaucoma and the disease
can occur 10-15 years earlier.15,16 People of South Asian origin are at an increased risk of
diabetes and the associated eye condition, diabetic retinopathy, as well as early onset
cataract.17 The risk of developing diabetic retinopathy has been found to be 35 percent
higher than the risk in the white population.3
Figure 3: Percentage population split by ethnicity in BNSSSG
Data source: Office for National Statistics (ONS)
White93.1%
Mixed1.8%
Asian or Asian British2.6%
Black or Black British2.1% Other ethnic group
0.4%
16
3.5 Lifestyle factors
Smoking has been associated with an increased risk for AMD and cataracts. Evidence
suggests people who smoke have double the risk of developing AMD than non-smokers and
tend to develop it earlier. Approximately one in five adults are smokers; smoking prevalence
in England in 2012 was 19.5%. Prevalence across the four CCGs in BNSSSG ranged from
14.8% in North Somerset to 21.3% in Bristol.
Obesity can increase the risk of developing several eye conditions, specifically; diabetic
retinopathy, due to an increase in developing type 2 diabetes, cataracts and dry AMD.
Obesity also increases the speed of progression of AMD.18,19 In BNSSSG, around one in five
adults are obese; the proportion of adults classified as obese above ranged from 21.1% in
South Gloucestershire to 23.4% in Bristol.
3.6 Deprivation
Populations where there are multiple deprivation indicators have been shown to be more
likely to present with eye disease later than others.20 This increases the risk of sight loss in
deprived areas.
Across BNSSSG, 152,000 people (11% of the population) live in the 20% most deprived
areas of England.. However, there are marked differences between the four CCGs, ranging
from 0.5% of the population in South Gloucestershire living in the most deprived areas to
25.9% of the population in Bristol living in the most deprived areas.
The exploration of the effect of deprivation on presentation and whether the population of
deprived areas is accessing services is more difficult. However, corresponding data that
would highlight whether people in these areas are accessing services when needed is not
readily available.
3.7 Co-morbidities
Sight loss is also associated with a number of other co-morbidities, for example stroke,
neurological conditions, blood pressure, learning disabilities, dementia, falls and depression.
Furthermore, self care for other systemic conditions is likely to be affected21 resulting in
poorer health outcomes for these patients than those who are not visually impaired. In
BNSSSG, 20.4% of the total number of people registered as blind or partially sighted were
also recorded as having an additional disability, equating to 1,540 people in the area. Of
these, 53% reported a physical disability, 20% were hard of hearing and an additional 9%
reported being deaf, 11% reported a learning disability and 8% reported a mental health
issue. Overall, 70% were aged 65 years or over.
17
3.7.1 Learning disabilities
Visual impairments are more common among people with learning disabilities, especially
people with more severe learning disabilities; adults with a learning disability are 10 times
more likely to be blind or partially sighted.22 The presence of visual impairments can
significantly impair the independence and quality of life of people with learning disabilities.22
In 2014, there were 5,480 people in England registered as blind or partially sighted and
recorded as having a learning disability. However, this is likely to be an underestimate the
actual number, due to issues regarding registration data and its validity (see Section 4:
Incidence and Prevalence of Partial Sight and Blindness) as well as a lack of recognition of
deteriorating sight and issues with communicating any deterioration.23
Given the lack of robust data on the prevalence of visual impairments among people with
learning disabilities in the UK, a Department of Health report22 has used evidence from
Denmark and the Netherlands to predict prevalence in the UK. The report estimates there
are approximately 65,000 people with learning disabilities who are known to services in the
UK to have visual impairment (partial sight loss and blindness); 23,000 children and 42,000
adults, far higher than the number registered. In addition, whilst it is assumed that all
children with learning disabilities are known to education services, not all adults with learning
disabilities are thought to be known to adult health or social care learning disability services.
Therefore, the report estimates there may be an additional 55,000 adults with learning
disabilities and visual impairment. The report also predicts that these figures are likely to rise
by approximately 0.5% each year over the next 20 years.
In 2014, there were 170 people registered blind or partially sighted in BNSSSG who also
reported a learning disability. The actual number, however, is likely to be higher given that
the number of people registered as blind or partially sighted is thought to be far lower that
the actual number living with sight loss as discussed earlier.
In BNSSSG, there were 5,771 adults (18+) with learning disabilities known to GPs and 3735
adults (18-64 years) with learning disabilities known to local authorities in 2011/12. Each
year, GPs are supposed to offer regular health checks to people known to have a learning
disability. In 2011/12, the proportion of adults (18+) with a learning disability eligible for an
annual health check with their GP, who received a health check was 70%.
This data highlights that not only are there likely to be a number of people in BNSSSG who
have a learning disability and are not known to services and therefore may not be receiving
appropriate health care, but of those that are known, 30% do not receive their annual health
18
check to ensure health problems, such as visual impairment are appropriately diagnosed
and treated.
3.7.2 Dementia
The risk of dementia and sight loss both increase independently with age, therefore
inevitably there will be people affected by both conditions; and this is likely to increase given
the ageing population. Evidence suggests the effect of having both serious sight loss and
dementia at the same time is much more severe than the difficulties caused by either
condition alone.24 In addition, since sight loss symptoms may cause similar symptoms to
progression of dementia (e.g. decrease in interest in reading/television, loss of confidence,
confusion and visual hallucinations), the deterioration is often misdiagnosed as a worsening
of dementia rather than sight loss. Over 9,000 people aged 65 and over are estimated to be
living with dementia in BNSSSG; this ranged from 1,392 people in South Gloucestershire to
4,132 people in Somerset.
3.7.3 Falls
Visual impairment is an important risk factor for falls in older people;25 older people with
visual impairment are 1.7 times more likely to have a fall.26 There are approximately 68,000
falls in people aged 65 and over across BNSSSG each year; of these, around 8% (5,500)
are estimated to occur amongst those with sight loss. Of these 8%, almost half (around
2,600) are estimated to have been directly attributable to sight loss. Serious falls are those
requiring hospital admission; there are an estimated 208 falls which are directly attributable
to sight loss and require hospital treatment.
3.7.4 Depression
There is also an increased risk of depression in older people with visual impairment, with a
rate of 13.5 per cent, as compared to 4.6 per cent in the general population.27 Reducing
avoidable sight loss therefore is important for reducing depression and improving well-being,
but there must also be a focus on ensuring blind and partially sighted people have access to
emotional support and rehabilitation services from the point of diagnosis onwards.28
Relieving depression and social isolation are therefore vital; services should include social
opportunities (e.g. swimming clubs or social drop in). Furthermore, counselling services offer
an important opportunity to ensure those newly diagnosed have the appropriate support.
3.7.5 Stroke
Almost 70% of people who experience strokes will also experience some form of vision
dysfunction.29 However, existing evidence suggests 45% of stroke services provide no
formal vision assessment for stroke patients.30 Given that there are an estimated 6,689
19
people aged 65 and over in BNSSSG who have had a stroke, there may be 4,682 people in
BNSSSG who have experienced some form of vision dysfunction following a stroke.
20
4. Incidence and Prevalence of Partial Sight and Blindness
Where data in this section are presented at BNSSSG level but available at CCG level, this
additional data is provided in Appendix 1.
A Certification of Vision Impairment (CVI) formally certifies a person as either sight impaired
(partially sighted) or severely sight impaired (blind). Each CVI form is completed by a
consultant ophthalmologist in an eye clinic, with a copy being sent to the local social services
department which provides a formal route to social care services.31 Although it is the formal
route to social care services, it should be noted that people who are visually impaired often
need support well before the time of registration.
The total number of new CVIs issued in BNSSSG in 2012/13 was 557. The rate per 100,000
population ranged from 25.6 in South Gloucestershire to 51.2 in Somerset, which is above
the England average (42.3 per 100,000). The rate of CVIs in England for 2012/13, was
similar to the rates reported for 2010/11 and 2011/12 (42.7 and 44.5 respectively)Within
BNSSSG, the rates differed more markedly by year for the four local authorities; for
example, the rate for Somerset was 63.0 per 100,000 in 2010/11, 57.1 in 2011/12 and 51.2
in 2012/13. Year on year comparison of CVI data by local authority should be interpreted
with caution due to the small numbers involved and natural yearly variation. An analysis of
time trends may help to understand the year on year differences better.
Upon receipt of a completed Certification of Vision Impairment form, a social services
department offers registration and other relevant advice and support; registration is not
automatic and not everybody that has been certified as having a visual impairment is
recorded on a local authority register. Those that register become eligible for certain
concessions. Registers of blind and partially sighted people are generally maintained by
local authorities, however, in North Somerset, the local authority commission Vision North
Somerset to maintain this information on their behalf.
In the most recently published data (up to March 2014), there were around 290,000 people
registered blind or partially sighted in England. In BNSSSG, there were 7,565 registered
cases (table 1). In line with national data, the number of registrations in BNSSSG has been
falling in recent years (there were 320 fewer registrations in 2014 compared to 2011). There
are several possible explanations for this observation; for example, it could be an artefact, as
a result of issues with registration (see further explanation later in this section) or it could be
due to the availability of treatment for wet AMD. Approximately one quarter of registrations
are in people aged 64 or under and around one-fifth are recorded as having an additional
21
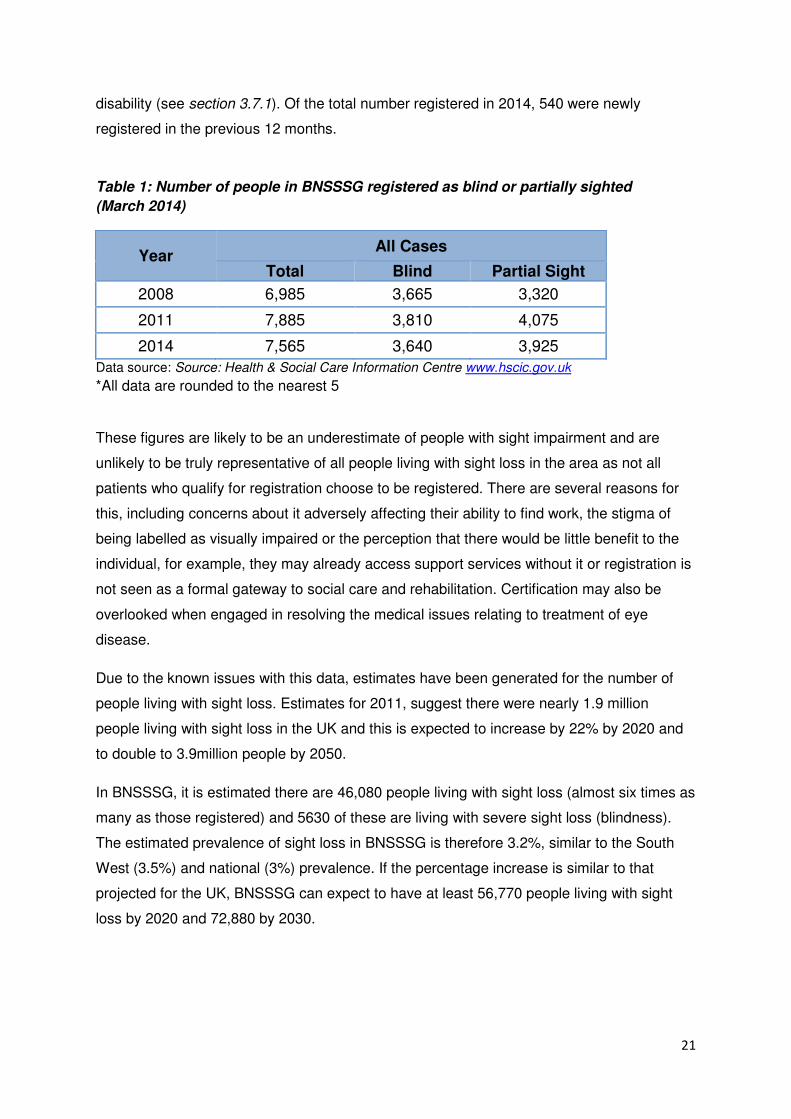
disability (see section 3.7.1). Of the total number registered in 2014, 540 were newly
registered in the previous 12 months.
Table 1: Number of people in BNSSSG registered as blind or partially sighted
(March 2014)
Year All Cases
Total Blind Partial Sight
2008 6,985 3,665 3,320
2011 7,885 3,810 4,075
2014 7,565 3,640 3,925
Data source: Source: Health & Social Care Information Centre www.hscic.gov.uk
*All data are rounded to the nearest 5
These figures are likely to be an underestimate of people with sight impairment and are
unlikely to be truly representative of all people living with sight loss in the area as not all
patients who qualify for registration choose to be registered. There are several reasons for
this, including concerns about it adversely affecting their ability to find work, the stigma of
being labelled as visually impaired or the perception that there would be little benefit to the
individual, for example, they may already access support services without it or registration is
not seen as a formal gateway to social care and rehabilitation. Certification may also be
overlooked when engaged in resolving the medical issues relating to treatment of eye
disease.
Due to the known issues with this data, estimates have been generated for the number of
people living with sight loss. Estimates for 2011, suggest there were nearly 1.9 million
people living with sight loss in the UK and this is expected to increase by 22% by 2020 and
to double to 3.9million people by 2050.
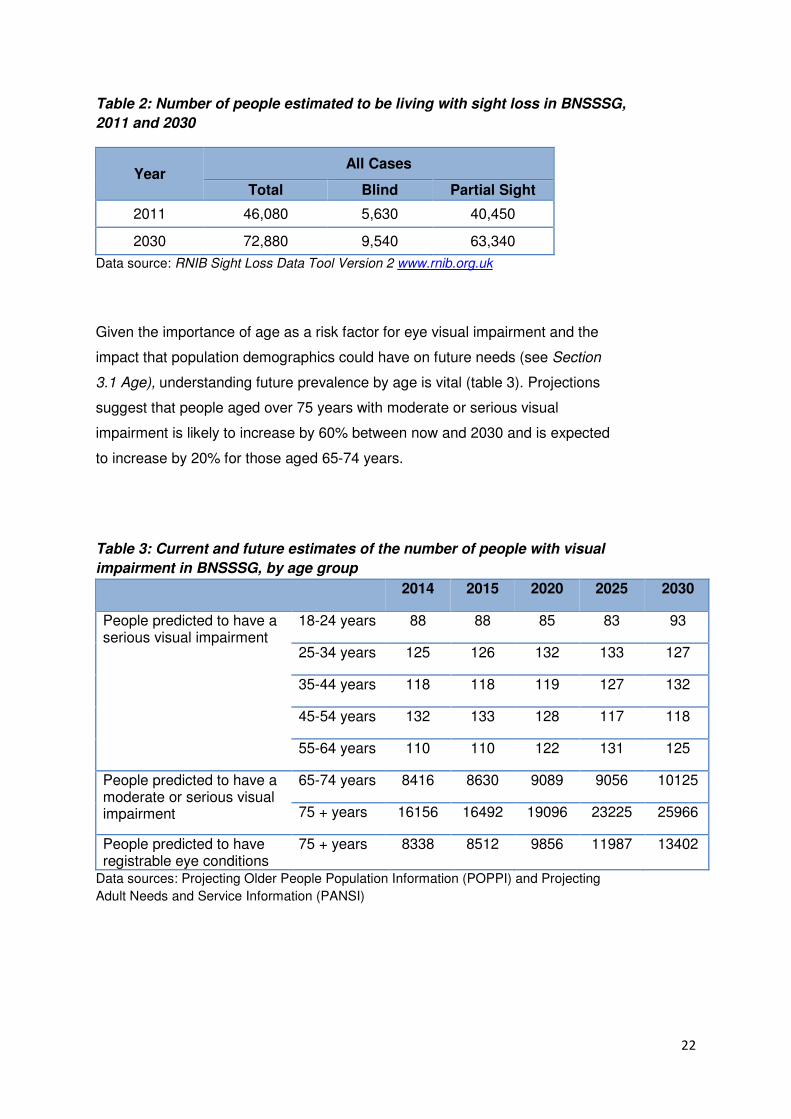
In BNSSSG, it is estimated there are 46,080 people living with sight loss (almost six times as
many as those registered) and 5630 of these are living with severe sight loss (blindness).
The estimated prevalence of sight loss in BNSSSG is therefore 3.2%, similar to the South
West (3.5%) and national (3%) prevalence. If the percentage increase is similar to that
projected for the UK, BNSSSG can expect to have at least 56,770 people living with sight
loss by 2020 and 72,880 by 2030.
22
Table 2: Number of people estimated to be living with sight loss in BNSSSG,
2011 and 2030
Year All Cases
Total Blind Partial Sight
2011 46,080 5,630 40,450
2030 72,880 9,540 63,340
Data source: RNIB Sight Loss Data Tool Version 2 www.rnib.org.uk
Given the importance of age as a risk factor for eye visual impairment and the
impact that population demographics could have on future needs (see Section
3.1 Age), understanding future prevalence by age is vital (table 3). Projections
suggest that people aged over 75 years with moderate or serious visual
impairment is likely to increase by 60% between now and 2030 and is expected
to increase by 20% for those aged 65-74 years.
Table 3: Current and future estimates of the number of people with visual
impairment in BNSSSG, by age group
2014 2015 2020 2025 2030
People predicted to have a serious visual impairment
18-24 years 88 88 85 83 93
25-34 years 125 126 132 133 127
35-44 years 118 118 119 127 132
45-54 years 132 133 128 117 118
55-64 years 110 110 122 131 125
People predicted to have a moderate or serious visual impairment
65-74 years 8416 8630 9089 9056 10125
75 + years 16156 16492 19096 23225 25966
People predicted to have registrable eye conditions
75 + years 8338 8512 9856 11987 13402
Data sources: Projecting Older People Population Information (POPPI) and Projecting
Adult Needs and Service Information (PANSI)
23
5. Cost of eye care
The costs of visual impairment are high and include not only the direct costs associated with
healthcare (e.g. diagnosis and treatment), but also the indirect costs such as unpaid care,
adaptations and unemployment.
Whilst data is available on healthcare expenditure, quantifying the indirect costs relating to
eye health is complex. One report has suggested that for the estimated 1.8million visually
impaired people in the UK in 2008, costs were £6.5billion.3 The direct costs (£2.2billion)
contained in this calculation were predominantly due to hospital care (£1.1billion) and
spending on residential and community care services (£304million) whilst a further
£25million was attributed to the costs of injurious falls. The indirect costs (£4.3billion) were
predominantly due to informal care costs accounted (£2billion) and lower employment
(£1.6billion); the cost of devices and adaptations required to facilitate daily living was
calculated to be £336.5million. The total cost associated with the burden of disease, which
included the burden of disability in terms of reduced quality of life (measured in disability
adjusted life years) and years of life lost due to premature death was estimated at
£15.5billion.
Programme budgeting benchmarking data are available for all CCGs, detailing a breakdown
of expenditure across 23 programmes of care and 12 care settings, such as outpatient and
community for the year 2012/13. Data on expenditure of programme budgeting category
“Problems with vision” for the four CCGs within BNSSSG are presented in table 4. In
2012/13, Bristol, North Somerset and Somerset spent around two-thirds of their expenditure
on secondary care and just over a quarter on primary care, whilst South Gloucestershire
spent around 45% of their expenditure on each.
For BNSSSG, total healthcare expenditure on problems of vision in 2012/13 was £58.4
million, whilst the indirect cost of sight loss for BNSSSG have been estimated at £130
million. It should be noted that programme budgeting benchmarking data are collated by
Area Teams and provided by those commissioning services; its validity and usefulness
therefore is reliant on accurate coding and reporting and this should be borne in mind when
interpreting the data.
24
Table 4: Expenditure on own population (total and £million per 100,000), BNSSSG, 2012/13
Expenditure on own
population
(£million)
Expenditure
(£million per
100,000 population)
Proportion (%)
of total
expenditure
Bristol 17.2 3.78 2.2
North Somerset 10.5 4.98 2.9
Somerset 23.8 4.64 2.6
South Gloucestershire 6.9 3.22 1.7
National average - 4.35 -
Data source: Programme budgeting data, NHS England, http://www.england.nhs.uk/resources/resources-for-ccgs/prog-budgeting/
25
6. Eye conditions
The major sight conditions in the UK are age-related macular degeneration (AMD),
glaucoma, diabetic retinopathy and cataracts.3 Uncorrected refractive error also cause
registrable levels of visual impairment which may need to be resolved with appropriate
treatment, whilst low visions services are an important area of commissioning. These six
areas will be discussed in this section, however it should be highlighted that there are a
number of other important areas relevant to eye health, such as emergency eye care,
surgery and cancer. It was not possible to obtain data on these areas within the necessary
timescales, however these areas should be addressed locally.
6.1 Age related macular degeneration
Age related macular degeneration (AMD) is the leading cause of certifiable visual loss in the
UK. There are two main types: “dry” and “wet” (see Glossary of eye conditions, page 36).
Risk factors for AMD include smoking, increasing age and most significantly a family history.
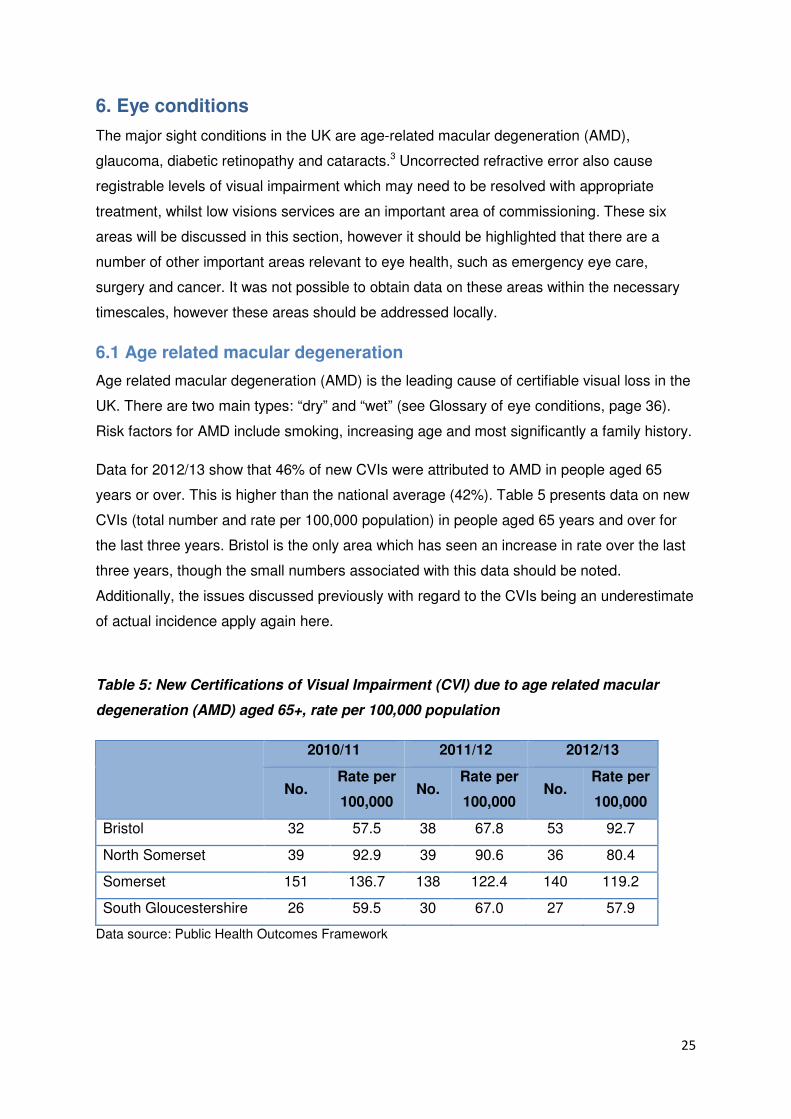
Data for 2012/13 show that 46% of new CVIs were attributed to AMD in people aged 65
years or over. This is higher than the national average (42%). Table 5 presents data on new
CVIs (total number and rate per 100,000 population) in people aged 65 years and over for
the last three years. Bristol is the only area which has seen an increase in rate over the last
three years, though the small numbers associated with this data should be noted.
Additionally, the issues discussed previously with regard to the CVIs being an underestimate
of actual incidence apply again here.
Table 5: New Certifications of Visual Impairment (CVI) due to age related macular
degeneration (AMD) aged 65+, rate per 100,000 population
2010/11 2011/12 2012/13
No. Rate per
100,000 No.
Rate per
100,000 No.
Rate per
100,000
Bristol 32 57.5 38 67.8 53 92.7
North Somerset 39 92.9 39 90.6 36 80.4
Somerset 151 136.7 138 122.4 140 119.2
South Gloucestershire 26 59.5 30 67.0 27 57.9
Data source: Public Health Outcomes Framework
26
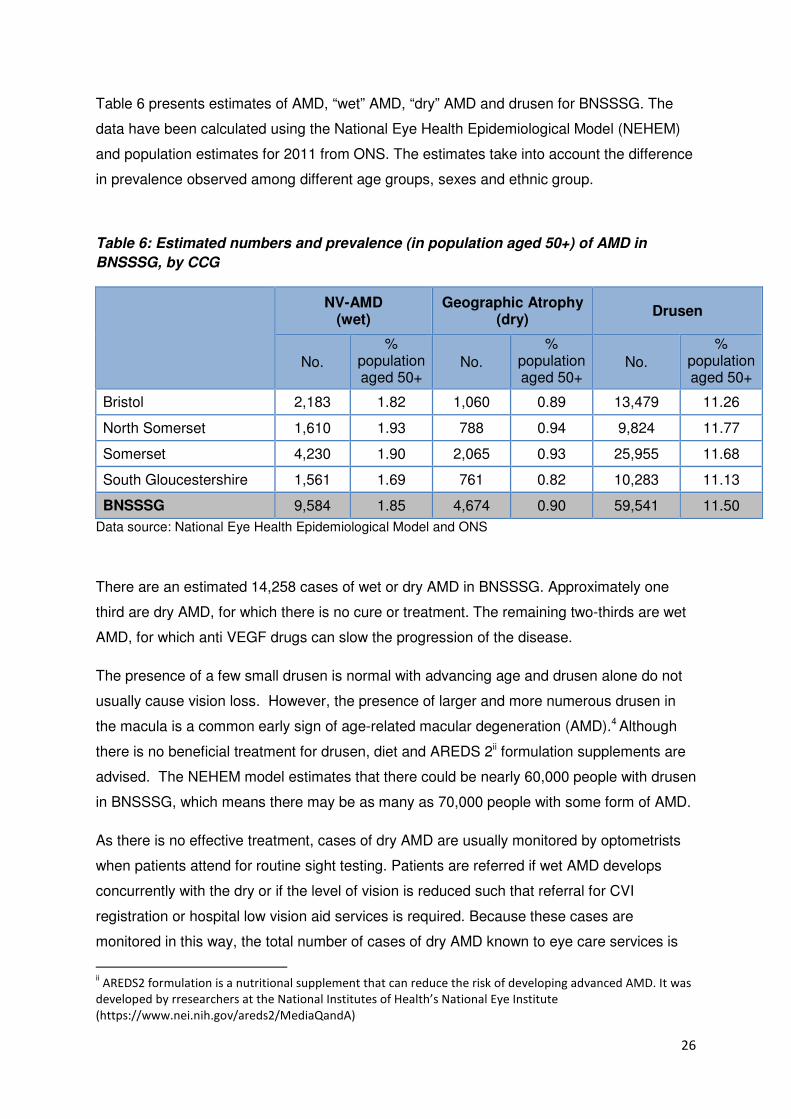
Table 6 presents estimates of AMD, “wet” AMD, “dry” AMD and drusen for BNSSSG. The
data have been calculated using the National Eye Health Epidemiological Model (NEHEM)
and population estimates for 2011 from ONS. The estimates take into account the difference
in prevalence observed among different age groups, sexes and ethnic group.
Table 6: Estimated numbers and prevalence (in population aged 50+) of AMD in
BNSSSG, by CCG
NV-AMD (wet)
Geographic Atrophy (dry)
Drusen
No. %
population aged 50+
No. %
population aged 50+
No. %
population aged 50+
Bristol 2,183 1.82 1,060 0.89 13,479 11.26
North Somerset 1,610 1.93 788 0.94 9,824 11.77
Somerset 4,230 1.90 2,065 0.93 25,955 11.68
South Gloucestershire 1,561 1.69 761 0.82 10,283 11.13
BNSSSG 9,584 1.85 4,674 0.90 59,541 11.50
Data source: National Eye Health Epidemiological Model and ONS
There are an estimated 14,258 cases of wet or dry AMD in BNSSSG. Approximately one
third are dry AMD, for which there is no cure or treatment. The remaining two-thirds are wet
AMD, for which anti VEGF drugs can slow the progression of the disease.
The presence of a few small drusen is normal with advancing age and drusen alone do not
usually cause vision loss. However, the presence of larger and more numerous drusen in
the macula is a common early sign of age-related macular degeneration (AMD).4 Although
there is no beneficial treatment for drusen, diet and AREDS 2ii formulation supplements are
advised. The NEHEM model estimates that there could be nearly 60,000 people with drusen
in BNSSSG, which means there may be as many as 70,000 people with some form of AMD.
As there is no effective treatment, cases of dry AMD are usually monitored by optometrists
when patients attend for routine sight testing. Patients are referred if wet AMD develops
concurrently with the dry or if the level of vision is reduced such that referral for CVI
registration or hospital low vision aid services is required. Because these cases are
monitored in this way, the total number of cases of dry AMD known to eye care services is
ii AREDS2 formulation is a nutritional supplement that can reduce the risk of developing advanced AMD. It was developed by rresearchers at the National Institutes of Health’s National Eye Institute (https://www.nei.nih.gov/areds2/MediaQandA)
27
unknown.
It is not clear from local hospital episode statistics what proportion of patients seen has wet
AMD. In addition, coding of outpatient data is not detailed enough to allow us to determine
the proportion of cases of all types of macular degeneration known to local health services.
6.2 Glaucoma
Glaucoma is an asymptomatic disease (in its early stages) that damages the optic nerve and
can lead to blindness. Risk factors include increasing age, family history, ethnicity and
ocular hypertension. Sight loss in glaucoma is not reversible, however the onset of
glaucoma is gradual and the condition can be treated with medication, laser or filtration
surgery. Ocular hypertension (OHT) is an additionally important condition to measure as
patients diagnosed with OHT are at increased risk of developing glaucoma and therefore
require ongoing monitoring.
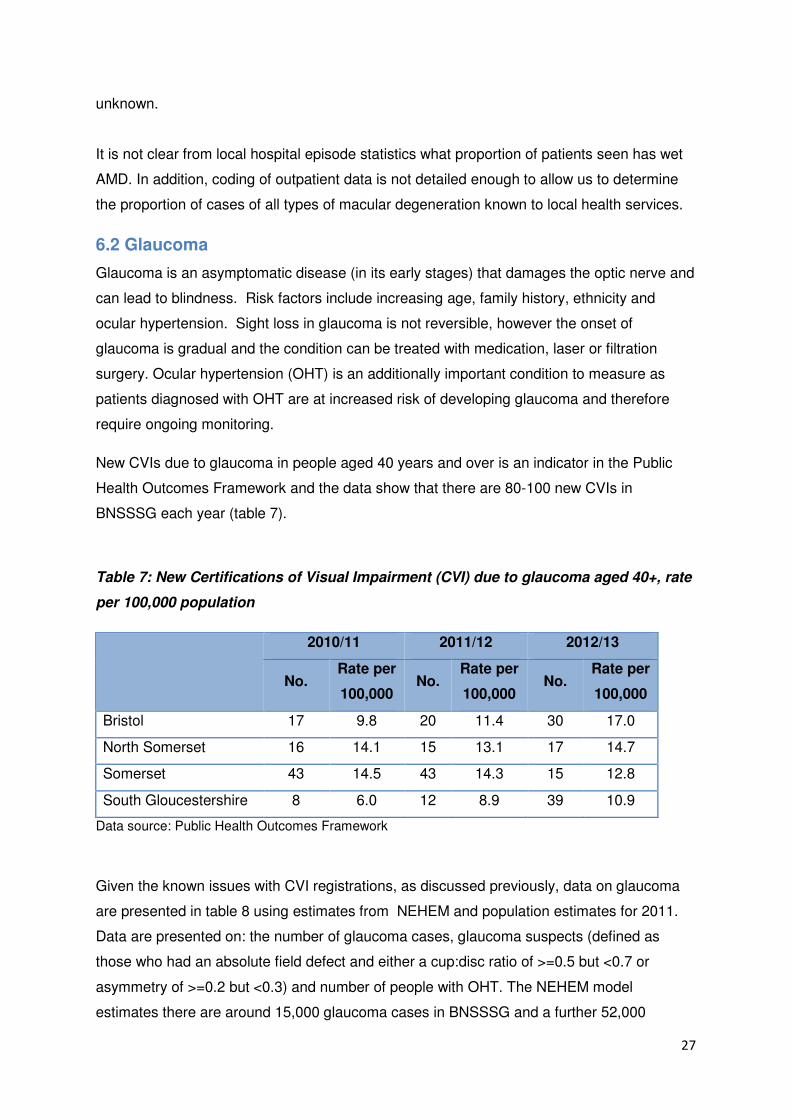
New CVIs due to glaucoma in people aged 40 years and over is an indicator in the Public
Health Outcomes Framework and the data show that there are 80-100 new CVIs in
BNSSSG each year (table 7).
Table 7: New Certifications of Visual Impairment (CVI) due to glaucoma aged 40+, rate
per 100,000 population
2010/11 2011/12 2012/13
No. Rate per
100,000 No.
Rate per
100,000 No.
Rate per
100,000
Bristol 17 9.8 20 11.4 30 17.0
North Somerset 16 14.1 15 13.1 17 14.7
Somerset 43 14.5 43 14.3 15 12.8
South Gloucestershire 8 6.0 12 8.9 39 10.9
Data source: Public Health Outcomes Framework
Given the known issues with CVI registrations, as discussed previously, data on glaucoma
are presented in table 8 using estimates from NEHEM and population estimates for 2011.
Data are presented on: the number of glaucoma cases, glaucoma suspects (defined as
those who had an absolute field defect and either a cup:disc ratio of >=0.5 but <0.7 or
asymmetry of >=0.2 but <0.3) and number of people with OHT. The NEHEM model
estimates there are around 15,000 glaucoma cases in BNSSSG and a further 52,000
28
suspects. In addition, there could be as many as 28,000 people with OHT who are at risk of
glaucoma.
Table 8: Expected number of glaucoma cases in BNSSSG
Estimated glaucoma cases Suspected glaucoma cases Ocular Hypertension (% population
30+) High Low Mean (%
population 30+)
<60 years
60+ years
Total (% population
30+)
Bristol 5,179 2,391 3,678
(1.52%) 8,297 5,316
13,614 (5.63%)
7,741 (3.20%)
North Somerset 3,302 1,452 2,314
(1.69%) 3,992 4,010
8,002 (5.84%)
4,388 (3.20%)
Somerset 8,652 3,796 6,077
(1.71%) 10,182 10,568
20,750 (5.85%)
11,347 (3.20%)
South Gloucestershire
3,514 1,548 2,479
(1.48%) 5,378 4,211
9,589 (5.72%)
5,367 (3.20%)
BNSSSG 20,647 9,187 14,548 (1.61%)
27,849 24,105 51,955 (5.76%)
28,843 (3.20%)
Data source: National Eye Health Epidemiological Model and ONS
It is likely that the NEHEM estimates are an underestimate of prevalence as the definition of
glaucoma used is more likely to pick up more advanced cases and miss early cases with
subtle changes. An equity profile produced by Bradford and Airedale PCT suggests that
NEHEM may underestimate the prevalence of glaucoma by 1.5 to 2 times.
In an attempt to more accurately define the number of known glaucoma cases in the area
the general ophthalmic services statistics relating to sight tests were considered as patients
with glaucoma and their close relative aged 40 and over are entitled to an annual NHS sight
test. Unfortunately, available published statistics group together patients with glaucoma with
those that have diabetes and therefore it is not possible to tell what proportion of the sight
test carried out in diabetic/glaucoma sufferers were due to glaucoma. Even so, this
information still provides important information on people eligible to receive NHS eye tests;
in 2013/14, 10.4% of all NHS sight tests (equating to 36,766 tests) were on
diabetics/glaucoma sufferers. The number of tests in this eligibility category has increased
over the last six years (from 18, 249 tests in 2007/08) and is a likely reflection of increases in
both diabetic and glaucoma sufferers aged 40 years and over. Additionally, in 2013/14,
36,982 tests (10.5%) were carried out on close relatives of glaucoma sufferers.
29
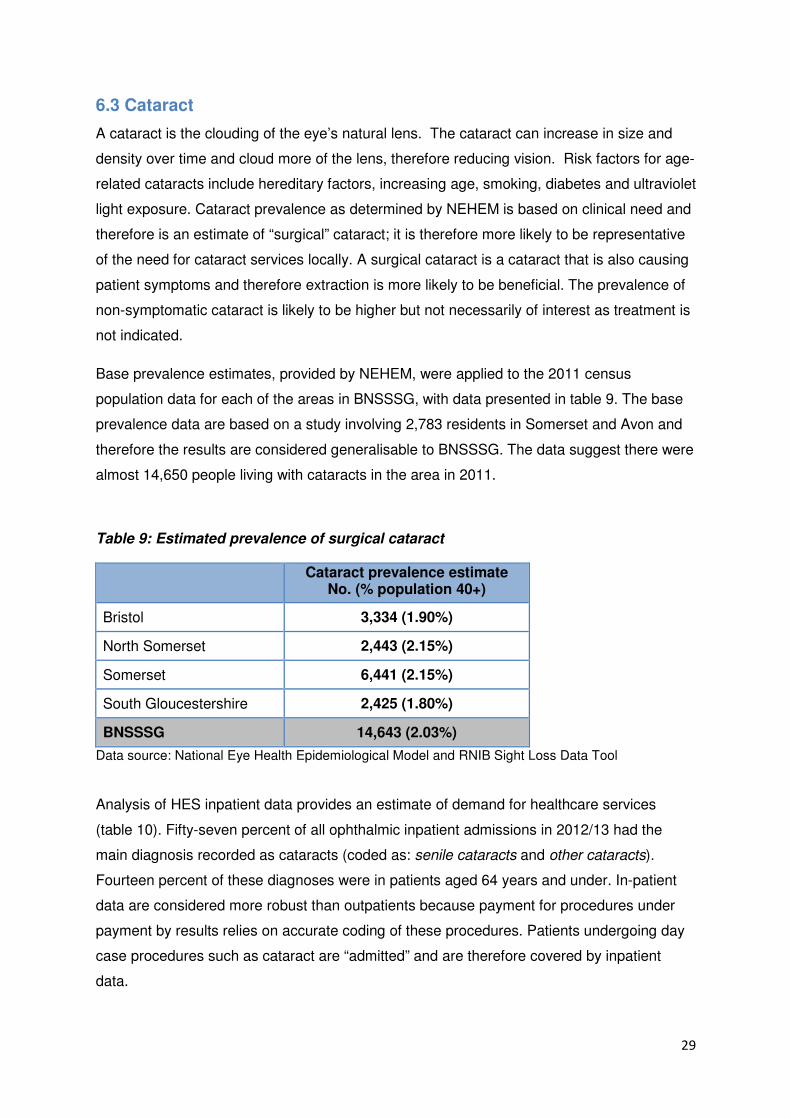
6.3 Cataract
A cataract is the clouding of the eye’s natural lens. The cataract can increase in size and
density over time and cloud more of the lens, therefore reducing vision. Risk factors for age-
related cataracts include hereditary factors, increasing age, smoking, diabetes and ultraviolet
light exposure. Cataract prevalence as determined by NEHEM is based on clinical need and
therefore is an estimate of “surgical” cataract; it is therefore more likely to be representative
of the need for cataract services locally. A surgical cataract is a cataract that is also causing
patient symptoms and therefore extraction is more likely to be beneficial. The prevalence of
non-symptomatic cataract is likely to be higher but not necessarily of interest as treatment is
not indicated.
Base prevalence estimates, provided by NEHEM, were applied to the 2011 census
population data for each of the areas in BNSSSG, with data presented in table 9. The base
prevalence data are based on a study involving 2,783 residents in Somerset and Avon and
therefore the results are considered generalisable to BNSSSG. The data suggest there were
almost 14,650 people living with cataracts in the area in 2011.
Table 9: Estimated prevalence of surgical cataract
Cataract prevalence estimate No. (% population 40+)
Bristol 3,334 (1.90%)
North Somerset 2,443 (2.15%)
Somerset 6,441 (2.15%)
South Gloucestershire 2,425 (1.80%)
BNSSSG 14,643 (2.03%)
Data source: National Eye Health Epidemiological Model and RNIB Sight Loss Data Tool
Analysis of HES inpatient data provides an estimate of demand for healthcare services
(table 10). Fifty-seven percent of all ophthalmic inpatient admissions in 2012/13 had the
main diagnosis recorded as cataracts (coded as: senile cataracts and other cataracts).
Fourteen percent of these diagnoses were in patients aged 64 years and under. In-patient
data are considered more robust than outpatients because payment for procedures under
payment by results relies on accurate coding of these procedures. Patients undergoing day
case procedures such as cataract are “admitted” and are therefore covered by inpatient
data.
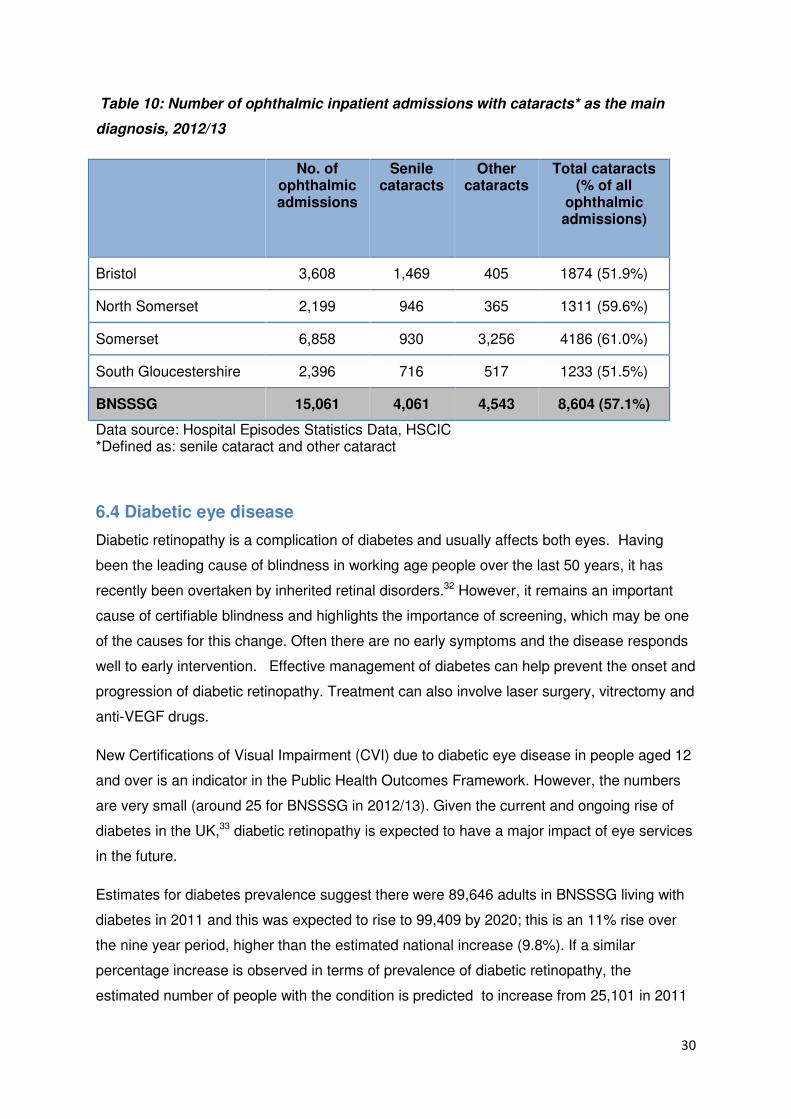
30
Table 10: Number of ophthalmic inpatient admissions with cataracts* as the main
diagnosis, 2012/13
No. of ophthalmic admissions
Senile cataracts
Other cataracts
Total cataracts (% of all
ophthalmic admissions)
Bristol 3,608 1,469 405 1874 (51.9%)
North Somerset 2,199 946 365 1311 (59.6%)
Somerset 6,858 930 3,256 4186 (61.0%)
South Gloucestershire 2,396 716 517 1233 (51.5%)
BNSSSG 15,061 4,061 4,543 8,604 (57.1%)
Data source: Hospital Episodes Statistics Data, HSCIC *Defined as: senile cataract and other cataract
6.4 Diabetic eye disease
Diabetic retinopathy is a complication of diabetes and usually affects both eyes. Having
been the leading cause of blindness in working age people over the last 50 years, it has
recently been overtaken by inherited retinal disorders.32 However, it remains an important
cause of certifiable blindness and highlights the importance of screening, which may be one
of the causes for this change. Often there are no early symptoms and the disease responds
well to early intervention. Effective management of diabetes can help prevent the onset and
progression of diabetic retinopathy. Treatment can also involve laser surgery, vitrectomy and
anti-VEGF drugs.
New Certifications of Visual Impairment (CVI) due to diabetic eye disease in people aged 12
and over is an indicator in the Public Health Outcomes Framework. However, the numbers
are very small (around 25 for BNSSSG in 2012/13). Given the current and ongoing rise of
diabetes in the UK,33 diabetic retinopathy is expected to have a major impact of eye services
in the future.
Estimates for diabetes prevalence suggest there were 89,646 adults in BNSSSG living with
diabetes in 2011 and this was expected to rise to 99,409 by 2020; this is an 11% rise over
the nine year period, higher than the estimated national increase (9.8%). If a similar
percentage increase is observed in terms of prevalence of diabetic retinopathy, the
estimated number of people with the condition is predicted to increase from 25,101 in 2011
31
to 27,834 in 2020, suggesting there will be almost 3000 more people living with diabetic
retinopathy across BNSSSG (these estimates are based on applying base prevalence rates
for diabetes to population estimates).
Diabetic retinopathy screening is an effective way of detecting the disease as early as
possible. Therefore, a national screening programme for England was established in 2003.
All people aged 12 and over and with diabetes (type 1 or 2) are offered annual screening
appointments. Screening is provided in a variety of locations, including GP surgeries,
hospitals and opticians’ practices.34 There are two diabetic eye screening programmes within
BNSSSG. These are: Bristol and Weston Diabetic Eye Screening Programme and Somerset
Diabetic Eye Screening Programme.
For 2011/12, the proportion of patients who were invited to and attended a retinal screening
appointment varied across BNSSSG: Bristol, 83.3%; North Somerset, 87.4%, South
Gloucestershire, 84.2% and Somerset, 92.3%. More recent data available for April-June
2013 for each screening programme showed uptake was 79.2% for Bristol and Weston
Diabetic Eye Screening Programme and 87.7% for Somerset Diabetic Eye Screening
Programme (England average: 82.8%). Over the two areas, a total of 57,363 people were
invited for screening and 47,278 took up the offer.
6.5 Low vision
This refers to people who have some useful vision which can often be improved with low
vision aids and adaptations. Low vision services may be based in a local hospital, located in
opticians' practices or offered from a resource centre run by the local society for people with
sight loss.35
Low vision estimates were calculated using NEHEM and population estimates for 2011
(table 11). The model calculates the prevalence of visual impairment overall (binocular visual
acuity <6/18), which was categorized into low vision (binocular acuity <6/18-3/60) or severe
sight impairment (binocular acuity <3/60).36 The model suggests there could be around
19,000 people in BNSSSG with low vision.
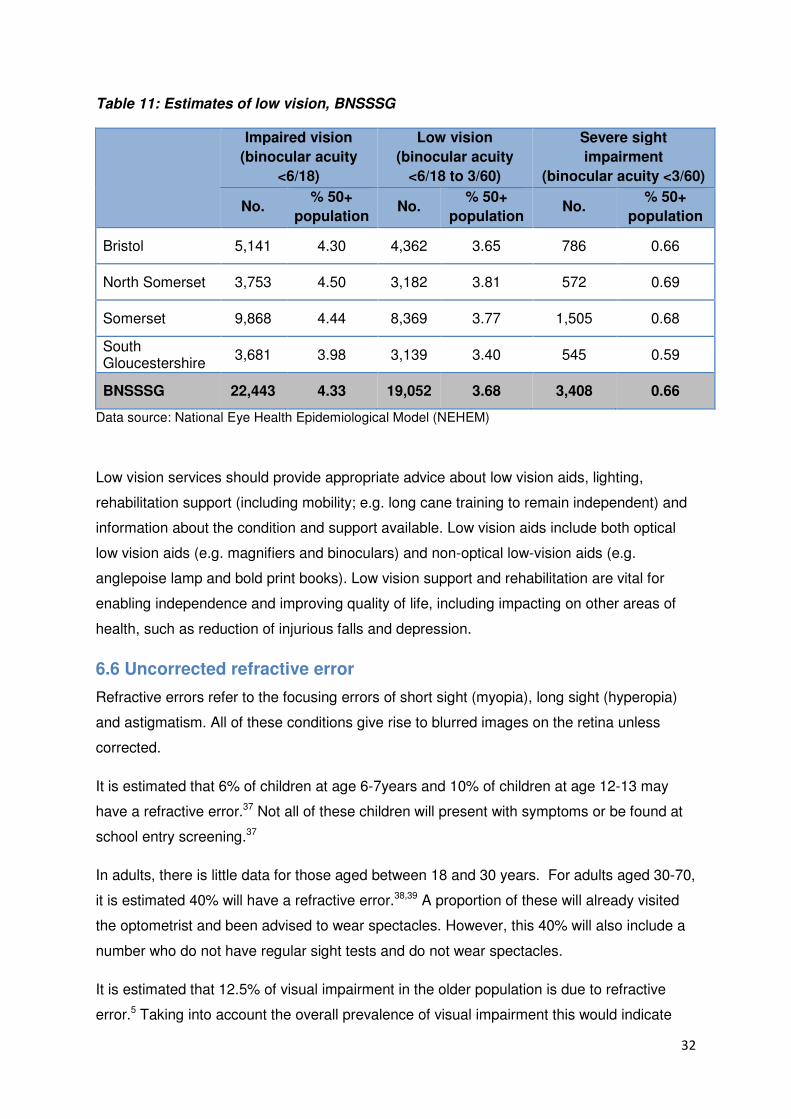
32
Table 11: Estimates of low vision, BNSSSG
Impaired vision
(binocular acuity
<6/18)
Low vision
(binocular acuity
<6/18 to 3/60)
Severe sight
impairment
(binocular acuity <3/60)
No. % 50+
population No.
% 50+
population No.
% 50+
population
Bristol 5,141 4.30 4,362 3.65 786 0.66
North Somerset 3,753 4.50 3,182 3.81 572 0.69
Somerset 9,868 4.44 8,369 3.77 1,505 0.68
South Gloucestershire
3,681 3.98 3,139 3.40 545 0.59
BNSSSG 22,443 4.33 19,052 3.68 3,408 0.66
Data source: National Eye Health Epidemiological Model (NEHEM)
Low vision services should provide appropriate advice about low vision aids, lighting,
rehabilitation support (including mobility; e.g. long cane training to remain independent) and
information about the condition and support available. Low vision aids include both optical
low vision aids (e.g. magnifiers and binoculars) and non-optical low-vision aids (e.g.
anglepoise lamp and bold print books). Low vision support and rehabilitation are vital for
enabling independence and improving quality of life, including impacting on other areas of
health, such as reduction of injurious falls and depression.
6.6 Uncorrected refractive error
Refractive errors refer to the focusing errors of short sight (myopia), long sight (hyperopia)
and astigmatism. All of these conditions give rise to blurred images on the retina unless
corrected.
It is estimated that 6% of children at age 6-7years and 10% of children at age 12-13 may
have a refractive error.37 Not all of these children will present with symptoms or be found at
school entry screening.37
In adults, there is little data for those aged between 18 and 30 years. For adults aged 30-70,
it is estimated 40% will have a refractive error.38,39 A proportion of these will already visited
the optometrist and been advised to wear spectacles. However, this 40% will also include a
number who do not have regular sight tests and do not wear spectacles.
It is estimated that 12.5% of visual impairment in the older population is due to refractive
error.5 Taking into account the overall prevalence of visual impairment this would indicate
33
that 2-7% have vision of less than 6/12 because they either don’t have or don’t wear
appropriate spectacles.
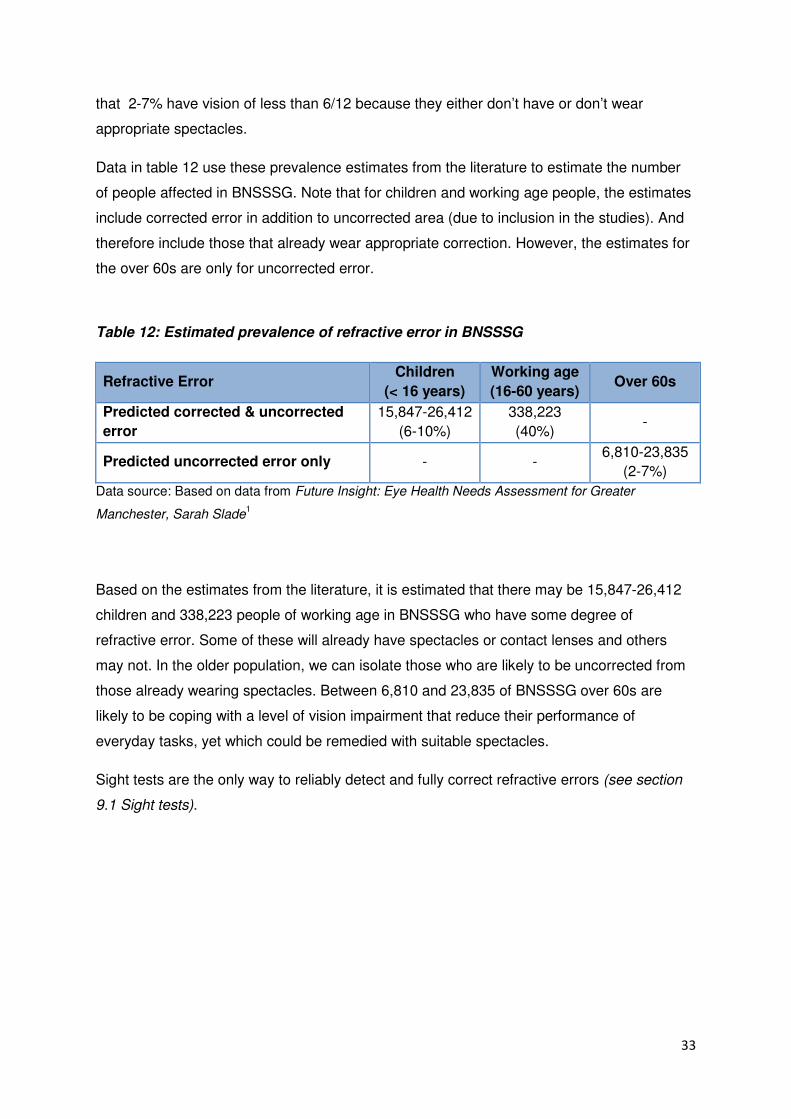
Data in table 12 use these prevalence estimates from the literature to estimate the number
of people affected in BNSSSG. Note that for children and working age people, the estimates
include corrected error in addition to uncorrected area (due to inclusion in the studies). And
therefore include those that already wear appropriate correction. However, the estimates for
the over 60s are only for uncorrected error.
Table 12: Estimated prevalence of refractive error in BNSSSG
Refractive Error Children
(< 16 years)
Working age
(16-60 years) Over 60s
Predicted corrected & uncorrected
error
15,847-26,412
(6-10%)
338,223
(40%) -
Predicted uncorrected error only - - 6,810-23,835
(2-7%)
Data source: Based on data from Future Insight: Eye Health Needs Assessment for Greater
Manchester, Sarah Slade1
Based on the estimates from the literature, it is estimated that there may be 15,847-26,412
children and 338,223 people of working age in BNSSSG who have some degree of
refractive error. Some of these will already have spectacles or contact lenses and others
may not. In the older population, we can isolate those who are likely to be uncorrected from
those already wearing spectacles. Between 6,810 and 23,835 of BNSSSG over 60s are
likely to be coping with a level of vision impairment that reduce their performance of
everyday tasks, yet which could be remedied with suitable spectacles.
Sight tests are the only way to reliably detect and fully correct refractive errors (see section
9.1 Sight tests).
34
7. Children and Young People
The information in this section is designed to give a brief overview of eye health in children
and children’s eye services. It is not intended to be a full review and should be
supplemented with local data.
Although incidence of visual impairment in children is low, the impact of such a condition is
high. The causes of vision impairment in childhood are generally different to the causes of
sight loss in adults. The four most common causes are: cerebral vision impairment, optic
nerve disorders, retinal or macular dystrophies and congenital cataracts. Children most at
risk of vision impairment are:
• Premature and low birth weight babies;
• Genetic eye conditions;
• Maternal infections (e.g. measles and rubella);
• Maternal alcohol and drug exposure;
• Maternal smoking;
• Children with learning disabilities.
Children with vision impairment have different needs from adults with sight loss. Significant
vision impairment can delay early childhood development and learning; including social
communication, mobility, and everyday living skills. Children with vision impairment are at
risk of poor outcomes across a range of emotional and social wellbeing indicators,40 which
can have an effect on adult life, limiting work opportunities.41 It can also have a major impact
on the wellbeing and coping capacities of the family. It is therefore vital that support is
provided from birth, throughout childhood and the transition into adulthood.35
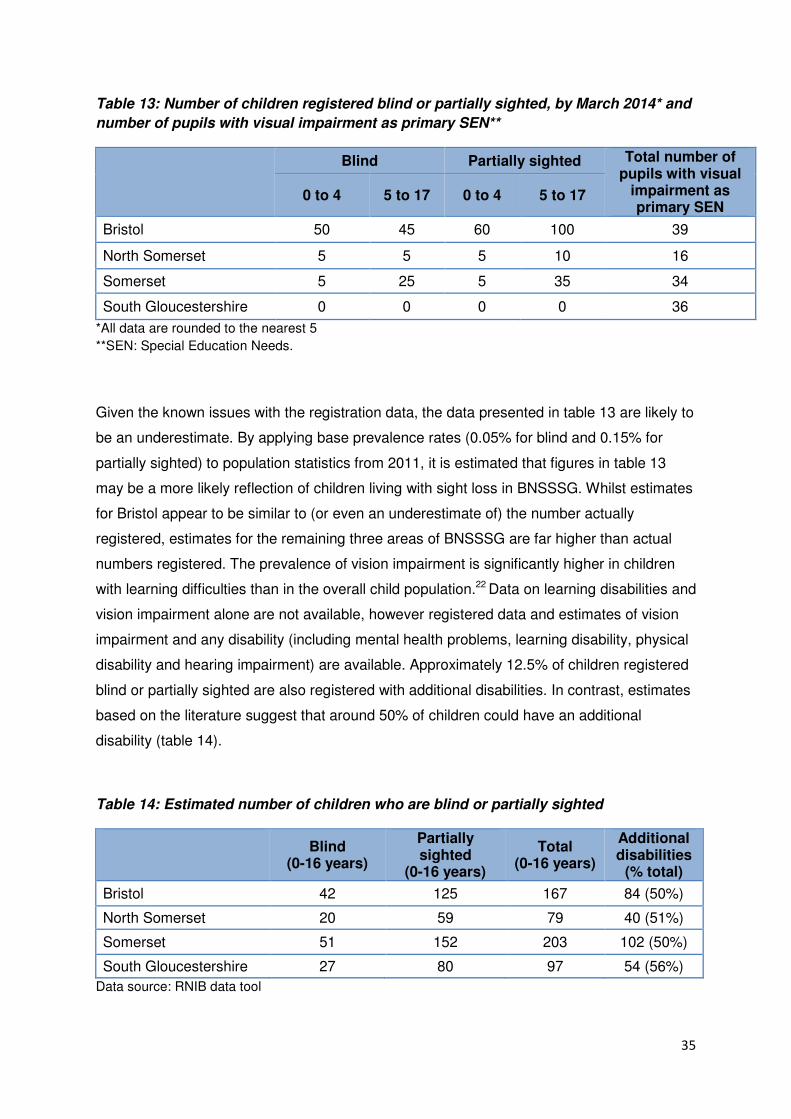
The number of children registered blind or partially sighted (rounded to the nearest 5), as of
March 2014 are shown in table 13. The table also presents data on children with special
education needs (SEN). Children with SEN who are known to visual impairment services are
recorded by the local authority. Data are presented on the number of pupils who are
recorded as having a primary SEN of visual impairment (as at January 2013).
35
Table 13: Number of children registered blind or partially sighted, by March 2014* and
number of pupils with visual impairment as primary SEN**
Blind Partially sighted Total number of pupils with visual
impairment as primary SEN
0 to 4 5 to 17 0 to 4 5 to 17
Bristol 50 45 60 100 39
North Somerset 5 5 5 10 16
Somerset 5 25 5 35 34
South Gloucestershire 0 0 0 0 36
*All data are rounded to the nearest 5
**SEN: Special Education Needs.
Given the known issues with the registration data, the data presented in table 13 are likely to
be an underestimate. By applying base prevalence rates (0.05% for blind and 0.15% for
partially sighted) to population statistics from 2011, it is estimated that figures in table 13
may be a more likely reflection of children living with sight loss in BNSSSG. Whilst estimates
for Bristol appear to be similar to (or even an underestimate of) the number actually
registered, estimates for the remaining three areas of BNSSSG are far higher than actual
numbers registered. The prevalence of vision impairment is significantly higher in children
with learning difficulties than in the overall child population.22 Data on learning disabilities and
vision impairment alone are not available, however registered data and estimates of vision
impairment and any disability (including mental health problems, learning disability, physical
disability and hearing impairment) are available. Approximately 12.5% of children registered
blind or partially sighted are also registered with additional disabilities. In contrast, estimates
based on the literature suggest that around 50% of children could have an additional
disability (table 14).
Table 14: Estimated number of children who are blind or partially sighted
Blind
(0-16 years)
Partially sighted
(0-16 years)
Total (0-16 years)
Additional disabilities
(% total)
Bristol 42 125 167 84 (50%)
North Somerset 20 59 79 40 (51%)
Somerset 51 152 203 102 (50%)
South Gloucestershire 27 80 97 54 (56%)
Data source: RNIB data tool
36
Early detection and treatment interventions are imperative to avoid preventable sight loss.
There are three key stages at which all children should be screened for ocular conditions
and vision impairment: the new-born examination; the 6 to 8 weeks review and the school-
entry vision check at the age of 4-5 years.35
37
8. Current Activities, Service Provision and Assets
This section gives a limited overview of service provision in BNSSSG. There is considerable
variation in local service provision and availability of relevant data. It is therefore intended
that local data should supplement this section (see section 8.4 for suggestions on additional
data).
8.1 Sight tests
Regular sight tests present an ideal opportunity to detect reduced vision and early signs of
eye disease so that corrective spectacles (if appropriate) or prompt treatment can be sought.
NHS sight tests are carried out by community optometrists under General Ophthalmic
Services. All people aged under 16 or under 19 years of age and in full-time education and
over 60 years of age are automatically entitled to NHS tests. Between these ages, NHS sight
tests may be obtained only if a person has diabetes or glaucoma or a close relative with
glaucoma or if they are in receipt of some government benefits e.g. tax or pension credits.
NHS sight tests currently account for an estimated 70% of all eye examinations.42
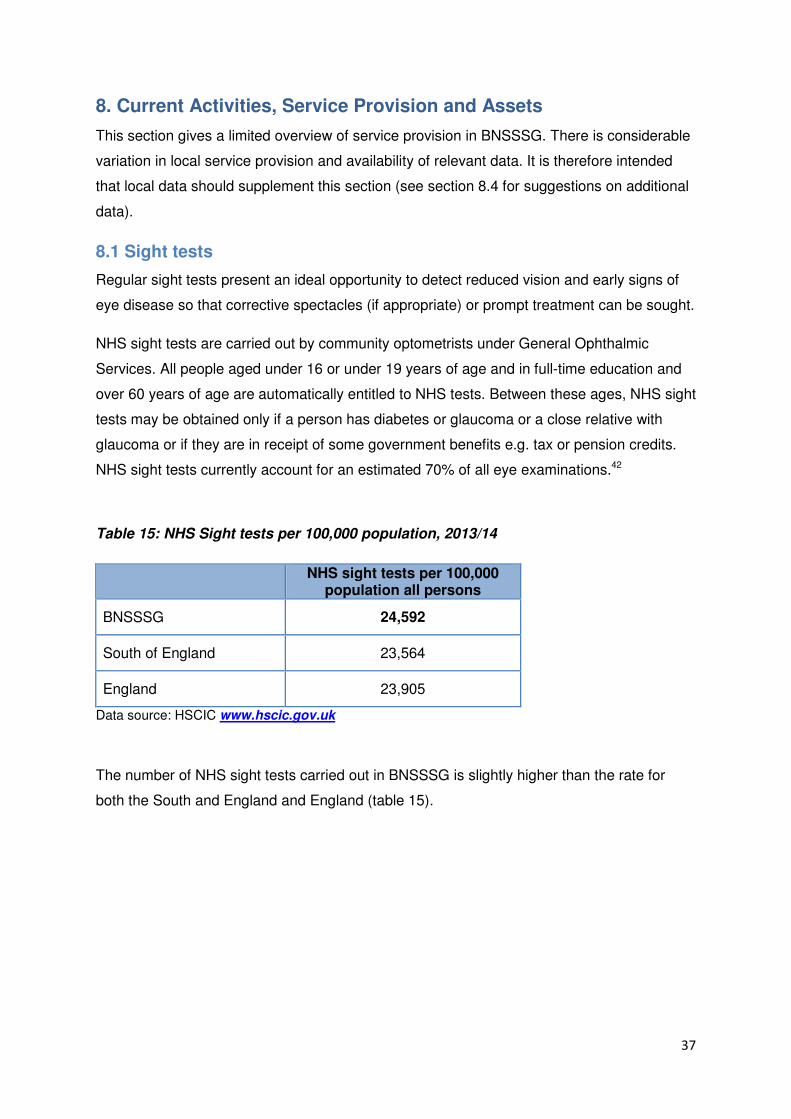
Table 15: NHS Sight tests per 100,000 population, 2013/14
NHS sight tests per 100,000
population all persons
BNSSSG 24,592
South of England 23,564
England 23,905
Data source: HSCIC www.hscic.gov.uk
The number of NHS sight tests carried out in BNSSSG is slightly higher than the rate for
both the South and England and England (table 15).
38
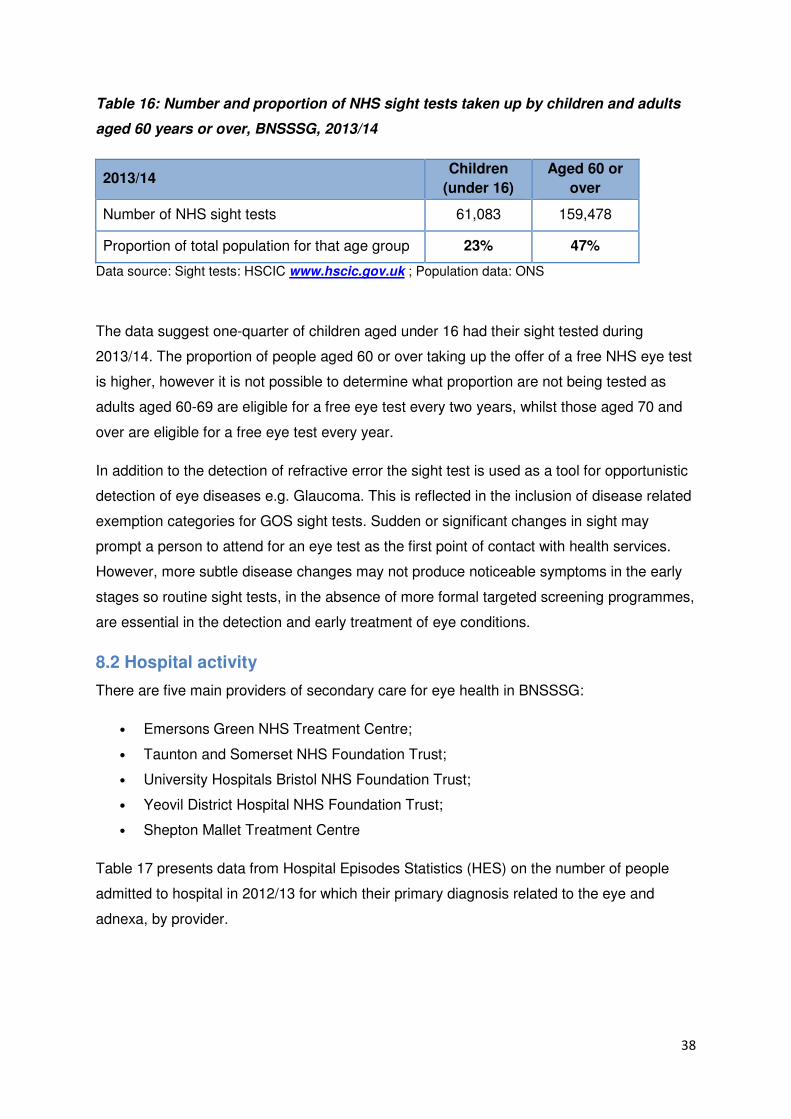
Table 16: Number and proportion of NHS sight tests taken up by children and adults
aged 60 years or over, BNSSSG, 2013/14
2013/14 Children
(under 16)
Aged 60 or
over
Number of NHS sight tests 61,083 159,478
Proportion of total population for that age group 23% 47%
Data source: Sight tests: HSCIC www.hscic.gov.uk ; Population data: ONS
The data suggest one-quarter of children aged under 16 had their sight tested during
2013/14. The proportion of people aged 60 or over taking up the offer of a free NHS eye test
is higher, however it is not possible to determine what proportion are not being tested as
adults aged 60-69 are eligible for a free eye test every two years, whilst those aged 70 and
over are eligible for a free eye test every year.
In addition to the detection of refractive error the sight test is used as a tool for opportunistic
detection of eye diseases e.g. Glaucoma. This is reflected in the inclusion of disease related
exemption categories for GOS sight tests. Sudden or significant changes in sight may
prompt a person to attend for an eye test as the first point of contact with health services.
However, more subtle disease changes may not produce noticeable symptoms in the early
stages so routine sight tests, in the absence of more formal targeted screening programmes,
are essential in the detection and early treatment of eye conditions.
8.2 Hospital activity
There are five main providers of secondary care for eye health in BNSSSG:
• Emersons Green NHS Treatment Centre;
• Taunton and Somerset NHS Foundation Trust;
• University Hospitals Bristol NHS Foundation Trust;
• Yeovil District Hospital NHS Foundation Trust;
• Shepton Mallet Treatment Centre
Table 17 presents data from Hospital Episodes Statistics (HES) on the number of people
admitted to hospital in 2012/13 for which their primary diagnosis related to the eye and
adnexa, by provider.
39
Table 17: Finished admission episodes with a primary diagnosis of ‘Diseases of the
eye and adnexa (H00-H59)’, by main providers in BNSSSG, 2012/13
Provider No. of episodes
Emersons Green 1251
Taunton and Somerset 3250
University Hospitals Bristol 7694
Yeovil District Hospital 1058
Shepton Mallet Treatment Centre 1557
Data source: Hospital Episodes Statistics, HSCIC
In-patient data can provide additional detail on characteristics of patients and equity of
access. This analysis has not been undertaken.
8.3 Primary care and community services
A survey43 has revealed that many GPs in the UK are not confident in detecting early signs
of major eye diseases. Just one third (34.1%) of respondents were confident in diagnosing
symptoms or signs of age-related macular degeneration, with only half of GPs confident in
diagnosing diabetic retinopathy (48.8%), glaucoma (51.2%) or refractive error (49.3%). It is
potentially possible to extract consultations relating to eye disease from general practice
systems, but this is not a part of this needs assessment.
Across BNSSSG, there are a number of community eyecare services available. A list of
these enhanced services is provided below, though not all are available in every CCG:
• Cataract Referral;
• Glaucoma Repeat Readings;
• Intra-Ocular Pressure (IOP) Referral;
• Ocular Hypertension (OHT) Monitoring;
• Acute Community Eyecare Services (ACES).
Details of these schemes can be included in local needs assessments.
8.4 Additional information and data
The following would be a useful supplement to this section, if available:
• Local data on trends in hospital use and characteristics of those accessing services.
ICD codes required: H00-H59;
40
• Outpatient data (may not be suitable; depends on coding);
• Enhanced services;
• Low vision;
• Childhood vision screening;
• General Practice (GP) data;
• Adult social care (e.g. rehabilitation, befriending service, housing);
• Community Optomoetry services: local optometrists can provide enhanced services,
usually negotiated through Local Optical Committees;
• Education support services;
• Voluntary sector (e.g. rehabilitation, advice, support, employment, welfare rights,
independence).
9. Patient voice
Within the confines of this report, it was not possible to conduct patient and public
consultation. It is recommended that patient views are gathered prior to any decision
making.
41
10. Recommendations/priorities
This report presents a rapid health needs assessment of eye health in Bristol, North
Somerset, Somerset and South Gloucestershire, produced over a relatively short time frame.
Further work is needed, particularly in identifying relevant data for hospital activity and
primary care and in understanding local services and pathways and the community voice
aspect. However, based on this report, some initial recommendations have been identified.
The primary recommendation is that each local areas uses the data presented in this
report to inform their Joint Strategic Needs Assessment (JSNA) with supplementary data
from local services.
From the data available, local areas should consider the following issues when
developing strategies and plans relating to eye health:
• Early detection is a priority. Provision and monitoring of effective schemes
promoting early detection, including promotion of regular eye sight tests and
awareness raising.
• Increasing ageing population on current service provision.
• Increase in diabetes on current service provision.
• Equity of access. This includes consideration of those living in deprived areas and
vulnerable groups, particularly those with learning disabilities.
• Good quality support services for those who have visual impairment and the
impact of visual impairment on their quality of life. This includes ensuring low vision
services offer a range of low vision options, e.g. lighting, low vision aids, rehabilitation
support and counselling. Additional consideration of co-morbidities linked to eye
health, e.g. reducing depression and social isolation.
• Mapping of eye health services (community, hospital, voluntary etc) to see how
they are being met and identify any gaps. Consideration of what models of service
delivery are needed.
• Identify areas of best practice to be shared locally and with the wider BNSSSG
network.
• Link with other relevant strategies and care pathways, e.g. falls, stroke.
42
11. Data sources
• Office for National Statistics population data
• RNIB data tool
• People registered as blind and partially sighted (HSCIC)
• Projecting Older People Population Information System (POPPI)
• Projecting Adult Needs and Service Information System (PANSI)
• Public Health Outcomes Framework (PHOF) tool
• Programme budgeting benchmarking tool
• Future Sightloss UK reports for RNIB
• National Eye Health Epidemiological Model (NEHEM)
• General Ophthalmic Services (GOS) Activity Statistics (HSCIC)
• Diabetic retinopathy screening uptake
• Certificate of Vision Impairment, Moorfields Eye Hospital
• Hospital Episodes Statistics Inpatient Data (HSCIC)
43
12. Acknowledgements
I would like to thank Susan Hamilton for her guidance and feedback throughout the
development of this report and Ian Longden and Chrissie Edwards for their support and
valuable input.
The following key documents have been used to support the development of this report and
should be acknowledged:
• UK Vision Strategy: Eye health and sight loss; statistics and information for
developing a Joint Strategic Needs Assessment;
• Eye Care Needs Assessment for Bristol, North Somerset and South Gloucestershire
(BNSSG), Sarah Scott, September 2012;
• Future Insight: Eye Health Needs Assessment for Greater Manchester, Sarah Slade;
• Eye Health Needs Assessments for Somerset;
• Eye Health Needs Assessments for Norfolk.
44
13. References
1. Slade S. Future Insight: Eye Health Needs Assessment Greater Manchester
2. Millodot M, Laby DM. Dictionary of ophthalmology. Woburn, MA: Reed Educational and
Professional Publishing Ltd, 2002.(Guideline Ref ID: MILLODOT2002)
3. Access Economics for the RNIB. (2009) Future Sight Loss UK(1): The economic impact
of partial sight and blindness in the UK adult population.
http://www.rnib.org.uk/aboutus/Research/reports/prevention/Pages/fsluk1.aspx
4. Eye Care. Available at: http://www.eyecare-information-
service.org.uk/disorders/drusen.html
5. Tate R, Smeeth L, Evans J, Fletcher A, Owen C, Rudnicka A, 2005. The Prevalence of
Visual Impairment in the UK: A Review of the Literature. RNIB.
6. Cavanagh S, Chadwick K. Health Needs Assessment: A Practical Guide. [online] 2005.
London: NICE. Available at:
http://www.gserve.nice.org.uk/nicemedia/documents/Health_Needs_Assessment_A_Pra
ctical_Guide.pdf
7. UK Vision Strategy. What is the Strategy? [online] Available at:
http://www.vision2020uk.org.uk/ukvisionstrategy/page.asp?section=278§ionTitle=W
hat+is+the+Strategy%3F. Accessed: 23/09/2014
8. Public Health England. Public Health Outcomes Framework. [online] Available at:
http://www.phoutcomes.info/. Accessed: 29/09/2014
9. UK Vision Strategy. Commissioning Guide for Eye Care and Sight Loss Services.
[online] Available at:
http://commissioningforeyecare.org.uk/commhome.asp?section=153§ionTitle=Effec
tive+eye+care+commissioning. Accessed: 29/09/2014
10. NICE. Quality, Innovation, Productivity and Prevention (QIPP). [online] Available at:
https://www.evidence.nhs.uk/qipp. Accessed: 29/09/2014
11. Busby D, 2004. ‘First Report of the National Eye Health Steering Group’ London:
Department of Health DH/Optical policy/Shadow SHA Gateway ref 3170
12. NHS England. Improving eye health and reducing sight loss – A ‘Call to Action’. [online]
Available at: http://www.england.nhs.uk/ourwork/qual-clin-lead/calltoaction/eye-cta/.
Accessed: 29/09/2014
13. Royal College of General Practitioner’s. Eye Health. [online] Available at:
http://www.rcgp.org.uk/clinical-and-research/clinical-priorities.aspx. Accessed:
29/09/2014
14. Vision 2020. [online] Available at: http://www.vision2020uk.org.uk/. Accessed:
29/09/2014
15. The College of Optometrists. Britain’s Eye Health in Focus: a snapshot of consumer
attitudes and behavior towards eye health. [online] 2013. Available at:
http://www.college-optometrists.org/en/utilities/document-
summary.cfm/docid/A60DE8E4-B6CF-49ED-8E0FE694FCF4B426. Accessed:
01/10/2014
16. Racette. L., Wilson, M.R., Zangwill, L.M., Weinreb, R.N., Sample, P.A. Primary open-
angle glaucoma in blacks: a review. Surv Ophthalmol. 2003; May-Jun; 48(3):295-313.
45
17. Wormald, R.P., Basauri, E. Wright, L.A., Evans, J.R. The African Caribbean Eye Survey:
risk factors for glaucoma in a sample of African Caribbean people living in London.
Eye.1994; 8(3):315-20.
18. Rughani, S. The Vital Role of Optometry in Disease Detection. Optometry Today. 2012;
March 9th 41-4.
19. Hogg, R. Healthy Lifestyle Equals Healthier Eyes. Optometry Today. 2012; April 6th 41-
4.
20. Fraser S, Bunce C, Wormald R, Brunner E. Deprivation and Late Presentation of
Glaucoma: Case-control Study. British Medical Journal. 2001; 322(7287) 639-643.
21. Douglas G, Corcoran C and Pavey S. Network 1000, Opinions and Circumstances of
Visually Impaired People in Britain. 2006. Visual Impairment Centre for Teaching and
Research (VICTAR) School of Education, University of Birmingham.
22. Emerson, E., Robertson, J. The estimated prevalence of visual impairment among
people with learning disabilities in the UK. [online] 2011. Available at:
https://www.rnib.org.uk/sites/default/files/Emerson%20report.pdf. Accessed: 24/10/2014
23. Royal National Institute for the Blind (RNIB). Across the spectrum: learning disability and
sight loss. [online] Available at: http://www.rnib.org.uk/services-we-offer-advice-
professionals-nb-magazine-health-professionals-nb-features/across-spectrum.
Accessed: 24/10/2014
24. Thomas Pocklington Trust. Dementia and serious sightloss. [online] 2007. Available at:
http://www.pocklington-
trust.org.uk/Resources/Thomas%20Pocklington/Documents/PDF/Research%20Publicati
ons/OP11.pdf. Accessed: 24/10/2014
25. Legood, R., Scuffham, P., Cryer, C. Are we blind to injuries in the visually impaired? A
review of the literature. Inj Prev. 2002; 8:155-160.
26. Scuffham PA, Legood R, Wilson E, Kennedy-Martin T. Incidence and Cost of Injurious
Falls Associated with Visual Impairment. Visual Impairment Research. 2002; 4 1-14
27. Evans, J.R., Fletcher, A.E., Wormald, R.P. Depression and anxiety in visually impaired
older people, Ophthalmology. 2007; 114(2):283-288.
28. RNIB. Sight loss: a public health priority. 2014. [online] Available at:
http://www.rnib.org.uk/sites/default/files/Sight_loss_a%20public_health_priority.pdf.
Accessed: 15/10/2014
29. MacIntosh, C. Stroke re-visited: visual problems following stroke and their effect on
rehabilitation. Br Orthopt J. 2003; 60, 10-14
30. Rowe FJ. Who sees visual impairment following a stroke. Strabismus. 2010;18(2), 37-
40
31. RNIB. Sight loss data tool v2 – guidance notes. [online] Available at:
http://www.rnib.org.uk/knowledge-and-research-hub-key-information-and-statistics/sight-
loss-data-tool. Accessed: 15/10/2014
32. Liew G, Michaelides M, Bunce C. A comparison of the causes of blindness certifications
in England and Wales in working age adults (16–64 years), 1999–2000 with 2009–2010.
BMJ Open. 2014. Available at: http://bmjopen.bmj.com/content/4/2/e004015.full.
Accessed: 24/10/2014
33. Diabetes UK. Number of people diagnosed with diabetes reaches 3.2 million. [online]
2014. Available at: http://www.diabetes.org.uk/About_us/News/Number-of-people-
diagnosed-with-diabetes-reaches-32-million/. Accessed: 22/10/2014
34. NHS Diabetic Eye Screening Programme. [online] Available at:
http://diabeticeye.screening.nhs.uk/. Accessed: 22/10/2014
46
35. UK Vision Strategy: Eye health and sight loss; statistics and information for developing a
Joint Strategic Needs Assessment. [online] 2013. Available at:
http://www.commissioningforeyecare.org.uk/commhome.asp?section=175§ionTitle=
Health+and+Wellbeing+Boards. Accessed: 22/10/2014
36. Evans JR, Fletcher AE, Wormald RP, NG ES, Stirling S, Smeeth L, Breeze E, Bulpitt
CJ, Nunes M, Jones D, Tulloch A. Prevalence of visual impairment in people aged 75
years and older in Britain: results from the MRC trial of assessment and management of
older people in the community. Br J Opthalmol. 2002; 86(7):795-800
37. O’Donoghue L, McClelland JF, Logan NS, Rudnicka AR, Owen CG, Saunders KJ.
Refractive Error and Visual Impairment in School Children in Northern Ireland” British
Journal of Ophthalmology. 2010; doi10.1136/bjo2009.176040
38. Bourne RR, Dineen BP, Ali SM, Noorul Hug DM, Johnson CJ. Prevalence of Refractive
Error in Bangladeshi Adults: Results of the National Blindness and Low Vision Survey of
Bangladesh. Ophthalmology. 2004; 111(6) 1150-60
39. Hyams SW, Pokotilo E, Shkurko G. Prevalence of Refractive Errors in Adults Over 40: A
Survey of 8102 Eyes. British Journal of Ophthalmology. 1977; 61 428-48
40. Harris J, Keil S, Lord C and McManus S. Sight impaired at age seven: Secondary
analysis of the Millennium Cohort Study. 2012. RLSB, RNIB and NatCen Social
Research.
41. McManus S and Lord C. Circumstances of people with sight loss:secondary analysis of
Understanding Society and the Life Opportunities Survey. 2012. Natcen report for RNIB.
42. Optical Confederation. Optics at a Glance. [online] London: December 2011. Available
at: www.fodo.com
43. Royal College of General Practitioners. RCGP working to improve GP eye care
knowledge after survey reveals low GP confidence in diagnosing major eye conditions.
[online] 25/09/2014. Available at: http://www.rcgp.org.uk/news/2014/september/rcgp-
working-to-improve-gp-eye-care-knowledge.aspx Accessed: 24/10/2014
47
Appendix 1: Supplementary data
POPULATION CHARACTERISTICS AND HEALTH DETERMINANTS
Figure 1: Percentage population split by age in a) 2014 and b) 2030 compared with
England average (bold outlines). Data from ONS.
A. Bristol
B. North Somerset
C. Somerset
0.0 2.0 4.0 6.0 8.0 10.0 12.0
90+85 to 8980 to 8475 to 7970 to 7465 to 6960 to 6455 to 5950 to 5445 to 4940 to 4435 to 3930 to 3425 to 2920 to 2415 to 1910 to 14
5 to 90 to 4
%
Age
grou
p (y
ears
)
2014
0.0 2.0 4.0 6.0 8.0 10.0 12.0
90+85-8980-8475-7970-7465-6960-6455-5950-5445-4940-4435-3930-3425-2920-2415-1910-14
5-90-4
%
Age
grou
p (y
ears
)
2030
0 2 4 6 8
90+85-8980-8475-7970-7465-6960-6455-5950-5445-4940-4435-3930-3425-2920-2415-1910-14
5-90-4
%
Age
grou
p (y
ears
)
2030
0 2 4 6 8
90+85 to 8980 to 8475 to 7970 to 7465 to 6960 to 6455 to 5950 to 5445 to 4940 to 4435 to 3930 to 3425 to 2920 to 2415 to 1910 to 14
5 to 90 to 4
%
Age
grou
p (y
ears
)
2014
48
D. South Gloucestershire
0 2 4 6 8
90 and over85 to 8980 to 8475 to 7970 to 7465 to 6960 to 6455 to 5950 to 5445 to 4940 to 4435 to 3930 to 3425 to 2920 to 2415 to 1910 to 14
5 to 90 to 4
%
Age
grou
p (y
ears
)2014
0 2 4 6 8
90+85-8980-8475-7970-7465-6960-6455-5950-5445-4940-4435-3930-3425-2920-2415-1910-14
5-90-4
%
Age
grou
p (y
ears
)
2030
0 2 4 6 8 10
90 and over85 to 8980 to 8475 to 7970 to 7465 to 6960 to 6455 to 5950 to 5445 to 4940 to 4435 to 3930 to 3425 to 2920 to 2415 to 1910 to 14
5 to 90 to 4
%
Age
grou
p (y
ears
)
2014
0 2 4 6 8
90+85-8980-8475-7970-7465-6960-6455-5950-5445-4940-4435-3930-3425-2920-2415-1910-14
5-90-4
%
Age
grou
p (y
ears
)
2030
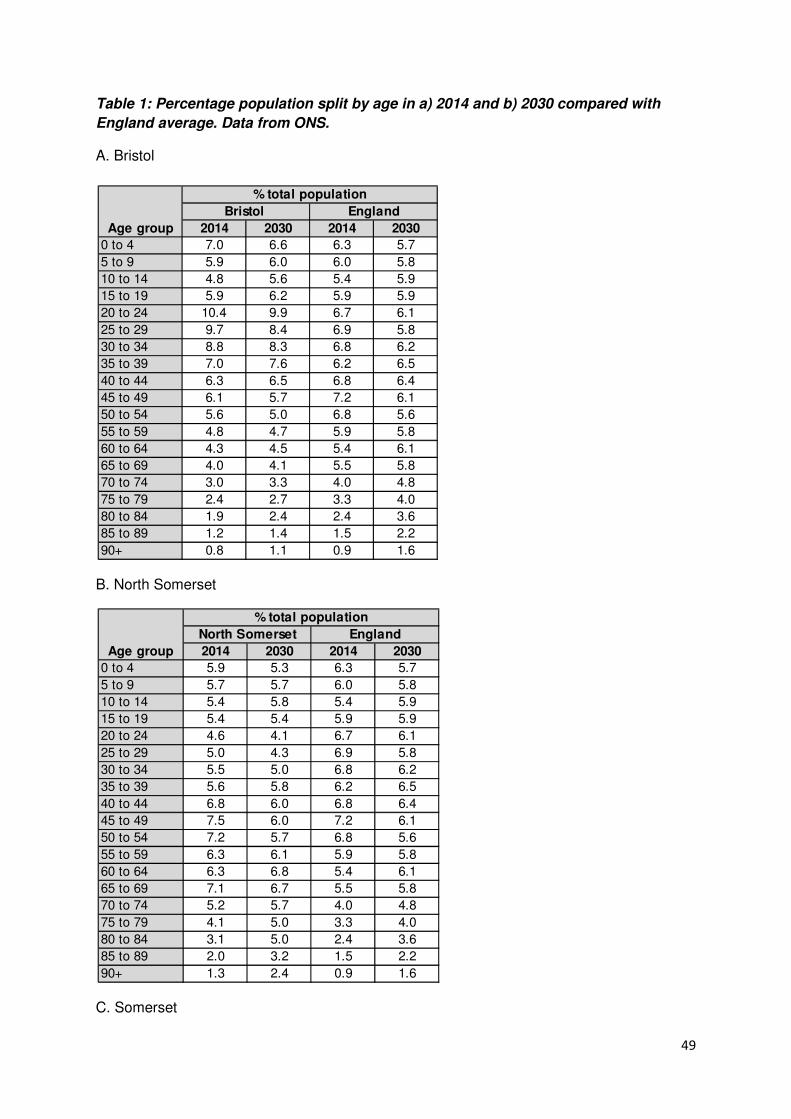
49
Table 1: Percentage population split by age in a) 2014 and b) 2030 compared with
England average. Data from ONS.
A. Bristol
B. North Somerset
C. Somerset
2014 2030 2014 2030
0 to 4 7.0 6.6 6.3 5.7
5 to 9 5.9 6.0 6.0 5.8
10 to 14 4.8 5.6 5.4 5.9
15 to 19 5.9 6.2 5.9 5.9
20 to 24 10.4 9.9 6.7 6.1
25 to 29 9.7 8.4 6.9 5.8
30 to 34 8.8 8.3 6.8 6.2
35 to 39 7.0 7.6 6.2 6.5
40 to 44 6.3 6.5 6.8 6.4
45 to 49 6.1 5.7 7.2 6.1
50 to 54 5.6 5.0 6.8 5.6
55 to 59 4.8 4.7 5.9 5.8
60 to 64 4.3 4.5 5.4 6.1
65 to 69 4.0 4.1 5.5 5.8
70 to 74 3.0 3.3 4.0 4.8
75 to 79 2.4 2.7 3.3 4.0
80 to 84 1.9 2.4 2.4 3.6
85 to 89 1.2 1.4 1.5 2.2
90+ 0.8 1.1 0.9 1.6
Bristol England
% total population
Age group
2014 2030 2014 2030
0 to 4 5.9 5.3 6.3 5.7
5 to 9 5.7 5.7 6.0 5.8
10 to 14 5.4 5.8 5.4 5.9
15 to 19 5.4 5.4 5.9 5.9
20 to 24 4.6 4.1 6.7 6.1
25 to 29 5.0 4.3 6.9 5.8
30 to 34 5.5 5.0 6.8 6.2
35 to 39 5.6 5.8 6.2 6.5
40 to 44 6.8 6.0 6.8 6.4
45 to 49 7.5 6.0 7.2 6.1
50 to 54 7.2 5.7 6.8 5.6
55 to 59 6.3 6.1 5.9 5.8
60 to 64 6.3 6.8 5.4 6.1
65 to 69 7.1 6.7 5.5 5.8
70 to 74 5.2 5.7 4.0 4.8
75 to 79 4.1 5.0 3.3 4.0
80 to 84 3.1 5.0 2.4 3.6
85 to 89 2.0 3.2 1.5 2.2
90+ 1.3 2.4 0.9 1.6
% total population
North Somerset England
Age group
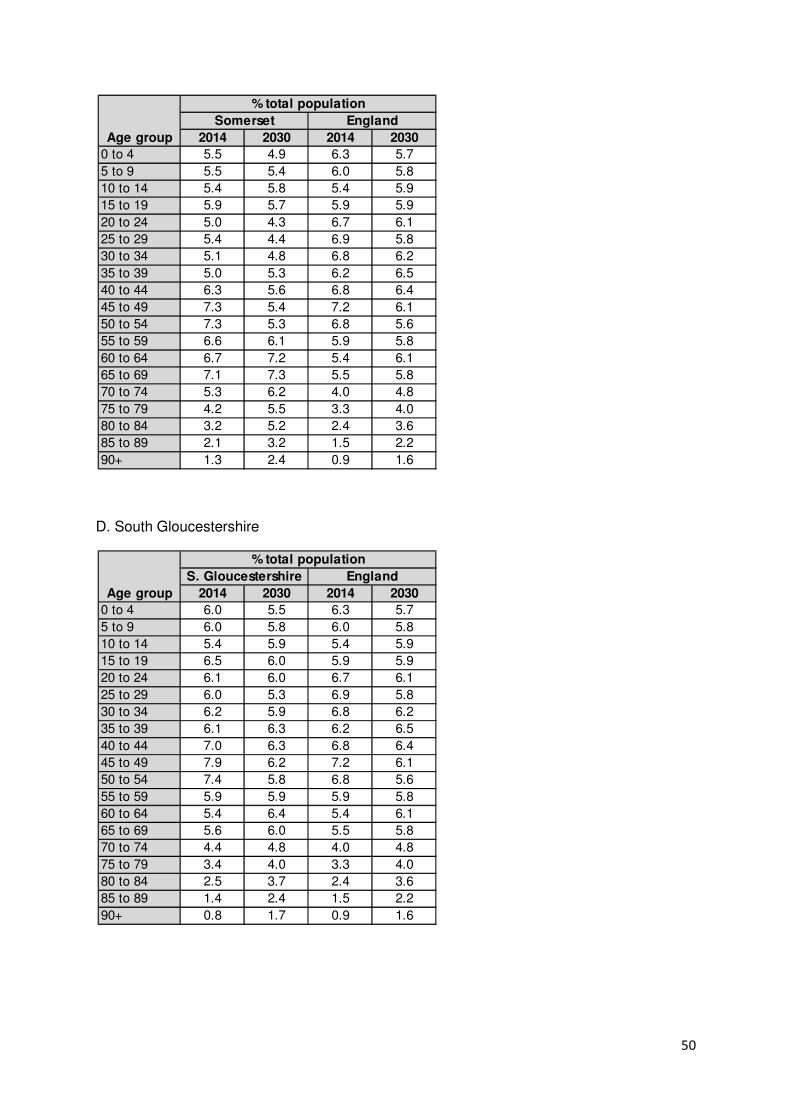
50
D. South Gloucestershire
2014 2030 2014 2030
0 to 4 5.5 4.9 6.3 5.7
5 to 9 5.5 5.4 6.0 5.8
10 to 14 5.4 5.8 5.4 5.9
15 to 19 5.9 5.7 5.9 5.9
20 to 24 5.0 4.3 6.7 6.1
25 to 29 5.4 4.4 6.9 5.8
30 to 34 5.1 4.8 6.8 6.2
35 to 39 5.0 5.3 6.2 6.5
40 to 44 6.3 5.6 6.8 6.4
45 to 49 7.3 5.4 7.2 6.1
50 to 54 7.3 5.3 6.8 5.6
55 to 59 6.6 6.1 5.9 5.8
60 to 64 6.7 7.2 5.4 6.1
65 to 69 7.1 7.3 5.5 5.8
70 to 74 5.3 6.2 4.0 4.8
75 to 79 4.2 5.5 3.3 4.0
80 to 84 3.2 5.2 2.4 3.6
85 to 89 2.1 3.2 1.5 2.2
90+ 1.3 2.4 0.9 1.6
Age group
% total population
Somerset England
2014 2030 2014 2030
0 to 4 6.0 5.5 6.3 5.7
5 to 9 6.0 5.8 6.0 5.8
10 to 14 5.4 5.9 5.4 5.9
15 to 19 6.5 6.0 5.9 5.9
20 to 24 6.1 6.0 6.7 6.1
25 to 29 6.0 5.3 6.9 5.8
30 to 34 6.2 5.9 6.8 6.2
35 to 39 6.1 6.3 6.2 6.5
40 to 44 7.0 6.3 6.8 6.4
45 to 49 7.9 6.2 7.2 6.1
50 to 54 7.4 5.8 6.8 5.6
55 to 59 5.9 5.9 5.9 5.8
60 to 64 5.4 6.4 5.4 6.1
65 to 69 5.6 6.0 5.5 5.8
70 to 74 4.4 4.8 4.0 4.8
75 to 79 3.4 4.0 3.3 4.0
80 to 84 2.5 3.7 2.4 3.6
85 to 89 1.4 2.4 1.5 2.2
90+ 0.8 1.7 0.9 1.6
Age group
% total population
S. Gloucestershire England
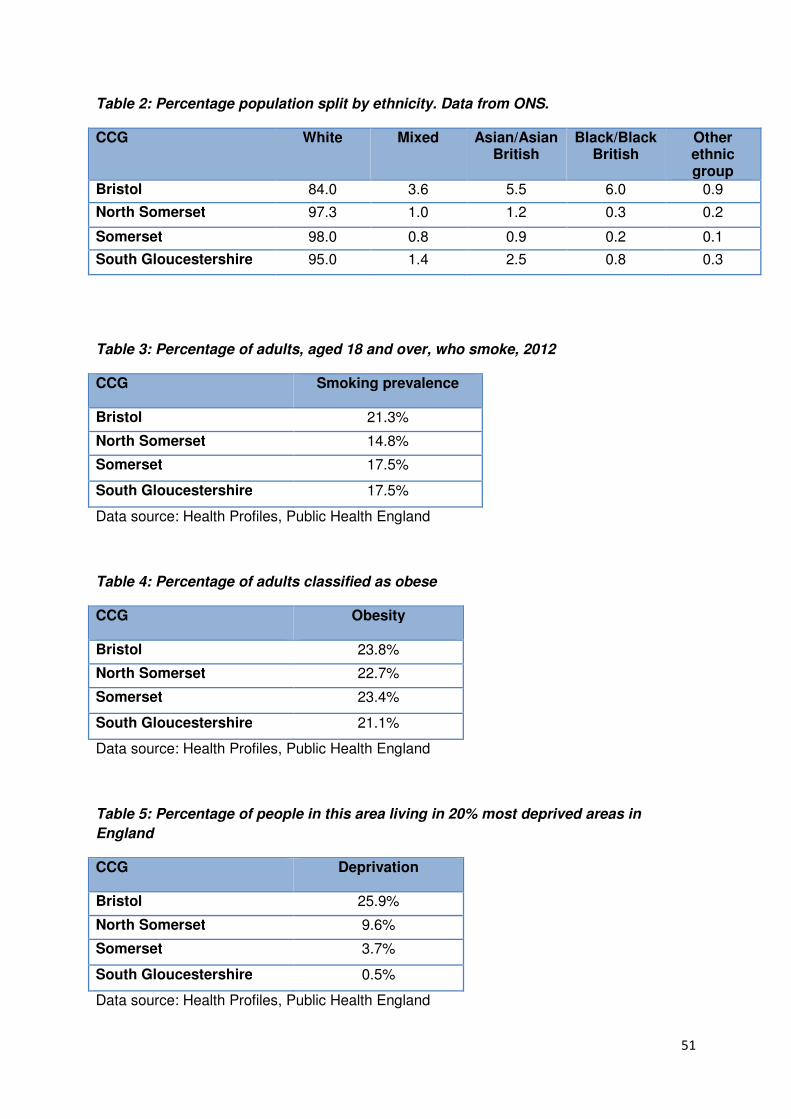
51
Table 2: Percentage population split by ethnicity. Data from ONS.
CCG White Mixed Asian/Asian British
Black/Black British
Other ethnic group
Bristol 84.0 3.6 5.5 6.0 0.9
North Somerset 97.3 1.0 1.2 0.3 0.2
Somerset 98.0 0.8 0.9 0.2 0.1
South Gloucestershire 95.0 1.4 2.5 0.8 0.3
Table 3: Percentage of adults, aged 18 and over, who smoke, 2012
CCG Smoking prevalence
Bristol 21.3%
North Somerset 14.8%
Somerset 17.5%
South Gloucestershire 17.5%
Data source: Health Profiles, Public Health England
Table 4: Percentage of adults classified as obese
CCG Obesity
Bristol 23.8%
North Somerset 22.7%
Somerset 23.4%
South Gloucestershire 21.1%
Data source: Health Profiles, Public Health England
Table 5: Percentage of people in this area living in 20% most deprived areas in
England
CCG Deprivation
Bristol 25.9%
North Somerset 9.6%
Somerset 3.7%
South Gloucestershire 0.5%
Data source: Health Profiles, Public Health England
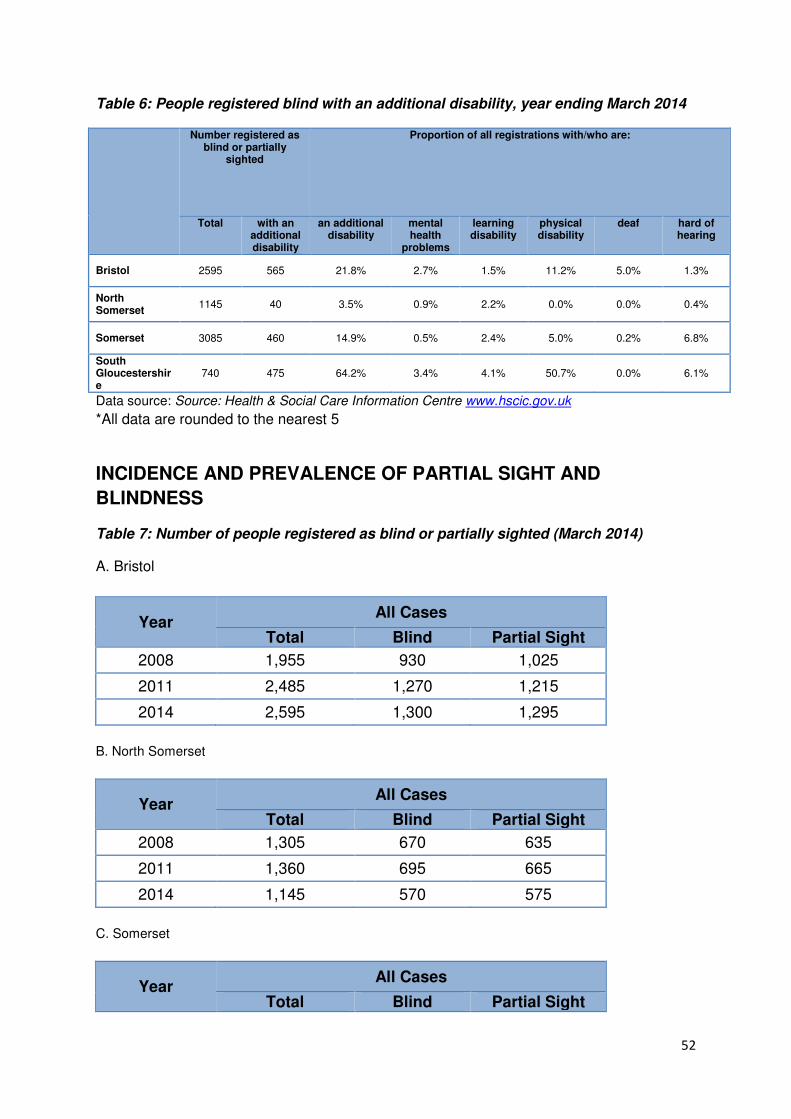
52
Table 6: People registered blind with an additional disability, year ending March 2014
Number registered as blind or partially
sighted
Proportion of all registrations with/who are:
Total with an additional disability
an additional disability
mental health
problems
learning disability
physical disability
deaf hard of hearing
Bristol 2595 565 21.8% 2.7% 1.5% 11.2% 5.0% 1.3%
North Somerset
1145 40 3.5% 0.9% 2.2% 0.0% 0.0% 0.4%
Somerset 3085 460 14.9% 0.5% 2.4% 5.0% 0.2% 6.8%
South Gloucestershire
740 475 64.2% 3.4% 4.1% 50.7% 0.0% 6.1%
Data source: Source: Health & Social Care Information Centre www.hscic.gov.uk
*All data are rounded to the nearest 5
INCIDENCE AND PREVALENCE OF PARTIAL SIGHT AND
BLINDNESS
Table 7: Number of people registered as blind or partially sighted (March 2014)
A. Bristol
Year All Cases
Total Blind Partial Sight
2008 1,955 930 1,025
2011 2,485 1,270 1,215
2014 2,595 1,300 1,295
B. North Somerset
Year All Cases
Total Blind Partial Sight
2008 1,305 670 635
2011 1,360 695 665
2014 1,145 570 575
C. Somerset
Year All Cases
Total Blind Partial Sight
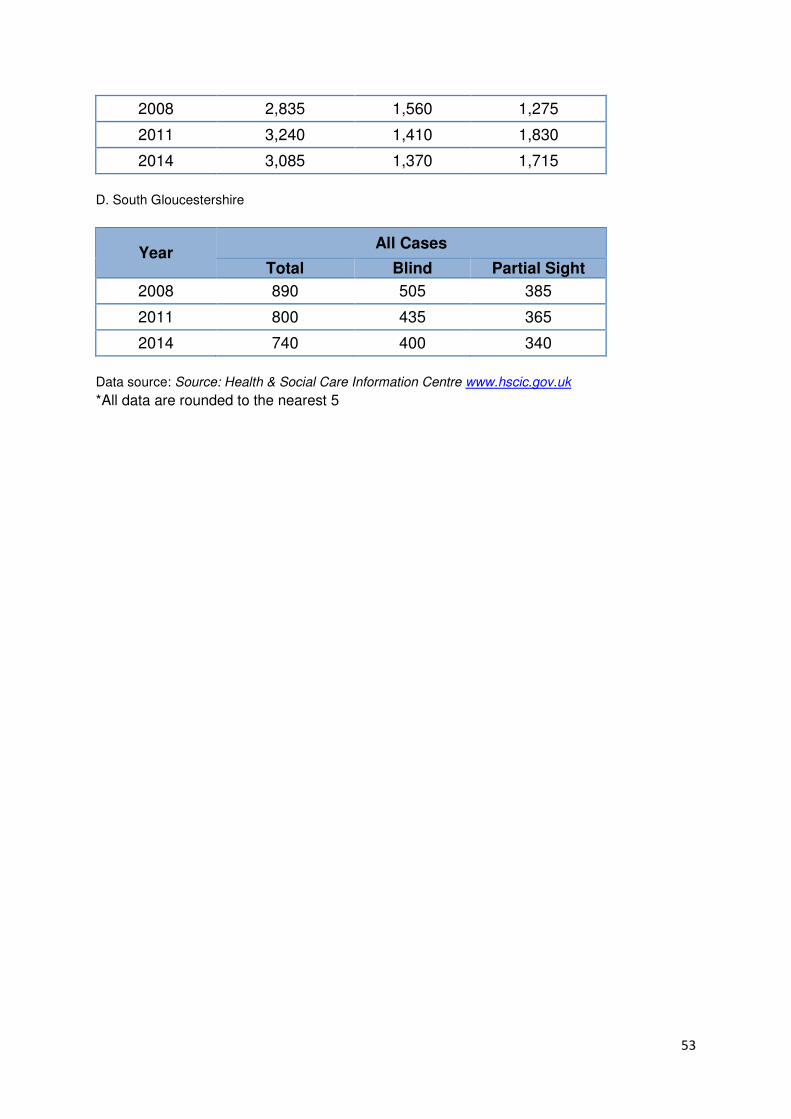
53
2008 2,835 1,560 1,275
2011 3,240 1,410 1,830
2014 3,085 1,370 1,715
D. South Gloucestershire
Year All Cases
Total Blind Partial Sight
2008 890 505 385
2011 800 435 365
2014 740 400 340
Data source: Source: Health & Social Care Information Centre www.hscic.gov.uk
*All data are rounded to the nearest 5
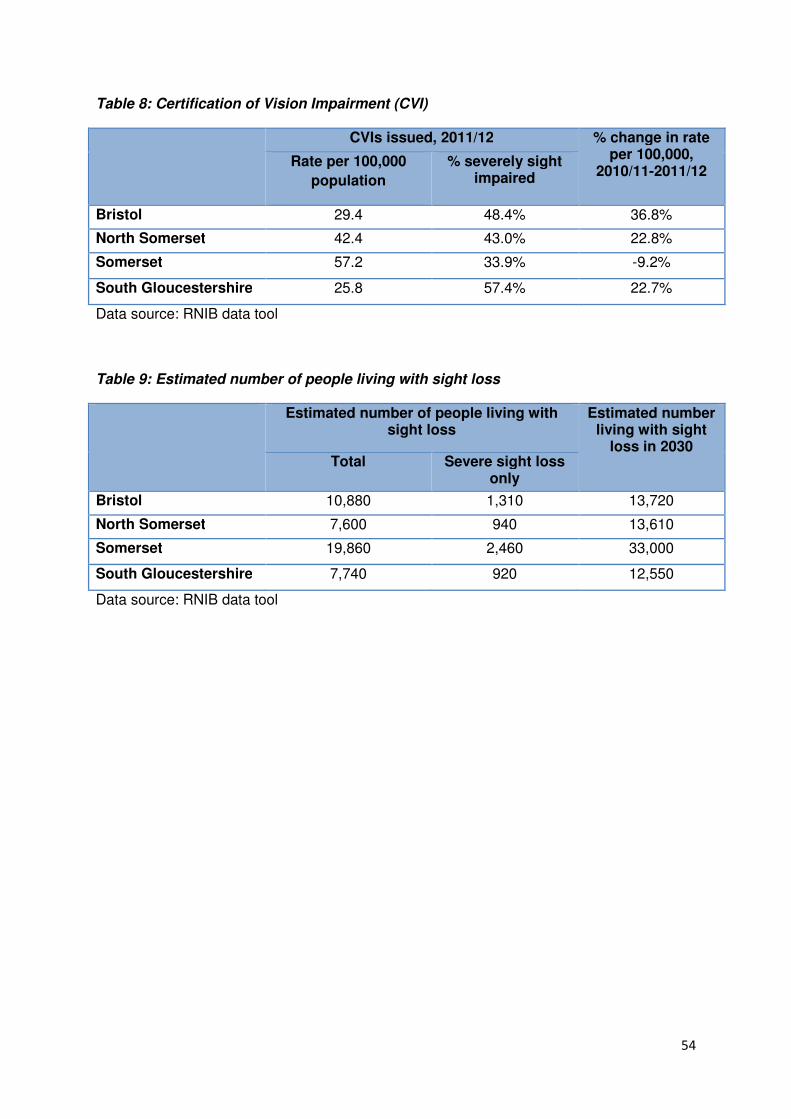
54
Table 8: Certification of Vision Impairment (CVI)
CVIs issued, 2011/12 % change in rate per 100,000,
2010/11-2011/12 Rate per 100,000
population
% severely sight impaired
Bristol 29.4 48.4% 36.8%
North Somerset 42.4 43.0% 22.8%
Somerset 57.2 33.9% -9.2%
South Gloucestershire 25.8 57.4% 22.7%
Data source: RNIB data tool
Table 9: Estimated number of people living with sight loss
Estimated number of people living with sight loss
Estimated number living with sight
loss in 2030 Total Severe sight loss
only
Bristol 10,880 1,310 13,720
North Somerset 7,600 940 13,610
Somerset 19,860 2,460 33,000
South Gloucestershire 7,740 920 12,550
Data source: RNIB data tool
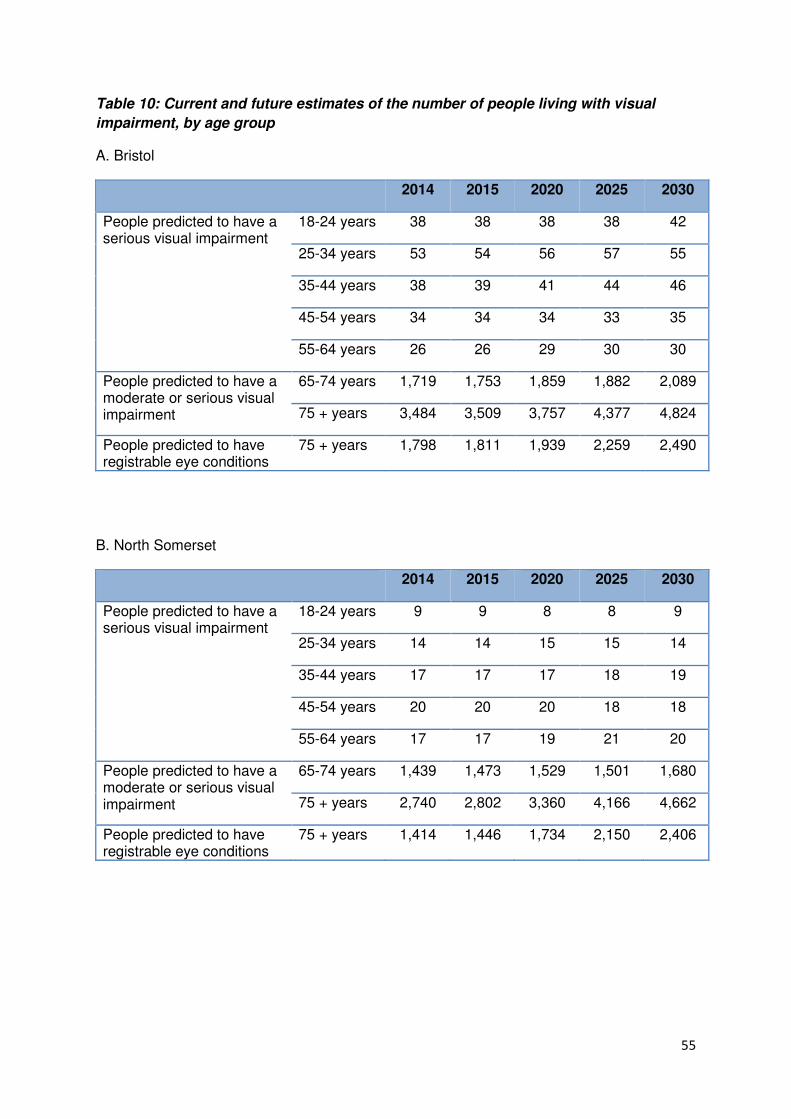
55
Table 10: Current and future estimates of the number of people living with visual
impairment, by age group
A. Bristol
2014 2015 2020 2025 2030
People predicted to have a serious visual impairment
18-24 years 38 38 38 38 42
25-34 years 53 54 56 57 55
35-44 years 38 39 41 44 46
45-54 years 34 34 34 33 35
55-64 years 26 26 29 30 30
People predicted to have a moderate or serious visual impairment
65-74 years 1,719 1,753 1,859 1,882 2,089
75 + years 3,484 3,509 3,757 4,377 4,824
People predicted to have registrable eye conditions
75 + years 1,798 1,811 1,939 2,259 2,490
B. North Somerset
2014 2015 2020 2025 2030
People predicted to have a serious visual impairment
18-24 years 9 9 8 8 9
25-34 years 14 14 15 15 14
35-44 years 17 17 17 18 19
45-54 years 20 20 20 18 18
55-64 years 17 17 19 21 20
People predicted to have a moderate or serious visual impairment
65-74 years 1,439 1,473 1,529 1,501 1,680
75 + years 2,740 2,802 3,360 4,166 4,662
People predicted to have registrable eye conditions
75 + years 1,414 1,446 1,734 2,150 2,406
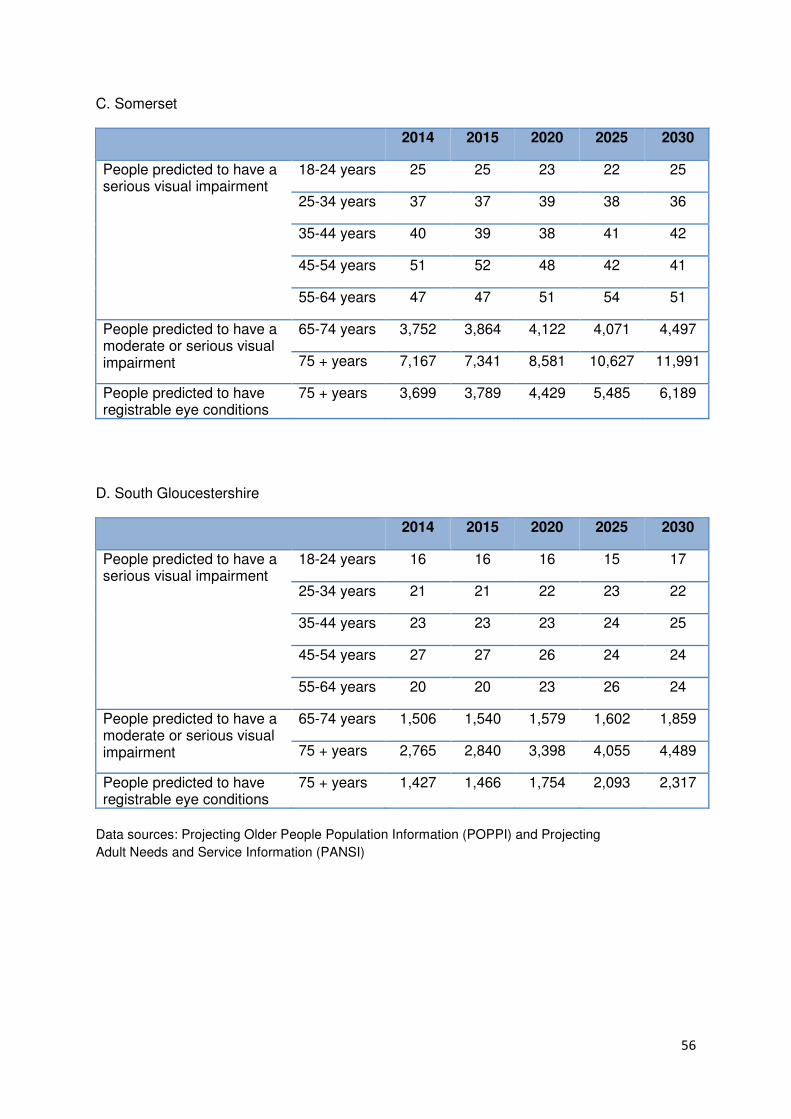
56
C. Somerset
2014 2015 2020 2025 2030
People predicted to have a serious visual impairment
18-24 years 25 25 23 22 25
25-34 years 37 37 39 38 36
35-44 years 40 39 38 41 42
45-54 years 51 52 48 42 41
55-64 years 47 47 51 54 51
People predicted to have a moderate or serious visual impairment
65-74 years 3,752 3,864 4,122 4,071 4,497
75 + years 7,167 7,341 8,581 10,627 11,991
People predicted to have registrable eye conditions
75 + years 3,699 3,789 4,429 5,485 6,189
D. South Gloucestershire
2014 2015 2020 2025 2030
People predicted to have a serious visual impairment
18-24 years 16 16 16 15 17
25-34 years 21 21 22 23 22
35-44 years 23 23 23 24 25
45-54 years 27 27 26 24 24
55-64 years 20 20 23 26 24
People predicted to have a moderate or serious visual impairment
65-74 years 1,506 1,540 1,579 1,602 1,859
75 + years 2,765 2,840 3,398 4,055 4,489
People predicted to have registrable eye conditions
75 + years 1,427 1,466 1,754 2,093 2,317
Data sources: Projecting Older People Population Information (POPPI) and Projecting
Adult Needs and Service Information (PANSI)