eye care visits and use of eyeglasses or contact lenses, united
TRANSCRIPT
e
-a DHHS Publication No. (PHS) 64-1573
U.S. Department of Health and Humanservices
PubIii Heatth Senfice
NationalCenter for Health Statistics
=
Hyattsville, Md.February 1964
For sale by the Superintendent of Documents, u.S. (government Printing Otl.ice,Washington, D.C. 20402
Eye Care Visitsand Use ofEyc@8sses orContact LensesunitedStat%sj1979and 1980
Statistics are presented on the volume andfrequency of visits for eye care, place of
visit, and type of specialist seen, by age,
sex, race, family income, education of head
of family, place of residence, andgeographic region. These estimates are
based on data col!ected in interviews during1979. In addiion, statistics are presented on
the propo~ of persons with glasses or
contact lenses during 1979 and 1960 byage, sex, race, Hispanic origin, geographicregion, place of residence, education of
head of family, education of the individual,
occupation, and family income. Trends inthe use of eyeglasses and contact lenses
also are shown starting in fiscal year 1966.
IMa From the Ndond HealthSurveyseries 10, NO. 145
.—
Allma4aM appearinginthsreportiain thepublic dwnain and mayberWf@J@d~~QP@m_: -~aatoa ouma,howavef,is
National Center forHealth Statktii, G.S. Poe: Eye care visitsand use ofq@aaaeaor lwntectlenaea,united statea, 1979andlsso. VitalamlmSfafls?& Setiea 10, No. 145. DHHS Pub. No. (PHS) 64-1573. [email protected]. [email protected]. 1964.
Poe, Gail S.Eye care visitsand use of eyaglaaaaaor contactIaneea,UnitedStatas,
1979 and 1960.
(Vii and healthat$iatica.Series 10, Data fromthe nationalhealthaurvay;no. 145) (DHHS pub.;no. 10-145)
Includesbib@r@oai rafarenfxs.1. Eye+Maawm and Macta-United Stataa+Natiatica. 2. Eyegtaasee—
unitedstat~. 3. Contactlaaeee-Unitad SMea-SMwioa. 4.physicianeemicaaU61ii nitedSt~atk!a. 5. optometriata-
Jhlkl ~i. 6. Healthwwye-ww states. 7. united Stat&ii,-. L Natii canter for HealthStatMi@ (Us.) Il. Ttle. Ill. series.Iv:SariesDHHspubhtiq no.10-145.RA407.3.A346no. 145 312.0973s SMOOG65[RE24.K$] [312.304770s73]ISSN0+406-0267-1
National Center for Health Statistics
Manning Feinleib, M. D., Dr. P. H., Director
Robert A. Israel, Deputy Director
Jacob J. Feldman, Ph. D., Associate Director for Analysis and
Epidemiology
Garrie J. Losee, Associate Director for Data Processing and
Services
Alvan O. Zarate, Ph. D., Assistant Director for International
Statistics
E. Earl Bryant, Associate Director for Interview and Examination
Statistics
Robert L. Quave, Acting Associate Director for Management
Gail F. Fisher, Ph. D., Acting Associate Director for Program
Planning, Evaluation, and Coordination
Monroe G. Sirken, Ph. D., Associate Director for Research and
Methodology
Peter L. Hurley, Associate Director for Vital and Health Care
Statistics
Alice Haywood, Information Of/icer
Interview and Examination Statistics Program
E. Earl Bryant, Associate Director
Mary Grace Kovar, Dr.P.H., Special Assistant for Data Policy and
Analysis
Paul D. Williams, Chief Data Applications and Research Sta&
Dtision of Health Interview Statistics
Robert R. Fuchsberg, Director
Owen T. Thombeny, Jr., Ph. D., Deputy Director
Clinton E. Bumham, Chief, Illness and Disability Statistics Branch
‘ Robert A. Wright, Chief Utilization and Expenditure Statistics
Branch
Stewart C. Rice, Jr., Chief Survey Planning and Development
Branch
Nelma B. Keen, Chief, Computer Systems and Programming Staff
Cooperation of the U.S. Bureau of the CensusUnder the legislation establishing the National Health Interview Suwey,
the Public Health Service is authorized to use, insofar as possible, theservices or facilities of other Federal, State, or private agencies.
In accordance with specifications established by the Division of HealthInterview Statistics, the Bureau of the Census, under a contractualarrangement, participated in planning the survey and collecting the data.
AcknowledgementsThe number of persons who made major contributions to the survey
design, data collection, and processing procedures resulting in this reportare too numerous to mention. However, the author wishes to acknowledgethat the writing of this report is only one step, among many other equallyimportant steps, in the overall pnxess leading to the presentation of thesedata.
Contents
Introduction ., . .,,....,. . . . . . . . . . . . . . . . . . . . . . . . . . . . . . . . . . . . . . . . . ...1
Sourceandlimitationsofthedata . . . . . . . . . . . . . . . . . . . . . . . . . . . . . . . . . . . . . . . . . . , . 2
Findings . . . . . . . . . . . . . . . . . . . . . . . . . . . . . . . . . . . . . . . . . . . . . . . . . . . . . . ...4Eyecare ., . . . . . . . . . . . . . . . . . . . . . . . . . . . . . . . . . . . . . . . . . . . . . . . . . . ...4Useofeyeglasses andcontactlenses . . . . . . . . . . . . . . . . . . . . . . . . . . . . . . . . . . . . . . . ...7Trendsintheuseofcorrectivelenses . . . . . . . . . . . . . . . . . . . . . . . . . . . . . . . . . . . . . . . . . 15
References. . . . . . . . . . . . . . . . . . . , . . . . . . . . . . . . . . . . . . . . . . . . . . . . . . . . . . . . 17
Listofdetailedtables . . . . . . . . . . . . . . . . . . . . . . . . . . . . . . . . . . . . . . . . . . . . . . . ...19
Appendixes
LTechnical notesonmethods. . . . . . . . . . . . . . . . . . . . . . . . . . . . . . . . . . . . . . . . . . ...45II. Theaccuracyofreportingtypesofeye-careproviders . . . . . . . . . . . . . . . . . . . . . . . . . . . . . , . . 55III, Definitionsofcertaintermsused inthisreport . . . . . . . . . . . . . . . . . . . . . . . . . . . . . . . . . . ..57IV. Questionnaire items relating toeye-care visits anduseof eyeglasses and contact lenses . . . . . . . . . . . . . . . . 59V. Tables used forselection ofone-third subsample for1979questions oneye-care visits . . . . . . . . . . . . . . . . 60
t-idof text figures
1. Percent of persons with I ormoreeye-care visits in the 12months prior tointerview, byage: United States, 1979 . . 42. Percent ofeye-care visits, bytypeof specialist andage: United States, 1979 . . . . . . . . . . . . . . . . . . . . . 63, Percent ofpersons with comective lenses, byageand sex: United States, 1979-80. . . . . . . . . . . . . . . . . . . 84, Percent ofpersons with comective lenses, byageand race: United States, 1979-80 . . . . . . . . . . . . . . . . . . 95, Percent ofpersons with comective lenses, byageand Hispanic origin: United States, 1979-80. . . . . . . . . . . . 106. Percent ofpersons with comective lenses, byageand education ofheadof family: United States, 1979-80 . . . . . 117. Percent ofpersons with comective lenses, byageand place ofresidence: United States, 1979-80 . . . . . . . . . . . 128. Percent ofpersons with comective lenses, byageand geographic region: United States, 1979-80 . . . . . . . . . , . 139, Rrcentof persons with comective Ienses, byageand family income: United States, 1979-80 . . . . . . . . . . . . . 1410. Percent ofpersons with comective lenses, byageand occupational staWs: United States, 1979-80 . . . . . . . . . . . 15
Listof text tables
A, Rate ofeye-care visits per 100persons peryear forallpersons and persons with at least 1 visit during the year prior tointerview, byselected characteristics: United States, 1979 . . . . . . . . . . . . . . . . . . . . . . . . . . . . . . 5
B. Number andpercent ofeye-care visits toadoctor's office, bytypeof eye-care specialist: United States, 1979 . . . . . 7
v
Symbols
..-
. . .
0.0
z
*
#
Data not available
Category not applicable
Quantity zero
Quantity more than zero but less than0.05
Quantity more than zero but less than500 where numbers are rounded tothousands
Figure does not meet standards ofreliability or precision (more than 30-percent relative standard error)
Figure suppressed to comply withconfidentiality requirements
Eye=Care Visits and Useof Eyeglasses orContact Lensesby Gail S. Poe, M. P.H., Division of Health Interview Statistics
Introduction
National estimates of volume and frequency of eye-carevisits and the types of eye-care specialists seen are presented
in this report. For the first time since 1964, using the datashown here, a comparison of the volume of eye-care visitsby type of specialist for selected population subgroups canbe made. Also the data can be used to project the requirementsfor health professionals in future years.’ Estimates relatingto eye-care visits are based on data collected in 1979 bymeans of the National Health Interview Survey of a nationalprobability sample of households. The population coveredby the survey is the civilian noninstitutionalized populationof the United States. An eye-care visit is defined as a visitto a doctor or someone else in which help or advice was
received about the eyes. It includes examinations, treatments,surgery, and fitting or adjusting contact lenses. Eye caredoes not include visits that were only for adjusting eyeglassframes,
Also presented in this report are the use of eyeglassesand contact lenses in 1979 and 1980 and trends in the useof corrective lenses starting in fiscal year 1966. The last
time data were published by the National Center for HealthStatistics (NCHS) on corrective lenses was for the 1971National Health Interview Survey (NHIS)2 and the 1971-72National Health and Nutrition Examination Survey
(NHANES)3. For this report, 2 years of NHIS data werecombined (1979 and 1980). The combining of these yearsincreased the reliability of estimates because increasing the
sample size decreases the sampling error. A comparison be-tween the 2-year average and the statistics for individualyears is shown below:
Average1979 and 1980 1979 1980
Population ages3 years and over. 207,132,000 206,134,000 208,132,0CQ
Percent witheyeglasses orcontact lenses . . 51.7 51.6 51 .s
Data in this report on use of corrective lenses can becompared to earlier reports from NHIS .2’4’5 In addition, datain this report can be used with data from the 1977 National
Medical Care Expenditure Surveyb and the 1980 NationalMedical Care Utilization and Expenditure Survey. The Na-tional Ambulatory Medical Care Survey has data on visitsto ophthalmologists.7 NHANES has published reports on datafor 1971-72 on the national prevalence estimates of refractionstatus, refraction potential, and motility defects;3 visual acuitylevels with usual correction, if any, as determined in an
ophthalmology examination before dilations and selected eyeconditions, decrease in vision from eye pathology, and relatedneed for medical care. 9
In addition, based on data from the 1974-75 NationalHealth and Nutrition Examination Augmentation Survey, datawere presented on access to refractive care.’0
1
.
Source and limitations of the data
The information from NHIS, presented in this report,is based on data collected in a continuing nationwide surveyconducted by personal interview in the household. A probabil-ity sample of households is interviewed each week by trainedpersonnel of the U.S. Bureau of the Census to obtain informa-
tion about the health and other characteristics of each memberof the household in the civilian noninstitutionalized popula-tion.
During the 52 weeks in 1979, the sample consisted ofapproximately 42,000 eligible, occupied households contain-ing about 111,000 persons living at the time of the interview.The total noninterview rate was about 3.9 percent—2.2 percentof which was due to respondent refusal and the remainderwas primarily due to an inability to locate an eligible respon-dent at home after repeated calls. Because of budgetary limita-tions in 1980, four weeks of data collection were deletedfrom the fourth quarter sample. The data derived from theremaining weeks were differentially weighted to produce afull quarterly estimate. During the 48 weeks in 1980, thesample consisted of approximately 39,000 households contain-ing about 103,000 persons living at the time of the interview.
The total noninterview rate was about 2.9 percent of which1.8 percent was due to refusals.
The regular NHIS respondent rules are that a personaged 19 years or older or ever married may respond forhimself or herself and any other related household membena person aged 17 or 18 years who has never been married
may respond for self only; a related household member mustrespond for a never married person under age 17; an unrelatedperson living in a household must be interviewed separatelyusing a separate questionnaire. Information on eye-care visitswas obtained for a one-third subsample of respondents in
1979 and, to increase reporting accuracy, a self-respondentrule for adults was used for the eye-care questions. (For
children, answers for the eye-care questions were obtainedfrom a related adult household member.)
Because of the use of a more stringent respondent rulerelating to eye-care visits than for the basic NHIS question-
naire, there was additional nonresponse to these questions.
Of the 36,063 persons in the 1979 one-third subsample,
responses were obtained for 35,199 or 97.6 percent.Tables 1-4 in the detailed tables contain data related
to eye-care visits. The population based figures used in com-puting most of the rates and percents for eye-care visitsin this report are found in tables 5-7. Tables 8-17 containdata on use of eyeglasses or contact lenses.
A description of the survey design, methods used in
estimation, and general qualifications of the data obtainedfrom this survey are provided in appendix 1. In this reportthe estimates are subject to sampling error because theyare based on a sample of the population. Therefore, particular
attention should be paid to the section entitled “Reliabilityof estimates.” Sampling errors for most of the estimatesrelated to eyeglasses or contact lenses are relatively low.Errors due to sampling in the statistics related to eye-care
visits are generally bigger because of the much smaller samplesize. Where an estimated number or the numerator or de-nominator of a rate of percentage is small, the samplingerror may be high. Charts of relative sampling errors andinstructions for their use are presented in appendix 1.
In addition to errors resulting from sampling mentionedabove, response error is also a possibility in interview data.Response error occurs when household respondents do notknow the requested information, fail to recall accurately eventsoccurring during the reference period, report events that actu-ally happened outside the reference period as having occurredduring it, or withhold information. Errors may also be in-
troduced by interviewers, coders, and others during the pro-cessing and analysis of the data. To reduce the reportingerror for the type of eye-care specialist seen, special procedureswere used that required the interviewers to verify the typeof speciality. (See appendix II for a description of theseprocedures.) Interviewers were able to verify specialty in
89 percent of the reported visits. For this report, interviewer-
ascertained specialty was used where available and, wherenot, respondent-reported specialty was used.
It should be noted that age has a large effect on botheye-care visits and use of eyeglasses and contact lenses.
Gender also has an effect on use of corrective lenses. Wheredata are not presented for age and sex-specific groups, someof the observed differences among population subgroups maybe due in part to differences in age-sex distributions.
A comparison of the 1980 population estimates basedon the 1970 census with the 1980 census estimates revealedan error of closure of 2.1 percent. That is, the 1970-consistent
estimate was 2.1 percent less than the number of people
counted in 1980. The U.S Bureau of the Census has publishedrevised population estimates for the intercensal years that
I I In general, the ratesare consistent with the 1980 census .and percents presented in this report are affected very littlebecause both the numerator and denominator are derivedfrom the survey. Estimates of the number of persons with
2
a specified characteristic will be affected more if they arefor a population group for which the error of closure wasrelatively large,
Terms used in the survey are defined in appendix III.Appendix IV contains portions of the questionnaire applicableto this report. A complete facsimile of the questionnaireused in 1979 is provided in Vital and Health Statistics,Series 10, No. 136]2and for 1980 in Series 10, No. 139. ]3
In this report, terms such as “similar” and “the same”
mean that there was no statistically significant differencebetween the statistics being compared. Terms relating todifferences such as “greater than” or “less than” indicatethat differences are statistically significant. A critical valueof 1.96 (0.05 level of significance) was used to test compari-sons that are discussed. Lack of comment regarding thedifference between any two statistics does not mean thatthe difference was tested and found to be not significant.
Findings
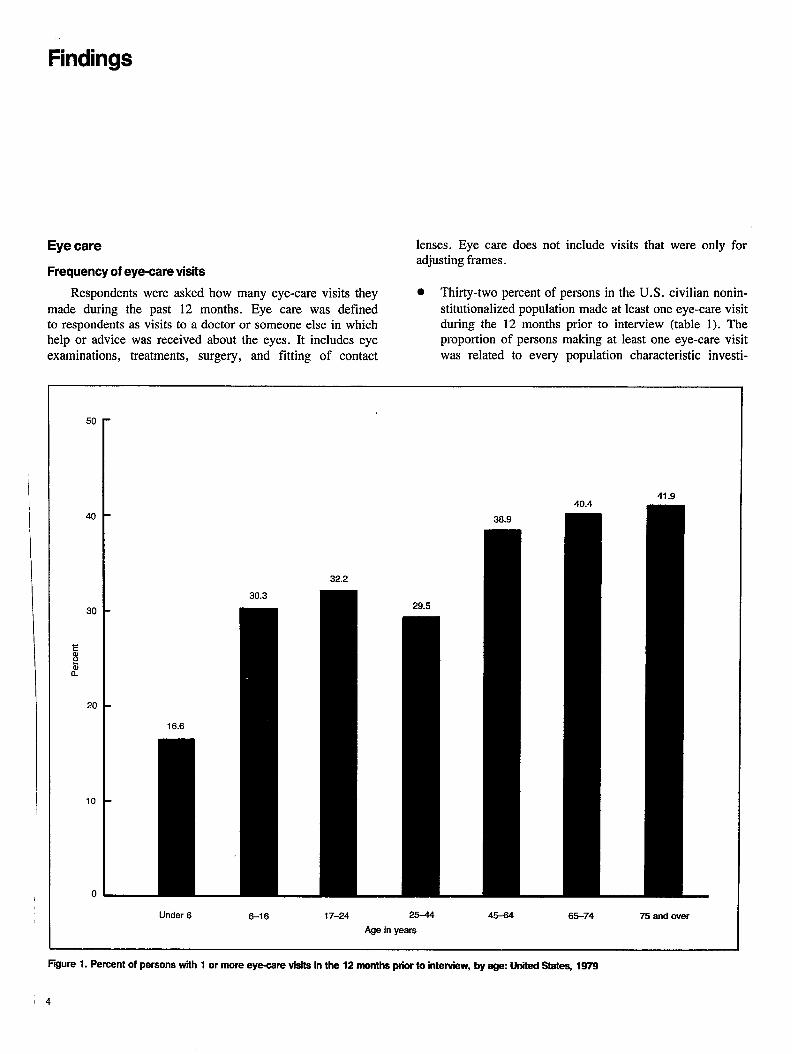
Eye care lenses. Eye care does not include visits that were only for
Frequency of eye-ewe visitsadjusting frames.
Respondents were asked how many eye-care visits they ● Thirty-two percent of persons in the U.S. civilian nonin-made during the past 12 months. Eye care was defined stitutionalized population made at least one eye-care visitto respondents as visits to a doctor or someone else in which during the 12 months prior to interview (table 1). Thehelp or advice was received about the eyes. It includes eye proportion of persons making at least one eye-care visitexaminations, treatments, surgery, and fitting of contact was related to every population characteristic investi-
50 -
40
30
‘F~
bn
20
10
0
30.3
16.6
32.2
29.5
40.4
38.9
41.9
Under 6 6-16 17-24 2544
Age in years
45-64 6S74 75 and over
Figure 1. Percent of persone with 1 or more eye-care visits in the 12 months prior to interview, by age UnitedState$ 1979
4
gated—gender, age, race, family income, education ofhead of family, place of residence, region of country,and family size,There was a direct positive relationship between ageand having one or more eye-care visits in the 12 monthsprior to interview (figure 1). Only 30 percent of thepersons ages 6-16 years had one or more eye-care visitsand 42 percent of the persons 75 years and over hadone or more visits. This is consistent with the deteriorationof the eyes that accompanies the aging process and thestrong positive relationship between the use of eyeglassesand contact lenses and age.A higher proportion of femalss than males had at leastone eye-care visit during the year prior to interview.A higher proportion of white than black persons hadone or more eye-care visits during the, 12 months ,priorto interview,Persons with $25,000 or more family income had thehighest percent with one or more eye-care visits duringthe 12months prior to interview. .
The proportion of persons with one or more eye-carevisits, during the year prior to interview, increased withthe education of the head of the family.A lower proportion of persons living outside a stmdardmetropolitan statistical area (SMSA) than inside an SMSAhad one or more visits during the year prior to interview.Persons living in the Northeast Region had the highestpercent of persons with one or more visits in the 12months prior to interview (35 percent).The percent of persons with one or more visits wasIowerin larger families.
Volume of 1979 eye-care visits
Estimates of the number of eye-care visits made during1979 were based on visits reported as occurring during the2 weeks ending Sunday night of interview week. For estimatesof number of visits per 100 persons with one or more visitsduring the year prior to interview, the numerator is basedon visits reported during the two weeks prior to interviewand the denominator is based on visits reported for the 12months prior to interview,
103.6 million visits were made in 1979 to obtain eyecare (table 2).Despite the fact that a higher proportion of females thanmales had at least one eye-care visit during the yearprior to interview, the rate of eye-care visits was aboutthe same for females as for males. In 1979 there were47 eye-care visits per 100 males and 49 visits per 100females (table A).The rate of eye-care visits increased with age. The ratefor persons 65 years and over (82 visits per 100 persons)was more than twice the rate for persons under 17 years(35 visits per 100persons).The rate of visits for white persons appeared to be largerthan for black persons; however, the potential error inthe estimates due to interviewing only a sample of house-holds precludes definitely stating that the rate for whitepersons was higher.
●
●
●
The rates of visits across income groups were aboutthe same.The rates of visits appeared to increase with higher levelsof education of head of family; however, the potentialerror in the estimates due to sampling precludes definitelystating that there was a direct positive relationship betweenrate of visits and education of head of family.Among all persons having at least one visit during theyear prior to interview, the rate of visits was 14~ per100 persons. Among persons 65 years and over havingat least one visit in the year prior to interview, therate of visits was 198 per 100persons.
Table A. Rateof eye-oere viaiis per 100 persons per year for aNpereonsand persons with at least 1 viaif during the year prior to interview, byselected chareoteristim United Steteq 1979
Rate of vkitsRete of visits per 100 persons with
Selected characteristic per 100 persons at /east 7 visit
All personsl
Sex
Male . . . . . . . . . . . . . .Female . . . . . . . . . . . .
Age
Under 17 years . . . . . . . .17-44 . . . . . . . . . . . . .45-64 . . . . . . . . . . . . .65 years and over . . . . . .
Race
White . . . . . . . . . . . . .Black . . . . . . . . . . . . .
Family income
Less then $5,000 . . . .$5,000-$9,999 . . . . . .$10,000-$14,999. . . . . . .$15,000-$24,999 . . . . . .$25,000 or more . . . . . . .
Education of head of family
Less than 12 years . . . . . .12years . . . . . . . . . . . .12years ormore . . . . . . .13yeara or more . . . . . . .16years or more . . . . . . .
Placd of residence
SMSA . . . . . . . . . . . . .
C6ntralcity . . . . . .Not central city . . . . .
Outeide SMSA . . . . . . . .Region
Northeast . . . . . . . . . . .North Central . . . . . . . . .South . . . . . . . . . . . . .West . . . . . . . . . . . . .
48.0
47.248.6
34.844.056.281.7
49.933.8
50.552.247.144.952.5
39.148.752.656.65a.7
49.3
46.351.345.4
56.846.936.057.1
149.1
156.214s.2
132.9141.9147.5198.1
151.4122.5
158.7171.3156.7142.9141.5
139.7148.6152.6157.2155.7
148.0
142.0152.0151.7
161.8140.9130.8173.4
‘Includes parsons of other races and persons of unknown income and education.
NOTE Relative standard errors of estimates ror this table are found in appendix 1.
Type of specialist seen
Respondents were asked whether the person seen foreye care was an ophthalmologist, an optometrist, an optician,or some other kind of doctor or specialist. Interviewers verifiedthe type of specialty. For definitions of types of specialistssee appendix II. The percent of visits to a particular typeof specialist was caictdated in the following way. Basedon visits reported as occurring during the 2 weeks prior
5
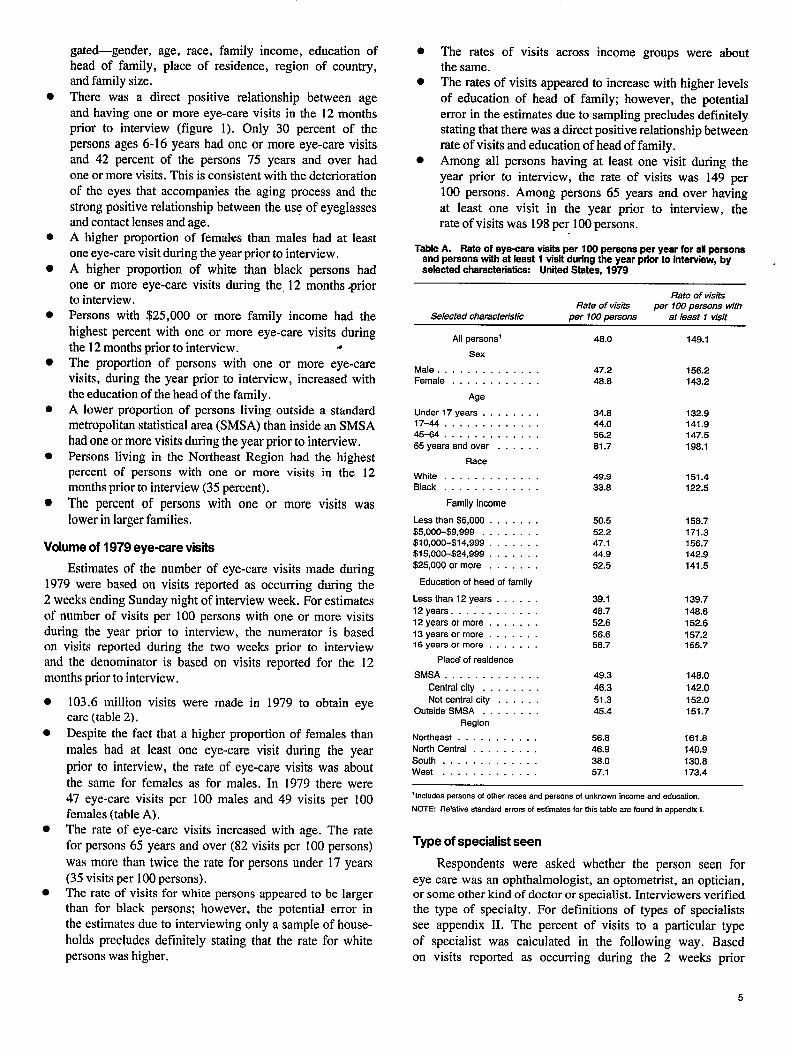
to interview, the denominator was the estimate of eye-care tometrists and 16 percent to medical doctors other than
visits to any type of specialist and the numerator was the ophthalmologists (table 3).
estimate of eye care visits to the particular type of specialist.● In 1979 there were approximately 21,855 active optomet-
. Forty-three percent of all visits for eye care were made rists’4 and 12,619 active ophthalmologists’5 in the United
to ophthalmologists, compared with 32 percent to op- States and possessions. Hence, in 1979 there were more
70 -
60
50
40
EalP2
30
20 -
10
0
39.9
28.1
Under 17 years
41.0
17-44 years
Age in years
51.9
Ophthalmologists
Optometrists
Other M.D., not ophthalmologists
66.7
45-64 years 65 years and over
F~ure 2. Percent of eye-care viaita,by type ot specialistsnd age United States, 1979
6
than twice as many visits for eye care per ophthalmologist
as there were per optometrist.. The percent of all eye-care visits that were to ophthal-
mologists increased dramatically with age, but this wasnot true for other specialties. The percent of visits to
ophthalmologists for persons 65 years and over was overtwice the percent of visits for persons under 17. Forpersons 45 years of age and over the highest percentof visits was to an ophthalmologist. The potential errorin the survey estimates due to sampling precludes makinga definitive statement for children or for persons ages17-44. However, for children the highest percent of alleye-care visits appears to have been to a medical doctorother than an ophthalmologist. For persons ?ges 17-44years the highest percent of visits appears to have beento an optometrist (figure 2).
. The percent of visits to an optometrist for persons living,in the North Central Region of the country was twice.the percent of visits for persons living in the SouthRegion. This finding is consistent with the fact that
the number of optometrists per person was lowest inthe South Region. The number of optometrists per 10,000people was 0.8 in the South Region and 1.3 in theNorth Central Region (according to the 1980 decennial
census),
Place of visit
For visits reported as occurring during the 2 weeks priorto interview, respondents were asked where the visit tookpktcc: a doctor’s office, an optical store, or some otherplace.
. Most (81 percent) eye-care visits occurred .in a doctor’soffice w opposed to another place such as a hospitalor tin optical store (table 4). Ninety-one percent of ophthal-
mologist visits occurred in a doctor’s office as comparedwith 77 percent of optometrist visits (table B).
. A higher percent of visits among white persons werein a doctor’s office than were visits among black persons.
Table B. Number and percent of eye-care visits to a doctor’s office bytype of eye-ewe specialist: United States, 1979
Doctor’s officeTotal visits
to all placesl Number inSIJecia/ist in thousands thousands Percent
All specialists . . . . . . , . . . 103,609 84,228 81.3
Ophthalmologist. . . . . . . . 44,556 40,442 90.8
Optometrist . . . . . . . . . . . 32,935 25,261 76.7
M. D., not ophthalmologist. . . . 16,881 14,193 84.1
Other and unknown . . . . . . 14,511 6,054 41.7
‘Includesunknown place of visit.
Use of eyeglasses and contact lenses
Household respondents during 1979 and 1980 were askedwhether each person in the family, at the present time, woreeyeglasses or contact lenses. Hence, the statistics presentedon the use of corrective lenses are average annual estimatesfor 1979-80 for the U.S. civilian noninstitutionalized popula-tion.
. Of the 207.1 million persons ages 3 and over, a totalof 107.1 million (51.7 percent) wore either eyeglassesor contact lenses (table 8).
. The wearing of some type of corrective lenses was relatedto age, gender, race, Hispanic origin, education of headof family, education of individual, geographic region,family income, and occupational status.
. A total of 9.3 million (4.5 percent) persons ages 3 andover wore contact lenses in 1979-80.
. The wearing of contact lenses was also related to age,gender, race, Hispanic origin, education of head of fam-ily, education of individual, geographic region, familyincome, and occupational status.
Sex and age
●
●
●
●
●
●
●
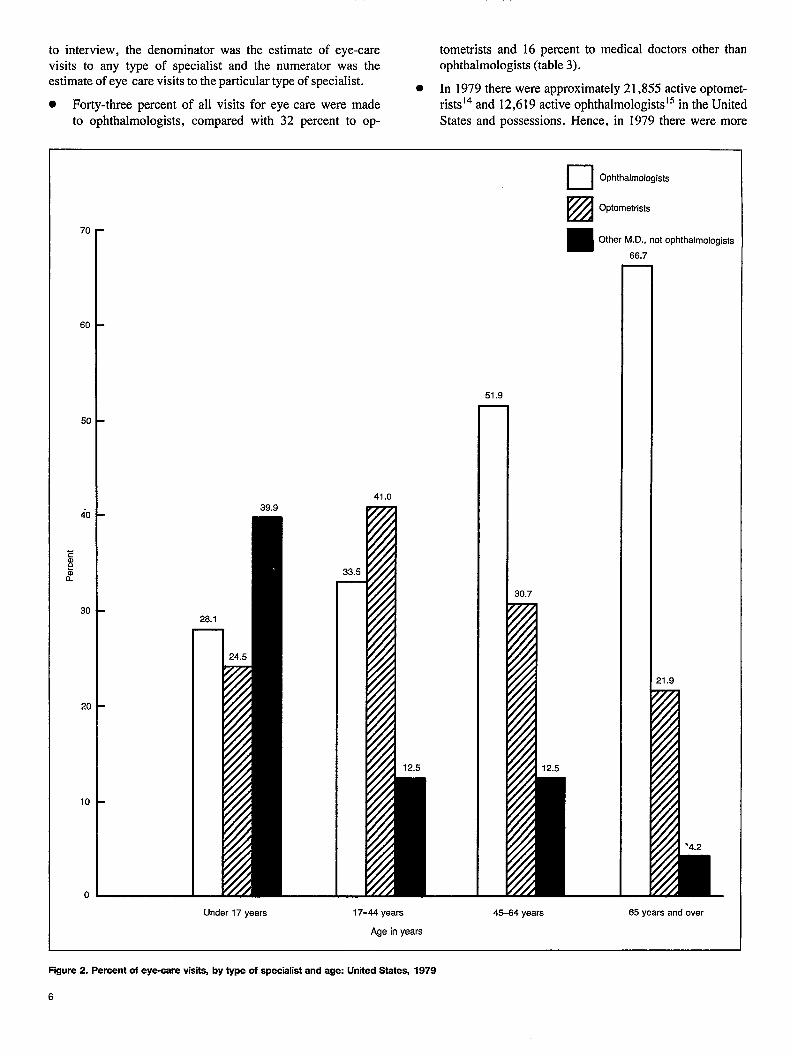
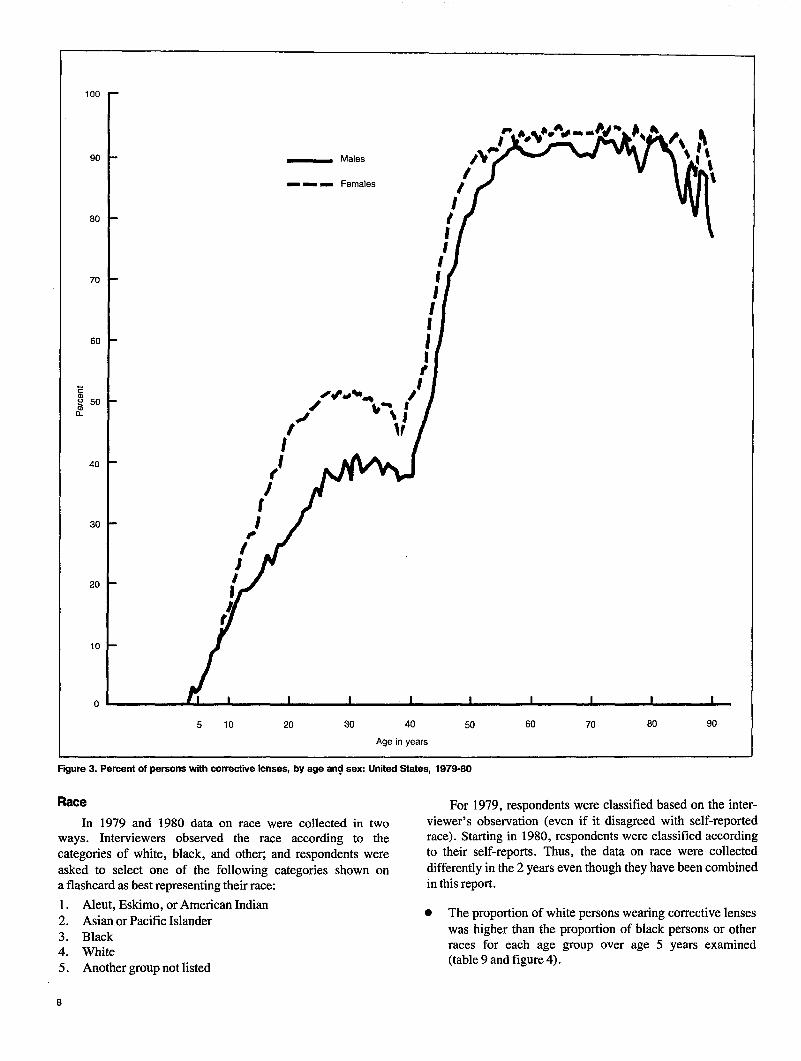
The proportion of persons wearing corrective lenses in-creased with age with less than 1 percent of persons3 years of age wearing lenses to 92 percent of persons75 years and over (table 8).The age pattern of persons who used corrective lensesis quite similar for males and females, although thelevel was higher at all age intervals above age 5 yearsamong females (figure 3).The gap between males and females in the percent usingcorrective lenses was greatest between ages 19-21. Almost17 percent more females than males ages 19-21 years
wore corrective lenses.The age curve for both sexes displays two well-definedplateaus. The use of corrective lenses rose rapidly untilthe midtwenties at which point there was a leveling
off until about age 41. After age 40 there was againa steep rise until another leveling off occurred startingin the midfifties.The percent of persons wearing contact lenses was highestfor the age group 17-24 years (9 percent) and for those
25-44 years (8 percent). For all other age groups examinedthe percent wearing contact lenses was about 2 percentor lower.The proportion of females wearing contact lenses wastwice the proportion of males.
Although the proportion of females ages 6-54 years wear-
ing contact lenses is about double the proportion ofmales, the proportion for persons ages 55 years andover was about the same for both sexes (2 percent).
7
100
90
80
70
80
E3 501?
40
30
20
10
0
.
— Males
--- Females
5 10 20 30 40 50 60 70 80 90
Age in years
F~ure 3. Percent of persons with corrective knses, by sge snq sex United Ststes, 1979-80
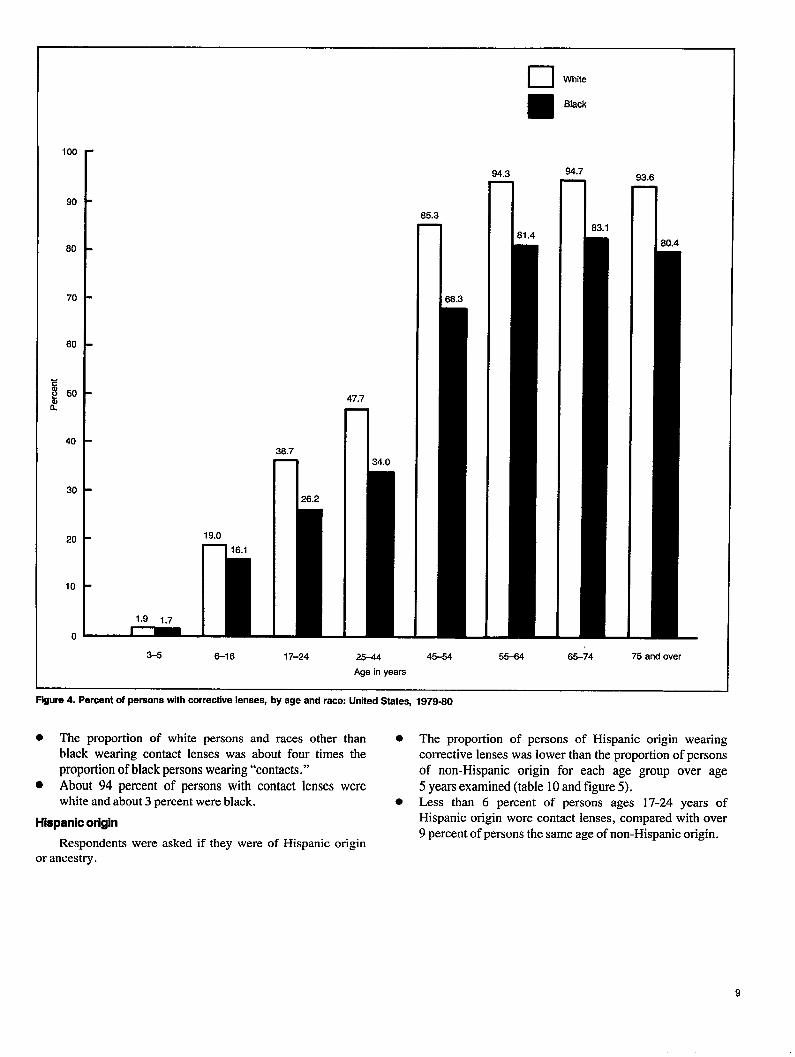
Race For 1979, respondents were classified based on the inter-
In 1979 and 1980 data on race were collected in twoways. Interviewers observed the race according to thecategories of white, black, and otheq and respondents wereasked to select one of the following categories shown ona flashcard as best representing their race:
1. Aleut, Eskimo, or American Indian2. Asian or Pacific Islander3. Black4. White5. Another group not listed
viewer’s observation (even if it disagreed with self-reportedrace). Starting in 1980, respondents were classified accordingto their self-reports. Thus, the data on race were collecteddifferently in the 2 years even though they have been combinedin this report.
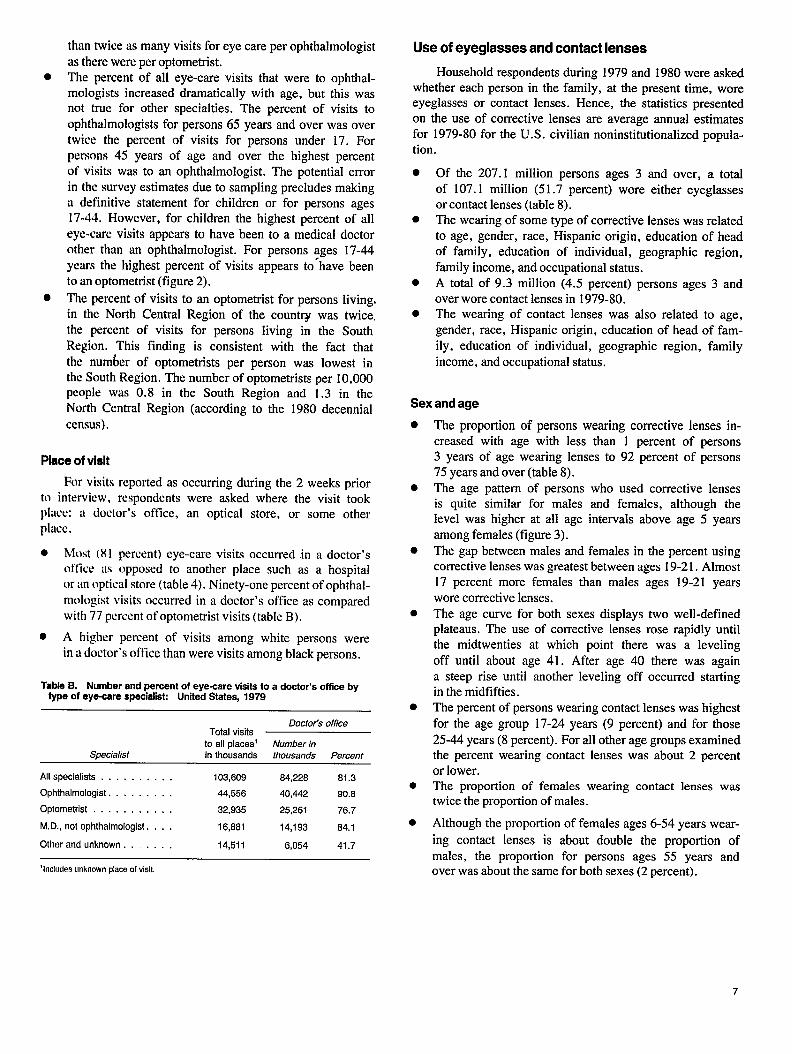
● The proportion of white persons wearing corrective lenseswas higher than the proportion of black persons or otherraces for each age group over age 5 years examined(table 9 and figure 4).
8
❑ White
Black
100
90
80
70
60
40
30
20
10
0
1.9 1.7
3-5
19.0
8-16
36.7
n26.2
47.7
n34.0
94.3 94.7
nrl
85.3
n66.3
93.6
n80.4
17-24 25-44
Age in years
45-54 55-64 65-74 75 and over
Figure 4. Pmoent of pereons with corrective tenees, by age and rsce United States, 1979-80
● The proportion of white persons and races other than ● The proportion of persons of Hispanic origin wearing
black wearing contact lenses was about four times the corrective lenses was lower than the proportion of persons
proportion of black persons wearing “contacts.” of non-Hispanic origin for each age group over age. About 94 percent of persons with contact lenses were 5 years examined (table 10and figure 5).
white and about 3 percent were black. ● Less than 6 percent of persons ages 17-24 years of
Hispanic origin Hispanic ongin wore contact lenses, compared with over9 percent of persons the same age of non-Hispanic origin.
Respondents were asked if they were of Hispanic originor ancestry.
9
100
90
80
70
60
40
30
20
10
0
19.0
6-16
37.9
n27.7
17–24
47.2
n32.2
25-44
Age”inyears
Non-Hispanicorigin
84.2
1 73.2
Hispanicorigin
93.8
n
45-54 55 and over
F~ure 5.Percent of persons with corrective lenses, by sge snd Hispsnic origin: United States, 1979-80
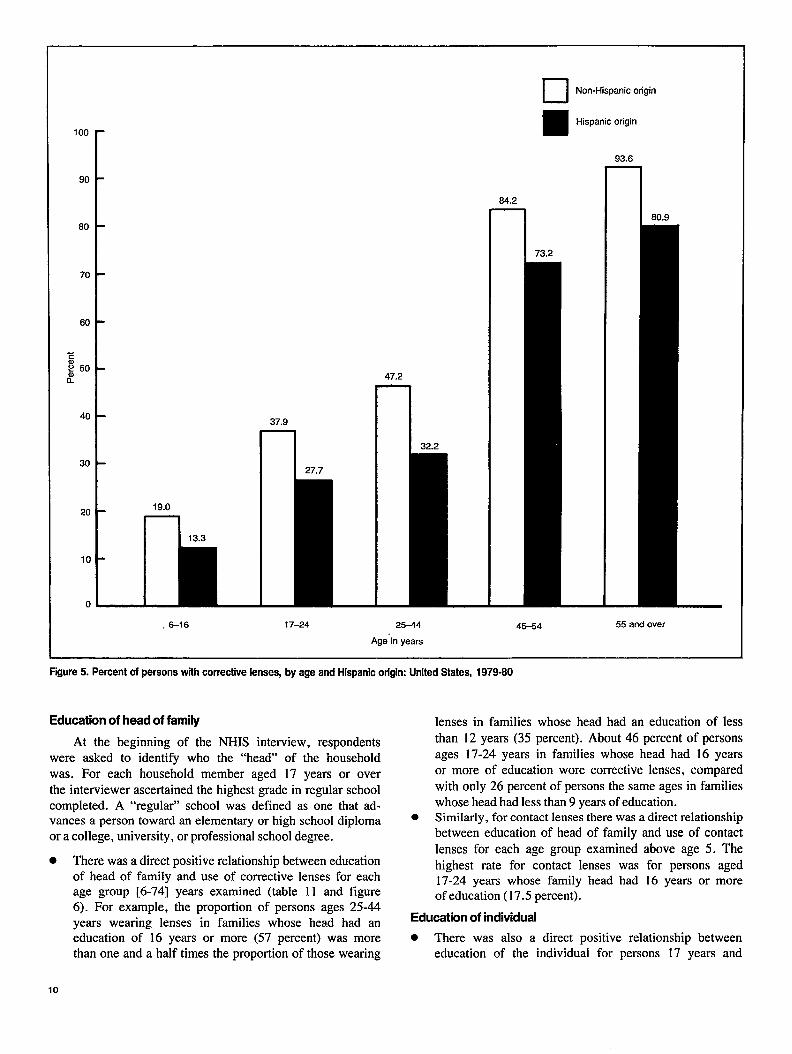
Education of head of family
At the beginning of the NHIS interview, respondentswere asked to identify who the “head” of the householdwas. For each household member aged 17 years or over
the interviewer ascertained the highest grade in regular schoolcompleted. A “regular” school was defined as one that ad-vances a person toward an elementary or high school diplomaor a college, university, or professional school degree.
● There was a direct positive relationship between educationof head of family and use of corrective lenses for eachage group [6-74] years examined (table 11 and figure6). For example, the proportion of persons ages 25-44years wearing lenses in families whose head had aneducation of 16 years or more (57 percent) was morethan one and a half times the proportion of those wearing
10
lenses in families whose head had an education of less
than 12 years (35 percent). About 46 percent of personsages 17-24 years in families whose head had 16 yearsor more of education wore corrective lenses, compared
with only 26 percent of persons the same ages in familieswhose head had less than 9 years of education.
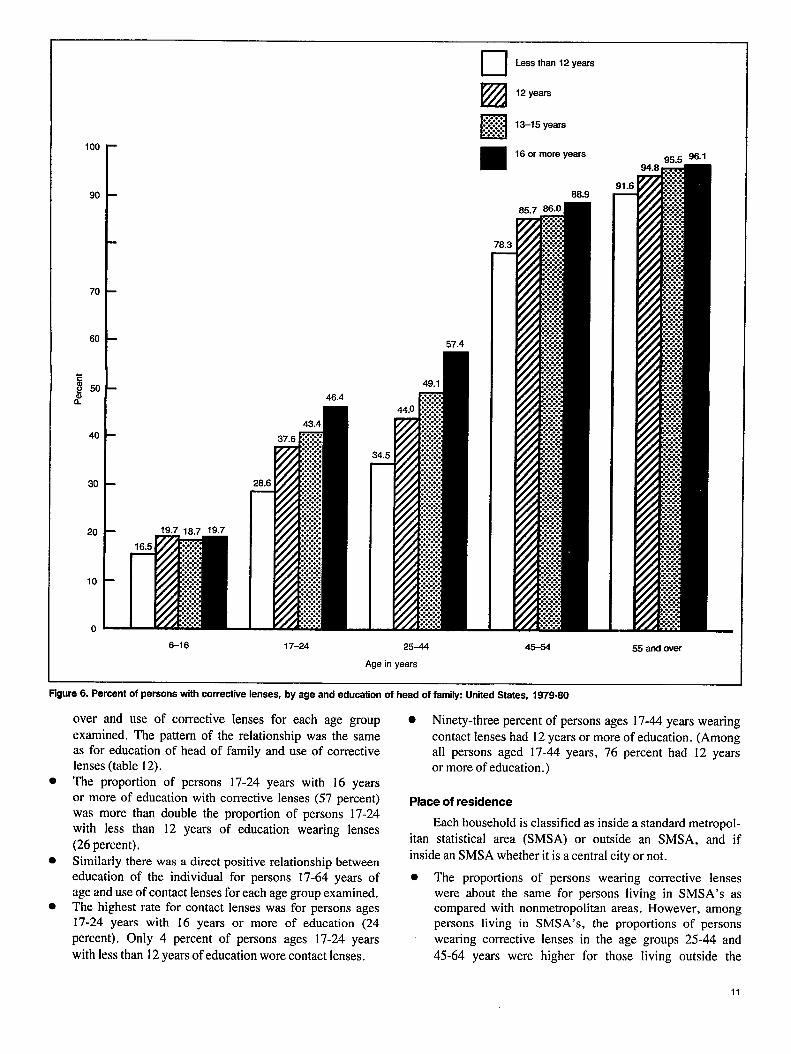
● Similarly, for contact lenses there was a direct relationshipbetween education of head of family and use of contact
lenses for each age group examined above age 5. Thehighest rate for contact lenses was for persons aged17-24 years whose family head had 16 years or moreof education ( 17.5 percent).
Education of individual
● There was also a direct positive relationship betweeneducation of the individual for persons 17 years and
100 -
90
70
60
Eg 50 -
n
40
30
20
10
0
6-16 17–24
57.4
46.4
34.5
1
25-44
Age in years
❑Izz❑
J....o.
. . . .
:.:.:.:.
. . . . . . .
Less than 12 years
12 years
13-15 years
16 or more years
9188.9
45-54 55andwer
--- —Figure 6. Percent of persons with corrective lenses, by age and education of head of family United States, 1979-80
●
●
●
over and use of corrective lenses for each age group
examined. The pattern of the relationship was the sameas for education of head of family and use of correctivelenses (table 12).The proportion of persons 17-24 years with 16 yearsor more of education with corrective lenses (57 percent)was more than double the proportion of persons 17-24with less than 12 years of education wearing lenses
(26 percent),Similarly there was a direct positive relationship betweeneducation of the individual for persons 17-64 years ofage and use of contact lenses for each age group examined.The highest rate for contact lenses was for persons ages17-24 years with 16 years or more of education (24
percent). Only 4 percent of persons ages 17-24 years
with less than 12 years of education wore contact lenses.
● Ninety-three percent of persons ages 17-44 years wearing
contact lenses had 12 years or more of education. (Amongall persons aged 17-44 years, 76 percent had 12 yearsor more of education. )
Placeof residence
Each household is classified as inside a standard metropol-
itan statistical area (SMSA) or outside an SMSA, and if
inside an SMSA whether it is a central city or not.
. The proportions of persons wearing corrective lenseswere about the same for persons living in SMSA’S ascompared with nonmetropolitan areas. However, amongpersons living in SMSA’S, the proportions of personswearing corrective lenses in the age groups 25-44 and
45-64 years were higher for those living outside the
11
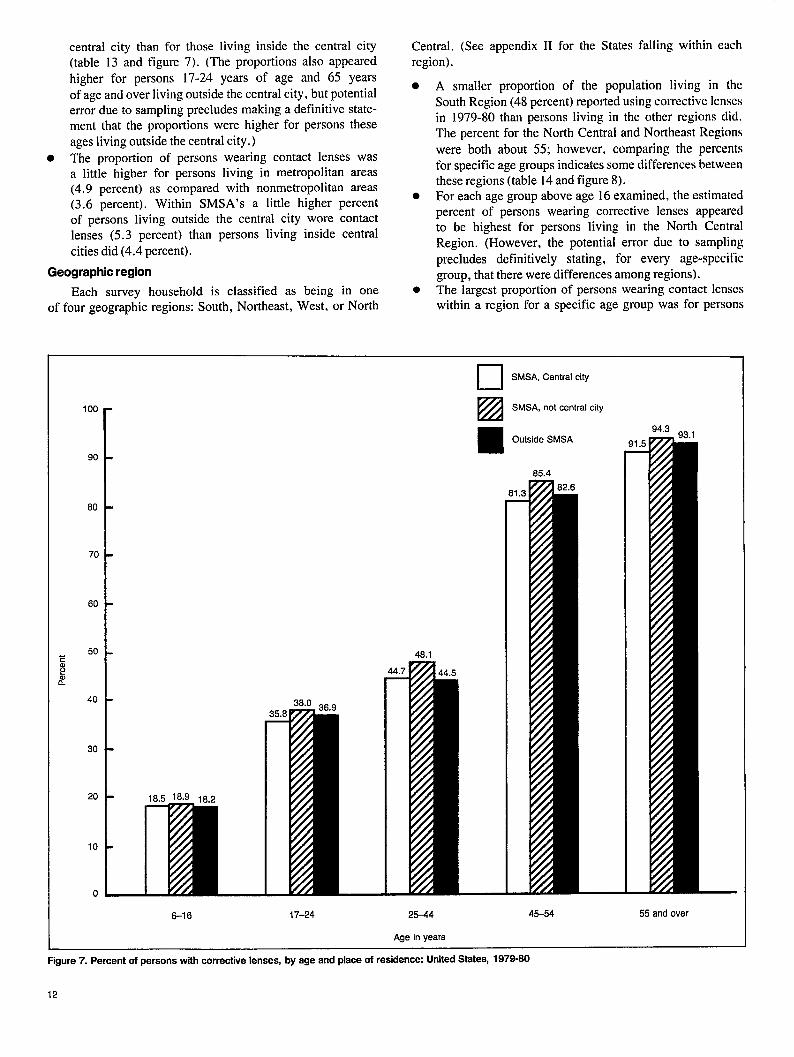
central city than for those living inside the central city Central. (See appendix II for the States falling within each(tab]e 13 and figure 7). (The proportions also appeared region).higher for pers&s 17-24 years ‘of age and 65 yearsof age and over living outside the central city, but potentialerror due to sampling precludes making a definitive state-ment that the proportions were higher for persons theseages living outside the central city. )
The proportion of persons wearing contact lenses wasa little higher for persons living in metropolitan areas(4.9 percent) as compared with nonmetropolitan areas(3.6 percent). Within SMSA’S a little higher percentof persons living outside the central city wore contactlenses (5.3 percent) than persons living inside central
cities did (4.4 percent).
Geographic region
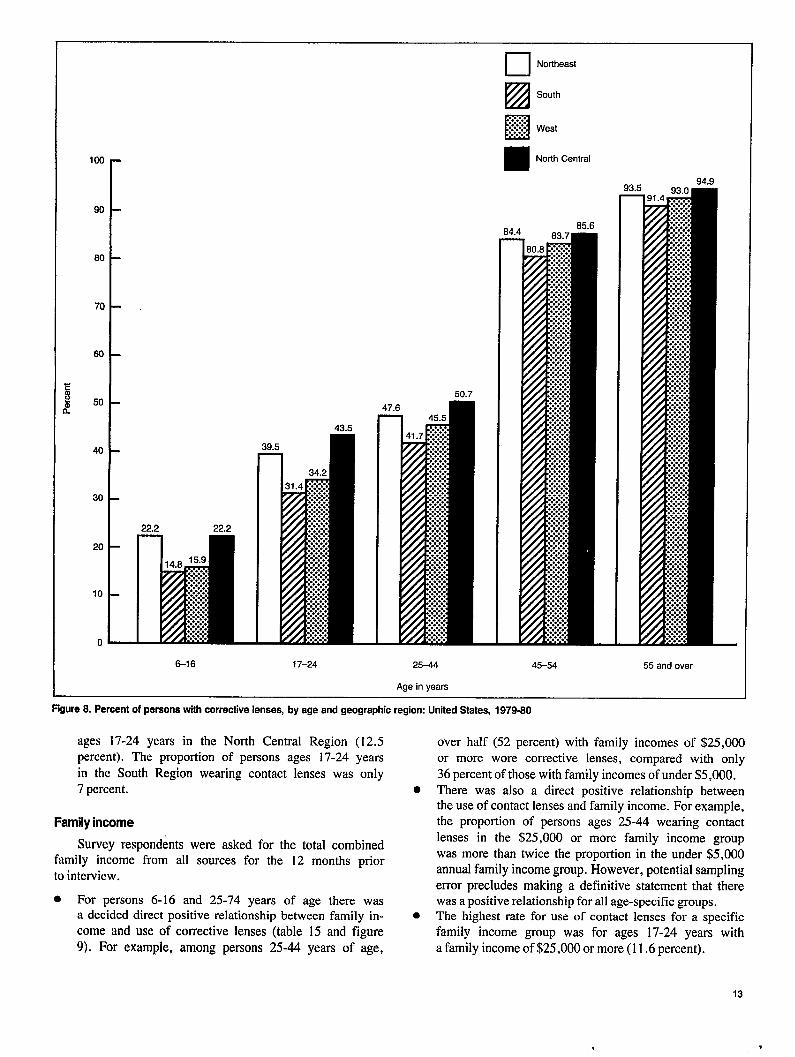
. A smaller proportion of the population living in the
South Region (48 percent) reported using corrective lensesin 1979-80 than persons living in the other regions did.The percent for the North Central and Northeast Regions
were both about 55; however, comparing the percentsfor specific age groups indicates some differences betweenthese regions (table 14 and figure 8).
● For each age group above age 16 examined, the estimatedpercent of persons wearing corrective lenses appearedto be highest for persons living in the North CentmlRegion. (However, the potential error due to sampling
precludes definitively stating, for every age-specificgroup, that there were differences among regions).
Each survey household is classified as being in one . The largest proportion of persons wearing contact lenses
of four geographic regions: South, Northeast, West, or North within a region for a specific age group was for persons
100 ~
90
80
70
60
50
40
30
20
10
0
38.0 ,,.-,.
18.5 18.9 18.2
m
48.1
❑ SMSA, Central city
IzzlSMSA, not central city
Outside SMSA
85.4
81.3
8-16 17-24 25-44 45-54 55 and over
Age in yeara
Figure 7. Percent of persons with corrective lenses, by age and place of residence United Statee, 1979-80
12
—
•1 Northeaat
5South
Q%::::j::::West
North Central
—
100 -
90
80
70 -
60
50
40
30
20
10
0 —
22.2 22.2
M
,48 15.9
M+::.:.:.:.Jm.,.J. . . ........~.:.}. . . .::::::::
~.:.:.................+:+:
6-16 17-24
Aqe in vears
50.7
47
i
25-44 45-54 55 and over
Figure 8. Pereent of persons with corrective lenses, by age and geographic region: United States, 1979-80
ages 17-24 years in the North Central Region (12.5percent). The proportion of persons ages 17-24 yearsin the South Region wearing contact lenses was only7 percent. ●
Family income
Survey respondents were asked for the total combinedfamily income from all sources for the 12 months priorto interview.
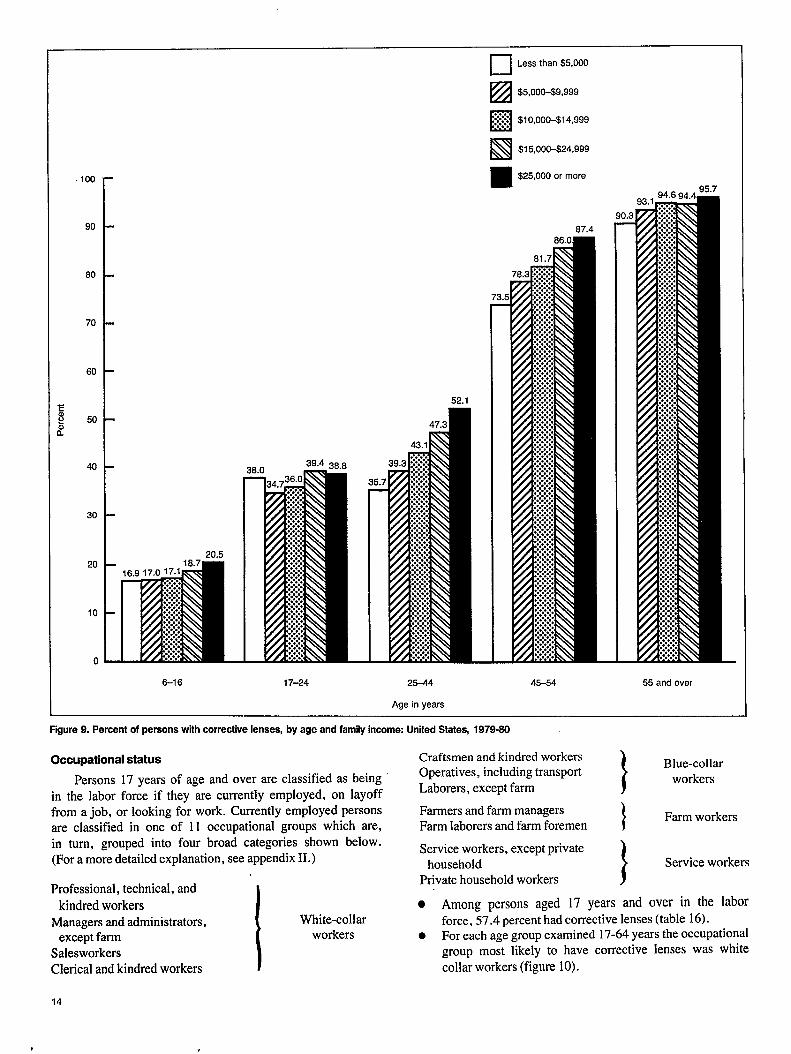
. For persons 6-16 and 25-74 years of age there wasa decided direct positive relationship between family in- ●
come and use of corrective lenses (table 15 and figure9). For example, among persons 25-44 years of age,
over half (52 percent) with family incomes of $25,000or more wore corrective lenses, compared with only36 percent of those with family incomes of under $5,000.There was also a direct positive relationship betweenthe use of contact lenses and family income. For example,the proportion of persons ages 25-44 wearing contactlenses in the $25,000 or more family income groupwas more than twice the proportion in the under $5,000annual family income group. However, potential samplingerror precludes making a definitive statement that therewas a positive relationship for all age-specific groups.The highest rate for use of contact lenses for a specificfamily income group was for ages 17-24 years witha family income of $25,000 or more (11.6 percent).
13
,
❑ Lessthan $5,000
100
90
80
70
60
zale 50
:
40
30
20.520
16.917.017.1
10
0
El $5,000-$9,999
ElW $10,000-$14,999
IS$15,000-524,999
$25,000 or mora
87.4
52.1
6-16 17-24 25-44 45-54 55 and over
Age in years
Fgure 9. Percent of persons with corrective lenses, by age and family income United States, 1979-80
Occupationalstatus Craftsmen and kindred workersOperatives, including transport
1
Blue-collarPersons 17 years of age and over are classified as being
Laborers, except farmworkers
in the labor force if they are currently employed, on layofffrom a job, or looking for work. Currently employed persons Farmers and farm managersare classified in one of 11 occupational groups which are, Farm laborers and farm foremen 1
Farm workers
in turn, grouped into four broad categories shown below.(For a more detailed explanation, see appendix II.)
Professional, technical, andkindred workers
Managers and administrators,except farm
SalesworkersClerical and kindred workers
White-collarworkers
Service workers, except privatehousehold
1Service workers
Private household workers
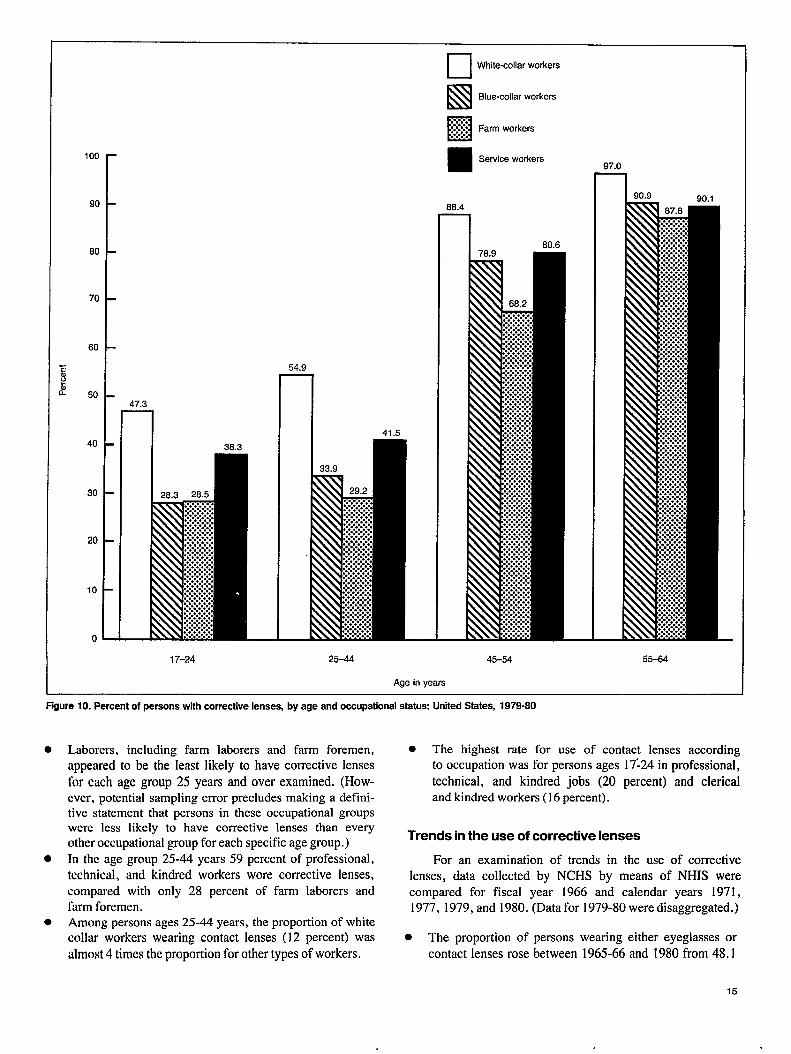
. Among persons aged 17 years and over in the laborforce, 57.4 percent had corrective lenses (table 16).
● For each age group examined 17-64 years the occupationalgroup most likely to have corrective lenses was whitecollar workers (figure 10).
14
❑ White-collar workers
INlBlue-collar workers
100
r
90
80
70
60
50
40
30
20
10
0 —
47.3
7I 36.3
17-24
54.9
I 415
El,.....O
~ Farm workers
Service workers97.0
66.4
nII 80.6
25-44 45-54
Age in years
Figure 10. Percent of persons with corrective lenses, by age and occupational status: United Statea, 1979-80
5.5-64
Laborers, including farm laborers and farm foremen, . The highest rate for use of contact lenses according
appeared to be the least likely to have corrective lenses
for each age group 25 years and over examined. (How-ever, potential sampling error precludes making a defini-tive statement that persons in these occupational groupswere less likely to have corrective lenses than everyother occupational group for each specific age group. )
In the age group 25-44 years 59 percent of professional,technical, and kindred workers wore corrective lenses,compared with only 28 percent of farm laborers andfarm foremen.Among persons ages 25-44 years, the proportion of whitecollar workers wearing contact lenses (12 percent) was
almost 4 times the proportion for other types of workers.
to occupation was for persons ages 17:24 in professional,
technical, and kindred jobs (20 percent) and clericaland kindred workers (16 percent).
Trends in the use of corrective lenses
For an examination of trends in the use of corrective
lenses, data collected by NCHS by means of NHIS werecompared for fiscal year 1966 and calendar years 1971,1977, 1979, and 1980. (Data for 1979-80 were disaggregated.)
. The proportion of persons wearing either eyeglasses or
contact lenses rose between 1965-66 and 1980 from 48.1
15
percent to 51.8 percent (table 17). To some extent thisrise reflects the fact that our population has been “aging”and a higher percent of older persons wear corrective
lenses. (Ifthedata are’’adjusted’’ to make the 1965-66population similar to the 1980 population with respectto the proportion of persons in each age group, theincrease in the proportion of persons wearing correctivelenses from 1965-66 to 1980 was only 1 percent.)
● Among children ages 3-16 years, the proportion wearingcorrective lenses was about the same in 1965-66 as it
was in 1980. However, for persons ages 17-24 years,the proportion wearing corrective lenses has declinedfrom 41.6 percent in 1965-66 to 36.5 percent in 1980,
The proportions of persons ages 25-44 years and 45years and over wearing corrective lenses has increased.
. A very large gap between the proportion of white andblack persons wearing corrective lenses remained from1965-66 through 1980.
. The proportion of persons wearing contact lenses in-creased almost fivefold between 1965 and 1980.
16
References
I Bu~ea” of Health professions: Third Report to the Pre~~~ent and
Congress on the Status of Health Professions Personnel in theUnited States, January 1982. DHHS Pub. (HRA) 82-2. HealthResources Administration. Washington. U.S. Government PrintingOftIce, Feb. 1982.
~Nati~na] Center for Health Statistics, M. Wildec Characteristics
of persons with corrective lenses, United States, 1971. Vital andHealth Statistics. Series 1O-NO. 93. DHEW Pub. No. (HRA) 75-1520. Health Resources Administration. Washington. U.S. Govem-mimt Printing Office, Sept. 1974.
‘National Center for Health Statistics, J. Roberts and M. Rowland:Refraction status and motility defects of persons 4-74 years, UnitedStates, 1971-72. Vital and Health Statistics. Series 1I-No. 206.DHEW Pub. No. (PHS) 78-1654. Public Health Service.Washington. U.S. Government Printing Office, Aug. 1978.
4Nutional Center for Health Statistics, M. Hannaford: Characteristicsof patients of selected types of medical specialists and practitioners,United States, July 1963-June 1964. Vital and Health Statistics.Series IO-NO. 28. DHEW Pub. No. (PHS) 1000. Public HealthSmvicc, Washington. U.S. Government Printing Office, May 1966.
‘National Center for Health Statistics, M. Hannaford: Characteristicsof persons with corrective lenses, United States, July 1965-June1966. Vital and Health Statistics. Series IO-NO. 53. DHEW Pub.No. (PHS) 1000. Public HeaIth Service. Washington. U.S. Gover-nmentPrinting Office, June 1969.
fII_Is DepafimentofHealthand Human Services: Eyeglasses and. .ccmtact lenses, purchases, expenditures, and sources of payment.National Medical Care Expenditures Study. Data Preview No. 11.1982.
7National Center for Health Statistics, H. Koch and T. Ezzati:Office visits to ophthalmologists, National Ambulatory Medical CareSuNcy, United States, 1976. Advance Data from Vital and HealthStatistics, No. 31. DHEW Pub. No. (PHS) 78-1250. Public HealthService. Washington. U.S. Government Printing Office, July 1978.
‘Notional Center for Health Statistics, J. Roberts and J. Ludford:Monocular visual acuity of persons 4-74 years, United States, 1971-72. Vihd and Health Statistics. Series 11-No. 201. DHEW Pub.No. (HRA) 77-1646. Health Resources Administration. Washington.U.S. Government Printing Office, Mar. 1977.
‘National Center for Health Statistics, J. Ganley and J. Roberts:Eyc conditions and related need for medical care among persons1-74 years of age, United States, 197 I-72. Vital and Health Statistics.Swim I l-No. 228. DHHS Pub. No. (PHS) 83-1678. Public HealthService. Washington. U.S. Government Printing Office, Mar. 1983.
l“Fltming, N. S.: Socio-demographic differences in access to visioncure among U.S. adults, 1974-75. To be published in MedicalCure in 1983. (Currently being edited).
1Iu ,S, Bureau of the Census: Preliminary estimates of the population
Llf the United States, by age, sex, and race, 1970-81. CurrentPqudafion Reports. Series P-25, No. 917. Washington. U.S. Gov-ernment Printing Office, 1982.
1zNational Center for Health Statistics, S. Jack and P. Ries: current
estimates from the National Health Interview Survey, United States,1979. Vital and Health Statistics. Series 1O-NO. 136. DHHS Pub.No. (PHS) 81-1564. Public Health Service. Washington. U.S. Gov-ernment Printing Office, Apr. 1981.
IsNational Center for Health Statistics, S. Jack: current estimates
from the National Health Interview Survey, United States, 1980.Vital and Health Statistics. Series 10-No. 139. DHHS Pub. No.(PHS) 81-1567. Public Health Service. Washington. U.S. Gover-nmentPrinting Office, Dec. 1981.
‘unpublished estimates, Division of Associated and Dental HealthProfessions, Bureau of Health Professions, Health Resources Admin-istration, Department of Health and Human Services, Feb. 1983.
‘5Bureau of Health Professions, L. E. Jensen, L. E. Wunderman,and L. J. Goodman: Characteristics of Physicians, District of Colum-bia, December 31, 1979. DHHS Pub. No. (HRA) 82-109. HealthResources Administration. Washington, D.C. 1982.
l’5Nationa] Center for Health Statistics: Health IntetView SurveY
procedures, 1957-74. Vital and Health Statistics. Series l-No. 11.DHEW Pub. No. (HRA) 75-1311. Health Resources Administration.Washington. U.S. Government Printing Office, Apr. 1975.
iTNational Center for Health Statistics: Health SurveY procedure>
concepts, questionnaire development, and definitions in the HealthInterview Survey. Vital and Health Statistics. Series l-No. 2. DHEWPub. No. (PHS) 1000. Public Health Service. Washington. U.S.Government Printing Office, May 1964.
!sNational Center for Health Statistics: The statistical design ‘f
the Health-Household Interview Survey. Health Statistics. A-2. PHSPub. No. 584-A2. Public Health Service. Washington. U.S. Gover-nmentPrinting Office, July 1958.
IgNational Center for Health Statistics, J. Bean: Estimation and
sampling variance in the Health Interview Survey. Vital and HealthStatistics. Series 2-No. 38. DHEW Pub. No. (PHS) 1000. PublicHealth Service. Washington. U.S. Government Printing OffIce, June1970.
‘“National Center for Health Statistics, D. Koons: Quality controland measurement of nonsampling error in the Health InterviewSurvey. Vital and Health Statistics. Series 2-No. 54. DHEW Pub.No. (HSM) 73-1328. Health Services and Mental Health Administra-tion. Washington. U.S. Government Printing Office, Mar. 1973.2 I National center for Health Statistics, E. Balamuth: Health interview
responses compared with medical records. Vital and Health Statistics.Series 2-No. 7. DHEW Pub. No. (PHS) 1000. Public Health Service.Washington. U.S. Government Printing Office, July 1965.
22National Center for Health Statistics, W. Madow: Interview data
on chronic condhions compared with information derived from medi-cal records. Vital and Health Statistics. Series 2-No. 23. DHEWPub. No. (PHS) 1000. Public Health Service. Washington. U.S.Government Printing Office, May 1967.
17
.

z~National Center for Health Statistics, C. Cannell and F. Fowler,
Jr.: Comparison of hospitalization reporting in three survey proce-psychological and behavioral variables on the reporting in householdinterviews. Vital and Health Statistics. Series 2-No. 26, DHE,W
dures. Vital and Health Statistics. Series 2-No. 8. DHEW Pub. Pub. No. (PHS) 1000. Public Health Service. Washington. U.S.No. (PHS) 1000. Public Health Service. Washington. U.S. Govem- Govemment Printing Office, Mar. 1968.ment Printing Office, July 1965.
~National Center for Health Statistics, C. Cannell, F. Fowler~
Jr., and K. Marquis: The influence of interviewer and respondent
List of detailed tables
Eye-care visits
1.
7-.
3. .
4.
‘i. .
b,
7.
Number of persons in population and percent distributionof persons by number of eye-care visits in the 12 monthsprior to interview, according to selected characteristics:United States, 1979 . . . . . . . . . . . . . . . . . 20
Number and percent distribution of eye-care visits by age,
~ccording to selected characteristics: United States, 1979. 2 I
Number and percent distribution of eye-care visits by typeof eyc-cmc specialist, according to selected characteristics:United Statq1979 . . . . . . . . . . . . . . . . . 23
Number and percent of eye-care visits to a doctor’s office,
by selected characteristics: United States, 1979 . . . 24
Population used in obtaining rates relating to eye-carevisits shown in this report, by race, education of headL>f family, sex, age, and family income: United States,
1979 . . . . . . . . . . . . . . . . . . . . . . . . . 25
Population used in obtaining rates relating to eye-carevisits shown in this report, by place of residence, geo-graphic region, SCX, and age: United States, 1979 . 26
Population used in obtaining rates relating to eye-carevis-its shown in this report, by family income, sex, andugc:Unitcd States, 1979.. . . . . . . . . . . . . . 27
Use of eyeglasses and contact lenses
n. Number of persons in population and percent of persons3 years of age and over with corrective lenses, by type
of lens, sex, and age: United States, 1979-80 . . . 28
~), Number of persons in population and percent of persons3 years of age and over with corrective Ienses, by typeof kns, race, and age: United States, 1979–80 . . 29
10. Number of persons in population and percent of persons3 years of agc and over with corrective lenses, by typeof lens, hispanic origin, and age: United States, 1979–80 . 30
11.
12.
13.
14.
15.
16.
Number of persons in population and percent of persons3 years of age and over with corrective lenses, by typeof lens, education of head of family, and age: UnitedStates, 1979–80 . . . . . . . . . . . . . . . . . . . . 31
Number of persons in population and percent of persons17 years of age and over with corrective lenses, by typeof lens, education of individual, and age: United States,1979–80 . . . . . . . . . . . . . . . . . . . . . . . . 33
Number of persons in population and percent of persons3 years of age and over with corrective lenses, by typeof lens, place of residence, and age: United States,1979–80 . . . . . . . . . . . . . . . . . . . . . ...35
Number of persons in population and percent of persons3 years of age and over with corrective lenses, by typeof lens, geographic region, and age United States,1979-80 . . . . . . . . . . . . . . . . . . . . . ...37
Number of persons in population and percent of persons3 years of age and over with corrective lenses, by typeof lens, family income, and age: United States,1979–80 . . . . . . . . . . . . . . . . . . . . . ...38
Number of persons in population and percent of persons17 years of age andover with corrective lenses, by typeof lens, occupational status, and age: United States,1979–80 . . . . . . . . . . . . . . . . . . . . . ...40
Trends in use of eyeglasses and contact lenses
17. Percent of persons 3 years of age and over with eyeglasses
and contact lenses, by selected characteristics: UnitedStates, fiscal year 1966 and calendar years 1971, 1977,1979 and 1980 . . . . . . . . . . . . . . . . . ...43
19
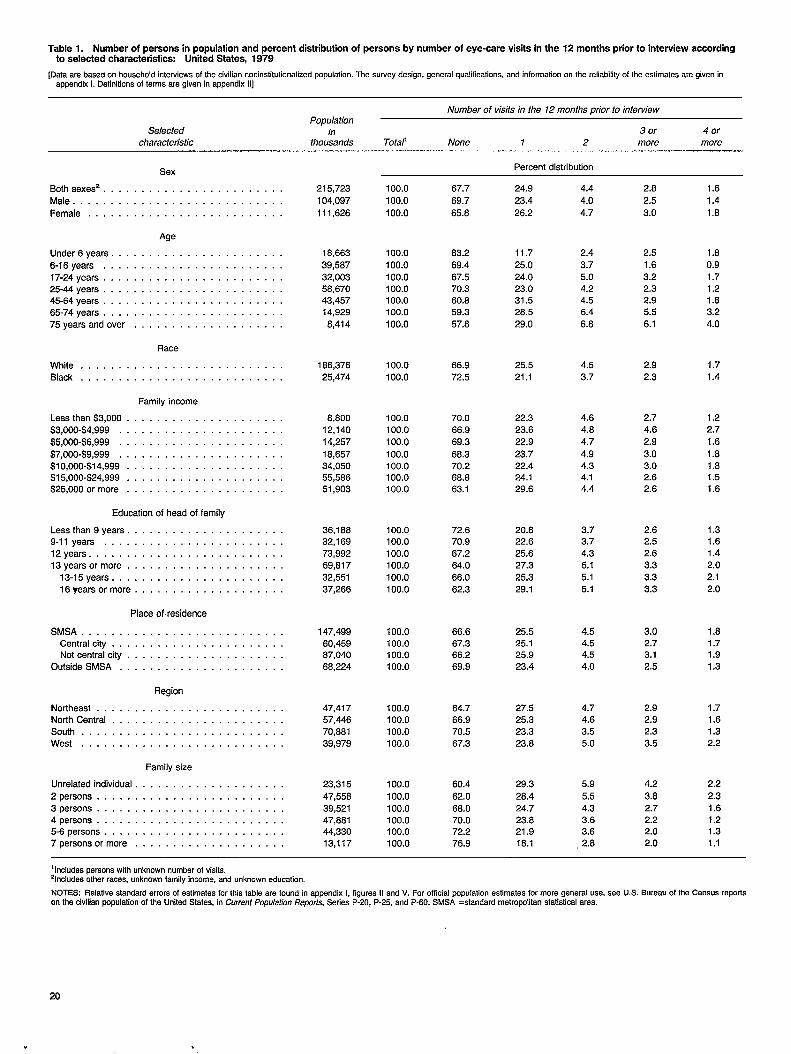
Tablel. Number ofpersons inpopulstion sndpercent datnbution ofpersons bynumber ofeye-care visits inthe12months pnortointewiew accordngtoselected chsrsctenstics United Ststes, 1979
[Data are based on household interviews of the civilian noninstitutionalized population. The swvey design, general qualifications, and information on the reliability of the eslimatea are given inappendix 1.Definitionaof terms are given in appendix II]
Number ofvMshrthe 12months prior to interviewPopulation
Selected in 3 or 4 or
characteristic thousands Total’ None 1 2 more more
Percent distributionSex
Bothsexesz . . . . . . . . . . . . . . . . . . . . . . . .
Male . . . . . . . . . . . . . . . . . . . . . . . . . . . .
Femsle . . . . . . . . . . . . . . . . . . . . . . . . . .
Age
Under6years . . . . . . . . . . . . . . . . . . . . . . .
6-16years . . . . . . . . . . . . . . . . . . . . . . . .17-24years . . . . . . . . . . . . . . . . . . . . . . . .25-44yeara . . . . . . . . . . . . . . . . . .45-64years . . . . . . . . . . . . . . . . . . . . . . . .
65-74yesrs . . . . . . . . . . . . . . . . . . . . .75yearsand over . . . . . . . . . . . . . . . . . . . .
Race
White . . . . . . . . . . . . . . . . . . . . . .Black . . . . . . . . . . . . . . . . . . . . . . . . . . .
Family income
Leesthan$3,000 . . . . . . . . . . . . . . . . . . . . .
$3,000-$4,999 . . . . . . . . . . . . . . . . . . . . . .
$5,000-$6,999 . . . . . . . . . . . . . . . . . . . . . .$7,000-$9,999$10,000-$14,999” :::::::::::: :::::::::$15,000-$24,999 . . . . . . . . . . . . . . . . . . .$25,0000rmore . . . . . . . . . . . . . . . . . . . . .
Education of head of family
Leasthan 9years . . . . . . . . . . . . . . . . . . . . .9-n years . . . . . . . . . . . . . . . . . . . . . . . .12years . . . . . . . . . . . . . . . . . . . . . . .
13yearsormore . . . . . . . . . . . . . . . . . . . . .13-15yeare . . . . . . . . . . . . . . . . . . .
16yearsormore . . . . . . . . . . . . . . . . . . . .
Place of residence
SMSA . . . . . . . . . . . . . . . . . . . . . . . . . . .Centralcify . . . . . . . . . . . . . . . . . . . .Notcentralcify . . . . . . . . . . . . . . . . . . . . .
OutsideSMSA . . . . . . . . . . . . . . . . . . . . . .
Region
Norfheaet . . . . . . . . . . . . . . . . . . . . . . . . .North Central . . . . . . . . . . . . . . . . . . . . .
South . . . . . . . . . . . . . . . . . . . . . . . . . . .West . . . . . . . . . . . . . . . . . . . . . . . . . . .
Family size
100.0100.0
100.0
67.7
69.7
65.8
24.9
23.4
26.2
4.4
4.0
4.7
2.6
2.5
3.0
1.6
1.4
1.8
1.8
0.91.71.21.63.24.0
1.71.4
1.2
2.7
1.6
1.61.61.51.6
1.31.61.42.0
2.12.0
1.61.71.9
1.3
1.71.61.32.2
2.2
2.3
1.61.21.3
1.1
215,723
104,097
111,626
18,663
39,587
32,00358,67043,45714,929
6,414
100.0100.0100.0100.0100.0100.0
100.0
83.2
69.4
67.570.360.859.3
57.6
11.7
25.0
24.0
23.0
31.5
26.5
29.0
2.4
3.75.04.24.56.4
6.8
2.5
1.6
3.22.32.95.5
6.1
186,376
25,474
100.0100.0
66.972.5
25.5
21.1
4.5
3.7
2.92.3
8,80012,140
14,257
18,657
34,05055,58651,903
22.323.6
22.9
23.722.424.129.6
4.64.8
4.7
4.94.34.14.4
2.74.6
2.9
3.03.02.62.6
100.0100.0
100.0
100.0100.0100.0100.0
70.066.9
69.3
68.370.268.863.1
36,16832,16973,992
69,817
32,55137,266
100.0100.0100.0100.0
100.0100.0
72.6
70.9
67.2
64.0
66.0
62.3
20.8
22.6
25.6
27.3
25.3
29.1
3.7
3.7
4.3
5.1
5.1
5.1
2.6
2.5
2.6
3.3
3.3
3.3
147,49960,459
87,040
68.224
100.0100.0100.0100.0
66.667.3
66.2
69.9
25.525.1
25.9
23.4
4.54.5
4.5
4.0
3.02.73.12.5
47,417
57,446
70,881
39,979
100.0100.0100.0100.0
64.7
66.9
70.5
67.3
27.5
25.3
23.3
23.8
4.7
4.6
3.5
5.0
2.9
2.9
2.3
3.5
Unrelated individual . . . . . . . . . . . . . . . . . . . .
2persons . . . . . . . . . . . . . . . . . . . . . . . . .
3persons . . . . . . . . . . . . . . . . . . . . . . . . .4persons . . . . . . . . . . . . . . . . . . . . . . . . .5-6persons . . . . . . . . . . . . . . . . . . . . .7peraonsormore . . . . . . . . . . . . . . . . . . . .
23,315
47,556
39,521
47,861
44,330
13,117
100.0100.0100.0100.0100.0100.0
60.4
62.0
68.070.072.2
76.9
29.3
28.4
24.723.821.918.1
5.9
5.5
4.3
3.6
3.6
2.8
4.2
3.82.72.22.02.0
llncludea persons with unknown number of viaits.%cludesot her races, unknown family income, and unknown education.
NOTES: Relative standard errors ofestimates fortKstable are found inappentix l, figures hand V. Foroticial ppulation estimates formore general use, see U. S. Bureau of the Census repofison fheciviKsn ~pulation oflhe United Statea, in Current Population Re~ds, Seties P-20, P-25, and P-60. SMSA =atandard metropolitan statistical area.
20
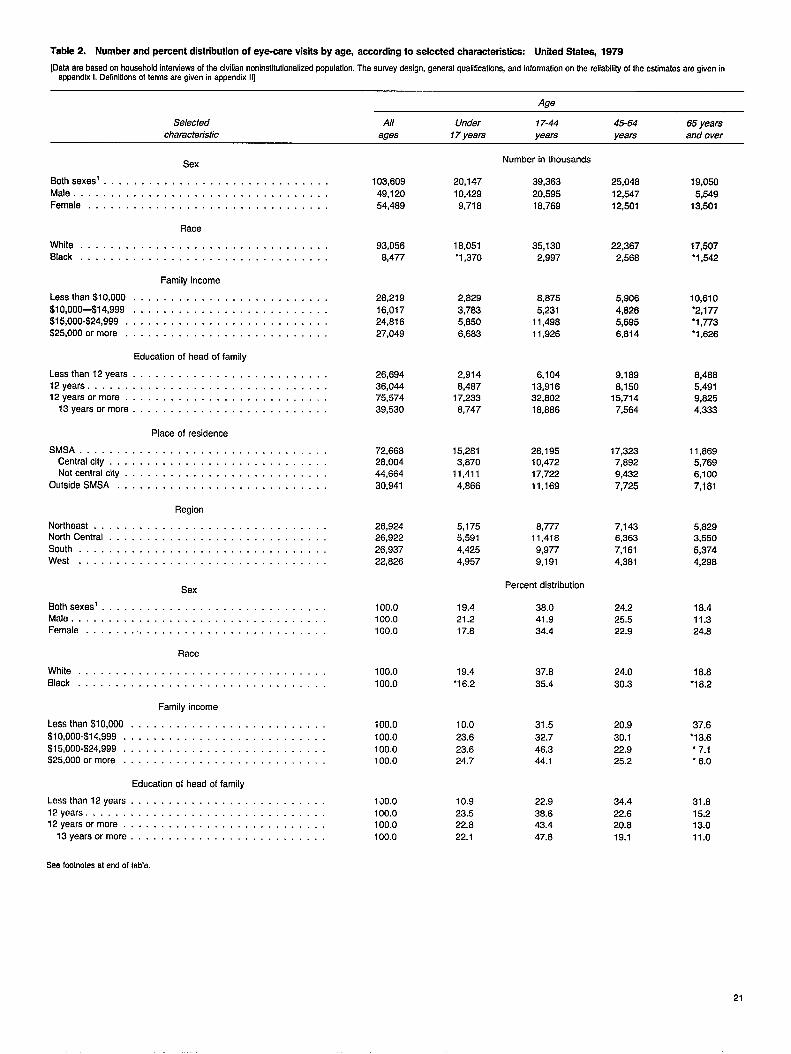
Table2. NumWrand pementdsttibution ofeye-~re vistisby sge, sccordng toselectd chsmdetisti~: United States, 1979
[Data are based on household interviewsof the civilian noninsfitutionalizedpopulation. The survey design, general qualifications, and informationon the refinabilityof the estimates are given inappandix 1.Definitionsof terms are given in appendix II]
Age
Selected All Under 17-44 45-64 65 yearscharacteristic a.qes 17 vears vears vears and over
Sex
Bo[h sexes’ . . . . . . . . . . . . . . . . . . . . . . . . . . . . . .
Male . . . . . . . . . . . . . . . . . . . . . . . . . . . . . . . . . .
Female . . . . . . . . . . . . . . . . . . . . . . . . . . . . . . . .
Rsce
White . . . . . . . . . . . . . . . . . . . . . . . . . . . . . . . . .Black . . . . . . . . . . . . . . . . . . . . . . . . . . . . . . . . .
Family income
Leasthan$lO,OOO .,....... . . . . . . . . . . . . . . . . .
$10!000-$14,999$15,000-$24,999 .::::::::::: :::::::::::::::
$25,0000rmore . . . . . . . . . . . . . . . . . . . . . . . . . . .
Education of head of family
Lessthan 12years . . . . . . . . . . . . . . . . . . . . . . . . . .12yeare . . . . . . . . . . . . . . . . . . . . . . . . . . . . . . . .12yearsormore . . . . . . . . . . . . . . . . . . . . . . . . . .
13yearsormore . . . . . . . . . . . . . . . . . . . . . . . . . .
Place of reeidence
SMSA . . . . . . . . . . . . . . . . . . . . . . . . . . . . . . . . .Centrality . . . . . . . . . . . . . . . . . . . . . . . . . . . . .Notcsntralcity . . . . . . . . . . . . . . . . . . . . . . . . . . .
OulsideSMSA . . . . . . . . . . . . . . . . . . . . . . . . . . . .
Region
Northeast . . . . . . . . . . . . . . . . . . . . . . . . . . . . . . .North Central . . . . . . . . . . . . . . . . . . . . . . . . . . . . .
South . . . . . . . . . . . . . . . . . . . . . . . . . . . . . . . . .West . . . . . . . . . . . . . . . . . . . . . . . . . . . . . . . . .
Sex
Bothsexesl . . . . . . . . . . . . . . . . . . . . . . . . . . . . . .Male . . . . . . . . . . . . . . . . . . . . . . . . . . . . . . . . . .Female . . . . . . . . . . . . . . . . . . . . . . . . . . . . . . . .
Race
While . . . . . . . . . . . . . . . . . . . . . . . . . . . . . . . . .
Black . . . . . . . . . . . . . . . . . . . . . . . . . . . . . . . . .
Family income
Lessthan$lO,OOO . . . . . . . . . . . . . . . . . . . . . . . . . .
$10,000-$14,999 . . . . . . . . . . . . . . . . . . . . . . . . . . .
$15,000-$24,999 . . . . . . . . . . . . . . . . . . . . . . . . . . .$25,0000rmore . . . . . . . . . . . . . . . . . . . . . . . . . . .
Education of head of family
Lessthan 12years . . . . . . . . . . . . . . . . . . . . . . . . .12yeare . . . . . . . . . . . . . . . . . . . . . . . . . . . . . . .12yearsormore ..,...... . . . . . . . . . . . . . . . . . .
13yearsormore . . . . . . . . . . . . . . . . . . . . . . . . . .
.%mfootnotesatend oflable.
103,609
49,120
54,489
93,0568,477
28,219
16,01724.616
26,694
36,04475,57439,530
72,88828,00444,884
30,941
26,92426,922
26,93722,826
100.0100.0100.0
100.0
100.0
100.0
100.0100.0100.0
1Jo.o100.0100.0100.0
20,147
10,429
9,718
18,051“1 ,370
2,829
3,7835,8506,683
2,914
8,48717,233
8,747
15,2813,870
11,411
4,866
5,1755,5914,4254,957
19.421.217.8
19.4
●16.2
10.0
23.8
23.624.7
10.9
23.522.6
22.1
Number in thousands
39,36320,595
18,769
35,1302.997
8,675
5,23111,49811,926
6.10413,91632,80218,886
28,19510,47217,722
11,169
6,77711,418
9,9779,191
Percent distribution
38.041.934.4
37.8
35.4
31.5
32.746.344.1
22.9
38.643.447.8
25,048
12,54712,501
22,3672,568
5,906
4,8265,6956,814
9,1898,150
15,7147,564
17,3237,8929,432
7,725
7,1436,3637,1614,381
24.225.522.9
24.0
30.3
20.9
30.1
22.925.2
34.422.820.8
19.1
19,050
5,54913,501
17,507‘1 ,542
10,610
●2,177*1 ,773‘1 ,626
8,4885,4919,8254,333
11,8695,7696,1007,181
5,8293,550
5,3744,298
18.411.324.8
18.8
*18.2
37.6
*13.6
‘ 7.1“ 6.0
31.815.213.0
11.0
21
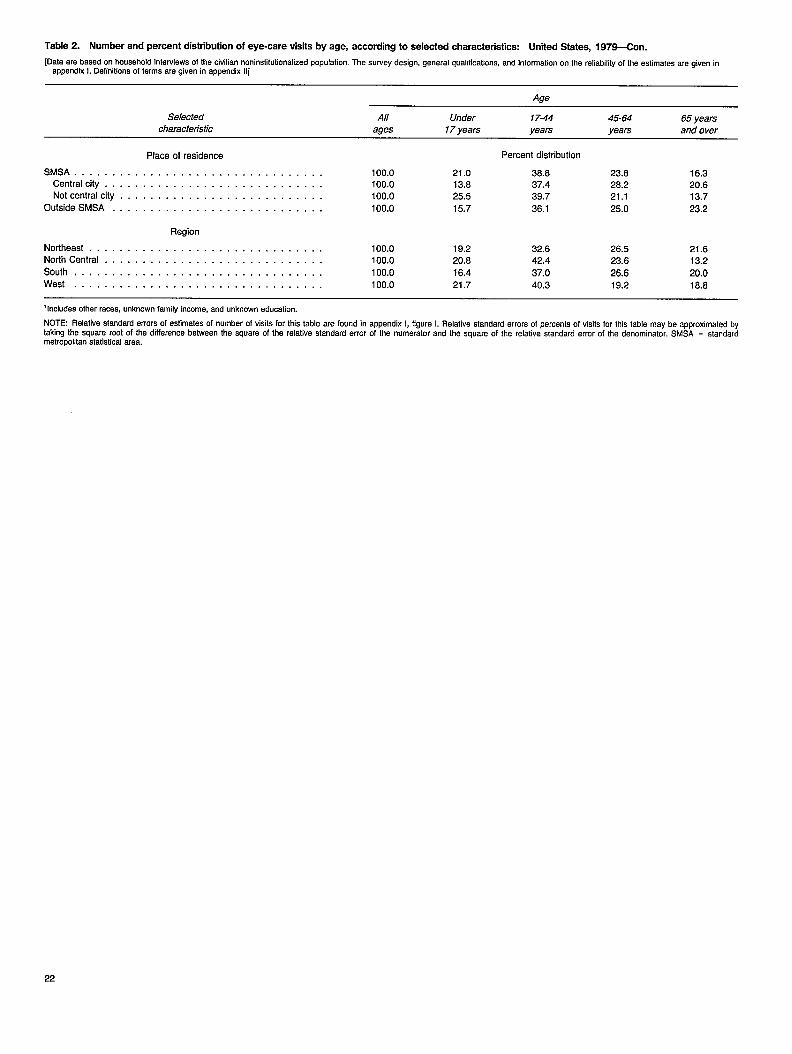
Table2. Number andpercent distribution ofeye-care visits byage, according toaelected characterfatics: United States, 1979-Con.
[Data are based on household interviews of the civilian noninstitutionalized population. The suwey design, general qualifications, and information on the refiabili(y of the estimates are given m
appendix 1.Definitions of terms are given in appendix II]
Age
Selected All Under 17-44 45-64 65 yearscharacteristic ages 17 years years years and over
Place of residence Percent distribution
SMSA . . . . . . . . . . . . . . . . . . . . . . . . . . . . . . . . . 100.0 21.0 38.8 23.8Centrality . . . . . . . . . . . . . . . . . . . . . . . . . . . . .
16.3
100.0 13.6 37.4 28.2 20.6
Noncentral city . . . . . . . . . . . . . . . . . . . . . . . . . . . 100.0 25.5 39.7 21.1 13.7OutsideSMSA . . . . . . . . . . . . . . . . . . . . . . . . . . . . 100.0 15.7 36.1 25.0 23.2
Region
Northeast . . . . . . . . . . . . . . . . . . . . . . . . . . . . . . . 100.0 19.2 32.8 28.5North Central . . . . . . . . . . . . . . . . . . . . . . . . . . . . .
21.6
100.0 20.8 42.4 23.8 13.2South . . . . . . . . . . . . . . . . . . . . . . . . . . . . . . . . . 100.0 16.4 37.0 26.6 20.0West . . . . . . . . . . . . . . . . . . . . . . . . . . . . . . . . . 100.0 21.7 40.3 19.2 16.8
‘Includes other racea, unknown family income, and unknown education.
NOTE: Relative standard errors ofestimatea ofnumber ofviaita fortMstable are found inappendix l, figure l. Relative standard errors ofpercen& ofvisits fort fistable may beapproxlmatedbytaMngthe square root of thetifference beWeenthe aquareof there!ative standard error of thenumerator andthesquare of therelative atandard error of thedenominator. SMSA = standardmetropolitan statiafical area.
22
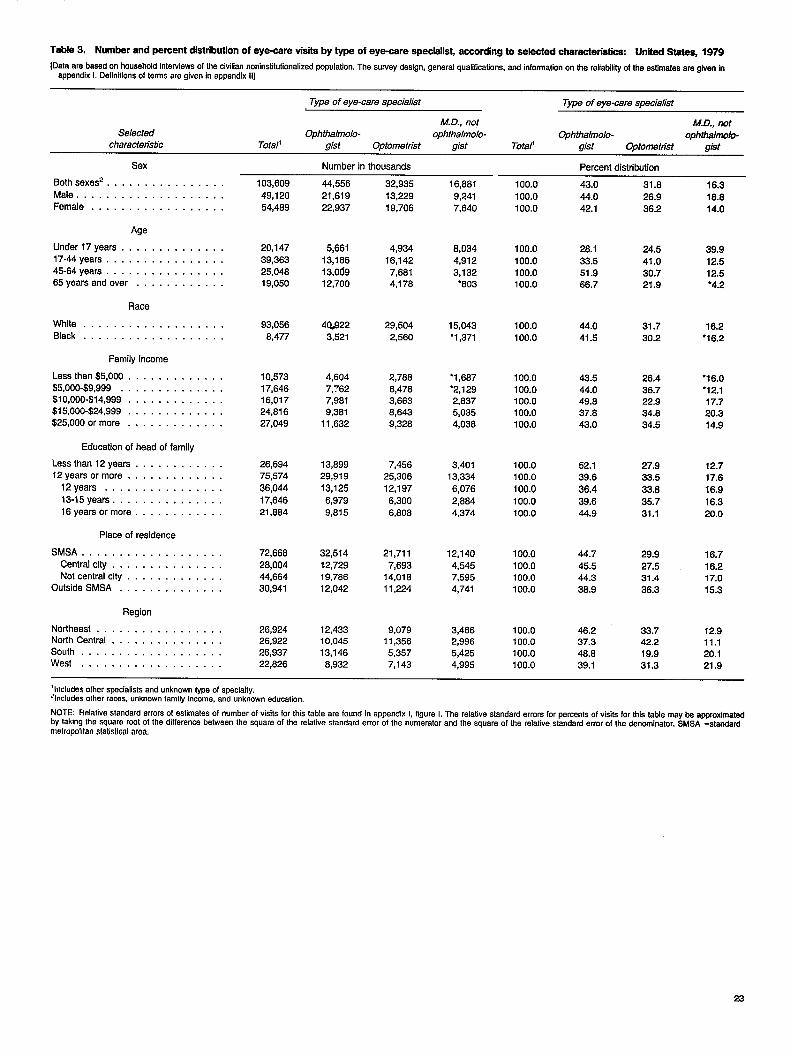
Table 3. Number and percent diatnbution of eye-care visits by type of eye-care speoielis~ according to selected chsrraoteristirx United Stafe$ 1979
[Data ara based on houaahold interviewsof the civilian noninsfitutionalized population. The survey design, general quafificationa, and information on the relfablii of the estimates are given in
aPPendix 1. Definitionsof terms are given in appendix III
Type of eye-care specialist Type of eye-care specialist
M. D., not M.D., notSelected Ophthalmolo- ophthalmolo- Ophthalmolo- ophthalnrob
characteristic Tots/l gist Optometrist gist Totaf gist Optometrist gist
Sex
Bothsexesz . . . . . . . . . . . . . . . .
Male . . . . . . . . . . . . . . . . . . . .Female . . . . . . . . . . . . . . . . . .
Age
Under 17 yeara . . . . . . . . . . . . . .17-44 yesrs . . . . . . . . . . . . . . . .45-64 years . . . . . . . . . . . . . . . .65 years and over . . . . . . . . . . . .
Race
White . . . . . . . . . . . . . . . . . . .
Black . . . . . . . . . . . . . . . . . . .
Family income
Lesathan $5,000, . . . . . . . . . . . .
$5,000-$9,999 . . . . . . . . . . . . . .$10,000-$14,999 . . . . . . . . . . . . .
$15,000-$24,999 . . . . . . . . . . . . .$25,0000r more . . . . . . . . . . . . .
Education of head of family
Lessthan 12 yeara . . . . . . . . . . . .12years or more . . . . . . . . . . . . .
12years . . . . . . . . . . . . . . . .
13.15 yeara . . . . . . . . . . . . . . .16yeara or more . . . . . . . . . . . .
Place of residence
SMSA . . . . . . . . . . . . . . . . . . .
Central city . . . . . . . . . . . . . . .Not central city . . . . . . . . . . . . .
Outside SMSA . . . . . . . . . . . . . .
Region
Northeast . . . . . . . . . . . . . . . . .Norfh Central . . . . . . . . . . . . . . .South . . . . . . . . . . . . . . . . . . .West . . . . . . . . . . . . . . . . . . .
Number in thousands Percent distribution--
103,60949,12054.489
44,55621,61922,937
5,66113,16613,06912,700
4Q,!322
3,521
4,6047,?627,9619,361
11,632
13,69929,919
13,125
6,9799,815
32,514
12,72919,78612,042
12,43310,04513,146
6,932
32,93513,22919,706
4,93416,1427,6614,176
29,5042,560
2,7866,4783,6638.843
16,881
9,2417,640
100.0
100.0100.0
43.044.042.1
31.626.9
36.2
16.318.8
14.0
39.912.512.5‘4.2
16.2‘16.2
‘1 6.0‘12.117.720.314.9
12.717.6
16.9
16.320.0
16.7
16.217.015.3
12.911.120.121.9
20,147
39,36325,04819,050
6,0344,912
3,132“603
100.0100.0100.0100.0
28.1
33.561.966.7
24.541.030.721.9
93,0568,477
15,043*1,371
100.0100.0
44.041.5
31.730.2
10,57317,64616,01724,81627,049
‘1 ,687‘2,1 292,8375,0354,038
100.0100.0100.0100.0100.0
43.544.049.837.843.0
26.4
36.722.934.834.5
26,69475,574
36,04417,64621,884
7,45625,306
12,197
6,3008,808
21,711
7,69314,01811,224
9,07911,356
5,3577,143
3,40113,334
6,0762,8844,374
100.0100.0
100.0
100.0100.0
52.139.6
36.439.644.9
27.933.5
33.6
35.731.1
72,66628,00444,66430,941
12,140
4,5457,5954,741
100.0100.0100.0100.0
44.745.544.3
38.9
29.9
27.531.436.3
2!6,92426,92226,93722,826
3,4662,996
5,4254,995
100.0100.0
100.0100.0
46.237.346.639.1
33.742.219.931.3
‘Includes other apeciallsts and unknown type of specialty.%cludesothrrrraces, unknown family income, and unknown adulation,
NOTE? Relative slandard errors ofestimales ofnumbarof visits fortMstable are found inappendx l, figure l. Tharalative standard errors for~rcents ofvisik forttis table may ba~oximat~bytaking thesquare rmtofthe dfferenw beWeenthe square of therelative standard emorofthe numerator andthesquare oftierelative standard emorof~e denminator. SMSA =afsndsrd
mfiropohfan statistical area,
23
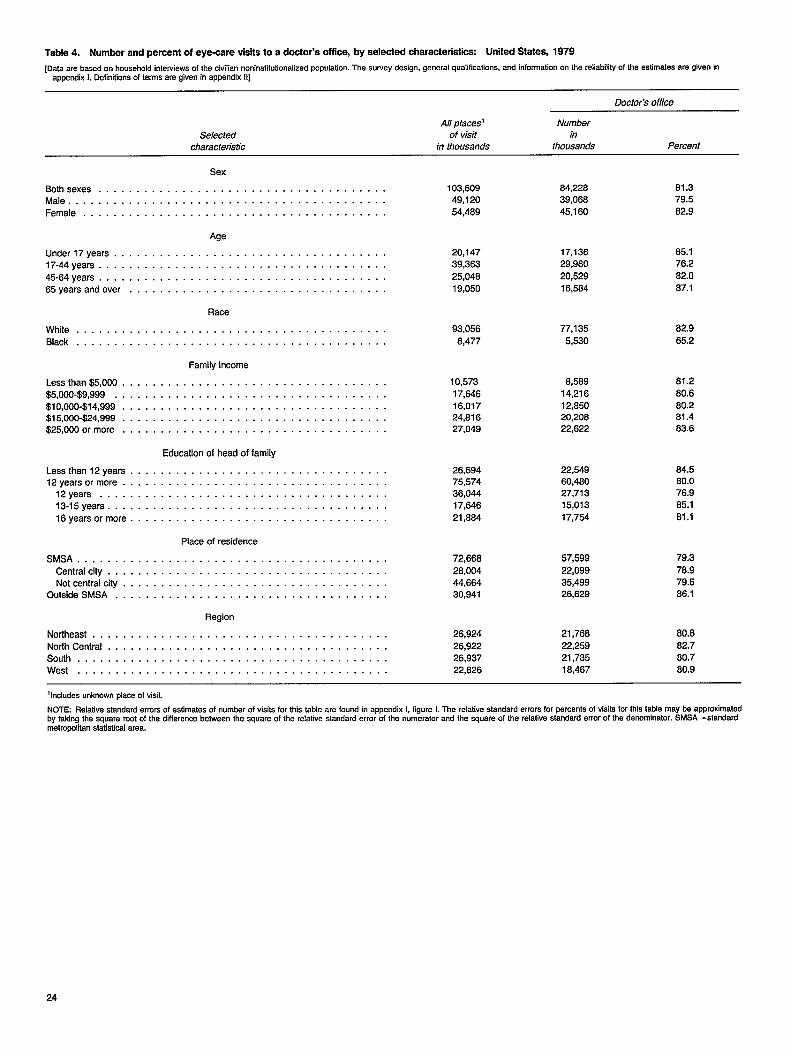
Table4. Number andpercent ofeye-care viaitato adootor's office, byaelected charaotenstkx United Statea, 1979
[Data are based on household intawiews of the civilian noninstitutionalized population. The survey design, general qualifications, and information on the reliabifitj of the estimates ara given inappendix 1.Definitionsof tenna are given in appendix II]
Doctork office
All places’ NumberSelected of visit in
characteristic in thousands thousands Percent
Sex
Both sexes . . . . . . . . . . . . . . . . . . . . . . . . . . . . . . . . . . . . . . 103,609 84,228 81.3Male . . . . . . . . . . . . . . . . . . . . . . . . . . . . . . . . . . . . . . . . . . 49,120 39,088 79.5
Female . . . . . . . . . . . . . . . . . . . . . . . . . . . . . . . . . . . . . . . . 54,489 45,160 82.9
Age
Under 17years . . . . . . . . . . . . . . . . . . . . . . . . . . . . . . . . . . . . 20,147 17,136 85.1
17-44years . . . . . . . . . . . . . . . . . . . . . . . . . . . . . . . . . . . . . 39,363 29,960 76.2
45-84years . . . . . . . . . . . . . . . . . . . . . . . . . . . . . . . . . . . . . . 25,048 20,529 82.0
65yearsand over . . . . . . . . . . . . . . . . . . . . . . . . . . . . . . . . . . 19,050 18,584 87.1
Race
White . . . . . . . . . . . . . . . . . . . . . . . . . . . . . . . . . . . . . . . . . 93,056 77,135 82.9
Black . . . . . . . . . . . . . . . . . . . . . . . . . . . . . . . . . . . . . . . . . 8,477 5,530 65.2
Family income
Lessthan$5,000 . . . . . . . . . . . . . . . . . . . . . . . . . . . . . . . . . . . 10,573 8,589 81.2
$5,000-$9,999 . . . . . . . . . . . . . . . . . . . . . . . . . . . . . . . . . . . . 17,646 14,216 80.6
$10,000-$14,999 . . . . . . . . . . . . . . . . . . . . . . . . . . . . . . . . . . . 16,017 12,850 80.2$15,000-$24,999 . . . . . . . . . . . . . . . . . . . . . . . . . . . . . . . . . . . 24,818 20,208 81.4
$25,0000rmore . . . . . . . . . . . . . . . . . . . . . . . . . . . . . . . . . . . 27,049 22,622 83.6
Education of head of family
Lessthan 12years . . . . . . . . . . . . . . . . . . . . . . . . . . . . . . . . . 26,694 22,549 84.512yearsormore . . . . . . . . . . . . . . . . . . . . . . . . . . . . . . . . . . . 75,574 60,480 80.0
12years . . . . . . . . . . . . . . . . . . . . . . . . . . . . . . . . . . . . . . 36,044 27,713 76.9
13-15years . . . . . . . . . . . . . . . . . . . . . . . . . . . . . . . . . . . . . 17,646 15,013 85.1
16yearaormore . . . . . . . . . . . . . . . . . . . . . . . . . . . . . . . . . . 21,884 17,754 81.1
Place of residence
SMSA . . . . . . . . . . . . . . . . . . . . . . . . . . . . . . . . . . . . . . . . . 72,668 57,599 79.3
Centrality. . . . . . . . . . . . . . . . . . . . . . . . . . . . . . . . . . . . . 28,004 22,099 78.9Notcentralcity . . . . . . . . . . . . . . . . . . . . . . . . . . . . . . . . . . . 44,664 35,499 79.5
OutaideSMSA . . . . . . . . . . . . . . . . . . . . . . . . . . . . . . . . . . . . 30,941 26,629 86.1
Region
Northeast . . . . . . . . . . . . . . . . . . . . . . . . . . . . . . . . . . . . . . . 26,924 21,768 80.8North Central . . . . . . . . . . . . . . . . . . . . . . . . . . . . . . . . . . . . . 26,922 22,259 82.7South . . . . . . . . . . . . . . . . . . . . . . . . . . . . . . . . . . . . . . . . . 26,937 21,735 80.7West . . . . . . . . . . . . . . . . . . . . . . . . . . . . . . . . . . . . . . . . . 22,826 18,467 80.9
Ilncludes unknown place of visit.
NOTE Relafive standard errors ofestimates ofnum&r ofviaita forttia table are found inappentix l, figure l. Therelative standard errors forprcenta ofvisib for~stable mayhapproximatedby&ting thesquare rwtofthe tifferenw beWeenthe square of there fativestandard error of thenumerator andtheaquare of therelative standard error of the denominator. SMSA =standardmetropolitan statistical area.
24

TIIble5. ~ulatim usdinobtining ratearelating toeyeare visfisshown inttisre~@ bymce,4~tmn ofheadof timi~, ~z~e, andtimi~Inoome United States, 1979
[Data are based on household interviews of the sivilian noninsfitutionalized pepulafion. The suwey design, general qualiicafions, and information on the reliability of the estimates are given in
appendix 1.Definitionsof terms are given in appendix II]
Race Education of head of family
Sex, age, and All Less than 9-12 9-11 13 yeare 13-15family income
16 yearsperaons~ White Black 9 years years yeara 12 yeara or more yeara or more
Both sexesz
All agea . . . . . . . . . . . .
Under 6years. ..,.....6-16years . . . . . . . . . .17-24 years . . . . . . . . . .25-44 years . . . . . . . . . .45-64 years . . . . . . . . . .
65-74 years . . . . . . . . . .75 years and over . . . . . .
Male
All agea . . . . . . . . . . . .
Under 6 years . . . . . . . . .6-16years . . . . . . . . . .17-24years . . . . . . . . . .25-44years . ...,,....45-64years . . . . . . . . . .
65.74years . . . . . . . . . .75years and over . . . . . .
Female
Alleges . . . . . . . . . . . .
Undar6years . . . . . . . . .6-16years . . . . . . . . . .17-24years . . . . . . . . . .25-44yeara . . . . . . . . . .
45-64years . . . . . . . . . .
65.74years, . . . . . . . . .75 years and over . . . . .
FamllyincomeLess than $10,000
Alleges . . . . . . . . . . . .
Under6years . . . . . . . . .6-16years . . . . . . . . . .
17.24years . . . . . . . . . .
25-44years . . . . . . . . . .45-64years . . . . . . . . . .65-74years . . . . . . . . . .75yearsandover . . . . . .
$10,000 or more
Alleges . . . . . . . . . . . .
Under6years . . . . . . . . .6-16years . . . . . . . . . .
17-24years . . . . . . . . . .
25-44years . . . . . . . . . .45-64yaars . . . . . . . . . .
65-74years . . . . . . . . . .75yaara and over . . . . .. .
215,723
16,66339,58732,00356,67043,457
14,929
6,414
104,097
9,56020,13415,60328,39020,773
6,4943,122
111,626
9,06319,45316,400
30,260
22,664
8,4355,291
4,8568,139
9,5279,6196,9547,738
5,020
141,539
12,22227,737
19,71444,94229,459
5,2942,171
166,376
15,325
32,84327,28951,10538,717
13,445
7,651
90,390
7,897
16,73813,43625,06316,598
5,8432,815
95,966
7,426le,lo513,85326,042
20,119
7,6034,636
41,745
3,3155,257
7,4617,2057,1966,7884,521
128,324
10,87524,702
17,803
40,60727,263
5,0102,044
25,474
2,9275,9694,0836,3924,062
1,336
706
11,632
1,4643,0061,8492,7911,849
577276
13,642
1,4432,9632,234
3,601
2,212
759430
11,193
1,4252,728
1,6692,1851,638
874474
10,732
1,0952,523
1,562
3,4901,721
241100
36,188
2,0015,8484,0335,5199,351
5,554
3,662
16,964
1,0002,9582,0982,5474,225
2,5301,605
19,224
1,0022,6901,9352,972
5,126
3,0232,277
17,352
9992,482
1,4531,9743,6223,7682,854
14,496
7652,657
2,0582,9314,343
1,180566
Number of persona in thousands
106,161
9,92620,81417,52627,62021,140
6,122
2,613
50,907
5,12010,654
8,50013,157
9,9982,557
922
55,254
4,80610,1609,026
14,663
11,143
3,5651,691
26,669
3,1664,581
5,2235,2344,0963,0471,521
69,648
5,94114,365
10,879
20,64414,667
2,279
871
32,169
2,936
6,2155,1827,1007,004
2,539
1,191
15,292
1,521
3,1482,5553,2473,3111,090
418
16,877
1,4173,0672,626
3,853
3,6931,449
772
11,443
1,3952,156
1,8402,011I ,eoo1,456
784
17,663
1,2963,4712,870
4,4814,483
792272
73,992
6,98814,59912,34420,72014,136
3,563
1,622
35,615
3,5997,5055,9449,9106,6871,467
503
38,376
3,3697,0936,400
10,811
7,449
2,1161,119
15,425
1,7712,425
3,3833,2232,2961,590
737
51,983
4,64510,894
8,00916,16310,185
1,487599
69,817
6,47512,27510,02724,56912,092
2,9421,416
34,424
3,3296,1404,764
12,327
6,1211,278
466
35,393
3,1476,1345,263
12,263
5,9711,665
950
6,787
627864
2,7912,283
691618513
56,364
5,43010,506
6,63621,11510,205
1,775695
32,551
3,1545,6385,905
10,5955,1881,349
722
15,634
1,5922,7492,8585,3072,535
575217
16,717
1,5632,ee93,0465,266
2,653
774505
5,931
447650
2,2001,274
547511302
24,485
2,5054,617
3,376
8,8384,178
671299
37,266
3,3216,6384,123
13,9946,904
1,593
894
18,590
1,7373,3911,9067,019
3,586702249
18,676
1,5843,2452,217
6,975
3,318891446
2,655
179
214
5911,009
344307212
31 ,e79
2,9255,891
3,26012,277
6,027
1,104
396
‘Includes unknown education and other races.21ncludes unknown Income.
NOTES: Relatlve standard errors ofestimatea fortMatable are found inappendx l, figure ll. Foroticial ppulation estimateaformore general uae, see U.S. Bureau oftie Censuars~~ on thecivlllsn population of the United Statas, in Current Population Repon!s, Series P.20, P.25, a”d p-13J.
25
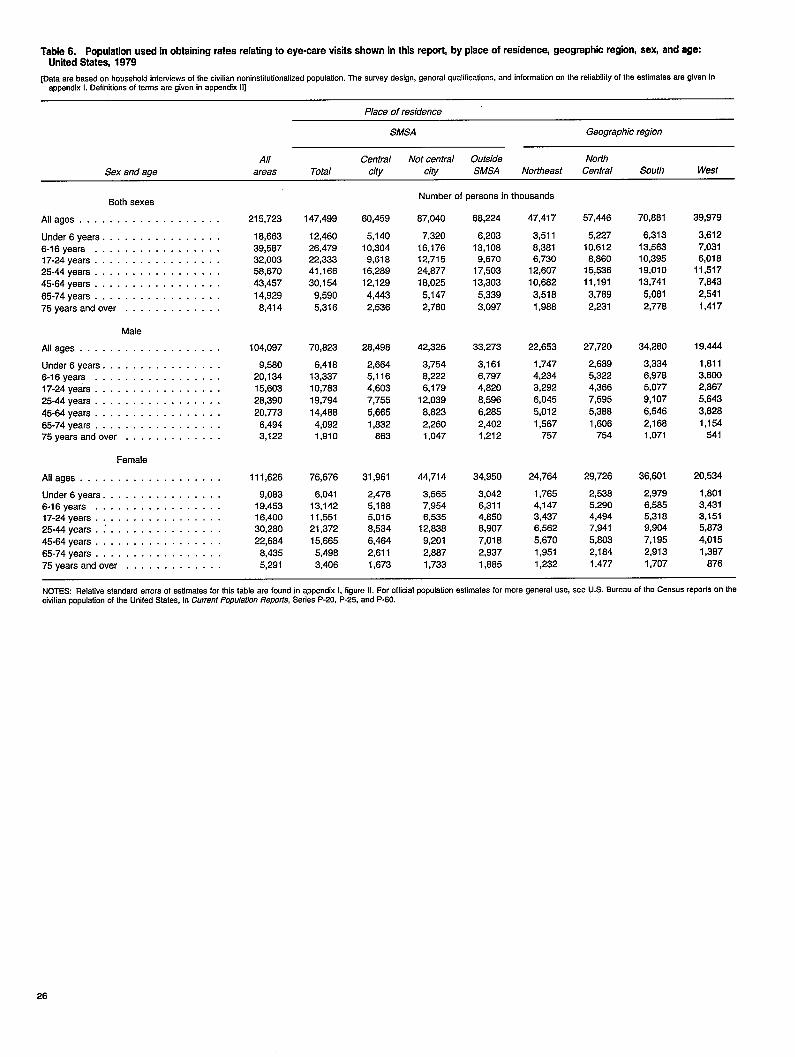
Table6. Populationusdinobtaining rates relating toeye-care visksshown intMsre~m bypkceof residence, gmgrapMc regbn, sex, andag=United Statea, 1979
[Data are based on household intewiews of the civilian noninstitutionalized population. The swvey design, general qualifications, and information on the reliability of the estimates are given inappendix L Definitions of terms are given in appendix II]
Place of residence
SMSA Geographic region
All Central Not central Outside NorthSex and age areas Total city city SMSA Northeast Central South West
Both sexes
All ages . . . . . . . . . . . . . . . . . . .
Under 6years . . . . . . . . . . . . . . . .6-16 years . . . . . . . . . . . . . . . . .17-24years . . . . . . . . . . . . . . . . .25-44years . . . . . . . . . . . . . . . . .45-64years . . . . . . . . . . . . . . . . .
65-74years . . . . . . . . . . . . . . . . .75yearsandover . . . . . . . . . . . . .
Male
Alleges . . . . . . . . . . . . . . . . . . .
Under6years . . . . . . . . . . . . . . . .6-16years . . . . . . . . . . . . . . . . .17-24years . . . . . . . . . . . . . . . . .
25-44years . . . . . . . . . . . . . . . . .
45-64years . . . . . . . . . . . . . . . . .
65-74years . . . . . . . . . . . . . . . . .75yearsandover . . . . . . . . . . . . .
Female
Aliases . . . . . . . . . . . . . . . . . . .
Under6years . . . . . . . . . . . . . . . .6-16years . . . . . . . . . . . . . . . . .17-24years . . . . . . . . . . . . . . . . .25-44years . ; . . . . . . . . . . . . . . .
45-64years . . . . . . . . . . . . . . . . .
65-74years . . . . . . . . . . . . . . . . .75yearsandover . . . . . . . . . . . . .
215,723
16,663
39,56732,00356,67043,457
14,929
6,414
104,097
9,56020,134
15,60326,390
20,773
6,4943,122
111,626
9,06319,45316,40030,260
22,664
6,4355,291
147,499
12,46026,47922,33341,166
30,154
9,590
5,316
70,623
6,41613,33710,783
19,794
14,468
4,0921,910
76,878
6,04113,14211,55121,372
15,665
5,496
3,406
60,459
5,14010,304
9,61816,269
12,129
4,4432,536
26,496
2,6645,1164,6037,755
5,6651,632
663
31,961
2,4765,1665,0158,534
6,4642,611
1,673
Number of persons in thousands
87,040
7,32016,17612,71524,67718,025
5,1472,760
42,326
3,7546,2226,179
12,039
8,8232,2601,047
44,714
3,5657,9546,535
12,638
9,2012,8871,733
68,224
8,20313,106
9,67017,503
13,303
5,339
3,097
33,273
3,1616,7974,620
6,596
6,2852,4021,212
34,950
3,0426,3114,6506,907
7,0182,937
1.865
47,417
3,5116,3816,730
12,60710,682
3,5161,966
22,653
1,7474,2343,292
6,045
5,012
1,567757
24,764
1,7654,1473,4376,5625,670
1,9511,232
57,446
5,22710,612
8,66015,53611,191
3,7892,231
27,720
2,689
5,3224,366
7,595
5,386
1,606754
29,726
2,5385,2904,4947,941
5,8032,184
1,477
70,861
6,31313,56310,39519,01013,741
5,081
2,778
34,260
3,3346,9785,077
9,107
6,5462,1681,071
36,601
2,9796,5655,3189,9047,1952,913
1,707
39,979
3,6127,0316,016
11,5177,843
2,541
1,417
19,444
1,811
3,6002,867
5,643
3,6261,154
541
20,534
1,8013,4313,1515,6734,015
1,387
876
NOTES Relative standard arrorsof estimates fortMstable are found inappentix l, figure ll. ForoMcial ppulation estimates formore general use, aee U.S. Bureau of the Census repofls on thecivilian population of the United States, in Current Population Reports, Series P-21J,P-25, and P-60.
26
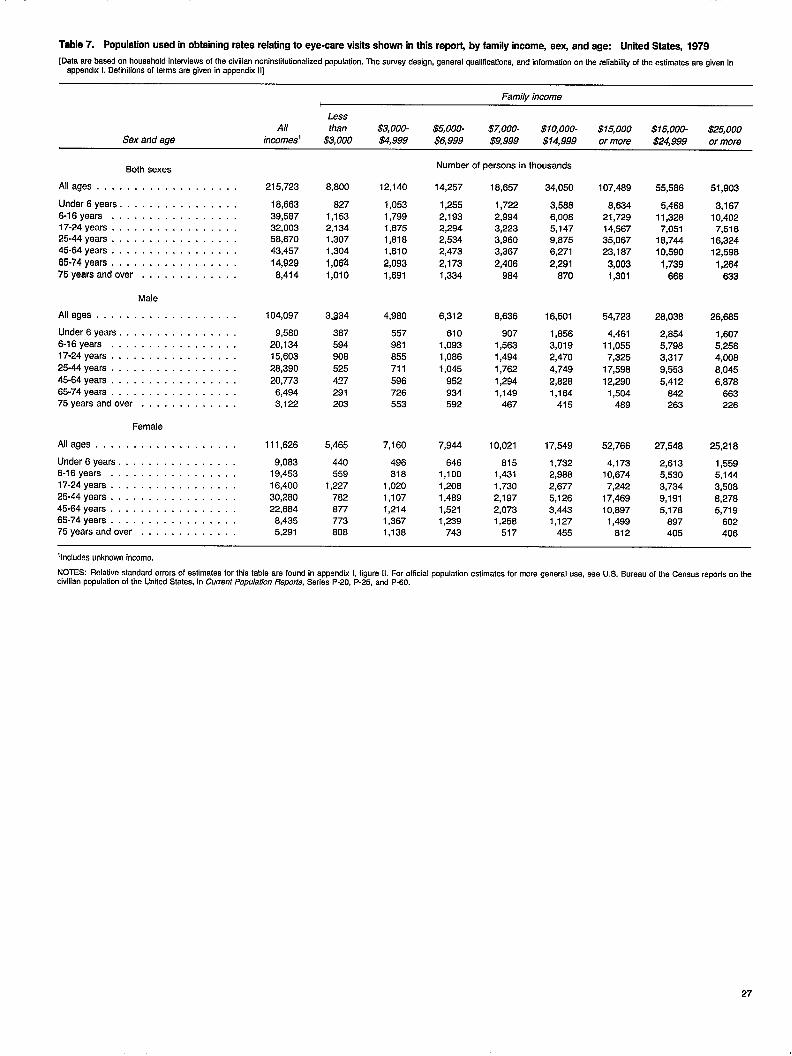
Table7. Populationusdinobtaining rates relating toeye-~re vistisshown inttisre~~ by family income, sex, andag= United Stateq 1979
[Data are based on household interviews of the civilian noninatitutionalized population. The auwey design, general qualifrcationa, and information on the reliability of the eatimatea are given in
appendix L Deflnlllona of terms are given in appendix II]
Family income
Sex and age
Less
All than $3,000- $5,000- $7,000- $1o,ooo- $15,000 $i5,000- $25,000incomasl $3,000 $4,999 $6,999 $9.999 $14,999 or more $24.999 or more
Both sexes
Alleges . . . . . . . . . . . . . . . . . . .
Under 6years . . . . . . . . . . . . . . . .6-16 years . . . . . . . . . . . . . . . . .17-24years . . . . . . . . . . . . . . . . .25-44years . . . . . . . . . . . . . .45-64years . . . . . . . . . . . . . . . . .
65.74years . . . . . . . . . . . . . . . .,75yearsandover . . . . . . . . . . . . .
Male
Alleges, . . . . . . . . . . . . . . . . . .
Under6yeara . . . . . . . . . . . . . . . .6-16years . . . . . . . . . . . . . . . . .17-24years, . . . . . . . . . . . . . . . .
25-44years . . . . . . . . . . . . . . . . .
45-64years . . . . . . . . . . . . . . . . .65-74yeara . . . . . . . . . . . . . . . . .75yearsandover . . . . . . . . . . . . .
Female
Alleges . . . . . . . . . . . . . . . . . . .
Under6years . . . . . . . . . . . . . . . .6-16years . . . . . . . . . . . . . . . . .17-24years . . . . . . . . . . . . . . . . .25-44years . . . . . . . . . . . . . . . . .45-64years . . . . . . . . . . . . . . . . .65-74years . . . . . . . . . . . . . . . . .75yearsandover . . . . . . . . . . . . .
215,723
16,66339,58732,00356,67043,457
14,929
6,414
104,097
9,58020,13415,603
28,390
20,7736,4943,122
111,626
9,08319,45316,400
30,28022,664
6,4355,291
8,800
8271,1532,1341,3071,304
1,ofY41,010
3334
367594908
525
427291203
5,465
440559
1,227762e77773808
12,140
1,0531,7991,8751,8181,810
2,093
1,691
4,980
557981855711
596726553
7,160
496el 8
1,020
1,1071,2141,3671,138
Number of persons in thousands
14,257
1,2552,1932,2942,5342,473
2,1731,334
6,312
6101,0931,086
1,045
952934592
7,944
6461,1001,2081,4891,5211,239
743
18,857
1,7222,9943,2233,9603,367
2,406
984
8,636
9071,5631,494
1,762
1,2941,149
467
10,021
8151,4311,730
2,1972,0731,258
517
34,050
3,5666,0085,1479,8756,271
2,291
670
16,501
1,8563,0192,4704,749
2,8281,184
415
17,549
1,7322,9882,677
5,1263,4431,127
455
107,469
8,63421,72914,56735,06723,187
3,0031,301
54,723
4,46111,0557,325
17,598
12,2901,504
489
52,766
4,173i 0,674
7,242
17,46910,897
1,499812
55,586
5,46611,3287,051
18,74410,590
1,739
666
28,038
2,8545,7983,317
9,553
5,412842283
27,546
2,6135,5303,734
9,1915,178
897405
51,903
3,16710,402
7,51616,32412,598
1,264633
26,685
1,607
5,2584,008
8,045
6,878663226
25,218
1,5595,1443,5088,2765,719
602406
llncludes unknown Income.
NOTES: Relatlve standard errors ofeaHmates forttia table are found inappentix l, figure ll. Foroticial ppulation estimates formora general use, see U.S. Buraauof the Census repofls on theclvillan population of the United States, in Current Population Repotis, Series P-2O, P.25, and P-60.
27
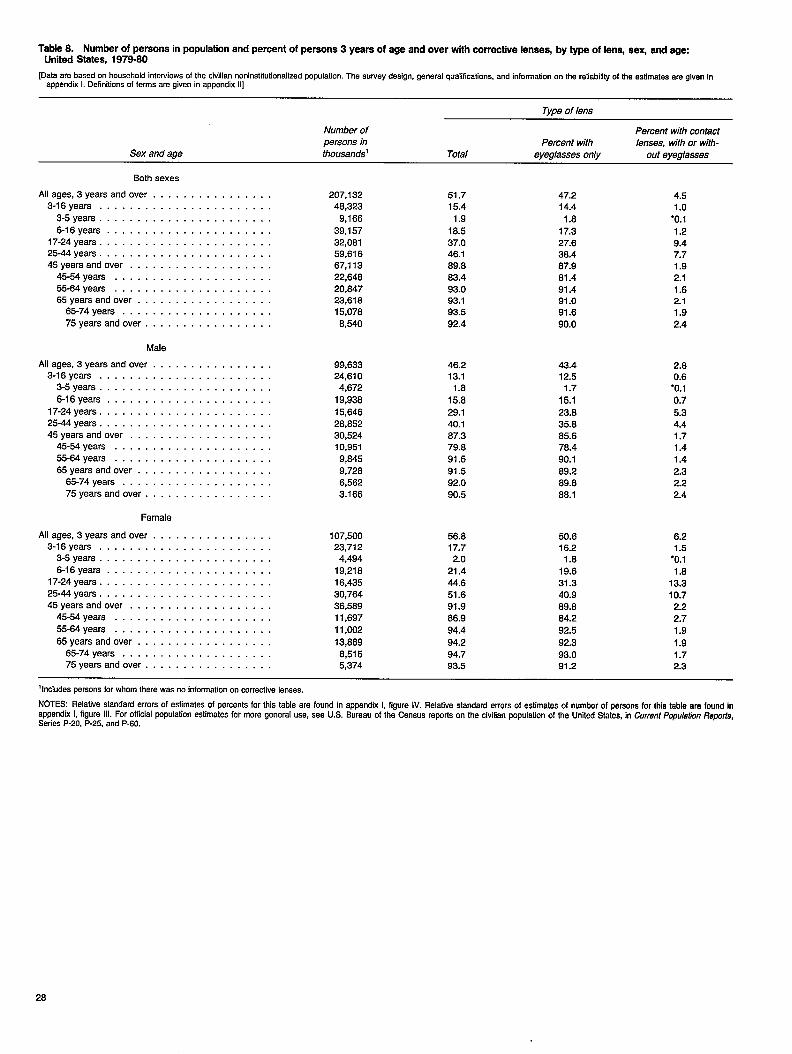
Table8. Num&rof pemonain ~pulation andpement of~mona 3yeamof ageandover titham~~we knaes, by~Mlen~sex, andqoUnited States, 1979-80
[Data are based on household interviewsof the civilian noninsfitutionalizedpopulation. The survey design, general quafificafions,and informationon the refiabifityof the estimates are given Inappendix 1.Definitionsof terms are given in appendix II]
Type of lens
Number of Percent with contactpersons in Percent with lenses, with or with-
Sex and age thousands Total eyeglasses only out eyeglasses
Both sexes
Allages, 3 years And over..... . . . . . . . . . . .3-16years . . . . . . . . . . . . . . . . . . . . . . .
3-5 years . . . . . . . . . . . . . . . . . . . . . . .
6-16years . . . . . . . . . . . . . . . . . . . . . .17-24years . . . . . . . . . . . . . . . . . . . . . . .25-44years . . . . . . . . . . . . . . . . . . . . . . .45yearsandover . . . . . . . . . . . . . . . . . . .
45-54yeara . . . . . . . . . . . . . . . . . . . . .55-64years . . . . . . . . . . . . . . . . . . . . .65yearsandover . . . . . . . . . . . . . . . . . .
65-74years . . . . . . . . . . . . . . . . . . . .
75yearsand over . . . . . . . . . . . . . . . . .
Male
Allages,3yearsandover . . . . . . . . . . . . . . . .3-16years . . . . . . . . . . . . . . . . . . . . . . .
3-5years . . . . . . . . . . . . . . . . . . . . . . .
6-16years . . . . . . . . . . . . . . . . . . . . . .17-24years . . . . . . . . . . . . . . . . . . . . . . .25-44years . . . . . . . . . . . . . . . . . . . . . . .45yearsandover . . . . . . . . . . . . . . . . . . .
45-54years . . . . . . . . . . . . . . . . . . . . .55-64years . . . . . . . . . . . . . . . . . . . . .65yearsandover . . . . . . . . . . . . . . . . . .
65-74years . . . . . . . . . . . . . . . . . . . .75yearsand over . . . . . . . . . . . . . . . . .
Female
Allages,3yearsandover . . . . . . . . . . . . . . . .3-16years . . . . . . . . . . . . . . . . . . . . . . .
3-5years . . . . . . . . . . . . . . . . . . . . . . .
6-16years . . . . . . . . . . . . . . . . . . . . . .17-24years . . . . . . . . . . . . . . . . . . . . . . .25-44years . . . . . . . . . . . . . . . . . . . . . . .45yearsandover . . . . . . . . . . . . . . . . . . .
45-54yeara . . . . . . . . . . . . . . . . . . . . .
55-84years . . . . . . . . . . . . . . . . . . . . .
65yearsand over . . . . . . . . . . . . . . . . . .65-74years . . . . . . . . . . . . . . . . . . . .75yearsand over . . . . . . . . . . . . . . . . .
207,13246,323
9,166
39,15732,06159,61667,11322,64620,84723,61815,078
8.540
99,63324,610
4,672
19,938
15,64626,65230,52410,951
9,845
9,7266,5623.166
107,50023,712
4,49419,21816,43530,76436,56911,697
11,00213,889
8,5155,374
51.715.4
1.9
18.537.046.169.863.493.093.193.592.4
46.213.1
1.8
15.829.140.167.379.891.591.592.090.5
56.817.72.0
21.444.651.691.988.994.4
94.294.793.5
47.214.4
1.617.327.638.467.961.491.491.091.690.0
43.412.5
1.7
15.123.835.685.678.490.169.289.868.1
50.616.2
1.619.631.340.989.664.292.5
92.393.091.2
4.51.0
‘0.11.29.47.71.92.11.62.11.92.4
2.80.6
‘0.1
0.75.34.41.71.41.42.32.22.4
6.21.5
‘0.11.8
13.310.72.22.71.9
1.91.72.3
‘Includes parsons for whom there was no informationon corracfive Ienaes.
NOTES: Relative atandard errors ofestimates ofpercants fortMatable are found inappendx l, figurelV. Relstive standard errors ofsstimates ofnumkr ofperWns fortMstable are foundlnaPPen~xl,fi9ure Ill. Foroficial Populationestimates formora general use, see U.S. Bureau ofths Censuarew* ontheciviHan ~pulation of the United Statea, in Cumnf P~u/afion Re~tis,Series P-20, P-25, and P-60.
28
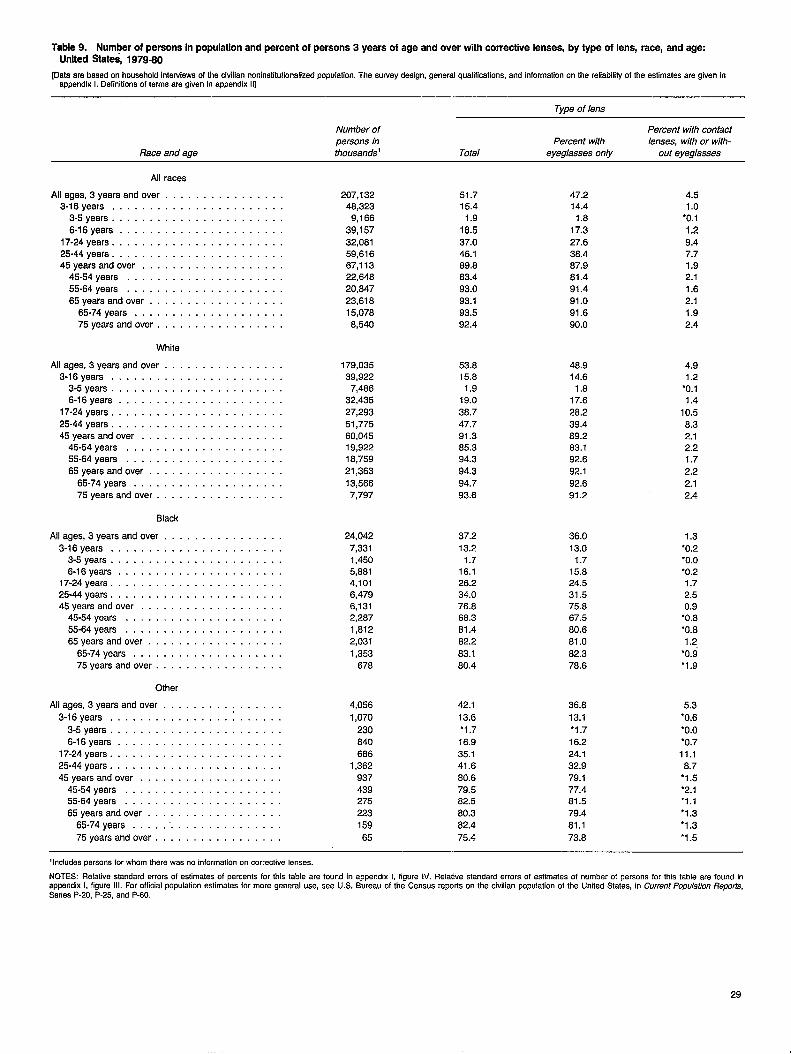
Table9. Num@rof persons inpopulstion sndpercent ofpersons 3yearaof ageandover wtihcom~twe lenses, by~peof lena, race, and ageUnited Statea, 1979-S0
[Data are basad on household interviews of the civilian noninsfitutionalized population. The survey design, general qualifications, and information on the reliability of the eatimatea are given inappendix 1.Definitionsof terms are given in appendix II]
Type of lens
Number of Percent with contactpersons in Percent with lenses, with or with-
Race and age thousands’ Total eyeglasses only out eyeglasses
All races
Allagas, 3 years And over . . . . . . . . . . . . . . . .3-16years . . . . . . . . . . . . . . . . . . . .
3-5years . . . . . . . . . . . . . . . . . . . . . . .
6.16years . . . . . . . . . . . . . . . . . . . . . .17-24years . . . . . . . . . . . . . . . . . . . . . . .25-44years . . . . . . . . . . . . . . . . . . . . . . .45yearsandover, . . . . . . . . . . . . . .
45-54years . . . . . . . . . . . . . . . . . . . . .
55-64years . . . . . . . . . . . . . . . . . . . . .65yearsandover . . . . . . . . . . . . . . . . . .
65-74years . . . . . . . . . . . . . . . . . . . .75yaaraand over .,...... . . . . . . . . .
White
Allagea,3yearsand over..... . . . . . . . . . . .3-16yeara . . . . . . . . . . . . . . . . . .
3-5 years . . . . . . . . . . . . . . . . . . . . . . .6-16years . . . . . . . . . . . . . . .
17-24years, . . . . . . . . . . . . . . . . . . . . . .
25-44years . . . . . . . . . . . . . . . . . . . . . . .45yearsandover . . . . . . . . . . . . . . . . . . .
45-54years . . . . . . . . . . . . . . . . . . . . .55-64years . . . . . . . . . . . . . . . . . . . . .
65yearaandover . . . . . . . . . . . . . . . . . .
65-74years . . . . . . . . . . . . . . . . .75yearsand over . . . . . . . . . . . . . . .
Black
Allages, 3yearsandover . . . . . . . . . . . . . . . .
3-16years . . . . . . . . . . . . . . . . . . . . . . .3-5 years . . . . . . . . . . . . . . . . . . . . . . .6-16years . . . . . . . . . . . . . . . . . . . . . .
17-24years . . . . . . . . . . . . . . . . . . . . . . .25-44years . . . . . . . . . . . . . . . . . . . . . . .45yearsand over . . . . . . . . . . . . . . . . . . .
45-54years . . . . . . . . . . . . . . . . . . . . .55-64years . . . . . . . . . . . . . . . . . . . . .
65yearsandover . . . . . . . . . . . . . . . . . .
65-74yeara . . . . . . . . . . . . . . . . . . . .75yearsandover . . . . . . . . . . . . . . .
Other
Allages, 3yearsand over.,... . . . . . . . . . . .
3-16yeare . . . . . . . . . . . . . . . . . . . . . . .
3-5years . . . . . . . . . . . . . . . . . . . . . . .
6-16years . . . . . . . . . . . . . . . . .17-24years . . . . . . . . . . . . . . . . . . . . . . .25-44years . . . . . . . . . . . . . . . . . . . . . . .45yearsandover . . . . . . . . . . . . . .
45-54years . . . . . . . . . . . . . . . . .55-64years . . . . . . . . . . . . . . . . .
65yearaandover, . . . . . . . . . . . . . .
65-74years . . . . .’ . . . . . . . . . . . . . . .
75yearsandover. . . . . . . . . . . . . . .
207,132
48,323
9,188
39,157
32,061
59,616
67,113
22,848
20,647
23,618
15,078
8.540
179,03539,922
7,48832,43527,293
51,77580,04519,92218,759
21,363
13,5667,797
24,042
7,3311,4505,8814,1018,4798,1312,2871,8122,031
1,353678
4,056
1,070
230840686
1,362937439275223
159
65
51.715.4
1.9
16.5
37.046.189.883.493.093.193.592.4
53.815.8
1.919.0
38.747.791.385.394.3
94.3
94.793.6
37.213.2
1.716.126.234.076.668.3
61.482.2
63.180.4
42.1
13.6
*1.7
16.935.1
41.680.679.582.5
80.3
62.4
75.4
47.214.4
1.6
17.3
27.638.487.981.491.491.091.690.0
48.914.6
1.817.6
28.2
39.489.283.192.6
92.1
92.691.2
36.0
13.01.7
15.824.531.575.867.5
80.681.0
62.378.6
36.6
13.1
●1.7
16.224.1
32.979.177.481.5
79.4
81.1
73.8
4.51.0
‘0.1
1.2
9.47.71.92.1
1.62.11.92.4
4.91.2
‘0.11.4
10.5
6.32.12.21.7
2.2
2.12.4
1.3
‘0.2“0.0‘0.21.72.50.9
‘0.8‘0.61.2
‘0.9‘1.9
5.3
‘0.6
‘0.0‘0.711.18.7
‘1.5●2.1‘1.1‘1.3“1.3
●1.5
‘Includes persons for whom there was no information on corrective lenses.
NOTES: Relafive standard errors of estimates ofpercents forttis table are found inappentixl, figure IV. Relative standard errors ofestimates of number of persons forthis table are found in
appendix Lf19ure Ill. FOrOfficial pOpulatiOn estimates formOre generaluse, saa U.S. Efureau Ofthe Census reprfson thecivifian population of the United States, in CirrentPopulationRe petis,.%rles P-20, P-26, and P-60.
29
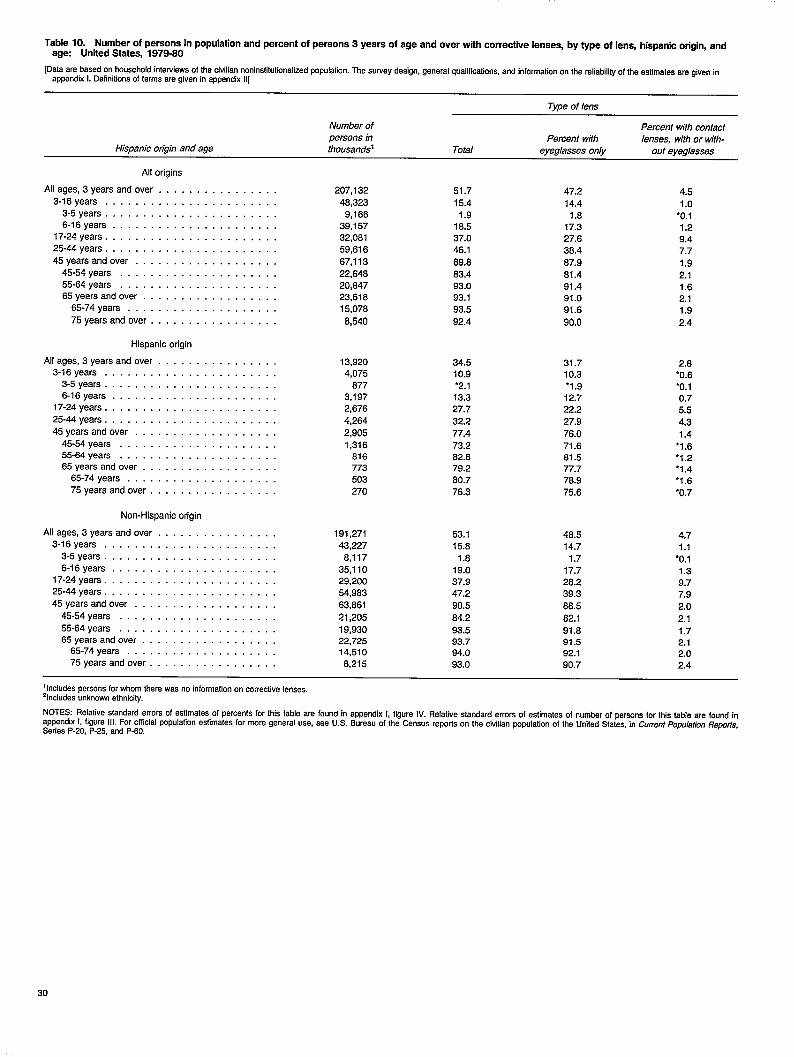
Table IO. Number ofperaons inpopulation andpercent ofperaona 3yearsof ageandover wkhcorrectwe lenses, by~peof lens, tispankodgin, andage United Statas, 1979-80
[Data are based on household intewiewa of the sivifian noninatitufiona fized population. The auwey design, general quafificationa,and informationon the refinabilityof the eefimatesare given In
appendix 1. Definitions of tema are given in appendix III
Type of lens
Number of Percent with contactpersons in Percent with lenses, with or with-
Hispanic otigin and age thousands’ Total eyeglasses only out eyeglasses
All origins
Allages, 3years And over . . . . . . . . . . . . . . . .
3-16years . . . . . . . . . . . . . . . . . . . . . . .3-5 years . . . . . . . . . . . . . . . . . . . . . . .6-16years . . . . . . . . . . . . . . . . . . . . . .
17-24years . . . . . . . . . . . . . . . . . . . . . . .
25-44years . . . . . . . . . . . . . . . . . . . . . . .
45yearsandover . . . . . . . . . . . . . . . . . . .
45-54years . . . . . . . . . . . . . . . . . . . . .55-64years . . . . . . . . . . . . . . . . . . . . .65yearsandover . . . . . . . . . . . . . . . . . .
65-74years . . . . . . . . . . . . . . . . . . . .
75yearsand over . . . . . . . . . . . . . . . . .
Hispanic origin
Allages,3yearsand over.. . . . . . . . . . . . . . .3-16years . . . . . . . . . . . . . . . . . . . . . . .
3-5years . . . . . . . . . . . . . . . . . . . . . . .6-16years . . . . . . . . . . . . . . . . . . . . . .
17-24years . . . . . . . . . . . . . . . . . . . . . . .
25-44years . . . . . . . . . . . . . . . . . . . . . . .
45yearsandover . . . . . . . . . . . . . . . . . . .45-54years . . . . . . . . . . . . . . . . . . . . .55-64years . . . . . . . . . . . . . . . . . . . . .65yearsandover . . . . . . . . . . . . . . . . . .
65-74years . . . . . . . . . . . . . . . . . . . .75yearsandover . . . . . . . . . . . . . . . . .
Non-Hispanic origin
Allages,3yearsand over... . . . . . . . . . . . . .3-16years . . . . . . . . . . . . . . . . . . . . . . .
3-5years . . . . . . . . . . . . . . . . . . . . . . .6-16years . . . . . . . . . . . . . . . . . . . . . .
17-24years . . . . . . . . . . . . . . . . . . . . . . .25-44years . . . . . . . . . . . . . . . . . . . . . . .
45yearsandover . . . . . . . . . . . . . . . . . . .
45-54years . . . . . . . . . . . . . . . . . . . . .
55-64years . . . . . . . . . . . . . . . . . . . . .65yearsandover . . . . . . . . . . . . . . . . . .
65-74years . . . . . . . . . . . . . . . . . . . .75yearsandover . . . . . . . . . . . . . . . . .
207,132
48,323
9,16639,15732,061
59,616
67,11322,64820,84723,61815,078
8,540
13,9204,075
8773,1972,676
4,264
2,905
1,316616773503270
191,27143,227
8,11735,11029,20054,983
63,861
21,205
19,93022,72514,510
8,215
51.715.4
1.918.537.046.1
89.883.493.093.193.5
92.4
34.510.9
‘2.113.327.7
32.2
77.4
73.262.679.280.776.3
53.115.6
1.8
19.037.947.2
90.5
84.2
93.593.794.093.0
47.2
14.41.8
17.327.6
38.4
87.981.491.491.091.6
90.0
31.710.3‘1.912.722.2
27.9
76.0
71.681.577.778.9
75.6
46.514.7
1.717.728.2
39.3
88.5
62.1
91.891.592.190.7
4.5
1.0
‘0.11.29.47.7
1.92.11.62.11.9
2.4
2.8“0.6‘0.10.75.54.3
1.4
‘1.6“1.2“1.4*1.6
“0.7
4.71.1
“0.11.39.77.9
2.0
2.1
1.72.12.02.4
llncludea persons for whom there was no information on corrective lenses.21ncludas unknown ethnicity.
NOTES: Relative atandarderroraof eatimatesof percenta forthis table are found inappendix l, figurelV. Relafive atandard errors ofesfimatesof number ofpersons forthis table are foundln
aPPen~xL fi9ure [Il. FOroficial ~pula~Oneatimateaf ormoreg eneraluae,seeU. S. Bureau of the Census repmtsont hecivilian ppulation of the United States, in CumentPopu/atbn Re@tis,Series P-20, P-25, and P-6o.
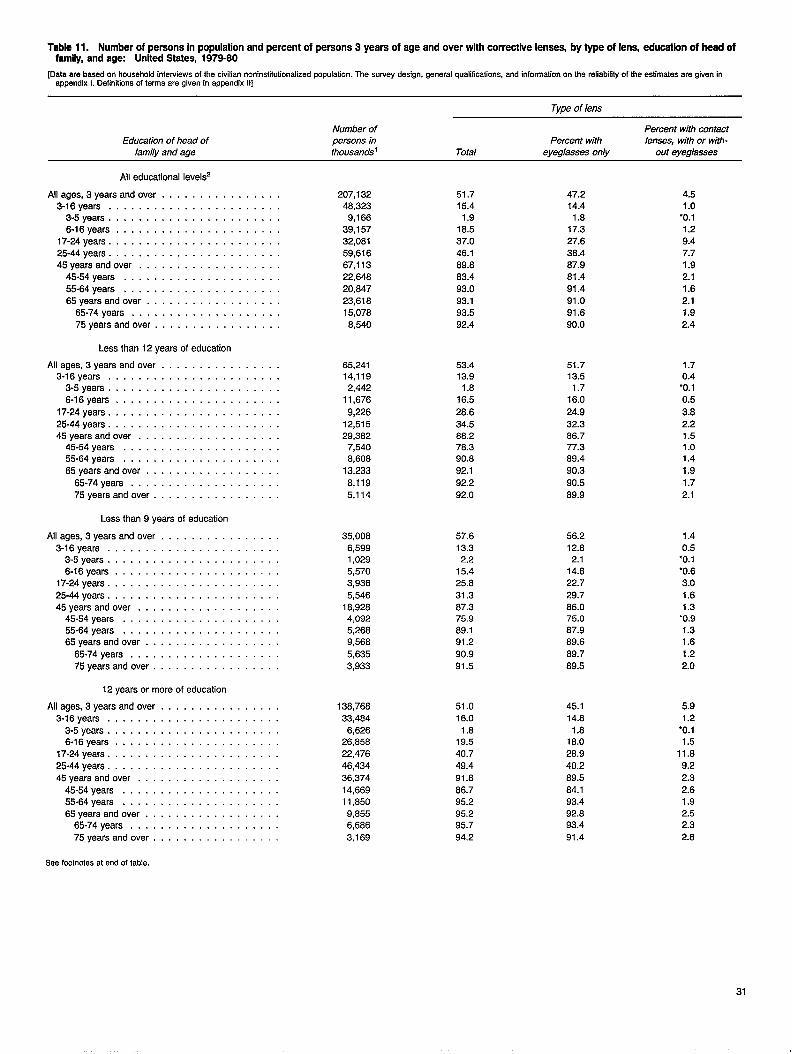
Tablell. Number ofpemona inpopulation andpercent ofpersona 3yearsof agesndover wtihcomectWe lenses, by~eoflens, ed-tbnofheWdfamily, and age United Statea, 1978-80
[Data are based cm household Interviews of the civifian noninstitutionatized population. The sutvey design, general quafifimdions, and information on the retiabiiity of the estimates are given inappendix 1.Definitionsof terms are given in appendix II]
Type of lens
Number of F’ercent with conkfEducetion of head of persons in Percent with lenses, with or with-
family and age thousands’ Total eyeglasses only out eyeglasses
All educational Ievelsz
AIlages, 3years And over . . . . . . . . . . . . . . . .3-16 years . . . . . . . . . . . . . . . . . . . . . . .
3-5 years . . . . . . . . . . . . . . . . . . . . . . .6-16years . . . . . . . . . . . . . . . . . . . . . .
17-24years . . . . . . . . . . . . . . . . . . . . . . .
25-44years . . . . . . . . . . . . . . . . . . . . . . .45yearaandover .,....... . . . . . . . . . .
45-54years . . . . . . . . . . . . . . . . . . . . .
55-64years, . . . . . . . . . . . . . . . . . . . .65yearsandover . . . . . . . . . . . . . . . . . .
65-74years . . . . . . . . . . . . . . . . . . . .75yearsand over . . . . . . . . . . . . . . . . .
Less than 12 yeara of education
Allages, 3yearsandover . . . . . . . . . . . . . . . .3-16years . . . . . . . . . . . . . . . . . . . . . . .
3-5years . . . . . . . . . . . . . . . . . . . . . . .6-16years . . . . . . . . . . . . . . . . . . . . . .
17-24years . . . . . . . . . . . . . . . . . . . . . . .25-44yesrs . . . . . . . . . . . . . . . . . . . .45yearsandover . . . . . . . . . . . . . . . . .
45-54years . . . . . . . . . . . . . . . . . . . . .55-64years . . . . . . . . . . . . . . . . . . . . .
65yearsandover . . . . . . . . . . . . . . . . . .
65-74years . . . . . . . . . . . . . . . . . . . .75yearsand over . . . . . . . . . . . . . . . . .
Less than 9 yeara of education
Allages, 3yearsand over..... . . . . . . . . . . .
3-16years . . . . . . . . . . . . . . . . . .3-5years . . . . . . . . . . . . . . . . . . . . . . .6-16years . . . . . . . . . . . . . . .
17-24years . . . . . . . . . . . . . . . . . . . . . . .
25-44years . . . . . . . . . . . . . . . . . .45yearaandover . . . . . . . . . . . . . . . . . . .
45-54years . . . . . . . . . . . . . .55-64yeara . . . . . . . . . . . . . . . . . . . . .65yearsandover . . . . . . . . . . . . . . . . . .
65.74yeara . . . . . . . . . . . . . . . . . . . .75yearsand over . . . . . . . . . . . . .
12 years or more of education
Allages, 3yearsandover . . . . . . . . . . . . . . . .3-16years . . . . . . . . . . . . . . . . .
3-5years . . . . . . . . . . . . . . . . . . . . . . .6.16years . . . . . . . . . . . . . . . . . . . . . .
17-24years . . . . . . . . . . . . . . . . . . . . . . .
25-44years . . . . . . . . . . . . . . . . . . . . . . .45yearsandover . . . . . . . . . . . .
45-54years . . . . . . . . . . . . . . . . . . . . .55-64years . . . . . . . . . . . . . . .65yearsandover . . . . . . . . . . . .
65-74years . . . . . . . . . . . . . . . . . . . .75yearsand over . . . . . . . . . . . . . . . . .
See fcmtnotesat end of table.
207,13248,323
9,16639,15732,061
59,61667,11322,648
20,847
23,61615,078
6,540
65,24114)1192,442
11,676
9,22612,515
7;5406,608
13,233
6,1195,114
35,0066,5991,0295,5703,936
5,54616,926
4,092
5,2689,566
5,635
3,933
138,768
33,464
6,62626,85822,476
46,434
36,374
14,66911,650
9,8556,686
3,169
51.715.4
1.91S.5
37.046.1
69.863.4
93.093.193.5
92.4
53.413.9
1.816.5
28.6
34.588.278.390.8
92.1
92.292.0
57.613.32.2
15.425.8
31.387.375.989.191.2
90.991.5
51.016.0
1.819.5
40.7
49.4
91.8
86.795.295.295.794.2
47.214.4
1.817.327.6
38.4
87.981.4
91.491.091.6
90.0
51.713.5
1.716.0
24.9
32.38S.777.389.4
90.3
90.5
89.9
56.212.82.1
14.822.7
29.786.075.0
87.989.6
89.7
89.5
45.1
14.8
1.816.0
28.9
40.2
69.5
84.193.492.893.4
91.4
4.51.0
“0.11.2
9.47.71.92.1
1.62.11.9
2.4
i .7
0.4‘0.10.5
3.82.21.51.01.4
1.9
1.72.1
1.4
0.5‘0.1‘0.63.0
1.61.3
‘0.91.31.6
1.2
2.0
5.91.2
‘0.11.5
11.8
9.22.3
2.61.92.52.3
2.8
31
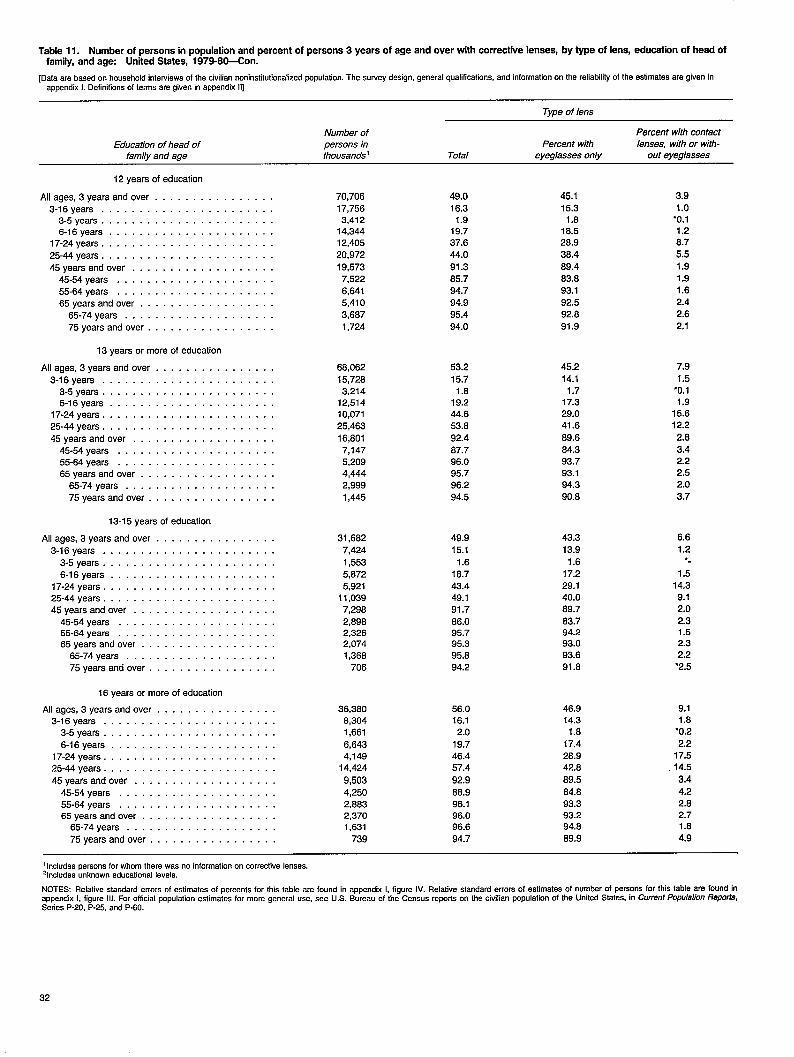
Table Il. Number ofpersons inpopulation andparcant ofpersons 3yearsof ageandover wtihcorrec~we lenaes, by~eofkns, duatmnofhetioffamily, and age United States, 1979-80-Con.
[Data are baaed on household interviewsof the civifian noninatitufionafized population. The survey design, general qualifications, and informationon the reliabilityof Ihe estimates are given in
appendix 1. Definitions of terms are given in appendix f]]
Type of lens
Number of Percent with contactEducation of head of persona in Percent with lenses, with or with-
familv and age thouaanda’ Total eyeglasses only out eyeglasses
12 years of education
AIIages, 3years And over . . . . . . . . . . . . . . . .
3-16years . . . . . . . . . . . . . . . . . . . . . . .3-5 years . . . . . . . . . . . . . . . . . . . . . . .6-16years . . . . . . . . . . . . . . . . . . . . . .
17-24years . . . . . . . . . . . . . . . . . . . . . . .
25-44years . . . . . . . . . . . . . . . . . . . . . . .
45yearsandover . . . . . . . . . . . . . . . . . . .45-54years . . . . . . . . . . . . . . . . . . . . .
55-64years . . . . . . . . . . . . . . . . . . . . .65yearsandover . . . . . . . . . . . . . . . . .
65-74years . . . . . . . . . . . . . . . . . . . .75yearsand over . . . . . . . . . . . . . . . . .
13 years or more of education
AlIages,3yearsand ovar . . . . . . . . . . . . . . . .
3-16years . . . . . . . . . . . . . . . . . . . . . . .3-5years . . . . . . . . . . . . . . . . . . . . . . .6-16years . . . . . . . . . . . . . . . . . . . . . .
17-24years . . . . . . . . . . . . . . . . . . . . . . .25-44years . . . . . . . . . . . . . . . . . . . . . . .
45yearsand over . . . . . . . . . . . . . . . . . . .45-54years . . . . . . . . . . . . . . . . . . . . .55-64years . . . . . . . . . . . . . . . . . . . . .65yearsand over . . . . . . . . . . . . . . . . . .
65-74years . . . . . . . . . . . . . . . . . . . .75yearsandover . . . . . . . . . . . . . . .
13-15 years of education
Allages,3yearsandover . . . . . . . . . . . . . . . .
3-16years . . . . . . . . . . . . . . . . . . . . . . .
3-5years . . . . . . . . . . . . . . . . . . . . . . .6-16years . . . . . . . . . . . . . . . . . . . . . .
17-24years . . . . . . . . . . . . . . . . . . . . . . .25-44years . . . . . . . . . . . . . . . . . . . . . . .45yearsandover . . . . . . . . . . . . . . . . . . .
45-54years . . . . . . . . . . . . . . . . . . . . .55-64years . . . . . . . . . . . . . . . . . . . .65yearsandover . . . . . . . . . . . . . .
65-74years . . . . . . . . . . . . . . . . . . . .
75yearsandover . . . . . . . . . . . . . . . .
16 years or more of education
Allages,3yearsandover . . . . . . . . . . . . . . . .3-16years . . . . . . . . . . . . . . . . . . . . . . .
3-5years . . . . . . . . . . . . . . . . . . . . . . .
6-16years . . . . . . . . . . . . . . . . . . . . . .17-24years . . . . . . . . . . . . . . . . . . .25-44years . . . . . . . . . . . . . . . . . . . . . . .
45yearsandover . . . . . . . . . . . . . . . . . . .45-54years . . . . . . . . . . . . . . . . . . . . .
55-64years . . . . . . . . . . . . . . . . . . . . .65yearsandover . . . . . . . . . . . . . . .
65-74years . . . . . . . . . . . . . . . . . . . .
75yearsandover . . . . . . . . . . . . . . . . .
70,70617,7563,412
14,34412,405
20,972
19,5737,522
6,6415,410
3,6671,724
66,06215,7283,214
12,51410,07125,463
16,8017,1475,2094,4442,999
1,445
31,682
7,4241,553
5,8725,921
11,0397,298
2,8982,3262,074
1,366706
36,3806,3041,661
6,6434,149
14,424
9,5034,2502,8632,3701,631
739
49.016.31.9
19.737.6
44.0
91.385.794.7
94.995.4
94.0
53.215.7
1.619.244.6
53.6
92.487.796.095.796.2
94.5
49.9
15.1
1.616.7
43.449.1
91.7
86.095.795.395.894.2
56.016.1
2.0
19.746.4
57.4
92.9
88.996.196.096.6
94.7
45.1
15.31.8
16.528.9
36.4
69.483.893.1
92.592.8
91.9
45.2
14.11.7
17.329.041.6
69.684.393.793.194.3
90.8
43.3
13.9
1.617.2
29.140.069.7
83.794.293.093.6
91.8
46.914.3
1.8
17.426.942.8
89.5
84.893.393.294.6
69.9
3.91.0
‘0.11.26.7
5.5
1.9
1.9
1.6
2.4
2.6
2.1
7.9
1.5‘0.11.9
15.612.2
2.8
3.42.22.52.0
3.7
6.6
1.2●.
1.5
14.39.12.0
2.31.52.32.2
“2.5
9.11.6
“0.22.2
17.514.5
3.4
4.22.82.71.6
4.9
llncludea peraona forwhom there wasnoinformafion oncorrecffve Ienaes.‘Includes unknown educational levels.
NOTES Relative standard amorsof estimates ofpercents fortistab!e arafound inappentixl, tigure IV. Relative standard erroraof estimates ofnum&r ofpersns fortMstable are f0Undln
aPPen~x L fi9ure Ill. FOroficial population estimates for more general use, see U.S. Bureau of the Census reports on the civifian population of the Unitad States, in CurrentPopulationReporis,SeriesP-20, P-25, and P-60.
32
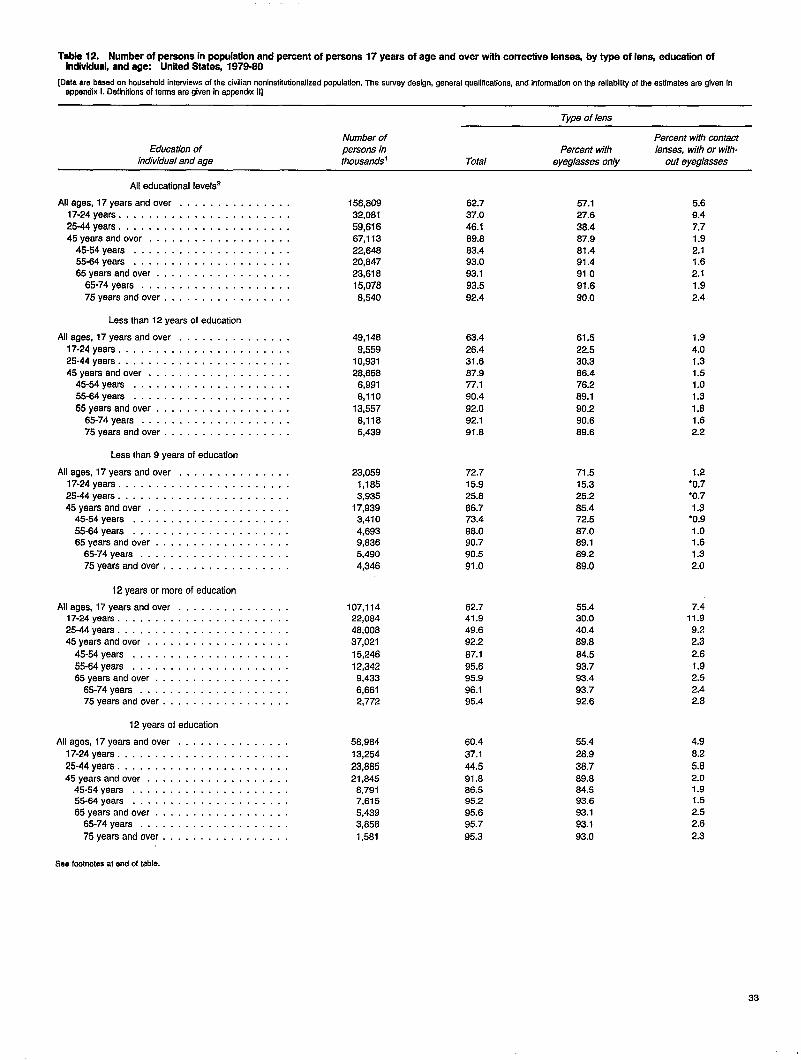
Table 12. Number of~mons in~pulation andpement ofpersons 17years ofageand overwtih @metive len~s, by~oflens, 4umtionofindividual,and age United States, 1978-80
[Data are baaad on household interviews of the dvilian noninstitutionalized population. The survey design, general qualificstiins, and information on thp reliabilii of the estimates are given inappendix1.Definillonsof termsare given in appendix 11]
Type of lens
Number of Percenf with contactEducation of persons in Percent with lenses, with or with-
individual and age thousands’ Total eyeglasses only out eyeglasses
All educational levels2
Allagea, 17yearsand over . . . . . . . . . . . . . . .17-24 years . . . . . . . . . . . . . . . . . . . . . . .25-44years . . . . . . . . . . . . . . . . . . . . . . .45yearsandover . . . . . . . . . . . . . . . . . . .
45-54years . . . . . . . . . . . . . . . . . . . . .55-64years . . . . . . . . . . . . . . . . . . . . .65yeareandover . . . . . . . . . . . . . . . . . .
65-74years . . . . . . . . . . . . . . . . . . . .75yearsandover . . . . . . . . . . . . . . . . .
Less than 12 years of educ@ion
Allagea, 17yearsandover . . . . . . . . . . . . . . .17.24years, . . . . . . . . . . . . . . . . . . . . . .25-44years . . . . . . . . . . . . . . . . . . . . . . .45yeareandover . . . . . . . . . . . . . . . . . . .
45-54yeare . . . . . . . . . . . . . . . . . . . . .55-64years . . . . . . . . . . . . . . . . . . . . .65yearsandover . . . . . . . . . . . . . . . . . .
65-74years . . . . . . . . . . . . . . . . . . . .75yearaandovar . . . . . . . . . . . . . . . . .
Leas than 9 years of education
Allages, 17yearsandover . . . . . . . . . . . . . . .17-24yeare . . . . . . . . . . . . . . . . . . . . . . .25-44years . . . . . . . . . . . . . . . . . . . . . . .45yearaandovar . . . . . . . . . . . . . . . . . . .
45-54years . . . . . . . . . . . . . . . . . . . . .55-64years . . . . . . . . . . . . . . . . . . . . .65yearsandover . . . . . . . . . . . . . . . . . .
65-74yeara . . . . . . . . . . . . . . . . . . . .75yaarsand over, . . . . . . . . . . . . . . . .
12 years or more of education
Allages, 17yearaandover . . . . . . . . . . . . . . .17-24yeara . . . . . . . . . . . . . . . . . . . . . . .25-44yeare . . . . . . . . . . . . . . . . . . . . . . .45yearsandover . . . . . . . . . . . . . . . . . . .
45-54yeara . . . . . . . . . . . . . . . . . . . . .55-64years . . . . . . . . . . . . . . . . . . . . .65yearsandover . . . . . . . . . . . . . . . . . .
65-74years . . . . . . . . . . . . . . . . . . . .75yearaandover . . . . . . . . . . . . . . . . .
12 years of education
Ailagee, 17yeareandover . . . . . . . . . . . . . . .17-24years . . . . . . . . . . . . . . . . . . . . . . .25-44years . . . . . . . . . . . . . . . . . . . . . . .45yearsandover . . . . . . . . . . . . . . . . . . .
45-54years . . . . . . . . . . . . . . . . . . . . .55-64years . . . . . . . . . . . . . . . . . . . . .65yearsandover . . . . . . . . . . . . . . . . . .
65-74yeara . . . . . . . . . . . . . . . . . . . .75yearsand over . . . . . . . . . . . . . . . . .
156,60932,08159,61667,11322,64820,84723,61815,0768,540
49,1469,559
10,93128,65e6,9916,110
13,5578,1165,439
23,0591,1653,935
17,9393,4104,6939,6365,4904,346
107,11422,08448,00637,02115,24612,3429,4336,6612,772
58,96413,25423,86521,8458,7917,6155,4393,8581,561
62.737.046.189.883.493.093.193.592.4
63.426.431.6e7.977.190.492.092.191.8
72.715.925.866.773.488.090.790.591.0
62.741.949.692.287.195.695.996.195.4
60.437.144.591.886.595.295.695.795.3
57.127.638.487.981.491.491091.690.0
61.522.530.388.476.289.1
90.290.689.6
71.515.325.285.472.587.089.189.289.0
55.430.040.469.884.593.793.493.792.6
55.428.938.789.884.593.693.193.193.0
5.69.47.71.92.11.62.11.92.4
1.94.01.31.51.01.31.81.62.2
1.2“0.7‘0.71.3
“0.91.01.6~.32.0
7.411.99.22.32.61.92.52.42.6
4.9
8.25.82.01.91.52.52.62.3
Sea footnotes at end of table.
33
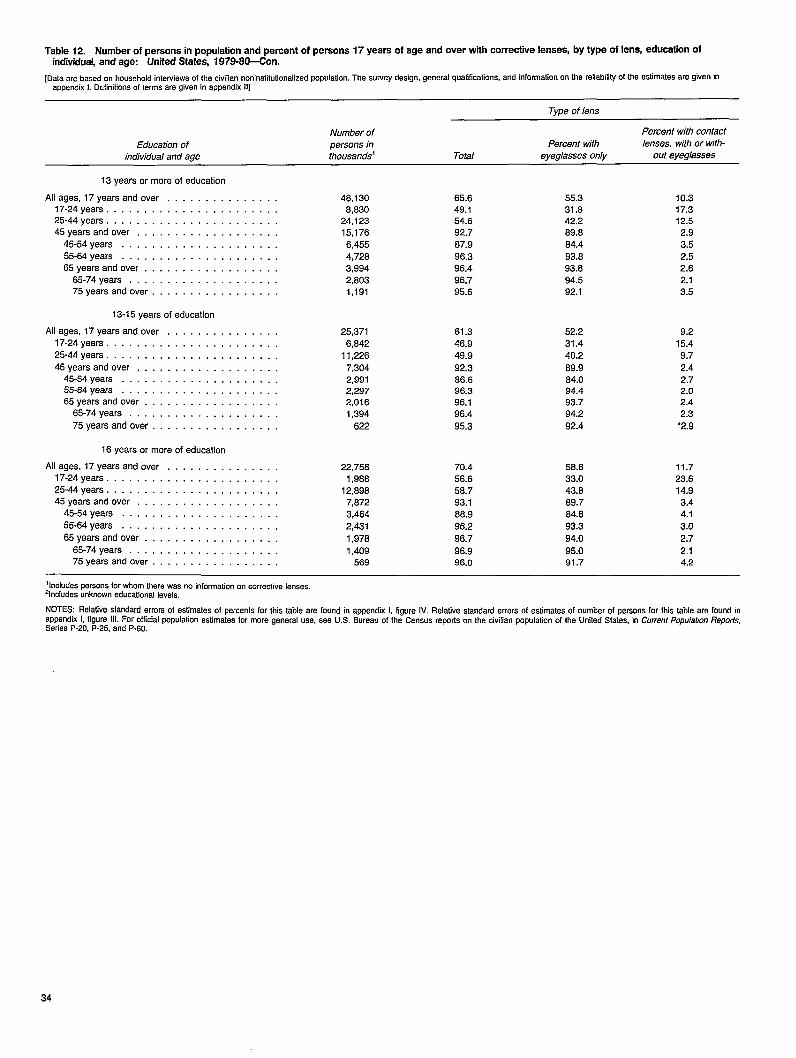
Table 12.. Number ofperaons inpopulation andpercent ofpersons 17years ofageand overwRh comedve lenses, by~peof lens, ducationofindividual, and age: United States, 1979-8fFf20n.
[Data are based on household interviews of the civifian noninstitutionalized population. The auwey design, general qualifications, and information on the refinability of the eatimatea are given in
aPPendix 1. Definitions of terms are given in appendix II]
Type of lens
Number of Percent with contact
Education of persons in Percent with lenses, with or wiih-
individual and age thousands’ Total eyeglasses only out eyeglasses
13 years or more of education
Allages, 17 years and over . . . . . . . . . . . . . . . 48,130 65.6 55.3 10.317-24 years . . . . . . . . . . . . . . . . . . . . . . . 8,830 49.1 31.8 17.325-44years . . . . . . . . . . . . . . . . . . . . . . . 24,123 54.6 42.2 12.545yearsand over . . . . . . . . . . . . . . . . . . . 15,176 92.7 89.8 2.9
45-54years . . . . . . . . . . . . . . . . . . . . . 6,455 87.9 84.4 3.555-64years . . . . . . . . . . . . . . . . . . . . . 4,728 98.3 93.8 2.565yearsandover . . . . . . . . . . . . . . . . . . 3,994 96.4 93.8 2.6
65-74years . . . . . . . . . . . . . . . . . . . . 2,803 96.7 94.5 2.175yearsandover . . . . . . . . . . . . . . . . . 1,191 95.8 92.1 3.5
13-15 years of education
Allages, 17yearsandover . . . . . . . . . . . . . . .17-24years . . . . . . . . . . . . . . . . . . . . . . .
25-44years . . . . . . . . . . . . . . . . . . . . . . .
45yearsandover . . . . . . . . . . . . . . . . . . .45-54years . . . . . . . . . . . . . . . . . . . . .55-64years . . . . . . . . . . . . . . . . . . . . .65yearsand over . . . . . . . . . . . . . . . . . .
65-74years . . . . . . . . . . . . . . . . . . . .
75yearaand over . . . . . . . . . . . . . . . . .
25,371
6,84211,226
7,3042,9912,2972,0161,394
622
61.346.949.9
92.388.698.396.196.4
95.3
52.231.440.2
89.984.094.493.794.2
92.4
9.215.4
9.7
2.42.72.02.42.3
●2.9
16 years or more of education
Allages, 17yearsandover . . . . . . . . . . . . . . . 22,758 70.4 56.8 11.717-24years . . . . . . . . . . . . . . . . . . . . . . . 1,986 56.6 33.0 23.625-44years . . . . . . . . . . . . . . . . . . . . . . . 12,898 58.7 43.8 14.945yaarsandover . . . . . . . . . . . . . . . . . . . 7,872 93.1 89.7 3.4
45-54years . . . . . . . . . . . . . . . . . . . . . 3,464 88.9 84.8 4.155-64years . . . . . . . . . . . . . . . . . . . . . 2,431 96.2 93.3 3.065years Andover . . . . . . . . . . . . . . . . . . 1,978 96.7 94.0 2.7
65-74years . . . . . . . . . . . . . . . . . . . . 1,409 96.9 95.0 2.175yearsand over . . . . . . . . . . . . . . . . . 569 96.0 91.7 4.2
llncludea peraonafor whom there was no information on corrective lenses.‘Includes unknown educational levels,
NOTE6: Relafive atandard errors ofestimateaof parcants forthis table are found inappendix l, figurelV. Relafive atandard errors of eatimatesof numbarof persons forthis table are found in
aPPendix l,f19ure111.Forofficial wpulation eatimateaformoregeneraluae, aee U.S. Bureau of the Cenausre~fls onthecivikan ppu[ation of the United Statea, in Current Population RepoHs,Series P-20, P-25, and P-60.
34
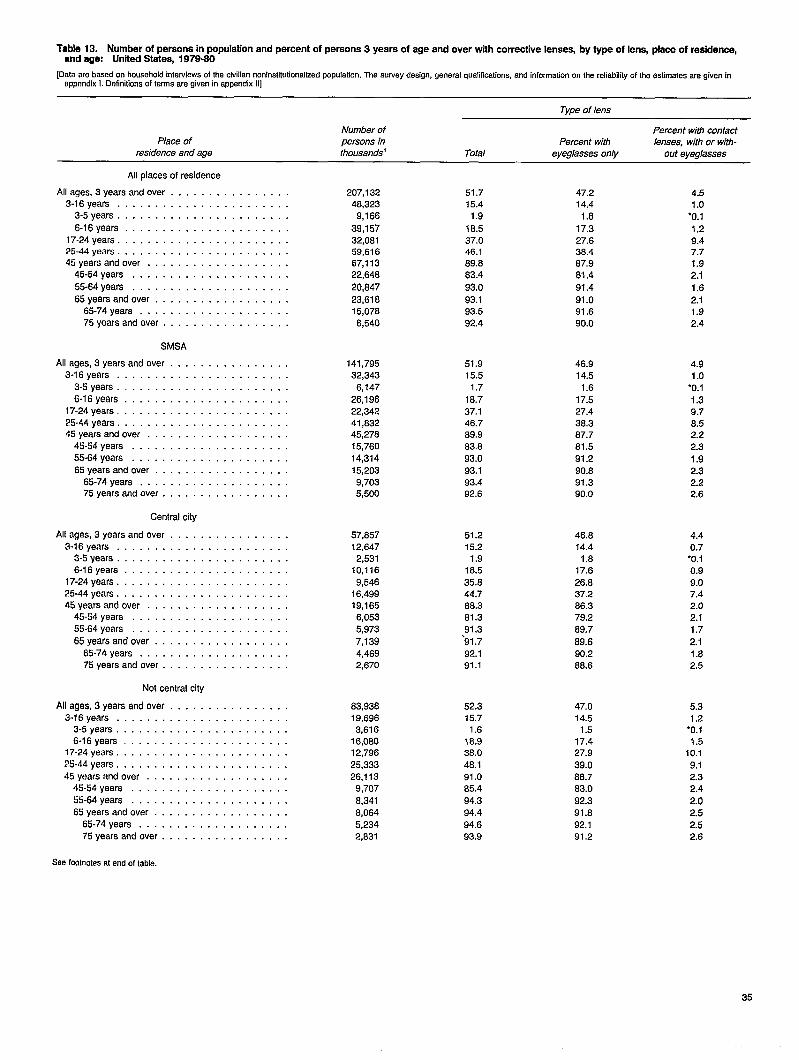
Table 13. Number ofpersons in~pulstion andpercent ofpersons 3yaarsof ageandover wkhcometitie lense$by ~ofknqpkce ofrestience,and age: United States, 1979-80
[Data are based on household interviews of the civiffan noninatitutiona fized population. The survey design, general qualifications, and information on the refiabifiiy of the estimates are given in
appandlx 1.Daflnltlons of terms are givan in appendix II]
Type of lens
Number of Percent with contactPlace of persons in Percent with lenses, with or with-
residence and age thousands’ Total eyeglasses only out eyeglasses
All places of residence
Allages, 3yeara And over . . . . . . . . . . . . . . . .3-16 years . . . . . . . . . . . . . . . . . . . . . . .
3-5 years . . . . . . . . . . . . . . . . . . . . . . .
6-16yeara . . . . . . . . . . . . . . . . . . . . . .17-24years . . . . . . . . . . . . . . . . . . . . . . .25-44years . . . . . . . . . . . . . . . . . . . . . . .45yearsandover . . . . . . . . . . . . . . . . . . .
45-54yeara . . . . . . . . . . . . . . . . . . . . .
55-64years . . . . . . . . . . . . . . . . . . . . .
65yearsandover . . . . . . . . . . . . . . . . . .65-74years . . . . . . . . . . . . . . . . . . . .75yearsandover . . . . . . . . . . . . . . . . .
SMSA
Allages,3yearsand over.... . . . . . . . . . . . .3-16years . . . . . . . . . . . . . . . . . . . . . . .
3-5years . . . . . . . . . . . . . . . . . . . . . . .
6-16years . . . . . . . . . . . . . . . . . . . . . .17-24years . . . . . . . . . . . . . . . . . . . . . . .25.44years . . . . . . . . . . . . . . . . . . . . . . .45yearsandover . . . . . . . . . . . . . . . . . . .
45-54years . . . . . . . . . . . . . . . . . . . . .
55-64years . . . . . . . . . . . . . . . . . . . . .
65yearsand over . . . . . . . . . . . . . . . . . .
65-74years . . . . . . . . . . . . . . . . . . . .75yearsandover . . . . . . . . . . . . . . . . .
Central city
Allages,3yearsand over.... . . . . . . . . . . . .
3-16years . . . . . . . . . . . . . . . . . . . . . . .3-5years . . . . . . . . . . . . . . . . . . . . . . .6-16years . . . . . . . . . . . . . . . . . . . . . .
17-24years . . . . . . . . . . . . . . . . . . . . . . .25-44years . . . . . . . . . . . . . . . . . . . . . . .45yearsand over . . . . . . . . . . . . . . . . . . .
45-54years . . . . . . . . . . . . . . . . . . . . .
55-64years . . . . . . . . . . . . . . . . . . . . .
65 yearsandover . . . . . . . . . . . . . . . . . .65-74years . . . . . . . . . . . . . . . . . . . .75yearsand over . . . . . . . . . . . . . . . . .
Not central city
Allages, 3years Andover . . . . . . . . . . . . . . . .
3-16years . . . . . . . . . . . . . . . . . . . . . . .3-5years . . . . . . . . . . . . . . . . . . . . . . .6-16years . . . . . . . . . . . . . . . . . . . . . .
17-24years . . . . . . . . . . . . . . . . . . . . . . .
25-44years . . . . . . . . . . . . . . . . . . . . . . .
45years Andover . . . . . . . . . . . . . . . . . . .45-54years . . . . . . . . . . . . . . . . . . . . .
55-64years . . . . . . . . . . . . . . . . . . . . .
65yearsandover . . . . . . . . . . . . . . . . . .
65-74years . . . . . . . . . . . . . . . . . . . .75yearsandover . . . . . . . . . . . . . . . . .
See fmlnoles at end of table.
207,13248,323
9,166
39,15732,06159,61667,11322,646
20,847
23,61815,076
8,540
32,3436,147
26,19622,34241,63245,27e15,760
14,314
15,203
9,7035,500
57,65712,647
2,53110,116
9,54616,49919,165
6,053
5,973
7,1394,4692,670
63,93619,6963,616
16,06012,796
25,33326,113
9,707
8,341e,064
5,2342,831
51.715.4
1.9
18.5
37.046.1e9.863.4
93.0
93.193.592.4
51.915.5
1.7
18.737.146.769.9e3.6
93.0
93.193.492.6
51.2
15.21.9
16.5
35.644.786.3
81.391.3
’91.7
92.191.1
52.315.7
1.616.938.0
46.191.0
65.4
94.394.4
94.693.9
47.2
14.4
1.8
17.327.638.467.981.4
91.491.091.6
90.0
46.914.5
1.6
17.527.4
38.367.761.5
91.290.691.390.0
46.614.4
1.817.6
26.637.286.379.2
89.7
69.690.2e6.6
47.014.5
1.517.427.9
39.086.763.0
92.391.6
92.191.2
4.51.0
‘0.1
1.29.47.71.9
2.1
1.6
2.11.92.4
4.91.0
“0.1
1.39.76.52.22.3
1.92.32.22.6
4.4
0.7“0.10.9
9.07.42.02.11.72.11.82.5
5.31.2
“0.11.5
10.1
9.12.32.4
2.02.5
2.52.6
35
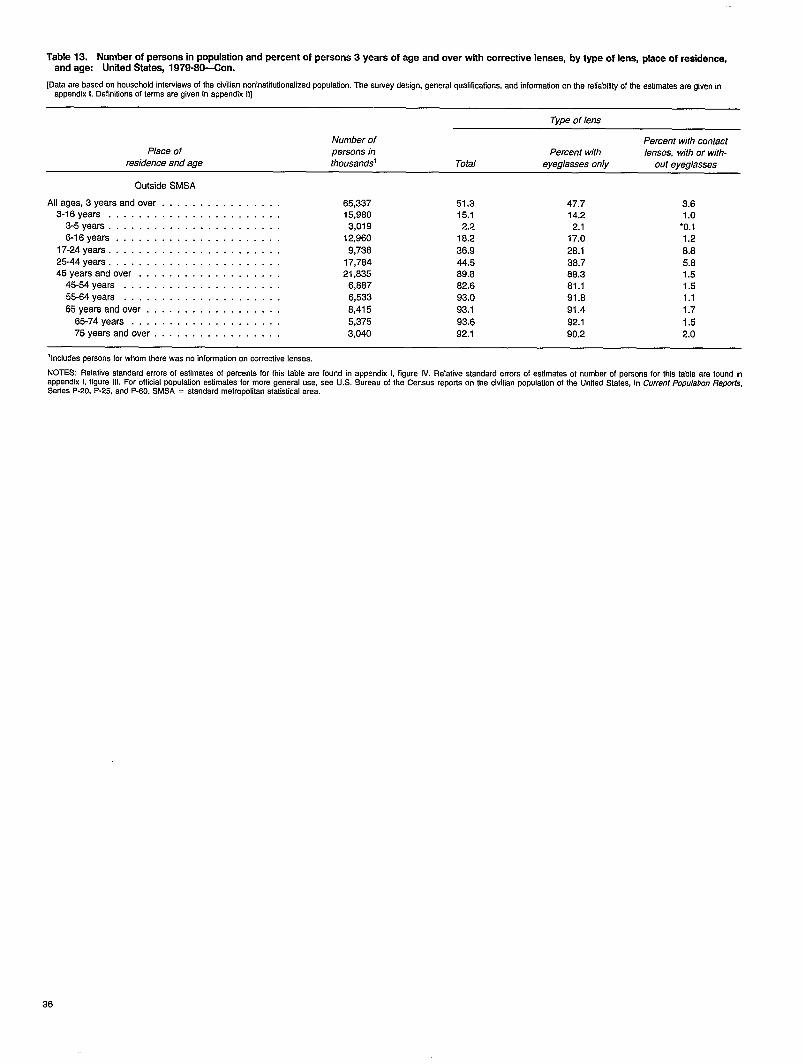
Table 13. Number ofpersons inpopulation andpercent ofpersons 3yearsof ageandover wtihcorrecttie lenaes, bytypeof lens, place of residence,and age UnitedStates, 1979-8fl-Con.
[Data are baaed on household inlewiews of the civilian noninatitutionalized population. The survey design, general qualitkatfona, and information cmthe refiabifityof the eafimateaare given inappendix 1. Definitiona of tarma are given in appendix II]
Type of lens
Number of Percent with corrkfdPlace of persons in Percent with lenses, with or with-
residence and age thousands Total eyeglasses only out eyeglasses
C)utside SMSA
Allages, 3 years And over . . . . . . . . . . . . . . . . 65,337 51.3 47.7 3.63-16 years . . . .
3-5 years . . . .6-16 years . . . .
17-24 years . . . . .25-44 years . . . .45 years and over .
45-54 years . . .
55-64 yeare . . .
65 years and over
65-74 years .
15,960
3,019
12,960
9,738
17,784
21,635
6,887
6,533
8,415
5,375
15.12.2
16.2
36.944.589.882.693.0
93.1
93.6
14.22.1
17.0
28.138.766.361.191.8
91.4
92.1
1.0“0.11.2
8.85.81.51.51.1
1.7
1.5
75years And over . . . . . . . . . . . . . . . . . 3,040 92.1 90.2 2.0
1Includes persona for whom there waa no information on corrective Ienaea.
NOTES: Relative standard errors of estimatea of parcanta for this table are found in appendix 1, figure IV. Relative standard errora of eatimatea of number of persona for this table are found In
aPPan~x L fi9ure Ill. For oficial Wpulation estimatea for more general use, aee U.S. Bureau of the Census reports on the civilian population of the United States, in CurrentPopulation Reports,Saries P-20, P-25, and P-60. SMSA = standard metropolitan statistical area.
36
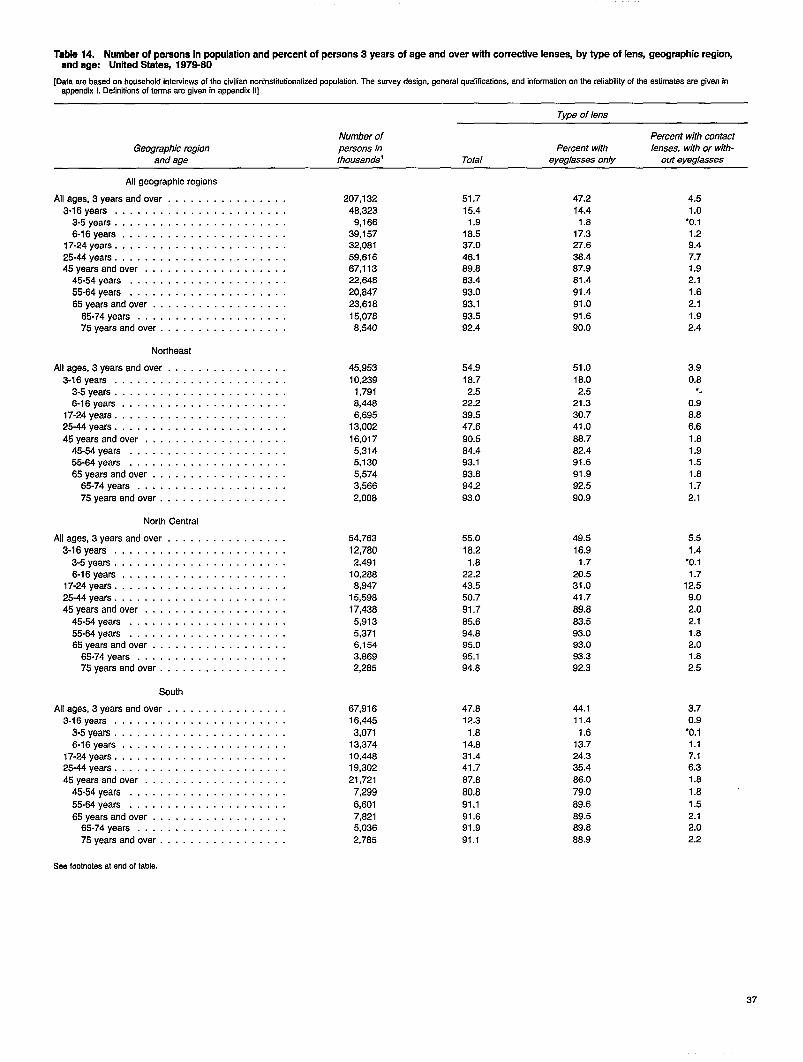
Table 14. Number of persons in population snd percent of persons 3 years of sge snd over with omectiie Ienseej by type of lens geographic region,and agc United Stateej 1979-80
[Data are baaed on houaahold Interviews of the civilian noninstitutionalized ~pulation. The survey deeign, general qualitisafions, and information on the reliability of the estimates ‘are given in
appendix 1. Definitions of tarrms are given in appendix II]
Type of lens
Number of Percent with contactGeographic region persons in Percent with lenses, with or with-
and age thousands’ Total eyeglasses only out eyeglasses
All geographic regions
Allages, 3yearaand over . . . . . . . . . . . . . . . .3-16 years . . . . . . . . . . . . . . . . . . . . . . .
3-5 years . . . . . . . . . . . . . . . . . . . . . . .6.16years . . . . . . . . . . . . . . . . . . . . . .
17-24 years . . . . . . . . . . . . . . . . . . . . . . .25-44years . . . . . . . . . . . . . . . . . . . . . . .45yearsandover . . . . . . . . . . . . . . . . . . .
45-54years . . . . . . . . . . . . . . . . . . . . .55-64yeara . . . . . . . . . . . . . . . . . . . . .65yearsandover . . . . . . . . . . . . . . . . . .
65-74yeara . . . . . . . . . . . . . . . . . . . .75yearaandover . . . . . . . . . . . . . . . . .
Northeast
Allages,3yearaand over . . . . . . . . . . . . . . . .3-16years . . . . . . . . . . . . . . . . . . . . . . .
3-5yeara . . . . . . . . . . . . . . . . . . . . . . .6-16years . . . . . . . . . . . . . . . . . . . . . .
17-24years . . . . . . . . . . . . . . . . . . . . . . .25-44yeara . . . . . . . . . . . . . . . . . . . . . . .45yearsandover . . . . . . . . . . . . . . . . . . .
45-54years . . . . . . . . . . . . . . . . . . . . .55-64years . . . . . . . . . . . . . . . . . . . . .65yearsandover . . . . . . . . . . . . . . . . . .
65-74years . . . . . . . . . . . . . . . . . . . .75yearsandover . . . . . . . . . . . . . . . . .
North Central
Allages,3yearsand over..... . . . . . . . . . . .3-16years . . . . . . . . . . . . . . . . . . . . . . .
3-5years . . . . . . . . . . . . . . . . . . . . . . .6-16years . . . . . . . . . . . . . . . . . . . . . .
17-24yeara . . . . . . . . . . . . . . . . . . . . . . .25-44years . . . . . . . . . . . . . . . . . . . . . . .45yearaandover . . . . . . . . . . . . . . . . . . .
45-54yaars . . . . . . . . . . . . . . . . . . . . .55-64years . . . . . . . . . . . . . . . . . . . . .65yearsandover . . . . . . . . . . . . . . . . . .
65-74years . . . . . . . . . . . . . . . . . . . .75yearsandover . . . . . . . . . . . . . . . . .
South
Allages,3yearsandover . . . . . . . . . . . . . . . .3-16years . . . . . . . . . . . . . . . . . . . . . . .
3-5years . . . . . . . . . . . . . . . . . . . . . . .6-16years . . . . . . . . . . . . . . . . . . . . . .
17-24yeara . . . . . . . . . . . . . . . . . . . . . . .25-44years . . . . . . . . . . . . . . . . . . . . . . .45yearsandover . . . . . . . . . . . . . . . . . . .
45-54years . . . . . . . . . . . . . . . . . . . . .55-64years . . . . . . . . . . . . . . . . . . . . .65yearsandover . . . . . . . . . . . . . . . . . .
65-74years . . . . . . . . . . . . . . . . . . . .75yearaand over . . . . . . . . . . . . . . . . .
Seafootnotesat endof table.
207,13246,3239,166
39,15732,06159,61667,11322,64820,64723,61615,0786,540
45,95310,2391,7918,4486,695
13,00216,0175,3145,1305,5743,5662,006
54,76312,7802,491
10,2666,947
15,59817,4385,9135,3716,1543,6692,285
67,91616,4453,071
13,37410,44619,30221,721
7,299
6,6017,821
5,036
2,785
51.7
15.41.9
18.537.046.169.663.493.093.193.592.4
54.918.72.5
22.239.547.680.584.493.193.894.293.0
55.016.21.8
22.243.550.791.785.694.895.095.194.6
47.612.3
1.814.631.441.767.880.6
91.191.691.991.1
47.214.41.8
17.327.638.487.961.491.491.091.690.0
51.016.02.5
21.330.741.088.782.491.691.992.590.9
49.516.91.7
20.531.041.789.683.593.093.093.392.3
44.111.41.6
13.724.335.466.079.069.6a9.589.886.9
4.51.0
‘0.11.29.47.71.92.11.62.11.92.4
3.90.8
●.
0.98.86.61.81.91.51.81.72.1
5.51.4
‘0.11.7
12.59.02.02.11.62.01.82.5
3.70.9
‘0.11.17.16.31.81.61.52.12.02.2
37
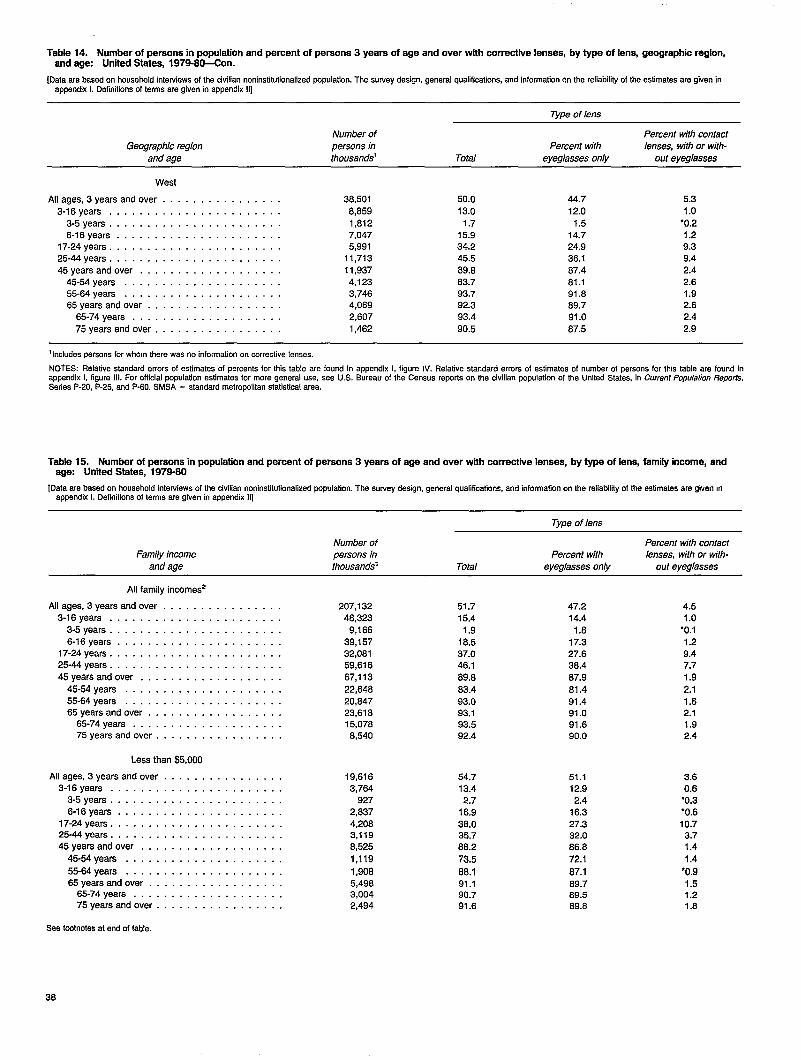
Tab+e 14. Number ofpersons inpopulstion sndpercent ofpersons3 years of ageandover with aorrectiie lenses, bytypeof lens, geography region,andsge: United States, 1979-80-Con.
[Data are based on housefmld interviews of the civilian noninatitutionalized population. The survey design, general qualifications, and information on the reliabifiiy of the estimates are given inappendix 1.Definitionsof terms are given in appendix II]
Type of lens
Number of Percent with contact
Geographic region persons in Percent with lenses, with or with-
and age thousands’ Total eyeglasses only out eyeglasses
West
Allages, 3yearsand over . . . . . . . . . . . . . . . .
3-16years . . . . . . . . . . . . . . . . . . . . . . .3-5years . . . . . . . . . . . . . . . . . . . . . . .6-16years . . . . . . . . . . . . . . . . . . . . . .
17-24years . . . . . . . . . . . . . . . . . . . . . . .25-44years . . . . . . . . . . . . . . . . . . . . . . .
45yeareandover . . . . . . . . . . . . . . . . . . .45-54years . . . . . . . . . . . . . . . . . . . . .55-64years . . . . . . . . . . . . . . . . . . . . .65yearsandover . . . . . . . . . . . . . . . . . .
65-74years . . . . . . . . . . . . . . . . . . . .
75yearsand over . . . . . . . . . . . . . . . . .
36,501
8,8591,8127,0475,991
11,713
11,9374,1233,7464,0692,607
1,462
50.0
13.01.715.934.245.5
89.883.793.792.393.4
90.5
44.7
12.0
1.514.724.9
36.187.481.191.889.791.0
87.5
5.3
1.0
‘0.21.29.39.42.42.61.92.62.4
2.9
‘Includes persons for whom there was no information on corrective lenses.
NOTES: Relative standard errors of estimates ofpercents fortKstable are found irlappentix l, figure IV. Relative standard errors of estimates of number ofpersons forthis table are foundln
aPPen$!x 1, fi9ure Ill. Foroficial wPulatiOn estimate$ f0rm0re9eneral use, aee U.S. sureauof the Census reWsOnthe Civifian Population Of the United Statea, in Cument Popu/aflon Rewds,Series P-20, P-25, and P-60. SMSA = standard metropefitan atatiaticalaraa.
Tsbfe 15. Numbrof ~monsin ppulation andpercent tipersons 3yearsof a~andoverwfih mmttie lenses, bytypeof lens, famiiyinoome, andagrx United States, 1979-80
[Data are based on household interviews of the civilian noninstiiufionalized population. The survey design, general qualifications, and information on the refiabifii of the estimates are given Inappendix 1. Definitions of terms are give” i“ appendix II]
Type of lens
Numberof Percent with contactFamilyirrcome persons in Percent with lenses, with or with-
and age thousands’ Tots\ eyeglasses only out eyeglasses
All family incomes2
Allagea,3yearsandover . . . . . . . . . . . . . . . .3-16yeara . . . . . . . . . . . . . . . . . . . . . . .
3-5years . . . . . . . . . . . . . . . . . . . . . . .6-16years . . . . . . . . . . . . . . . . . . . . . .
17-24years . . . . . . . . . . . . . . . . . . . . . . .25-44years . . . . . . . . . . . . . . . . . . . . . . .
45yearsandover . . . . . . . . . . . . . . . . . . .
45-54years . . . . . . . . . . . . . . . . . . . . .
55-64years . . . . . . . . . . . . . . . . . . . . .65yearsandover . . . . . . . . . . . . . . . . . .
65-74years . . . . . . . . . . . . . . . . . . . .75yearsand over . . . . . . . . . . . . . . . . .
Less than $5,000
Allages, 3yearsandover . . . . . . . . . . . . . . . .
3-16years . . . . . . . . . . . . . . . . . . . . . . .3-5years . . . . . . . . . . . . . . . . . . . . . . .6-16years . . . . . . . . . . . . . . . . . . . . . .
17-24years . . . . . . . . . . . . . . . . . . . . . . .25-44ysars . . . . . . . . . . . . . . . . . . . . . . .
45yearsandover . . . . . . . . . . . . . . . . . . .
45-54years . . . . . . . . . . . . . . . . . . . . .
56-64yeara . . . . . . . . . . . . . . . . . . . . .65yearsandover . . . . . . . . . . . . . . . . . .
65-74years . . . . . . . . . . . . . . . . . . . .75yearsandover . . . . . . . . . . . . . . . . .
207,13246,323
9,16639,15732,08159,616
67,113
22,64820,84723,61815,0788,540
19,616
3,764
927
2,8374,2083,1198,525
1,119
1,9085,4983,0042,494
51.7
15.41.9
18.537.046.1
89.8
63.493.093.193.592.4
54.713.42.7
16.9
38.035.788.2
73.5
88.191.190.791.6
47.214.4
1.8
17.327.638.487.9
81.491.491.091.690.0
51.1
12.9
2.4
16.3
27.3
32.0
86.8
72.1
87.189.7S9.569.6
4.5
1.0
‘0.11.29.47.71.9
2.11.62.11.92.4
3.60.6
“0.3
‘0.610.7
3.71.4
1.4
‘0.91.51.2
1.6
See footnotes at end of table.
38
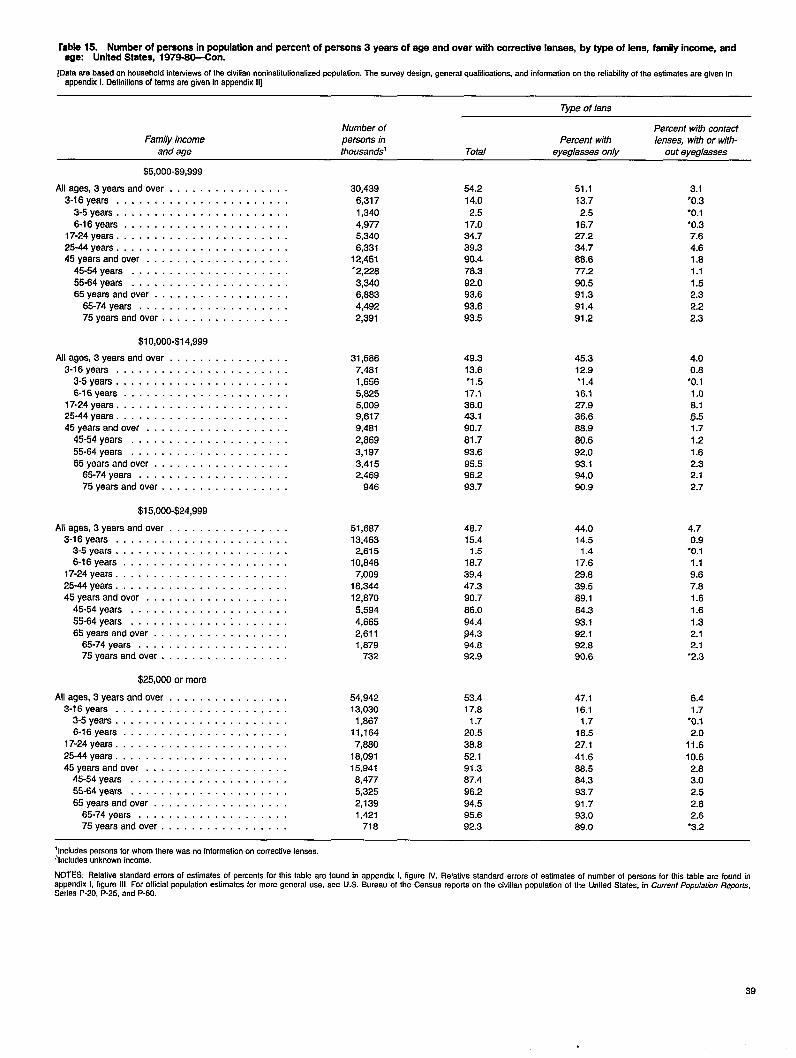
kbla 15. Numhrof pemonsin ~pulation andpercent of@mona 3yearsof a~andoverwfih wmeMtie lense$by ~ofkn~ti~in~e, andsge: United Stete~ 1979-StJ-Con.
[Data are based cm household interviews of the civilian nonlnstitutionalized population. The survey design, general quafifiaations, and information on the refiabilii of the estimates are given in
appendix L Definitions of terms are given in apparrdix II]
Type of lens
Number of Percent with contactFamily income persona in Percent with lenses. with or with-
and age ihousandsq Total eyeglasses only out eyeglasses
$5,000-$9,999
Allages,3years Andover . . . . . . . . . . . . . . . .3.16years . . . . . . . . . . . . . . . . . . . . . . .
3-5years . . . . . . . . . . . . . . . . . . . . . . .6-16years . . . . . . . . . . . . . . . . . . . . . .
17-24years . . . . . . . . . . . . . . . . . . . . . . .25-44years . . . . . . . . . . . . . . . . . . . . . . .45yeareandover . . . . . . . . . . . . . . . . . . .
45-54years . . . . . . . . . . . . . . . . . . . . .55-64yeara . . . . . . . . . . . . . . . . . . . . .65yearsandover . . . . . . . . . . . . . . . . . .
65-74years . . . . . . . . . . . . . . . . . . . .75yearsandover . . . . . . . . . . . . . . . . .
$10,000-$14,999
Allagee, 3yearsandover . . . . . . . . . . . . . . . .3-16years . . . . . . . . . . . . . . . . . . . . . . .
3-5years . . . . . . . . . . . . . . . . . . . . . . .6-16years . . . . . . . . . . . . . . . . . . . . . .
17-24years . . . . . . . . . . . . . . . . . . . . . . .25-44yeara . . . . . . . . . . . . . . . . . . . . . . .45yearsandover . . . . . . . . . . . . . . . . . . .
45-54years, . . . . . . . . . . . . . . . . . . . .55-64years . . . . . . . . . . . . . . . . . . . . .65yeareandover . . . . . . . . . . . . . . . . . .
65-74years . . . . . . . . . . . . . . . . . . . .75yearsand over . . . . . . . . . . . . . . . . .
$16,000-$24,999
Allagee, 3yearsandover . . . . . . . . . . . . . . . .3-16years . . . . . . . . . . . . . . . . . . . . . . .
3-5yeara . . . . . . . . . . . . . . . . . . . . . . .6-16years . . . . . . . . . . . . . . . . . . . . . .
17-24years . . . . . . . . . . . . . . . . . . . . . . .25-44years . . . . . . . . . . . . . . . . . . . . . . .45yearsandover . . . . . . . . . . . . . . . . . . .
45-54years . . . . . . . . . . . . . . . . . . . . .55-64years . . . . . . . . . . . . .: . . . . . . .65yearaandover . . . . . . . . . . . . . . . . . .
65-74years . . . . . . . . . . . . . . . . . . . .75yearsandover ..,.,... . . . . . . . . .
$25,000 or more
Allages, 3yearsandover . . . . . . . . . . . . . . . .3-16years . . . . . . . . . . . . . . . . . . . . . . .
3-5years . . . . . . . . . . . . . . . . . . . . . . .6-16years . . . . . . . . . . . . . . . . . . . . . .
17-24years . . . . . . . . . . . . . . . . . . . . . . .25-44yeare . . . . . . . . . . . . . . . . . . . . . . .45yearaandover . . . . . . . . . . . . . . . . . . .
45-54years . . . . . . . . . . . . . . . . . . . . .65-64years . . . . . . . . . . . . . . . . . . . . .65yearsandover . . . . . . . . . . . . . . . . . .
65-74yeara . . . . . . . . . . . . . . . . . . . .75yearsandover . . . . . . . . . . . . . . . . .
30,4396,3171,3404,9775,3406,331
12,451“2,2263,3406,6634,4922,391
31,5667,4611,6565,6255,0099,6179,4el2,6693,1973,4152,469
946
51,66713,4632,615
10,6467,009
16,34412,6705,5944,6652,6111,879
732
54,94213,0301,667
11,1647,680
16,09115,9416,4775,3252,1391,421
716
54.214.02.5
17.034.739.390.476.392.093.693.693.5
49.313.6●1.617.136.043.190.761.793.695.596.293.7
46.715.41.5
18.739.447.390.766.094.4.84.394.892.9
53.417.81.7
20.536.652.191.367.496.294.595.692.3
51.113.72.5
16.727.234.766.677.290.591.391.491.2
45.312.9‘1.416.127.936.666.960.692.093.194.090.9
44.014.51.4
17.629.639.569.164.393.192.192.890.6
47.116.11.7
18.527.141.688.564.393.791.793.069.0
3.1‘0.3“0.1‘0.37.64.61.81.11.52.32.22.3
4.00.8‘0.11.06.16.51.71.21.62.32.12.7
4.70.9
“0.11.19.67.81.61.61.32.12.1
“2.3
6.41.7
‘0.12.0
11.610.62.83.02.52.62.6
‘3.2
llncludes persons for whom there was no information on corrective lenses.‘Includes unknown income,
NOTES: Relative standard errors ofestimatea ofpercenta fortNstsble are found inappentix l, figurelV. Relative standard ermrsof estimates of number of pi?raons forthia table are found in
aPPan~xLf19ure1i1 FOrOficial population es~mateaf ormoreg enera1use,see U.8. 8ureauof the Census reports onthecMianp opuMonofthe United 8tates, in Current Population Remx’fa,Series P-20, P-25, and P-60.
39
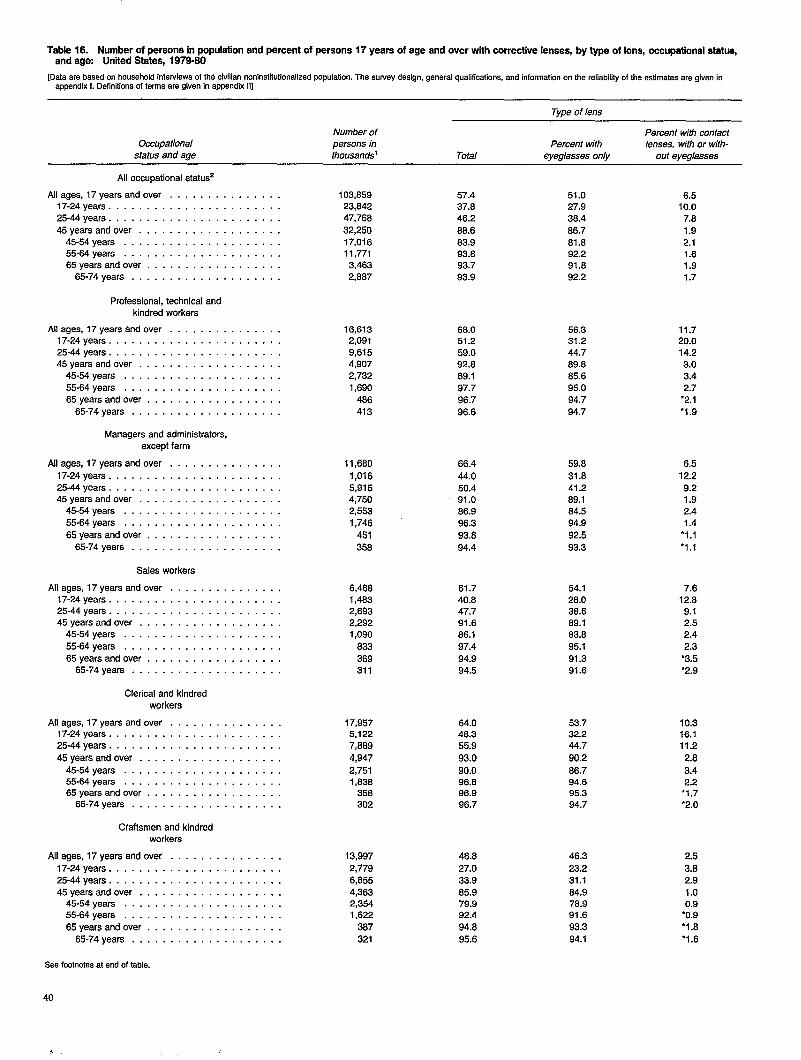
Table 16. Number of~raons in~pulation andpercent of~mons 17yeamof ageandover wfih@mective len~s, by~eoflens, ~cupationala@tqand age United States, 1979-80
[Data are baaed cm household interviews of th6 civilian noninstitutionalized ~pulation. The survey design, general qualification, and information on the reliability of the estimates are given inappendix 1.Definitionsof terms are given in appendix II]
Type of lens
Number ofOccupational
Percent with contactpersons in Percent with lenses, with or with-
status and age thousands’ Total eyeglasses only out eyeglasses
All occupational status2
Allages, 17years and over . . . . . . . . . . . . . . .17-24 years . . . . . . . . . . . . . . . . . . . . . . .
25-44years . . . . ...<.... . . . . ..I . . . .
45yearsandover . . . . . . . . . . . . . . . . . . .45-54yeara . . . . . . . . . . . . . . . . . . . . .55-64yeara . . . . . . . . . . . . . . . . . . . . .65yearsandover . . . . . . . . . . . . . . . . . .
65.74years . . . . . . . . . . . . . . . . . . . .
103,85923,84247,768
32,25017,01611,771
3,463
2.887
57.4
37.8
46.2
88.6
83.9
93.8
93.7
93.9
51.027.9
38.4
86.7
81.8
92.2
91.8
92.2
8.5
10.0
7.8
1.92.11.81.9
1.7
Professional, tacllnical andkindred workers
Allages, 17yearsandover . . . . . . . . . . . . . . .17-24years . . . . . . . . . . . . . . . . . . . . . . .25-44years . . . . . . . . . . . . . . . . . . . . . . .45yearsandover . . . . . . . . . . . . . . . . . . .
45-54years . . . . . . . . . . . . . . . . . . . . .
55-64years . . . . . . . . . . . . . . . . . . . . .65yearsand over . . . . . . . . . . . . . . . . . .
65-74years . . . . . . . . . . . . . . . . . . . .
16,613
2,091
9,615
4,907
2,732
1,690
486
413
68.0 56.331.244.789.885.695.0
94.794.7
11.7
20.0
14.2
3.03.42.7
‘2.1
“1.9
51.2
59.0
92.8
89.1
97.7
96.7
96.6
Managers and administrators,except farm
Allages, 17yearsandover . . . . . . . . . . . . . . .
17-24years . . . . . . . . . . . . . . . . . . . . . . .25-44years . . . . . . . . . . . . . . . . . . . . . . .45yaarsandover . . . . . . . . . . . . . . . . . . .
45-54yeara . . . . . . . . . . . . . . . . . . . . .55-64years . . . . . . . . . . . . . . . . . . . . .
65yearsandover . . . . . . . . . . . . . . . . . .65-74yeara . . . . . . . . . . . . . . . . . . . .
11,680
1,016
5,9154,7602,5531,746
461
358
66.4
44.050.491.086.996.3
93.894.4
59.8
31.641.289.184.5
94.9
92.5
93.3
6.512.2
9.21.92.41.4
‘1.1
‘1.1
Sales workers
Allages, 17yearsandover . . . . . . . . . . . . . . .17-24years . . . . . . . . . . . . . . . . . . . . . . .25-44years . . . . . . . . . . . . . . . . . . . . . . .45yearsandover . . . . . . . . . . . . . . . . . . .
45-54years . . . . . . . . . . . . . . . . . . . . .
55-64years . . . . . . . . . . . . . . . . . . . . .
65yearsandover . . . . . . . . . . . . . . . . . .65-74years . . . . . . . . . . . . . . . . . . . .
6,4681,4832,693
2,292
1,090
833
369
311
61.740.847.791.686.1
97.4
94.994.5
54.128.038.689.183.8
95.1
91.391.6
7.612.8
9.12.52.4
2.3
‘3.5‘2.9
Clerical and kindredworkers
Allages, 17yearsandover . . . . . . . . . . . . . . .17-24years . . . . . . . . . . . . . . . . . . . . . . .25-44yeara . . . . . . . . . . . . . . . . . . . . . . .
45yearsandovar . . . . . . . . . . . . . . . . . . .
45-54years . . . . . . . . . . . . . . . . . . . . .55-84years . . . . . . . . . . . . . . . . . . . . .65yearsandover . . . . . . . . . . . . . . . . . .
65-74yeara . . . . . . . . . . . . . . . . . . . .
17,9575,1227,869
4,947
2,7511,838
358302
64.048.355.9
93.0
90.096.S96.996.7
53.732.244.7
90.2
86.794.695.394.7
10.316.111.2
2.8
3.42.2
‘1.7●2.O
Craftsmen and kindredworkers
Allages, 17yearsandover . . . . . . . . . . . . . . . 13,997
2,779
6,8554,3632,3541,622
387
321
48.8
27.0
33.985.979.992.4
94.695.6
46.3
23.2
31.184.978.991.6
93.3
94.1
2.5
3.82.9
1.00.9
‘0.9‘1.8
*1.6
17-24years. . . . . .25-44years. . . . . .
45years and over . .45-54years . . . .55-64 yeara . . .
65years andover .65-74 years . . .
See footnotes at end of table.
40
. . . . . . . . . . . . . . . . .
. . . . . . . . . . . . . . . . .
. . . . . . . . . . . . . . . . .
. . . . . . . . . . . . . . . . .
. . . . . . . . . . . . . . . . .
. . . . . . . . . . . . . . . . .
. . . . . . . . . . . . . . . . .
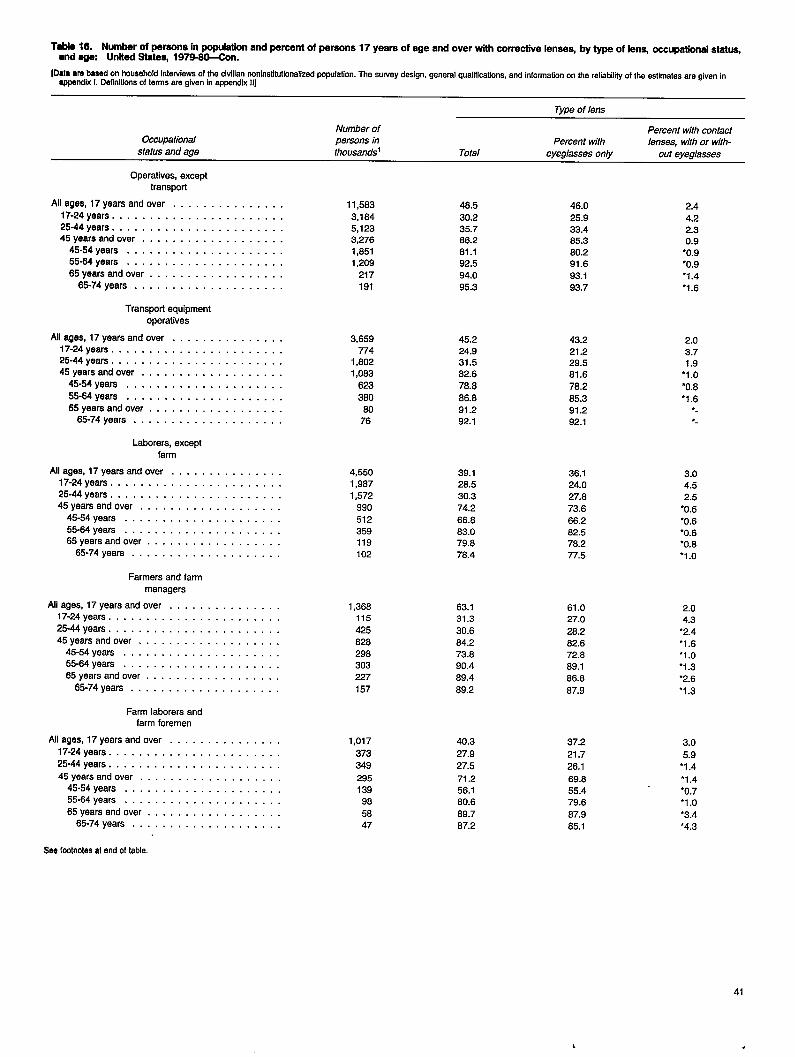
T* 16. Number of parsons in populationand percent of parsons 17 years of age and over with corrective Ienee$ by type of lens occupational statuq●nd w United State$ 1979-60-Con.
[Data am bawd on household interviewsof ths civilian ncminsfiiutlonalizedpopulation. The survey desgn, general qusliicafiins, and informationon the reliabilii of the estimates are given inappandlx 1.Definitionsof terms are given in appendix 11]
Type of lens
Number ofOccupational
Percent with contactpersons in Percent with lenses, with or with-
status and age thousandsl Total eyeglasses only out eyeglasses
Operatives, excepttranspori
Allages, 17yearsandover . . . . . . . . . . . . . . . 11,583 48.5 46.017-24 years . . . . . . . . . . . . . . . . . . . . . . .
2.4
3,184 30.2 25.925-44 yeara . . . . . . . . . . . . . . . . . . . . . . .
4.25,123 35.7 33.4
45yeara And over . . . . . . . . . . . . . . . . . . .2.3
3,276 86.2 65.345-54 yeara . . . . . . . . . . . . . . . . . . . . .
0.91,851 81.1 60.2
55-84 years . . . . . . . . . . . . . . . . . . . . .“0.9
1,209 92.5 91.665years And over . . . . . . . . . . . . . . . . . .
“0.9217 94.0 93.1
65-74 years . . . . . . . . . . . . . . . . . . . .‘1.4
191 95.3 93.7 ‘1.6
Tranaport equipmantoperatives
Allages, 17years and over . . . . . . . . . . . . . . .17-24 years . . . . . . . . . . . . . . . . . . . . . . .25-44 years . . . . . . . . . . . . . . . . . . . . . . .45 years Andover . . . . . . . . . . . . . . . . . . .
45.54 years, . . . . . . . . . . . . . . . . . . . .
55-64 years . . . . . . . . . . . . . . . . . . . . .65years Andover . . . . . . . . . . . . . . . . . .
65-74 yeera . . . . . . . . . . . . . . . . . . . .
Laborers, exceptfarm
Allages, 17years and over . . . . . . . . . . . . . . .17-24years . . . . . . . . . . . . . . . . . . . . . . .25-44years . . . . . . . . . . . . . . . . . . . . . . .45yearsandover . . . . . . . . . . . . . . . . . . .
45-54years . . . . . . . . . . . . . . . . . . . . .55-64yeara . . . . . . . . . . . . . . . . . . . . .65yearsandover . . . . . . . . . . . . . . . . . .
65-74yeara . . . . . . . . . . . . . . . . . . . .
Farmera and farm
managera
Allages, 17yearaandover . . . . . . . . . . . . . . .17-24yaara . . . . . . . . . . . . . . . . . . . . . . .
25-44years . . . . . . . . . . . . . . . . . . . . . . .45yearsandover . . . . . . . . . . . . . . . . . . .
46-64years . . . . . . . . . . . . . . . . . . . . .55-64yeara . . . . . . . . . . . . . . . . . . . . .65yearsandover . . . . . . . . . . . . . . . . . .
65.74years . . . . . . . . . . . . . . . . . . . .
Farm laborers andfarm foremen
Allages, 17yearsandover . . . . . . . . . . . . . . .
17-24years . . . . . . . . . . . . . . . . . . . . . . .
25-44years . . . . . . . . . . . . . . . . . . . . . . .
45yaarsandover . . . . . . . . . . . . . . . . . . .
45-54years . . . . . . . . . . . . . . . . . . . . .55-64years . . . . . . . . . . . . . . . . . . . . .
65yearsandover . . . . . . . . . . . . . . . . . .65-74years ., .,, ,, . . . . . . . . . . . . .
3,65977’4
1,8021,083
623
36080
76
4,5501,9871,572
990512359119102
1,368115
425
82829e303227
157
1,017
373349
29513998
5847
45.224.931.582.6
78.6
66.691.292.1
39.128.530.3
74.266.883.079.876.4
63.131.3
30.684.273.890.489.4
69.2
40.3
27.927.5
71.256.180.6
89.787.2
43.221.229.581.6
78.2
85.391.292.1
36.124.027.8
73.666.282.578.277.5
61.027.0
28.282.672.889.186.8
67.9
37.2
21.7
26.1
69.855.479.6
87.985.1
2.03.71.9
●1.0
‘0.8●1.6
●-
3.04.52.5
‘0.6“0.6‘0.6‘0.8“1.0
2.04.3
●2.4●1.6‘1.0*I .3“2.6
“1.3
3.0
5.9●1.4
‘1.4‘0.7“1.0
*3.4‘4.3
2.ss footnotesat end of tabla
41
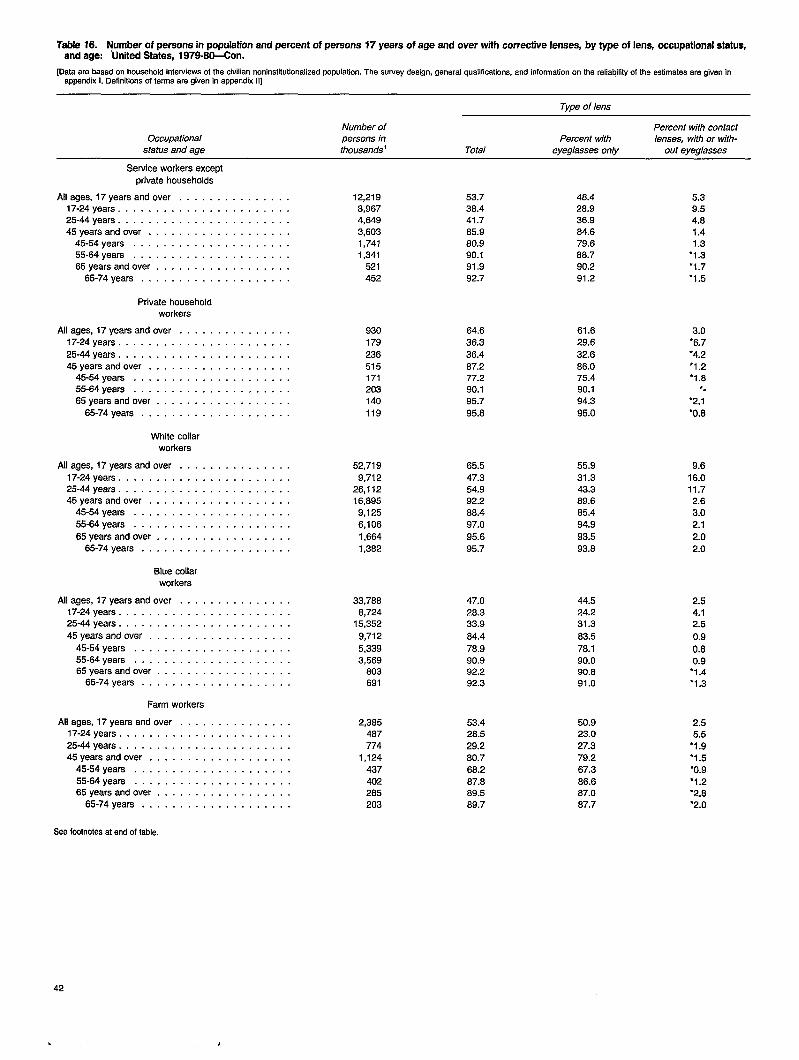
T’aMa 16. Number ofperaons inpo~lstion andpercent of~rsons 17years ofageand overw2h ~rrective lense~by ~eoflenalmupational stitu&and age: lJrtited States, 1979-60-Con.
[Data are basad on household intewiews of the civilian noninstitutionalizad population. Tha suwey design, ganeral qualifications, and information on tha reliability of tha estimales are givan Inappandlx 1.Definitionsof terms are given in appendix II]
Type of lens
Number ofOccupational
Percent with contactpersons in Percent with lenses, with or with-
status and age thousands’ Total eyeglasses only out eyeglasses
Service workers exceptprivate householda
Allages, 17years and over . . . . . . . . . . . . . . .17-24 years . . . . . . . . . . . . . . . . . . . . . . .25-44years . . . . . . . . . . . . . . . . . . . . . . .45yearsandover . . . . . . . . . . . . . . . . . . .
45-54years . . . . . . . . . . . . . . . . . . . . .55-64years . . . . . . . . . . . . . . . . . . . . .65yearsandover . . . . . . . . . . . . . . . . . .
65-74years . . . . . . . . . . . . . . . . . . . .
Private householdworkers
Allages, 17yearsandover . . . . . . . . . . . . . . .17-24years . . . . . . . . . . . . . . . . . . . . . . .
25-44years . . . . . . . . . . . . . . . . . . . . . . .45yearsandover . . . . . . . . . . . . . . . . . . .
45-54years . . . . . . . . . . . . . . . . . . . . .55-64years . . . . . . . . . . . . . . . . . . . . .65yearsandover . . . . . . . . . . . . . . . . . .
65-74years . . . . . . . . . . . . . . . . . . . .
White collarworkers
Allages, 17yearsandover . . . . . . . . . . . . . . .17-24years . . . . . . . . . . . . . . . . . . . . . . .25-44yesrs . . . . . . . . . . . . . . . . . . . . . . .45yearsandover . . . . . . . . . . . . . . . . . . .
45-54years . . . . . . . . . . . . . . . . . . . . .
55-fMyears . . . . . . . . . . . . . . . . . . . . .
65yearsandover . . . . . . . . . . . . . . . . . .65-74years . . . . . . . . . . . . . . . . . . . .
Blue collarworkers
Allagea, 17yearsandover . . . . . . . . . . . . . . .17-24years . . . . . . . . . . . . . . . . . . . . . . .25-44years . . . . . . . . . . . . . . . . . . . . . . .
45yearsand over .,....... . . . . . . . . . .
45-54yeara . . . . . . . . . . . . . . . . . . . . .55-64years . . . . . . . . . . . . . . . . . . . . .65yearsandover . . . . . . . . . . . . . . . . . .
65-74years . . . . . . . . . . . . . . . . . . . .
Farm workera
Allages, 17yearsandover . . . . . . . . . . . . . . .17-24years. . . . . .
25-44years. . . . .45years and over . .
45-54 years . . . .55-64years . . . .65years and over .
65-74years . . .
See fcotnotes at end of table.
. . . . . . . . . . . . . . . .
. . . . . . . . . . . . . . . . .
. . . . . . . . . . . . . . . . .
. . . . . . . . . . . . . . . . .
. . . . . . . . . . . . . . . . .
. . . . . . . . . . . . . . . . .
. . . . . . . . . . . . . . . . .
12,2193,9674,6493,6031,7411,341
521452
930779
236
515171203140
119
52,7199,712
26,11216,695
9,1256,1061,6641,3S2
33,766S,724
15,352
9,712
5,3393,569
S03691
2,365467774
1,1244374022S5203
53.73s.441.765.980.990.191.992.7
64.636.336.4S7.277.290.195.795.6
65.547.354.992.266.497.0
95.695.7
47.028.333.9
64.476.990.992.292.3
53.428.529.260.766.267.689.569.7
4s.428.936.9S4.679.688.790.291.2
61.629.6
32.666.075.490.194.395.0
55.931.343.389.665.494.993.593.s
44.524.231.3
83.576.190.090.891.0
50.923.027.379.267.366.687.067.7
5.39.54.81.41.3
‘1.3●1.7“1.5
3.0●6.7‘4.2‘1.2‘1.6
●.
‘2. 1
“0.6
9.616.011.72.63.02.1
2.02.0
2.54.12.5
0.9
0.60.9
●1.4‘1.3
2.55.5
‘1.9‘1.5
‘0.9‘1.2●2.6“2.0
42
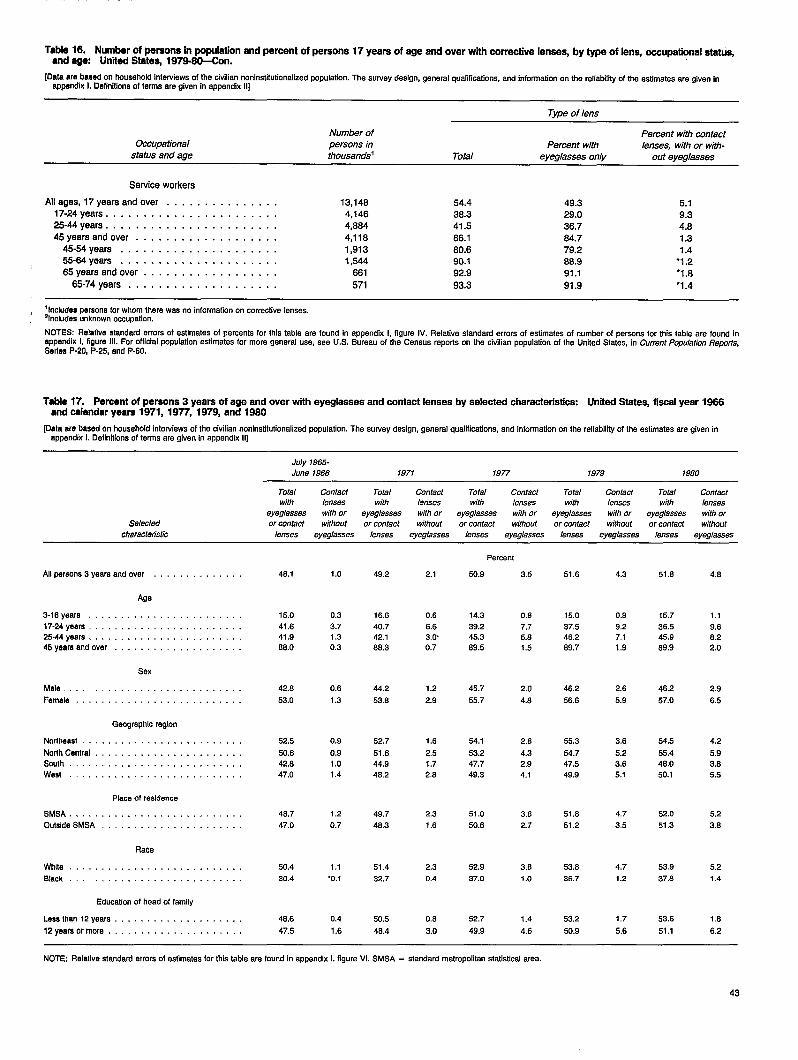
Table 16. Number of persons in populationand percent of persona 17 yeara of age and over with corrective lenae~ by type of len~ ocoupationelstatqand agw United State$ 197S@PCcm.
[Data am based on household Interviews of the civilian neninstltutionalized population. The survey design, general quafhications, and information on the refiabilii of the estimates are given inappndix 1. Definitions of terms are given in appendix 11]
Type of lens
Number of Percent with contact
Gmfpational persons in Percent with lenses, with or with-status and age thousands’ Total eyeglasses only out eyeglasses
Service workers
Allagea, 17yearsand over . . . . . . . . . . . . . . .17-24 years . . . . . . . . . . . . . . . . . . . . . . .25-44 yeara . . . . . . . . . . . . . . . . . . . . . . .
45years And over . . . . . . . . . . . . . . . . . . .
45-54 yeara . . . . . . . . . . . . . . . . . . . . .55-64 yeara . . . . . . . . . . . . . . . . . . . . .65 years and over . . . . . . . . . . . . . . . . . .
65-74 years . . . . . . . . . . . . . . . . . . . .
13,1484,1464,884
4,1181,9131,544
661
571
54.438.347.5
66.180.690.192.9
93.3
49.329.0
36.784.779.288.991.1
91.9
5.19.34.61.31.4
●1.2‘1.8
*1.4
‘Includes persons for whom there was no information on corrective lenses,21ncludes unknown essupatlon.
NOTE8: Relative standard errors of eafimatea of pementa for this table are found in appendix 1, figure IV. Relative standard errors of estimates of numb%r of parsona for this table are found in
appandlx 1 fioure Ill. For official P@ation a*mates for more 9eneral use, see U.S. Bureau of the Census reports on the civifian population of the Unitad Statea, in Current Population Reports,Series P-20, P-25, and P.60.
Table 17. Par’centof pereons 3 yeare of age end over with eyeglasses and contact lenses by selected charecteristk United States, fiecel year 1S66and salendar years 1971, 1977, 1979, and 1980
[Data ara basad on housahold Intervlaws of the civilian noninsfitutionalized population. The survay design, ganeral quaMicationa, and information on the reliability of the estimates are given in
appandix t. Definitionsof terms are given in appendix II]
July 1965-
June 1966 1971 1977 1979 1ss0
Total Contact Total Contact Total Contsct Total Contact Total Contact
with lenses with lenses with lenses with lenses with Iensea
eyeglasses with or eyeg/aaees with or eyeglasses with or eyeglasses with or
Selected
eyeglasses with or
or contact without or contact without or contact without or contact without or wntact without
characteristic lenses eyeglasses lenses eyeglasses lenses eyeglasses lenses eyeglasses lenses eysg/aaees
Parcent
Allparsons 3yearaandover . . . . . . . . . . . . . . 48.1 1.0 49.2 2.1 50.9 3.5 51.6 4.3 51 .s 4.e
Age
3-16years . . . . . . . . . . . . . . . . . . . . . . . .
17-24 years . . . . . . . . . . . . . . . . . . . . . . . .
25-44 years . . . . . . . . . . . . . . . . . . . . . . . .
45yaara andovar . . . . . . . . . . . . . . . . . . . .
15,0 0.3
41.6 3.7
41.9 1.3
88.0 0,3
0.6
6.6
3)3
0.7
14.3
39.2
45.3
69.5
16.6
40,7
42.1
66.3
0.9
9.2
7.1
1,9
16.7 1.1
36.5 9.6
45.9 e.2
69.9 2.0
0.s 15.0
7.7 37.5
6.e 46.2
1.5 69.7
Sex
Male . . . . . . . . . . . . . . . . . . . . . . . . . . . .
Female . . . . . . . . . . . . . . . . . . . . . . . . . .
42.6 0.6
53.0 1.3
44.2
53.e
1.2
2.9
45.7 2.0 46.2
4.6 56.6
2.6
5.9
46.2 2.9
57.0 6.555.7
Qaographlcraglon
Notiheast . . . . . . . . . . . . . . . . . . . . . . . . .
NorfhCantral . . . . . . . . . . . . . . . . . . . . . . .
South . . . . . . . . . . . . . . . . . . . . . . . . . . .
West . . . . . . . . . . . . . . . . . . . . . . . . . . .
52.5 0.9
50.6 0.9
42.6 1.0
47.0 1.4
52.7
51.6
44.9
4S.2
1.e2.5
1.7
2.6
54.1
53.2
47.7
49.3
2.6 55.3 3.6
4.3 54.7 5.2
2.9 47.5 3.6
4.1 49.9 5.1
54.5 4.2
55.4 5.9
46.0 3.s
50.1 5.5
Place of rasldence
SMSA . . . . . . . . . . . . . . . . . . . . . . . . . .
0utslde8MSA . . . . . . . . . . . . . . . . . . . . . .
46.7 1.2
47.0 0.7
49,7
48.3
2.3
1.6
51.0
50.6
3.e 51.s 4.7
2.7 51.2 3.5
52.0 5.2
51.3 3,6
Race
Whlta . . . . . . . . . . . . . . . . . . . . . . . . . . .
Slack . . . . . . . . . . . . . . . . . . . . . . . . . . .
50.4 1.1
30.4 “0.1
51.4
32.7
2.3
0.4
52.9
37.0
3.s 53.6 4.7
1.0 3a.7 1.2
53.9 5.2
37.e 1.4
Education of head of family
Lessthan12yeara .,....... . . . . . . . . . . .
12yearsormore . . . . . . . . . . . . . . . . . . . . .
48.6 0.4
47,5 1.6
50.5
48.4
0.6
3.0
52.7
49.9
1.4 53.2 1.7
4.6 50.9 5.6
53.6 I .e
51.1 6.2
NOTE: Relatlvastandad ermmofealimates fortNatable are found inappendx l, figure Vl. SMSA = standard metropolitan statistical area
43
Appendixes
Contents
I. Technical notes on methods . . . . . . . . . . . . . . . . . . . . . . . . . . . . . . . . . . . . . . . ...45Background ofthis report . . . . . . . . . . . . . . . . . . . . . . . . . . . . . . . . . . . . . . . ...45Statistical design of the National Health Interview Survey . . . . . . . . . . . . . . . . . . . . . . . . . . 45
General qualifications . . . . . . . . . . . . . . . . . . . . . . . . . . . . . . . . . . . . . . . . . ...47Reliability of estimates . . . . . . . . . . . . . . . . . . . . . . . . . . . . . . . . . . . . . . . . ...47
II. The accuracy of reporting types of eye-care providers . . . . . . . . . . . . . . . . . . . . . . . . . . . . . 55Introduction . . . . . . . . . . . . . . . . . . . . . . . . . . . . . . . . . . . . . . . . . . . . . . ...55Fiscal year 1964 study . . . . . . . . . . . . . . . . . . . . . . . . . . . . . . . . . . . . . . . . ...551979 survey procedures . . . . . . . . . . . . . . . . . . . . . . . . . . . . . . . . . . . . . . . . ...55
111. Definitions ofcertain terms used in this report . . . . . . . . . . . . . . . . . . . . . . . . . . . . . . . . . 57Terrnsrelating toeye-care visits... . . . . . . . . . . . . . . . . . . . . . . . . . . . . . . . . . ...57
Demographic terms . . . . . . . . . . . . . . . . . . . . . . . . . . . . . . . . . . . . . . . . . . ...57
IV. Questionnaire items relating toeye-care visits anduseof eyeglasses and contact lenses . . . . . . . . . . . . . 59
V. Tables used forselection ofone-third subsample for 1979 questions oneye-care visits . . . . . . . . . . . . . 60
List of appendix figures
I. Relative standard errors for number of eye-care visits based on a 2-week reference period for a one-thirdsubsample . . . . . . . . . . . . . . . . . . . . . . . . . . . . . . . . . . . . . . . . . . . . . . . ...49
II. Relative standard errors for population characteristics for a one-third subsample . . . . . . . . . . . . . . . . . 50III. Relative standard errors for population characteristics based on 2 years of data . . . . . . . . . . . . . . . . . 51
IV. Relative standard errors of average annual percentages of population characteristics based on 2 years of data . . 52
V. Relative standard errors of percentages of population characteristics for a one-third subsample . . . . . . . . . . 53VI. Relative standard errors of percentages of population characteristics based on 1 year of data . . . . . . . . . . . 54
List of appendix tables
1. Number and percent distribution of the comparisons of respondent reported and interviewer verified eye-care visits,
according totypeof eye-care specialist . . . . . . . . . . . . . . . . . . . . . . . . . . . . . . . . . . . . 56
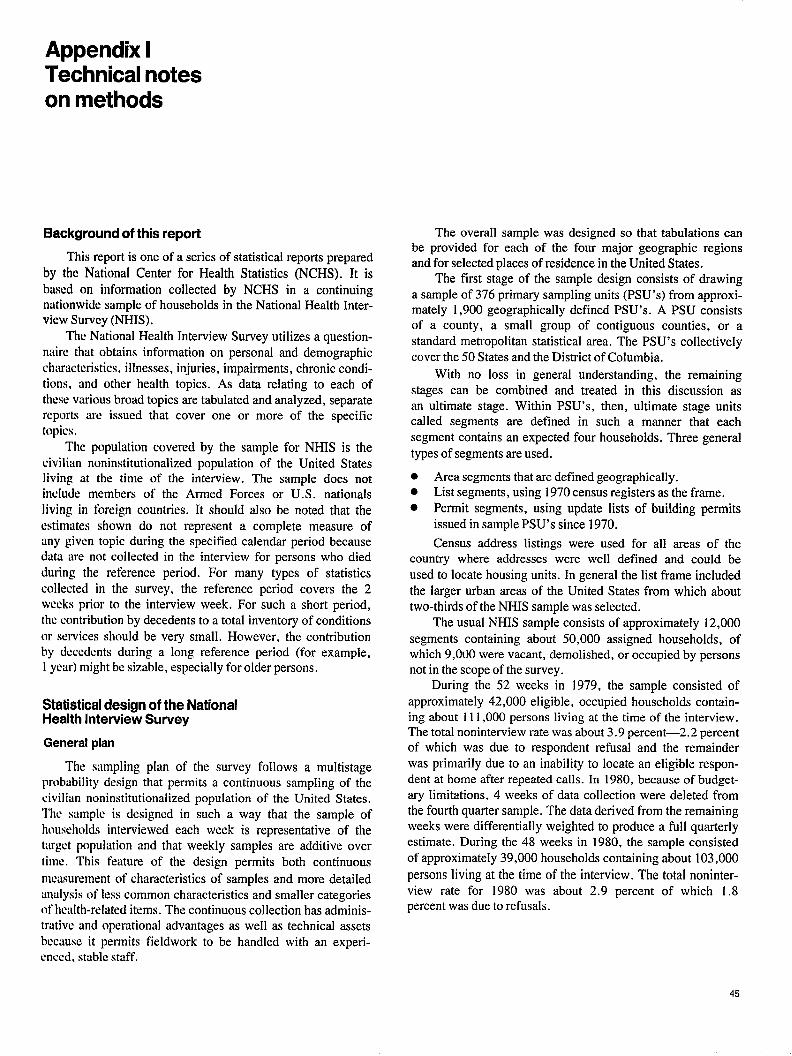
Appendix ITechnical noteson methods
Background of this report
This report is one of a series of statistical reports prepared
by the National Center for Health Statistics (NCHS). It isbased on information collected by NCHS in a continuingnationwide sample of households in the National Health Inter-view Survey (NHIS).
The National Health Interview Survey utilizes a question-naire that obtains information on personal and demographicchttracteristics, illnesses, injuries, impairments, chronic condi-tions, and other health topics. As data relating to each ofthese various broad topics are tabulated and analyzed, separatereports are issued that cover one or more of the specifictopics.
The population covered by the sample for NHIS is thecivilian noninstitutionalized population of the United Statesliving at the time of the interview. The sample does notinclude members of the Armed Forces or U.S. nationalsliving in foreign countries. It should also be noted that the
estimates shown do not represent a complete measure ofany given topic during the specified calendar period becausedata are not collected in the interview for persons who diedduring the reference period. For many types of statistics
collected in the survey, the reference period covers the 2weeks prior to the interview week. For such a short period,the contribution by decedents to a total inventory of conditions
or services should be very small. However, the contributionby decedents during a long reference period (for example,1 year) might be sizable, especially for older persons.
Statistical design of the NationalHealth Interview Survey
General plan
The sampling plan of the survey follows a multistageprobability design that permits a continuous sampling of thecivilitin noninstitutionalized population of the United States.The stimple is designed in such a way that the sample of
households interviewed each week is representative of thetiirg~t population and that weekly samples are additive overtimc. This feature of the design permits both continuous
mcusurement of characteristics of samples and more detailedmdysis of less common characteristics and smaller categories
Of health-related items. The continuous collection has adminis-trative und operational advantages as well as technical assets
bccausc it permits fieldwork to be handled with an experi-enced, stiible staff.
The overall sample was designed so that tabulations canbe provided for each of the four major geographic regionsand for selected places of residence in the United States.
The first stage of the sample design consists of drawinga sample of 376 primary sampling units (PSU’S) from approxi-mately 1,900 geographically defined PSU’S. A PSU consistsof a county, a small group of contiguous counties, or astandard metropolitan statistical area. The PSU’S collectivelycover the 50 States and the District of Columbia.
With no loss in general understanding, the remainingstages can be combined and treated in this discussion asan ultimate stage. Within PSU’S, then, ultimate stage unitscalled segments are defined in such a manner that eachsegment contains an expected four households. Three general
types of segments are used.
● Area segments that are defined geographically.. List segments, using 1970 census registers as the frame.
● Permit segments, using update lists of building permitsissued in sample PSU’S since 1970.
Census address listings were used for all areas of thecountry where addresses were well defined and could be
used to locate housing units. In general the list frame includedthe larger urban areas of the United States from which abouttwo-thirds of the NHIS sample was selected.
The usual NHIS sample consists of approximately 12,000
segments containing about 50,000 assigned households, ofwhich 9,000 were vacant, demolished, or occupied by personsnot in the scope of the survey.
During the 52 weeks in 1979, the sample consisted of
approximately 42,000 eligible, occupied households contain-ing about 111,000 persons living at the time of the interview.The total noninterview rate was about 3.9 percent—2.2 percentof which was due to respondent refusal and the remainderwas primarily due to an inability to locate an eligible respon-dent at home after repeated calls. In 1980, because of budget-ary limitations, 4 weeks of data collection were deleted fromthe fourth quarter sample. The data derived from the remainingweeks were differentially weighted to produce a full quarterlyestimate. During the 48 weeks in 1980, the sample consisted
of approximately 39,000 households containing about 103,000
persons living at the time of the interview. The total noninter-view rate for 1980 was about 2.9 percent of which 1.8percent was due to refusals.
45
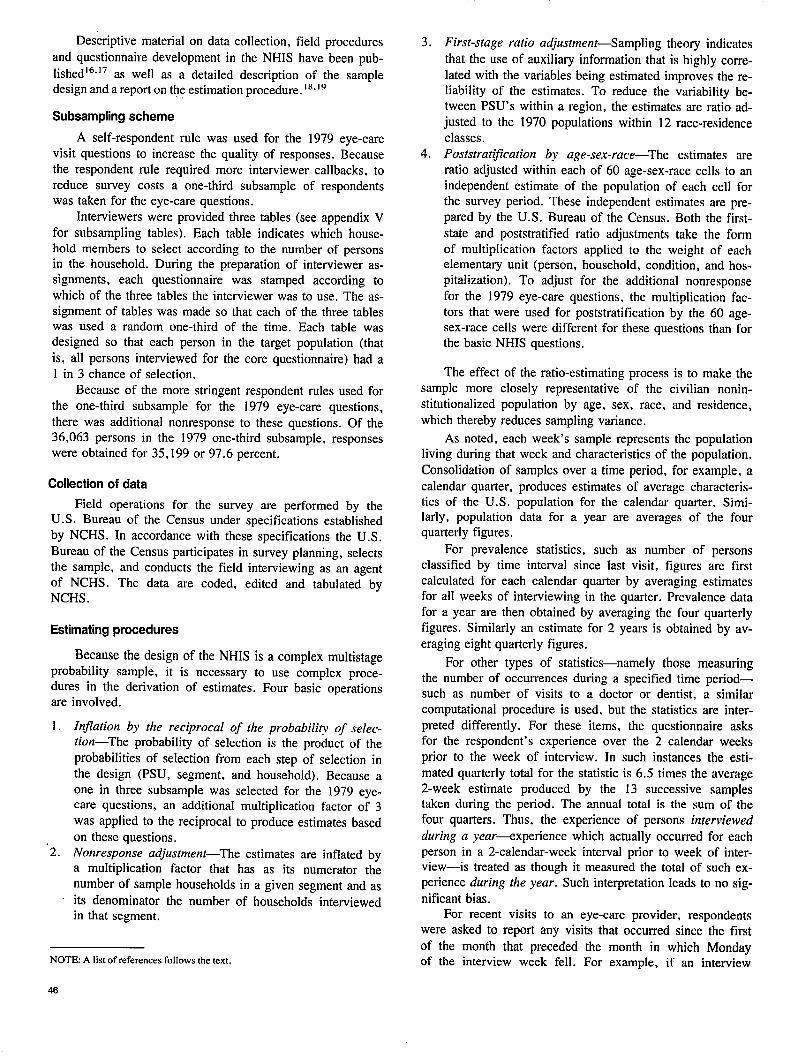
Descriptive material on data collection, field procedures
and questionnaire development in the NHIS have been pub-
lished16”]7 as well as a detailed description of the sampledesign and a report on the estimation procedure. 18”19
Subsampling scheme
A self-respondent rule was used for the 1979 eye-carevisit questions to increase the quality of responses. Becausethe respondent rule required more interviewer callbacks, toreduce survey costs a one-third subsample of respondentswas taken for the eye-care questions.
Interviewers were provided three tables (see appendix V
for subsampling tables). Each table indicates which house-hold members to select according to the number of personsin the household. During the preparation of interviewer as-signments, each questionnaire was stamped according towhich of the three tables the interviewer was to use. The as-signment of tables was made so that each of the three tableswas used a random one-third of the time. Each table wasdesigned so that each person in the target population (that
is, all persons interviewed for the core questionnaire) had a1 in 3 chance of selection.
Because of the more stringent respondent rules used forthe one-third subsample for the 1979 eye-care questions,
there was additional nonresponse to these questions. Of the36,063 persons in the 1979 one-third subsample, responseswere obtained for 35,199 or 97.6 percent.
Collection of data
Field operations for the survey are performed by theU.S. Bureau of the Census under specifications establishedby NCHS. In accordance with these specifications the U.S.Bureau of the Census participates in survey planning, selectsthe sample, and conducts the field interviewing as an agentof NCHS. The data are coded, edited and tabulated byNCHS.
Estimating procedures
Because the design of the NHLS is a complex multistageprobability sample, it is necessa~ to use complex proce-dures in the derivation of estimates. Four basic operationsare involved.
1.
“2.
Injlation by the reciprocal of the probability of selec-tion—The probability of selection is the product of the
probabilities of selection from each step of selection inthe design (PSU, segment, and household). Because aone in three subsample was selected for the 1979 eye-care questions, an additional multiplication factor of 3
was applied to the reciprocal to produce estimates based
on these questions.Nonresponse adjustment—The estimates are inflated bya multiplication factor that has as its numerator thenumber of sample households in a given segment and as
its denominator the number of households interviewedin that segment.
NOTE A list of references follows the text.
46
3,
4.
First-stage ratio adjustment—Sampling theory indicates
that the use of auxiliary information that is highly corre-lated with the variables being estimated improves the re-liability of the estimates. To reduce the variability be-tween PSU’S within a region, the estimates are ratio ad-
justed to the 1970 populations within 12 race-residenceclasses.Poststratlfication by age-sex-race-The estimates areratio adjusted within each of 60 age-sex-race cells to anindependent estimate of the population of each cell forthe survey period. These independent estimates are pre-pared by the U.S. Bureau of the Census. Both the first-
state and poststratified ratio adjustments take the formof multiplication factors applied to the weight of eachelementary unit (person, household, condition, and hos-pitalization). To adjust for the additional nonresponsefor the 1979 eye-care questions, the multiplication fac-tors that were used for poststratification by the 60 age-sex-race cells were different for these questions than forthe basic NHIS questions.
The effect of the ratio-estimating process is to make thesample more closely representative of the civilian nonin-stitutionalized population by age, sex, race, and residence,
which thereby reduces sampling variance.
As noted, each week’s sample represents the populationliving during that week and characteristics of the population.
Consolidation of samples over a time period, for example, acalendar quarter, produces estimates of average characteris-tics of the U.S. population for the calendar quarter. Simi-larly, population data for a year are averages of the fourquarterly figures.
For prevalence statistics, such as number of personsclassified by time interval since last visit, figures are firstcalculated for each calendar quarter by averaging estimatesfor all weeks of interviewing in the quarter. Prevalence datafor a year are then obtained by averaging the four quarterlyfigures. Similarly an estimate for 2 years is obtained by av-
eraging eight quarterly figures.
For other types of statistics—namely those measuringthe number of occurrences during a specified time period—such as number of visits to a doctor or dentist, a similarcomputational procedure is used, but the statistics are inter-
preted differently. For these items, the questionnaire asksfor the respondent’s experience over the 2 calendar weeks
prior to the week of interview. In such instances the esti-mated quarterly total for the statistic is 6.5 times the average2-week estimate produced by the 13 successive samplestaken during the period. The annual total is the sum of thefour quarters. Thus, the experience of persons interviewedduring a year-experience which actually occurred for eachperson in a 2-calendar-week interval prior to week of inter-view—is treated as though it measured the total of such ex-perience during the year. Such interpretation leads to no sig-
nificant bias.For recent visits to an eye-care provider, respondents
were asked to report any visits that occurred since the first
of the month that preceded the month in which Mondayof the interview week fell. For example, if an interview
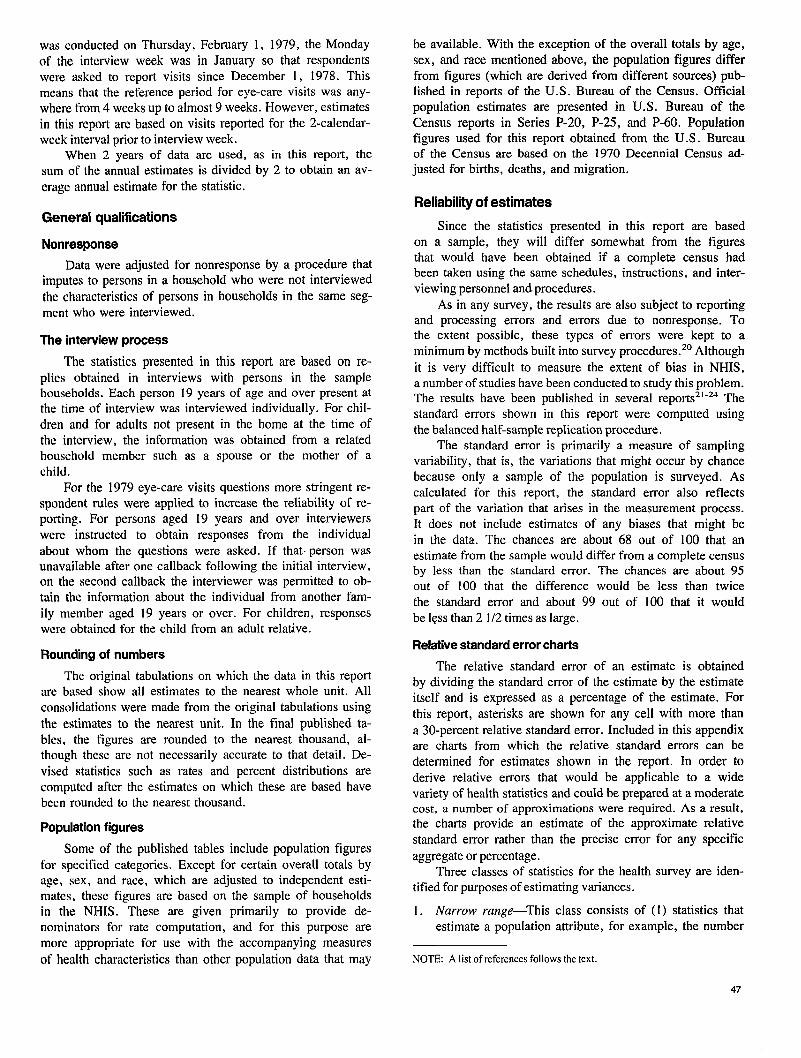
was conducted on Thursday, February 1, 1979, the Mondayof the interview week was in January so that respondentswere asked to report visits since December 1, 1978. Thismeans that the reference period for eye-care visits was any-where from 4 weeks up to almost 9 weeks. However, estimatesin this report are based on visits reported for the 2-calendar-week interval prior to interview week.
When 2 years of data are used, as in this report, thesum of the annual estimates is divided by 2 to obtain an av-
erage annual estimate for the statistic.
General qualifications
Nonresponse
Data were adjusted for nonresponse by a procedure thatimputes to persons in a household who were not interviewed
the characteristics of persons in households in the same seg-ment who were interviewed.
The interview process
The statistics presented in this report are based on re-plies obtained in interviews with persons in the samplehouseholds. Each person 19 years of age and over present atthe time of interview was interviewed individually. For chil-dren and for adults not present in the home at the time ofthe interview, the information was obtained from a relatedhousehold member such as a spouse or the mother of achild.
For the 1979 eye-care visits questions more stringent re-spondent rules were applied to increase the reliability of re-porting. For persons aged 19 years and over interviewerswere instructed to obtain responses from the individual
about whom the questions were asked. If that. person wasunavailable after one callback following the initial interview,on the second callback the interviewer was permitted to ob-tain the information about the individual from another fam-ily member aged 19 years or over. For children, responseswere obtained for the child from an adult relative.
Rounding of numbers
The original tabulations on which the data in this reportare based show all estimates to the nearest whole unit. Allconsolidations were made from the original tabulations using
the estimates to the nearest unit. In the final published ta-bles, the figures are rounded to the nearest thousand, al-though these are not necessarily accurate to that detail. De-
vised statistics such as rates and percent distributions arecomputed after the estimates on which these are based havebeen rounded to the nearest thousand.
Population figures
Some of the published tables include population figuresfor specified categories. Except for certain overall totals byage, sex, and race, which are adjusted to independent esti-mates, these figures are based on the sample of householdsin the NHIS. These are given primarily to provide de-nominators for rate computation, and for this purpose aremore appropriate for use with the accompanying measuresof health characteristics than other population data that may
be available. With the exception of the overall totals by age,sex, and race mentioned above, the population figures differfrom figures (which are derived from different sources) pub-lished in reports of the U.S. Bureau of the Census. Officialpopulation estimates are presented in U.S. Bureau of theCensus reports in Series P-20, P-25, and P-60. Populationfigures used for this report obtained from the U.S. Bureauof the Census are based on the 1970 Decennial Census ad-justed for births, deaths, and migration.
Reliability of estimates
Since the statistics presented in this report are basedon a sample, they will differ somewhat from the figuresthat would have been obtained if a complete census hadbeen taken using the same schedules, instructions, and inter-viewing personnel and. procedures.
As in any survey, the results are also subject to reportingand processing errors and errors due to nonresponse. Tothe extent possible, these types of errors were kept to aminimum by methods built into survey procedures. 20Although
it is very difficult to measure the extent of bias in NHIS,a number of studies have been conducted to study this problem.The results have been published in several reports21-24 Thestandard errors shown in this report were computed usingthe balanced half-sample replication procedure.
The standard error is primarily a measure of samplingvariability, that is, the variations that might occur by chancebecause only a sample of the population is surveyed. Ascalculated for this report, the standard error also reflectspart of the variation that arises in the measurement process.It does not include estimates of any biases that might bein the data. The chances are about 68 out of 100 that anestimate from the sample would differ from a complete censusby less than the standard error. The chances are about 95out of 100 that the difference would be less than twicethe standard error and about 99 out of 100 that it wouldbe less than 2 1/2 times as large.
Relative standard error charts
The relative standard error of an estimate is obtainedby dividing the standard error of the estimate by the estimateitself and is expressed as a percentage of the estimate. Forthis report, asterisks are shown for any cell with more than
a 30-percent relative standard error. Included in this appendixare charts from which the relative standard errors can bedetermined for estimates shown in the report. In order toderive relative errors that would be applicable to a widevariety of health statistics and could be prepared at a moderatecost, a number of approximations were required. As a result,the charts provide an estimate of the approximate relativestandard error rather than the precise error for any specific
aggregate or percentage.Three classes of statistics for the health survey are iden-
tified for purposes of estimating variances.
1. Narrow rarzge-This class consists of (I) statistics thatestimate a population attribute, for example, the number
NOTE A list of references follows the text.
47
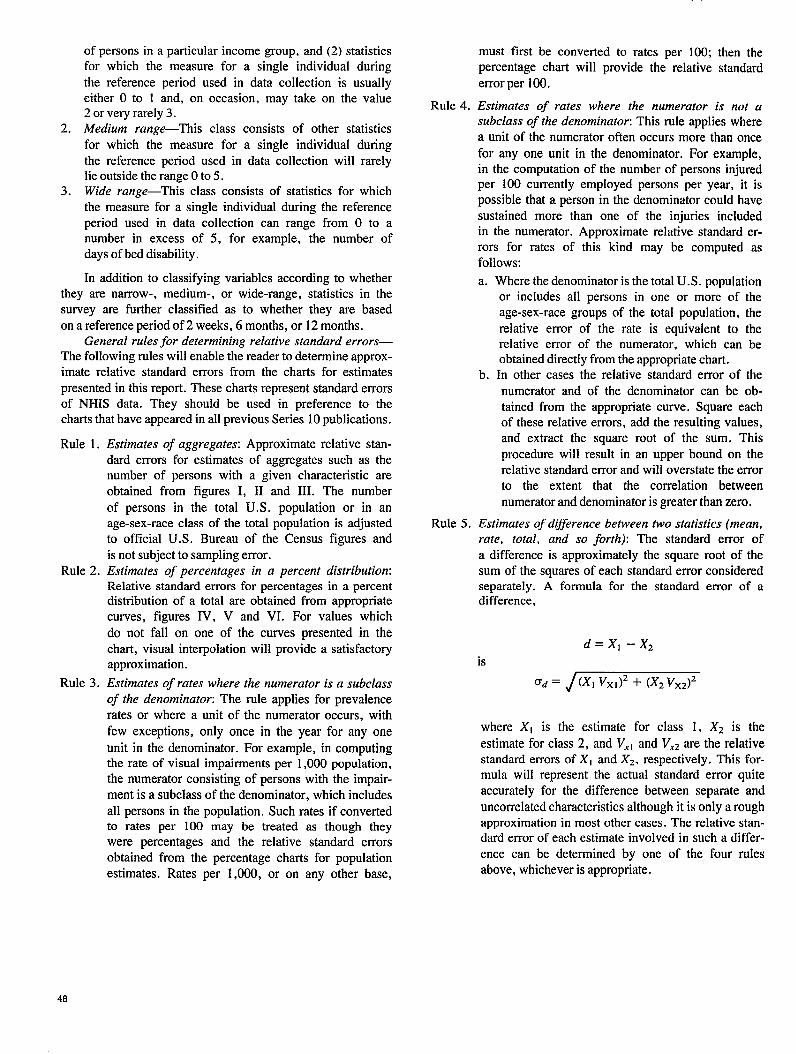
2.
3.
of persons in a particular income group, and (2) statisticsfor which the measure for a single individual duringthe reference period used in data collection is usuallyeither O to 1 and, on occasion, may take on the value2 or very rarely 3.Medium range—This class consists of other statisticsfor which the measure for a single individual duringthe reference period used in data collection will rarelylie outside the range Oto 5.Wide range—This class consists of statistics for whichthe measure for a single individual during the referenceperiod used in data collection can range from O to anumber in excess of 5, for example, the number ofdays of bed disability.
In addition to classifying variables according to whetherthey are narrow-, medium-, or wide-range, statistics in thesurvey are further classified as to whether they are basedon a reference period of 2 weeks, 6 months, or 12 months.
General rules for determining relative standard errors—The following rules will enable the reader to determine approx-imate relative standard errors from the charts for estimatespresented in this report. These charts represent standard errorsof NHIS data. They should be used in preference to thecharts that have appeared in all previous Series 10publications.
Rule 1.
Rule 2.
Rule 3.
Estimates of aggregates: Approximate relative stan-dard errors for estimates of aggregates such as thenumber of persons with a given characteristic areobtained from figures I, H and HI. The numberof persons in the total U.S. population or in anage-sex-race class of the total population is adjustedto official U.S. Bureau of the Census figures andis not subject to sampling error.Estimates of percentages in a percent distribution:Relative standard errors for percentages in a percentdistribution of a total are obtained from appropriatecurves, figures IV, V and VI. For values whichdo not fall on one of the curves presented in thechart, visual interpolation will provide a satisfactoryapproximation.
Estimates of rates where the numerator is a subclass
of the denominator: The rule applies for prevalencerates or where a unit of the numerator occurs, withfew exceptions, only once in the year for any oneunit in the denominator. For example, in computingthe rate of visual impairments per 1,000 population,the numerator consisting of persons with the impair-ment is a subclass of the denominator, which includesall persons in the population. Such rates if convertedto rates per 100 may be treated as though theywere percentages and the relative standard errorsobtained from the percentage charts for populationestimates. Rates per 1,000, or on any other base,
Rule 4.
Rule 5.
must first be converted to rates per 100; then thepercentage chart will provide the relative standarderror per 100.
Estimates of rates where the numerator is not asubclass of the denominator: This rule applies wherea unit of the numerator often occurs more than oncefor any one unit in the denominator. For example,in the computation of the number of persons injuredper 100 currently employed persons per year, it ispossible that a person in the denominator could havesustained more than one of the injuries includedin the numerator. Approximate relative standard er-rors for rates of this kind may be computed asfollows:
a. Where the denominator is the total U.S. populationor includes all persons in one or more of theage-sex-race groups of the total population, therelative error of the rate is equivalent to therelative error of the numerator, which can beobtained directly from the appropriate chart.
b. In other cases the relative standard error of thenumerator and of the denominator can be ob-tained from the appropriate curve. Square eachof these relative errors, add the resulting values,and extract the square root of the sum. Thisprocedure will result in an upper bound on therelative standard error and will overstate the errorto the extent that the correlation betweennumerator and denominator is greater than zero.
Estimates of dl~erence between two statistics (mean,rate, total, and so forth): The standard error ofa difference is approximately the square root of thesum of the squares of each standard error consideredseparately. A formula for the standard error of adifference,
d= X1– X2
is
(x,v~,)’+ (XZv~2)’
where Xi is the estimate for class 1, X2 is theestimate for class 2, and V.,I and V,2 are the relativestandard errors of Xl and Xz, respectively. This for-mula will represent the actual standard error quiteaccurately for the difference between separate anduncorrelated characteristics although it is only a roughapproximation in most other cases. The relative stan-dard error of each estimate involved in such a differ-ence can be determined by one of the four rulesabove, whichever is appropriate.
48
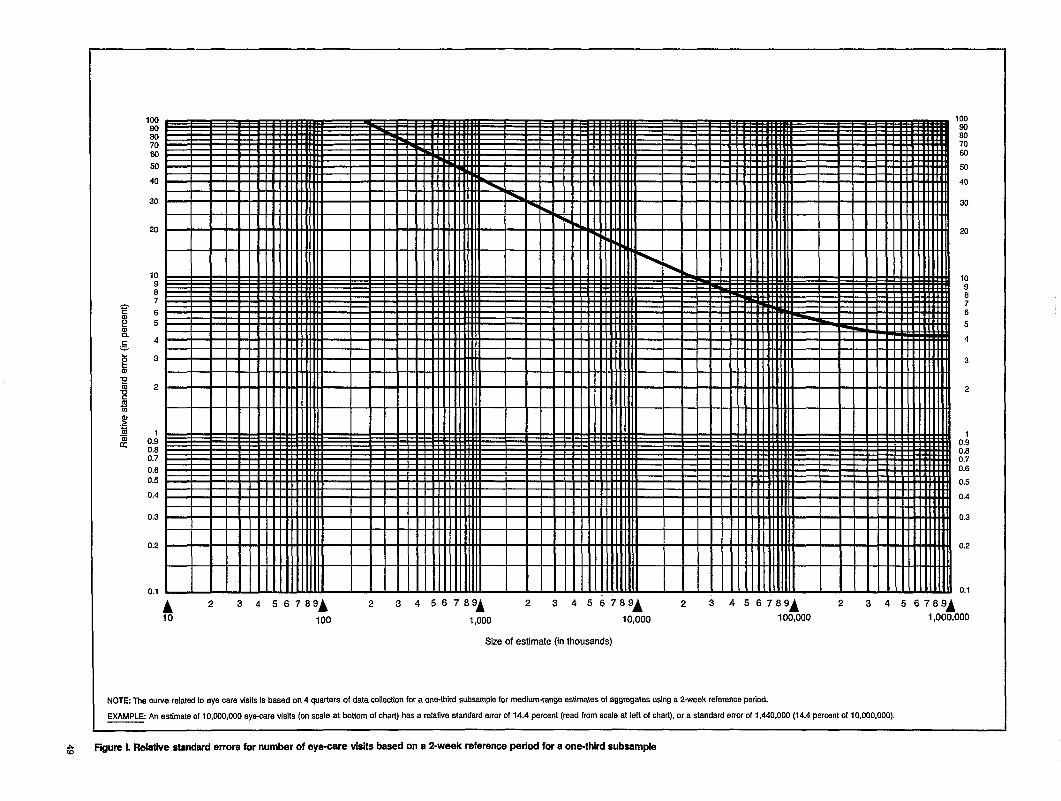
20
10090
10JJ
So
W
70so
60
7060
cm 50
40 40
30 30
20
10 10
:9
78
67
5
6
5
4
3
2
0.:0.8
O.i
0.70.8
0.6
0.70.6
0.5 0.5
0.4
0.3
4
3
2
0.2 1!. A J . L . ~ . { L. .L J. . , 0.2
0.1 — 0.1
A’ 3 456769A 2 3 456789A 2 3 456789A 2 3 456789A 2 3 4 56789A
10 100 1,000 10,000 400,000 1,000,000
3ize of estimate (in thousands)
NOTE Thecurve relatedto eye care visitsis baaedon 4 quartera of data Collection for a one-third subsample for medium-range estimates of aggregates using a 2-week reference period.
EXAMPLE An estimate of 10,000,000 eye-care visits (on Wde at LWtom of chart) has a relative standard error of 14.4 percent (read from scale at left of chart), or a standard error of 1,440,000 (14.4 percent of 10,000,000)
Aw Fgure L Refative standard errors for number of eye-oare visiis based on a 2-week reference period for a one-third subsample
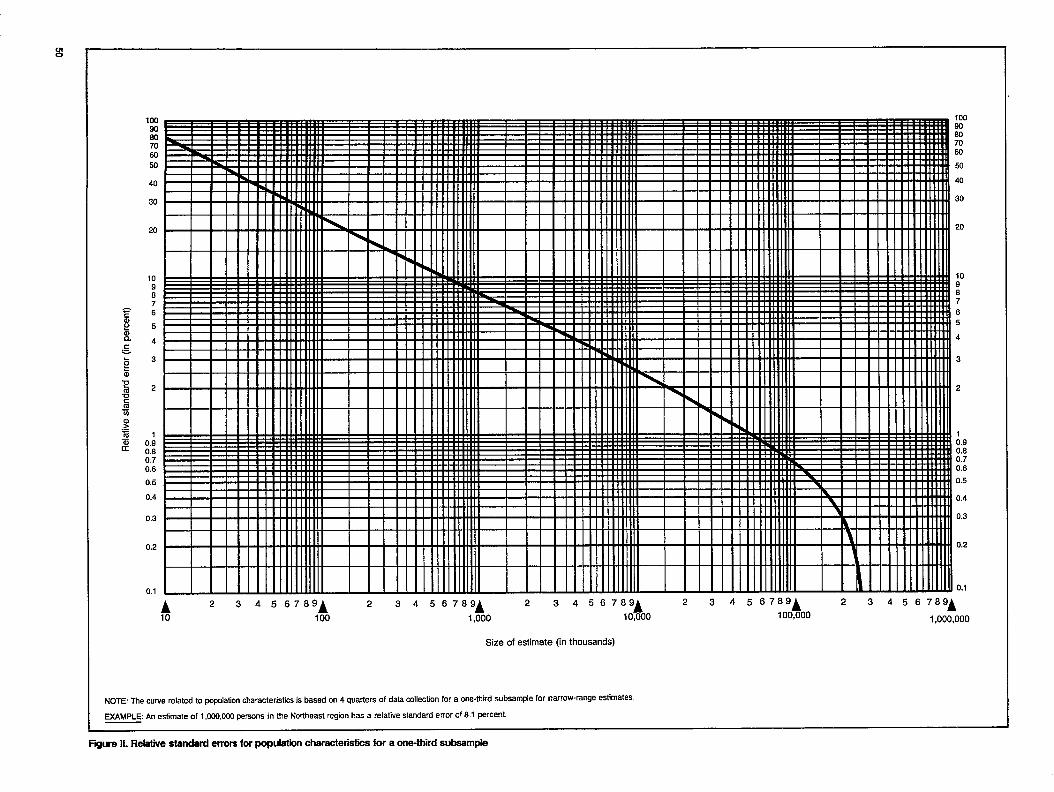
m0
50
40
30
20
109876
5
4
3
2
O.i0.80.7
Km 100
90 90
So 80
70 70
so 60
50
40
30
. .
.c
, I , , m LuI Illltm-mttn II Illlm Illllllmtltttl I I Hlllmllnl
0.6
0.5
0.4
0.3
0.2
0.1
10987
6
5
4
3
2
10.90.80.70.6
0,5
0.4
0.3
0.2
0.1
2 3 4 56789A 2 3 4 56789 A’ 3 456789A 2 3 4 56789A 2 3 456789A
100 1,000 10,000 100,000 1,000,000
Size of estimate (in thousands)
NOTE: The curve relatedto ppulatim characteristics is based on 4 quarters of data collection for a one-thid subsample for narrow-range estimates
EXAMPLE An estimate of 1,CWI,OW parsons in the Northeast region has a relative standard error of 8.1 perCent.
Figure Il. Relative standard errora for ~uhtion characteristics for a one-third aubaample
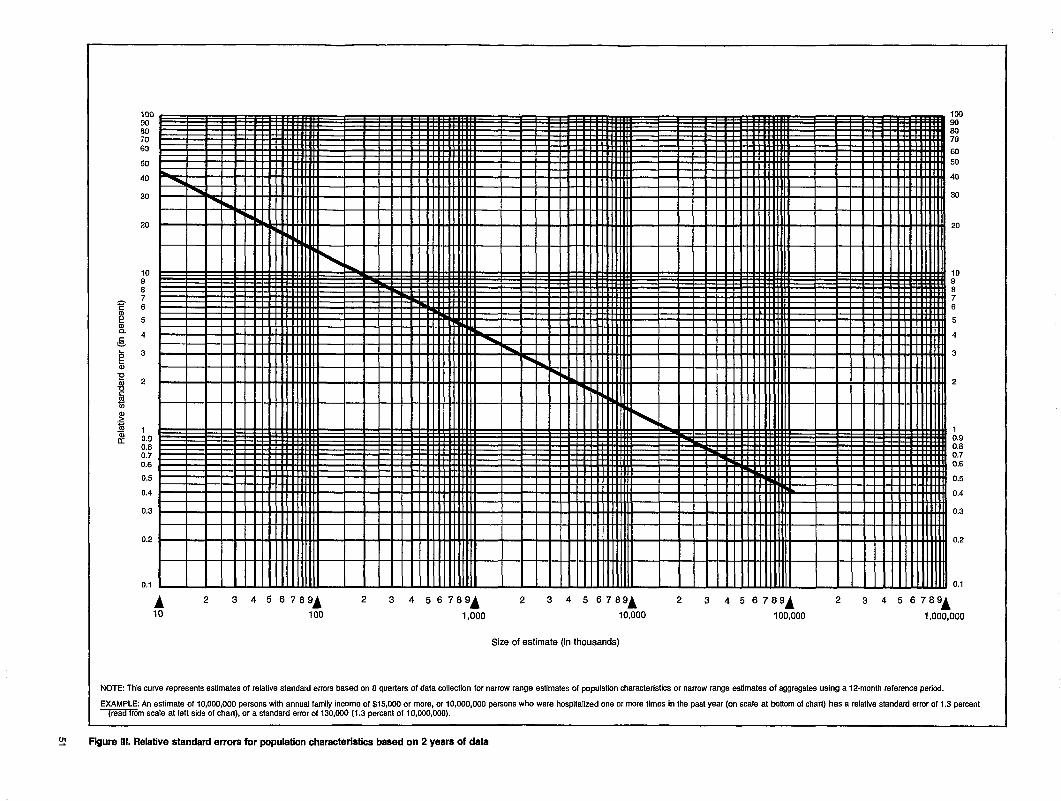
70so
50
40
30
20
109876
5
4
3
2
10.90.80.70.6
0.5
0.4
0.3
0.2
0.1
10090
100
8090So70
60
50
40
30
20
109876
5
4
3
2
10.90.80.70.6
0.5
0.4
0.3
0.2
0.1
A’ 3 456789A 2 3 456789A 2 3 4 56789A 2 3 456789A 2 3 456769 A10 100 1,000 10,000 100,000 1,000,000
Size of estimate (in thousands)
NOTE This curve represents estimates of relative standard errors basad on L7quarters of data collection for narrow range estimates of population characteristics or narrow range esfimataa of aggregates using a 12-month reference period.
EXAMPLE An estimate of 10,000,000 persons with annual family incomeof$15,000 or more, or 10,OOO,OOOpersons who were hospilaffzed one or more times in the past year (on scale at fmftom of chart) has a relative standard error of 1.3 percent
~Om scale at let side Of chart), Or a standard errOr Of 130030 (1.3 Percent Of lo@o,ooo).
m Fgure Ill. Relative standard errors for populationcharacteriafica based on 2 yeara of data
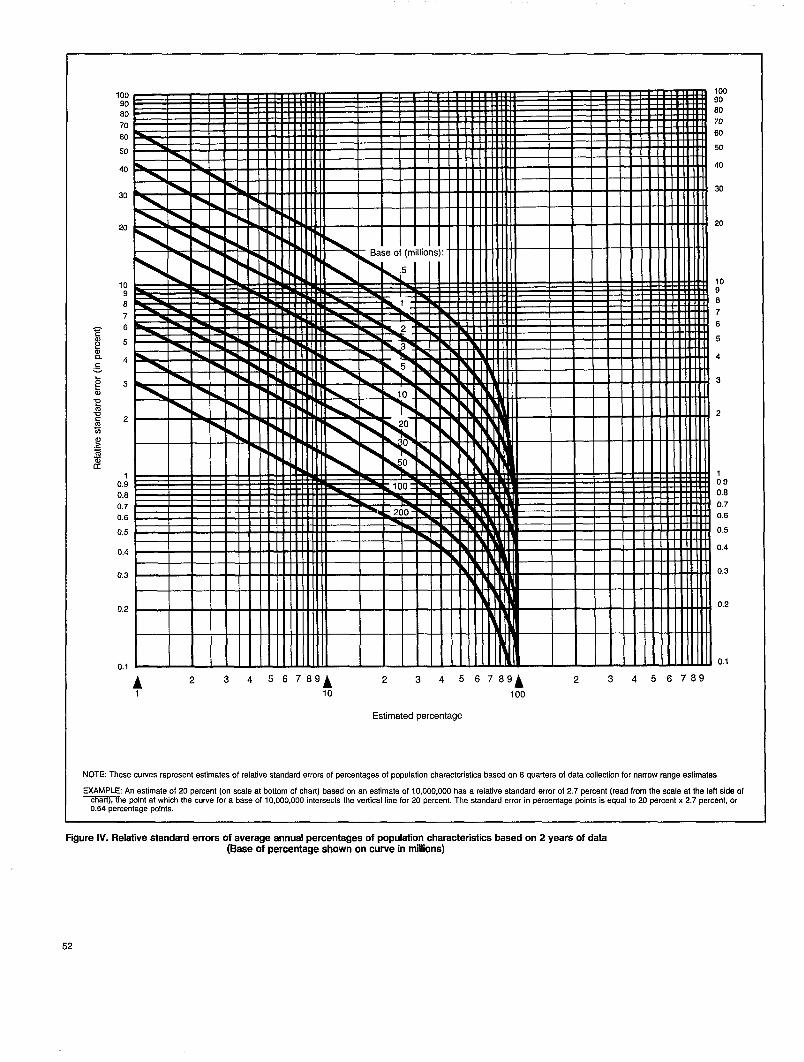
10090
80
70
80
50I -1 I I I
40 \ I
Im I m I
30
20
109
8
7
6
5
4
3
2
O.i0.8
0.7
0.6
0.5
0.4
0.3
0.2
0.1
1 I
i 1 , , , I m , ,, ,
II II ! ,
I I I I I I I 111111111111 I
10090
80
70
60
50
40
30
20
109
8
7
6
5
4
3
2
10.9
0.8
0.7
0.6
0.5
0.4
0.3
0,2
0.1
A 2 3 4 56789A
10
2 3 4 56789A
100
2 3 456789
Estimated percentage
NOTE: These curves represent estimates of relative standard errors of percentage of population characteristics based on 8 quarters of data collection for narrow range eaffmatea.
EXAMPLE: An estimate of 20 percent (on scale at bonom of chart) baaed on an estimate of 10,000,000 has a relative standard error of 2.7 percent (read from the scale at the left side of
~e mint at which the cuwe for a base of 10,000.00o intersects the ve~cal fine for 20 Parcent. The standard arror in Percanta9e win~ is equal to 20 Percent x 2.7 Percent, or0.54 percentage points,
Figure IV. Relative standard errora of average annual percentages of population characteristics based on 2 years of data(Base of percentage shown on curve in milliins)
52
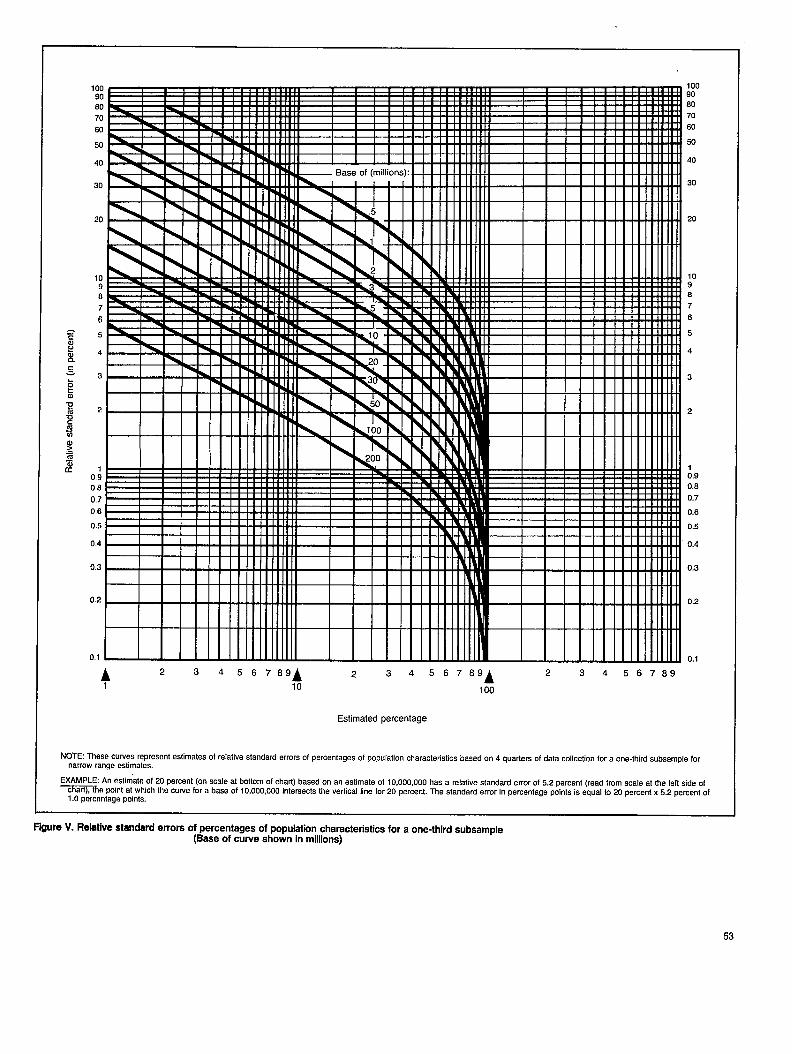
100 t “ 100m , man.“
90
80 80
70 70
60 60
50 50
40 40
30 30
20 20
109
109
8 8
7 7
6 6
5 5
4 4
3
2
:.9
0.8
“.. 0.7
06 0.6
0.5
0.4
0.3
0.2 0.2
0.1 0.1
2 3 4 56789A 2 34 56769
10A
100
Oi0.8
n7
I I I I I 1 I 1 II 1111 1!
0.5I
0.4
0.3t!
2 34 56789
Estimated percentage
NOTE, These cutves represent estimates of relative standard errors of percentages of population characteristics based on 4 quarters of data collection for a one-third subsample fornarrow range eatimales.
EXAMPLE: An eatim”ate of 20 percent (on scale at bonom of chart) baaed on an estimate of 10,000,000 haa a relative standard error of 5,2 percent (read from scafe at the left aide of
~e Point at which the Cuwe fOr a baae of 10,000,000 intersects the vertical fine for 20 percent. The standard arror in percentage points is aqual to 20 percent x 5.2 percent of1.0 percentage points,
Figure V. Reletive stsndsrd errora of percentages of population chsrsctenstioa fors one-third subssmple(Base of curve shown in millions)
53
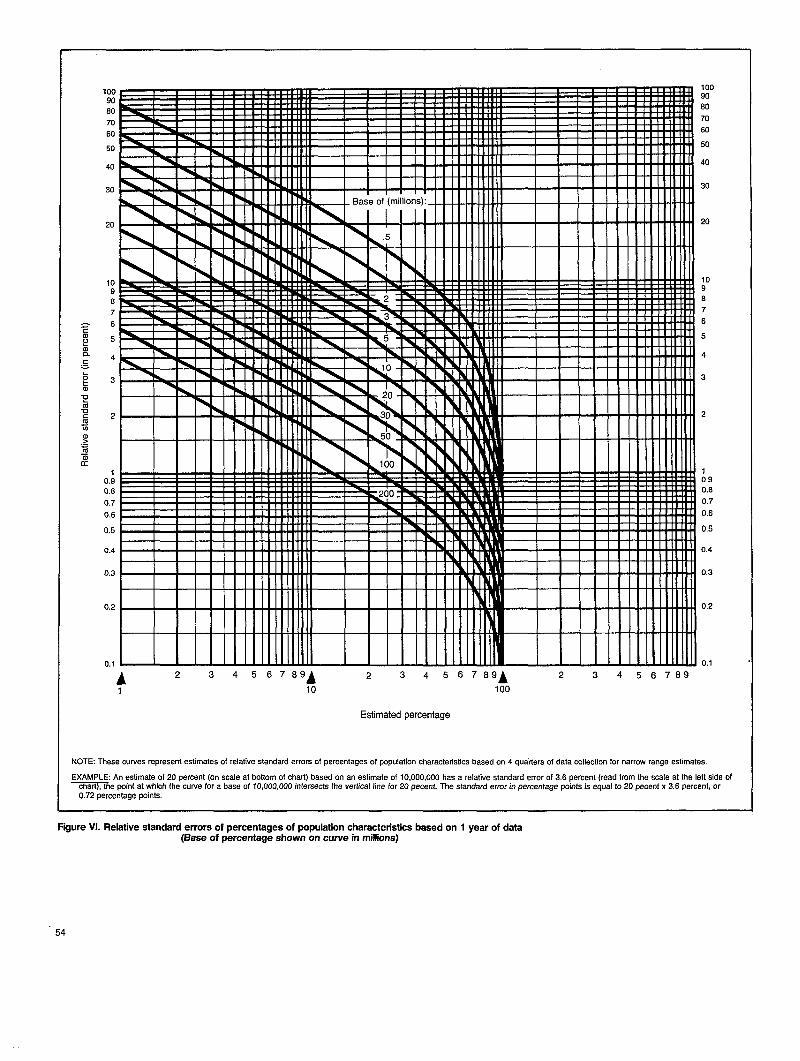
, ,
It!I I I I I I I
K! I I 1 1 I I tI m
El 1 # 1 1 1 , , I
I 1 I 1 I 1 111-ttl
10090
80
70
60
50
40
30 30
20 20
10 109 9
8 8
7 7
6 6
5 5
1 1 1 1 1 1 1
4 4
II I I I 1 1 1 II3 3
2 2
II I 1 I 1 1 1 1
0.:0.8
0.7
0.6
0.5
0.4
0.3
I I I I I t I I
! 1 8 I I 1 !1 1 1 1 I
I 1 1 I t 1 1 1, I I ,
10.90,8
0.7
0.6
0.5
0.4
0.3
.-0.2 U.z
0.1 0.1
A 2 3 456789A10
2 3 4 56789A
100
2 3 456789
Estimated percentage
NOTE These curves represent estimates of relative standard errors of percentages of population characteristics based on 4 qua’rters of data collection for narrow range estimates.
EXAMPLE An estimate of 20 percent (on scale at bottom of chart) baaed on an estimate of 10,000,000 has a relative standard error of 3,6 percent (raad from tha scale at the left side of
~a Wint at which fha cuwe for a base of Io,ooo,ooo intersects the veflicat line for 20 pecent. The standard error in percentage points is equaJ to 2fJ pecenf x 3.6 Percent, or0.72 percentage points.
F@ure W. Relative standard errors of percentages of population characteristics based on 1 year of data(Base of percentage shown on cuwe in milliins)
54
Appendix IIThe accuracy ofreporting types ofeye-care providers
Introduction
Because results from an earlier NHIS study4 co~ductedin 196zl indicated poor accuracy in respondent reporting oftypes of eye-care specialists (that is, ophthalmologists andoptometrists), special procedures were used for the 1979NHIS data collection on eye-care visits, to increase~he accu-rucy of the results, These procedures included the use ofu self-respondent rule and interviewer verification of typeof specialist seen for eye care. The use of these proceduresresulted in a high level of accuracy of respondent reportsof type of eye-care specialist. Following is a brief descriptionof the fiscal year 1964 study procedures and results. Next,the 1979 survey procedures are presented, along with a com-pariscm of respondent-reported and interviewer-verified typeof eye-care specialist.
Fiscalyear 1964 study
In the fiscal year 1964 NHIS, an extension of the usualdtita collection procedure was used as a means of estimatingthe accuracy with which respondents could identify the typesof medical specialists and practitioners consulted by familymembers. During a 4-week period of the survey year (July1963–June 1964), respondents who reported use of the servicesof tiny of the selected types of medical specialists and prac-titioners were asked for the names and addresses of thoseproviding the service. By checking this supplementary infor-mittion with medical directories, listings, and other sourcesof identification, it was possible to obtain a rough estimateof the reliability of the data on medical specialists’ andpractitioners’ services collected throughout the year.
Approximately 82 percent of the 3,169 specialists andprxtitioners reported by respondents in this study could beidentified in the listing and directories, Identification couldnot be made when the information the respondent gave didnot meet the criteria for a match or when the respondentdid not know or refused to give the name and address ofthe specialist consulted. Of the 82 percent identified special-ists, the specialty area of 88 percent were reported correctlyby rwpondents. However, only 69 percent of the ophthal-mologists were reported correctly by the respondents andonly 71 percent of the optometrists were reported correctly.
1979 survey proceduresBcctiuse a higher degree of accuracy of specialty was
desired for the 1979 data collected on type of specialistseen for eye care, a self-respondent rule was applied for
adults in addition to requiring interviewer verification oftype of specialist. For persons aged 19 years and over inter-viewers were instructed to obtain responses from the individualabout whom the questions were asked. If that person wasunavailable after one callback following the intial interview,on the second callback the interviewer was permitted toobtain the information about the individual from anotherfamily member aged 19 years and over. Using these proce-dures, over 92 percent of the surveyed persons answeredentirely for themselves and over 94 percent answered eitherentirely or partly for themselves.
In order that the interviewer might verify the type ofspecialist seen, respondents were asked for the name andaddress of the provider of eye care. Interviewers were in-structed to lookup the type of specialist seen in local telephonedirectories after the interview. If the directory was not clearas to the specialty of the eye-care provider, the interviewerswere instructed to call the place where the visit occurredand to ask for the specialty. If during the interview a respon-dent provided written information, such as a bill which indi-cated the provider’s specialty, the interviewer was allowedto accept this information.
The results of the comparison between the respondent’sreplies as to type of specialist seen and the interviewer’sverification are presented in table I. These results indicatea high level of accuracy of respondent reporting of the special-ties bf ophthalmology and optometry. Excluding unknownrespondent answers, ophthalmologists were reported accuratelyby respondents 97 percent of the time and optometrists werereported accurately 98 percent of the time. Medical doctorsother than ophthalmologists were reported somewhat lessaccurately; excluding respondent unknown answers, othermedical doctors were reported correctly 79 percent of thetime. Respondents reported other medical doctors as specialistsother than medical doctors in 15percent of the cases.
In 11 percent ~f the cases there was no interviewerverification of the specialty. These cases were the resultof such reasons as inadequate respondent information forthe interviewers to contact the place where the care wasprovided.
For estimates in this report relating to type of specialistseen, the interviewer-verified type of specialist was usedwhere known. Where the interviewer did not ascertain the
specialty, the respondent-reported type of specialty was used.In only 2 percent of the cases was the specialty unknownfor both the respondent’s answer and the interviewer’s verifica-tion.
55
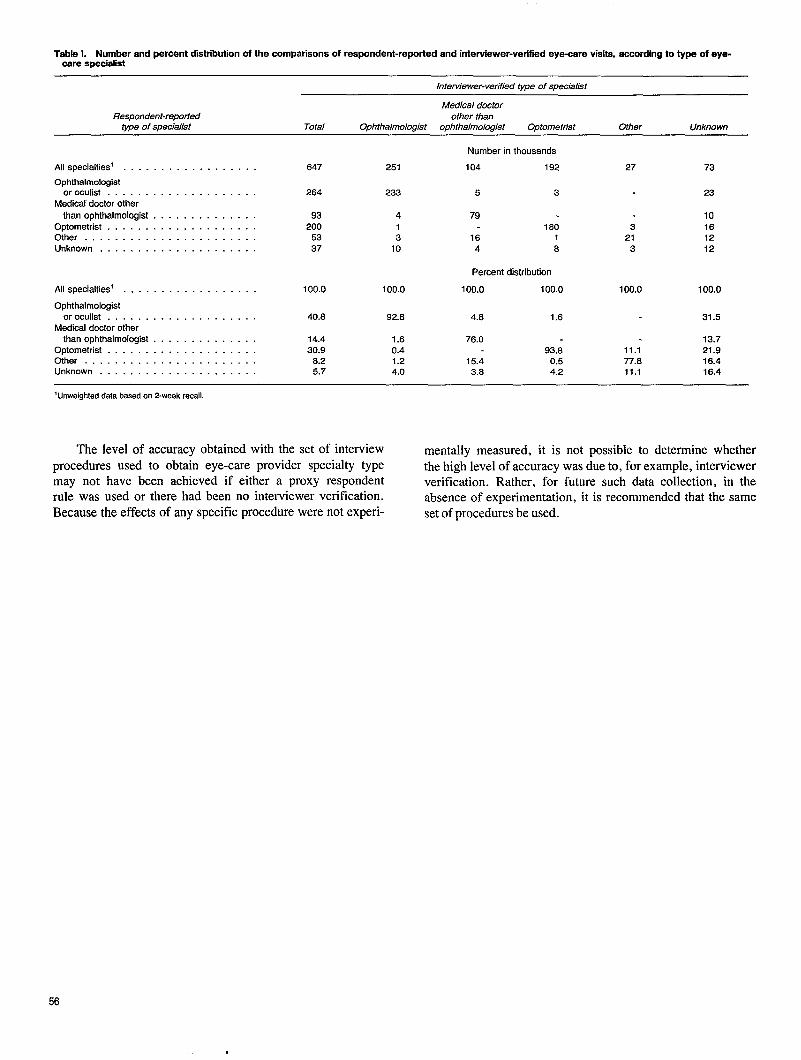
Table L Number and percent distributionof the comparisons of respondent-reported and interviewer-verifiedeye-aare visits,according to type of eye-osre spaoialist
Interviewer-verified type of specialist
Medical doctorRespondent-repotied other than
type of specialist Total Ophthalmologist ophthalmologist Optometrist Other Unknown
Number in thousands
104 192All specialties’ . . . . . . . . . . . . . . . . . . 647 251 27 73
Ophthalmologistoroculist . . . . . . . . . . . . . . . . . . . .
Medicat doctor otherthan ophthalmologist . . . . . . . . . . . . .
Optometrist . . . . . . . . . . . . . . . . . . . .Other . . . . . . . . . . . . . . . . . . . . . . .Unknown . . . . . . . . . . . . . . . . . . . . .
264 233 5 3 23
932005337
413
10
79i 80
16 14 8
10161212
321
3
Percent distribution
100.0 100,0All specialties’ . . . . . . . . . . . . . . . . . . 100.0 100.0 100.0 100.0Ophthalmologist
oroculist . . . . . . . . . . . . . . . . . .Medical doctor other
than ophthalmologist . . . . . . . . . . . . .Optometrist . . . . . . . . . . . . . . . . . . . .Other . . . . . . . . . . . . . . . . . . . . . . .Unknown . . . . . . . . . . . . . . . . . . . . .
40.6 92.8 4.6 1,6 31.5
14.430.9
8.25.7
1.60.41.24.0
76.093.8
15.4 0.53.8 4.2
13.721.918.416.4
11.177.811.1
‘Unweighteddata basedon 2-week recall.
The level of accuracy obtained with the set of interview mentally measured, it is not possible to determine whetherprocedures used to obtain eye-care provider specialty type the high level of accuracy was due to, for example, interviewermay not have been achieved if either a proxy respondent verification. Rather, for future such data collection, in therule was used or there had been no interviewer verification. absence of experimentation, it is recommended that the sameBecause the effects of any specific procedure were not experi- set of procedures be used.
56
Appendix IllDefinitions of certain termsused in this report
Terms relating toeye-care visits
Eye-care visit-An eye-care visit is a visit to a doctoror someone else in which help or advice was received aboutthe eyes. It includes examinations, treatments, surgexy, andfitting or adjusting contact lenses. Visits for eye care donot include visits that were only for adjusting frames.
Ophthalmologists (oculists)--An ophthalmologist is aphysician who specializes in the diagnosis and treatmentof all eye diseases and abnormal conditions including refractiveerrors. They may prescribe drugs, lenses, or other treatment,or perform surgery to remedy these conditions.
Optometrists—An optometrist examines ‘the eye and re-lated structures to determine the presence of vision problems,eye disease, or other abnormalities. They prescribe and adaptlenses or other optical aids and may use visual trainingaids (orthoptics) when indicated to preserve or restoremaximum efficiency of vision. They do not prescribe drugs,make definitive diagnosis of or treat eye disease, or performsurgery.
Opticians (also called dispensing opticians, ophthalmicdispensers, or contact lens technicians)-opticians make,fit, supply, and adjust eyeglasses according to prescriptionswritten by ophthalmologists or optometrists to correct a pa-tient’s optical defects, They do not examine eyes or prescribetreatment.
Demographic terms
Age—The age recorded for each person is the age atlast birthday. Age is recorded in single years and groupeddepending on the purpose of the table.
Race—Three racial groupings are used in this report:“white,” “black,” and “other. “ “Other” includes Aleut, Eskimoor American Indian, Asian or Pacific Islander, and any otherraces. Starting in 1980, race characterization is based onthe respondent’s description of his or her racial background.For years prior to 1980, racial characterization was basedon the interviewer’s observation of race.
Income offamily or of unrelated individuals—Each mem-ber of a family is classified according to the total incomeof the family of which he or she is a member. Withinthe household all persons related to each other by blood,marriage, or adoption constitute a family. Unrelated individu-UISare classified according to their own incomes.
The income recorded is the total of all income receivedby members of the family (or by an unrelated individual)
in the 12-month period preceding the week of interview.Income from all sources is included, for example, wages,salaries, rents from property, pensions, and help from rela-tives.
Head of family—The head of family is usually the personregarded as the “head” by the members of the group.
Education of head of family or of unrelated individuals—Each member of a family is classified according to the educa-tion of the head of the family of which he or she is amember. Within the household all persons related to eachother by blood, marriage, or adoption constitute a family.Unrelated individuals are classified according to their owneducation.
The categories of education status show the years ofschool completed. Only years completed in regular schools,where persons are given a formal education, are included.A “regular” school is one that advances a person towardan elementary or high school diploma or a college, university,or professional school degree. Thus, education in vocational,trade, or business schools outside the regular school systemis not counted in determining the highest grade of schoolcompleted.
Family—Family refers to a group of two persons ormore related by blood, marriage, or adoption who are livingtogether in the same household. Although the usual householdcontains only the primary family, a household can containsecondary families as well as individuals unrelated to thefamily. A lodger and his or her family who are not relatedto the head of the household or a resident employee andhis wife living in the household are considered a secondaryfamily and not part of the primary family. However, ifthe son of the head of the household and the son’s wifeand children are members of the household, this subfamilyis treated as part of the primary family.
Unrelated individuals—Unrelated individuals are personswho are not living with any relatives. An unrelated individualcan .be (1) a household head living alone or with nonrelative,(2) a lodger or resident employee with no relatives in thehousehold, or (3) a resident of a dormitory, lodging house,or other shared-residence facility who has no relative livingwith him or her.
Size of family—Families are classified by the numberof members in it as defined above. Those living alone,or in residence with persons not related to them, are designatedas “unrelated individuals. ”
Geographic region—For the purpose of classifying the
57
“
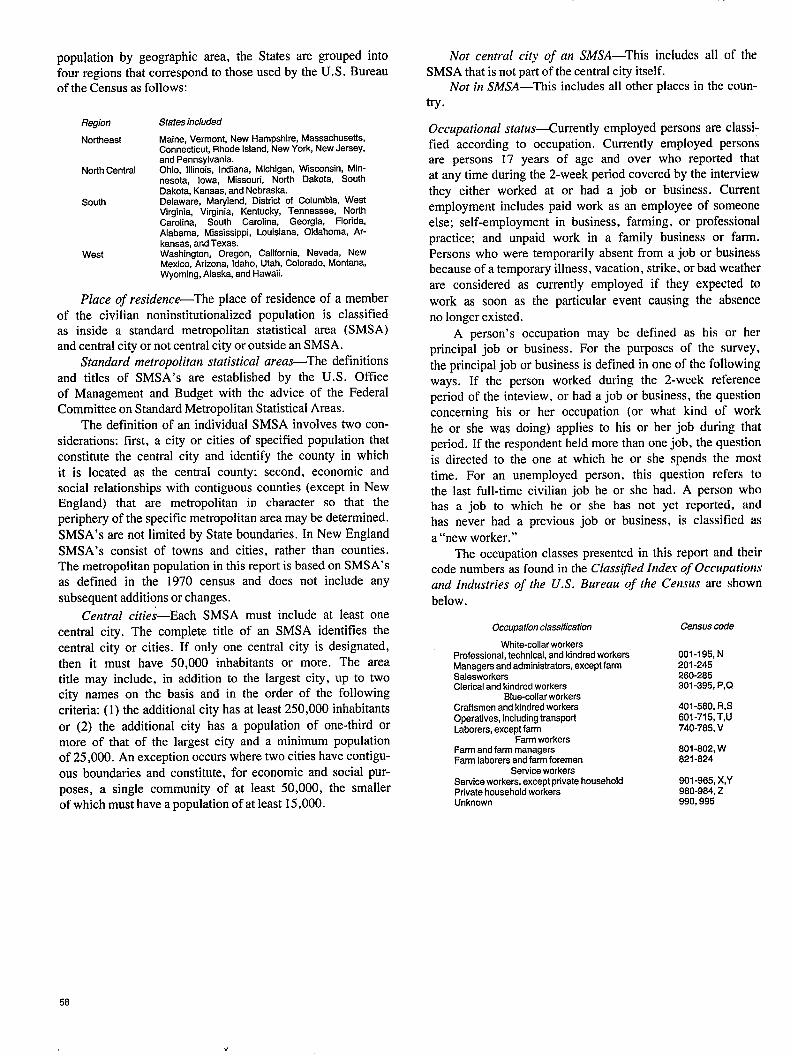
population by geographic area, the States are grouped intofour regions that correspond to those used by the U.S. Bureauof the Census as follows:
Region States included
Northeast Maine, Vermont, New Hampshire, Massachusetts,Connecticut, Rhode Island, New York, New Jersey,and Pennsylvania.
North Central Ohio, Illinois, Indiana, Michigan, Wisconsin, Min-nesota, Iowa, Missouri, North Dakota, SouthDakota, Kansas, and Nebraska.
South Delaware, Maryland, District of Columbia, WestVirginia, Vkginia, Kentucky, Tennessee, NorihCarolina, South Carolina, Georgia, Florida,Alabama, Mississippi, Louisiana, Oklahoma, Ar-kansas, and Texas.
West Washington, Oregon, California, Nevada, NewMexico, Arizona, Idaho, Utah, Colorado, Montana,Wyoming, Alaska, and Hawaii.
Place of residence—The place of residence of a memberof the civilian noninstitutionalized population is classifiedas inside a standard metropolitan statistical area (SMSA)and central city or not central city or outside an SMSA.
Standard metropolitan statistical areas—The definitionsand titles of SMSA’S are established by the U.S. Officeof Management and Budget with the advice of the FederalCommittee on Standard Metropolitan Statistical Areas.
The definition of an individual SMSA involves two con-siderations: first, a city or cities of specified population thatconstitute the central city and identify the county in whichit is located as the central county; second, economic andsocial relationships with contiguous counties (except in NewEngland) that are metropolitan in character so that theperiphery of the specific metropolitan area maybe determined.
SMSA’S are not limited by State boundaries. In New EnglandSMSA’S consist of towns and cities, rather than counties.The metropolitan population in this report is based on SMSA’Sas defined in the 1970 census and does not include any
subsequent additions or changes.
Central cities—Each SMSA must include at least onecentral city. The complete title of an SMSA identifies thecentral city or cities. If only one central city is designated,then it must have 50,000 inhabitants or more. The areatitle may include, in addition to the largest city, up to twocity names on the basis and in the order of the following
criteria ( 1) the additional city has at least 250,000 inhabitants
or (2) the additional city has a population of one-third ormore of that of the largest city and a minimum populationof 25,000. An exception occurs where two cities have contigu-ous boundaries and constitute, for economic and social pur-
poses, a single community of at least 50,000, the smallerof which must have a population of at least 15,000.
Not central city of an SMSA—This includes all of theSMSA that is not part of the central city itself.
Not in SMSA—This includes all other places in the coun-try.
Occupational status-Currently employed persons are classi-fied according to occupation. Currently employed personsare persons 17 years of age and over who reported thatat any time during the 2-week period covered by the interviewthey either worked at or had a job or business. Currentemployment includes paid work as an employee of someoneelse; self-employment in business, farming, or professionalpractice; and unpaid work in a family business or farm.Persons who were temporarily absent from a job or businessbecause of a temporary illness, vacation, strike, or bad weatherare considered as currently employed if they expected to
work as soon as the particular event causing the absenceno longer existed.
A person’s occupation may be defined as his or herprincipal job or business. For the purposes of the survey,
the principal job or business is defined in one of the followingways. If the person worked during the 2-week referenceperiod of the inteview, or had a job or business, the questionconcerning his or her occupation (or what kind of work
he or she was doing) applies to his or her job during thatperiod. If the respondent held more than one job, the questionis directed to the one at which he or she spends the most
time. For an unemployed person, this question refers tothe last full-time civilian job he or she had. A person whohas a job to which he or she has not yet reported, andhas never had a previous job or business, is classified as
a “new worker.”The occupation classes presented in this report and their
code numbers as found in the Classj?ed Inde.v of Occupationsand Industries of the U.S. Bureau of the Census are shown
below.
Occupation classification
White-collar workersProfessional, technical, and kindred workersManagers and administrators, except farmSalesworkersClerical and kindred workers
Blue-collar workersCraftsmen and kindred workersOperatives, including transportLaborers, except farm
Farm workersFarm and farm managersFarm laborers and farm foremen
Service workersService workers, except private householdPrivate household workersUnknown
Census code
001-195, N201-245260-285301-395, P,Q
401-580, R,S601-715, T,U740-785, V
801-802, W821-824
901-965, X,Y980-964, Z990,995
58
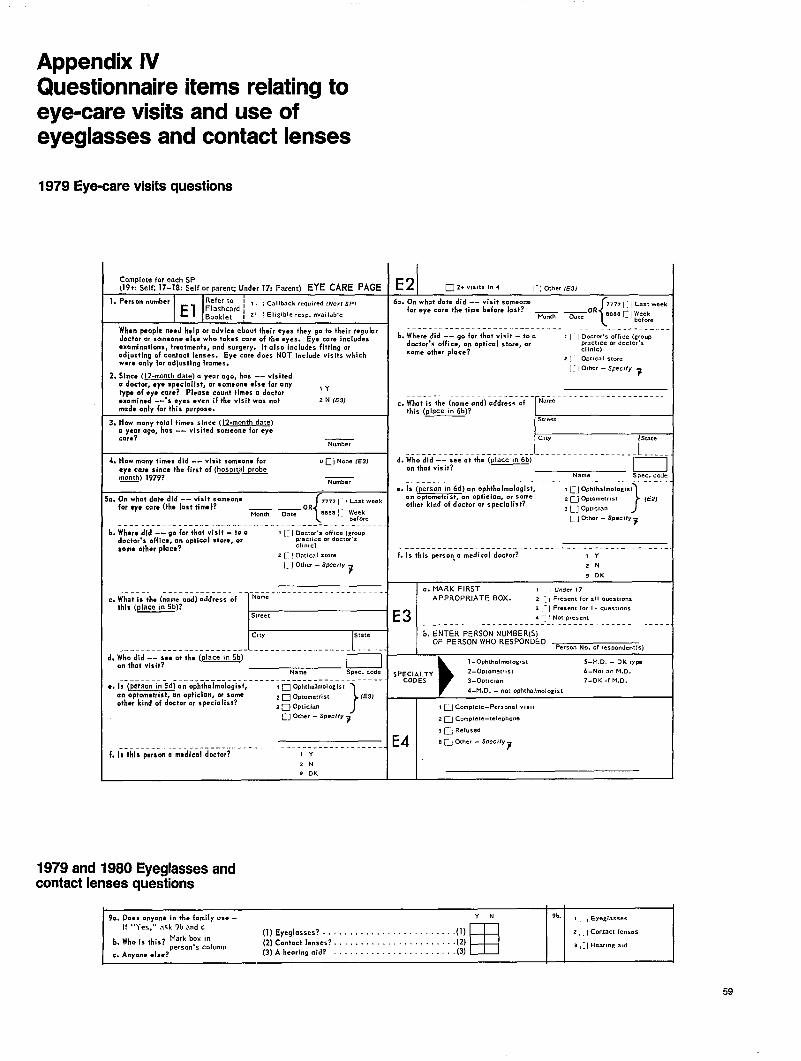
Appendix IVQuestionnaire items relating toeye-care visits and use ofeyeglasses and contact lenses
1979 Eye-care visits questions
Complete for each 5P(19R Selfi 17-18: self or parenu Und.r In parent) EYE CARE PAGE
1. Person number Refer co ~ 1 I ( Callback required (Nex! SP1E1 F1.sflcard ,
Booklet , 21 \ El, wble ,,,0. avail.bte
When people need help or advice about their eyes they go to their reg”l.ardoctor or someone else who tokes core of the ●yes. Eye core includes●xaminations, treatments, and surgery. It also includes fitting orad[u.ting of contact lenses. Eye core does NOT include visits whichw.re only for odj.sting frames.
2. Since (12.month date) a year ego, has -- visiteda doctor, .ye spccio list, or s.arn. one ●lse for any
type of ●ye core? Please count times n doctorlY
●x.mln.d --’s eyes ● ven if the visit w.. not 2 N (E3)
made only for this purpose.
3. How many total times since (12-month date)~ y,ar age, has -- visited someone for ●ye
.Yw.?Number
4. How many times did -- visit someone for o U None fE31
●ye care since the first of (hospital probe@) 1979?
Number
. . On what dat. did -- visit someonefor CY* care (the last time)?
{
777, [ I L.,, week— —ORMonth Date 9888 ~: I Week
.-for.. .. . .. . . . . . . . . . . . . . . . . . . . . . . . . . . . . . . . . . . . . . . . . . . . . . . . .h. Whw. did -- go for that visit - to o I [: I Doctor, s of f,., [zrmm
doctor’s office, .“ optical st.r., w Pr.cl,.e or d.ctor. s
soma other place?.1,.,.)
2 [- I Opucal score
[_J Other - S,c.s.,fy7
‘“-----Fc. What is th. (name an-d) nddress of ‘“M=this (place in 5b)?
City’ state
. . . . . . . . . . . . . . . . . . . . . . . .._L_..-..l__. -.-- . . ..l . . . . .J. Who did -- s.* ot the (place in 5b)
on that visit? —0Name
.-. —-----D. Is person In 5d an ophthalmologist, I ❑ Ophth. !mologist
an optomdrist, an optician, c+ some 2 ❑ Optometrist
}
[E3)other kind of doctor ., specioli. t? a Q Optician
❑ Other - SPec(/y ~
. . . . . . . . . . . . . . ..--.. - . . ..-. .. —-------------- -------f. Is this pwson n mcdicnl doctor? !Y
,N
s DK
1979 and 1980 Eyeglasses andcontact lenses questions
E2 02+ .,s,1s in 4 [:] other (E3,
5.. O.wh.td.at. did -- visit someonefor eye core the time before last?
{
777, [] Last week
— —OR Sr388~l WeekMonth 0. t. before...-- . . ..-- ——.--. .___—_—_________________________b. Where did -- go forthot visit - to. f[ I Doctor,, of f,., (g,oup
doctor’s office, a“ opticol sto,e, or Drmcmce ordoct.r’s
SOlll, other Place? CIlntc)
.?1- I Oc.,, c.l sm..
“’;=)’-‘---------c. What is the (nome and) nddress of “M’
1!. . . . . . . . . . . . . . -l___d. Who did -- see at the (place In 6b)
on that visit? ~Name
--------- . . . . . . . . . .. —. . . . . . . . . . . . . . . . . . . . . . .
● . Is (person ,n 6d)on .phthohn.a logist,
}
, U Oohthalmol.ag, sl.3” optometrist, ,. optic i.n, or some , u Opt.meu, st fE2)other kind of doctor w specialist?
3 r-l Opt,.,..
~j other - Specify-F
. . . . . . . . . . . . . . . . . . . . . . . . .---. ---. . —--------------f. 1. this pers.aq.a medic.aldoct.ar? *Y
—
:3
2N
3 DK
c. MARK FIRST l’-, U”de,17
APPROPRIATE BOX. . , , Pm,.., for .11 q.,,,,.”.
3 [-1 P,e$..t f., u, mJCStI.. S4::1 Nozwe,ent
b. ENTER PERSON NuM8ER(S)OF PERsONWHORESPONDEO
Per,.” No. of re,r,onde”t[,)
b1-Oohthalm.log, st 5-M, D, - DKo’w
2-oD1mlletrtst 6-Nc., ,. M.D.; P~~lDAELSTy3- Opt,. mn 7-D< ,f M.D.
4-M. D.-”oc ophthalmolomst
9e. Does anyone in the family .s. - YN 9b. , [ ~EYegla s,.,
If ’’Yes,” ask9bandc
b. Who i: this? ~j~$o~j~~lum”
(l) Eyeglasses? . . . . . . . . . . . . . . . . . . . . . . ...(l)
H
2,. !COntact lenses
(2) C.ntoct lenses? . . . . . . . . . . . . . . . . . . . . ...(2) 3 1~1 Hearmga!d
c. Anyone else? (3) Aheori.g aid? . . . . . . . . . . . . . . . . . . . . ...(3)
59
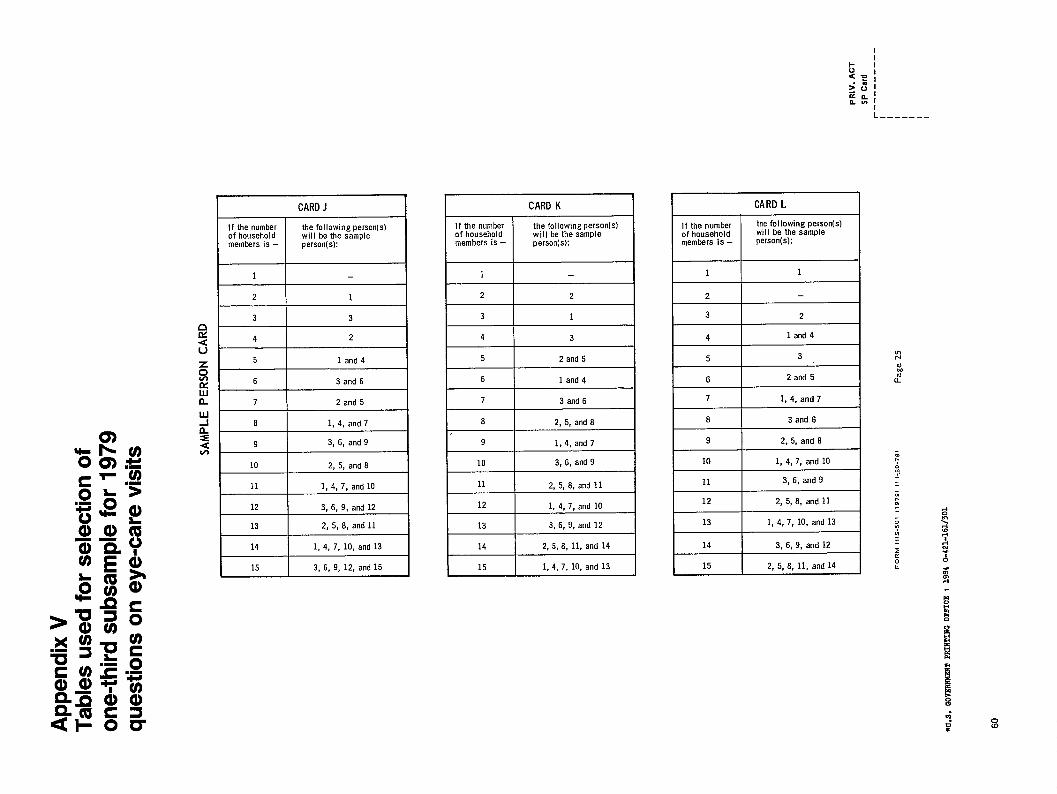
1
L_______
[ CARD J I II CARD K I I CARD L
I If the number I the following person(s)of household will be the samplemembers is- person(s): I
1
2 2I
3 3nz< 4 2
u5 1 and4
g6 3 and 6
%IL 7 2 and 5
U.1-1 8 1, 4, and 79.=E~ 9 3,6, and9
H-d3 1
4 3
151 2 and 5 II 61 1 and 4 I171 3 and 6 I
8 3 and 6,
8 2, 5, and 8
9 1,4, and 7
10 3, 6, and 9
11 2, 5, 8, and 11
12 1, 4, 7, and 10
13 3, 6, 9, and 12
9 2, 5, and 8
10 1, 4, 7, and 10
11 3, 6, and 9
12 2, 5, 8, and 11
13 1, 4, 7, 10, and 13
‘5 10 2, 5, and8
11 1, 4, 7, and 10
12 3, 6, 9, and 12
13 2, 5, 8, and 11
14 1, 4, 7, 10, and 13
15 3,6,9, 12, and15
.
>
019
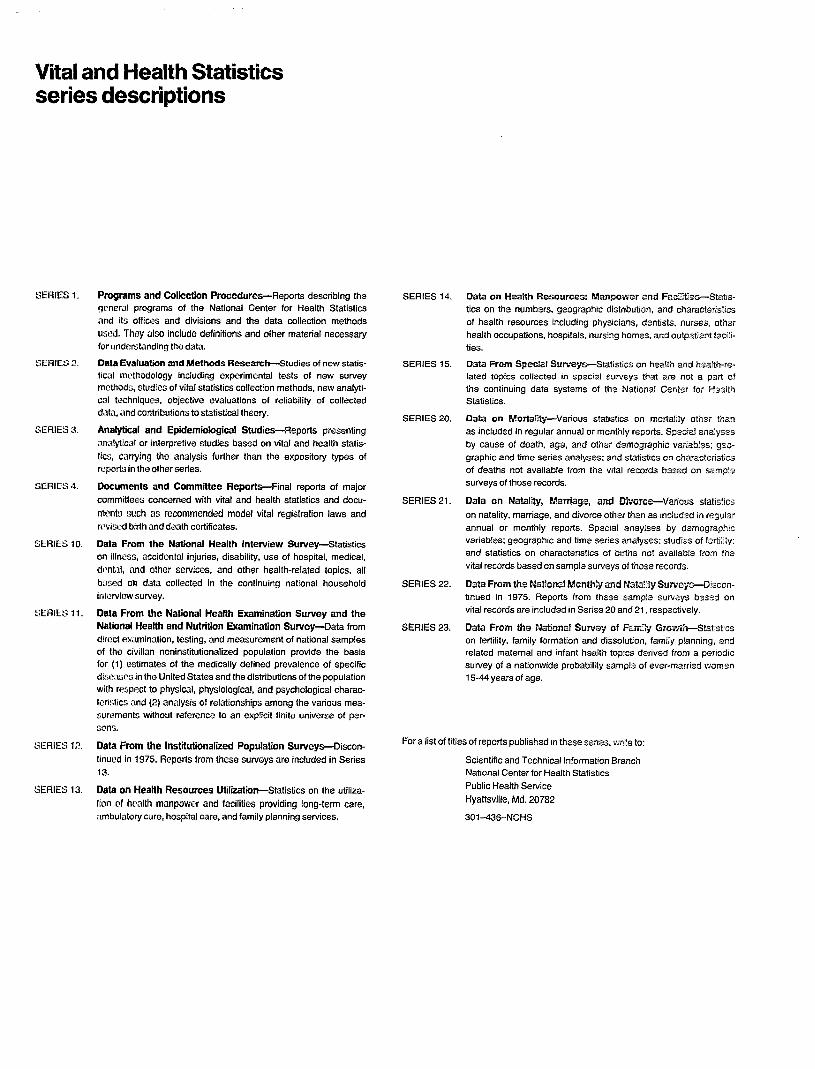
Vital and Health Statisticsseries descriptions
Smllx 1.
sEFtlEs 2.
SERIES 3.
SERIES 4.
SERIES 10.
SERIES 11.
sEflIEs12.
SHWS 13.
Programs and Confection Procedures-Reports describing the
general programs of the National Center for Health Statistics
and its offices and divisions and the data collection methods
used. They also include definitions and other material necessary
for understanding the data.
Data Evaluation and Methods Research-Studies of new statis-
bcal methodology including experimental tests of new survey
method% studies of vital statistics collection methods, new analyti-
cal techniques, objective evaluations of reliability of collected
data, and contributions to statistical theo~.
Analytical and Epidemfofogical Studies-Reports presenting
cmalyfkml or interpretive studies bassd on vital and healtin statis-
tics, carrying the analysis further than the expository types of
rcpork in the other series.
Documents and Committee Reports-Final reports of major
committees concerned with vital and health statistics and docu-
mcnki such as recommended model vital registration laws and
revised birth and death certificates.
Data From the National Heatth Interview Survey-StatisticsKM illness, accidental injuries, disability, use of hospital, medical,
dmW and other services, and other health-related topics, all
b~scd oh data collected in the continuing national household
iritcrviow survey.
Data From the National Heafth Examination Survey and the
Nstbxtal Health and Nutrition Examh’ration Survey-Data from
direct examination, testing, and measurement of national samples
of tho civilkm noninstitutiomlized population provide the basisfor (1) ostimrdes of the medically defined prevalence of specific
diseases in the United States and tha distributions of the population
with respect to physical, physiological, and psychological charac-
teristics and (2) analysis of relationships among the various mea-
surements without reference to an explicit finite universe of per-
sons.
Data From the Institutiortaliied Population Surveys-Discon-
tinued in 1!375. Reports from these surveys are included in Series
13.
Data on Heafth Resources Utiiiition+$tatistics on the utiliza-
Iiem of health mcmpower and facilities providing long-term care,ambukdory care, hospital care, and family planning services.
SERIES 14. Data on f+eafth Re60urce= Manpower and FacZtk~Staks-
fics on the numbers, geographic distribution, and characteristics
of health resources including physicians, dentists, nurses, other
health occupations, hospitals, nursing homss, and outpatient facih-
fk?s.
SERIES 15. Data From Speck] Surveys-Statistics on haalth and hezlfin-re-
Iated topics mllected in special surveys that are not a pal of
the continuing data systems of the hlabonal Center for Haa[lh
Statistics.
SERIES 20. Data on k?mba5@-Various statmwx on morta[jty otiwr than
aa included in regular annual or monfiily reports. .Spscialanalysesby cause of death, age, and other demographic variablas; g50-
graphlc and time series analyses; and statistics on characteristics
of deaths not available from the vital records based on sample
surveys of those records.
SERIES 21. Data cm Nata!ii, Marriage, and Divorc+Various stabstlcs
on natality, marriage, and divorce other than as included in regular
annual or monthly reports. Spec!al anaylses by dsrnograph]c
variables; geographic and time serk?s analyses; studies of fert!hty:
and statistics on characteristics of births not avai[abla from tha
vital records based on sample surveys of those records..
SERIES 22. Data From the Natorwl Mmitfty and Nats!fy Staveyyc-Drscon-
tmued in 1975. Reports from these sampla surveys based on
vital records are included m Series 20 and 21, respectively.
SERIES 23. Data From the National Surv&f of Fam2y Grovfih-Statistics
on fetillity, family formation and dissolution, family planning, andrelated maternal and infant health topics derived from a psviodic
survey of a nationwide probability sample of evsr-marrisd women
15-44 years of age.
For a list of titles of reports published m these series, write to:
Scientific and Technical lnformabon BranchNational Center for Health Statistics
Public Health Service
I-fyatfsville, Md. 20782
301436-NCHS
U.S. DEPARTMENT OF HEALTH ANDHUMAN SERVICES
Public Health ServiceNational Center for Health Statistics3700 East-West HighwayHyaltsvi[le, Matyland 20782
OFFICIAL BUSINESSPENALTY FOR PRIVATE USE, $300
DHHS Publication No. (PHS) 84-?573, Series 10, No. 145