extreme networks investor presentation - jefferies · 2017-05-16 · investor presentation. may...
TRANSCRIPT

©2017 Extreme Networks, Inc. All rights reserved
Investor PresentationMay 2017
Extreme Networks

©2017 Extreme Networks, Inc. All rights reserved©2017 Extreme Networks, Inc. All rights reserved
Cautionary Statement on Financial MeasuresNon GAAP Measures:In preparing the accompanying information, the Company has excluded, where applicable, the impact of certain Non GAAP costs. The Company believes these Non GAAP measures provide both management and investors with additional insight into its current operations, the trends affecting the Company and the Company's marketplace performance. Management believes presenting non GAAP items allow readers to better correlate the Company's operating activities with the Company's ability to generate cash from operations. Accordingly, management uses Non GAAP measures along with comparable GAAP information when evaluating the Company’s historical performance and future business activities. The Company’s Non GAAP measures may be different than those used by other companies and should be considered in conjunction with, and not as a substitute for, the Company’s financial information presented in accordance with GAAP. Please refer to our most recent earnings press release, which is posted on the “Investor Relations” section of our website for the required reconciliation to the most comparable GAAP financial measures. Reconciliation of non-GAAP to corresponding GAAP measures with respect to our business outlook is not possible at this time due to the fact that amortization, stock compensation expense and the impact of the mark-up of inventory to fair value for purchase accounting can only be determined in connection with the post-closing valuation of the assets we acquired in connection with the closing of our transaction with Zebra Technologies Corporation and other post-closing activities of the Company.
Forward Looking Statements:This presentation contains forward-looking statements that involve risks and uncertainties, including statements regarding the Company’s financial performance including its revenue and margin targets, acceptance of the Company’s newer products in the market and its expectations regarding its general business prospects. Actual results could differ materially from those projected in the forward-looking statements as a result of certain risk factors. The Company undertakes no obligation to update the forward-looking information in this presentation. More information about potential factors that could affect the Company’s business and financial results is included in its filings with the Securities and Exchange Commission, including, without limitation, under the captions: “Management’s Discussion and Analysis of Financial Condition and Results of Operations,” and “Risk Factors”.
2

©2017 Extreme Networks, Inc. All rights reserved©2017 Extreme Networks, Inc. All rights reserved
OverviewNetworking solutions for the enterprise campus worldwide
3
• Revenue Run Rate: Approx. $650 million
• Market capitalization: ~$1 billion
• Fiscal year-end: June 30
• Shares outstanding: 114 million
• Average daily volume: 1,463,000 shares
• Nasdaq: EXTR
©2017 Extreme Networks, Inc. All rights reserved
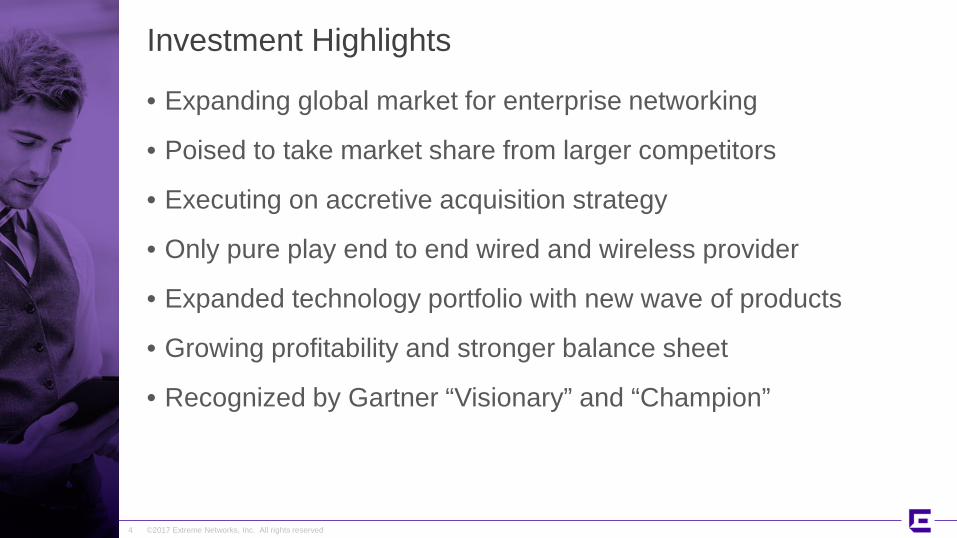
Investment Highlights
4
• Expanding global market for enterprise networking
• Poised to take market share from larger competitors
• Executing on accretive acquisition strategy
• Only pure play end to end wired and wireless provider
• Expanded technology portfolio with new wave of products
• Growing profitability and stronger balance sheet
• Recognized by Gartner “Visionary” and “Champion”

©2017 Extreme Networks, Inc. All rights reserved©2017 Extreme Networks, Inc. All rights reserved5
• Accretive to earnings and cash flow in 2HFY17
• Increases TAM by $1.3B
• Strong position in retail, hospitality and transportation
• Additional blue-chip customers and new channel partners
• Refresh and upsell opportunities
• Acquired wireless LAN business from Zebra Technologies
• Announced all-cash transaction closed on October 31, 2016
• Fastest growing segments in networking
• Third largest WLAN provider
• Wireless now 25+% of total revenue
Zebra Acquisition - Strategic Rationale

©2017 Extreme Networks, Inc. All rights reserved
Asset Purchasing Agreement (“APA”) of Avaya Networking
• Announced APA to acquire Avaya’s networking business on March 7, 2017
• Acquired for approximately $100 million, less the value of assumed leases
• Strengthens Extreme’s position as the third largest competitor in its targeted enterprise markets
• Accretive to earnings and cash flow beginning in FY18
• Expected to generate over $200 million in annual revenue
• Targets similar market segments, verticals and customers
• Anticipated synergies and complementary products will support Extreme’s strategy
6

©2017 Extreme Networks, Inc. All rights reserved
APA of Brocade Data Center Networking Business
• Announced APA to acquire Brocade’s data center switching, routing and analytics business on March 29, 2017
• Acquired for approximately $55 million in cash, as well as additional potential performance based payments to Broadcom, paid over a five-year term
• Strengthens Extreme’s position in the expanding high-end data center market and go-to-market strategy in target verticals
• Accretive to earnings and cash flow beginning in FY18• Expected to generate over $230 million in annual revenue• Expands commercial relationship with Broadcom• Increases total addressable market size to $12.9 billion
7

©2017 Extreme Networks, Inc. All rights reserved©2017 Extreme Networks, Inc. All rights reserved
“Market Consolidation” execution of company strategy Builds upon #3 position in Enterprise Networking Further entrenchment and expansion in target vertical markets Strengthens Team with experienced pool of talented networking professionals Strong technology heritage complements existing secure networking concepts Addition of 4000+ Avaya Networking & 6600 Brocade Networking Customers & Partners
8
Enterprise IP Networking – Strong Technology Heritage

©2017 Extreme Networks, Inc. All rights reserved
Target MarketsStrategy: End-to-End Wired/Wireless software driven networking solutions
9
SOHO SMB Campus Enterprise
Large Enterprise
Cloud
GTM
Product
Customer
NetgearLinksys (Cisco)
D-LinkTP-Link
ExtremeCisco
HPAvaya
CiscoHPDell
Ubiquiti
CiscoHP
BrocadeJuniper
Small Office
*Only includes wireless – do not report consumer wired
Direct SaleOEM/ODM
AristaCisco
White-box
Home
Direct SaleOEM
CiscoHP
AristaBrocadeJuniper
ServiceProvider
TAM $12.9B$1B* $7.1B$10.8B$34B

©2017 Extreme Networks, Inc. All rights reserved
Target Market
Market Total Market
Extreme TAM 2016
TargetedVertical Markets
Extreme Only
Brocade& Avaya & Zebra
add
CAGR(2015-2020)
Software (Management, Controls & Cloud)
$2.1B $1.9B $1.6B $1.2B $0.7B 7.0%
Wireless LAN $5.8B $3.2B $2.7B $2.1B $1.1B 6.2%
Data Center $11.7B $4.3B $3.6B $2.6B $1.7B 0.1%
Ethernet Switching & Campus LAN $14.3B $3.5B $2.9B $2.2B $1.3B (2.2%)
Total $33.9B $12.9B $10.8B $8.1B $4.8B 2.0%
10
Notes:• Based on Extreme estimates utilizing Gartner, IDC, Dell’Oro Group and publicly available information• Overlapping markets (Healthcare, Manufacturing, Hospitality) are included in Extreme Targeted Vertical Markets• Zebra brings incremental verticals: Retail, Logistics and Transportation• Avaya adds to Campus addressable market and SW market• Brocade adds to Data Center addressable market and Government vertical market

©2017 Extreme Networks, Inc. All rights reserved©2017 Extreme Networks, Inc. All rights reserved
Play to Strength
11
Enterprise Networking
Management Software Analytics Fabric Cloud Management Controls High-End Data Center
Healthcare Government Education ManufacturingHospitality/Public Venues RetailTransportation
& Logistics
Vertical Markets
Core/Data Center
• 10G/25G/40G/100G • Fixed Form Factor• VMware – to OpenStack• L3 Scalable• VxLAN options
Switching, Routing & Analytics
• VDX/MLX Switching & Routing
• SLX Next Gen Platform• Network Visibility• Automation & Orchestration
Edge
• Wired + Wireless• 1G centric• Wave 2 - 2.5G/5G

©2017 Extreme Networks, Inc. All rights reserved©2017 Extreme Networks, Inc. All rights reserved
High-Profile Customers
12
EducationHealthcare Government Hospitality Manufacturing Transportation & Logistics
Retail

©2017 Extreme Networks, Inc. All rights reserved
Competitive Position in Enterprise Market
13
Competitor Enterprise Network Revenue ($M) Market Share (%) Comment**
Cisco $14,299 45% OMF/WI/ISHPE/Aruba $1,808 6% OMF/ISExtreme $1,100 4%Juniper $980 3% OMF/WI/ISArris (post Brocade/Ruckus) $750 2% OMF/WI/ISDell $339 1% OMF/WI/ISAlcatel-Lucent Enterprise $195 0.6% OMF/WI/ISAerohive $151 0.5% WI/ISOther $ 11,793 37% OMF/LG
TOTAL $31,800 100%
** Key: OMF: Other Market FocusWI: Wireless IssueIS: Incomplete Solution LG: Limited Geo
• Based on Extreme estimates utilizing Gartner, IDC, Dell’Oro Group and publicly available information
• Other includes: Huawei, H3C, Check Point, Fortinet, Palo Alto and F5

©2017 Extreme Networks, Inc. All rights reserved©2017 Extreme Networks, Inc. All rights reserved
1
2
3
4
5
6
7
8
9
2013 20172014 2015 2016
10
11
12
8
13
8
5
3
2
1
++
++
*Source Dell’Oro
Third Largest Enterprise End-to-End Networking Vendor*
14
Aerohive

©2017 Extreme Networks, Inc. All rights reserved
The “New” Extreme
15
The only pure play, end-to-end enterprise IP networking company in the world
• Provider of high quality, software-driven, secure networking solutions and the industry’s #1 customer support organization
• SW Suite enables customers to simplify and secure complex networking environments
• Only multi-vendor network management with “single pane of glass”
• Delivering new releases of next generation portfolio organically and through acquisition
• Differentiation through hyper focus on enterprise networking

©2017 Extreme Networks, Inc. All rights reserved©2017 Extreme Networks, Inc. All rights reserved
Recognized Visionaries
• Unified Management System –“Single Pane of Glass”
• Optimized access layer in enterprise environments
• Better outcomes through network analytics
Magic Quadrant: Wired & Wireless LAN Access Infrastructure
16
“Extreme is the best kept secret in the industry.”
August 2016

©2017 Extreme Networks, Inc. All rights reserved©2017 Extreme Networks, Inc. All rights reserved
Recognized Challenger
• Brocade enhances Extreme’s presence in the Data Center market.
• According to Gartner: “Brocade has consistently focused on providing an automated network switching fabric, resulting in increased market traction for their fabric.”
Magic Quadrant: Data Center Networking
17
“Brocade is a longtime data center networking player with a solid portfolio…”
May 2016

©2017 Extreme Networks, Inc. All rights reserved©2017 Extreme Networks, Inc. All rights reserved
Growth from Wireless
18
HD Camera AP (AP3916)Wall Plate AP (AP3912)
Cloud ManagementWave 2
Wi-Fi Replacement Cycle
Internet of Things (IoT)
Simplifies IT operations
Indoor AP and Surveillance Camera

©2017 Extreme Networks, Inc. All rights reserved©2017 Extreme Networks, Inc. All rights reserved
Increased Profitability and Stronger Balance Sheet
19
53.6% 53.4%
54.8%
56.3%
57.5%57.0%
51.0%
52.0%
53.0%
54.0%
55.0%
56.0%
57.0%
58.0%
FQ216 FQ316 FQ416 FQ117 FQ217 FQ317
Non-GAAP Gross Margin
$85.9 $88.3 $94.1
$102.3 $103.8
$117.3
$60.0
$70.0
$80.0
$90.0
$100.0
$110.0
$120.0
$130.0
FQ216 FQ316 FQ416 FQ117 FQ217 FQ317
Cash at end of quarter (in Millions)

©2017 Extreme Networks, Inc. All rights reserved©2017 Extreme Networks, Inc. All rights reserved
Extreme’s Transformation
20
Events Actions
Execution Eight consecutive quarters of delivering earnings that have met or exceeded guidance
Products Strong new product cycle starting in FY17
Zebra WLAN business acquisition Wireless 25+% of total revenue –Increased TAM and added two vertical markets
Avaya Networking APA Will strengthen position as the third largest competitor in targeted enterprise markets
Brocade Data Center Networking APA Will strengthen position in the expanding high-end data center market and go-to-market strategy in target verticals
Management team Key strategic hires
Strategy Refined focus on enterprise customers and targeted verticals

©2017 Extreme Networks, Inc. All rights reserved
FQ3’17 Guidance
21
Non-GAAP($ in millions except EPS) FQ3’17 Actual FQ4’17 Guidance Target
Revenue $148.7 $168.0 - $178.0
Gross Margin % 57.0% 56.5% - 57.5% >60%
Operating Expenses $70.8 $76.5 - $80.5
Operating Income % 9.4% 11.0% - 12.3% >10%
EPS $0.10 $0.14 - $0.17
Average Shares Outstanding 113M 114M

©2017 Extreme Networks, Inc. All rights reserved
Investment Highlights
22
• Expanding global market for enterprise networking
• Poised to take market share from larger competitors
• Executing on accretive acquisition strategy
• Only pure play end to end wired and wireless provider
• Expanded technology portfolio with new wave of products
• Growing profitability and stronger balance sheet
• Recognized by Gartner “Visionary” and “Champion”
©2017 Extreme Networks, Inc. All rights reserved
WWW.EXTREMENETWORKS.COM
Thank You