extractive institutions and gains from trade: evidence from colonial africa · 2014-06-17 ·...
TRANSCRIPT
Extractive Institutions and Gains From Trade:
Evidence from Colonial Africa∗
Federico Tadei
A common explanation for African current underdevelopment is the extractive character of institutions
established during the colonial period. Yet, since colonial extraction is hard to quantify and its exact mecha-
nisms are not well understood, we still do not know precisely how successful the colonizers were in extracting
wealth from Africans. In this paper, I tackle this issue by analyzing how trade monopsonies and coercive
labor institutions reduced African gains from trade during the colonial period. By using new data on prices to
agricultural producers in French Africa, I show that (1) the monopsonistic character of colonial trade implied
a reduction in prices to producers way below world market prices; (2) coercive labor institutions allowed
the colonizers to reduce prices even further; (3) as a consequence, colonial extraction cut African gains from
trade by over 60%.
∗California Institute of Technology, Division of Humanities and Social Science, 1200 E. California Blvd.,
Pasadena, CA 91125, USA. E-mail: [email protected]. I would like to thank Jean-Laurent Rosenthal, Erik
Snowberg, Matt Shum, Jean Ensminger, Phil Hoffman, Jonathan Chapman, and the participants to the
Caltech HSS Proseminar, Caltech Social Science-History Lunch, All-UC Economic History Workshop at UC
Berkeley, and UCLA Economic History Proseminar for their helpful comments.
I Introduction
Many leading hypotheses about current African underdevelopment emphasize the role of
colonialism. If the early literature underlined how colonial rule relegated Africa to exporter
of primary commodities (Rodney, 1972), more recent works have instead focused on the
long-term consequences of colonial extractive institutions (e.g. Acemoglu et al., 2001, 2002;
Englebert, 2000; Herbst, 2000; Nunn, 2007).1 Yet, to explain how colonial institutions affect
current development, we need to understand the extent of extraction during the colonial
period. Many of the institutions established by the colonizers were, in fact, maintained in
the post-independence period. Moreover, the extent to which they were extractive in the
colonial period affects how extractive they are after independence (Acemoglu et al., 2001;
Bates, 1981). However, since colonial extraction is hard to quantify and its exact mechanisms
are unclear, we still do not know precisely how successful the colonizers were in extracting
wealth from Africans.
This paper investigates this issue by exploiting the peculiar structure of labor and trade
policies employed by the French colonizers. The focus on trade in the French colonies offers
two main advantages for understanding the mechanisms of extraction in the colonial period.
First, because of the low population densities of French Africa and the high cost of labor rela-
tive to land, the colonizers faced there powerful incentives to use coercive labor institutions.2
Second, focusing on trade allows us to use price data in order to evaluate colonial extraction.
By using the gap between prices to African agricultural producers and world market prices
as a measure of extraction, I analyze how colonial trade monopsonies and coercive labor
institutions affected African gains from trade during the colonial period.
Because of limited data on colonial institutions and prices in Africa, this question has so
1Extractive institutions can be defined as those arrangements “designed to extract incomes and wealthfrom one subset of society [masses, African populations] to benefit a different subset [elite, colonizers]”(Acemoglu and Robinson, 2012).
2When coercion is a feasible option, a higher land/labor ratio might not translate into higher wages, butin an increase of coercion of labor (Domar, 1969). Fenske (2013) tests this hypothesis in the African contextshowing that lower population density is correlated to the extent of indigenous slavery.
1
far remained unanswered. On one hand, historians have collected information about colonial
institutions, but they have not attempted to systematically quantify the level of extraction.
On the other hand, economists have overlooked the temporal variation in colonial extraction,
increasing the risk of “compression of history” and making it difficult to understand how
extractive institutions persist over time (Austin, 2008).3
My first contribution then is to provide a new yearly dataset of labor institutions and
prices paid to African producers for the main commodities exported from each French colony
between 1898 and 1959. I collected the data on labor institutions from historical and ethno-
graphic studies and the data on prices from a variety of colonial publications, including, but
not limited to, statistical reports of the Ministry of the Colonies, customs statistics, and
Bulletins Economiques of the different colonies.
My second contribution is to use these data to understand how colonial extractive insti-
tutions affected African prices. The main difficulty in answering this question is that, since
extractive institutions were used in all colonies, we cannot observe colonial trade in absence
of extraction. However, since in a competitive market the prices to African producers should
be equal to the difference between world market prices and transport costs, we can use this
measure as a counter-factual.
Building on this insight, I proceed in three steps. First, I use my price dataset to check
whether colonial extraction (monopsony and coercive labor institutions) implied a reduction
in the prices to African producers. I show that the prices to Africans were reduced by about
30% with respect to what they would have been in absence of monopsonies and coercive
labor institutions. Moreover, the level of extraction varied substantially across the different
colonies and economic activities and decreased in the second half of the colonial period.
3Previous works by economists exploited spacial variation in some colonial policy or institution, observedin one point in time. Huillery (2009) studies the impact of colonial investments in education in French Africa.Gallego and Woodberry (2010) and Nunn (2010) analyze the effect of colonial missionary activity on schoolingand religious conversion. Michalopoulos and Papaioannou (2011) estimates the effect of arbitrary colonialborders on civil war. Berger (2009) studies the modern impact of colonial policies on public good provisionin Nigeria Cogneau and Moradi (2014) analyzes the effect of colonial policies on education and religion acrossthe border between the French and British partitions of Togoland.
2
Second, I use newly collected data on labor institutions to disentangle the effect of coer-
cive labor institutions on prices to producers from the effect of monopsony. I present evidence
that the level of coercion of labor affected the extent of price reduction. Prices to Africans
were reduced by 25% with respect to competitive prices if the colonizers used free peas-
ant production, but they were reduced by almost 40% for crops that were produced under
compulsory cultivations.
To make sure that the relationship between prices and institutions is not spurious, I need
to consider potential omitted variables. One candidate is the price elasticity of African supply.
The colonizers might have in fact established coercive institutions and offered lower prices in
colonies/crops where Africans responded less to price incentives. To account for this problem,
I exploit the panel structure of the data and the historical evidence on change in institutions.
Since the transition from compulsory to free production at the end of the colonial period was
affected more by the political climate before independence than by changes in elasticity of
supply, I can reduce the omitted variable bias by controlling for colony/commodity and year
fixed effects.
Finally, I construct lower bounds for the losses that monopsony and coercive labor insti-
tutions together implied for African welfare: on average, colonial extraction reduced African
gains from trade by over 60%. Moreover, by exploiting the insight of a simple model of
colonial trade under extractive institutions, I am able to disentangle the effects of monop-
sony from those of coercive labor institutions. I show that, when the latter were used, they
accounted for at least 60% of the total losses.
The paper is structured as follows. Section II provides some historical background about
French colonies in Sub-Saharan Africa, monopsonistic trading companies, and labor institu-
tions. Section III proposes a theoretical model of colonial trade under extractive institutions.
The following three sections test the implications of the model: Section IV explores the effect
of colonial extraction on prices to Africans, Section V focuses on the impact of coercive labor
institutions, and Section VI provides lower bounds for the reduction in the gains from trade
3
with respect to competition. Section VII offers concluding remarks and delineates directions
of future research.
II Historical Background
Most of the military conquest of French Africa occurred between 1880 and 1900. Towards the
end of 19th century there still existed some small pockets of resistance (Mauritania did not
fall under full French control until 1936), but the conditions were ready for the development
of the colonial system (Coquery-Vidrovitch, 1969; Suret-Canale, 1971).
The French government organized the colonies in two federations: French West Africa
(1895)—including Mauritania, Senegal, French Sudan (now Mali), Niger, Upper Volta (now
Burkina Faso), Guinea, Ivory Coast, and Dahomey (now Benin)—and French Equatorial
Africa (1908)—including Gabon, Congo, Ubangi-Shari (now Central African Republic), and
Chad. After WW1, part of Togo and almost all of Cameroon were added to the French
colonies in continental Sub-Saharan Africa (see Figure I).
The extension of French possessions was reflected in the heterogeneity of their natural
environment, including, from the coast towards the interior, tropical forests, savannas, and
arid-desertic regions. The coastal forestry regions were suitable to produce bananas, coffee,
cocoa, and rubber, while the drier interior areas were suitable for peanuts and cotton. In
general, Western colonies were more prosperous than Equatorial colonies and, with the ex-
ception of the peanut-producing areas of Senegal, coastal regions were usually wealthier with
respect to interior regions because of the higher value of their crops and lower transportation
costs (Hopkins, 1973).
Figure II shows the evolution of the total value of exports (in constant 1900 francs, evalu-
ated with prices in France) from French Africa between 1900 and 1960.4 Exports grew during
the entire colonial period, slowed down throughout the Great Depression, and increased dra-
matically after 1945. On average, peanuts accounted for the highest share of exports (about
4See Section IV.1 for details on the data.
4
30% of the total value), followed by rubber (about 18%), oil palm produces (15%), coffee,
cocoa, and timber (each of them accounting for about 10%). Cotton and bananas accounted
for the remaining exports. Ivory Coast, Senegal, and Cameroon were the richest colonies,
generating 28%, 21%, and 16% of the total value of exports, respectively.
Given the variety of environments and commodities, the colonizers structured economic
activity and trade in the colonies in different ways. In West Africa, exports were initially
based only on African peasant production. European trading companies limited themselves
to buying crops and reselling them at higher prices in Europe. After WWI, Europeans
began to enter the productive sector, establishing plantations (e.g. cocoa and coffee in Ivory
coast, bananas in Guinea) and exploiting forestry concessions. Mining was a minor activity.
In Equatorial Africa economic activity was initially organized on the basis of concessionary
companies with monopoly over given territories. African laborers were forced to collect crops,
especially rubber, for the concessionaires who employed harsh coercive methods. The abuses
of the concession system led to its termination in the 1920s, when trading companies on the
model of West Africa were established (Suret-Canale, 1971).
The French administration fixed the import prices in France by ministerial decree, fol-
lowing world market prices, and the prices to African producers, usually as a percentage of
the world market price. For example, cotton price paid to Ubangi-Shari farmers was 15% of
the average FOB price of cotton in New York (DeDampierre, 1960).
Whether the economic activity was organized through European companies or African
peasant agriculture, the French colonizers had incentives to reduce the cost of production in
order to increase profit. Thus, the colonial government tried to establish de iure or de facto
monopsonies for the trading and concessionary companies in order to reduce prices and wages
to Africans (Coquery-Vidrovitch, 1972; Manning, 1998; Suret-Canale, 1971; Thompson and
Adloff, 1957).
At the beginning of the 20th century, trade in the Senegal/Mali region was controlled by a
group of eight Bordeaux trading firms, while Guinea and Congo were in the hands of business
5
houses from Marseilles or Paris. Smaller traders were allowed a share of exports as long as
they respected the prices fixed by the main trading firms. After WWI, the de facto monop-
sony of these companies grew stronger: economic crises eliminated competition from smaller
companies, German business interests were canceled by the war, and protectionist measures
were taken against British trade. Protectionist policies were not applied everywhere and did
not completely eliminate non-French trade (especially in Guinea and Dahomey). Neverthe-
less, the number of the remaining trading firms became sufficiently small to allow agreement
and ban entry into the African market (Suret-Canale, 1971). As a result, at the begin-
ning of WWII, fewer than a dozen companies monopolized almost all of trade from French
West Africa and two French companies (Societe Commerciale de l’Ouest Africain, Compagnie
francaise de l’Afrique Occidentale) and a British one (Unilever) controlled between 50% and
90% of exports (Suret-Canale, 1971, p. 167).
In addition to establishing monopsony power for the trading companies, the colonizers
attempted to reduce price and wages to Africans by interfering with labor markets and
implementing coercive institutions.5 Since capital was relatively expensive, production relied
on labor-intensive methods. French Africa’s low population densities and abundant cultivable
land in the indigenous sector implied that African incentives to enter the wage labor force or
to produce cash crops were insufficient. For these reasons, the colonizers put in place specific
institutions such as compulsory African cultivations and various forms of forced labor in
European plantations. These institutions, by reducing the outside options of Africans, had
the goal to further increase the ability of the colonial governments to lower prices to producers.
Three main kind of institutions were used (free peasant production, compulsory peasant
production, and concession/forced labor production) and the type of coercive arrangements
available to the colonizers depended on whether agricultural production was African-based or
European-based. When the colonizers limited themselves to trade and production was left to
African peasants, the colonial governments could introduce compulsory peasant production.
5We can interpret these institutions as subsidies given by the colonial government to the European tradingand concessionary companies.
6
In this case, they set quotas of produce that Africans had to cultivate or gathered and sell
for a fix price to the colonizers. The most notable example of this institution were the cotton
quotas established by Felix Eboue in Ubangi-Shari in 1924 (DeDampierre, 1960). Under this
arrangement, every village had to produce amounts of cotton in proportion to its population
and sell it to trading companies with monopsony power over given territories. The costs for
the recruitment of cotton producers were borne by the colonial government, and payments
were often in the form of tax vouchers. Cotton quotas were abolished in 1956, just four years
before independence.
Alternatively, when the colonizers entered the productive sector, establishing concessions
and plantations, forced labor could be implemented. It took the direct form of labor taxes
and the indirect form of contract labor. With labor taxes, all males between 18 and 60 had
to contribute a certain number of days of unpaid labor (usually from 8 to 12 per year) to
whatever enterprise the administration assigned them. Labor taxes were used mostly for
porterage and public works, but not infrequently for private enterprises, especially in the
early days of the colonial period. They were finally abolished for both the private and public
sector in 1946 (Fall, 1993).6
Contract labor was a system of formal labor recruiting used mainly for private enterprises.
While not forced labor, it was far from a free market system. The most important figure
in this system was the labor recruiter who rounded up manpower in villages. Local chiefs
received payments for every man supplied and were therefore encouraged to cooperate with
the recruiter. The compulsory nature of this system decreased in the late 1930s, when freer
forms of recruitment started to appear.
In addition to these institutions, the colonizers also used indirect methods, such as poll
taxes.7 Introduced to raise the revenue of colonial governments, they also served the function
of forcing Africans to enter the wage labor force or to produce cash crops in order to earn the
6Other institutions such as labor drafts, convict labor, and military labor worked in a similar manner.7Given the low population densities, land alienation was a less attractive option to generate a labor force
than it was in East Africa.
7
money needed to pay taxes. In Equatorial Africa, for example, poll taxes were introduced in
1902 as a way to facilitate rubber collection for the concessionary companies.
However, coercive labor institutions were not implemented everywhere. When neither
compulsory cultivations nor forced labor were used, the prices or wages were still fixed by the
colonizers, but the African peasants could decide whether to work for the colonizers in the
case of European-based production or how much crop to produce in the case of African-based
production.
By exploiting newly collected data on labor arrangements, quantities, and prices in each
colony/commodity/ year (see Section IV.1 and V for details), I evaluate the importance
of the three main institutions: free peasant production, compulsory peasant production,
and concession/forced labor production. Table I reports the shares of the total value of
exports under the three institutions, from 1900 to 1960. Since the kind of institution may
have affected the prices paid to African producers, the value of exports is computed using
prices in France. Column (1) shows the shares of institutions considering the whole French
Africa for the entire colonial period. Free peasant production was used in the majority of
cases, accounting for almost 60% of the total value of exports; concession and compulsory
production followed with about 30% and 10% of the export value, respectively. Column
(2) presents the export share by institutions in West and Equatorial Africa. Free peasant
production was much more diffuse in West African colonies, where it accounted for almost
three fourths of exports in contrast with only one fourth of exports from Equatorial Africa. In
contrast, concession production and especially compulsory production were employed more
frequently in Equatorial Africa.
Given such a variety of labor arrangements, one might ask which factors affected the
kind of institutions that were implemented. Overall, the choice seems to be affected more by
factors related to the characteristics of crops, such as economies of scale and whether they
were indigenous or introduced by the colonizer, than to the characteristics of colonies, such
as settler mortality or population density. Simple crop fixed effects account in fact for a large
8
portion of the variance in institutions, while the explanatory power of colony fixed effects
is much lower. Table II shows that, in a simple regression of labor institution dummies on
crop, colony, and year fixed effects, crops explain 50% of the variation in institutions, while
colonies and years only 7% and 1%, respectively.8
Free peasant production was used for crops with limited economies of scale or those that
were already produced by Africans (peanuts, palm kernels, and cocoa in the late colonial
period). Compulsory peasant production was implemented for crops that were introduced by
colonizers for which Africans had not entered market production (cotton, wild rubber, and
cocoa in the early colonial period). Concession production with various forms of coercion
for African workers was used for commodities whose production needed large capital invest-
ments and was characterized by large economies of scale (bananas, coffee, timber, plantation
rubber).
Timber, peanuts, palm kernel, and bananas, which were almost always produced using
the same institutions across regions and periods, accounted for about 60% of the total value
of exports. Nevertheless, some variation in institutions existed across regions within the
same crop. Coffee was mostly produced with concessions in Equatorial Africa, while some
free peasant production was used in West Africa. Cotton was cultivated via compulsory
production in the Equatorial colonies, but with both compulsory production and concessions
in the Western colonies. Compulsory production was used for cocoa and rubber in Equatorial
Africa, while concessions and some free peasant production were employed in West Africa.
Over time, Africans started responding more to price incentives and, especially after
WWII, the political pressure to abolish coercive institutions increased. As a result, we
observe a transition towards free peasant production in most colonies and crops. At the
8We observe a strong correlation between crops and institutions. However, it is also possible that in-stitutions are assigned by exogenous administrative decisions and that the colonizers then choose the cropsthat are more suitable for those institutions. Nevertheless, if this were the case we should observe muchbigger colony fixed effects. Moreover, the historical evidence supports the view that crops affect institutions.For example, poll taxes were introduced in Equatorial Africa to facilitate the collection of rubber for theconcessionary companies and compulsory quotas were established in Ubangi-Shari in order to increase cottonproduction.
9
onset of independence, free peasant production accounted for almost 70% of the total value
of exports, with the remainder produced under concessions.
III A Model of Colonial Extraction
Although both economists and historians agree on the importance of colonial institutions, the
extent of extraction has been difficult to assess. How much did colonial extractive institutions
reduce African prices and gains from trade?
In order to answer this question, we need to identify the proper counterfactual. To do so,
I outline a simple model of colonial trade under monopsony and coercive labor institutions.
For the purpose of the model, institutions are treated as exogenous, and I will address the
issue of their origin in the empirical part of the paper.
There are two groups of actors: African Peasants and Trading Companies. The African
Peasants produce one crop and sell it to the Trading Companies. The Trading Companies
set the price to producers and resell the crop at the world market price in Europe.9 Given
the price to producers pA, the African Peasants produce the quantity Q in order to maximize
ΠA = pAQ − C(Q), where C(Q) is a convex cost function. The FOC implies that the
quantity is such that the marginal cost is equal to the price and the African supply function
is Q(pA) = MC−1(pA), where MC is the marginal cost function. Given this supply function,
the Trading Companies choose the price pA to maximize ΠC = (p − t − pA)Q(pA), where
p is the (exogenous) world market price and t are transportation costs. The price paid to
Africans varies according to the kind of institutions governing trade and production: perfect
competition among trading companies, simple monopsony, monopsony and coercive labor
institutions. Let us consider each of the three cases.
1. Perfect Competition
Suppose that there are (infinitely) many trading companies competing for African pro-
duction. If one company sets a price pA < p − t, then a second company might set
9The traded quantity from Africa is too small to affect world prices. See Table XI.
10
a higher price, buy the entire production, and still make a positive profit. The equi-
librium price to Africans is just the difference between price in Europe and transport
costs,
pA = p− t (1)
In this case, the profit of the Trading Companies is zero.
2. Simple Monopsony
Suppose that one Trading Company has the right to buy all African production. In
this case, the FOC for the Trading Company’s maximization problem implies
pA = p− t− Q(pA)
Q′(pA)(2)
Since both Q(pA) and Q′(pA) are positive, the price to Africans is lower under monop-
sony than under competition. In this case, the Trading Company makes a positive
profit.
3. Monopsony and Coercive Labor Institutions
Suppose that, in addition to monopsony, the Trading Company has access to coercive
labor institutions (various forms of forced labor and compulsory cultivations) in order to
force African Peasants to produce more than they would produce at any given price. We
can model African’s supply function under coercive institutions as Qc(pA) = Q(pA + c),
where c is the level of coercion. In this case, the FOC implies
pA = p− t− Q(pA + c)
Q′(pA + c)(3)
Since Q(.) is increasing and concave, Q(pA+c)Q′(pA+c)
> Q(pA)Q′(pA)
. Thus, the price under monop-
sony and coercive labor institutions is lower than the price under simple monopsony.
As a consequence, the profit of the Trading Company is higher in this last case.
11
Let us now consider the implications of these institutional arrangements for African gains
from trade.
• Simple Monopsony
Since the price under simple monopsony is lower than the price under competition, the
traded quantity will also be lower. African gains from trade are thus lower under simple
monopsony than under competition. Without coercive labor institutions the marginal
cost of each unit is always lower than the price, so Africans still get some gains from
trading, but less than if they were facing competition among trading firms.
• Monopsony and Coercive Labor Institutions
With coercive labor institutions, the price is lower than under simple monopsony. Given
the presence of coercion, the traded quantity is higher, but Africans will produce the
additional quantity at a cost higher to the price. For this reason, African gains from
trade are lower under monopsony and coercive labor institutions than under simple
monopsony. Moreover, notice that, because the Africans receive a price lower than the
marginal cost, they might be worse off with respect to not trading at all.
The model yields three predictions about the features of colonial extraction in French Africa:
1. Prices to Africans were lower than they would have been with competition.
2. They were further reduced with respect to monopsony prices by the presence of coercive
labor institutions.
3. Extractive institutions reduced African gains from trade.
In the rest of the paper, I will empirically test these results.
IV Result 1: Prices to Africans and Competitive Prices
In this section I explore the first result of the model, checking whether the prices to Africans
in the French colonies were lower than competitive prices.
12
IV.1 Data
To test this hypothesis, I use newly-collected data on prices in Africa, prices in France, and
transport costs. I focus on nine main commodities exported by French Africa: peanuts,
palm kernels and oil, cotton, cocoa, coffee, rubber, timber, and bananas. The commodities
included in the dataset account for 80% of the value of all exports from West and Equatorial
Africa during the whole colonial period.
Prices in Africa and Quantities Exported
Colonial customs statistics reported the total quantity and value for each exported com-
modity from each colony every year. These statistics were registered at the local customs
offices and then aggregated at the colony level. The reported values were usually official mar-
ket prices in Africa (valeurs mercuriales), established by decree by the General Governor of
the colonies on the basis of reports of local commissions of evaluation. After World World II,
the reported evaluations were often values of the commodities at the loading port, including
transportation costs to the port and exit taxes.10
Using these customs statistics, I collected data on prices in Africa and quantities exported
from each colony for nine main commodities between 1898 and 1959. I exploited numerous
yearly issues of different colonial publications, including, but not limited to, statistical reports
of the Ministry of Colonies, Bulletins Economiques of the various colonies, and Annuaire
Statiques of West and Equatorial Africa.11
Given the variety of the sources and the length of the period considered, the names of the
territorial units for which the custom statistics are reported change over time and sometimes
data are reported only for larger territorial units. To solve these issues, I first tracked the
variation in the names of colonies. Then, I assigned each commodity from a larger territorial
unit to the smallest territory (colony or group of colonies) that I could identify by excluding
10These values are a good proxy for the actual prices to producers: detailed data on prices to farmers,inland transport cost, and tariffs from the late 1950s show that, after controlling for transportations costs,differences in prices at African ports are almost exclusively due to differences in prices to producers. SeeTable III.
11See the appendix for more details on the sources.
13
those colonies which do not produce that specific commodity.12 I deflated all prices in 1900
French francs.13
Prices in France
I collected prices in France from various issues of the Statistiques Mensuelles du Commerce
Exterieur de la France, a monthly publication by the Direction Generale des Douanes report-
ing the total values and quantities of the commodities imported from the French colonies in
every year. As a control, I also used different issues of the Annuaire Statistiques de France
reporting similar information. I deflated all prices in 1900 French francs.
Not all exports from French Africa went to France. Nevertheless, given the importance of
the French market, using export prices in France is a good approximation. By 1949, France
was the destination of about 80% of the total exports originating from its African colonies
(Duignan and Gahan, 1975). Moreover, French prices are highly correlated with world market
prices, as shown in appendix A.1.
Transport costs
Since extensive data on transportation costs between Africa and France are not available,
I constructed estimates of shipping costs for each colony-commodity-year in my dataset
according to the following procedure. First, I computed the distance to Marseilles from
the closest African port for each colony.14 Then, I used data on average freight rates from
the West African coast to France for the main exports in 1938 to compute the average
shipping cost per km for each commodity in 1938.15 Finally, I multiplied this measure by
the distance to Marseilles for each colony (both West and Equatorial Africa) and by an
index of transportation costs between 1898 and 1959 with base 1938=1 from Mohammed
and Williamson (2004).16 In the empirical analysis, I will consider also inland transport
12For example, all cocoa exports 1898-1907 recorded as from French Congo (including Gabon and Congo)are assigned to Gabon because there was no registered cocoa production in Congo before 1927. Territorialunits involved are AEF, French Congo, AOF, and Senegal-Haut Senegal-Niger.
13Inflation data come from France-Inflation.com (2013).14The main ports are identified from the map reported at page 149 of Duignan and Gahan (1975). The
distance to Marseille is computed by using http://ports.com/sea-route.15Documents et statistiques - Ministere de la France d’Outremer, Service de statistique, 1949-52.16I used the global real freight rate deflated by commodity prices, from table 3 of the paper.
14
costs, by controlling by the distance of each colony to the coast.
Overall, the dataset includes 1717 observations (colony-commodity-year) and I have data
on prices in Africa, prices in France, and transportation costs for 1466 of them. The years cov-
ered are: 1898-1914, 1920-1951, 1953, 1956, 1958, and 1959. Table IV reports the summary
statistics.
IV.2 Empirical Strategy
Equations (2) and (3) imply that with perfect competition pA = p−t, while under monopsony
and coercive labor institutions pA = p − t − Q(pA+c)Q′(pA+c)
, where pA is the price to Africans, p is
the price in France, t is transport costs, and Q(.) is the African supply function. Defining
the elasticity of African supply with respect to the price as ε(pA) = Q′(pA + c) pAQ(pA+c)
, we
can rewrite the expression for the price to Africans under extractive institutions as17
pA =ε(pA)
1 + ε(pA)(p− t) (4)
We can thus test whether the prices to Africans were lower than they would have been with
competition by running the following regression
pA,cit = β(pct − tcit) + ucit (5)
where c refers to the commodity, i to the colony, t to time, and ucit is the error term. Under
the null hypothesis and no colonial extraction, β = 1.18
However, the estimation of β is likely to be inconsistent because transport costs t might
not include all of the costs that the trading companies had to face to export commodities
17Notice that as the elasticity of African supply increases the gap between price to Africans and price inFrance minus transport cost decreases. The colonizer offers higher prices to those colonies/commodities withhigher elasticity of supply.
18In equation (5) the coefficient β is equal to ε(pA)1+ε(pA) and thus it might depend on pA. This is not an
issue if we assume a supply function with constant elasticity of supply, such as the one originated from aCobb-Douglas production function with decreasing return of scale.
15
from Africa to France (e.g. loading and storage costs, taxes and tariffs, insurances). Suppose
that the true regression is pA,cit = β(pct− tcit− ccit) + εcit, where ccit represents other omitted
costs. Assume Cov(p, ε) = 0, Cov(t, ε) = 0, and Cov(c, ε) = 0. Standard results imply that,
estimating β by OLS from (5), plimβOLS = β(1− Cov(p,c)−Cov(t,c)V ar(p−t) ). If Cov(p, c)−Cov(t, c) > 0,
then the estimated coefficient is biased against the null hypothesis of no extraction.
Fixed transport costs (loading and unloading, warehousing, insurance, docking fees, etc.),
inland transport costs from the interior to the port, and taxes and tariffs in Africa and in
France are likely to be omitted costs. Even if it is reasonable to think that the correlation
of fixed and inland transport cost with t is positive (implying a potential bias in favor of
the null), the correlation between prices in France and omitted costs could also be positive,
leaving the direction of the bias ambiguous.
Suppose, for example, that the price of a commodity in France is equal to the price of
that commodity in a big supplier country plus fixed transport costs and shipping costs from
there to France. If fixed transport costs in this country are the same or correlated with
fixed transport costs in Africa, then Cov(p, c) > 0. Moreover, if transport costs depend on
some characteristics of commodities (perishability, stowage factors, etc.), inland and fixed
transport costs might be positively correlated and consequently also inland transport costs
and prices in France would be positively correlated. Finally, the colonizers might tax more
heavily commodities with higher values, implying again Cov(p, c) > 0.
To reduce the impact of omitted variables, I pursue two strategies. First, I control for
observables including proxies for fixed and inland transportation costs. Second, I control for
unobservables using fixed effects.
Controlling for observables
To control for fixed transport costs, I use the value of fixed transport costs estimated by
Maurer and Yu (2008, p.693) for the Panama Canal: 2.12 $ per ton in 1925 (3.12$ minus 1$
of Panama Canal tolls). Considering an exchange rate of 21 francs per $ in 1925 and deflating
in 1900 francs, this corresponds to 9.64 1900 francs per ton in 1925. I multiply this value by
16
the index in Mohammed and Williamson (2004) with base 1925 to get fixed transport costs
for every year. Notice that including this fixed cost measure might mean double-counting
fixed costs since they could be already included in my original shipping cost data.
To control for inland transport costs, for each colony I include in the regression the
average distance from the interior to the coast.19 Moreover, since the ratio volume/weight
is an important determinant of both fixed (loading and warehousing) and inland transport
costs, I also control for each commodity’s stowage factor.20
Controlling for unobservables
I model unobservable costs as ccit = kci+θt. The first component k captures the differences
in costs due to each commodity-colony; the second component θ captures the variation over
time, common to all commodities-colonies. This is a mild assumption: I allow unobservable
costs to vary across commodity-colony and time, just assuming a common trend over time in
all colonies and commodities. In the empirical specification, I implement this idea by using
commodity/colony and time fixed effects. In this way, the relationship between price in
France minus transport costs and price in Africa is identified exclusively from the variation
within each commodity/colony over time, after taking into account common time shocks
affecting all commodities and all colonies.
I estimate the following regression
pA,cit = β(pct − tcit − fcit) + (Xcitδ) + kci + θt + εcit (6)
where f is the proxy for fixed transport costs, X is a vector of control variables including
distance from the coast and commodity’s stowage factor (excluded when I include fixed
effects), and k and θ are commodity/colony and time fixed effects, respectively. If there is
no extraction, β = 1 (null hypothesis). If there is extraction, β < 1.
A last concern regards measurement errors in my estimation of shipping costs described
19GIS World Geography Datasets, Portland State University.20Source is http://www.cargohandbook.com.
17
in Section IV.1. Classic measurement error in t, in fact, would bias the coefficient β towards
zero, in favor of my hypothesis. To check whether this affects the results, I run an alternative
specification in which shipping costs are estimated directly from the data. To do so, I
exclude t from the regression and I control for the interaction of distance to France with
decade/commodity dummies.21 I run the following regression
pA,cit = α + β1(pct − fcit) +Wct ∗Diη + εcit (7)
where Wct is a matrix of decade by commodity fixed effects and Di is the distance from
France. Each element of the vector of coefficients η measures the shipping cost per km for
each commodity and decade.
IV.3 Results
Before presenting the results of the regressions, let me show some preliminary evidence by
comparing price gaps between Africa and France to those between US and UK. The idea is
that if the Africa-France price gap was larger than the price gap between the United States
and Britain, this would suggest that the difference between prices in Africa and in France
was not due exclusively to trading costs.
To check this, I collected yearly data on wholesale cotton prices in New York and Liverpool
between 1898 and 1938.22 Table V reports the percentage price gap in the two markets for
5-year periods. The results show that, on average, the percentage price difference between
France and the colonies was about 12 times higher than the difference between UK and US.
Given its magnitude, this result is unlikely to be driven by differences in shipping costs.
In the period under consideration, overall shipping costs from Africa to France were about 4
times higher than between US and UK.23 Since prices in Africa were about half of prices in
21If I interacted the distance with year/commodity dummies, I would have too many fixed effects and itwould be difficult to estimate precisely the parameters.
22My sources are the Historical Statistics of the United States (1975) and the Mitchell’s Abstract of BritishHistorical Statistics (1988).
23Costs per km are on average 3.4 times higher between Africa and France than between US and UK
18
the US, if the price gap was due only to shipping costs, then the Africa-France relative price
gap should have been only twice the US-UK price gap. Similarly, the result is not driven by
inland transport costs which accounted for a small portion of the total costs.24
Table VI presents the results of regression (6). Column (1) reports the simple regression
of price in Africa on the difference between price in France and shipping and fixed transport
costs: the coefficient is significantly less than 1 and we can reject the null hypothesis that
the price to Africans was just equal to the price in France minus trading costs.
In column (2) I control for other omitted costs, by including stowage factors and distance
to the coast. Since prices in Africa are measured at the export port after WWII, I only
include the distance from the coast for the years before 1945. The main result is unaffected.
In column (3) I control for unobservable costs, by using commodity/colony and year fixed
effects. Since fixed effects absorb all the variation in stowage factor and distance from the
coast, I exclude these control variables from this specification. The coefficient of interest is
still significantly less than 1.
The results of Table VI are unlikely to be driven by omitted costs. First, including fixed
effects, the R2 does not increase much: omitted costs are not a big determinant of the price
in Africa. Second, consider that the price in Africa is on average 55% of the price in France
and observable trading costs are about 5%: if the difference was just due to omitted costs,
unobservable costs should be 8 times the observable costs. Finally, consider also that the
ratio between origin FOB prices and destination CIF prices from the FAO Agricultural Trade
Database since 1960 is 89%, much larger than the 55% ratio observed in the French colonies.
In column (4) I run regression (7), where shipping costs are estimated directly from the
data. The coefficient of interest is again significantly less than 1. Moreover, since it is smaller
than in column (1), this suggests that the bias of the estimates in column (1) is against my
(Maurer and Yu, 2008, table 4). Conversion rates are from www.measuringworth.com.) The distance betweencotton producing French Africa to France (about 7300 km) is 15% higher that the distance from New Yorkto Liverpool (about 6400 km).
24According to the estimates of column (2) of table (VI), one standard deviation increase in distance fromthe coast makes the price to Africans decrease by only .03 standard deviations.
19
hypothesis. My estimates of transport costs are not affected by classic measurement errors
and they are likely to overestimate real transport costs.
The evidence shows that prices in Africa were lower than competitive prices. Was the
extent of price reduction common to all colonies and crops? To answer this question, I
constructed an index measuring how much the price to Africans under monopsony and coer-
cive labor institutions was reduced as a proportion of how much it should have been under
competition and free labor
E =pcompetitionA − pextractionA
pcompetitionA
=p− T − pAp− T
= 1 − pAp− T
(8)
where T includes shipping costs, fixed costs, and inland transport costs.25
On average, prices to Africans were reduced by about 30% because of colonial extraction.
Table VII reports the average index for the different commodities in West and Equatorial
colonies. The average reduction varied across commodities: the price was reduced by more
than 40% for rubber and timber, by 35-40% for cotton and bananas, by 25-30% for cocoa,
coffee, and peanuts; and by 20-25% for palm kernel and palm oil. Overall, the effects of
colonial extraction were more severe in Equatorial Africa (reduction of 37%) than in West
Africa (29%) and the difference was particularly large for palm kernel, coffee, palm oil, and
timber.
Figure III shows the proportional reduction of prices to Africans due to colonial extraction
over time, for an average commodity/colony. Excluding WWII, over time prices to Africans
approach competitive prices. Looking at the figure, we can observe that there was a change
around the middle of the colonial period: before 1930, the presence of monopsony reduced
prices to Africans by 30-50%; after 1930, instead, prices were reduced by only about 20%.
Overall, the evidence suggests that monopsonies and coercive labor institutions reduced
prices to African producers with respect to competitive prices. Moreover, we observe a large
25Since the trading costs T tend to be overestimated, the index is sometimes greater than 1 (if T > p)or less than 0 (if T > p − pA). In my analysis, I will therefore exclude all observations whose index is notbetween 0 and 1.
20
variation in the extent of price reduction across colonies and across commodities. Can labor
institutions explain this variation?
V Result 2: Labor Institutions and Prices to Africans
In this section, I explore the second result of the model. Did coercive labor institutions allow
the colonizers to reduce the prices even with respect to monopsony prices?
To test this hypothesis, I collected data about labor institutions in the French colonies of
West and Equatorial Africa between 1898 and 1959. Three main kinds of labor institutions
were used.
• Free peasant production: the colonizer fixed the prices, but the African peasants were
free to produce how much they wanted at the given price.
• Compulsory peasant production: the colonizer fixed both prices and compulsory quotas
of production that had to be met by the African peasants.
• Concession production: production was run by the colonizer who used various levels of
compulsion to get African labor force.
Historians and ethnographers have gathered information about the institutional arrangements
used in the production of different crops in the various colonies, in general works about French
colonization or country-specific studies. For example, Coquery-Vidrovitch (1972) wrote about
rubber quotas in Congo in 1910s, while Suret-Canale (1971) analyzed free peasant production
of peanuts in Senegal. By systematically extracting information from this literature, I was
able to associate one of the three labor institutions - free production, compulsory production,
or concession production - with each colony, commodity, and year.26
As shown in Section II, most of the variation in institutions was across crops: peanuts and
palms were mostly produced by free peasant production; cotton and rubber by compulsory
26See the appendix for the sources.
21
peasant production; timber, coffee, and bananas were usually produced in European conces-
sions. Equatorial colonies relied heavily on concessions and compulsory production, while in
West Africa free peasant production was more diffused. Over time, we observe a decrease in
the level of compulsion and an increase in the extent of free peasant production.
I start the analysis of the impact of extractive institutions on prices to Africans by treating
institutions as exogenous. I will address the endogeneity issue later in this section. To check
whether coercive labor institutions can explain price gaps, I regress the price to Africans on
institution dummy variables
pAcit = α + β1(COMPULSORY ) + β2(CONCESSION) + Zcitγ + η(p− T )cit + εcit (9)
where free peasant production is the omitted category, Zcit is a vector of control variables
(including elasticity of African supply and colony/commodity, and year fixed effects) and
(p− T )cit is the competitive price.
We expect β1 < 0: the prices should be lower under compulsory peasant production than
under free peasant production. Instead, we expect β2 > 0: the prices should be higher when
European companies run production than when production is run by African peasants. In
the case of concessions, in fact, since the profit from colonial trade has to be shared between
the trading and the concessionary company, the prices at African ports should be higher.
Notice that this does not necessarily mean that the level of extraction from African workers
is lower under concession production, but just that the export prices of commodities should
be higher with respect to peasant production.27
A potential concern with this approach is that the price elasticity of African supply might
have affected both prices and institutions. The colonizer might have, in fact, given lower
prices to those colonies/commodities that responded less to price incentives (low elasticity of
27We can write a similar model to that of section III in which: 1) Africans choose the number of workersL to maximize wL− c(L), where w is the wage and c(L) convex is the outside option; 2) the concessionarycompany chooses w to maximize pAf(L(w)) − wL, where f(.) is the production function; 3) the tradingcompanies chooses the price pA to pay to the concessionary company.
22
supply). At the same time, the colonizer might have needed to establish coercive institutions
to stimulate production where Africans responded less to price incentive. If this was the case,
the coefficient β1 would be biased in favor of my hypothesis and the negative relationship
between compulsory production and prices would be spurious.
To solve this problem, I use two strategies. As a first strategy, I exploit the model
FOC to directly compute the elasticity of supply ε(pA) = Q′(pA) pAQ(pA)
for the different
colonies/crops/years. We have data on prices pA and quantities Q, but we have no mea-
sure of the derivative of African supply with respect to price Q′(pA). Nevertheless, the FOC
for the Trading Company’s maximization problem implies pA = p − t − Q(pA)Q′(pA)
that we can
rewrite as Q′(pA) = Q(pA)p−t−pA
. Thus, we can express the elasticity of supply as a function of
only known variables as ε(pA) = pAp−t−pA
.28
Using this measure, I can check whether the elasticity of supply affects institutions and
prices. I first regress the free peasant dummy on the elasticity of supply with a probit
model. I omit concession production observations, so that the coefficient measures the effect
of elasticity on the probability of using free vs. compulsory peasant production. Column
(1) of Table VIII shows the results: the coefficient of elasticity of supply is positive, but the
marginal effect is very small.
I then check whether elasticity affects prices, by regressing price to Africans on elastic-
ity and controlling for competitive prices. The results are reported in column (2). The
coefficient of elasticity of supply is non-significant. We get similar results if we control for
colony/commodity and year fixed effects. Notice that since my expression of elasticity is
a positive function of the price to Africans pA, the estimate of the coefficients tends to be
biased away from zero: the real impact of elasticity on prices is even smaller.
This provides evidence that African elasticity of supply was not an important determinant
of prices or institutions. Thus, the omitted variable problem is not very serious.
As a second strategy, I estimate regression (9) with colony/commodity and year fixed
28Since transport costs tend to be overestimated, for some observations p− t− pA < 0 and the estimatedelasticity is negative. I omit these observations for all the subsequent analyses involving elasticities.
23
effects: the relationship between institutions and prices is identified by variations within the
same commodity and the same colony over time, taking into account common time shocks.29
Intuitively, this is a solution if the change in institutions within each colony/crop over time
did not depend on changes in the elasticity of supply. Both the results of Table VIII and the
historical evidence support this view: the transition from compulsory to free production was
common to almost all colonies/crops at the end of the colonial period and it was more likely
to reflect the political climate before independence (taken into account by year fixed effects)
than changes in elasticity of supply.
Table IX reports the estimates of regression (9). In column (1) I regress price in Africa
on institution dummies, competitive price, and fixed effects. The coefficient of compulsory
production is negative and significant: within each commodity/colony a change over time
from free to compulsory peasant production was associated with a decrease in prices. The
coefficient of concession production is positive and significant: the prices at African ports
were higher under concession production than under free peasant production. This provides
further evidence that institutions are important: the pressure to reduce prices in Africa
was lower when production was based on European concessions instead of African peasant
production.
In column (2) I control directly for the elasticity of supply. As expected, the coefficient
of elasticity is positive, but not significant, and the main result remains unchanged. In
column (3) I control for another potential determinant of prices, the size of the market, by
including the total quantity produced as a control variable. The effect of larger markets is
not significant the coefficients on institutions are not affected.
The use of compulsory production allowed the colonizers to reduce the prices to Africans
even with respect to monopsony prices. The effect of institutions on prices is not only
statistically significant, but also economically meaningful. Considering that the average
29The crops/colonies that experienced variations over time from compulsory cultivations to free peasantproduction are: all cotton producing colonies; cocoa in Congo and Gabon; rubber in Cameroon, Congo,Gabon, and Ubangi-Shari. Most changes in institutions happened in the post-WWII period.
24
price in Africa for free peasant production is .37 francs per kg, a change in institutions from
free to compulsory production implies an average reduction in prices by about 45%.
The evidence shows that the type of institutions put in place by the colonizers affected the
price received by African producers. Prices were lower than what they would have been with
competition between trading companies and coercive labor institutions allowed the colonizers
to reduce prices even further. Using these results, I can now ask how much monopsonies and
coercive labor institutions reduced African gains from trade.
VI Result 3: Colonial Extraction and Gains from Trade
In this section, I explore the third claim of the model: colonial extraction reduced African
gains from trade. The idea is to measure gains from trade as the surplus of African producers,
computed as the difference between price received and cost of production, times quantity
produced. Using an insight from the theory, I construct lower bounds for the reduction of
gains from trade due to colonial extraction and I disentangle how much of this reduction was
due to monopsonies and how much was due to labor institutions.
Figure IV describes the loss of gains from trade under the different institutional arrange-
ments. Subscripts C, M , and ME denote competition, monopsony, and monopsony with
extractive labor institutions, respectively. Taking competition as a benchmark, area 1 is the
African loss due to monopsony. The sum of areas 1, 2, 3, 4 is the loss due to monopsony and
extractive labor institutions (areas 1 and 2 are the loss due to the reduction in price; areas 3
and 4 are the loss due to receiving a price lower than the marginal cost). The sum of areas 1,
2, 3, and 4 is slightly larger than (pC − pME)QME, which can be computed as a lower bound
for the absolute loss.
We can also construct a lower bound for the relative loss. Since the supply function is
convex and Q > 1, the African gains from trade under competition is less than 12pCQME. A
25
lower bound for the relative loss is then (pC−pME)QME12pCQME
, that is30
L = 2(1 − pME
pC) (10)
Notice that this lower bound for the relative loss is equal to twice the price gap index, defined
in equation (8), where pA = pME and p− T = pC .
Table X presents the results. On average, Africans lost at least 65% of the possible gains
from competitive trade due to colonial extraction (including monopsonies and extractive
institutions). It is important to remember that exports to Europe accounted for a large part
of African income, while imports from Africa accounted for a relatively small proportion of
French GDP. Given the volume of trade, colonial extraction implied small gains for Europeans
at a cost of big losses for Africans.
Column (1) reports the reduction in gains from trade for the different commodities: the
reductions were particularly high for rubber and timber (at least 85% of the gains), at least
70% for cotton and bananas, at least 50% for coffee, peanuts, and cocoa, and at least 40%
for palm kernel and oil. Notice that the crops produced under free peasant production, such
as peanuts and oil palm produces, suffered the minor losses of gains from trade.
Columns (2A) and (2B) report the lower bounds for the periods before and after 1930.31
On average, the losses due to extraction were lower in the second part of the colonial period
(at least 47% vs. at least 73%). This change involved all commodities, with the exception of
bananas and only marginally rubber. Again, this is evidence of the importance of institutions:
in the second half of the colonial period coercive labor institutions started to disappear and
African prices increased.
Column (3A) and (3B) compare West and Equatorial Africa. For almost all commodities,
30The underling assumption to construct this lower bound is that the quantity produced under monopsonyand extractive institutions is higher than the quantity produced under competition. If this was not true, thenthe loss would be lower than areas 1, 2, 3, and 4. The historical evidence, however, is consistent with thisassumption: one of the reasons why the colonizers introduced extractive institutions was in fact to increaseAfrican production.
31Since price gaps were anomaly higher during WWII, I exclude the years 1939-1945 from the computationsin column (2B).
26
the Equatorial colonies, characterized by the presence of more coercive labor institutions, lost
more from colonial extraction than Western colonies (on average, at least 74% vs. at least
58%).
To disentangle the effects of coercive labor institutions from those of monopsony, notice
that area 1 of Figure IV represents the loss of gains from trade due to monopsony, while areas
2, 3, and 4 represent the loss due to coercive labor institutions. Thus, we can construct an
upper bound for the absolute loss due to monopsony as (pC − pM)QME. The upper bound
for the share of loss due to monopsony is then pC−pMpC−pME
. By consequence, coercive labor
institutions account for at least
1 − pC − pMpC − pME
(11)
of the total loss due to extraction.
To compute this measure, we need data on pME, pC , and pM . We have direct measures
for the price under monopsony and coercive labor institutions pME and we can compute the
price under competition pC as the difference between prices in France and trading costs, but
we do not observe the price under simple monopsony pM for all observations.
To solve this problem, I use the results from the regression of prices on institutions
(Table IX), where the coefficient β of the compulsory production dummy measures the effect
of coercive labor institutions on prices (difference between pME and pM). Using the estimate
of β, I can compute the price under simple monopsony as pM = pME + β.
Disentangling the effects of monopsony and coercive labor institutions, I estimate that
the upper bound for the share of loss due to monopsony was on average (for all compul-
sory production observations) 37%. Thus, when coercive labor institutions were used, they
accounted for at least 63% of the losses in gains from trade.
VII Conclusions
Extractive colonial institutions are considered one of the main causes of current African
underdevelopment (Acemoglu et al., 2001; Nunn, 2007). Yet, since colonial extraction is
27
hard to quantify and its precise mechanisms are not well understood, we still do not know
exactly how successful the colonizers were in extracting wealth from Africans.
In this paper, I investigated this issue by exploiting the peculiar structure of trade and
labor employed by the French colonizers. By using a new dataset of prices in Africa and
labor institutions, I showed that the colonizers were very successful in extracting income
from Africans and that they were able to do so by reducing the prices to producers through
a combination of trading monopsonies and coercive labor institutions. Without extractive
institutions, colonial trade should have raised income for African populations. However,
the lack of competition between trading firms and the presence of coercion of labor forced
Africans to accept prices lower than their marginal cost of production, thus reducing their
welfare. My estimates show that colonial extractive institutions reduced African gains from
trade by at least 60%.
Having clarified the mechanisms and the extent of extraction during the colonial period,
the next step is to understand the details of the impact of colonial extractive institutions
on current economic development. The level of extraction, in fact, varied greatly across
colonies and across crops and this variation can help explaining the different paths of growth
in African countries and regions. Moreover, there are reasons to believe that the extractive
character of colonial institutions persisted after independence. Preliminary results in ap-
pendix A.2 show that the price gap between prices in Africa and in France is still large in
the post-independence period. Coercive labor institutions were abolished by independence,
but trading monopsonies persisted and post-independence governments kept practicing price
policies that discriminated against agricultural producers (Bates and Block, 2009). Our
clearer understanding of extraction during colonialism calls now for future research aimed at
examining how institutions established in colonial times still affect current agricultural trade
policies and economic development.
28
A Appendix
A.1 Prices in France and World Market Prices
One of the assumptions of the model is that prices in France are exogenous and follow world
market prices. In this section, I provide evidence in favor of this assumption by comparing
prices in France to prices in Great Britain.
To do so, I use British commodity prices collected by Jacks et al. (2011) from various
yearly statistical publications, such as Sauerbeck’s Prices of Commodities and The Statist’s
Wholesale Prices of Commodities.32 Since the prices are reported in different units (shillings
per hundredweight, pence per pound, shillings per timber load), I convert all in pounds per
kg.33 Then, I use the exchange rates dollar-sterling and dollar-franc reported by Officer
(2013) to convert all prices in francs per kg.
The commodities for which I have both prices in France and in Great Britain are: coffee,
cotton, palm oil, and timber.34 Because exchange rates are available only since 1913 and the
WWII and post-war periods are characterized by strong appreciation and then depreciation
of the franc, I focus my analysis on the period 1913-1940.
Figure VI compares British and French prices between 1913 and 1940 for the four com-
modities. For all of them, British and French prices follow the same trend: the data for
French prices are closely tied to world market prices.
A.2 Post-Independence Prices
In this section, I explore preliminary data on prices in Africa and in France after indepen-
dence. I collected the data from the FAO Trade Statistics Database (2013), reporting yearly
CIF and FOB prices by country and commodity since 1961.
Figure VII reports the joint evolution of prices for four commodities: cocoa, coffee, cotton,
32http://www.sfu.ca/ djacks/data/publications.33The conversion rates used are: 20 shillings per 1 sterling; 50 kg per hundredweight; 1 timber load=50
cubic feet= 1.4 cubic meters=1.12 tons.34British coffee is Brazilian from Rio; cotton is American-middling.
29
and peanuts. The price in Africa is the average of prices of all ex-colonies producing that
commodity. The price in France is the CIF import price. All prices are in dollars per kg.
The gap between prices in Africa and in France is small right after independence, but, with
the exception of cotton, gets larger since the 1970s.
Figure VIII shows the price in Africa as a percentage of the price in France for cotton,
between 1900 and 2010.35 I choose cotton because it is one of the commodities for which
colonial institutions were more extractive. The general trend is increasing and the ratio of
prices is higher after independence. Interestingly, prices in Africa catch up with prices in
France already after WWII.
A.3 Data Sources
This section describes in detail the sources of the data on prices, quantities, and institutions.
Prices in Africa and Quantities. Prices are in 1900 French francs per kg. I obtain
them by diving the total value by the total quantity of exports. Quantities are in tons.
Cocoa and coffe are in grains; peanuts can be shelled or unshelled; cotton is ginned. Timber
quantities are sometimes reported in cubic meters or steres and I convert them into tons by
using the average specific weight of timber (0.8 tons per cubic meter).
Values in Africa are either in French francs or in francs CFA (franc des Colonies francaises
d’Afrique). The conversion rate is 1 franc CFA=1 FF before 1946, =1.7 FF between 1946
and 1948, =2 FF after 1949. Exchange rates between francs, pounds, and dollars come from
Officer (2013). To deflate prices in 1900 FF, I use data from France-Inflation.com, reporting
inflation rates since 1901. For 1898-1900, I assume the same inflation as in 1901.
The sources are: Statistiques coloniales. Commerce volumes from 1898 to 1906; Statis-
tiques du commerce des colonies francaises, volumes from 1907 to 1914 (excluding 1908);
Reinsegnements generaux sur le commerce des colonies francaises et la navigation volumes
from 1920 to 1928; Bulletin Economique de l’Afrique Equatoriale francaise, volumes from
35The price in Africa is the average price of all cotton producing colonies, excluding five years for whichthe price in Africa was higher than the price in France.
30
1931 to 1936; Bulletin mensuel de l’Agence economique de l’Afrique Occidentale Francaise,
volumes from 1930 to 1939; Bulletin mensuel d’information. Cameroun, Togo, volumes from
1933 to 1937; Annuaire statistique de France 1935 ; Annuaire Statistique de l’AOF, 1933-
38 ; Chambre de Commerce du Cameroun. Statistiques Commerciales 1935-37 ; Statistique
du Commerce Exterieur de l’AEF, 1936-47 ; Annuaire Statistique du Cameroun, 1938-45 ;
Annuaire Statistique de l’AOF et du Togo volumes 1949 and 1950-54; Annuaire Statistique
de l’AEF volumes 1936-50 and 1951-55; Bulletin de la Statistique Generale de l’AOF, 1956 ;
Bulletin Statistique Mensuel du Togo, 1957 ; Bulletin Mensuel Statistique et Economique
1959-60 ; Ministere de la France d’Outremer. Documents et Statistiques, 1949-67 .36
For some colonies and years, sources are not available. In particular: 1922, 1929-32, 1939-
55, 1957 for Togo; 1922-23, 1929-31, 1946-57 for Cameroon; 1908, 1915-19, 1931, 1939-55,
1957 for West Africa colonies; 1908, 1915-19, 1937-50 (at colony level), 1953-57 for Equatorial
Africa colonies.
Prices in France. In 1900 French francs per kg. I obtain them by dividing the total value
by the total quantity of imports to France from the colonies. The sources are Statistiques du
commerce exterieur de la France, volumes from 1902 to 1959.
Labor Institutions. The main sources are: Berg (1965), Coquery-Vidrovitch (1972),
Cordell and Gregory (1982), DeDampierre (1960), Duignan and Gahan (1975), Fall (1993),
Gray and Ngolet (1999), Hopkins (1973), Suret-Canale (1971), Thompson and Adloff (1957),
and the Cambridge History of Africa (1986). An appendix with the specific sources for each
colony/crop is available from the author.
36Details about the sources used for each specific colony, commodity, and year are available upon request.
31
References
D. Acemoglu and J. Robinson. Why Nations Fail: The Origins of Power, Prosperity, and Poverty.
Crown Publishing Group, 2012.
D. Acemoglu, S. Johnson, and J. Robinson. The colonial origins of comparative development: An
empirical investigation. American Economic Review, 91:1369–1401, 2001.
D. Acemoglu, S. Johnson, and J. Robinson. Reversal of fortune: Geography and institutions in
the making of the modern world income distribution. Quarterly Journal of Economics, 117:
1232–1294, 2002.
G. Austin. The “reversal of fortune” thesis and the compression of history: Perspectives from
African and comparative economic history. Journal of International Development, 20:996–1027,
2008.
R. Bates. Markets and States in Tropical Africa: The Political Basis of Agricultural Policies.
University of California Press, 1981.
R. Bates and S. Block. Political economy of agricultural trade interventions in Africa. Agricultural
Distortions Working Paper, 87, 2009.
E. J. Berg. The development of a labor force in Sub-saharan Africa. Economic Development and
Cultural Change, 13(4):394–412, 1965.
D. Berger. Taxes, institutions, and local government: evidence from a natural experiment in colonial
Nigeria. Working Paper, 2009.
Cameroun. Statistiques Commerciales. Chambre de Commerce du Cameroun, 1935-37.
Cameroun. Annuaire statistique du Cameroun, v.1, 1938/45. Service de la statistique generale,
1947.
D. Cogneau and A. Moradi. Borders that divide: Education and religion in Ghana and Togo since
colonial times. Journal of Economic History, forthcoming, 2014.
32
C. Coquery-Vidrovitch. Colonialism in Africa, 1870-1970, vol. 1, chapter French Colonization in
Africa to 1920: administration and economic development, pages 165–198. Cambridge University
Press, 1969.
C. Coquery-Vidrovitch. Le Congo au temps des grandes compagnies concessionnaires, 1898-1930.
Mouton De Gruyter, 1972.
D. Cordell and J. W. Gregory. Labour reservoirs and population: French colonial strategies in
Koudougou, Upper Volta, 1914 to 1939. Journal of African History, 23(2):205–224, 1982.
E. DeDampierre. Coton noir, cafe blanc. Deux cultures du Haut-Oubangui a la veille de la loi-cadre.
Cahiers d’etudes africaines, 1(2):128–147, 1960.
E. Domar. The causes of slavery: a hypothesis. Journal of Economic History, 30:18–32, 1969.
P. Duignan and L. H. Gahan. Colonialism in Africa, 1870-1960. Cambridge University Press, 1975.
P. Englebert. Pre-colonial institutions, post-colonial states, and economic development in tropical
Africa. Political Research Quarterly, 53:7 36, 2000.
J.D. Fage and R. Olivier. The Cambridge history of Africa. Cambridge University Press, 1986.
B. Fall. Le travail force en AOF, 1900-1946. KARTHALA Editions, 1993.
FAO. Faostat trade database, 2013. URL http://faostat.fao.org/.
J. Fenske. Does land abundance explain African institutions? Economic Journal, 123:1363–1390,
2013.
France. Statistiques coloniales. Commerce. Ministere des Colonies. Office Colonial, 1898-1906.
France. Statistiques du commerce exterieur de la France. Direction generale des douanes et droits
indirects, 1902-1959.
France. Statistiques du commerce de colonies Francaises. Ministere des Colonies. Office Colonial,
1909-1914.
33
France. Reinsegnements generaux sur le commerce des colonies Francaises. Documents statistiques
sur les principaux produits exportes. Ministere des Colonies. Office Colonial, 1920-28.
France. Annuaire Statistique de France. Statistique generale, 1935.
France. Statistiques du Commerce Exterieur de l’AEF, 1936-47. Ministere de la France d’Outremer,
1948.
France. Documents et Statistiques, 1949-1967. Ministere de la France d’ Outremer, 1967.
France-Inflation.com, 2012. URL http://france-inflation.com/.
French Equatorial Africa. Annuaire Statistique de l’AEF, vol. 1936-50 and 1951-55. Service de la
statistique generale.
French Equatorial Africa. Bulletin economique de l’Afrique Equatoriale Francaise. Gouvernement
general de l’Afrique Equatoriale Francaise, 1931-36.
French West Africa. Bulletin de la Statistique Generale de l’AOF, 1946-1956. Service de la statis-
tique generale.
French West Africa. Bulletin mensuel. Agence economique du Gouvernement general de l’Afrique
occidentale francaise, 1930-39.
French West Africa. Annuaire Statistique de l’Afrique Occidentale Francaise. Service de la statis-
tique generale, 1933-38.
French West Africa. Annuaire Statistique de l’Afrique Occidentale Francaise, 1950-54. Service de
la statistique generale, 1955.
French West Africa. Bulletin statistique et economique mensuel. Service de la statistique generale,
1959-60.
F. Gallego and R. Woodberry. Christian missionaries and education in former colonies: How
competition mattered. Journal of African Economies, 19(3):294–329, 2010.
34
C. Gray and F. Ngolet. Lambarene, okoume and the transformation of labor along the Middle
Ogooue (Gabon), 1870-1945. Journal of African History, 40:87–107, 1999.
J. Herbst. States and Power in Africa: Comparative Lessons in Authority and Control. Princeton
University Press, 2000.
A. G. Hopkins. An economic history of West Africa. Columbia University Press, 1973.
E. Huillery. History matters: The long term impact of colonial public investments in French West
Africa. American Economic Journal - Applied Economics, 1(2):176–215, 2009.
D. Jacks, K. ORourke, and J. Williamson. Commodity price volatility and world market integration
since 1700. Review of Economics and Statistics, 93(3):800–813, 2011.
P. Manning. Francophone Sub-Saharan Africa 1880-1995. Cambridge University Press, 1998.
N. Maurer and C. Yu. What T. R. took: The economic impact of the Panama canal, 1903-1937.
Journal of Economic History, 68(3):686–721, 2008.
S. Michalopoulos and E. Papaioannou. The long-run effects of the scramble for Africa. Working
Paper, 2011.
B. Mitchell. Abstract of British Historical Statistics. Cambridge University Press, 1988.
S. Mohammed and J. Williamson. Freight rates and productivity gains in British tramp shipping
1869-1950. Explorations in Economic History, 41(2):172–203, 2004.
N. Nunn. Historical legacies: A model linking Africa’s past to its current underdevelopment. Journal
of Development Economics, 83:157–175, 2007.
N. Nunn. Religious conversion in colonial Africa. American Economic Review Papers and Proceed-
ings, 100(2):147–152, 2010.
L. H. Officer. Exchange rates between the United States dollar and forty-one currencies. Measur-
ingWorth, URL: http://www.measuringworth.com/exchangeglobal/, 2013.
W. Rodney. How Europe Underdeveloped Africa. Bogle-L’Ouverture Publications, 1972.
35
J. Suret-Canale. French colonialism in tropical Africa, 1900-1945. Pica Press, 1971.
V. Thompson and R. Adloff. French West Africa. Stanford University Press, 1957.
Togo. Bulletin Statistique Mensuel. Service de la statistique generale, 1957.
Togo-Cameroun. Bulletin mensuel d’information. Agence economique des territoires africains sous
mandat, 1933-37.
United States. Historical Statistics of the United States, Colonial Times to 1970. Bureau of the
Census, 1975.
36
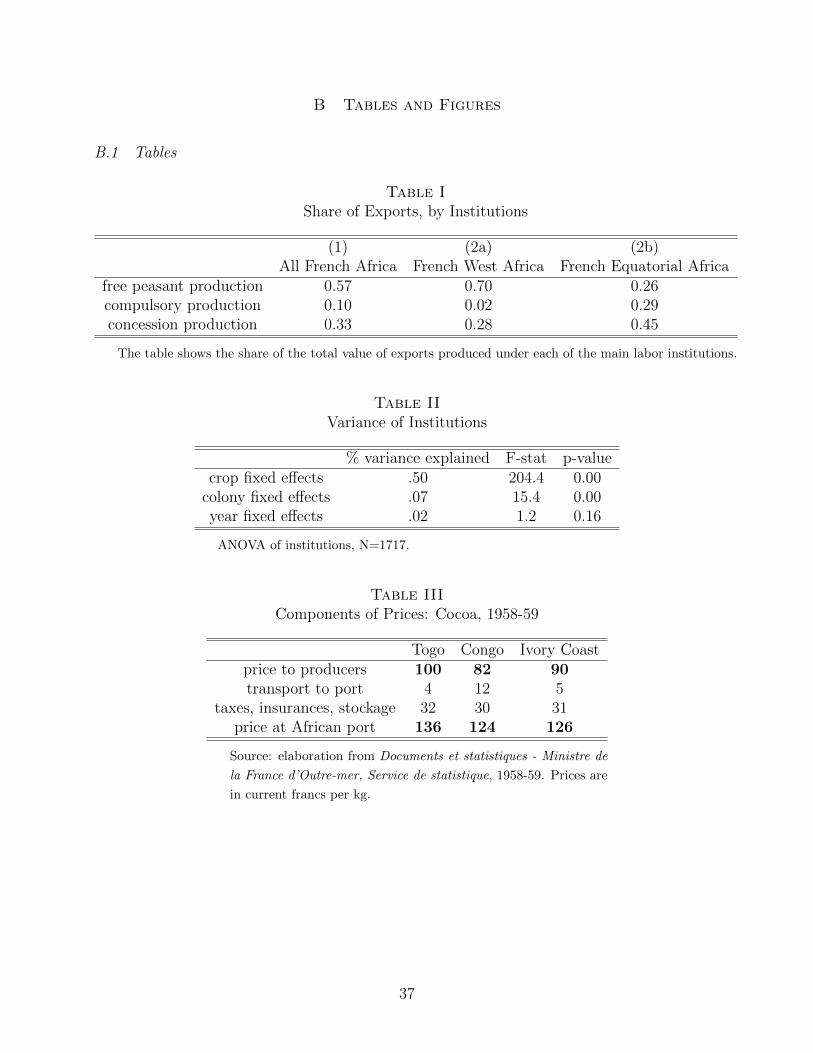
B Tables and Figures
B.1 Tables
Table IShare of Exports, by Institutions
(1) (2a) (2b)All French Africa French West Africa French Equatorial Africa
free peasant production 0.57 0.70 0.26compulsory production 0.10 0.02 0.29concession production 0.33 0.28 0.45
The table shows the share of the total value of exports produced under each of the main labor institutions.
Table IIVariance of Institutions
% variance explained F-stat p-valuecrop fixed effects .50 204.4 0.00
colony fixed effects .07 15.4 0.00year fixed effects .02 1.2 0.16
ANOVA of institutions, N=1717.
Table IIIComponents of Prices: Cocoa, 1958-59
Togo Congo Ivory Coastprice to producers 100 82 90transport to port 4 12 5
taxes, insurances, stockage 32 30 31price at African port 136 124 126
Source: elaboration from Documents et statistiques - Ministre de
la France d’Outre-mer, Service de statistique, 1958-59. Prices are
in current francs per kg.
37
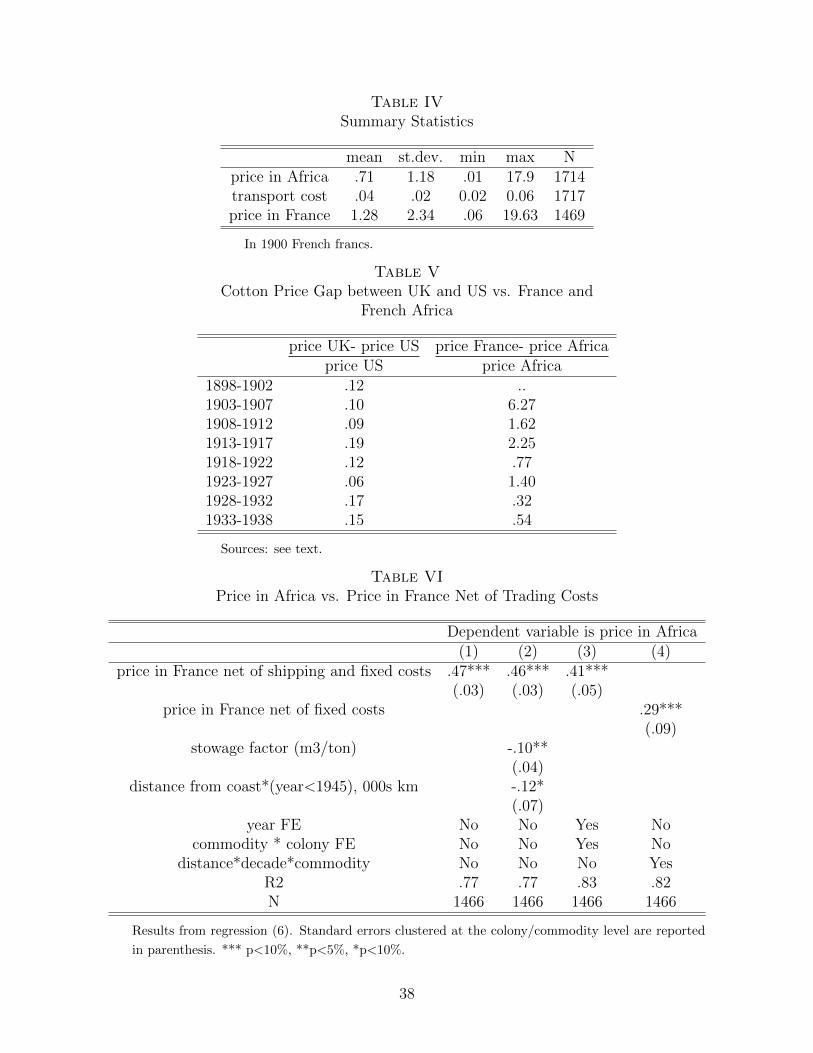
Table IVSummary Statistics
mean st.dev. min max Nprice in Africa .71 1.18 .01 17.9 1714transport cost .04 .02 0.02 0.06 1717price in France 1.28 2.34 .06 19.63 1469
In 1900 French francs.
Table VCotton Price Gap between UK and US vs. France and
French Africa
price UK- price US price France- price Africaprice US price Africa
1898-1902 .12 ..1903-1907 .10 6.271908-1912 .09 1.621913-1917 .19 2.251918-1922 .12 .771923-1927 .06 1.401928-1932 .17 .321933-1938 .15 .54
Sources: see text.
Table VIPrice in Africa vs. Price in France Net of Trading Costs
Dependent variable is price in Africa(1) (2) (3) (4)
price in France net of shipping and fixed costs .47*** .46*** .41***(.03) (.03) (.05)
price in France net of fixed costs .29***(.09)
stowage factor (m3/ton) -.10**(.04)
distance from coast*(year<1945), 000s km -.12*(.07)
year FE No No Yes Nocommodity * colony FE No No Yes No
distance*decade*commodity No No No YesR2 .77 .77 .83 .82N 1466 1466 1466 1466
Results from regression (6). Standard errors clustered at the colony/commodity level are reported
in parenthesis. *** p<10%, **p<5%, *p<10%.
38
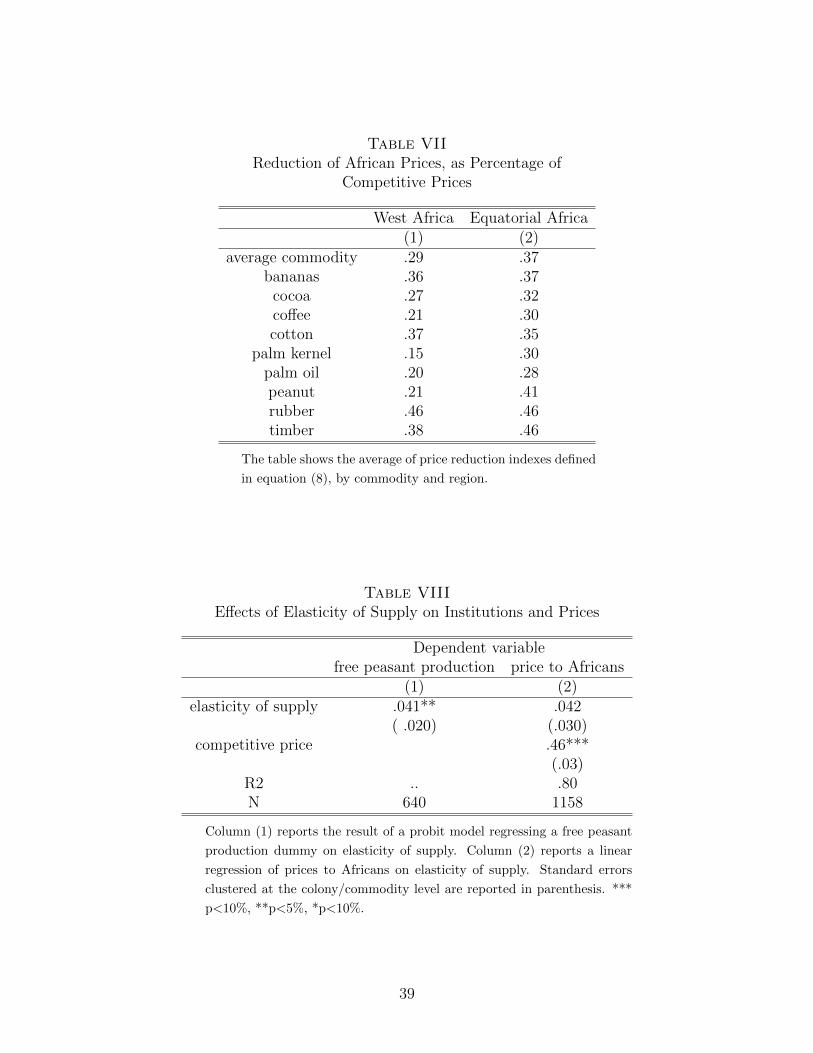
Table VIIReduction of African Prices, as Percentage of
Competitive Prices
West Africa Equatorial Africa(1) (2)
average commodity .29 .37bananas .36 .37
cocoa .27 .32coffee .21 .30cotton .37 .35
palm kernel .15 .30palm oil .20 .28peanut .21 .41rubber .46 .46timber .38 .46
The table shows the average of price reduction indexes defined
in equation (8), by commodity and region.
Table VIIIEffects of Elasticity of Supply on Institutions and Prices
Dependent variablefree peasant production price to Africans
(1) (2)elasticity of supply .041** .042
( .020) (.030)competitive price .46***
(.03)R2 .. .80N 640 1158
Column (1) reports the result of a probit model regressing a free peasant
production dummy on elasticity of supply. Column (2) reports a linear
regression of prices to Africans on elasticity of supply. Standard errors
clustered at the colony/commodity level are reported in parenthesis. ***
p<10%, **p<5%, *p<10%.
39
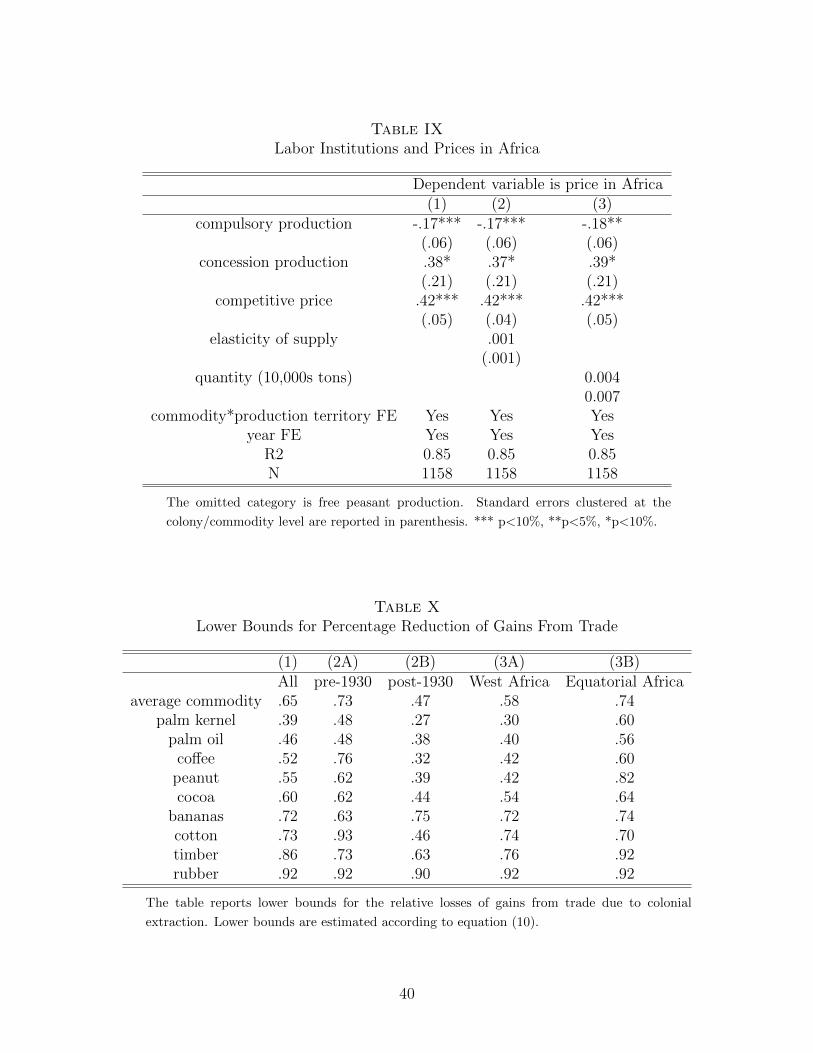
Table IXLabor Institutions and Prices in Africa
Dependent variable is price in Africa(1) (2) (3)
compulsory production -.17*** -.17*** -.18**(.06) (.06) (.06)
concession production .38* .37* .39*(.21) (.21) (.21)
competitive price .42*** .42*** .42***(.05) (.04) (.05)
elasticity of supply .001(.001)
quantity (10,000s tons) 0.0040.007
commodity*production territory FE Yes Yes Yesyear FE Yes Yes Yes
R2 0.85 0.85 0.85N 1158 1158 1158
The omitted category is free peasant production. Standard errors clustered at the
colony/commodity level are reported in parenthesis. *** p<10%, **p<5%, *p<10%.
Table XLower Bounds for Percentage Reduction of Gains From Trade
(1) (2A) (2B) (3A) (3B)All pre-1930 post-1930 West Africa Equatorial Africa
average commodity .65 .73 .47 .58 .74palm kernel .39 .48 .27 .30 .60
palm oil .46 .48 .38 .40 .56coffee .52 .76 .32 .42 .60
peanut .55 .62 .39 .42 .82cocoa .60 .62 .44 .54 .64
bananas .72 .63 .75 .72 .74cotton .73 .93 .46 .74 .70timber .86 .73 .63 .76 .92rubber .92 .92 .90 .92 .92
The table reports lower bounds for the relative losses of gains from trade due to colonial
extraction. Lower bounds are estimated according to equation (10).
40
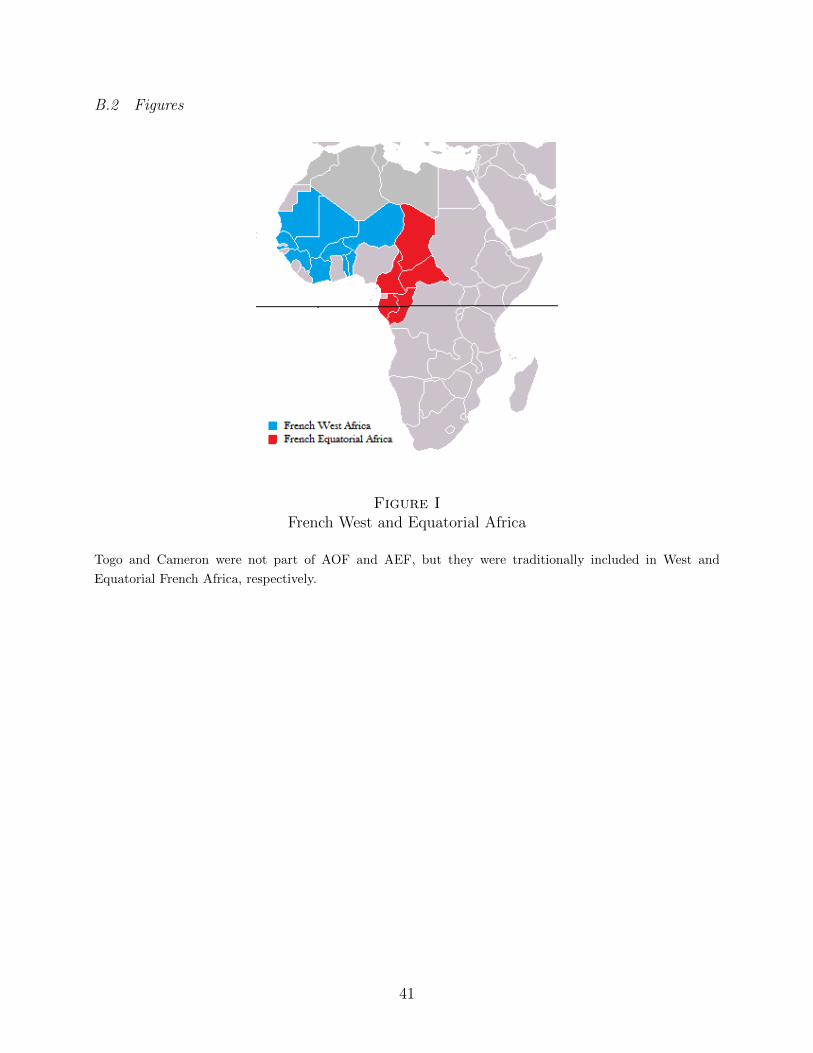
B.2 Figures
Figure IFrench West and Equatorial Africa
Togo and Cameron were not part of AOF and AEF, but they were traditionally included in West and
Equatorial French Africa, respectively.
41
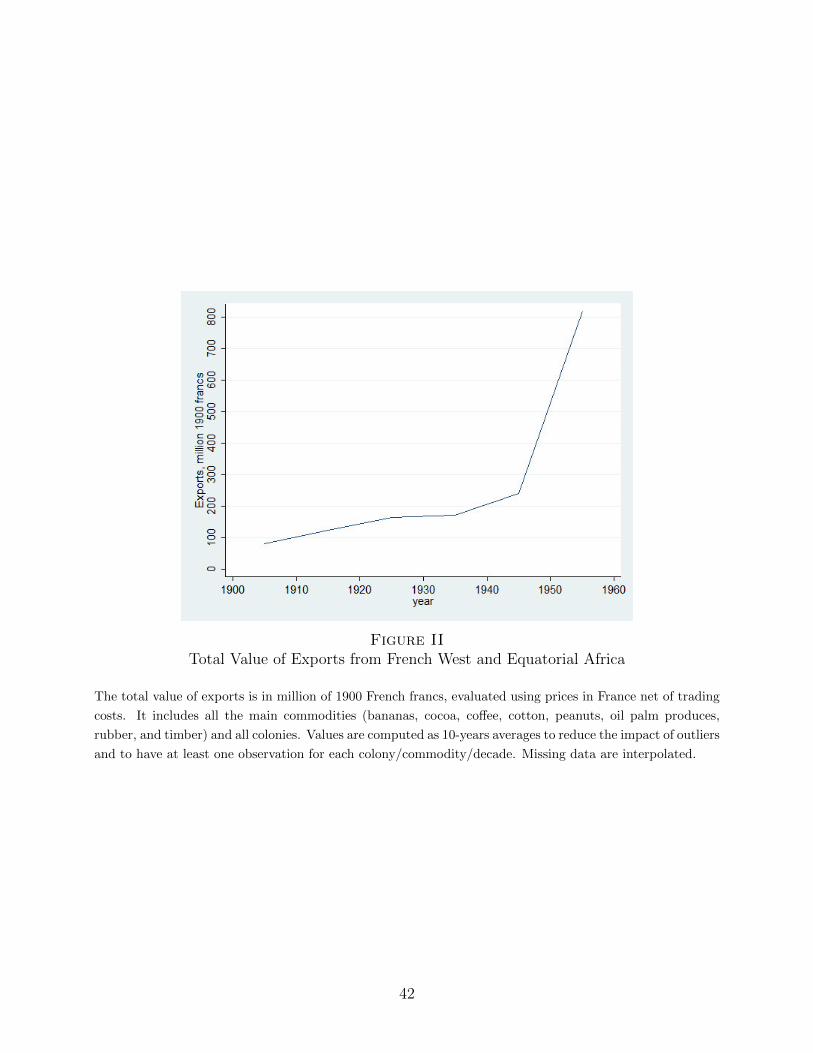
Figure IITotal Value of Exports from French West and Equatorial Africa
The total value of exports is in million of 1900 French francs, evaluated using prices in France net of trading
costs. It includes all the main commodities (bananas, cocoa, coffee, cotton, peanuts, oil palm produces,
rubber, and timber) and all colonies. Values are computed as 10-years averages to reduce the impact of outliers
and to have at least one observation for each colony/commodity/decade. Missing data are interpolated.
42
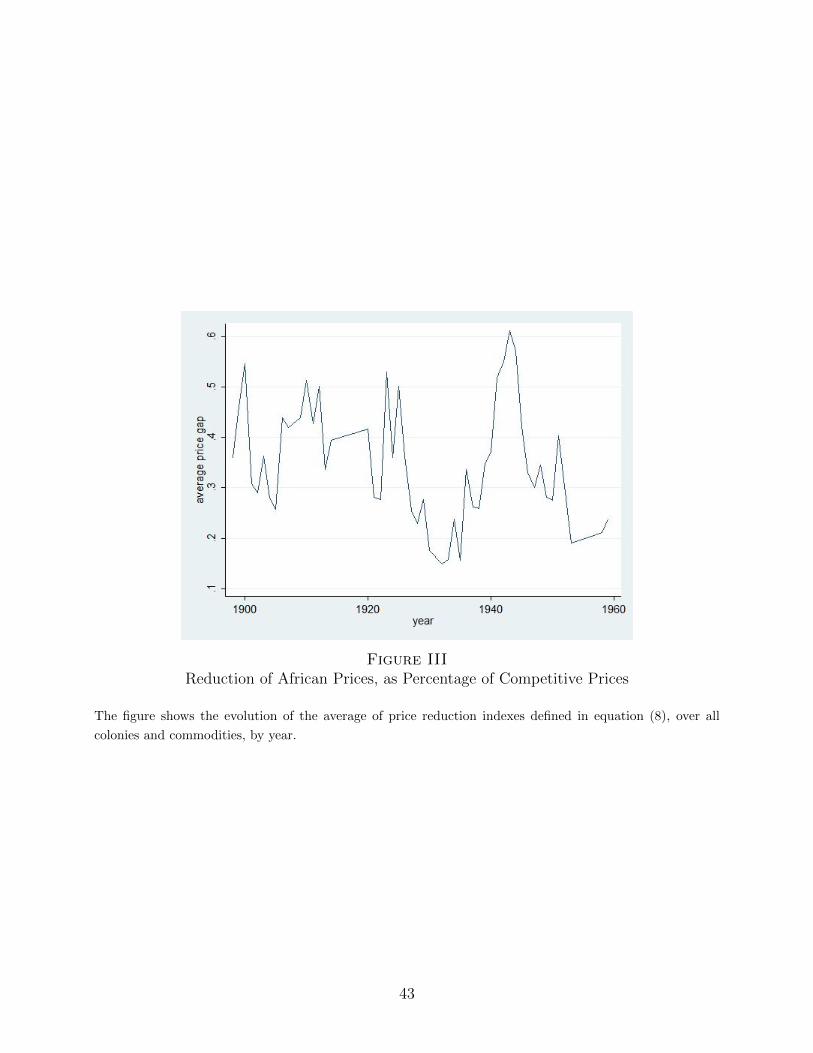
Figure IIIReduction of African Prices, as Percentage of Competitive Prices
The figure shows the evolution of the average of price reduction indexes defined in equation (8), over all
colonies and commodities, by year.
43
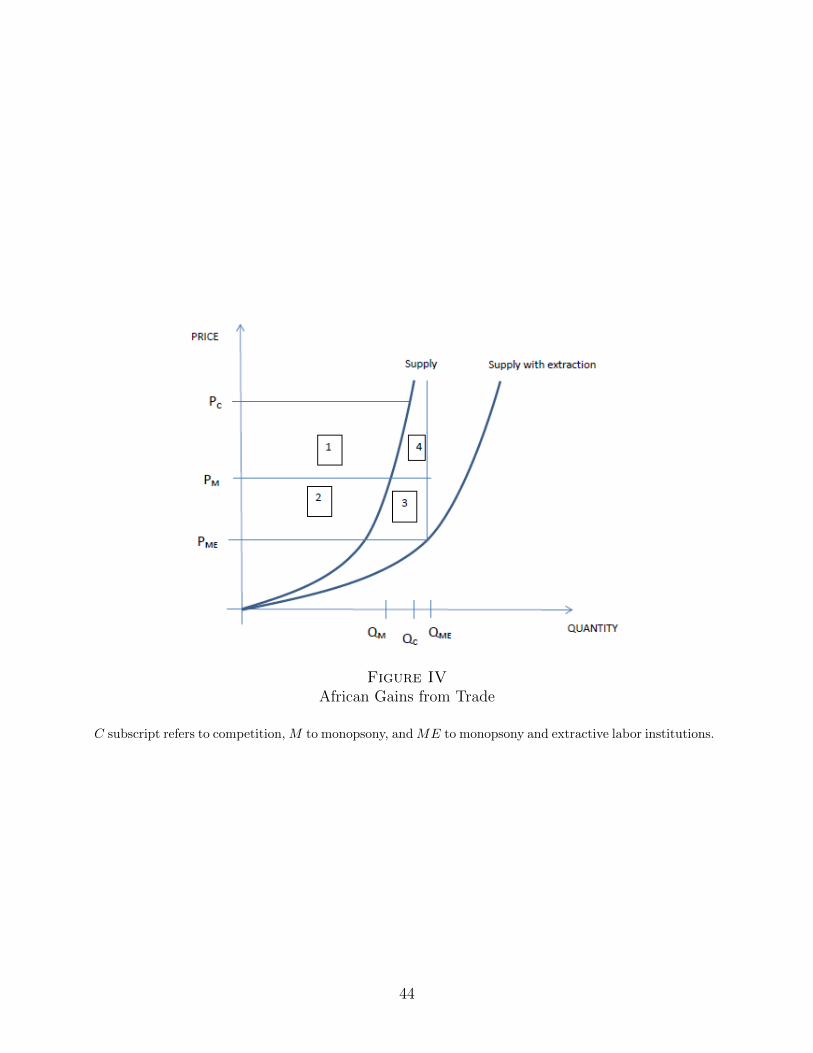
Figure IVAfrican Gains from Trade
C subscript refers to competition, M to monopsony, and ME to monopsony and extractive labor institutions.
44
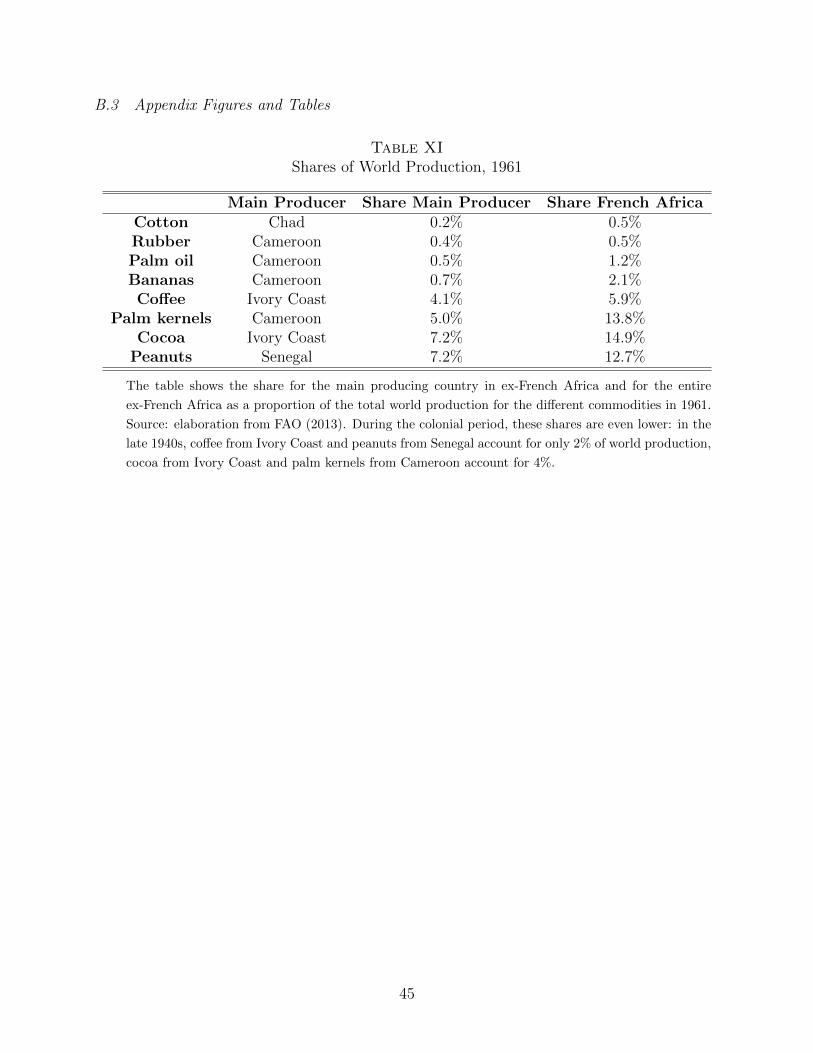
B.3 Appendix Figures and Tables
Table XIShares of World Production, 1961
Main Producer Share Main Producer Share French AfricaCotton Chad 0.2% 0.5%Rubber Cameroon 0.4% 0.5%Palm oil Cameroon 0.5% 1.2%Bananas Cameroon 0.7% 2.1%Coffee Ivory Coast 4.1% 5.9%
Palm kernels Cameroon 5.0% 13.8%Cocoa Ivory Coast 7.2% 14.9%
Peanuts Senegal 7.2% 12.7%
The table shows the share for the main producing country in ex-French Africa and for the entire
ex-French Africa as a proportion of the total world production for the different commodities in 1961.
Source: elaboration from FAO (2013). During the colonial period, these shares are even lower: in the
late 1940s, coffee from Ivory Coast and peanuts from Senegal account for only 2% of world production,
cocoa from Ivory Coast and palm kernels from Cameroon account for 4%.
45
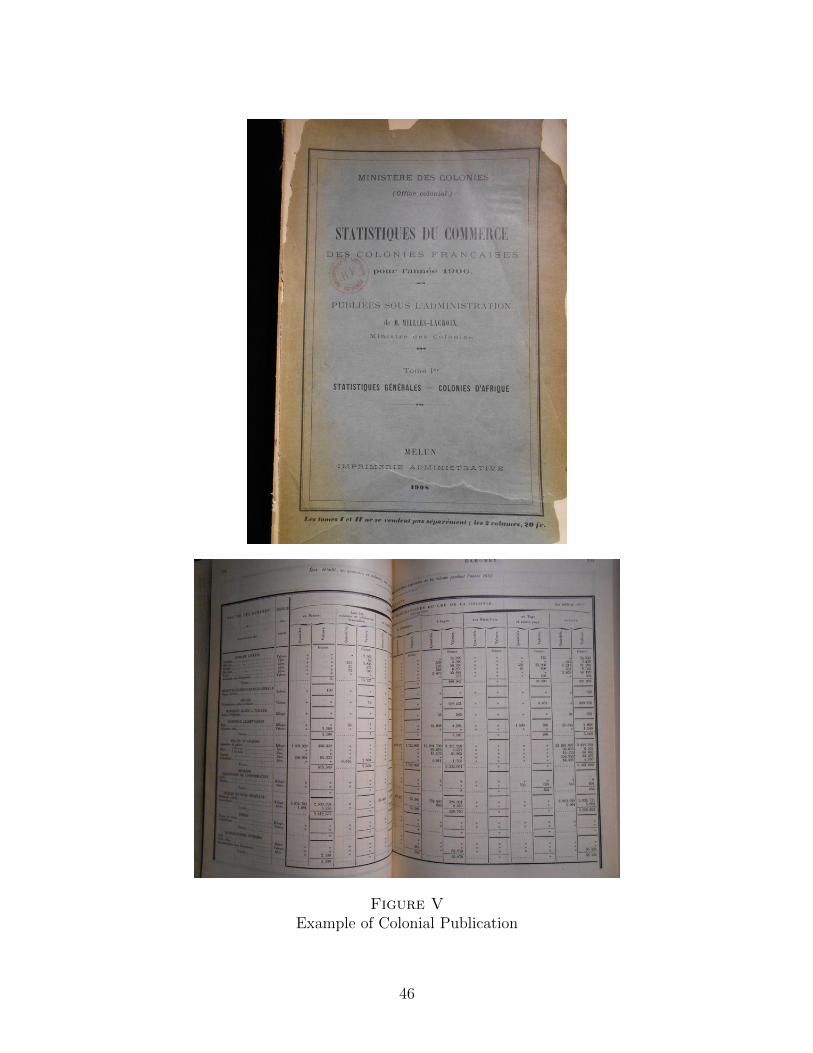
Figure VExample of Colonial Publication
46
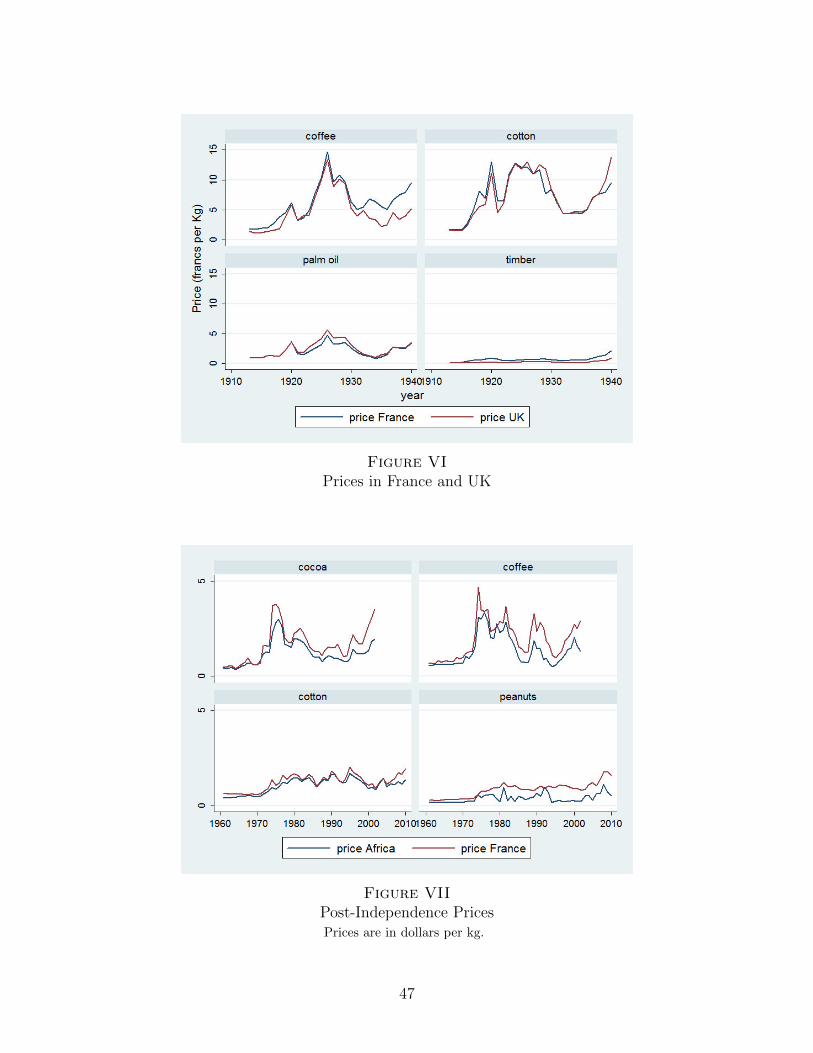
Figure VIPrices in France and UK
Figure VIIPost-Independence PricesPrices are in dollars per kg.
47
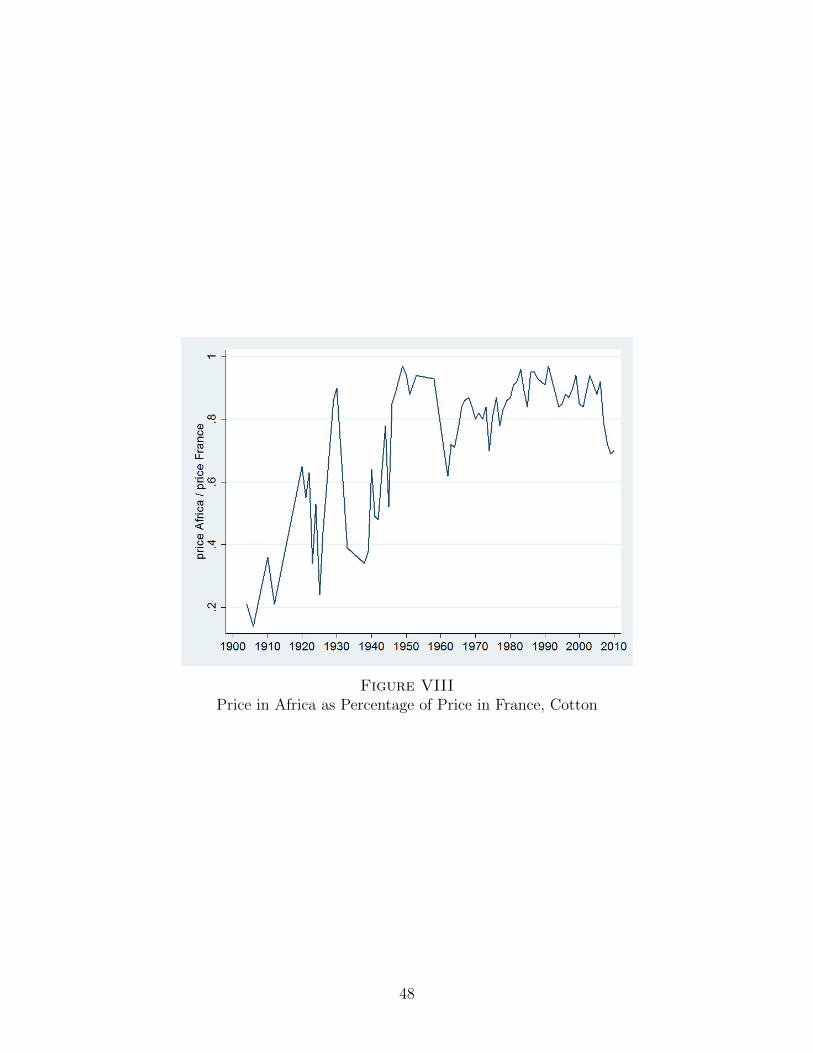
Figure VIIIPrice in Africa as Percentage of Price in France, Cotton
48