extinction risks of amazonian plant species - pnas · extinction risks of amazonian plant species...
TRANSCRIPT

Extinction risks of Amazonian plant speciesKenneth J. Feeley1 and Miles R. Silman1
Department of Biology, Wake Forest University, Winston Salem, NC 27106
Edited by Harold A. Mooney, Stanford University, Stanford, CA, and approved June 1, 2009 (received for review January 21, 2009)
Estimates of the number, and preferably the identity, of speciesthat will be threatened by land-use change and habitat loss are aninvaluable tool for setting conservation priorities. Here, we usecollections data and ecoregion maps to generate spatially explicitdistributions for more than 40,000 vascular plant species from theAmazon basin (representing more than 80% of the estimatedAmazonian plant diversity). Using the distribution maps, we thenestimate the rates of habitat loss and associated extinction prob-abilities due to land-use changes as modeled under 2 disturbancescenarios. We predict that by 2050, human land-use practices willhave reduced the habitat available to Amazonian plant species by�12–24%, resulting in 5–9% of species becoming ‘‘committed toextinction,’’ significantly fewer than other recent estimates. Con-trary to previous studies, we find that the primary determinant ofhabitat loss and extinction risk is not the size of a species’ range,but rather its location. The resulting extinction risk estimates are avaluable conservation tool because they indicate not only the totalpercentage of Amazonian plant species threatened with extinctionbut also the degree to which individual species and habitats will beaffected by current and future land-use changes.
Amazon � deforestation � distrbutions � ecoregions � land-use changes
Ongoing development of the Amazon, including natural gasand oil production, large-scale cattle ranching, soy farming,
extended networks of improved roads, and the various synergis-tic activities that invariably accompany increased access (fire,hunting, logging, etc.), is causing the rapid loss and degradationof natural habitat (1–6). To set conservation priorities anddesign appropriate mitigation strategies it is important to esti-mate the number, and preferably identity, of species that will bethreatened by current and future land-use changes.
Several notable studies have estimated extinction risks forAmazonian plants attributable to habitat loss (7–11). Theseestimates have almost all been based documented or predictedchanges in habitat area across the entire Amazon Basin or othercomparably large regions (7–10), thereby omitting the influenceof spatial patterns in species ranges and/or disturbances. By notincorporating information about the location or size of speciesranges or any spatial patterns in the rates of habitat loss, theresulting extinction estimates are potentially inaccurate. Fur-thermore, these methods do not allow extinction risks to becalculated for individual species.
For example, Hubbell et al. (11) recently estimated thepercentage of canopy trees in the Brazilian Amazon threatenedwith extinction by overlaying a spatially explicit map of predictedhabitat disturbances over theoretical species ranges. The use ofa spatially explicit disturbance map is an improvement overprevious studies. However, Hubbell et al. (11) did not usespatially explicit species ranges, and instead modeled speciesranges as circles (or ellipses) randomly distributed throughoutthe study region, thereby implicitly incorporating several unre-alistic assumptions about species ranges and failing to accountfor pronounced and well-established spatial gradients in treespecies richness (12). Tree diversity is greatest in western Ama-zonia and along the main stem of the Amazon River and is lowestacross the large expanses of the seasonal Cerrado savannahs insouthwestern Brazil (13–16). Because this is the near inverse of
the pattern predicted for future disturbances (3, 6), extinctionrisks were likely overestimated (12).
To accurately estimate the impacts of land-use changes,especially for the many conservation purposes in which species-specific rather than simple overall mean estimates are needed,realistic spatially explicit maps of species ranges are required.Most tropical plant species have been too poorly studied to allowfor accurate range maps to be drawn from collections data alone(17). However, by incorporating other sources of data it ispossible to create spatially explicit estimates of species’ potentialranges. South America has previously been subdivided intodiscrete ‘‘ecoregions’’ (18). By definition, ecoregions indicate theextent of distinct natural biological communities or areas withrelatively homogeneous species composition. A plausible esti-mate of a species’ range is therefore the total extent of all of theecoregions in which it is known to occur. The ecoregionsoccupied by plant species can be determined on the basis ofherbarium collection records, and several hundreds of thousandsof collection records identified to species are available onlinethrough the Global Biodiversity Information Facility (GBIF;www.gbif.org) for vascular plant species occurring within theAmazon. These records are geo-referenced and provide data onthe collection coordinates, and hence known ecoregions occu-pied, of 40,027 species representing �80% of the estimated50,000 Amazonian plant species. By combining the collectionlocalities with the maps of ecoregions, range maps can beproduced for individual species that provide information notonly on total area occupied but also, perhaps more importantly,range location and range shape. Although the accuracy of theseecoregion range maps will be influenced by limitations inher-ently associated with the use of natural history collections data(including biased geographic and taxonomic sampling, insuffi-cient sampling of rare and/or specialist species, and geo-referencing and taxonomic errors; refs. 17, 19–22), they providea better indication of distributions than has been used in previousattempts to estimate the extinction risks of Amazonian plantspecies (see Discussion).
Here, we use the collections data available through GBIF tomap the potential ecoregion-based distributions of the morethan 40,000 vascular plant species for which collections areavailable from the Amazon. We use these maps to estimate ratesof habitat loss due to land-use changes as mapped underpredictions by Soares-Filho et al. (6) of areas that will bedeforested by 2050 under a ‘‘Business As Usual’’ (BAU) and amore optimistic ‘‘Governance’’ (GOV) scenario, which we havemodified to extend to areas of species ranges outside the AmazonBasin (Fig. 1 and Table S1). Applying the species area curve, wetranslate the species-specific estimates of habitat loss into esti-mated extinction risks (23). The results represent a valuable toolto conservation planners because they predict not only the total
Author contributions: K.J.F. and M.R.S. designed research; K.J.F. performed research; K.J.F.analyzed data; and K.J.F. and M.R.S. wrote the paper.
The authors declare no conflict of interest.
This article is a PNAS Direct Submission.
1To whom correspondence may be addressed: E-mail: [email protected] or [email protected].
This article contains supporting information online at www.pnas.org/cgi/content/full/0900698106/DCSupplemental.
12382–12387 � PNAS � July 28, 2009 � vol. 106 � no. 30 www.pnas.org�cgi�doi�10.1073�pnas.0900698106
number of Amazonian plant species expected to eventually goextinct, but also the degree to which individual species arethreatened by habitat loss.
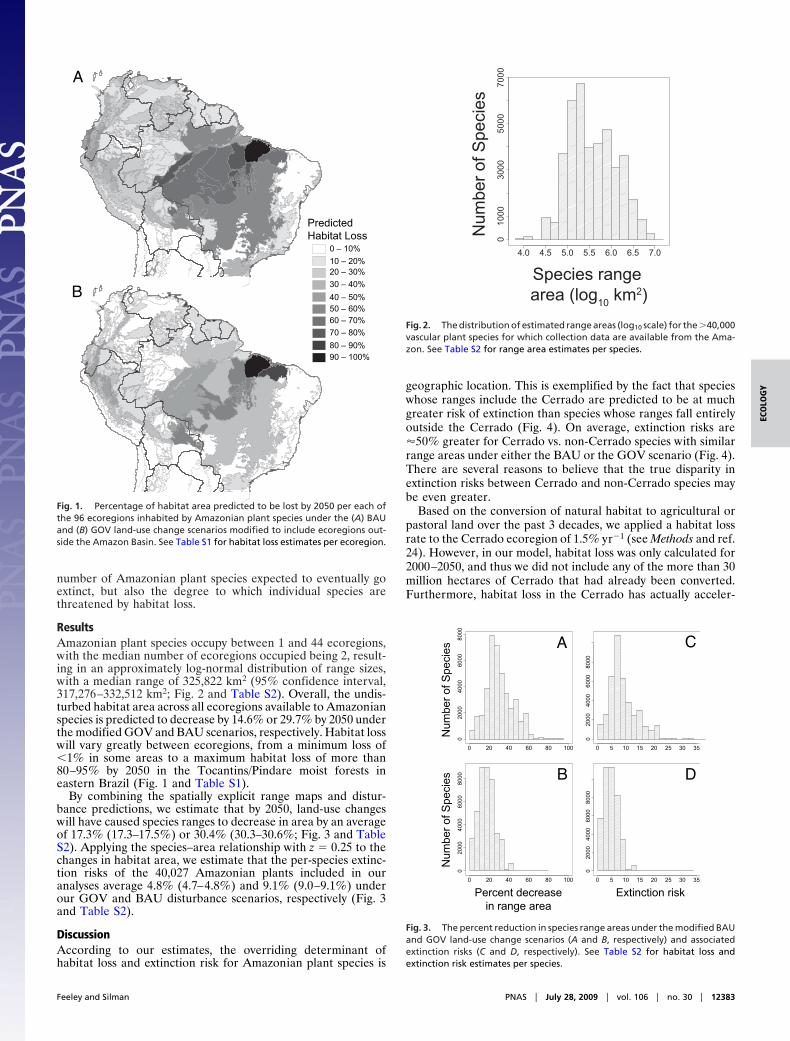
ResultsAmazonian plant species occupy between 1 and 44 ecoregions,with the median number of ecoregions occupied being 2, result-ing in an approximately log-normal distribution of range sizes,with a median range of 325,822 km2 (95% confidence interval,317,276–332,512 km2; Fig. 2 and Table S2). Overall, the undis-turbed habitat area across all ecoregions available to Amazonianspecies is predicted to decrease by 14.6% or 29.7% by 2050 underthe modified GOV and BAU scenarios, respectively. Habitat losswill vary greatly between ecoregions, from a minimum loss of�1% in some areas to a maximum habitat loss of more than80–95% by 2050 in the Tocantins/Pindare moist forests ineastern Brazil (Fig. 1 and Table S1).
By combining the spatially explicit range maps and distur-bance predictions, we estimate that by 2050, land-use changeswill have caused species ranges to decrease in area by an averageof 17.3% (17.3–17.5%) or 30.4% (30.3–30.6%; Fig. 3 and TableS2). Applying the species–area relationship with z � 0.25 to thechanges in habitat area, we estimate that the per-species extinc-tion risks of the 40,027 Amazonian plants included in ouranalyses average 4.8% (4.7–4.8%) and 9.1% (9.0–9.1%) underour GOV and BAU disturbance scenarios, respectively (Fig. 3and Table S2).
DiscussionAccording to our estimates, the overriding determinant ofhabitat loss and extinction risk for Amazonian plant species is
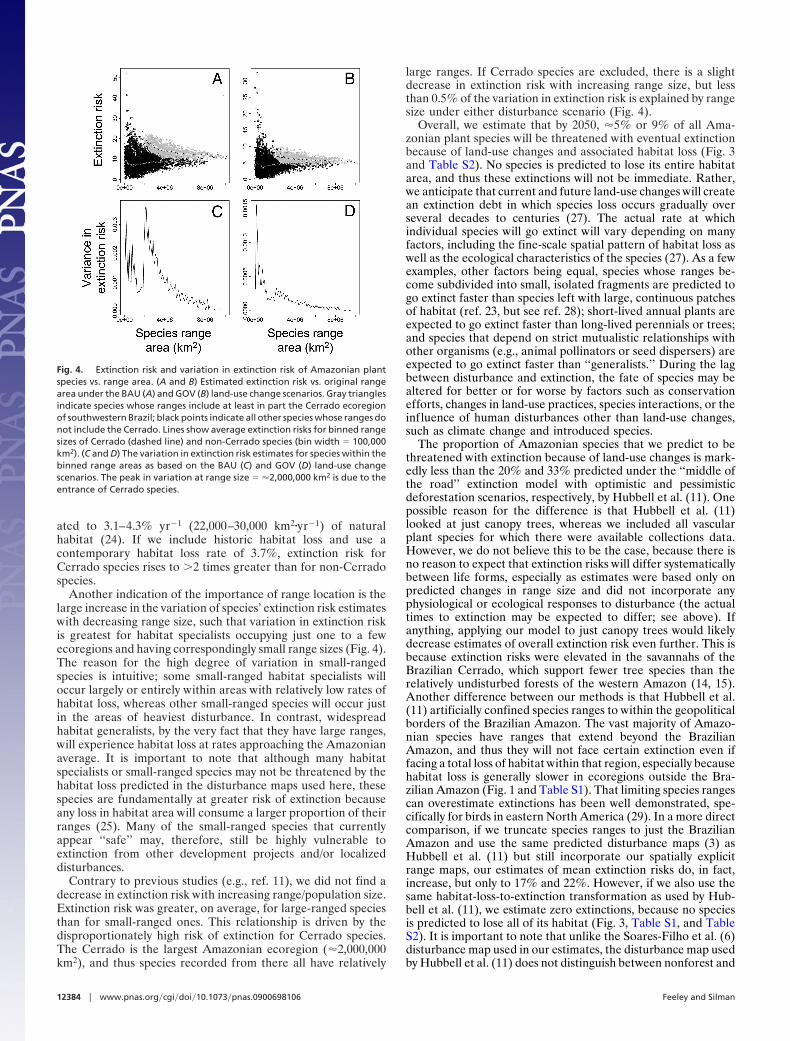
geographic location. This is exemplified by the fact that specieswhose ranges include the Cerrado are predicted to be at muchgreater risk of extinction than species whose ranges fall entirelyoutside the Cerrado (Fig. 4). On average, extinction risks are�50% greater for Cerrado vs. non-Cerrado species with similarrange areas under either the BAU or the GOV scenario (Fig. 4).There are several reasons to believe that the true disparity inextinction risks between Cerrado and non-Cerrado species maybe even greater.
Based on the conversion of natural habitat to agricultural orpastoral land over the past 3 decades, we applied a habitat lossrate to the Cerrado ecoregion of 1.5% yr�1 (see Methods and ref.24). However, in our model, habitat loss was only calculated for2000–2050, and thus we did not include any of the more than 30million hectares of Cerrado that had already been converted.Furthermore, habitat loss in the Cerrado has actually acceler-
A
B
0 – 10%
10 – 20%
40 – 50%50 – 60%60 – 70%
70 – 80%
80 – 90%90 – 100%
30 – 40%
20 – 30%
PredictedHabitat Loss
Fig. 1. Percentage of habitat area predicted to be lost by 2050 per each ofthe 96 ecoregions inhabited by Amazonian plant species under the (A) BAUand (B) GOV land-use change scenarios modified to include ecoregions out-side the Amazon Basin. See Table S1 for habitat loss estimates per ecoregion.
4.0 4. 5 5 .0 5.5 6.0 6. 5 7 .0
0 1
00
0
30
00
5
00
0
70
0 0
Species range area (log
10 km2)
Num
ber
of S
peci
es
Fig. 2. The distribution of estimated range areas (log10 scale) for the �40,000vascular plant species for which collection data are available from the Ama-zon. See Table S2 for range area estimates per species.
0 20 40 60 80 100
020
0040
0060
0080
00
0 5 10 15 20 25 30 35
020
0040
0060
0080
00
0 20 40 60 80 100
020
0040
0060
0080
00
0 5 10 15 20 25 30 35
020
0040
0060
008
000
Num
ber
of S
peci
esN
umbe
r of
Spe
cies
Percent decrease in range area
Extinction risk
A
B
C
D
Fig. 3. The percent reduction in species range areas under the modified BAUand GOV land-use change scenarios (A and B, respectively) and associatedextinction risks (C and D, respectively). See Table S2 for habitat loss andextinction risk estimates per species.
Feeley and Silman PNAS � July 28, 2009 � vol. 106 � no. 30 � 12383
ECO
LOG
Y
ated to 3.1–4.3% yr�1 (22,000–30,000 km2�yr�1) of naturalhabitat (24). If we include historic habitat loss and use acontemporary habitat loss rate of 3.7%, extinction risk forCerrado species rises to �2 times greater than for non-Cerradospecies.
Another indication of the importance of range location is thelarge increase in the variation of species’ extinction risk estimateswith decreasing range size, such that variation in extinction riskis greatest for habitat specialists occupying just one to a fewecoregions and having correspondingly small range sizes (Fig. 4).The reason for the high degree of variation in small-rangedspecies is intuitive; some small-ranged habitat specialists willoccur largely or entirely within areas with relatively low rates ofhabitat loss, whereas other small-ranged species will occur justin the areas of heaviest disturbance. In contrast, widespreadhabitat generalists, by the very fact that they have large ranges,will experience habitat loss at rates approaching the Amazonianaverage. It is important to note that although many habitatspecialists or small-ranged species may not be threatened by thehabitat loss predicted in the disturbance maps used here, thesespecies are fundamentally at greater risk of extinction becauseany loss in habitat area will consume a larger proportion of theirranges (25). Many of the small-ranged species that currentlyappear ‘‘safe’’ may, therefore, still be highly vulnerable toextinction from other development projects and/or localizeddisturbances.
Contrary to previous studies (e.g., ref. 11), we did not find adecrease in extinction risk with increasing range/population size.Extinction risk was greater, on average, for large-ranged speciesthan for small-ranged ones. This relationship is driven by thedisproportionately high risk of extinction for Cerrado species.The Cerrado is the largest Amazonian ecoregion (�2,000,000km2), and thus species recorded from there all have relatively
large ranges. If Cerrado species are excluded, there is a slightdecrease in extinction risk with increasing range size, but lessthan 0.5% of the variation in extinction risk is explained by rangesize under either disturbance scenario (Fig. 4).
Overall, we estimate that by 2050, �5% or 9% of all Ama-zonian plant species will be threatened with eventual extinctionbecause of land-use changes and associated habitat loss (Fig. 3and Table S2). No species is predicted to lose its entire habitatarea, and thus these extinctions will not be immediate. Rather,we anticipate that current and future land-use changes will createan extinction debt in which species loss occurs gradually overseveral decades to centuries (27). The actual rate at whichindividual species will go extinct will vary depending on manyfactors, including the fine-scale spatial pattern of habitat loss aswell as the ecological characteristics of the species (27). As a fewexamples, other factors being equal, species whose ranges be-come subdivided into small, isolated fragments are predicted togo extinct faster than species left with large, continuous patchesof habitat (ref. 23, but see ref. 28); short-lived annual plants areexpected to go extinct faster than long-lived perennials or trees;and species that depend on strict mutualistic relationships withother organisms (e.g., animal pollinators or seed dispersers) areexpected to go extinct faster than ‘‘generalists.’’ During the lagbetween disturbance and extinction, the fate of species may bealtered for better or for worse by factors such as conservationefforts, changes in land-use practices, species interactions, or theinfluence of human disturbances other than land-use changes,such as climate change and introduced species.
The proportion of Amazonian species that we predict to bethreatened with extinction because of land-use changes is mark-edly less than the 20% and 33% predicted under the ‘‘middle ofthe road’’ extinction model with optimistic and pessimisticdeforestation scenarios, respectively, by Hubbell et al. (11). Onepossible reason for the difference is that Hubbell et al. (11)looked at just canopy trees, whereas we included all vascularplant species for which there were available collections data.However, we do not believe this to be the case, because there isno reason to expect that extinction risks will differ systematicallybetween life forms, especially as estimates were based only onpredicted changes in range size and did not incorporate anyphysiological or ecological responses to disturbance (the actualtimes to extinction may be expected to differ; see above). Ifanything, applying our model to just canopy trees would likelydecrease estimates of overall extinction risk even further. This isbecause extinction risks were elevated in the savannahs of theBrazilian Cerrado, which support fewer tree species than therelatively undisturbed forests of the western Amazon (14, 15).Another difference between our methods is that Hubbell et al.(11) artificially confined species ranges to within the geopoliticalborders of the Brazilian Amazon. The vast majority of Amazo-nian species have ranges that extend beyond the BrazilianAmazon, and thus they will not face certain extinction even iffacing a total loss of habitat within that region, especially becausehabitat loss is generally slower in ecoregions outside the Bra-zilian Amazon (Fig. 1 and Table S1). That limiting species rangescan overestimate extinctions has been well demonstrated, spe-cifically for birds in eastern North America (29). In a more directcomparison, if we truncate species ranges to just the BrazilianAmazon and use the same predicted disturbance maps (3) asHubbell et al. (11) but still incorporate our spatially explicitrange maps, our estimates of mean extinction risks do, in fact,increase, but only to 17% and 22%. However, if we also use thesame habitat-loss-to-extinction transformation as used by Hub-bell et al. (11), we estimate zero extinctions, because no speciesis predicted to lose all of its habitat (Fig. 3, Table S1, and TableS2). It is important to note that unlike the Soares-Filho et al. (6)disturbance map used in our estimates, the disturbance map usedby Hubbell et al. (11) does not distinguish between nonforest and
Fig. 4. Extinction risk and variation in extinction risk of Amazonian plantspecies vs. range area. (A and B) Estimated extinction risk vs. original rangearea under the BAU (A) and GOV (B) land-use change scenarios. Gray trianglesindicate species whose ranges include at least in part the Cerrado ecoregionof southwestern Brazil; black points indicate all other species whose ranges donot include the Cerrado. Lines show average extinction risks for binned rangesizes of Cerrado (dashed line) and non-Cerrado species (bin width � 100,000km2). (C and D) The variation in extinction risk estimates for species within thebinned range areas as based on the BAU (C) and GOV (D) land-use changescenarios. The peak in variation at range size � �2,000,000 km2 is due to theentrance of Cerrado species.
12384 � www.pnas.org�cgi�doi�10.1073�pnas.0900698106 Feeley and Silman

deforested areas (3), and thus may be inappropriate for estimat-ing rates of habitat conversion.
A central motivation of our study was to reduce the numberof unrealistic assumptions that have potentially weakened pre-vious estimates of Amazonian extinction rates (12); however,many important caveats remain. Namely, although we contendthat estimating species’ distributions based on the occurrence ofcollections within ecoregions produces range maps that are moreinformative than those used in previous studies, there are manyfactors that may limit their accuracy. Range maps based on thelocations of herbarium collections are potentially misleadingbecause of inaccuracies in geo-referencing and/or taxonomy (21,22). Geo-referencing errors may cause significant errors inestimates of species ranges because ranges are based on thepresence/absence of species within defined ecoregions. Speciesranges will be overestimated if collections are listed as occurringin ecoregions where the species does not actually occur (or,conversely, underestimated if species are listed as not occurringin regions where they do occur). However, because only pres-ence/absence within ecoregions is counted, the majority ofgeo-referencing errors will likely not cause any change in speciesranges at all.
Perhaps even more critical is the simple paucity of collectionsdata for most tropical plant species (17). The total plant diversityof the Amazon Basin has been estimated to be as high as 50,000species, but only 40,000 of these species are represented by evena single available collection record in GBIF. It is likely that theunrepresented species are disproportionately rare and/or habitatspecialists. Although these species may therefore be inherentlymore sensitive to habitat loss, their fate will ultimately dependlargely on where they occur in relation to disturbance as wediscuss above. Many of the unrepresented species likely comefrom undercollected areas or habitats. There are many potentialcauses for undercollecting, but one of the foremost is restrictedaccess. Limited access may also slow or hinder future land-usechanges, thereby reducing the danger to any species occurring inthese areas.
Many of the species that are included here are represented byonly a very small number of collections, which may limit ourability to accurately map their distributions. ‘‘Undercollected’’species may not be counted as occurring in some ecoregionswhere they truly occur, resulting in underestimates of speciesranges, with subsequent impacts on estimates of habitat loss andextinction risk. An example of how undercollecting may have animpact on extinction estimates comes from the Jurua-Purusmoist forest ecoregion in Brazil. Fewer than 100 collectionsrepresenting 82 plant species are currently available throughGBIF for this ecoregion, despite its large area (�250,000 km2)and predicted high biodiversity (16, 18). According to modeledland-use change scenarios, this ecoregion will receive relativelylittle impact (Fig. 1 and Table S1) (3, 6), and thus intensifyingcollection/digitizing efforts and expanding the represented list ofspecies will almost certainly have the effect of lowering estimatesof the habitat loss and extinction risks. Conversely, if species listsare expanded for more disturbed but undercollected ecoregions,such as the Monte Alegre varzea of Brazil (�66,000 km2, withjust 107 collections representing 95 species), which is predictedto lose between a quarter and a half of its natural habitat areaover the same period (3, 6), extinction estimates will increase.Errors such as these may potentially be avoided by applyingcriteria for the minimum number of collections per species, butthis could itself potentially skew extinction risk estimates bydisproportionately excluding rarer species. The impacts of un-dercollecting will be minimized by the use of presence/absenceper ecoregion, because only a single collection is required perspecies per ecoregion occupied.
Although the counting of ecoregions may help minimize someerrors, it may itself result in large overestimates of species ranges
if species are actually confined to smaller areas or habitats withinthe ecoregions. Although this is likely to be true for manyspecies, we contend that ecoregions are fair estimates of poten-tial ranges. Extinction estimates based on loss of area withinecoregions thus implicitly incorporate the assumption that spe-cies currently confined to smaller areas will be capable ofmigrating within their potential ranges. If species are incapableof migrating, or if the pace of habitat destruction exceedsmigration capabilities, then the use of ecoregions may underes-timate extinction risks for some species. Conversely, extinctionrisks will be overestimates if species occur predominantly withinjust the undisturbed areas within ecoregions.
To further improve the accuracy of range maps, it will benecessary to increase the quality and quantity of collections data.Improved/augmented collection records will not only allow forbetter estimates of which species occur in which ecoregions, butwill also allow for finer-scale mapping; for example, by usingbioclimatic niche or envelope models. Despite the potentialinaccuracies, species ranges based on even sparse collectionsdata and coarse habitat/ecoregion maps are a significant im-provement over previous studies, which have either assumed allspecies to be distributed everywhere (i.e., as when overallextinction rates are estimated based on average rates of habitatloss across the entire region) or that species range sizes are adirect translation of abundance estimates and randomly distrib-uted (as in ref. 11).
In addition to the problems arising from using collections dataand ecoregions, we based our estimates of extinction probabil-ities on changes in habitat area predicted over the next severaldecades (which itself may be erroneous, especially for areasoutside the Brazilian Amazon for which overall country-wideestimates were used) and the relationship between area andspecies richness. The many potential problems with extrapolat-ing extinction risk from change in habitat area have beenexplored in depth elsewhere (30–36) and will not be discussedfurther here.
Our estimates of extinction risks are based only on habitat lossand do not include other possible causes, such as other syner-gistic human disturbances (e.g. fire, logging, climate change) ordisruptions of biological interactions (e.g., trophic cascades). Weand others have demonstrated previously that the effects ofdistorted biological interactions may be even stronger drivers ofspecies loss from disturbed tropical forests than the direct effectsof habitat reduction (37, 38). Nor did we incorporate effects offuture climate change into our analyses. Climate change willthreaten many Amazonian plant species through a variety ofmechanisms, including shifted distributions of climatically suit-able habitats (39). The ability of species to respond to changingclimates will be diminished in a context of land-use change (e.g.,migration corridors may be cut), increasing the number ofspecies that would be threatened by either climate change orland-use change alone.
Finally, in estimating changes in species ranges, we onlyconsidered the loss of natural habitat area and did not allow forany successional regrowth or habitat recovery. If secondaryhabitats are able to support species that would otherwise bethreatened, loss of habitat area will be slowed and extinctionrisks decreased (40).
Despite these caveats and the associated uncertainties, thisstudy represents an important advancement in estimating ex-tinction risks of tropical plant species. As discussed above, tofurther refine extinction rate estimates it will be necessary toimprove the quality, quantity, and availability of collections data.Additionally, estimates will benefit from improved predictions ofhabitat disturbance and recovery rates (both in and out of theAmazon) and, perhaps most importantly, increased understand-ings of the various and complex ways in which species willrespond to different forms and degrees of human disturbances.
Feeley and Silman PNAS � July 28, 2009 � vol. 106 � no. 30 � 12385
ECO
LOG
Y
ConclusionsWe predict that �5–9% of the more than 40,000 Amazonianplant species studied here will become committed to extinctionby 2050 because of land-use changes and habitat loss. Althoughthe number of threatened species is less than estimated in someprevious studies, we stress that ongoing and future land-usechanges pose serious threats to Amazonian biodiversity. If therisk estimates from this study are applied to the 50,000 totalvascular plant species (12,500 canopy trees; ref. 11) estimated tooccur in the Amazon Basin, we predict that between 2,400 and4,550 species (600–1,138 species of trees) will become commit-ted to extinction over the next several decades because ofland-use change alone. This is an unacceptable loss rate and callsfor strong and immediate conservation actions. Beyond esti-mates of just overall or mean extinction risks, we estimate habitatloss and extinction risks individually for nearly 80% of allAmazonian plant species (Table S2). Likewise, we have pro-duced estimates of habitat loss rates for individual ecoregions(Table S1), which can themselves be extrapolated to rates of localspecies loss. By using these data, conservation efforts can bedirected with greater precision at the specific plant species orplant communities most threatened by future land-use changes.For example, it is clear from our results that the species mostimmediately threatened with extinction are those occurring inthe Cerrado and the surrounding ecoregions (Figs. 1 and 4 andTable S1), and thus we implore that conservation efforts therebe expanded.
MethodsSpecies Range Maps. To create species ranges, we downloaded all herbariumrecords for vascular plant specimens collected from tropical South Americaavailable through the GBIF (www.gbif.org; only records identified to speciesand containing geographical coordinates were used in the analysis, and datawere screened according to standard protocol; Table S3). We then mapped theranges for each of the 40,027 species collected from the Amazon basin as thetotal extent of all ecoregions (18) in South America from which the species hadbeen collected. The mapped species ranges included areas outside the Ama-zon basin, for a total of 96 ecoregions represented.
Changes in Habitat Area. We estimated the area of habitat loss within theforested regions of the Amazon (i.e., all Amazonian ecoregions except the
Beni Savanna, the Cerrado, and the Guianan Savanna) by overlaying theSoares-Filho et al. (6) map of areas predicted to be deforested by 2050 underboth a BAU and a more optimistic GOV scenario. The GOV model predictspatterns of deforestation under the assumption of increasing protection, andhence decreasing habitat conversion rates.
Because detailed, spatially explicit predictions of future land-use changesare lacking for most areas outside the Amazon Basin, we estimated theamount of habitat loss for each non-Amazonian ecoregion, or portion ofecoregions falling outside the Amazon, based on the annual rates of defor-estation recorded for natural forested areas in the encompassing countrybetween 1990 and 2000 [as estimated by the Food and Agriculture Organi-zation of the United Nations (42)] applied over a period of 60 years. A periodof 60 years was chosen to encompass both the loss of habitat from 1990 to 2000and the predicted loss of habitat by 2050. In our BAU scenario, we maintaineda constant rate of habitat loss over the 60-year period. In our GOV scenario, wedecreased the rate of habitat loss by 10% annually for the period from 2000to 2050. Finally, we applied specific estimates of habitat loss for the Cerrado,because this area is being lost at a disproportionately high rate because ofintensive conversion to agriculture (primarily cattle ranches and soy planta-tions). In our BAU scenario, habitat in the Cerrado was lost at a constant rateof 1.5% per year (24). In the GOV scenario, we decreased the rate of habitatloss in the Cerrado by 10% annually for the period 2000–2050 (to a minimumhabitat loss of �0.003% per year; Fig. 1).
We predicted the decrease in range area for each individual species (�A) asthe summed area lost in all occupied ecoregions. By using the species-specificestimates, we calculated the mean percent reductions in range size and 95%confidence intervals based on 10,000 bootstrap estimates.
Species Extinction Risks. We estimated the extinction risk (E) for each individ-ual plant species based on estimates of the original range size (A1) and rangesize after disturbance (A2 � A1 � �A) and the relationship between habitatarea and species richness according to the species–area relationship (23), suchthat that E � 1 � (A2/A1)z. We assumed z � 0.25 to be consistent with otherstudies and facilitate cross-comparisons with previous estimates (e.g., refs. 7,8, 10). Higher values of z will result in greater extinction risks, and lower zvalues will decrease estimates of extinction risks (23). As above, we used thespecies-specific risk estimates to calculate the mean extinction risk across allspecies with 95% confidence intervals.
ACKNOWLEDGMENTS. We thank the GBIF and all contributing herbaria, aswell as B. S. Soares-Filho, D. Nepstad, and SIMAMAZONIA for making theirdata publicly available and facilitating studies of biogeography and conser-vation. We acknowledge financial support from the Gordon and Betty MooreFoundation’s Andes to Amazon Program, National Science Foundation GrantDEB-0237684 (to M.R.S.), and the Amazon Conservation Association.
1. Laurance WF (2000) Mega-development trends in the Amazon: Implications for globalchange. Environ Monit Assess 61:113–122.
2. Laurance WF, Cochrane MA (2001) Synergistic effects in fragmented landscapes.Conserv Biol 15:1488–1489.
3. Laurance WF, et al. (2001) The future of the Brazilian Amazon. Science 291:438–439.4. Laurance WF, et al. (2001) Development of the Brazilian Amazon. Science 292:1652–
1654.5. Soares-Filho B, et al. (2004) Simulating the response of land-cover changes to road
paving and governance along a major Amazon highway: The Santarem–Cuiaba cor-ridor. Glob Chang Biol 10:745–764.
6. Soares-Filho BS, et al. (2006) Modelling conservation in the Amazon basin. Nature440:520–523.
7. Pimm SL, Raven P (2000) Biodiversity: Extinction by numbers. Nature 403:843–845.
8. Pimm SL, Russell GJ, Gittleman JL, Brooks TM (1995) The future of biodiversity. Science269:347–350.
9. Raven P (1988) Our diminishing tropical forests. Biodiversity, ed Wilson EO (Natl AcadPress, Washington, DC), pp 119–122.
10. Brooks TM, et al. (2002) Habitat loss and extinction in the hotspots of biodiversity.Conserv Biol 16:909–923.
11. Hubbell SP, et al. (2008) How many tree species are there in the Amazon and how manyof them will go extinct? Proc Natl Acad Sci USA 105:11498–11504.
12. Feeley KJ, Silman MR (2008) Unrealistic assumptions invalidate extinction estimates.Proc Natl Acad Sci USA 105:E121.
13. Silman MR (2007) Plant species diversity in Amazonian forests. Tropical Rain ForestResponses to Climate Change, eds Bush M, Flenly J (Praxis, London), pp 269–294.
14. Gentry AH (1988) Changes in plant community diversity and floristic composition onenvironmental and geographical gradients. Ann Mo Bot Gard 75:1–34.
15. Kreft H, Jetz W (2007) Global patterns and determinants of vascular plant diversity.Proc Natl Acad Sci USA 104:5925–5930.
16. Ter Steege H, et al. (2003) A spatial model of tree �-diversity and tree density for theAmazon. Biodiver Conserv 12:2255–2277.
17. Collen B, Ram M, Zamin T, McRae L (2008) The tropical biodiversity data gap: Address-ing disparity in global monitoring. Trop Conserv Sci 1:75–88.
18. Olson DM, et al. (2001) Terrestrial ecoregions of the world: A new map of life on earth.BioScience 51:933–938.
19. Nelson BW, Ferreira CAC, da Silva MF, Kawasaki ML (1990) Endemism centres, refu-gia and botanical collection density in Brazilian Amazonia. Science 345:714–716.
20. Ponder WF, Carter GA, Flemons P, Chapman RR (2001) Evaluation of museum collectiondata for use in biodiversity assessment. Conserv Biol 15:648–657.
21. Tobler M, Honorio E, Janovec J, Reynel C (2007) Implications of collection patterns ofbotanical specimens on their usefulness for conservation planning: An example of twoNeotropical plant families (Moraceae and Myristicaceae) in Peru. Biodiver Conserv16:659–677.
22. Graham CH, et al. (2008) The influence of spatial errors in species occurrence data usedin distribution models. J Appl Ecol 45:239–247.
23. MacArthur RH, Wilson EO (1967) The Theory of Island Biogeography (Princeton UnivPress, Princeton).
24. Klink CA, Machado RB (2005) Conservation of the Brazilian Cerrado. Conserv Biol19:707–713.
25. Schwartz MW, Iverson LR, Prasad AM, Matthews SN, O’Connor RJ (2006) Predictingextinctions as a result of climate change. Ecology 87:1611–1615.
26. Tilman D, May RM, Lehman CL, Nowak MA (1994) Habitat destruction and the extinc-tion debt. Nature 371:65–66.
27. Terborgh J (1974) Preservation of natural diversity-problem of extinction prone spe-cies. Bioscience 24:715–722.
28. Hanski I (1996) Metapopulation ecology. Population Dynamics in Ecological Space andTime, eds Rhodes OE, Chesser RK, Smith MH (Univ. of Chicago Press, Chicago), pp13–44.
29. Pimm SL, Askin RA (1995) Forest losses predict bird extinctions in eastern NorthAmerica. Proc Natl Acad Sci USA 92:9343–9347.
30. Thomas CD, et al. (2004) Biodiversity conservation: Uncertainty in predictions ofextinction risk/Effects of changes in climate and land use/Climate change and extinc-tion risk (reply). Nature 430:34.
12386 � www.pnas.org�cgi�doi�10.1073�pnas.0900698106 Feeley and Silman

31. Thuiller W, et al. (2004) Biodiversity conservation: Uncertainty in predictions of extinc-tion risk. Nature 430:34.
32. Heywood VH, Mace GM, May RM, Stuart SN (1994) Uncertainties in extinction rates.Nature 368:105–105.
33. Smith FDM, May RM, Pellew R, Johnson TH, Walter KS (1993) Estimating extinctionrates. Nature 364:494–496.
34. Dial R (1994) Extinction or miscalculation? Nature 370:104–105.35. Budiansky S (1994) Extinction or miscalculation? Nature 370:105.36. Harte J, Ostling A, Green JL, Kinzig A (2004) Biodiversity conservation: Climate change
and extinction risk. Nature 430:34.
37. Feeley KJ, Terborgh JW (2008) Direct vs indirect effects of habitat reduction on the lossof avian species from tropical forest fragments. Anim Conserv 11:353–360.
38. Terborgh J, Feeley K, Silman M, Nunez P, Balukjian B (2006) Vegetation dynamics ofpredator-free land-bridge islands. J Ecol 94:253–263.
39. Thomas CD, et al. (2004) Extinction risk from climate change. Nature 427:145–148.
40. Wright SJ, Muller-Landau HC (2006) The future of tropical forest species. Biotropica38:287–301.
41. Food and Agriculture Organization of the United Nations (2003) The State of theWorld’s Forests 2003 (FAO, Rome).
Feeley and Silman PNAS � July 28, 2009 � vol. 106 � no. 30 � 12387
ECO
LOG
Y