exposure assessment to airborne contaminants in … exposure assessment to airborne contaminants in...
TRANSCRIPT

i
Exposure assessment to airborne contaminants in the
indoor environment of Swine Farms
February 2007
Project Team:Marie Coggins1, Patricia Mc Donnell1, Gerard Fleming2, Victoria Hogan3,
1Department of Experimental Physics National University of Ireland Galway2Department of Microbiology, National University of Ireland Galway3Department of Health Promotion National University of Ireland Galway

ii
Acknowledgements
The authors would like to acknowledge fi nancial support of the National University of Ireland
Galway, Millennium Fund and the Health and Safety Authority who funded this project.
The authors would like to thank Teagasc for their help with coordinating the field sampling
and all the farmers who participated in this study, for their time, understanding and relentless
cooperation.
Special thanks to the NUI Galway students, Michelle Feeney, Thomas Murphy, Elaine Browne
and James Mclynn for help with sample collection.
iii
Executive Summary
Introduction:
The agriculture industry in Ireland is of major importance to both our economy and our way of life.
Despite notable advances, an occupation in the farming sector inadvertently results in multiple
exposures to a variety of hazards, including respiratory hazards. As a result, farmers tend to have higher
rates of asthma and respiratory symptoms than other occupational groups . Data from the Teagasc
National Farm Survey has shown that 9.9% of Irish farmers have reported work related illnesses (HSA ,
2003). One third of the illnesses reported were respiratory in nature. However, there is currently no data
on the extent to which Irish agricultural workers are exposed to various respiratory hazards in their
working environments.
Aims:
The primary objective of this research project was to evaluate Irish swine farmers’ occupational
exposure to certain respiratory hazards, namely: carbon dioxide, ammonia, swine confinement dust, and
bacterial endotoxin. Worker exposure levels were compared to the recommended health limits
developed by Donham (2000) for the prevention of acute respiratory symptoms in swine workers
Method:
Five intensive pig farms (approximate size 500 - 2200 sows) at various locations throughout Ireland
participated in the study. Similar animal house ventilation and manure collection systems were used on
all farms. Workers participating in the study were classified into similar exposure groups (SEG’s), based
on the farm units in which they were working i.e. the farrowing unit, the dry sow unit, the weaner unit,
the finishing unit and the farmer who worked throughout all units. Personal occupational exposure
monitoring was carried out, involving obtaining samples of the air breathed in by the swine confinement

iv
workers, in order to determine their exposure to the above respiratory hazards. Statistical analysis of
exposure data allowed comparisons to be made within the SEG’s and with recommended health limits
for the prevention of acute respiratory symptoms.
Results:
Results from this research project show that swine confinement workers are potentially exposed to
concentrations of workplace contaminants at levels above recommended health limits. For example,
swine confinement dust exposure concentrations of up to three times in excess of reco mmended health
limits were measured. Throughout the study a lack of both awareness and use of respiratory protection
equipment amongst farm workers was noted. In addition none of the farm workers monitored in this
study participated in an occupational heal th surveillance program.
Conclusions:
Exposure data collected in this research project indicate that swine confinement workers may be at an
increased risk of developing respiratory disease from exposure to workplace hazards. There is a need for
increased training and education to promote awareness of occupational health issues and the importance
of implementing workplace exposure controls in the sector. A literature review completed as part of this
study showed that there are available proven exposure redu ction practices developed by international
researchers which could be implemented in Ireland without much cost to the farmer. Exposure
monitoring and health surveillance programs are recommended across the swine industry, particularly
for vulnerable groups such as young people, pregnant workers, or those with existing respiratory
diseases.

v
Table of Contents
SECTION PAGE
Acknowledgements ii
Executive Summary iii
Table of Contents v
List of Plates, Tables and Figures ix
Abbreviations x
Chapter 1: INTRODUCTION
1. 0 Overview of Chapter 1
1.1 Agriculture Industry in Ireland 1
1.2 Swine Production 2
1.3 Respiratory Hazards in the Swine Industry 2
1.4 Background to Project 3
1.5 Research Objectives 4
Chapter 2: LITERATURE REVIEW
2.0 Overview of Chapter 5
2.1 Swine Production in Ireland 5
2.2 Occupational Hazards found in Swine Confinement Buildings 6
2.2.1 Gases 6
2.2.1.1 Carbon dioxide (CO 2) 7
2.2.1.2 Carbon monoxide (CO) 8
2.2.1.3 Ammonia (NH3) 8
2.2.1.4 Methane (CH4) 9
2.2.1.5 Hydrogen sulphide (H 2S) 10
2.2.2 Swine Confinement Dust 11
2.2.3 Microorganisms 13
2.2.3.1 Endotoxin 16
2.2.3.2 Endotoxin Sampling, Extraction & Analysis 18

vi
SECTION PAGE
2.2.4 Confined Spaces 19
2.2.5 Chemical Hazards in Swine Confinement Buildings 20
2.2.6 Noise Exposure in Swine Confinement Buildings 20
2.3 Workers in the Swine Industry 22
2.4 Occupational Diseases in Swine Workers 23
2.4.1 Acute Bronchitis 23
2.4.2 Sinusitis 23
2.4.3 Organic Dust Toxic Syndrome (ODTS) 24
2.4.4 Occupational Asthma 24
2.4.5 Zoonotic Infections 25
2.5 Occupational Exposure Control Measures in the Swine Ind ustry 26
2.5.1 Dust Control 27
2.5.1.1 Clean Interior Building Surfaces 27
2.5.1.2 Reduce Dust from Feed 28
2.5.1.3 Spraying with Vegetable Oil 28
2.5.2 Air Cleaning 30
2.5.2.1 Ventilation Systems 30
2.5.3 Diet Formulation 31
2.5.4 Manure Handling and Storage 32
2.5.5 Personal Protective Equipment (PPE) 33
Chapter 3: METHODOLOGY
3.0 Overview of Chapter 34
3.1 Sampling Strategy 34
3.2 Gas Sampling in Swine Confinement Units 37
3.2.1 Ammonia Sampling 37
3.2.2 Carbon Dioxide Sampling 38
3.3 Collection of Swine Confinement Dust 39
3.3.1 Equipment Used 39
vii
SECTION PAGE
3.3.2 Preparation of Sampling Equipment 40
3.3.3 Sampling Train 41
3.3.4 Gravimetric Analysis 41
3.4 Microbiological Analysis of the Air of Swine Confinement Buildings 42
3.4.1 Media Preparation 42
3.4.1.1 Malt Extract Agar (Yeast and Moulds) 42
3.4.1.2 Nutrient Agar (Total Colony Forming Units) 42
3.4.1.3 Violet Red Bile Agar (VRBA) (Coliforms) 43
3.4.2 Settle Plates for the Culture & Enumeration of Microorganisms 43
3.4.3 Media Incubation Periods 44
3.5 Endotoxin Sampling 45
3.5.1 Equipment Used 45
3.5.2 Preparation of Sampling Equipment 45
3.5.3 Sampling Train 46
3.5.4 Endotoxin Extraction 46
3.5.5 Endotoxin Analysis 47
3.6 Data Analysis 47
Chapter 4: RESULTS
4.0 Overview of Chapter 49
4.1 Gas Exposure of Swine Confinement Workers 50
4.1.2 Carbon dioxide 50
4.1.3 Ammonia 52
4.2 Swine Confinement Dust 54
4.2.1 Inhalable Swine Confinement Dust 54
4.2.2 Respirable Swine Confinement Dust 55
4.3 Microbiological Analysis 56
4.3.1 Settle Plates for the Culture & Enumeration of Microorgan isms 56
4.3.2 Comparison of the Microbial Bioburden in Farms A and B 57
viii
SECTION PAGE
4.3.3 Comparison of the Microbial Bioburden in Different Units
Between the Two Farms 58
4.3.4 Comparison of the Microbial Bioburden in Different Units
In each Individual Farm 59
4.4 Endotoxin Exposures of Swine Confinement Workers 60
Chapter 5: DISCUSSION
5.0 Overview of Chapter 62
5.1 Gas Exposure of Swine Confinement Workers 62
5.2 Exposure of Swine Workers to Swine Confinement Dust 65
5.3 Microbiological Analysis of the Air of Swine Confinement Buildings 68
5.4 Endotoxin Exposures of Swine Confinement Workers 71
5.5 Conclusions 74
5.6 Limitations of the Study 75
5.7 Future Research 76
5.8 Study Recommendations 77
References 78
Appendix A 90
Monitoring Record Sheet
Appendix B 91
Details on Limulus Amebocyte Lysate End-point Assay

ix
List of Plates, Tables and Figures
PLATE PAGE
Plate 1: The Inhalable, Thoracic and Respira ble Dust Fractions 12
Plate 2: Structure and Components of Gram -negative
Bacteria Cell Membrane 14
Plate 3: General Architecture of Lipopolysaccharide 16
Plate 4: Personal Ammonia Sampler 37
Plate 5: Carbon Dioxide Sampler 38
Plate 6: Exploded view of the IOM Inhalable Dust Sampler 39
Plate 7: IOM Inhalable Sampler 40
Plate 8: Sample Plan of Locations where Settle Plates
Were exposed in a Swine Confinement Unit 44
TABLE PAGE
Table 1: Previous Project Database:
Number of Personal Samples Collected 49
Table 2: Incorporated Database: Total Number of Personal Samples 49
Table 3: Carbon dioxide peak exposures (ppm) of the Various SEGs 50
Table 4: Ammonia Exposures of the Various SEGs 52
Table 5: Inhalable Dust Exposure s of the Various SEGs 54
Table 6: Respirable Dust Exposures of the Various SEGs 55
Table 7: Comparison of the Microbial Bioburden in Farms A and B 57
Table 8: The number of Microbes present in Different
Units in Farm A and Farm B 58
Table 9: Endotoxin Results (EU/m3 air) for Weaner,
Fattening and Farmer Workers 60
FIGURE PAGE
Figure 1: Example of Farmers Carbon Dioxide Exposure 51
Figure 2: Example of Weaner Unit Workers Daily Exposure to Ammonia 53

x
Abbreviations
ACGIH = American Conference of Governmental Industrial Hygienists
ARDS = Acute Respiratory Distress Syndrome
CEN = Comité Européen de Normalisation
CFU = Colony forming units
CH4 = Methane
CO = Carbon monoxide
CO2 = Carbon dioxide
db = decibel
db(A)= A-weighted decibels
DNA = Deoxyribonucleic Acid
EN = European Norm
EU = Endotoxin Unit
FEF75 = Forced Expiratory Flow at 75% Vital Capacity
FEV1 = Forced Expiratory Volume-In-One-Second
H2S = Hydrogen sulphide
HSA = Health and Safety Authority
IgE = Immunoglobulin E
INAB = Irish National Accreditation Board
IOM = Institute of Occupational Medicine
IrDA = Infrared Data Association
ISO = International Standards Organisation
xi
LAF = Laminar Airflow cabinet
LAL = Limulus Amebocyte Lysate
LPS = Lipopolysaccharide
MMI = Mucus Membrane Irritation
MSDS = Material Safety Data Sheet
NH3= Ammonia
NIHL = Noise Induced Hearing Loss
ODTS = Organic Dust Toxic Syndrome
OELV = Occupational Exposure Limit Values
ppeak = Peak Sound Pressure
PCR = Polymerase Chain Reaction
PPE = Personal Protection Equipment
ppm = Parts Per Million
rpm = Rotations Per Minute
SEG = Similar Exposure Group
SPSS = Statistical Package for Social Science
STEL = Short Term Exposure Limit
TWA = Time Weighted Average
USB = Universal Serial Bus
VRBA = Violet Red Bile Agar
1
1. 0 Overview of Chapter
This research presents work aimed at determining the occupational exposure of workers in the
swine industry to respiratory hazards. In this chapter an overview of the agriculture industry in
Ireland is discussed, while focusing on the swine industry for the remainder of the research. The
principal occupational hazards these workers are exposed to are identified, with particular
emphasis on respiratory hazards, namely gases, swine confinement dust and endotoxin. The
background to the study is also outlined and the overall objectives of the study are highlighted.
1.1 Agriculture Industry in Ireland
The agriculture industry in Ireland is of major importance to both our economy and the Irish
way of life. Traditionally, most count ry families practiced some form of farming and currently
farmers represent seven per cent of the Irish workforce (Teagasc, 2006). The relatively recent
move towards intensive livestock production and larger confinement buildings has brought with
it not only large increases in productivity per farm worker, but also has resulted in an increased
potential exposure to physical, chemical and biological health hazards. Although these modern
swine confinement buildings may appear ‘cleaner’, the air quality inside these units has become
an issue for both workers and for the environment. Thus, despite notable advances a n
occupation in the farming industry inadvertently results in multiple exposures to a variety of
dusts, toxic gases and bioaerosols - many of which may contribute to respiratory symptoms and
disease. Agricultural workers have higher rates of long -term sick leave associated with
respiratory disease than any other workers (Hoppin et al., 2002). Accordingly, second to
chronic back pain (forty-nine per cent), respiratory problems account for thirty -five per cent of
illnesses reported by Irish farmers (Health and Safety Authority, 2003).

2
1.2 Swine Production
Upon joining the European Union, farmers in Ireland began to specialise in different activities,
resulting in a drastic trend from almost every farm keeping pigs outdoors to currently less than
600 commercial pig farms. Donham and co-workers (1977) were the first to observe the
harmful effects of working with swine. Since then much research has been directed to the
hazards encountered by the workers in these swine confinement buildings. It has been
acknowledged that the increased frequency of symptoms of respiratory disease is related to the
number of years and percentage of the day spent working with swine (Donham et al., 1989).
Hoppin and co-workers (2003), in a study aimed at investigating the role of animal exposures
and wheeze, found that among European farmers, swine farmers had more work related
symptoms and were fifty per-cent more likely to wheeze than cattle farmers.
1.3 Respiratory Hazards in the Swine Industry
The air of swine confinement buildings is very complex and contains many contaminants that
are hazardous to human health. The respiratory hazards to which swine workers are exposed
include gases, swine confinement dusts and microorganisms or their components that can
become airborne and be inhaled. Gases are predominantly produced in swine production
facilities either directly by animals and excreta or microbial degradation of manure (Lemay,
2002). Gases typically produced include carbon dioxide, carbon monoxide, ammonia, methane
and hydrogen sulphide. Inhaled gases can act by being irritant, toxic or asphyxiating. Dust is an
aerosol containing solid particles made airborne by mechan ical disintegration of solid particles,
ranging in size from less than 1 µm to greater than 100 µm. The dust generated within indoor
swine buildings may contain many types of particles including: Animal dander; faecal material
and urine of both pigs and rodents; feed components; bedding materials; absorbed gases and
chemicals. Importantly, this dust also contains microorganisms such as viruses, bacteria, yeasts,
moulds and their by-products (Kirychuk, 2002). Such dust is more appropriately referred to as
‘bioaerosols’, as it is primarily made up of particles of organic origin. Somewhere in the region
of seventy to ninety per cent of swine confinement dust is thought to be biologically active in

3
its effects (Borg, 1999). Therefore this dust can serve as eith er an irritant or occasionally an
allergen. Furthermore, it is relevant to note that in addition to adversely affecting human health,
excessive dust effects the health of the swine, increases labour requirements for building and
equipment maintenance, and interferes with the performance of ventilation systems.
Endotoxin is an additional respiratory hazard of concern regarding the health of workers in
swine confinement buildings. They are a group of lipopolysaccharide (LPS) molecules making
up the outer membrane of gram-negative bacteria, and dose-response relationships have been
found between endotoxin in organic dusts and respiratory symptoms (Rylander, 2002; Beijer
and Rylander, 2005). Endotoxins are ubiquitous in nature but livestock confinement units
present one of the highest concentrations to be found anywhere (Thorne, 2004). Interestingly it
has been suggested that endotoxins may be a more significant contributor than dust is to swine
workers’ problems with chronic cough and bronchitis (Hoppin, 2003) .
1.4 Background to Project
While the levels of the above hazards have been investigated in Europe (Simpson et al., 1999),
Asia (Chang et al., 2001) and America (Cormior et al., 1990), there is no published data on the
extent to which they contaminate t he air of Irish agricultural buildings. This lack of data is an
important point as it not known to what extent variables such as the temperature and relative
humidity of the various climates would affect the levels of the particular contaminants. The
focus of the objectives of the Health and Safety Authority’s (HSA) National Strategy for
Workplace Well-being is on the health of employees in the workplace and on how this can be
improved through well-defined and practical programs based on quality information . This
initiative is in line with the relatively recent recognition of the importance of the health of
workers, be it in the primary, secondary or tertiary sectors. As regards agriculture, we know that
a significant target of the HSA Farm Safety Plan 2003 -2007 is to improve the health and safety
of farm workers through engineering/workplace design, enforcement and education/training.
This project aims to address this important data gap that exists in the Irish agricultural sector,
specifically the actual exposure levels of workers in the swine industry to respiratory hazards.

4
1.5 Research Objectives
Thus, the primary objective of this project is to evaluate Irish swine farmers’
occupational exposure to respiratory hazards, namely gases, swine confinement d usts
and endotoxins. The farms employed will take account of variables such as size,
facilities, age and productivity. The workers will be identified using Similar Exposure
Groups (SEGS), depending on the unit in which they work, either: Weaner unit,
farrowing unit, dry sow unit, fattening unit and the general farmer who works in all
units.
The results are to be compared to both the Occupational Exposure Limit Values
(OELV’s) and the recommended health limits for the prevention of acute respiratory
symptoms in the swine workers.
In addition, while there have been notable advances in engineering controls, it is
necessary to consider the various occupational exposure control measures and best -
practices that exist within the swine industry and their possible implications on the
health of swine workers.

5
2.0 Overview of Chapter
In this chapter an overview of the relevant research and literature is discussed. The nature of
swine production in Ireland is outlined. A summary of the occupational haza rds encountered in
swine confinement buildings is given, namely gases, swine confinement dust, microorganisms,
endotoxin, confined spaces, chemical hazards and noise exposures. In addition, occupational
diseases such as acute bronchitis, sinusitis, organic dust toxic syndrome, occupational asthma
and zoonotic infections experienced by swine confinement workers are identified. Furthermore,
control measures and best practices that exist within the industry are documented in this chapter
and their possible implications on the health of the workers are discussed.
2.1 Swine Production in Ireland
Traditionally every farm in Ireland had at least one pig kept outdoors; however, the current
trend is towards more intensive swine confinement buildings. There are an estimated 1.7
million pigs in Ireland, with more than half of all pigs being found in just four counties, namely
Cork, Cavan, Tipperary and Waterford (Teagasc, 2006). The average breeding herd has 355
sows with the pigs housed indoors, in specialised confi nement buildings. The current swine
density in Ireland is 40 pigs/km 2, which is similar to countries like the United Kingdom, Spain
and Germany (Anderson, 2001) . Most pig production units in Ireland are integrated units,
where the entire production cycle t akes place in one location. The designs of these swine
confinement buildings are aimed at protecting animal welfare and simplifying management,
while allowing one person to care for approximately 150 sows and their offspring through to
slaughter weight (Teagasc, 2006). The life cycle of such pigs consists of: Dry sows, farrowers,
piglets (birth to 6.5 kg), weaners (1 st stage 6.5 - 15kg; and 2nd stage 15 - 35 kg), and fatteners
(35 - 93 kg). The feed used for swine in Ireland is mainly meal and water. This c an be delivered
to the pigs separately, in a dry feeding system, or pre -mixed in a wet feeding system. Most
farms employ automatic systems for the distribution of the feed. As with other industries, the
viability of the swine industry is influenced by vari ables such as the environment, consumer
demands/trends competitive ability and the economy

6
2.2 Occupational Hazards found in Swine Confinement Buildings
2.2.1 Gases
Although approximately 160 different gases have been identified in the ambient air of sw ine
confinement buildings, many of these gases are present only in trace amounts and are not linked
to occupational respiratory illnesses. However, many of these gases produced in small
quantities, such as volatile acids, amines and meracaptans contribute to the characteristic
odours in swine facilities (von Essen, 2001). Gases of concern typically produced in swine
confinement buildings include: Carbon dioxide (CO 2), carbon monoxide (CO), ammonia (NH 3),
methane (CH4) and hydrogen sulphide (H 2S).
OELV exist to protect workers from excessive exposures to toxic chemicals in the workplace.
In addition to this 8-hour reference period, the following terms, which are used to quantify the
environment of the worker, shall be referred to:
The Time Weighted Average (TWA) is the employee's average airborne exposure in
any 8-hour work shift of a 40 hour working week. Concentrations are set at levels to
which nearly all workers may be repeatedly exposed without adverse effects.
The Short Term Exposure Limit (STEL) is the employee's 15-minute time weighted
average exposure that shall not be exceeded at any time during a working day. These are
set at concentrations to which workers can be exposed continuously for a short period of
time without suffering from adverse eff ects.
7
2.2.1.1 Carbon dioxide (CO 2)
Carbon dioxide occurs primarily as a normal by -product of pig respiration. Exposures to high
levels of carbon dioxide (20, 000 ppm) can result in deep rapid breathing (Doss et al., 2002). If
there is a ventilation failure (or lack of) in a fully occupied, completely enclosed fattening unit
the carbon dioxide level can rise rapidly, and in addition to depletion of oxygen, create an
asphyxiate atmosphere in as little as 6 hours (Donham, 2000). Carbon dioxide levels in swine
confinement buildings are used as a measure of the units’ air quality, and the adequacy of its
ventilation system. The reason for this is that the rate of carbon dioxide production per animal
is known, and if concentrations are kept below 0.5 per c ent then other gases do not usually
cause problems (Pearson, 1988). It is important to note that there is a seasonal variation in the
levels of this gas; while it may be over 4000 ppm in winter it is often under 1000 ppm in
summer (Lemay, 2002). This can b e explained by the increased ventilation rates during the
summer. Chang and co-workers (2001) reported mean concentrations between 600 and 895
ppm carbon dioxide. As per the 2002 Code of Practice to the Safety, Health & Welfare
(Chemical Agents) Regulations, 2001:
8 hour OELV - 5000 ppm
15 min STEL - 15,000 ppm
Donham’s (2000) recommended health limit for swine confinement workers’ exposure to
carbon dioxide is 1,540 ppm, as it was found that concentrations in excess of this were
associated with a higher proportion of ill health in workers.

8
2.2.1.2 Carbon monoxide (CO)
Carbon monoxide is produced from incomplete combustion of organic matter. It occurs in
exhaust fumes from improperly maintained or malfunctioning engines and direct burning
heaters where there is inadequate ventilation. Acute exposure to carbon monoxide has an
insidious onset with giddiness, headache, chest tightness and nausea; unconsciousness rapidly
supervenes at concentrations in excess of 3500 ppm (Harrington et al., 1998). As per the 2002
Code of Practice to the Safety, Health & Welfare (Chemical Agents) Regulations, 2001:
8 hour OELV - 20 ppm
15 min STEL - 100 ppm
2.2.1.3 Ammonia (NH3)
Ammonia is released into the air from the breakdown of urea in the urine of the animals. In
addition to the storage of liquid manure, ammonia gas is produced from the drying of manure
and urine on the solid floor surfaces of the pig houses. As it is water-soluble, ammonia is
rapidly absorbed in the upper airways, with the result of damaging th e upper airway epithelia
and impeding lung cilia from clearing dust particles (Merchant, 2002). Ammonia has a low
odour threshold of less than 5 ppm, meaning that its presence is readily detectable above this
concentration. Eye irritation and respiratory p roblems occur around 6 to 20 ppm and above;
while at 40 to 200 ppm headaches, nausea, reduced appetite, irritation to airways, nose and
throat occurs (Doss et al., 2002). There is much speculation in the literature as to the possibility
of ammonia gas particles adhering to respirable dust particles, and consequently being carried
deep into the lungs of exposed individuals, thus adding to their potential toxicological effects.
9
The release of ammonia from urea is a slow process governed by factors such as ammonia
concentration, pH, temperature, air velocity and emitting surface area. Accordingly, as with
carbon dioxide levels, ammonia levels can vary with the time of year in question; ammonia
concentrations can be between 20 and 30 ppm under winter conditi ons but are often much
lower in the summer, often due to increased ventilation rates (Lemay, 2002). In a study aimed
at determining the temporal variation of indoor air quality in enclosed swine confinement
buildings ammonia levels, O’Shaughnessy and co -workers (2002) reported ammonia to average
at only 3.6 ppm in their well -maintained study site. Chang and co-workers (2001) reported
mean concentrations of less than 5 ppm ammonia, while Wathes and co-workers (1998)
reported peaks of 18 ppm. As per the 2002 Code of Practice to the Safety, Health & Welfare
(Chemical Agents) Regulations, 2001:
8-hour OELV- 20 ppm
15 min STEL - 35 ppm
Donham’s (2000) recommended health limit for swine confinement workers’ exposure to
ammonia is 7 ppm.
2.2.1.4 Methane (CH4)
Methane is the colourless, odourless, flammable gas present in ‘natural gas’, which is
continuously produced by anaerobic decomposition of slurry. Methane is rarely a problem in
swine buildings, however at high concentrations (500,000 ppm) can cause hea daches and even
asphyxiation (Doss et al., 2002). If it accumulates in slurry stores and is present at the correct
concentration methane posses as an explosion hazard. Deep pit units are more likely to promote
methane accumulation and it is imperative that they are properly ventilated.

10
2.2.1.5 Hydrogen sulphide (H 2S)
Hydrogen sulphide is a colourless gas that smells like ‘rotten eggs’ and it is both an irritant and
an asphyxiant. It is produced during the decomposition of manure -slurry or sewage and remains
there until movement causes its release. This gas is of serious concern in both the cattle and
swine industries. Chronic low-level exposure to hydrogen sulphide is associated with anosmia,
the loss of ability to detect odors. This lack of ability to smell hydrogen sulphide results in no
warning of concentrations that can result in loss of consciousness. At higher levels, hydrogen
sulphide exposure causes hydrogen sulphide poisoning, pulmonary edema, Acute Respiratory
Distress Syndrome (ARDS), coma and death. The ambient level of hydrogen sulphide in a well -
ventilated swine unit will be less than 3 ppm. However, when manure is being agitated
hydrogen sulphide can rapidly reach levels that can cause immediate unconsciousness and
death in just a few seconds; with hydrogen sulphide levels above 500 ppm, unconsciousness
may result in just a few breaths. This gas is the principle hazard in confined swine areas.
Reported mean concentrations in the literature range from 0.2 to 10 ppm hydrogen sulphide
(Chang et al., 2001; Donham et al., 1977). As per the 2002 Code of Practice to the Safety,
Health & Welfare (Chemical Agents) Regulations, 2001:
8-hour OELV - 10 ppm
15 min STEL - 15 ppm
11
2.2.2 Swine Confinement Dust
When dust measurements are being tak en in relation to health effects, the sampling convention
relates to the penetration of the aerosol to regions of the respiratory tract and its aerodynamic
diameter. The definition of these conventions has been agreed between the Comité Européen de
Normalisation (CEN), the International Standards Organisation (ISO) and the American
Conference of Governmental Industrial Hygienists (ACGIH).
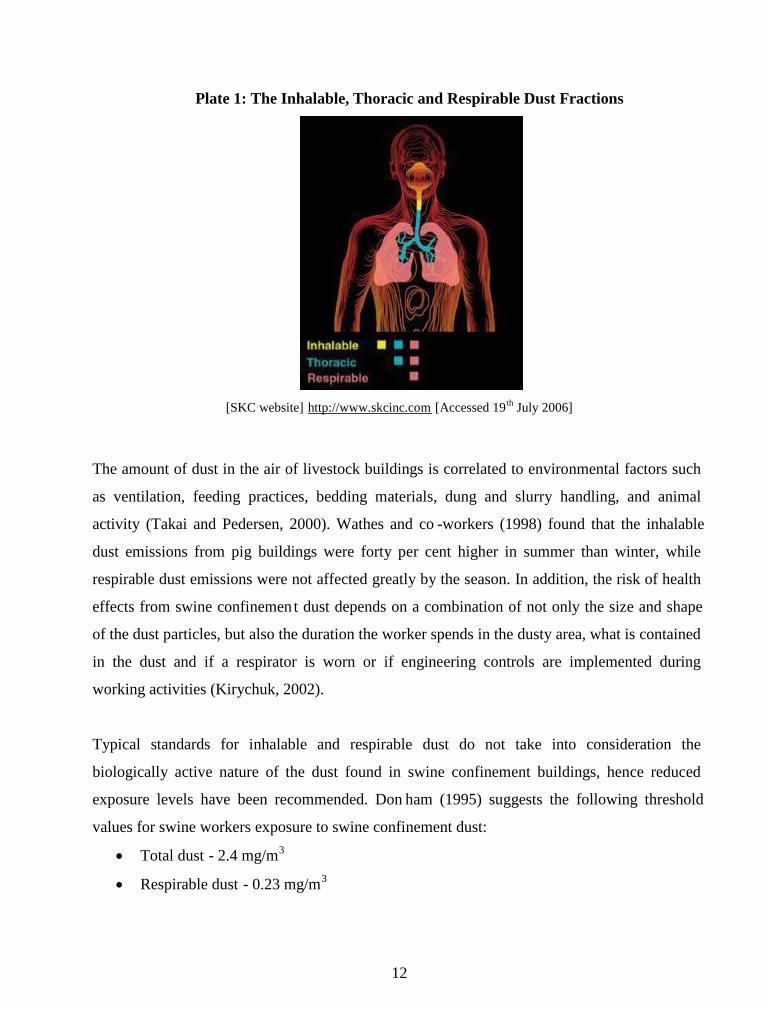
The inhalable fraction , which includes the thoracic and respirable fractions, is defined
as the mass fraction of the total airborne particles that are inhaled through the nose
and/or mouth. Inhalable fractions have no median aerodynamic diameter but are
generally less than 100 µm. Some of these airborne particulates are trapped in the
mucous of the nose and pharynx and ar e prevented from travelling deeper into the lungs.
The thoracic fraction, which includes the respirable fraction, is defined as the mass
fraction that penetrates the respiratory system beyond the larynx. These particles have a
mean aerodynamic diameter of 11.64 µm.
The respirable fraction is defined as the mass fraction that penetrates to the unciliated
airways of the lung, known as the alveolar region, where gaseous exchange takes place.
The respirable fraction has a mean aerodynamic diameter of 4.25 µm (Ashton and Gill,
2000).
12
Plate 1: The Inhalable, Thoracic and Respirable Dust Fractions
[SKC website] http://www.skcinc.com [Accessed 19 th July 2006]
The amount of dust in the air of livestock buildings is correlated to environmental factors such
as ventilation, feeding practices, bedding materials, dung and slurry handling, and animal
activity (Takai and Pedersen, 2000). Wathes and co -workers (1998) found that the inhalable
dust emissions from pig buildings were forty per cent higher in summer than winter, while
respirable dust emissions were not affected greatly by the season. In addition, the risk of health
effects from swine confinement dust depends on a combination of not only the size and shape
of the dust particles, but also the duration the worker spends in the dusty area, what is contained
in the dust and if a respirator is worn or if engineering controls are implemented during
working activities (Kirychuk, 2002).
Typical standards for inhalable and respirable dust do not take into consideration the
biologically active nature of the dust found in swine confinement buildings, hence reduced
exposure levels have been recommended. Don ham (1995) suggests the following threshold
values for swine workers exposure to swine confinement dust:
Total dust - 2.4 mg/m3
Respirable dust - 0.23 mg/m3

13
As with carbon dioxide and ammonia, exposures to concentrations in excess of the above
values were found to be associated with higher levels of ill health in workers. In addition
Donham and co-workers (2002) highlighted that the resultant adverse health effects of
ammonia and particulates in combination was greater than the additive effect of ammonia and
particulates by a factor of fifty three to one hundred and fifty -six per cent. These authors
concluded that maximum exposure concentrations must be less than the individual exposure
limits as workers are exposed to both substances simultaneously.
2.2.3 Microorganisms
One must acknowledge the vastness of microbial diversity and the fact that it is a result of
successful evolutionary events that have conferred survival value on the microorganisms in
existence today (Madigan et al., 2000). A brief understanding of what constitutes this microbial
diversity is desirable. The major groups of living organisms are Bacteria, Archae and Eukarya.
Several evolutionary branches occur within the Bacteria, which include all known pathogenic
prokaryotes and most of the bacteria found in the soil, water, animal digestive tracts, and many
other environments. Conversely, most Archae are anaerobes; cells incapable of living in air and
inhabiting what humans consider as being extreme environments. The microbial Eukarya
include the algae, fungi and protozoa. Three major groups of fungi are recognised: moulds,
yeasts and mushrooms.
These microorganisms and their products are easily accumulated and aerosolised in the densely
populated and enclosed areas of swine confinement buildi ngs. It has been shown that swine
workers are highly exposed to microbes present in dust at their workplaces; Cormior and co-
workers (1990) found that the air of swine confinement buildings is highly contaminated with
bacteria, yeast and moulds at a level up to 1200 – fold greater than so called “normal air”. The
bacteria are gram-positive and gram-negative and largely of fecal origin (Donham, 2000).
Importantly dust in swine buildings contains far more than purely viable organisms; microbial
products with health implications include antigens, glucans, and endotoxins
14
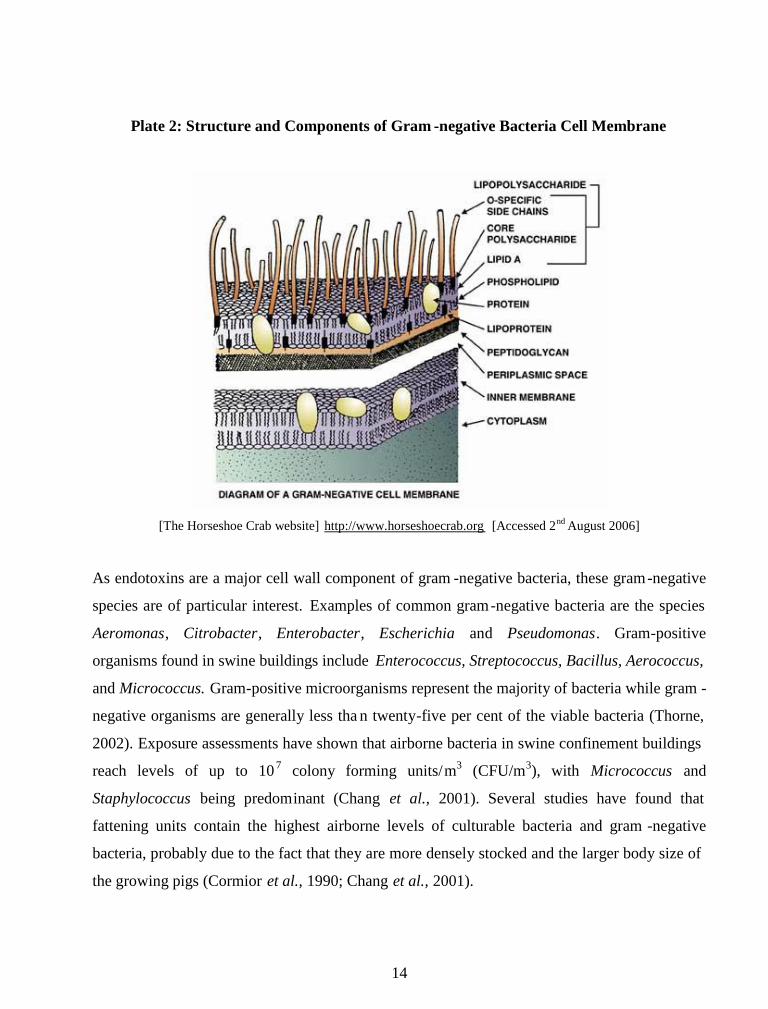
Plate 2: Structure and Components of Gram -negative Bacteria Cell Membrane
[The Horseshoe Crab website] http://www.horseshoecrab.org [Accessed 2nd August 2006]
As endotoxins are a major cell wall component of gram -negative bacteria, these gram-negative
species are of particular interest. Examples of common gram-negative bacteria are the species
Aeromonas, Citrobacter, Enterobacter, Escherichia and Pseudomonas. Gram-positive
organisms found in swine buildings include Enterococcus, Streptococcus, Bacillus, Aerococcus,
and Micrococcus. Gram-positive microorganisms represent the majority of bacteria while gram -
negative organisms are generally less tha n twenty-five per cent of the viable bacteria (Thorne,
2002). Exposure assessments have shown that airborne bacteria in swine confinement buildings
reach levels of up to 10 7 colony forming units/m3 (CFU/m3), with Micrococcus and
Staphylococcus being predominant (Chang et al., 2001). Several studies have found that
fattening units contain the highest airborne levels of culturable bacteria and gram -negative
bacteria, probably due to the fact that they are more densely stocked and the larger body size of
the growing pigs (Cormior et al., 1990; Chang et al., 2001).

15
Yeasts and moulds are also very concentrated in the air of swine confinement buildings. As
with bacteria, they appear to be present at similar portions to what might be found outdoors, but
are concentrated by a factor of 100 to 10,000 (Donham, 2000). Although many of these fungi
are parasitic on animals, including humans, they are generally less significant pathogens than
are bacteria and viruses. Nevertheless , the role of more than eighty airborne fu ngi in the
development of respiratory allergy and asthma has been established ( Adhikari et al., 2004).
Prevalent airborne fungi associated with swine buildings include Cladosporium, Ascospores,
smut spores, and Basidiospores. Fungal products or components of note include conidia and
microconidia, hyphal fragments, mycotoxins and glucans (Thorne, 2002). Some fungi such as
Aspergillus and Penicillium species are known to produce extrinsic allergic alveolitis, a clinical
entity found in swine workers (Cormior et al., 1990).
It is necessary to acknowledge the restrictions of the pure culture approach for the culturing and
enumeration of microorganisms. The term "the great plate count anomaly" was coined by
Staley and Konopka in 1985 to describe the difference in orders of magnitude between the
numbers of cells from natural environments that form colonies on agar media and the numbers
countable by microscopic examination using methods such as DNA staining (Connon and
Giovannoni, 2002). The concentrations of non-culturable aerobic and anaerobic organisms in
the particulate matter in swine confinement buildings is known to be 10 to 100 -fold higher than
the culturable organisms. Nonetheless culture is still one of the most popular methods of
bioaerosol sampling as it allows determinations of microbial composition and concentration
simultaneously (Chang et al., 2001). However, since many of the airborne organisms are not
culturable, it is often necessary to employ non -culture based methods for a more precise
identification. These molecular biological techniques include use of direct count methods with
deoxyribonucleic acid (DNA) staining and epifluorescence microscopy, fluorescent in situ
hybridization, and Polymerase Chain Reaction (PCR) techniques (Thorne, 1992). Fo r the
purpose of determining exposure in the current study, the endotoxin content of the air may be a
more reliable measure of biological exposure than bioaerosols, as it is independent of the ability
to culture the microorganism.

16
2.2.3.1 Endotoxin
Endotoxins are a major cell wall component of gram -negative bacteria. They are highly
inflammatory substances and are believed to be a major agent in initiating respiratory disease in
swine confinement workers and animals. Endotoxins are lipopolysaccharide (LPS) molecules
that consist of three distinct regions: O -specific polysaccharide, core polysaccharide (outer and
inner cores), and lipid A.
Plate 3: General Architecture of Lipopolysaccharide
[Todar’s Online Textbook of Bacteriology website] www.textbookofbacteriology.net
[Accessed 2nd August 2006]
The lipid A region of LPS exhibits little variation across genera and impar ts the toxicity to
endotoxin, while immunogenicity is associated with the polysaccharide components.
Subsequent to LPS biosynthesis in the cytoplasmic membrane, LPS molecules are transported
to the surface and function as the principle surface antigens of gram-negative bacteria. It is the
lipid A region that causes harmful health effects in humans after exposure to endotoxin.
Humans are able to produce antibodies to endotoxins after exposure, but these are generally
directed at the polysaccharide chain, and do not protect against a wide variety of endotoxins.
The term LPS, although not totally accurate, is often used interchangeably with endotoxin; this
term was adopted before the discovery of the toxic lipid A moiety.
It has been shown that multiple expos ures to endotoxin-containing swine confinement building
air induces airway hyper-responsiveness, increases mucus -containing airway epithelial cells,
lung inflammation, increased asthma severity, mucous membrane irritation (MMI), chronic
bronchitis, byssinosis, toxic pneumonitis, and hypersensitivity pneumonitis (Charavaryamath et

17
al., 2005). The alterations in pulmonary function are characterised most typically by a decline
in forced expiratory volume-in-one-second (FEV1); and this was found to be in a dose
dependent way (Donham et al., 1989). Conversely, it has been reported that low -level
endotoxin exposure induces tolerance to subsequent endotoxin challenges by challenging the
immune system (von Essen, 2001).
Similarly conflicting evidence exists in rela tion to endotoxin exposure and asthma. Some
studies indicate an increased risk of asthma after endotoxin exposure, while others indicate that
endotoxin exposure protects from asthma. Radon, (2006) postulates that these differences can
be explained when different asthma phenotypes are considered and the possibility that not all
asthma is associated with allergic sensitisation. Atopic asthma is caused, in susceptible
individuals, by sensitisation to and subsequent inhalation of allergens (Merchant, 2002). The
risk of atopic asthma, mainly dominated by eosinophilic response, is decreased in those
exposed to endotoxins. In contrast, the risk of nonatopic asthma, often referred to as asthma -
like syndrome and characterised by neutrophilic response, is enhanced in subjects with higher
endotoxin exposure.
While numerous studies have been undertaken in the area of endotoxin and its health effects,
the exact connection between endotoxin exposure and respiratory illness is still poorly
understood (Portengen et al., 2005). This problem is a result of many factors, including
inconsistent associations between exposure and adverse health affects, underdeveloped
sampling collection techniques, limitations on the accuracy of current endotoxin analysis
techniques, and only very limited information on the relationship between concentrations of
endotoxin in the air and settled dust (Pheatt, 2001). Furthermore, exposure to ammonia and
endotoxin-rich dust has been shown to act synergistically to adversely affect respiratory health
in both animals and humans (Sigurdarson et al., 2004).
Despite the fact that there is a clear recognition of endotoxin being a respiratory hazard there
are no occupational exposure limit values. Rylander (1985) calculated an endotoxin threshold
of 33 ng/m3 based on spirometric data; Castellan (1987) recommended an endotoxin exposure

18
limit of 9 ng/m3 based on a cotton dust study; and Palchak (1988) suggested an endotoxin
threshold of 30 ng/m3 in the pharmaceutical industry to trigger medical surveillance (W hite,
2002). Much of the endotoxin literature reports results in weight units (usually nanograms).
However it is important to note the inaccuracy in comparing data from studies that report
results in weight units of endotoxin, since different endotoxin pre parations do not necessarily
have equivalent potencies. To address this concern the Endotoxin Unit (EU) was implemented
as a measure of activity or potency of endotoxin, as opposed to gravimetric methods
(approximately 10 EU equals 1 ng i.e. 300 EU ≈ 30 ng).
Recommended exposure limit thresholds for endotoxin have been suggested ranging from 50 to
2000 EU/m3 (Radon, 2002). There is a drastic range in the levels of endotoxin detected in swine
confinement buildings. Chang and co -workers (2001) reported low levels of endotoxin
exposure for swine workers. These authors reported average concentrations of airborne total
endotoxin between 37 and 298 EU/m3, while respirable endotoxin was between 14 and 129
EU/m3. It is relevant to note however, that this particula r exposure assessment was carried out
in open style swine houses where there would invariably be more air circulation from the
outdoors. Conversely, Simpson and co -workers (1999) reported high levels of endotoxin
exposure for swine workers in enclosed conf inement buildings in the region of 149,230 EU/m3.
2.2.3.2 Endotoxin Sampling, Extraction & Analysis
An area of considerable uncertainty is that of endotoxin sampling and extraction of samples in
the environmental setting. Filter media and extraction sol utions are potential sources of
variation in the overall procedure. Commonly used filters include g lass fibre, cellulose esters,
polyvinyl chloride and polycarbonate membrane. Laitinen (1999) found that samples collected
on glass fibre filters showed highe st amounts of detectable endotoxin after collection. It was
also determined that the best efficiency was attained by extraction with non -pyrogenic water
within 8 hours after sampling, followed by storage of the extracts at 4°C until they were
analysed.
19
The effect of preservation method on detectable concentrations of endotoxin is an issue of great
importance. It has been recommended that t he extracted samples should be stored in a
refrigerator rather than in a deep -freezer because freezing and thawing decre ases the
concentration of detectable endotoxin in the LAL assay. A twenty-five per cent reduction in
endotoxin activity per freeze-thaw cycle has been reported in many studies, while storage of
samples for a period of less than 1 year at 7°C had no effect (Douwes et al., 1995). According
to Laitinen (1999) the air samples extracted on the day of collection showed larger amounts of
endotoxin than those stored at 4ºC without extraction. Furthermore, the difference was found to
increase with prolonged preserva tion time.
Concentrations of endotoxin can be quantified by several mondifications of the Limulus
Amebocyte Lysate (LAL) assay. This is an in vitro test utilising lysate of blood cells of the
horseshoe crab, Limulus Polyphemus , which enzymatically interacts with endotoxins (Ziljstra et
al., 1997). The LAL assay measures LPS potency, which is dependent on factors such as the
fatty acid content of the Lipid A portion, the polysaccharide content and LPS aggregational
properties (White, 2002). There are severa l variations of the LAL assay available for
quantification of endotoxins from different environmental settings. The LAL endpoint assay,
generates ranks or levels at which the endotoxin is present or not, while the kinetic LAL assay
is capable of determining exact levels of endotoxin present in a sample.
2.2.4 Confined Spaces
The Safety, Health and Welfare at Work (Confined Space) Regulations 2001 are applicable to
all workplaces involving work in confined spaces. Examples of confined spaces in swine
confinement facilities include enclosed tanks, manure pits and grain bins. According to
Kirychuk (2002) there are four main dangers in such confined spaces:
1. Oxygen deficiency and oxygen enrichment
2. Fire and/or explosion
3. Build up of harmful levels of gases, vapo urs or particles resulting in potential health
hazards and immediately dangerous to life and health
4. Drowning in liquids and/or entrapment in free -flowing solids

20
2.2.5 Chemical Hazards in Swine Confinement Buildings
In addition to the previously discussed respiratory hazards, swine workers encounter many
chemical hazards during their typical working day. These include solvents, vetinary drugs and
cleaners. The material safety data sheet (MSDS) for every chemical indicates how the worker
can be exposed to the chemicals by identifying the routes of entry. The risks of working with
such chemicals must be assessed - identifying how often, for how long and under what
conditions exposure occurs (Kirychuk, 2002).
2.2.6 Noise Exposure in Swine Confinement Buildin gs
Farmers are exposed to loud noises from both animals and equipment on the farm. Exposure to
high levels of noise over an extended period, or intense noise for a short period can damage
ones hearing. Permanent damage known as Noise Induced Hearing Loss (NIHL) cannot be
repaired because of damage to the cilia in the cochlea of the ear, which sense and transmit
sound messages to the brain. The noise levels within a swine confinement building will vary
greatly throughout the day, with the levels increasing greatly during feeding, due to both the
increase in animal activity and the dry feeding systems themselves. Automatic feeding systems
allow the swine workers to avoid the areas during feeding. In addition, automatic feeding
systems that feed all animals at the same time reduce noise from pigs waiting to be fed.
Engineering controls to reduce noise are difficult and often impractical in swine confinement
buildings as the animals are the primary source of high noise levels. Adsorptive materials and
baffles are not an option in these settings due to the requirements for stringent cleaning with
high-pressure spraying equipment. Thus, personal protection equipment is a viable option in the
swine industry for prevention of noise induced hearing loss, providing n oise attenuation in
excess of 30 decibel (db) at frequencies most common in swine confinement buildings
(Donham, 2000).

21
The Safety, Health and Welfare at Work (Control of Noise at Work) Regulations 2006 contain
strict noise exposure limits and responsibil ities for employers. The Regulations contains noise
‘Exposure Limit Values’ and Exposure Action Levels’, which are based on ambient noise
levels and trigger different degrees of protective measures. In each case a daily or weekly
average noise exposure value in A-weighted decibels (dB(A)) is accompanied by a peak sound
pressure (ppeak) to take account of high instantaneous noise levels. As per the Regulations, the
limits are as follows:
Exposure Limit Value of 87 dB(A) and a p peak of 200 Pa
Upper Exposure Action Value of 85 dB(A) and a p peak of 200 Pa
Lower Exposure Action Value of 80 dB(A) and a p peak of 112 Pa
Where noise exposure exceeds the Upper Exposure Action Value, workers are obliged to use
the individual hearing protectors, which the employer m ust make available to them when the
Lower Exposure Action Value is exceeded.

22
2.3 Workers in the Swine Industry
It has been well documented that workers in the swine industry often leave this environment
because of respiratory symptoms with in weeks or months of commencing employment.
Accordingly, swine workers are considered a ‘survivor population’, comprising of those who
can tolerate exposure to the various levels of hazards. However, there are several groups of
workers that deserve mentioning. As with many other industries in Ireland, foreign workers
constitute a noteworthy proportion of work force in the swine industry. This directly results in
many social and language barriers, which have implications for their training, health and healt h
care. Language barriers can impede following safety instructions on labels and training in
proper work practices.
Also of interest is the fact that pregnant workers are more susceptible to carbon monoxide
poisoning and hormonal drugs, such as prostagla ndin and oxytocin, which are used in the swine
industry. Carbon monoxide is occasionally present in levels of 50 to150 ppm that could harm
the human fetus but may not be acutely toxic to adults (Donham, 1995). It has been reported
that the swine environments and cigarette smoke exposures are likely to be additive in terms of
the risk of developing bronchitis (von Essen, 2001). Smokers have also been associated with a
reduced baseline pulmonary functioning and a greater decline in pulmonary functioning duri ng
a work shift (Donham, 1995). All susceptible workers, including those predisposed to asthma,
should be accommodated for, monitored accordingly and special attention given to their
specific needs.

23
2.4 Occupational Diseases in Swine Workers
There are several illnesses habitually experienced by those working in the swine farming
industry:
2.4.1 Acute bronchitis
Acute bronchitis is the most common complaint among swine workers, affecting as many as
seventy per cent of swine workers. This is an irritant-induced inflammatory condition of the
airways. The symptoms of bronchitis are cough and sputum production, which occur for usually
less than a year and typically dissipate within a year with decreased exposure (Donham, 2000).
However it may lead to chronic bronchitis, with cough and sputum production for two or more
years being characteristic of this disorder (Merchant et al., 2002).
2.4.2 Sinusitis
Sinusitis is often chronic among swine workers who may complain of a continual or frequent
cold “they just cannot shake,” and symptoms such as a stuffy head, difficulty in breathing
through the nose, headache, and/or “popping ears” (Merchant et al., 2002). These symptoms are
often accompanied by an irritant rhinitis and pharyngitis (Donham, 2000). Sinusitis and rhinitis
have been collectively referred to as mucus membrane irritation (MMI), which has been
attributed mainly to exposure to the combination of bioaerosol, endotoxin and ammonia.

24
2.4.3 Organic Dust Toxic Syndrome (ODTS)
Organic Dust Toxic Syndrome is a febrile illness characterised by a spectrum of symptoms
including malaise, joint and muscle pain, chest tightness, headache and nausea after exposure to
large amounts of organic dust contaminated with microorganisms (von Essen, 200 1).
Symptoms appear four to eight hours after exposure occurs and can last for several days. ODTS
results from unspecific stimulation of the immune system by a high concentration of bioactive
substances. These mostly consist of microorganisms and their pro ducts such as endotoxins, to
which swine workers are constantly exposed. It is likely that endotoxin exposure is the cause of
the signs and symptoms of ODTS because they can be reproduced by experimental exposure
(Rylander et al., 1989; von Essen, 2001). ODTS has been frequently mistaken for “farmers’
lung”, as they have the same acute symptoms; however this condition is seen mainly in dairy
farmers, as opposed to swine farmers. In a European farmers’ study the lifetime prevalence of
ODTS in pig farmers was found to be twenty-three per cent (Radon, 2006).
2.4.4 Occupational asthma
Occupational asthma includes periodic airway obstruction, chest tightness, wheezing, and
dyspnea; this does not occur on first exposure but may develop after weeks to months. S wine
workers with pre-existent asthma typically experience severe asthma upon first exposure to
animal confinement facilities and select themselves out of these jobs. Hence, reference to the
“survivor population”. Occupational asthma may result from repeat ed exposure to the work
environment. It has two basic mechanisms: 1) immunologically mediated or allergic
[Immunoglobulin E (IgE)], or 2) chronic irritation. Allergic occupational asthma is not a
common cause of swine farmer illness, as these are the worke rs who commonly self-select
themselves out of employment. Non -allergic occupational asthma or asthma -like syndrome, on
the other-hand, has been found to effect up to twenty per cent of swine confinement workers
(Merchant et al., 2002)

25
2.4.5 Zoonotic infections
A zoonotic infection is one that can be transmitted between animals and humans. Several swine
infections can be transmitted to humans, some with potentially serious outcomes. These include
brucellosis, erysipeloid, streptococcus suis meningitis, asc ariasis, swine influenza, scabies,
ringworn, leptospirosis, toxoplasmosis and salmonellosis. Toxoplasmosis is a risk for the fetus
of pregnant workers, and streptococcus suis meningitis may be fatal and permanent hearing loss
has been reported in survivors . A concern that has been raised in relation to microbes in the
swine industry is antibiotic resistance. Swine are often fed low -levels of antibiotics for growth
promotion or more frequently for the treatment of infectious diseases. Humans may acquire
resistant zoonotic pathogens directly or may be infected with a nonpathogenic, resistant
organism that may then transfer the resistant gene to a pathogen in the gut of the individual
(Donham, 2000). However, many zoonotic infections can be prevented by control ling the
diseases in the animal and through the following of good occupational hygiene principles.
These occupational hygiene principles fall into three categories: Abiding by safe work
practices; using good personal hygiene methods; and wearing personal p rotection equipment
(Health Services Executive, 2005). Myers and co -workers (2006) conclude that swine workers
should be included in pandemic surveillance, and in antiviral and immunisation strategies.
26
2.5 Occupational Exposure Control Measure s in the Swine Industry
In relation to control measures it is imperative to refer to Schedule 3 of the Safety, Health and
Welfare at Work Act, 2005, which contains the General Principles of Prevention. As with any
kind of contaminated working environment, swine workers health and safety can be addressed
using different approaches that can be grouped as: 1) engineering control; 2) administrative
control; and 3) personal protection equipment (PPE). In the hierarchy of safety controls,
engineering solutions to health and safety problems are to be given priority. Administrative
controls such as limiting the amount of time that workers spend in the contaminated areas are
not expected to be effective in the relatively uncontrolled livestock industry (Barber et al.,
1999). Personal protection equipment should be considered as an invaluable means for
protecting ones health and for susceptible workers or tasks with longer than normal exposure.
It is important that these controls are implemented with worker health i n mind, and not just with
pig production as the principal incentive. Upon consideration and implementation of the various
controls, swine workers health can be protected through a comprehensive program of
environmental monitoring and control, through the u se of efficient management and work
practices, education/awareness training and health surveillance. Little attention has been given
to exposure monitoring and health assessments in the swine confinement industry in Ireland.
Improved health surveillance wi th baseline spirometry and ongoing screening for respiratory
disease is important and should be implemented for swine confinement workers.
It is imperative that while considering the following measures, to remember that no single
technique will present a universal solution due to the complexity of the sources of
contamination in swine confinement buildings. More appropriately a combination of
engineering controls and good practices will be necessary to provide an integrated solution.
27
2.5.1 Dust Control
As dust particles can carry gases and odours, control of dust improves the farmers’ exposure
and helps significantly in odour reduction. Factors determining the amount of dust include
cleanliness of the buildings, animal activity, temperature, relative humidity, ventilation rate,
stocking density and feeding method. Strategies that can greatly reduce or control the amount of
dust in swine buildings include the following measures:
2.5.1.1 Clean interior building surfaces
The intervals of cleaning the swine units vary significantly from one farm to the next. However,
most farms seem to adhere to an “All in, All out” policy. This entails a ll of the animals of a
particular age or reproductive stage being housed in the same room, and being moved to
different facilities or marketed at the same time. Accordingly, the farrowing units would be
cleaned every 4 weeks, as would the 1 st and 2nd stage weaner units. Depending on the weight
gain of the fatteners, approximately 1 kg per day, the fattening unit would be cleaned every 8-
10 weeks. However the dry sow unit would not follow the same clear -cut cycle as not all sows
farrow at the same time; hence this unit may be only partially cleaned from time to time. The
time between animal groups is used to empty pits, pr essure wash, and disinfect all of the
interior surfaces. Strict adherence to this practice would invariably help to reduce dust levels .
28
2.5.1.2 Reduce dust from feed
Feed is one of the main sources of dust and has accordingly been targeted as on e of the most
common methods for dust reduction. Addition of oil to dry swine rations significantly reduces
the amount of dust in a building. Gestation rations are often mixed with water, which also
greatly reduces dust (Chastain, 2000). Addition of lignin to straw has been shown to aid in
reducing the dust released from straw. One particular Danish study found that addition of a
thirty-nine per cent solution of lignin to shredded straw provided a ninety per cent reduction in
the tendency to release dust and a reduction in the endotoxin content and fungal spores released
by seventy and eight per cent respectively (The National Committee for Pig Production, 1999).
Proper and timely maintenance of feeders, augers, and other feed handling equipment is
required for proper dust control (Chastain, 2000). The covering of feeders in a weaner house
and levels of dust in the air was examined in a Dutch trial. There was no reduction of dust and
checking and cleaning of feeders was made more difficult for the workers; thus it was not
recommended to cover the mouth of feeders for dry feed (Roelofs and Binnendijk, 2000).
However, this suggestion has not been reflected on in other literature and the practice remains
in many farms of covering the mouths of the feeders.
2.5.1.3 Spraying with vegetable oil
A rational way of reducing airborne dust concentrations is to make the dust particles more
adhesive so that they are not dispersed by animal activity. Sprinkling vegetable oil, such as
soybean or canola oil, in very smal l amounts inside swine buildings has been shown to control
dust as well as odour and some gases (Zhang, 1996; Lormior et al., 2002). This control method
has received a lot of attention in recent years, and in combination with good management
practices appears to be very effective. Soybean oil can be stored in a bulk storage tank either
inside or outside the production building and transferred to a smaller reservoir inside the
building as needed. This may involve manual application with a hand sprayer, or it can be

29
distributed automatically to minimise labour. The delivery system should be configured to
allow spraying of oil to a pair of pens, primarily in the sleeping/laying areas of the pen and
avoiding the walkways. This will adsorb dust particles in these areas and allow the pigs to
distribute the oil throughout the rest of the pen with their activities (Schmidt and Heber, 2005).
Once a day sprinkling at 0.5 ml/ft 2 has been shown to reduce dust by forty to fifty per cent,
odour up to sixty per cent and h ydrogen sulphide up to sixty per cent (Jacobsen et al., 1999;
Lormior et al., 2002). This technique also resulted in ammonia emission rates being reduced by
nineteen per cent (Schmidt and Heber, 2005). Lemay and co -workers (2000) designed an oil
sprinkling system using undiluted crude canola oil to control dust that achieved a reduction in
the inhalable and respirable dust particle counts by ninety and eighty -six per cent respectively.
Water or a surfactant or emulsifier can be added to the oil for better distribution and
convenience of cleaning the units between groups of pigs, and for reducing the incidence of
clogged nozzles. It must be noted that this practice requires additional labour and techniques for
cleaning of the units. Nonetheless this technolo gy has been credited for being cost -effective for
swine producers and remains one of the most hopeful options for reducing dust levels in swine
houses.
The pigs’ level of activity is an important factor in determining the dust particle concentration
in swine confinement buildings. In the course of half an hour the concentration of airborne dust
in a house with ad libitum feeding can be drastically affected due to a change in the level of
activity. Therefore, it is recommended that work in the houses shoul d be done at a calm pace to
avoid exciting the pigs. In a comprehensive comparative study of different dust control methods
in swine buildings, Takai and Pedersen (2000) found that a combined method of spraying an
oil-water mixture controlled by an animal activity sensor and animal fat to the dry feed reduced
the airborne dust concentrations and dust exposures of the swine workers by eighty and eighty -
five per cent respectively.

30
2.5.2 Air cleaning
The use of electrostatic air cleaners and vacuum clea ning has been investigated in swine
confinement buildings. These methods have shown little improvements in reduction of dust and
contaminants from the air of the buildings and are thus are not thought to be feasible relative to
the cost and labour input involved in their use (Gustafsson, 1999). Research into wet scrubbers
and dry filters has found them to be technically difficult and impractical. Thus, as is
recommended by Wathes and co -workers (1998) further research is needed for cleaning of the
air of these swine units in situ. The most practical methods available for air cleaning are
ventilation systems.
2.5.2.1 Ventilation system
There are multiple demands on the ventilation systems in swine confinement buildings.
However, the main purposes of any s wine facility ventilation system are to: (1) maintain an
adequate supply of fresh air for the animals, (2) remove excess moisture during cold weather,
(3) remove combustion gases from heaters, (4) provide adequate temperature control during
mild weather, and (5) limit the temperature rise during hot weather. A well -designed and
managed ventilation system will control the levels of gases, dusts and vapours, and is an
important factor in controlling odours from swine confinement buildings (Chastain, 2000).
Mechanical Exhaust Ventilation is the most common type of system used in modern swine
facilities. It takes three basic components: Properly sized fans, properly sized and distributed
fresh air inlets, and controls. The fans and inlets must be designed to pr ovide at least three
stages of ventilation. A proper setting of the minimum ventilation rate is one of the first things
to look at to maintain acceptable ammonia and carbon dioxide concentrations in a swine
facility. Considering that the swine confinements buildings’ ventilation system is not controlled
by the room ammonia concentration, it cannot react to an increase in ammonia release (Lemay
et al., 2002) A minimum, continuous ventilation rate for winter, a mild weather rate for
31
temperature control during the autumn and spring, and a maximum rate to control the
temperature rise of the building in summer are required (Chastain, 2000). Ideally the system
would be connected to an alarm in the case of a failure and a back up system should be in place.
Furthermore, it has been recommended that more thorough mixing of the stagnant indoor air of
well-insulated buildings may reduce the effects of clouds of pollutants containing gases, dusts
and endotoxins (Pickrell, 1991).
2.5.3 Diet formulation
The first method to reduce ammonia emission caused by excessive nitrogen is reducing the
nitrogen content in the swine diets. About seventy per cent of the protein ingested by swine
normally ends up in the manure as urea, ammonia and other compounds. Bacterial action on the
manure will result in production of several foul smelling compounds, which create unfavorable
working conditions (Lynch, 2000). Reduction of dietary protein combined with
supplementation of synthetic amino acids such as lysine in swine diets has been s hown to
reduce total nitrogen excretion by twenty -five to forty per cent. Reduction of dietary protein by
twenty nine per cent has resulted directly in a reduction of ammonia emission by fifty -two per
cent (Kay and Lee, 1997; Lemay et al., 2002). Moreover, concentrations of other major odour
components responsible for swine odour are significantly lower in slurry from swine fed low
crude protein diets compared to a control diet (Hobbs et al., 1996; Lemay et al., 2002). Thus,
diet formulation can have signif icant effects on ammonia emissions and on the level to which
workers are exposed.

32
2.5.4 Manure Handling and Storage
Hydrogen sulphide produced during agitation of manure can have lethal consequences. Teagasc
(1999) have published concise guideline s for manure management in intensive agricultural
enterprises, which is based on the following framework elements: Manure quantity and quality;
reducing manure nutrient content; operational procedures; and quality assurance. A systematic
approach encompassing the above elements should be formulated and strictly adhered to for
manure handling in every swine farm. Ventilation should be operating at maximum capacity
during the operation and afterwards for a sufficient period before anyone commences work in
the building. It is also recommended to always have two people that are properly equipped
working together as protective equipment can, and does fail. Meyer (1997) recommended that
ammonia-emission from livestock housing can be reduced by drying the manure qu ickly,
minimising the period of time during which the manure is in contact with the air, and
importantly minimising the contact surface area of the manure with the air. In addition, Meyer
(1997) demonstrated that emission from manure storage could be reduc ed by at least eighty per
cent provided that the right kind of covering is used. Also commercial manure additives are
available for mitigation of odour production, reduction of ammonia and hydrogen sulphide
emissions, and breaking down of solids.

33
2.5.5 Personal Protection Equipment (PPE)
As with all occupations, PPE can provide an invaluable means for protecting the health of
swine confinement workers. However, it is imperative that PPE be used as part of a supervised
respirator program and as an adjunct to management practices and engineering controls.
Voluntary use of this equipment is hindered by issues such as: Discomfort and difficulty in
communicating; lack of awareness or acceptance of the real risks of working unprotected in
hazardous areas; and the costs associated with their use (Barber et al., 1999).
The use of personal respiratory protection while working with swine is still not common.
However frequent use of dust masks may prevent respiratory illness from occurring. To be
effective, disposable masks must be of correct fit and the worker must be willing to wear the
device for the duration of the entire working shift. It is also imperative that reusable masks are
maintained and stored correctly. Dust masks are particularly appropriate for tasks that result in
higher than normal exposure or those that have proven to result in undesirable health affects in
a particular worker. The workers must use the correct type of dust mask, which can be decided
on by looking at the code of the mask. The European Norm (EN) 149 Type P2 is ideal.
However EN of FFP1, which is often used on swine farms, offers inadequate protection
(Lawlor, 2002). Dust masks provide no protection against toxic gases, thus an alternative range
of equipment is required. Only a self-contained breathing apparatus should be worn when
entering a manure pit or other confined space on the farm. In a study comparing the
effectiveness of two strategies for reducing dust exposures, Barber and co -workers (1999)
found that wearing a dust mask was a more effective means of reducing the effects on
pulmonary function than the oil spraying treatment; the reduction in dust was approximately
ninety-five per cent for a properly fitted mask.

34
3.0 Overview of Chapter
This chapter contains an overview of the project sampling strategy and a detailed description of
the methodologies used for personal sampling of ammonia, carbon dioxide, swine confinement
dust and endotoxin. Details on the microbiological analysis of the bioburden of the air in t he
swine confinement buildings through use of settle plates are specified. In addition, the statistical
tests that were used for analysing the results are noted in this chapter.
3.1 Sampling Strategy
Several farms were involved in the sampling for this study, which was carried out during the
months of June and October 2006. The farms involved varied in size (ranging from 200 to
2,200 sows), the number of employees (ranging from 1 to 15 employees), and in the age of the
facilities (ranging from 4 to 40 years old). The smaller farms were of older design, while the
larger farms had more modern designs and facilities, and an increased number of employees.
The swine farm workers are identified depending on the unit on the farm in which they work,
and were thus classified as Similar Exposure Groups (SEGs). The SEGs are as follows:
Farrowing unit worker, weaner unit worker, fattening unit worker, dry sow unit worker, and
farmer. The first four SEGs would spend the majority of their working day in the relevant units,
while the farmers would spend their day working throughout all of the swine confinement units.
The farrowing unit workers’ duties include: Inducing sows for birth; assisting in farrowing,
both physically and in the administration of oxytocin; clipp ing tails and teeth of piglets at birth;
administration of injections to piglets, (iron and vaccines); recording all births and deaths of
piglets; assessing house temperature, and piglet and sow welfare on a daily basis; and
introducing piglets to creep feed as soon as possible.
The weaner 1st stage unit workers’ duties include: Grouping piglets in homogenous groups
usually consisting of a set number; total switch over to solid creep feed; ensuring high

35
temperature in the unit for first week, usually 28°C with a reduction of 2°C each week to a
constant of 22°C; inject weaners as appropriate; move onto a link feed after a week or so; and
maintain good clean feeders and drinkers. The main duty of these workers is to assess piglet
welfare, as this is a very cr itical period and animals are very susceptible. Poorly thriving
weaners need a lot of attention at this time. In the weaner 2nd stage unit the workers main duty
is general observation for poorly thriving pigs. The swine under -go their biggest diet change in
this stage, moving on to a weaner ration. The weaners require a lot less supervision at this point
and there is no house heating. They are not mixed any more and they remain in the same groups
as in weaner stage-one through to leaving the fattening unit for slaughter.
The fattening unit worker : At this stage the pigs are moved onto a fattening ration.
Observation is important as when the pigs move onto wet feed, their feed quantities must be
constantly amended and it is important to ensure that all pigs are feeding properly. An
important issue at this stage is the change of floor type, which can cause lameness in the
fatteners. The general welfare of the swine is constantly assessed.
The dry sow unit worker: Not as much attention is needed with pregnant s ows as they are
housed in stalls. The worker must walk through all the stalls at feeding times to ensure that the
sows are feeding properly. These workers are also responsible for serving of weaned sows and
gilts; conducting daily boar walks to see if sows are in heat (boar effect); and keeping records
of all sows served and repeats. Dry sow unit workers are responsible for the general welfare of
the sows, including vaccines, recording parities for culling, and tagging sows with lost tags.
All workers are responsible for cleaning and washing of their respective units, as described in
Section 2.5.1.1, of Chapter 2.
The farmer is most commonly found on the smaller farms, where one worker may be
responsible for all of the above duties and running of the entire farm on a daily basis.
All swine confinement workers’ personal exposure to ammonia, carbon dioxide and swine
confinement dust was investigated. After review of the literature it was decided to focus on

36
determining the endotoxin exposures of the weaner u nit worker, fattening unit worker and
farmer. According to Chang and co -workers (2001) these workers were exposed to the highest
levels of endotoxin during their working day. Sampling involved the workers wearing the
relevant monitoring devices for a minim um of seventy five per cent of an eight -hour working
day. Also, settle plates were used for microbiological analysis of the air in the swine
confinement buildings. The typical working shift varied, but generally commenced at 08.30
hours and finished at 17.30 hours. A 30-minute break was taken both in the morning and in the
afternoons, with an hour break taken for lunch. The workers had their breaks either outside in
the fresh air or in canteens located on the farms. At the end of each working day, a monitor ing
record sheet was compiled, which contained all the relevant data for that day’s sampling (Refer
to Appendix).
Work has previously been carried out here in the National University of Ireland, Galway on
determining and assessing the occupational exposu re of swine confinement workers to gases,
swine confinement dust and noise. Thanks to sponsorship from the HSA, it was possible to
undertake the current study in order to continue this effort and also commence carrying out
microbiological and endotoxin ana lysis. The carbon dioxide, ammonia and swine confinement
dust results obtained were incorporated into a pre -existing database, resulting from these
previous studies. This data, along with the endotoxin data was analysed using Statistical
Package for Social Science (SPSS). The microbiological data from the settle plates was
analysed using GraphPad InStat 3.

37
3.2 Gas Sampling in Swine Confinement Units
3.2.1 Ammonia Sampling
The electrochemical ToxiPro Single Gas Detector was used to continuously mon itor the
ammonia levels of the workers in the SEGs in the swine confinement buildings. This device is
small and light weight which enabled the workers to continue with their daily tasks safely and
at ease. The ToxiPro was clipped to the workers’ collar in their breathing zone, for the duration
of their working day, and upon removal the device automatically saves the measurements data
in memory. The readings were downloaded to the computer via a universal serial bus (USB) -
infrared beam. From the data output generated it was possible to determine the start time, end
time, duration, peak and average of the ammonia exposure readings.
Plate 4: Personal Ammonia Sampler
Picture taken by Author (2006)

38
3.2.2 Carbon Dioxide Sampling
Carbon dioxide was measured using the Anagas CD 98 infrared analyser. This compact and
lightweight device measures in the range of 0 -10,000 ppm CO2 or zero to sixty per cent CO 2.
On-site this device was clipped onto the workers belt for a personal exposure measurement. The
Anagas CD 98 has a data storage facility and data is downloaded via an Infared Data
Association (IrDA) communications link.
Plate 5: Carbon Dioxide Sampler
Picture taken by Author (2006)
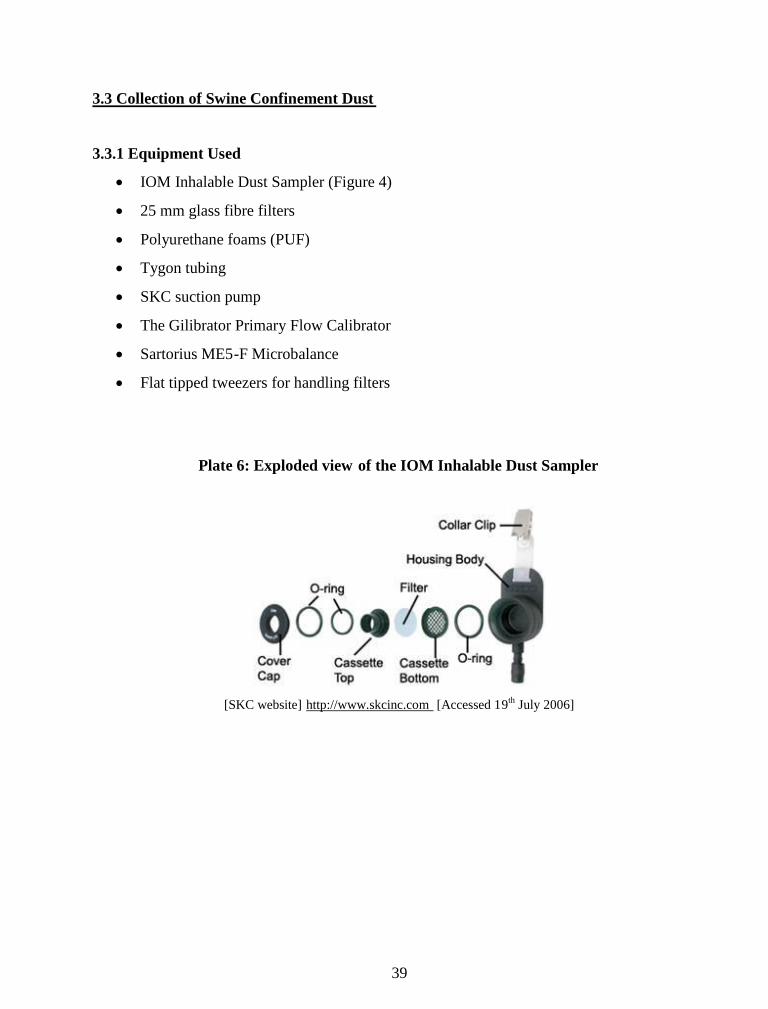
39
3.3 Collection of Swine Confinement Dust
3.3.1 Equipment Used
IOM Inhalable Dust Sampler (Figure 4)
25 mm glass fibre filters
Polyurethane foams (PUF)
Tygon tubing
SKC suction pump
The Gilibrator Primary Flow Calibrator
Sartorius ME5-F Microbalance
Flat tipped tweezers for handling filters
Plate 6: Exploded view of the IOM Inhalable Dust Sampler
[SKC website] http://www.skcinc.com [Accessed 19th July 2006]

40
3.3.2 Preparation of sampling equipment
1. The IOM Inhalable Samplers were cleaned before use. This involved the units being
disassembled, soaked in laboratory detergent solution, rinsed thoroughly with water,
wiped with adsorptive tissue and allowed to dry thoroughly before reassembly .
2. All filters and foams were pre -conditioned in the weighing-room over night before
weighing. The temperature and relative humidity were recorded.
3. The filters were loaded into clean and dry sampling head s using flame sterilised flat
tipped tweezers.
4. The weight of the filter and cassette was firstly recorded, which was used to determine
the respirable fraction of the swine confinement dust.
5. The weight of the entire unit with the foam in place was then re corded, which was used
to determine the inhalable fraction.
6. Each loaded sampling head was connected to a sampling pump using Tygon tubing,
ensuing that no leaks occurred.
7. The pump was switched on and the calibrated flow meter was attached to the sampling
head so that it measured the flow through the sampler inlet orifice. The flow rate was set
to 2.2 l/min with an accuracy of plus or minus five per cent.
Plate 7: IOM Inhalable Sampler
Picture taken by Author (2006)

41
3.3.3 Sampling Train
1. The sampling head was fixed to the worker on their lapel and as close to the mouth and
nose as possible.
2. The sampling pump was then either placed in a convenient pocket or attached to the
worker in a manner that caused minimum inconvenience, such as to a belt around the
waist. The pump was switched on and note was taken of the time at the start of the
sampling period.
3. The workers and the equipment were observed periodically throughout the sampling
period in order to ensure that the pump was operating as desired. At the end of the
sampling period the sampling pump was switched off and record was taken of the time.
4. The sampler was disconnected from the sampling head and stored in its cassette.
5. On return to the lab the flow rate of the pump was measured with the calibrate d flow-
meter using the actual sample to ensure that over -loading of the filter did not occur. The
sample identity and all relevant sampling data were carefully recorded in the monitoring
record sheet.
6. The mean flow rate was calculated by averaging the flo w rate measurements from
before and after the sampling period and calculating the volume of air sampled, in litres,
by multiplying the flow rate in litres per minute by the sampling time in minutes .
3.3.4 Gravimetric Analysis
1. The samples were allowed to re-condition overnight in the balance room. Again note
was taken of the temperature and relative humidity.
2. Prior to weighing they were placed in front of a static eliminator for 3 minutes to
eliminate any static build up.
3. The whole unit was weighed and r ecorded (inhalable fraction).
4. The foam and cassette front were removed and the filter and cassette rear were weighed
and recorded (respirable fraction).

42
3.4 Microbiological Analysis of the air of Swine Confinement Buildings
3.4.1 Media Preparation
All media were supplied from LAB M ®: UK.
3.4.1.1 Malt Extract Agar (Yeast and Moulds)
Malt extract agar is a selective media for the enumeration of yeasts and moulds. This media was
prepared as follows:
1. 25 g of media was weighed and added to 500 ml of de ionised water in a Schott bottle
(500 ml) and mixed vigorously.
2. The mixture was autoclave at 115°C for 10 minutes at 103.5 kPa.
3.4.1.2 Nutrient Agar (Total Colony Forming Units)
Nutrient agar is a general-purpose agar for the culture of non -fastidious organisms and is used
to determine the total colony forming units. This media was prepared as follows:
1. 14 g of media was weighed and added to 500 ml of deionised water in a Schott bottle
(500 ml) and mixed vigorously.
2. The mixture was autoclaved at 121°C for 15 min at 103.5 kPa.

43
3.4.1.3 Violet Red Bile Agar (VRBA) (Coliforms)
VRBA is a medium for the general enumeration of coliform organisms. This media was
prepared as follows:
1. 19.25 g of media was weighed and added to 500 ml of deionised water in a glass conical
flask (1 l) and mixed vigorously.
2. The flask was plugged with cotton wool and the solution was brought to the boil with
frequent stirring over a Bunsen burner.
3. The solution was then allowed to cool to 47°C.
Using aseptic techniques the media was poured into petri dishes. The dishes were stacked so as
to avoid condensation and left at room temperature until solidified. If necessary the dishes were
dried by being exposed for ten minutes in a laminar airflow (LAF) cabinet. All media were
stored at 4°C until required.
3.4.2 Settle Plates for the Culture & Enumeration of Microorganisms
Settle plates were exposed at various locations in the pig farms for a specified time to determine
the microbial bioburden of the air. The locations were chos en in an attempt to account for
possible variability in the units. Figure 3 is an example of locations that were chosen for
exposure of the settle plates in one particular swine confinement unit. For the first sampling
session an exposure time of 10 minute s was employed. Subsequently, an exposure time of 2
minutes was used in an attempt to get the colony count in the region of 30 to 300 colony -
forming units per plate.
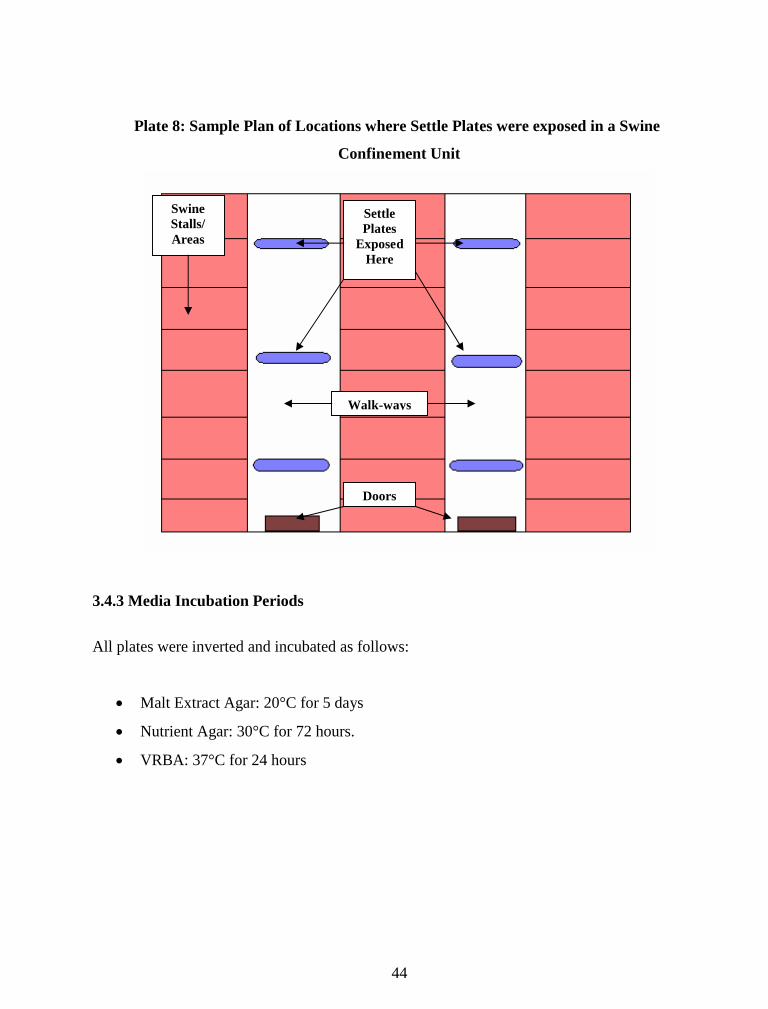
44
Plate 8: Sample Plan of Locations where Settle Plates were exposed in a Swine
Confinement Unit
3.4.3 Media Incubation Periods
All plates were inverted and incubated as follows:
Malt Extract Agar: 20°C for 5 days
Nutrient Agar: 30°C for 72 hours.
VRBA: 37°C for 24 hours
SwineStalls/Areas
SettlePlates
ExposedHere
Doors
Walk-ways

45
3.5 Endotoxin Sampling
The protocol that was used for endotoxin sampling is similar to that used for the collection of
swine confinement dust, described in Section 3.3, of Chapter 3.
3.5.1 Equipment used
The equipment used for endotoxin sampling is similar to that described in Section 3.3.1 of
Chapter 3.
3.5.2 Preparation of sampling equipment
Preparation of sampling equipment was carried in a similar manner to that described in Section
3.3.2, of Chapter 3. However, foams were not availed of for endotoxin sampling and it was not
necessary to weigh the units. Thus, preparation was carried out as follows:
1. The IOM Inhalable samplers were cleaned before use. This involved the units being
disassembled, soaked in laboratory detergent solution, rinsed thoroughly with water,
wiped with adsorptive tissue and allowed to dry thoroughly before reassembly .
2. The 25 mm glass fibre filters were individually wrapped in tin foil and placed in a
glassware oven at 180°C for 4 hours.
3. The filters were loaded into clean and dry sampling heads using flame sterilised flat
tipped tweezers.
4. Each loaded sampling head was connected to a sampling pump using Tygon tubing,
ensuing that no leaks occurred.
5. The pump was switched on and the calibrated flow meter was attached to the sampling
head so that it measured the flow throug h the sampler inlet orifice. The flow rate was set
to 2 l/min with an accuracy of plus or minus five per cent.

46
3.5.3 Sampling Train
The IOM Inhalable Sampler was used for collection of the inhalable endotoxin samples. The
equipment was placed on the worker in the same manner as described Section 3.3.3, of Chapter
3.
3.5.4 Endotoxin Extraction
1. Samples were extracted by placing the filters in 10 ml of sterile pyrogen -free water
(Water for injections: B| Braun: Germany) in 30 ml sterilins.
2. The samples were placed on a shaking table at 90 rotations per minute (rpm) at room
temperature for 1 hour.
3. Samples were subsequently centrifuged at 4000 rpm for 10 min.
4. The solutions were then decanted into fresh sterilins in a LAF.
3.5.5 Effect of Freezing during Storage on Endotoxin Sample
As mentioned previously (Section 2.2.3.2 of Chapter 2) there is much debate in the literature as
to the effect of freezing samples during storage on the endotoxin levels that are subsequently
detected. In order to address thi s uncertainty, one particular extracted sample was divided into
two separate sterilins. Sample 1 was stored at 4°C while the other sample (Sample 2) was
frozen. The LAL assay determined endotoxin levels to be as follows:
Sample 1 (4°C) = 21 EU/m3 air
Sample 2 (frozen) = 4.2 EU/m3 air
Freezing of the sample during storage was found to result in an eighty per cent reduction in
endotoxin levels, as opposed to storage of the same sample at 4°C. Thus, in accordance with
Douwes and co-workers (1995) it was decided to store the samples at 4°C until being
transported for analysis

47
3.5.6 Endotoxin Analysis
Microchem Laboratories carried out endotoxin analysis. This is an Irish National Accreditation
Board (INAB) accredited laboratory. Analysis was carried out usi ng the Limulus Amebocyte
Lysate Endosafe Assay (Refer to Appendix). This gel -clot LAL text method is conducted as
follows:
1. Equal parts of Endosafe® LAL reagent and the endotoxin sample are mixed together.
2. The mixture is then promptly incubated undisturb ed for 60 minutes at 37 °C.
3. A positive response on the gel clot indicates that there is an amount of endotoxin in the
sample that equals or exceeds the reagents’ labelled sensitivity.
Thus, due to the nature of the endpoint assay, i.e. the gel either cl ots or not at a certain dilution
of the sample, the results are generated as cut -off or break points of EU/ml. These results are
then converted to EU/m3 air, as described in Section 4.4, of Chapter 4.
3.6 Data Analysis
Raw data for the swine confinement dust (mg/m3), ammonia (ppm), carbon dioxide (ppm) and
endotoxin (EU/m3) sampling was analysed using SPSS version 14.0 for Windows, which is a
data management and analysis software. Data was analysed using a combination of descriptive
statistics, parametric, non-parametric and post-hoc tests.
Results from the microbiological analysis of the air (CFU/m 2) were analysed using GraphPad
Instat version 3.06, 32 bit for Windows, GraphPad Software, San Diego California, United
States of America. Analyses were main ly carried out using Mann-Whitney U Test and Kruskal -
Wallis Tests. In all cases, p values of > .05 were considered as significant.

48
Software provided with both the ammonia and carbon dioxide personal samplers were used for
downloading the information and generating preliminary tables and graphs. Microsoft Excel
was employed for producing tables and figures used for the presentation of results.

49
4.0 Overview of Chapter
Swine confinement dust, ammonia, carbon dioxide and endo toxin samples were collected
during the period of May-July 2006. Table 1 is an overview of the number of personal samples
that were collected throughout this period.
Table 1: Previous Project Database: Number of Personal Samples Collected
SEGInhalable Dust Respirable Dust NH3 CO2 Inhalable
Endotoxin
Weaner1 1 4 1 10
Fattening 1 1 1 0 8Farrowing 5 5 2 0 NSDry Sow 5 5 1 1 NSFarmer 2 2 2 1 19Total 14 14 10 3 37
NS denotes: Not Sampled
For the purpose of data-analysis this data has been incorporated with a pre-existing dataset
(explained in Section 3.1, of Chapter 3) resulting in a larger dataset, presented in Table 2. This
is the dataset that was analysed for the purpose of the current project.
Table 2: Incorporated Database: Total Num ber of Personal Samples
SEG Inhalable Dust Respirable Dust NH3 CO2 Inhalable
Endotoxin
Weaner12 12 8 5 10
Fattening 6 6 14 5 8Farrowing 10 12 6 4 NSDry Sow 11 11 6 7 NSFarmer 8 7 5 2 19
Total 47 48 37 23 37NS denotes: Not Sampled

50
Results from the above data were analysed using SPSS version 14.0 for Windows. Settle plates
were employed for the culture and enumeration of the microorganisms present in the air of the
various units in the swine confinement buildings. Results from this re search were analysed
using GraphPad Instat version 3.06. In this chapter the major findings of the above research are
highlighted and their significance acknowledged where applicable.
4.1 Gas Exposure of Swine Confinement Workers
4.1.2 Carbon dioxide
Table 3 illustrates that the mean values, ranges and standard deviations of carbon dioxide peak
(ppm) exposures experienced by the weaner, fattening, farrowing, dry sow and swine farmer
worker groups.
Table 3: Carbon dioxide peak exposures (ppm) of the V arious SEGs
SEG Mean (ppm)Std. Deviation
(ppm) Number of SamplesWeaner 1722
(430-2970)955 5
Fattening 2090(1190-3480)
991 5
Farrowing 1488(1151-1690)
243 4
Dry sow 2041(1390-2680)
511 7
Farmer 4700(4620-4780)
113 2
A one-way analysis of variance revealed significant differences between the SEGs (F(4,18) =
7.950, p< .001). Post-hoc comparison showed that the farmer SEG ( Mean = 4700, S.D. = 113)
experienced significantly more exposure to carbon dioxide than any other of the SEGs; weaner
(Mean = 1722; p< .001); fattening (Mean = 2090; p< .004); farrowing (Mean = 1488; p< .001);
dry sow (Mean = 2041 p< .002).

51
The most pertinent point that emerges from consideration of the carbon dioxide results is that
the swine workers are frequently exposed to levels of carbon dioxide in excess of the
recommended 1540 ppm carbon dioxide. Carbon dioxide levels in excess of this are considered
to reflect poor air quality in the swine confinement buildings and greater potential risk of
respiratory disease for the swine confinement workers.
Plot 1 shows an example of a farmers’ daily exposure to carbon dioxide. A peak reading of
4700 ppm carbon dioxide is evident at 09.30 hours, which may have occurred when the farmer
entered a building for the first time that da y. From this time onwards, the carbon dioxide peaks
appear to be cyclical, which may be a result of the farmer entering and leaving various units
throughout the day.
Figure 1: Example of Farmers Carbon Dioxide Exposure
Carbon dioxide - Farmer
0
1000
2000
3000
4000
5000
09:0
0:30
09:2
0:30
09:4
0:30
10:0
9:30
10:2
0:30
10:4
0:30
11:0
0:30
11:2
0:30
11:4
0:30
12:0
0:30
12:2
0:30
12:4
0:30
13:0
0:30
13:2
0:30
Time
Car
bon
diox
ide
(ppm
)
Series1

52
4.1.3 Ammonia
Table 4 presents the mean values, ranges and standard deviations of ammonia exposures of the
weaner, fattening, farrowing, dry sow and swine farmer worker groups.
Table 4: Ammonia Exposures of the Various SEGs
SEGMean (TWA) Std. Deviation (TWA) Number of Samples
Weaner 0.41(0.03-1.0)
0.44 8
Fattening 1.24(0.09-2.9)
0.84 14
Farrowing 0.72(.09-2.0)
0.71 6
Dry sow 1.47(0.02-3.0)
1.07 6
Farmer 0.64(0.01-2.0)
0.87 5
The highest ammonia TWA exposures were found in the dry sow (Mean = 1.5; S.D = 1.07) and
the fattening (Mean = 1.2; S.D = 0.88) SEGs. However, a one -way analysis of variance showed
that there were no significant differences between the ammonia exposures experienced by the
various workers in the swine confin ement buildings.

53
Plot 2 shows an example of a weaner unit workers’ typical exposure to ammonia. On this
particular day the worker commenced work at 08.00 hours and he/she entered the weaner unit
at approximately 08.20 hours, as is evident from th e initial peak value of 2 ppm ammonia. The
worker then spent the early part of the morning doing tasks outside of the actual weaner unit, as
is visible from the plot. The worker then returned, at approximately 11.00 hours to carrying out
tasks inside of the weaner unit.
Figure 2: Example of Weaner Unit Workers Daily Exposure to Ammonia
Example of Weaner Unit Workers' Daily AmmoniaExposure
00.5
11.5
22.5
08:
22:5
0
08:
48:5
0
09:
14:5
0
09:
40:5
0
10:
06:5
0
10:
32:5
0
10:
58:5
0
11:
24:5
0
11:
50:5
0
12:
16:5
0
12:
42:5
0
13:
08:5
0
13:
34:5
0
Time
Am
mon
ia (T
WA
)
NH3_Max

54
4.2 Swine Confinement Dust
4.2.1 Inhalable Swine Confinement Dust
Table 5 shows the mean values, ranges and standard deviations o f the inhalable dust fraction
exposures experienced by the different swine confinement workers.
Table 5: Inhalable Dust Exposures of the Various SEGs
SEG Mean(mg/m3)
Std. Deviation(mg/m3) Number of Samples
Weaner 4.33(0.25-7.6)
2.30 12
Fattening 2.75(1.9-5.0)
1.16 6
Farrowing 1.94(0.29-4.4)
1.51 10
Dry sow 1.36(0.25-3.5)
0.79 11
Farmer 3.01(1.1-5.6)
1.49 8
From Table 5 it is apparent that the weaner unit worker has the highest inhalable dust exposure
(Mean = 4.3 mg/m3; S.D. = 2.3). A one-way analysis of variance was carried out to determine
if this exposure was significantly different from the other SEGs. This analysis showed that the
weaner unit worker had significantly higher exposure to inhalable swine confinement dust than
other workers (F(4,42) = 5.717, p< .001). Post -hoc comparison showed that the weaner unit
workers’ exposure was significantly higher than both the farrowing ( Mean = 1.9; p< .011) and
the dry sow workers (Mean = 1.4; p< .001).
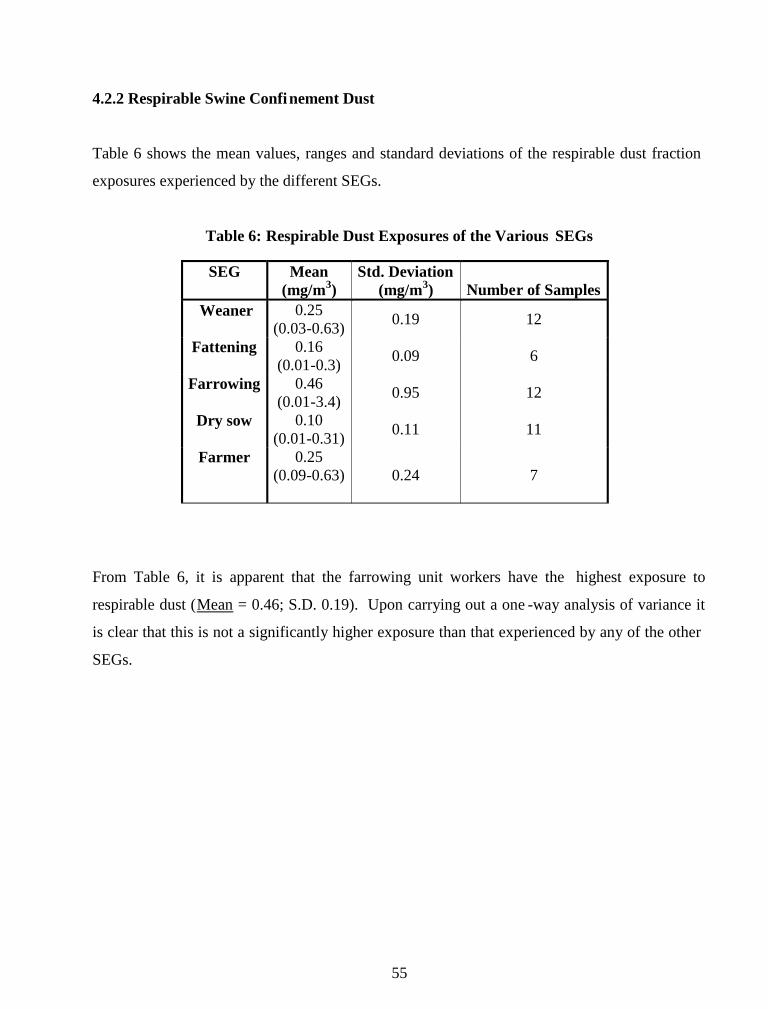
55
4.2.2 Respirable Swine Confinement Dust
Table 6 shows the mean values, ranges and standard deviations of the respirable dust fraction
exposures experienced by the different SEGs.
Table 6: Respirable Dust Exposures of the Various SEGs
SEG Mean(mg/m3)
Std. Deviation(mg/m3) Number of Samples
Weaner 0.25(0.03-0.63)
0.19 12
Fattening 0.16(0.01-0.3)
0.09 6
Farrowing 0.46(0.01-3.4)
0.95 12
Dry sow 0.10(0.01-0.31)
0.11 11
Farmer 0.25(0.09-0.63) 0.24 7
From Table 6, it is apparent that the farrowing unit workers have the highest exposure to
respirable dust (Mean = 0.46; S.D. 0.19). Upon carrying out a one -way analysis of variance it
is clear that this is not a significantly higher exposure than that experienced by any of the other
SEGs.
56
4.3 Microbiological Analys is
4.3.1 Settle Plates for the Culture & Enumeration of Microorganisms
Settle plates were used for analysis of the bioburden of the air in the swine confinement
buildings. The term bioburden is used to refer to the number of microorganisms with which an
object is contaminated. Coliforms, total colony forming units, yeasts and moulds were collected
using settle plates from the air of the swine confinement units and enumerated. This was carried
out in both a relatively modern building with several workers a nd an older swine farm with less
personnel working on-site. For the purpose of data analysis the more modern unit will be
referred to as “Farm A”. Farm A has units varying in age from 4 to 10 years, with 13 employees
working in the units. The older farm wi ll be referred to as “Farm B”, with units being on
average 40 years old and with 2 employees working in the units. The following data refers to
total colony forming units per exposed plate (surface area = 63.6 cm 2). The results were
analysed using GraphPad Instat 3.
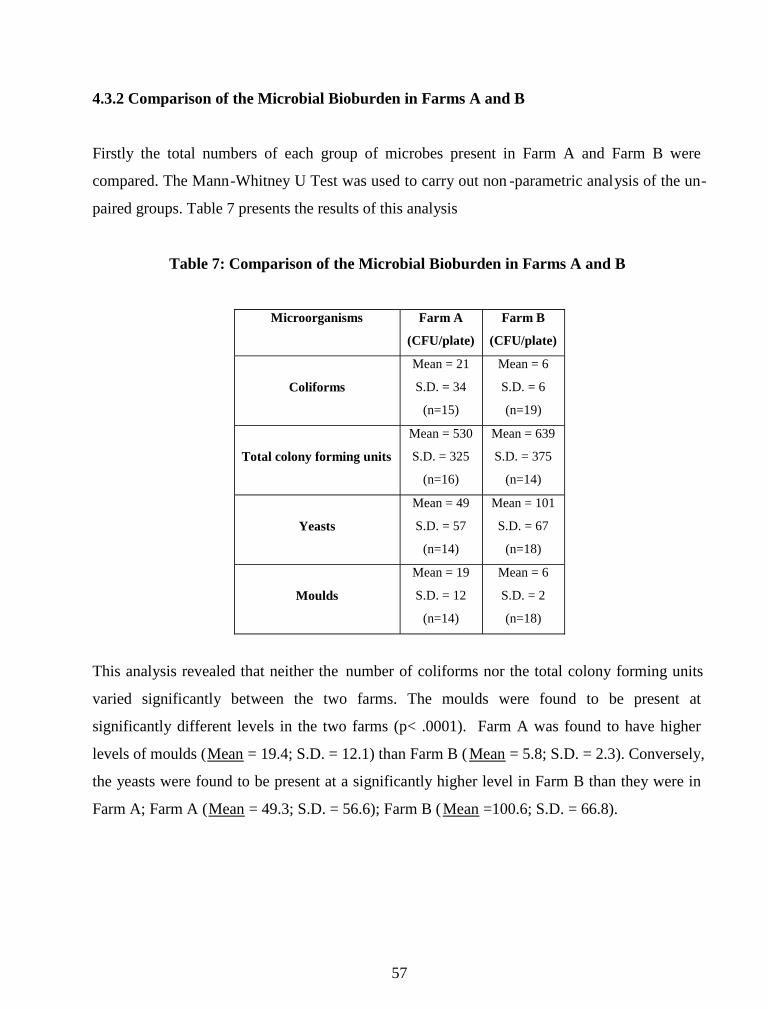
57
4.3.2 Comparison of the Microbial Bioburden in Farms A and B
Firstly the total numbers of each group of microbes present in Farm A and Farm B were
compared. The Mann-Whitney U Test was used to carry out non -parametric analysis of the un-
paired groups. Table 7 presents the results of this analysis
Table 7: Comparison of the Microbial Bioburden in Farms A and B
Microorganisms Farm A
(CFU/plate)
Farm B
(CFU/plate)
Coliforms
Mean = 21
S.D. = 34
(n=15)
Mean = 6
S.D. = 6
(n=19)
Total colony forming units
Mean = 530
S.D. = 325
(n=16)
Mean = 639
S.D. = 375
(n=14)
Yeasts
Mean = 49
S.D. = 57
(n=14)
Mean = 101
S.D. = 67
(n=18)
Moulds
Mean = 19
S.D. = 12
(n=14)
Mean = 6
S.D. = 2
(n=18)
This analysis revealed that neither the number of coliforms nor the total colony forming units
varied significantly between the two farms. The moulds were found to be present at
significantly different levels in the two farms (p< .0001). Farm A was found to have higher
levels of moulds (Mean = 19.4; S.D. = 12.1) than Farm B ( Mean = 5.8; S.D. = 2.3). Conversely,
the yeasts were found to be present at a significantly higher level in Farm B than they were in
Farm A; Farm A (Mean = 49.3; S.D. = 56.6); Farm B (Mean =100.6; S.D. = 66.8).

58
4.3.3 Comparison of the Microbial Bioburden in Different Units between the Two Farms
Both Farm A and Farm B have farrowing, weaner and dry sow units - Farm B does not have a
fattening unit. Accordingly coliforms, total colony forming units, yeasts and moulds in these
found in the air of these 3 areas were compared in order to determine if there were any
significant differences. Table 8 presents the total numbers of microbes that were found to be
present in the different units in Farm A and Farm B.
Table 8: The number of Microbes present in Different Units in Farm A and Farm B
Farm A Farm B
MicroorganismsDry sow
Unit
(CFU/plate)
Weaner
Unit
(CFU/plate)
Farrowing
Unit
(CFU/plate)
Fattening
Unit
(CFU/plate)
Dry sow
Unit
(CFU/plate)
Weaner
Unit
(CFU/plate)
Farrowing
Unit
(CFU/plate)
Coliforms
Mean=14
S.D. = 12
(n=4)
Mean=19
S.D. = 31
(n=3)
Mean = 5
S.D. = 4
(n=5)
Mean=59
S.D. = 63
(n=3)
Mean=3
S.D. = 3
(n=6)
Mean=1
S.D. = 2
(n=3)
Mean=9
S.D. = 7
(n=10)
Total colony
forming units
Mean=597
S.D. = 562
(n=4)
Mean=493
S.D. = 214
(n=3)
Mean=577
S.D. = 483
(n=5)
Mean=548
S.D. = 190
(n=4)
Mean=438
S.D. = 291
(n=6)
Mean=1148
S.D. = 350
(n=3)
Mean=702
S.D. = 458
(n=10)
Yeasts
Mean=64
S.D. = 84
(n=8)
Mean=24
S.D. = 19
(n=3)
Mean=63
S.D. = 64
(n=4)
Mean=37
S.D. = 7
(n=3)
Mean=55
S.D. = 37
(n=8)
Mean=117
S.D. = 17
(n=4)
Mean=112
S.D. = 81
(n=10)
Moulds
Mean=20
S.D. = 19
(n=4)
Mean=13
S.D. = 11
(n=3)
Mean=20
S.D. = 4
(n=4)
Mean=27
S.D. = 5
(n=3)
Mean=6
S.D. = 2
(n=4)
Mean=4
S.D. = 2
(n=4)
Mean=6
S.D. = 3
(n=10)
Results from the Mann-Whitney U Test analysis revealed that the number of moulds in the dry
sow and farrowing units were the only groups to differ significantly between Farm A and Farm
B; at levels of (p< .0427) and (p< .0020) respectively. Moulds were found to be present in the
dry sow unit of Farm A (Mean = 20; S.D. = 19) at a significantly higher level than in the dry
sow unit of Farm B (Mean = 6; S.D. = 2). Also moulds were found to be present in the
farrowing units of Farm A (Mean = 20; S.D. = 4) at significant ly higher level than in the
farrowing unit of Farm B (Mean = 6; S.D. = 3).

59
4.3.4 Comparison of the Microbial Bioburden in Different Units in each Individual Farm
A further analysis was carried out for both of Farms A and B. This involved comparing the
different groups of microorganisms found in the air of each individual farm. The Kruskal -
Wallis Test is a nonparametric test to compare three or more unpaired groups. Using this test to
analyse the data it appears that there are no significant differences in the numbers of coliforms,
total colony forming units, yeasts and moulds found in the four units of Farm A. The same non-
parametric analysis of variance test of the three locations in Farm B revealed that the only
significant difference was in the coliform numbers found between the weaner and farrowing
units (p< .0241) of Farm B. Coliforms were found to be present in the weaner unit ( Mean = 1;
S.D. = 2) at a significantly lower number to that found in the farrowing unit ( Mean = 9; S.D. =
7). Thus it appears that with the exception of this one significant difference, the levels of total
colony forming units, coliforms, yeasts and moulds are the same within the units of the two
farms.
For the purpose of comparison with the literature, the above results were extrapolated to
number of CFU/m2 as follows:
27 CFU/plate (63.6 cm2) = 43 CFU/100 cm2 =>
43 CFU/100 cm2 = 4300 CFU/m2 => 4.3 x 10³ CFU/m2
Mean levels of microorganisms found in the swine confinement buildings were as follows:
Coliforms (Mean = 2 x 10³ CFU/m2; S.D. =3.8 x 10³ CFU/m2)
Total colony forming units (Mean = 1.2 x 10⁵ CFU/m2; S.D. = 1.6 x10⁵ CFU/m2)
Yeasts (Mean = 1.3 x 10⁴ CFU/m2; S.D. = 1.1 x 10⁴ CFU/m2)
Moulds (Mean = 4.4 x 10³ CFU/m2; S.D. = 1.0 x 10⁴ CFU/m2)
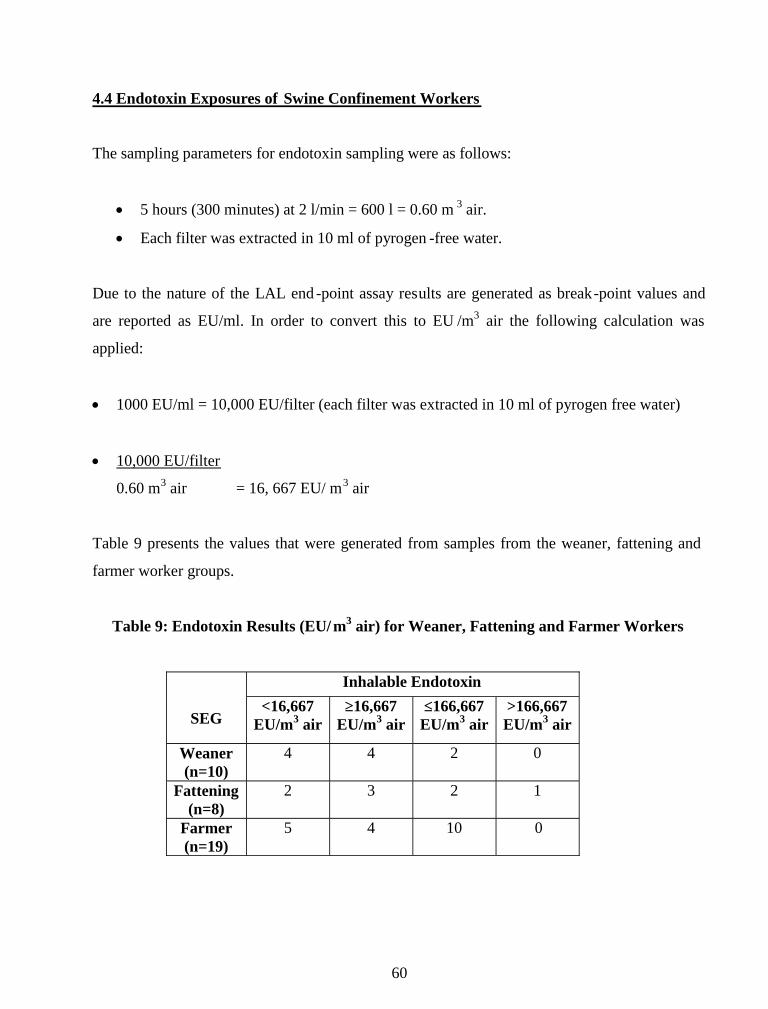
60
4.4 Endotoxin Exposures of Swine Confinement Workers
The sampling parameters for endotoxin sampling were as follows:
5 hours (300 minutes) at 2 l/min = 600 l = 0.60 m 3 air.
Each filter was extracted in 10 ml of pyrogen -free water.
Due to the nature of the LAL end -point assay results are generated as break-point values and
are reported as EU/ml. In order to convert this to EU /m3 air the following calculation was
applied:
1000 EU/ml = 10,000 EU/filter (each filter was extracted in 10 ml of pyrogen free water)
10,000 EU/filter
0.60 m3 air = 16, 667 EU/ m3 air
Table 9 presents the values that were generated from samples from the weaner, fattening and
farmer worker groups.
Table 9: Endotoxin Results (EU/ m3 air) for Weaner, Fattening and Farmer Workers
Inhalable Endotoxin
SEG<16,667
EU/m3 air≥16,667
EU/m3 air≤166,667
EU/m3 air>166,667EU/m3 air
Weaner(n=10)
4 4 2 0
Fattening(n=8)
2 3 2 1
Farmer(n=19)
5 4 10 0
61
It is apparent from the results in Table 9 that the workers are exposed to high levels of
endotoxin in the swine confinement buildings. These results were anticipated due to the high
levels of bacteria that were also found to be present in the various units (Section 4.3.1, of
Chapter 4).
Endotoxin results consist of ordinal scale data. As this involves ranking of the endotoxin level it
is necessary to carry out non-parametric analysis of variance. For this purpose a test called the
Kruskal-Wallis one-way analysis of variance by rank was used. This analysis revealed that
there were no significant differences between the levels of endotoxin exposure experienced by
the different workers. Results for each of the worker groups contain endotoxin levels up to
166,667 EU/m3 air. However on one occasion (fattening worker) a level in excess of 166, 667
EU/m3 was detected.

62
5.0 Overview of Chapter
The primary objective of this study was to evaluate Irish swine farmers’ occupational exposure
to respiratory hazards, namely gases, swine confinement dust and endotoxins. In this chapter
the main findings of the study in relation to the research objectives are discussed. The results of
this research are considered and compared to other studies and research carried out in similar
fields. The significance of this research and its results is consi dered while limitations of the
current study are acknowledged. In addition recommendations that resulted from this discussion
are offered and moreover, suggestions for future research are proposed.
5.1 Gas Exposure of Swine Confinement Workers
Carbon dioxide is produced by manure decomposition, animal respiration and heating systems.
In the current study carbon dioxide exposures of swine confinement workers ranged from 430
to 4780 ppm. The farmer who works throughout all the units in the swine farm expe rienced
significantly higher peak exposures of carbon dioxide than any of the other swine workers, with
a mean peak exposure of 4700 ppm carbon dioxide. On both days where high carbon dioxide
exposures were experienced by the farmer SEG worker (4620 and 47 80 ppm), the worker was
cleaning out non-slatted units, which would have a build up of manure on its surface, thus
accounting for the high carbon dioxide exposure experienced by the workers. It is important to
note that very high peak levels of carbon diox ide exposure were also experienced by the
fattening unit (2090 ppm) and the dry sow unit workers (2041 ppm). While the OELV for
carbon dioxide is 5000 ppm, concentrations in excess of 1540 ppm are considered to reflect
poor air quality and greater potentia l risk for the development of respiratory disease (Donham,
2000). Although the 8-hour OELV was not exceeded, carbon dioxide levels detected in this
study frequently reached concentrations greater than 1540 ppm. Mean carbon dioxide peak
exposures in excess of this value were observed for all workers, except for the farrowing unit
worker, who were exposed to just slightly lower levels of 1488 ppm carbon dioxide.
Consequently, these high exposures indicate that swine workers are at an increased risk of

63
experiencing headaches and dizziness during their typical working day and potentially
developing respiratory disease. Studies have shown a significant correlation between carbon
dioxide and lung function as related to forced expiratory flow at 75% vital capacity (FEF75)
(Donham et al. 1988) and between exposure to carbon dioxide and phlegm production (Zejda et
al., 1994).
Significant amounts of ammonia are released from manure and urine on the floors of the swine
confinement buildings or from manure storage pits. In the current study, ammonia TWA
exposures of the swine confinement workers ranged from 0.01 to 3.0 ppm and there were no
statistically significant differences in the ammonia exposures experienced by the various
worker groups. However, the dry sow and fa ttening unit SEG workers had the highest
exposures, with mean ammonia TWA values of 1.5 and 1.2 ppm respectively. The high
ammonia and carbon dioxide exposures in the fattening units are possibly attributable to the
presence of swine excrement on non -slatted floors and high stocking density of the fattening
pigs. The 8-hour OELV for ammonia is 20 ppm, while Donham (2000) recommended an
exposure health limit of 7 ppm ammonia. While neither of these limits was exceed in the
current study, short-term peak concentrations of 16 ppm ammonia were observed during
cleaning activities in fattening units which had non slatted floors. Such exposures reported in
the current study have been associated with irritation of the mucous membrane of the eyes,
noses and throats of the swine confinement workers. However due to the irritating nature of
ammonia, serious health problems are rarely seen because workers remove themselves from
high exposures (Preller et al., 1995). As high ammonia exposures are associated with activities
such as cleaning of non-slatted floors, it is especially important to ensure that the units are
adequately ventilated during these periods.
Carbon dioxide exposure levels in the current study range from 430 to 4780 ppm, while
ammonia TWA exposures range from 0.01 to 3 ppm. Chang and co -workers (2001) reported
levels of 5 ppm ammonia and 600 to 895 ppm carbon dioxide in their study carried out in open
style swine houses. However, the levels reported by these authors are well below most of the
published data, which involve studies carried out in enclosed swine buildings. Average

64
ammonia levels and carbon dioxide personal exposures reported for workers in swine
confinement buildings range from 5 to 34 ppm and from 1640 to 2632 ppm, respectively
(Attwood et al., 1987; Donham et al., 1989; Malcom et al., 2005; Zejda et al., 1984). Ammonia
levels reported in the current study appear to be quite low. However, an important point to
remember is that ammonia levels are affected by seasonal variations, which may acco unt for
some of the variation in reported results. Ammonia concentrations are generally found to
increase from summer to winter in response to a decreased ventilation rate to maintain internal
temperatures in the colder winter temperatures (Crook et al., 1991). While the farmer SEG
mean carbon dioxide exposures appear to be quite high as discussed previously, the exposures
of the other SEG worker groups’ appear to be within the range of that reported in the literature.
65
5.2 Exposure of Swine Workers to Swine Confinement Dust
When considering the levels of exposure experienced by the workers to swine confinement
dust, it is important to remember that Donham (1995) suggested an exposure threshold value of
2.4 mg/m3 total dust and 0.23 mg/m3 respirable dust. These values were suggested as repeated
exposures to concentrations in excess of these were found to be associated with higher levels of
ill health in swine confinement workers. Levels of personal inhalable swine confinement dust
exposures found in the current study range from 0.25 to 7.6 mg/m 3, while the respirable fraction
range from 0.01 to 3.4 mg/m 3.
The weaner unit worker (4.33 mg/m 3) was found to have the highest level of personal inhalable
dust exposure across the different SEG worker groups. All of the weaner unit (4.33 mg/m 3),
fattening unit (2.75 mg/m 3) and farmer (3.01 mg/m3) SEG workers were found to be exposed to
levels of swine confinement dust above the suggested threshold value of 2.4 mg/m 3. The
farrowing unit (1.94 mg/m 3) and dry sow unit (1.36 mg/m 3) SEG workers were not exposed to
concentrations of swine confinement dust above this recommended limit. In relation to
respirable swine confinement dust, the farrowing unit worker (0.46 mg/m 3) was found to have
the highest personal exposure levels. The weaner unit (0.25 mg/m 3), farrowing unit (0.46
mg/m3) and farmer (0.25 mg/m 3) workers exceed the recommended threshold limit of 0.23
mg/m3 respirable dust. However, the fattening unit (0.16 mg/m 3) and dry sow unit (0.10 mg/m 3)
workers were below the exposure threshold limit of 0.23 mg/m 3 respirable dust. There are
thought to be a number of influencing factors contributing to the personal exposure levels
experienced by the swine confinement workers, including: Duration the swine worker spends in
the unit; level of activity of animals in the units; stocking density of the units; feeding systems
and type of feed; surface area of the units; types of tasks done by the workers and manner in
which they are carried out; and interval of c leaning of the various units.
As mentioned previously, the highest personal inhalable particulate exposure levels were
experienced by the weaner unit SEG worker (4.33 mg/m 3). This high exposure may be
attributable to the greater activity of the younger s wine and the higher pig density in the weaner

66
units. A further possible influencing factor is the provision of dry based ration to swine in the
weaner unit, whereas wet feeding systems are to be found in the other units. The weaner unit
SEG workers duties involve close interaction with the young swine, such as grouping them into
homogenous groups, administering injections and general observation of their welfare during
this critical stage. The high swine confinement dust exposures of the farmer workers (3.0 1
mg/m3) are possibly a result of the varied nature of the tasks carried out and the numerous units
entered by these workers. As mentioned previously the farmer is responsible for the general
running of the entire farm and thus must enter all the swine uni ts several times throughout their
typical working day. In addition to carrying out all the required tasks in the different swine
units, the farmer is responsible for the moving of all the swine from each stage to the next,
which may be responsible for gene rating high dust levels. In addition to caring for the swine,
the farmer may be involved with working with other animals and general farming activities
such as building maintenance. As with the weaner unit worker (4.33 mg/m 3), the high dust
levels experienced by workers in the fattening unit (2.75 mg/m 3) may be a result of the high
stocking density found in these units. The low levels of personal dust exposure of those
working in the dry sow unit may be explained by the fact that these units are generally n ot as
densely stocked and that the sows are often pregnant and relatively inactive.
Also of relevance are the cleaning intervals in the different units. Both the farrowing units and
the weaner units are cleaned approximately every four weeks, in conjunc tion with the “All in,
All out” policy. However, the fattening unit is cleaned approximately every eight to ten weeks,
depending on the duration of time involved for the fatteners to reach their target weight of
approximately 93 kg. Thus these units may no t be as ‘clean’ as the farrowing and weaner units.
This may be a possible influencing factor for the relatively higher exposures of the fattening
unit worker (2.75 mg/m3).
It has been suggested that the respirable fraction of swine confinement dust const itutes a
significant proportion of the total inhalable fraction. Donham (1986) reported that seven per
cent of the total weight of the dust was respirable (Gustafsson, 1999). With the exception of the
farrowing unit worker, results reported in the study ap pear to concur with this statement. The

67
portion of total dust that is respirable in the farrowing unit appears to be exceptionally high,
constituting approximately twenty four per cent of the total inhalable dust. This is perhaps due
to the fact that the farrowing unit workers’ tasks include a significant amount of interaction
with the small piglets, such as clipping their tails and teeth. During such tasks the piglets are
extremely active and may result in dispersing higher amounts of respirable dusts.
Both inhalable and respirable swine confinement dust levels recorded in the current study
appear to be similar to those currently published in the literature. Inhalable dust exposures
determined in the present study, ranged between 0.25 and 7.61 mg/m3 across all units, were
similar to those of other published studies, which ranged from 1.32 to 8.8 mg/m 3 (Attwood et
al., 1987, Cormior et al., 1990, Donham et al., 1986; Mackiewicz, 1998; Malcom et al., 2005;
Preller et al., 1995; Simpson et al., 1999). These concentrations are approximately ten -fold
greater than total dust levels reported by Chang and co -workers (2001), who found average
personal exposures between 0.15 and 0.34 mg/m 3. Respirable dust exposures determined in the
present study, ranged between 0.0 1 and 3.4 mg/m3 across all units, were also comparable to
other published studies; means of respirable airborne dust exposures in swine confinement
buildings have been reported between 0.13 and 2.5 mg/m 3 (Donham et al., 1986; Zejda et al.,
1994). Again the mean respirable exposures dust reported by Chang and co -workers (2001)
were on the lower end of the scale, ranging from 0.08 to 0.24 mg/m 3.

68
5.3 Microbiological Analysis of the Air of Swine Confinement Buildings
Settle plates were used for the collection and enumeration of the microbial bioburden of the air
of swine confinement buildings. Coliforms, total colony forming units, yeasts and moulds were
collected and enumerated. As described in Section 4.4.1 of Chapter 4, samples were collected
in two farms, one being a modern building (Farm A), while the other is an older swine farm
(Farm B). Older farms, often up to 40 years old, tend to be smaller operations (200 sows),
employing possibly 2 or 3 employees. The modern facilities, as new as 4 years old, tend to be
larger (2,200) and more intensive production units, employing up to 15 employees. Hence,
these units often have more resources at their disposal and are in a position to ensure that more
stringent cleaning practices are adhered to. The purp ose of this analysis was as follows: Firstly
to investigate if there were any differences in the microbial bioburden of the air between the
older and the more modern swine facilites; secondly to investigate if there were any differences
in the microbial bioburden of the air between each of the different units; and finally if there is a
possible predictive value of observed cleanliness of the units in relation to the microbial
bioburden.
Firstly the overall microbial bioburden in the air was compared betwe en each of the 2 farms.
Analysis of the settle plate results found that there were very few statistically significant
differences in the numbers of microorganisms found between the two farms. There was a
significant differences in the numbers of yeasts and moulds that were found between the two
farms. Farm A was found to have higher numbers of moulds than Farm B, while Farm B was
found to be contaminated with higher numbers of yeasts than Farm A. Secondly the microbial
bioburden of the air of the farrowing, weaner and dry sow unit were then compared between
Farm A and Farm B. In this case it was found that the only statistically significant difference
between the two farms was in the number of the moulds in two of the units. Farm A was found
to have higher numbers of moulds in the dry sow and farrowing units than did Farm B. Overall
these results imply that while there are differences in the numbers of moulds in units between
the two farms, there are little differences in the levels of coliforms, total colony forming units
and yeasts found between the modern the and older swine confinement buildings.

69
Interestingly, Attwood and co -workers (1987) showed that there is a significant positive
correlation between airborne levels of culturable bacteria and the inter val of stall cleaning.
However, the findings of the current study seem to be in concurrence with those of Duchaine
and co-workers (2000) who reported that observed dirtiness of the swine confinement buildings
has a poor predictive value concerning air qual ity. Thus, while the interior of the units in Farm
A may appear to be cleaner, it is not possible to presume that the air of such apparently
‘cleaner’ swine confinement building will automatically have a lower microbial bioburden.
In addition the microbial bioburden in each of the units was compared within both of the
individual farms. From this comparison it appears that there is no difference in the numbers of
microbes found in the weaner unit, farrowing unit, dry sow unit and fattening unit of Farm A.
As regards Farm B, only one statistically significant difference was found, which was that the
farrowing unit was found to have higher numbers of coliforms than the weaner unit. Thus the
numbers of total colony forming units, yeasts and moulds appear to be similar across all the
units within both Farms A and B. Several other studies have found the fattening unit to be
contaminated with the highest airborne levels of culturable bacteria and gram -negative bacteria,
both in open-air swine houses and enclosed swine buildings (Chang et al., 2001; Cormior et al.,
1990; Crook et al., 1991). This finding appears to explain and be in concurrence with the fact
that fattening units have also been commonly cited as having one of the highest levels of
airborne endotoxin, which is the component of the cell wall of gram -negative bacteria that is
associated with the development of respiratory disease. Along with additional endotoxin
samples, it would be desirable to collect enough dust samples in each of the swine units of b oth
Farms A and B in order to determine if there is a correlation between the dust levels, endotoxin
levels and the microbial bioburden in the various units in these particular farms.
Furthermore it would be interesting to investigate the levels of bacte ria emanating from both
modern and older swine confinement buildings. Green and co -workers (2006), in a study aimed
at evaluating the levels of bacteria in the plume emanating from swine confinement buildings,
found that there was a marked increase in bacterial levels inside the facility (average of 18,132
CFU/m3) versus upwind (average of 63 CFU/m 3) and a steady downwind decrease in bacterial
levels out to approximately 150 m from the facility. Thus, in relation to the current study, it

70
would be desirable to carry out the sampling on a larger scale and across the different units
before any conclusions are drawn as to the effect of the facilities on the microbial bioburden of
the air both inside of the various units and in the air emanating from such swine c onfinement
buildings. In addition it would be beneficial to account for variables such as the duration of
cleaning, number and density of swine in the units, ventilation systems and ventilation rates,
temperature and relative humidity. Both temperature and relative humidity have been
documented as two important factors relating to the survival of bacteria in dust and the number
of airborne microorganisms (Chang et al., 2001).
Overall, the numbers of coliforms in the air of the swine confinement buildings ranged from 0
to 5.6 x 10³ cfu/m2, numbers of total colony forming units ranged from 3.1 x 10 2 to 9.5 x 10⁵
cfu/m2, numbers of yeasts ranged from 1.1 x 10 3 to 3.5 x 10⁴ cfu/m2 and the numbers of moulds
ranged from 7.9 x 10² to 8.1 x 10³ cfu/m2. Undoubtedly settle plates are an invaluable
microbiological method for assessing the likely number of microorganisms that are naturally
deposited from the air onto a surface in a given time. However after extensive analysis of the
literature, it is apparent that this method has not been widely applied across various industries
and thus it is not possible to compare the numbers of microorganisms found in the current study
with those found in other studies. Several researchers have used air samplers, such as the
Anderson microbial sampler (Cormior et al., 1990; Chang et al., 2001), which use forced
impaction of a certain amount of litres of air per minute onto the agar media. Such results are
reported as cfu/m3, as opposed to cfu/m2, which is reported in the current stud y. It would be
desirable in future studies to employ microbial air samplers in order to make comparisons with
the microbial bioburden reported in both swine farms and other industries. Swine confinement
buildings have previously been placed among the worki ng environments with the highest
bioaerosol pollution, along with grain stores, seed stores, animal feed factories, poultry farms,
herb processing plants and waste composting facilities (Chang et al., 2001; Adhikari et al.,
2004; Fishwick et al., 2001; Dutkiewicz et al., 2001). As of yet there are no internationally
accepted OELV for bioaerosols and microbial bioburdens in working environments; however
several authors have suggested recommended values, which have been reviewed by Dutkiewicz
and co-workers (2001).

71
5.4 Endotoxin Exposures of Swine Confinement Workers
As mentioned earlier there are several modifications of the Limulus Amebocyte Lysate assay
available for the quantification of endotoxin from environmental settings. In the current study
the LAL endpoint assay was used to determine the levels of endotoxin that were present in the
samples from the various swine worker groups.
The LAL endpoint assay generates results as break -point values; break-point values found in
the current study were as follows: <16,667 EU/m3 air; ≥16,667 EU/m3 air; ≤166,667 EU/m3 air;
and >166,667 EU/m3 air. Results from this assay indicate that all swine confinement workers
are exposed to endotoxin levels at concentrations ≤166,667 EU/m3 air and in one particular case
(fattening unit worker) was exposed to a level in excess of 166,667 EU/m3. There are numerous
suggestions in the literature for an exposure standard ranging from 50 –2000 EU/m3 (Radon,
2002). The Dutch Expert Committee on Occupational Standards of the National Health Council
has proposed a limit of 50 EU/m 3 over an 8-hour exposure period (Heederik and Douwes,
1997), while the International Commission on Occupational Health have proposed an
occupational exposure limit of 125 EU/m3. Several authors have offered exposure limit
recommendations for endotoxin of 90 EU/m3, 330 EU/m3 and 800 EU/m3 (Castellan 1987;
Rylander, 1985; Donham and Cumro, 1999). Even accepting the higher recommended
threshold limit of 800 EU/m3 results found in this study are 200 times greater than suggested,
indicating that there is potential for development of acute respiratory effects in swine
confinement workers.
However, exposures to high levels of endotoxin are not uncommon across various industries.
Zock and co-workers (1995) in a study aimed at determining exp osure in the potato processing
industry reported that twenty three per cent of the workers had a mean exposure above 1000
EU/m3. Kullmann and co-workers reported levels of 34,800 EU/m3 in the air of dairy farms.
According to Fishwick and co -workers (2001), there have been reported maximum
concentrations of endotoxin in the region of 16,970 and 66,000 EU/m3 in the cotton mill
industry (Gokani et al., 1987; Christiani et al., 1993). Simpson and co-workers (1999) carried

72
out a comparative study of dust and end otoxin exposure across nine different occupations.
These authors found poultry workers to be the most highly exposed to endotoxin levels of
719,950 EU/m3 with swine workers exposed to 149,230 EU/m3. These exposures appear to be
comparable to exposures of 166,667 EU/m3 found in the current study. In order to comprehend
the significance of such high endotoxin exposures, it is only necessary to point out that low
exposures of 70 EU/m3 have been reported for occupations such as mushroom handling
(Simpson et al., 1999).
Statistical analysis revealed that there were no significant differences between the levels of
endotoxin exposure experienced by the different SEG workers. While the weaner unit SEG
worker was exposed to the highest level of inhalable dust, the workers in this unit were not
exposed to the highest level of endotoxin. The highest level of endotoxin exposure ( >166,667
EU/m3) was a sample collected on a worker in the fattening unit. Interestingly, Chang and
coworkers (2001) also found that the highes t respirable endotoxin levels in the fattening unit
were greater than the inhalable exposures found in any of the other swine units. These authors
explained that this inconsistency might be due to the variation in the amount of endotoxin and
dust found to be in the respirable fraction across the different swine units. The difference in the
duration of time that the workers spent in the units was also thought to be relevant. The
fattening units tend to be larger units of greater surface area than other units , and the workers
often need to spend longer periods of time in these units than they do in perhaps the weaner
unit.
As endotoxin is a component of the cell wall of gram -negative bacteria and their release is
linked with bacterial death, these high levels of endotoxin appear to be in concurrence with the
high levels of bacteria that were detected in the air of the swine confinement buildings.
Theoretically, quantification of the load of gram -negative bacteria in the air via endotoxin
detection and vice versa should be possible. Laitinen and co -workers (1999) have shown that
endotoxin levels in the air of wastewater treatment plants can be estimated from bacterial
counts, by use of a selective medium for gram -negative bacteria. These authors concluded that
the LAL assay could be used to estimate the concentration of viable gram -negative bacteria in

73
the air. However Seedorf and co -workers (1998) did not confirm these conclusions in their
study, finding that there was no significant correlation between the con centrations of gram-
negative bacteria and aerial endotoxin. Due to the nature of the break -point value results
generated by the LAL endpoint assay, it is not possible to attempt to draw any conclusions from
the endotoxin results and bacterial counts report ed in the current study. Thus no definitive
conclusions can be drawn from this study as to the possibility of quantifying the load of gram -
negative bacteria in the air via endotoxin detection and vice versa. However, it is evident from
these results that swine confinement workers are exposed to high levels of endotoxin, which
have previously been associated with the initiation of respiratory disease.

74
5.5 Conclusions
While neither the ammonia nor carbon dioxide personal exposures sampl ed in the current study
are above the recommended 8 -hour OELV, the carbon dioxide exposure data frequently
exceeds the recommended limit for the prevention of acute respiratory symptoms in healthy
swine confinement workers. In addition, swine workers are f requently exposed to high levels of
inhalable and respirable swine confinement dust at concentrations above recommended health
threshold limits. Where contaminant concentrations are below the 8 -hour OELV, it is important
to remember that this is often beca use the workers spend a significant proportion of the working
day in the ambient air. It is apparent from this study also that the air of swine confinement
buildings is contaminated with high levels of microorganisms. Also endotoxin levels detected
in this study are 200-fold greater than suggested exposure limits for swine confinement workers
(Donham and Cumro, 1999). Thus results from this research show that swine confinement
workers are potentially exposed to levels of contaminants at hazardous levels abo ve
recommended maximum values for human health, which previous studies have associated with
adverse health effects in these workers, and in particular with the development of respiratory
disease.
An important concept that emerges from this study is that the hallmark of agricultural
exposures, such as those experienced by swine workers, is their enormous diversity in type,
extent and duration. Importantly, there is a stark lack of awareness of the affects an occupation
in the swine industry has on the heal th of the workers. Swine workers health can be protected
through implementation of a comprehensive program incorporating environmental monitoring
and control through the use of engineering controls, management practices, worker education,
health surveillance and use of personal protection equipment. By ensuring that swine workers
receive adequate education and training, and follow specified health and safety policies,
employers can reduce the risk of illness, injury and mortality in their workforce.

75
5.6 Limitations of the Study
It is necessary to acknowledge the following limitation of the current study:
As results from settle plates are generated as cfu/m 2 and there is a lack of such
published results, is not possible to compare the microbial bioburd en of the air of the
swine confinement units with other workplaces. In order to address this it would be
possible to use microbial air samplers, which have been widely used for determining the
microbial bioburden of the air across various industries.
While the results generated from the LAL end -point assay indicate that workers are
potentially exposed to endotoxin levels in excess of recommended health limits, they do
not specify the exact levels (EU/m 3) of air. The kinetic LAL assay is a modification of
this assay that may be availed of in order to determine the exact level of endotoxin
exposure of the swine confinement workers.
After analysis of the literature it was decided to concentrate on determining the
endotoxin exposures of the weaner, fattening and farmer SEG workers, who were
previously reported as being exposed to the highest levels of endotoxin. However, in
addition it would be desirable to determine the levels of exposure experienced by the
farrowing and dry sow SEG workers.

76
5.7 Future Research
In order to further our understanding in this area and address current knowledge gaps, further
studies are warranted to investigate the following areas:
Duchaine and co-workers (2000) found that there is a decrease in some contaminants
found in swine confinement buildings during the summer months. However the effect of
seasonal variations on the levels of the various contaminants has not been considered in
the current study and should be investigated in future studies, taking into account
variables such as temperature, relative humidity and wind velocity.
While the occupational exposure of swine workers to respiratory hazards was the
primary concern of the current study, they are not the only workforce at issue in the
agricultural sector. Those individuals working with poultry and cattle are also exposed
to similar contaminants and it would be interesting to carry out an analogous study
across different workforces in the agricultural sector.
Given these high exposure levels a major objectiv e of this study was to document the
various control measures and best practices in existence in the swine industry (Refer to
Section 2.5, of Chapter 2). While the current study has documented many of the control
measures and best practices future research is needed into the practicality and effects of
such measures in protecting the health of swine confinement workers.
77
5.8 Study Recommendations
On the basis of the present study’s findings, the following recommendations are offered:
Exposure monitoring and health surveillance are required across the swine industry for
protecting the health of swine confinement workers, particularly for vulnerable groups
such as pregnant workers or those with respiratory disease.
Attention needs to be directed to protecting the health of swine workers through:
Comprehensive programs of environmental monitoring and control; the implementation
of engineering controls; use of efficient management and best practices; and
education/awareness training.
The HSA have issued a ‘Draft Code of Practice for Preventing Injury and Occupational
Ill Health in Agriculture’, which is intended to provide guidance and to improve the
level of safety and health among all people engaged in the agriculture sector. Such
practical education is imperative in order to make workers aware of the risks to which
they are exposed and the measures that may be taken, by them and their employers to
protect their health and well -being.

78
REFERENCES
1. Adhikari, A., Reponen, T., Lee, S. and Gri nshpun, S. (2004). Assessment of Human
Exposure to Airborne Fungi in Agricultural Confinements: Personal Inhalable Sampling
versus Stationary Sampling. Ann. Agric. Environ. Med., 11, 269–277.
2. Anderson, T. (2001). Future U.S. Swine Industry. International animal agriculture and
food science conference, Indianapolis, Indiana. [Online]
www.fass.org/fass01/pdfs/Andersen.pdf [18th August 2006]
3. Ashton, I. and Gill, F. (2000). Monitoring for Health Hazards at Work. Blackwell
Scientific: Oxford, Malden, MA.
4. Attwood, P., Brouwer, R., Ruigewaard, P., Versloot, P., de Wit, R., Heederik,
D.and Boleij, J. (1987). A study of the relationship between airborne contaminants and
environmental factors in Dutch s wine confinement buildings. Am. Ind. Hyg. Assoc. J.,
48(8), 745-751.
5. Barber, E., Dosman, J., Senthilselvan, A., Kirychuk, S., Wilson, P., Rhodes, C.,
Lemay, S. and Hurst, T. (1999). Comparison of Two Strategies for Reducing Exposure
of Swine Barn Workers to Dust pp157-163. International Symposium on Dust Control
in Animal Production Facilities. Scandinavian Congress Center Aarhus.
6. Borg, R. (1999). Dust and Gases In the Barn Environment: How to measure and what to
do about it. Advs. in Pork Prod., 10, 187-190.
7. Chang, C., Chung. H., Huang, C. and Su, H. (2001). Exposure Assessment to
airborne endotoxin, dust, ammonia, hydrogen sulfide and carbon dioxide in open style
swine houses. Ann. Occp. Hyg., 45(6), 457-465.

79
8. Chang, C., Chung. H., Huang, C. and Su, H. (2001). Exposure of Workers to
Airborne Microorganisms in Open -Air Swine Houses. Appl. and Environ. Microb.,
67(1), 155-161.
9. Charavaryamath, C., Janardhan, K., Townsend, H., Wilsnon, P and Singh, B.
(2005). Multiple exposures to swine barn air induce lung inflammation and airway
hyper-responsiveness. Resp. Research, 6(50), [Online] http://respiratory-
research.com/content/6/1/50 [13th June 2006]
10. Chastain, J. (2000). Air Quality and Odor Control From Swine Production Facilities
[Online] www.clemson.edu/camm/Camm_s/Ch9/sch9_03.pdf [10th March 2006].
11. Christiani, D., Wegman, D., Eisen, E., Ye, T., Lu, P. and Olenchock, S. (19 93).
Cotton dust and Gram-negative bacteria endotoxin correlations in two cotton textile
mills. Am. J. Ind. Med., 23, 333-342.
12. Connon, S. A. and Giovannoni, S. J. (2002). High-Throughput Methods for Culturing
Microorganisms in Very-Low-Nutrient Media Yield Diverse New Marine Isolates.
Appl. and Environ. Microb., 68, 3878-3885.
13. Cormior, Y., Tremblay, G., Meriaux, A., Brochu, G. and Lavoie, J. (1990).
Airborne Microbial Content in Two Types of Swine Confinement Buildings in Quebec.
Am. Ind. Hyg. Assoc., 51(6), 304-309.
14. Crook, B., Robertson, J., Glass, S., Botheroyd, E., Lacey, J. and Topping, M.
(1991). Airborne dust, ammonia, microorganisms, and antigens in pig confinement
houses and the respiratory health of exposed farm workers. Am. Ind. Hyg. J., 52(7), 271-
279.
80
15. Donham, K., Rubino, M., Thedell, T. and Kammermeyer, J. (1977). Potential health
hazards to agricultural workers in swine confinement buildings. J. Occup. Med., 19,
383-387.
16. Donham, K., Cumro, D. and Reynolds, S. (2002). Synergistic effects of dust and
ammonia on the occupational health effects of poultry production workers. J. Agromed.,
8(2), 57-76.
17. Donham, K., Rubino, M., Thedell, T. and Kammermeyer, J. (1977). Potential health
hazards to agricultural workers in swine confinement buildin gs. J. Occup. Med., 19(6),
383-387.
18. Donham, K. (1986). Hazardous agents in agricultural dusts and methods of evaluation.
Am. J. Ind. Med., 10, 205-220.
19. Donham, K., Yeggy, J. and Dague, R. (1988). Production of toxic gases from liquid
swine manure: Health implications for workers and animals in swine confinement
buildings. Bio. Wastes, 24(3), 161-173.
20. Donham, K., Haglind, P., Peterson, Y., Rylander, R. and Belin, L. (1989).
Environmental and health studies of farm workers in Swedish swine confinement
buildings. Br. J. Ind. Med., 46, 31-37.
21. Donham, K. (1995). A Review-The Effects of Environmental Conditions inside Swine
Housing on Worker And Pig Health. Manipulating Pig Production V. Australian Pig
Science Association.
22. Donham, K. and Cumro, D. (1999). Setting Maximum Dust Exposure Levels for
People and Animals in Livestock Facilities, pp 93 -110. International Symposium on
Dust Control in Animal Production Facilities. Scandinavian Congress Center, Aarhus.

81
23. Donham, K. and Cumro, D. (1999b). Synergistic Health Effects of Ammonia and Dust
Exposures, pp 166. International Symposium on Dust Control in Animal Production
Facilities. Scandinavian Congress Center, Aarhus.
24. Donham, K. (2000). The concentration of swine production: effects on swine health,
productivity, human health, and the environment. Toxicology, 16(3), 559-597.
25. Doss, H., Howard, L., Mc Leod, P and Mc Leod, W. (2002). Beware of Maunre Pit
Hazards. [Online] http://www.cdc.gov/NASD/docs/d001001 -
d001100/d001097/d001097.html [17th August 2006]
26. Douwes, J., Versloot, P., Hollander, A. and Doekes, G. (1995). Influence of various
dust sampling and extraction methods on the measurement of airborne endotoxin. App.
and Environ. Microb., 61(5), 1763-1769.
27. Duchaine, C., Thorne, P., Meriaux, A., Grimard, Y., Whitten, P. and Cormier, Y.
(2001). Comparison of Endotoxin Exposure Assessment by Bioaerosol Impinger and
Filter-Sampling Methods. App. and Environ. Microb., 67(6), 2775-2780.
28. Dutkiewicz, J., Krysinska-Traczyk, E., Skorska, C., Sitkowska, J., Prazmo, Z. and
Golec, M (2001). Exposure to Airborne Microorganisms and Endotoxin in Herb
Processing Plants. Ann. Agric. Environ.Med., 8, 201-211.
29. Fishwick, D., Allan, L., Wrights, A. and Curran, A. (2001). Assessment of Exposure
to Organic Dust in a Hemp Processing Plant. Ann. Occup. Hyg., 45(7), 577-583.
30. Gokani, V., Doctor, P. and Ghosh, S. (1987). Isolation and identification of Gram
negative bacteria from raw cotton and s ynthetic textile fibres with special reference to
environmental GNB and endotoxin concentrations of textile mill. Am. Ind. Hyg. Assoc.
J., 48(6), 511-414.
82
31. Green, C., Gibbs, S., Tarwater, P., Mota, L. and Scarpino, P. (2006). Bacterial
Plume Emanating from the Air Surrounding Swine Confinement Operations. J. of
Occup. and Environ. Hyg., 3(9), 9-15.
32. Gustafsson, G. (1999). Measures against Dust in Pig Houses, pp 244 -252. International
Symposium on Dust Control in Animal Production Facilities. Scandinavian Co ngress
Center, Aarhus.
33. Harrington, J, Gill, F., Aw. T. and Gardiner, K. (1998). Occupational Health, Pocket
Consultant. Fourth Edition. Blackwell Publishing: Oxford, Malden, MA.
34. Health and Safety Authority (2003). Farm Safety Plan 2003-2007. [Online]
http://www.hsa.ie/publisher/storefront/product_download.jsp?dir_itemID=11 [13th June
2006]
35. Health Services Executive (2005). Common Zoonoses in Agriculture. Agricult ure
Information Sheet No 2 (revised). [Online] www.hse.gov.uk [19th June 2006]
36. Heederik, D. and Douwes, J. (1997). Towards an occupational exposure limit for
endotoxins? Ann. Agric. Environ. Med., 4,17-19.
37. Heederik, D., Thorne, P. and Douwes, J. (2002). Biological agents - monitoring and
evaluation of bioaerosol exposure. Mod. Ind. Hyg., 2(9), ACGIH, Cincinnati, OH.
38. Hobbs, P., Pain, B., Kay, R. and Lee, P. (1996). Reduction of odourous compounds in
fresh pig slurry by dietary control of crude protein. J . Sci. Food Agric., 71, 508-514.

83
39. Hoppin, J. Umbach, D. London, S. Alavanja, M. and Sandler, D. (2003). Animal
production and wheeze in the Agricultural Health Study: Interactions with atopy,
asthma, and smoking. Occup. Environ. Med., (60):e3 [Online]
http://www.occenvmed.com/cgi/content/full/60/8/e3
40. Iowa Department Natural Resources (2004). Animal Feeding Operations
Technical Workgroup Report On: Air Emissions Characterization, Dispersion Modeling,
and Best Management Practices. The Iowa Department of Natural Resources Animal
Feeding Operations Technical Workgroup. [Online]
http://www.iowadnr.com/air/afo/aforeport.html [13th June 2006].
41. Jacobson, L., Schmidt, D., Nicolai, R. and Clanton, C. (1999). Evaluating the Use of
Straw and Other Floating Materials to Control Odor and Gases from Pig Manure
Storage Units. ASAE paper No. 99 -4134, St. Joseph, MI: ASAE
42. Kay, R. and Lee. P. (1997). Ammonia emission from pig buildings and characteristics
of slurry produced by pigs offered low crude protein diets. Proceedings of the
International Symposium on Ammonia and Odour Control from Animal Product ion
Facilities, pp 253-260. CIGR and EurAgEng publication, Rosmalen, The Netherlands.
43.Kirychuk, S. (2002). Protecting Farm Worker Health and Safety: Risks and Hazard
Associated with Hog Production. Adv. in Pork Prod., (13), 177.
44. Kullman, G., Thorne, P., Waldron, P., Marx, J., Ault, B., Lewis, D., Siegel, P.,
Olenchock, S. and Merchant, J. (1998). Organic dust exposures from work in dairy
barns. Am. Ind Hyg. Assoc. J., 59(6), 403-413.
45. Laitinen, S., Nevalainen, A., Kotimaa, M., Liesivuori, J. and Martika inen, P.
(1992). Relationship between Bacterial Counts and Endotoxin Concentrations in the Air
of Wastewater Treatment Plants. Appl. and Environ. Microb., 58(11), 3774-3776.

84
46. Laitinen, S. (1999). Importance of sampling, extraction and preservation for the
quantation of biologicaaly active endotoxin. Ann. Agric. Environ. Med., 6(1), 33-8.
47. Lawlor, (2002). Health is Wealth – Your Health! Teagasc Pig Newsletter 5(4), 1-4.
[Online] www.teagasc [11th July 2006]
48. Lynch, B. (2000). Low Protein Diets. Teagasc Pig Newsletter 3(6), 1-4. [Online]
www.teagasc [11th July 2006]
49. Lemay, S., Chenard, L., Barber, E. and Fengler, R. (2000). Optimization of a
Sprinkling System Using Undiluted Canola Oil Fo r Dust Control in Pig Buildings, pp
337-344. Air Pollution from Agricultural Operations. Proceeding of the 2 nd International
Conference. Des Moines, Iowa.
50. Lemay, S., Chenard, L. and MacDonbald, R. (2002 ). Indoor Air Quality in Pig
Buildings: Why is it important and how is it Managed? London Swine Conference –
Conquering the Challenge, London.
51. Lorimor, J., Hoff, S. and O’Shaughnessy, P. (2002). Chapter 10. Emission Control
Systems. [Online] www.public-health.uiowa.edu/ehsrc/CAFOstudy/CAFO_ 10.pdf [10th
March 2006].
52. Mackiewicz, B. (1998). Study on exposure of pig farm workers to bioaerosols,
immunologic reactivity and health effects. Ann. Agric. Environ. Med., 5, 169–175.
53. Madigan, M., Martinko, J. and Parker, J. (2000). Microbial Evolution and
Systematics. In: Brock Biology of Microorganisms. Ninth Edition. Prentice Hall, New
Jersey.
85
54. Malcom, R., Conroy, L., Schoonover, T. and Erdal, S. (2005). Personal Exposure to
Total Dust, Ammonia and Endotoxin among Workers in a Swine Confinement Facility.
Paper 88, Podium Session 112: Agricultural Safety and Health [Online]
www.aiha.org/abs05/po112.htm [15th June 2006].
55. Merchant, J., Kline, J., Donham, K., Bundy, D. and Hodne, C. (2002). Human
health effects. In the IOWA Concentrated Animal Feeding Operations Air Quality
Study Final Report, pp121-145. IOWA State University and the University of IOWA
Study Group. [Online] http://www.public-health.uiowa.edu/ehsrc/CAFO
study/CAFO_6-3.pdf [13th June 2006]
56. Meyer, T. (1997). Ammonia Control in Agriculture, pp 575-577. Proceedings of the
International Symposium. Ammonia and Odour Control from Animal Production
Facilities, volume 2. Eds Jan Voermans and GertJan Monteny. The Netherlands.
57. Myers, K., Olsen, C., Setterquist, S., Capuano, A., Donham, K., Thacker, E.,
Merchant, J. and Gray, C. (2006). Are swine workers in the United States at increased
risk of infection with zoonotic influenza vi rus? Clin. Infect. Dis., 42(1), 14-20.
58. McNeel, S. and Kreutzer, R. (1996). Fungi & Indoor Air Quality. Health & Environ.,
Digest 10(2), 9-12. [Online]
http://www.dhs.cahwnet.gov/org/ps/deodc/ehib/EHIB2/topics/fungi_indoor.html [13th
June 2006]
59. Omland, O. (2002). Exposure and Respiratory Health in Farming in Temperate Zones –
A Review of the Literature. Ann. Agric. Environ. Med., 9, 119-136.
60. O’Shaughnessy, P. , Achutan, C. and Karsten, A. (2002). Temporal Variation of
indoor air quality in an enclose swine confinement building. J. Agric. Saf. Health 8(4),
349-64.

86
61. Pickrell, J. (1991). Hazards in confinement housing - gases and dusts in confined
animal houses for swine, poultry, horses and humans. Vet. Hum. Toxicol., 33(1), 32-39.
62. Portengen, L., Preller, L., Tielen, M., Doekes, G. and Heederik, D. (2005).
Endotoxin exposure and atopic sensitization in adult pig farmers. J. Allergy Clic.
Immunology 797-802.
63. Preller, L., Heederik, D., Kromhout, H., Boleii, J. and Tielen, M. (1995).
Determinants of Dust and Endotoxin Exposure of Pig Farmers: Development of a
Control Strategy Using Empirical Modelling. Ann. Occup. Hyg., 39(5), 545-557.
64. Radon, K., Danuser, B., Iversen , M., Monso, E., Weber, C., Hartung, J., Donham,
K., Palmgren, U. and Nowak, D. (2002). Air Contaminants in Different European
Farming Environments. Ann. Agric. Environ. Med., 9, 41-48.
65. Radon, K (2006). The Two Sides of the “Endotoxin Coin”. Occ. Environ. Med., (3),
73–78. [Online] www.oembmjjournals.com [16th March 2006]
66. Roelofs, P & Bibbebdijk, G. (2000). Covering feeders in rooms for weaned piglets;
effects on dust concentrations in the air. Praktijkonderzoek Varkenshouderij 1.253, 1-24
67. Rylander, R., Bake, B. and Fischer, J. (1989). Pulmonary function and symptoms
after inhalation of endotoxin. Am, Rev, Respir, Dis,m 140, 981-986.
68. Schmidt, A. and Heber, A. (2005). Dust, Odor and Gas Control in Swine Fin ishing
Barns Through Oil Sprinkling. [Online]
www.extension.missouri.edu/explore/agguides/ansci/g02530.htm [10th March 2006].

87
69. Seedorf, J., Hartung, J., Schroder, M., Linkert, K., Philips, R., Holden, M., Sneath,
R., Short, J., White, R., Pederson, S., T akai, H., Johnsen, J., Metz, J., Groot
Koerkamp, P., Uenk, G. and Wathes, C. (1998). Concentrations and Emissions of
Airborne Endotoxins and Microorganisms in Livestock Buildings in Northern Europe.
J. Agric. Engng. Res., 70, 97-109.
70. Sigurdarson, S., O’Shaughnessy, P., Watt, J. and Kline, J. (2004). Experimental
Human Exposures to Inhaled Grain Dust and Ammonia: Towards a Model of
Concentrated Animal Feeding Operations. Am. J. of Ind. Med., 46, 345-348.
71. Simpson, J., McL.Niven, R., Pickering, C., Oldham, L., Fletcher, A. and Francis,
H. (1999). Comparative Personal Exposures to Organic Dusts and Endotoxin. Ann.
Occup. Hyg., 32(1), 107-115.
72. Takai, H. and Pederson, S. (2000). A Comparison Study of Different Dust Control
Methods in Pig Buildings. App. Eng. in Agri., 16(3), 269-277.
73. Teagasc (1999). Land Spreading of Animal Manures, Farm Wastes and Non -
Agricultrual Organic Wastes Part 1 – Manure (and other organic wastes) Management
Guidelines for Intensive Agricultural Enterprises. [Online]
www.teagasc.ie/research/reports/environment/4026/eopr -4026.pdf [20th July 2006]
74. Teagasc (2006). Agri-Food Information – Pigs [Online] www.teagasc [10th March
2006]
75. The National Committee for Pig Production (1999). Addition of lignin to straw. 1999
Annual Report [Online] www.danskeslagterier.dk/view.asp?ID=539 [10th June 2006]

88
76. Thorne, P. and Heederik, D. (1999). Assessment methods for bioaerosols. In: Organic
Indoor Air Pollutants - Occurrence, Measurement, Evaluation . Weinheim, Germany:
Wiley/VCH.
77. Thorne, P. (2004). Chapter 3.0 Air Quality Issues, pp 35-44. [Online] www.public-
health.uiowa.edu/ ehsrc/CAFOstudy/CAFO_finalChap_3.pdf [10th March 2006]
78. Von Essen, S. (2001). The Respiratory Inflammatory Response to the Swine
Confinement Building Environment [Online] http://www.cdc.gov/nasd/docs/d001701 -
d001800/d001765/d001765.html [13th June 2006]
79. Wathes, C., Phillips, V., Holden, M., Sneath, R., Short, J., White, R., Hartung, J.,
Seedorf, J., Schro, M., Linkert, K., Pederson, S., Takai, H., Johnsem, O., G root, K.,
Uenk, G., Metz. J., Hinz, T., Caspary, V. and Linke, S. (1998). Emissions of Aerial
Pollutants in Livestock Buildings in Norther Europe: Overview of a Multinational
Project. J. Agri. Eng. Research, 70, 3-9.
80. White, E. (2002). Environmental Endotoxin Measurement Methods: Standardization
Issues. Appl. Occ. and Environ. Hyg., 17(9), 606-609.
81. World Health Organisation (2000). Environmental Health Criteria 214 - Human
Exposure Assessment. Geneva. [Online]
www.inchem.org/documents/ehc/ehc/ehc214.htm [10th March 2006]
82. Zejda, J., Barber, E., Dosman, J., Olenchock, S., Mc Duffoe, H., Rhodes, C. and
Hurst, T. (1994). Respiratory heath status in swine producers relates to endotoxin
exposure in the presence of low dust levels. J. Occup. Med., 36(1), 49-56.
89
83. Zhang, Y., Tanaka, A., Barber, E. and Feddes, J. (1996). Effect of frequency and
quantity of sprinkling canola oil on dust reduction in swine buildings. Transactions of
Am. Society of Agri. Eng., 39(3), 1077-1081.
84. Zock, J., Heederik, D. and Kromhout, H. (1995). Exposure to Dust, Endotoxin and
Micro-organisms in the Potato Processing Industry. Ann. Occup. Hyg., 39(6), 841-854.
85. Zijlstra, S., Gerken, P, Rechin, C., Wortmann, R. and Notohamprodjo,G. (1997).
Validation of the Limulus Amebocyte (LAL) Test for Routine PET
Radiopharmaceuticals Lysate. Appl. Radiat. Isot., 48(1), 51-54.
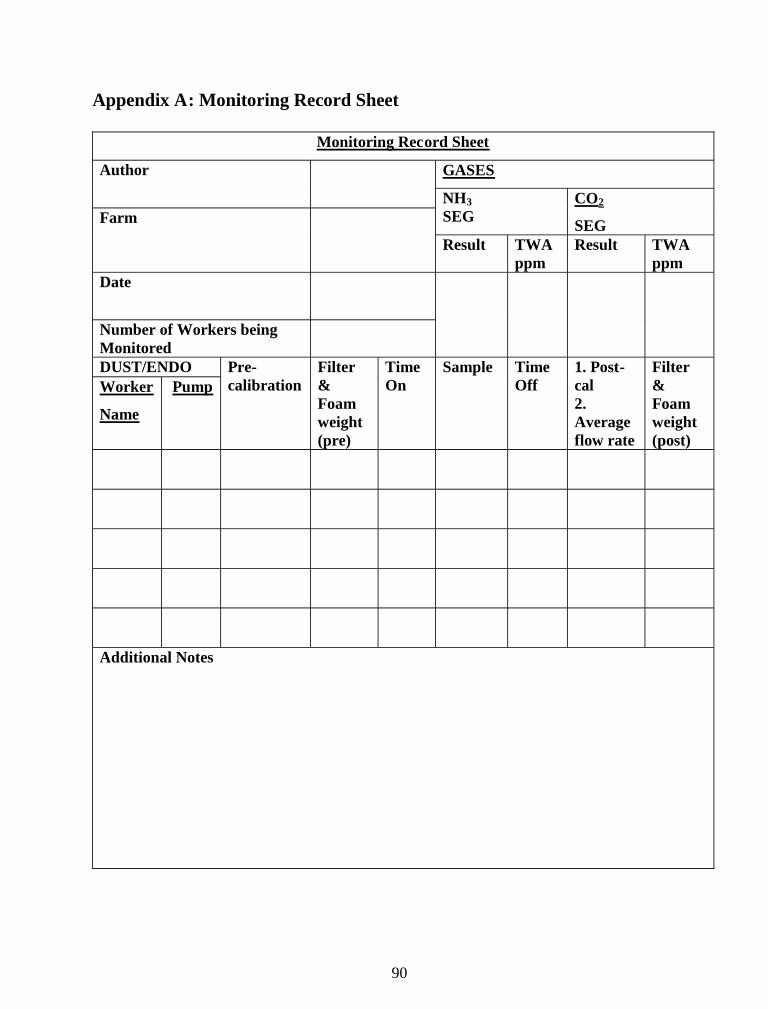
90
Appendix A: Monitoring Record Sheet
Monitoring Record Sheet
GASESAuthor
NH3
SEGCO2
SEGFarm
Result TWAppm
Result TWAppm
Date
Number of Workers beingMonitoredDUST/ENDOWorker
Name
PumpPre-calibration
Filter&Foamweight(pre)
TimeOn
Sample TimeOff
1. Post-cal2.Averageflow rate
Filter&Foamweight(post)
Additional Notes

91
Appendix B: Details on Limulus Amebocyte Lysate Assay