exports and imports show decline
TRANSCRIPT
Exports and Imports Show Decline C. C. CONCANNON, Office of International Trade, U. S. Department of Commerce, Washington, D. C.
T h r o u g h o u t t h e world c h e m i c a l p r o d u c t i o n i s o n t h e i n c r e a s e w i t h a t e n d e n c y t o revert t o p r e w a r p a t t e r n s o f l e a d e r s h i p
A N 1944 when leading minds in t h e allied chemical trades could foresee a termination of hostilities, plans were worked on with the hope of a prompt restoration of the industrial life of the world. However, recovery was slowed considerably by general world insufficiency of materials and labor and transportat ion difficulties despite the great expansion in the essential chemical industry, especially in the western hemisphere and British Commonwealth Now tha t shortages of chemicals are alleviated for the most par t and the pentup demand is being satisfied, these entities are planning means for meeting intensified competition in foreign markets. British and French chemical exports had been increasing, as had those of the United States, unt i l the summer of 1948 when t he trend turned downward. Exports of chemicals and allied products from the United States were valued at $641.5 million in the first nine months of 1948- 3 % less t h a n in the corresponding period of 1947; those for the first half of 1948 were 1.5% over the 1947 figure. Impor ts also were down and were valued a t $216.5 million, 1 4 % below the 1947 three-quarter period. Nevertheless, United States foreign chemical t rade remains several times t h a t of 1938.
World chemical trade generally continued on a high plane in 1948, par t ly because of the large consumption everywhere. High prices likewise contributed t o the large value. An outstanding characteristic of 1948 trade was the conclusion of commercial agreements among various countries, especially those of Europe.
World Production.
Chemical production is proceeding a t a rapid pace and, according to available indexes, is above similar 1938 levels in all world areas, particularly in Europe (United Kingdom, France, Netherlands, Sweden, Belgium, and Switzerland); British empire spheres of influence (Australia, New Zealand, Union of South Africa, India , a n d Canada) ; and in American republics (especially Argentina, Brazil, and Columbia) . I n I taly, however, t he chemical industry was operating at only about 8 5 % a n d in Germany at 6 2 % in September 1948.
Although chemical ou tpu t is generally greater than in 1938, there are some indications of a tendency to revert t o the prewar pattern—i.e. , those countries tha t were leaders then continue to be leaders
now, with the two exceptions of Germany and Japan . Repor ts are coming into the effect that already some wart ime factories in other areas are proving uneconomical in operation and are being closed. Nevertheless, world chemical consumption has increased greatly, a n d it is probable t h a t demands for both old and new chemicals will be sufficient t o maintain the greater part of the war-built establishments in operating condition even if below capacity.
T o compare 1948 accomplishments with those of 10 years ago would not be feasible in an article of this type, but some changes may be highlighted by a* few significant examples. Those countries which took advantage of circumstances to produce vital items manufactured in comparatively few countries or to develop their chemical industries from their own natural resources a n d to increase ou tpu t where demand already exists are in stronger position to continue growth and to share to a greater extent in world chemical t rade than those manufacturing mostly from imported materials and producing commodities of l imited sale.
Canada, utilizing its abundan t water-
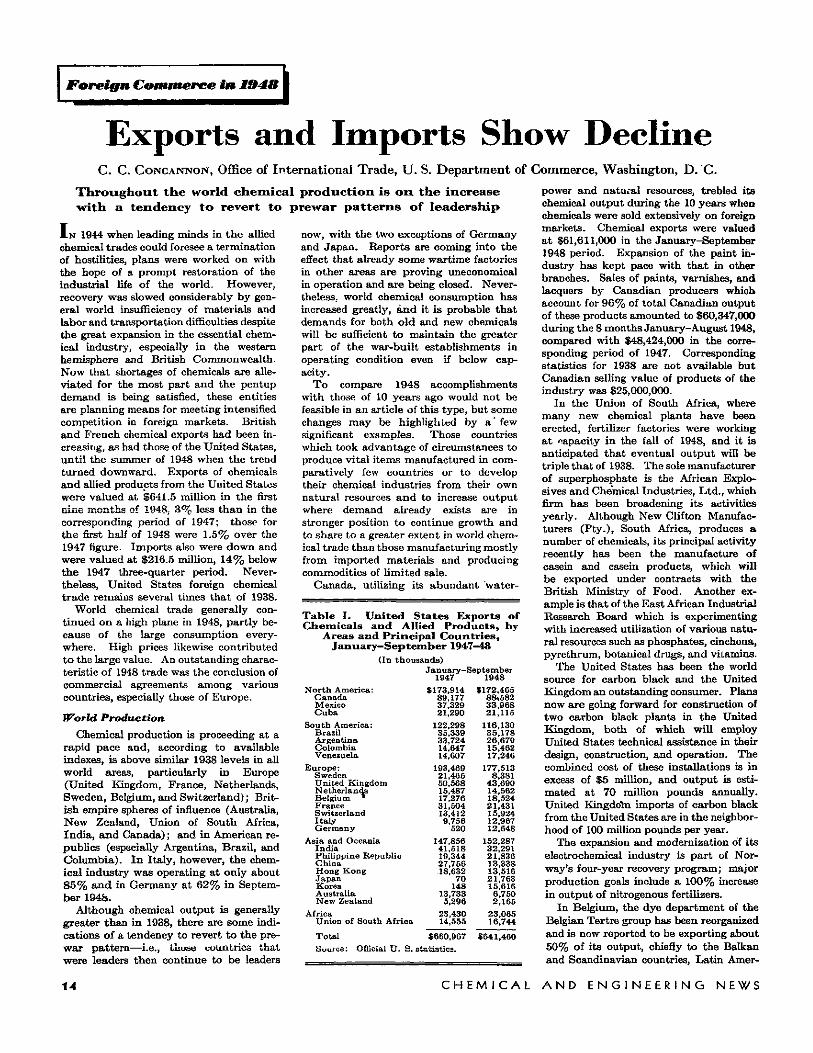
Table I. United States Exports of Chemicals and Allied Products, by
Areas and Principal Countries, January-September 1947-48
(In thou
North America: Canada Mexico Cuba
South America: Brazil Argentina Colombia Venezuela
Europe: Sweden United Kingdom Netherlands Belgium * France Switzerland Italy Germany
Asia and Oceania India Philippine Republic China Hong Kong Japan Korea Australia New Zealand
Africa Union of South Africa
Total Source; Official U. S.
isands) January-S
1947 $173,914
89,177 37,329 21,290
122,298 35,339 33,724 14,647 14,607
193,469 21,465 50,568 15,487 17,276 31,504 13,412 9,756
520 147,856
41,518 19,344 27,756 18,632
70 148
13,733 5,296
23,430 14,555
S660.967 statistics.
eptember 1948
$172,465 88)582 33,968 21,115
116,130 35,178 26,679 15,462 17,246
177,513 8,381
43,690 14,562 18,524 21,431 15,924 12,967 12,648
152,287 32,291 21,836 13,338 13,516 21,763 15,616
6,750 2,165
23,065 16,744
$641,460
power and natura l resources, trebled its chemical output during the 10 years when chemicals were sold extensively on foreign markets . Chemical exports were valued a t $61,611,000 in the January-September 1948 period. Expansion of the paint industry has kept pace with t h a t in other branches. Sales of paints, varnishes, and lacquers by Canadian producers which account for 9 6 % of total Canadian output of these products amounted to $60,347,000 during t h e 8 months January-August 1948, compared with $48,424,000 in the corresponding period of 1947. Corresponding statistics for 1938 are not available bu t Canadian selling value of products of the industry was $25,000,000.
In t he Union of South Africa, where many new chemical plants have been erected, fertilizer factories were working a t capacity in the fall of 1948, and it is anticipated t ha t eventual ou tpu t will be triple t h a t of 1938. The sole manufacturer of superphosphate is the African Explosives a n d Chemical Industries, Ltd. , which firm has been broadening its activities yearly. Although New Clifton Manufacturers (Pty . ) , South Africa, produces a number of chemicals, its principal activity recently has been the manufacture of casein and casein products, which wiD be exported under contracts with the British Ministry of Food. Another example is tha t of the East African Industrial Research Board which is experimenting with increased utilization of various natural resources such as phosphates, cinchona, pyrethrum, botanical drugs, and vitamins.
The United States has been the world source for carbon black and the United Kingdom an outstanding consumer. Plans now a re going forward for construction of two carbon black plants in the United Kingdom, both of which will employ United States technical assistance in their design, construction, and operation. The combined cost of these installations is in excess of $5 million, and output is estimated at 70 million pounds annually. United Kingddm imports of carbon black from t h e United States are in t he neighborhood of 100 million pounds per year.
The expansion and modernization of i ts electrochemical industry is pa r t of Norway's four-year recovery program; major production goals include a 100% increase in output of nitrogenous fertilizers.
In Belgium, the dye depar tment of the Belgian Tertre group has been reorganized and is now reported to be exporting about 50% of its output, chiefly to the Balkan and Scandinavian countries, Lat in Amer-
14 C H E M I C A L A N D E N G I N E E R I N G N E W S
Foreign Commerce in M94S
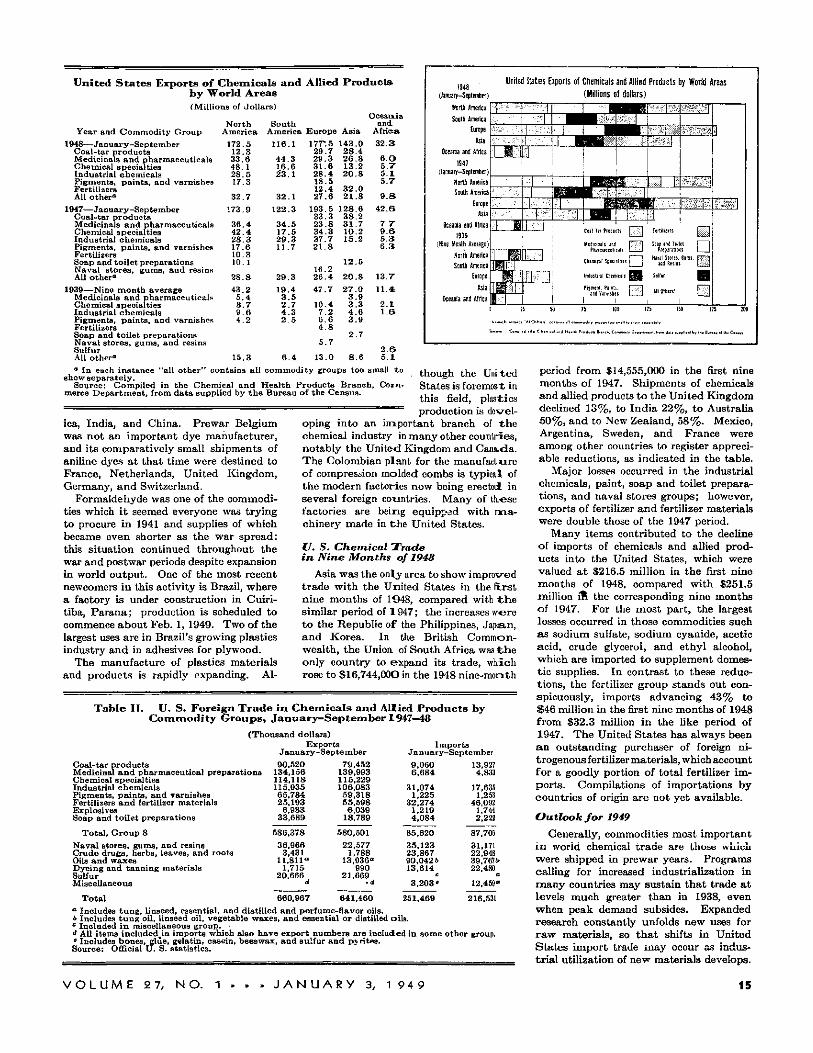
United S t a t e s Exports of Chemica l s and Allied Products by World Areas (Millions of dollars)
Year and C o m m o d i t y Group
1 9 4 8 — J a n u a r y - S e p t e m b e r Coal-tar product s Medicinals a n d pharmaceut ica l s Chemical spec ia l t i es Industrial chemica l s P igments , pa ints , and varnishes Fertil izers All o t h e r 0
1 9 4 7 — J a n u a r y - S e p t e m b e r Coal-tar produc t s Medic inals and pharmaceut ica ls Chemical spec ia l t ies Industrial chemica l s P igments , pa ints , and varnishes Fertilizers Soap and to i l e t preparations N a v a l s tores , gums , and resins All other*
1939—Nine m o n t h average Medicinals and pharmaceut ica ls Chemical spec ia l t i es Industrial chemica l s P igments , pa in t s , and varnishes Fertil izers Soap and t o i l e t preparations N a v a l s tores , gums, and resins Sulfur All o t h e r 0
North America
1 7 2 . 5 1 2 . 3 3 3 . 6 4 8 . 1 2 8 . 5 1 7 . 3
3 2 . 7
1 7 3 . 9
3 6 . 4 4 2 . 4 2 8 . 3 1 7 . 6 1 0 . 3 1 0 . 1
2 8 . 8
4 3 . 2 5 . 4 8 . 7 9 . 6 4 . 2
1 5 . 3
South America Europe As ia
1 1 6 . 1
4 4 . 3 1 6 . 6 2 3 . 1
3 2 . 1
1 2 2 . 3
3 4 . 5 1 7 . 5 2 9 . 3 1 1 . 7
2 9 . 3
1 9 . 4 3 . 5 2 . 7 4 . 3 2 5
6 . 4
177*. 5 2 9 . 7 2 9 . 3 3 1 . 6 2 8 . 4 1 8 . 5 1 2 . 4 2 7 . 6
1 9 3 . 5 3 3 . 3 2 3 . 8 3 4 . 3 3 7 . 7 2 1 . 8
1 6 . 2 2 6 . 4
4 7 . 7
1 0 . 4 7 . 2 6 . 6 4 . 8
5 . 7
1 3 . 0
1 4 3 . 0 2 8 . 4 2 6 . 8 1 3 . 2 2 0 . 8
3 2 . 0 2 1 . 8
1 2 8 . 6 3 8 . 2 3 1 . 7 1 0 . 2 1 5 . 2
1 2 . 5
2 0 . 8
2 7 . 0 3 . 9 3 . 3 4 . 6 3 . 9
2 . 7
8 . 6
Oceania and
Afr ica
3 2 . 3
6 . 0 5.7 5 . 1 5 . 7
9 . 8
4 2 . 6
7.7 9 . S 5 . 3 6 . 3
1 3 . 7
1 1 . 4
2 . 1 1 . 6
2 . 6 5 . 1
1948 (January-September)
1 North America
South America
Europe
Asia
Oceania and Africa
1947 (January—September)
North America
South America
Europe
Asia
Oceania and Africa
1939
(Nine Month Average)
North America
South America
Europe
j Asia Oceania and Africa
United States Exports of Chemicals and Allied Products by World Areas
(Millions of dollars)
f
r
I I i
J
, 1
_ L _ • • ! • •-
• 'T"" i una J ! 1 1 !
i i
1 1
1, , \
1
iiHi~r
M~ ,11- 1
||
•II J F
|-
4 - M
1 1
•-"-i , * _—-
- ~ - ; l
L-'i'-F _j |
r—1
Medicinals and f j Soao and To.let 1 1 Pharmaceuticals L i Preparations | |
1.1. • r i. 1 I Naval Stores. Gums. r r i Cbero.ca! Specialt.es j j , „ „ R e s i a ' s ^
Industrial Chemicals g g g Sultur ^ J j
1 1 ! 1
3
:-r~-1
25 50 75 100 125 150 175 200 1
l».—<:K ,n,l.nc« "All O A « „ " c « l i . m i l l commodity r°«C» Wo im.ll lo i h o - >.p.«t<ly 1
o « * » - Cuipi l td i» ik. Cfc.m.c.l .r.d H«.tth Prodgctt B..r.cK. Commt.c. Dejwrtm.nt. horn d . l . >uppli«d b r tk« Bw..» ol lS. Ciniin 1
a In each instance "all other" contains all commodity groups too small to show separately.
Source: Compiled in the Chemical and Health Products Branch, Commerce Department, from data supplied by the Bureau of the Census.
ica, India, and China. Prewar Belgium was not an important dye manufacturer, and its comparatively small shipments of aniline dyes at that time were destined to France, Netherlands, United Kingdom, Germany, and Switzerland.
Formaldehyde was one of the commodities which it seemed everyone was trying to procure in 1941 and supplies of which became even shorter as the war spread: this situation continued throughout the war and postwar periods despite expansion in world output. One of the most recent newcomers in this activity is Brazil, where a factory is under construction in Cuiri-tiba, Parana; production is scheduled to commence about Feb. 1, 1949. Two of the largest uses are in Brazil's growing plastics industry and in adhesives for plywood.
The manufacture of plastics materials and products is rapidly expanding. Al
though the United States is foremost, in this field, plastics production is devel
oping into an important branch of t h e chemical industry in many other countries, notably the United Kingdom and Canada. The Colombian plant for the manufacture of compression molded combs is typical of the modern factories now being erected in several foreign countries. Many of tli-ese factories are being equipped with m a chinery made in the United States.
17. S- Chemical Trade in Nine Months of 1948
Asia was the only area to show improved trade with the United States in the first nine months of 1948, compared with t h e similar period of 1947; the increases irere to the Republic of the Philippines, Japan, and Korea. In the British Commonwealth, the Union of South Africa was t h e only country to expand its trade, which rose to $16,744,000 in the 1948 nine-month
Table II. U. S. Foreign Trade i n C h e m i c a l s and Allied Products by C o m m o d i t y Groups , J a n u a r y - S e p t e m b e r L947—48
( T h o u s a n d dollars) Export s Imports
J a n u a r y - S e p t e m b e r January-September
Coal-tar product s Medicinal a n d pharmaceut ical preparat ions Chemical spec ia l t ies Industrial chemica l s P igments , pa in t s , and varnishes Fertilizers a n d fertilizer materials Explos ives Soap and to i l e t preparations
Tota l , G r o u p 8
N a v a l s tores , gums, and resins Crude drugs, herbs, l eaves , a n d roots Oils a n d w a x e s D y e i n g and tann ing materials Sulfur •Miscellaneous
Total
90 ,520 134,156 114,118 115,935
6 5 , 7 8 4 25 ,193
6 ,983 33 ,689
586 ,378
36 ,966 3,431
l l , 8 1 1 a
1,715 20 ,666
d
660 ,967
79 ,452 9 , 0 6 0 13,927 139 ,993 6 , 6 8 4 4,833 115,229 106 ,083 31 ,074 17,635
59 ,318 1,225 1,253 55 ,598 3 2 , 2 7 4 46,092
6 ,039 1,219 1.744 18 ,789 4 , 0 8 4 2,222
580 ,501 85 ,620 87,706
22 ,577 35 ,123 31,171 1,788 23 ,867 22.948
13 ,936° 90 ,0426 39,767&-990 13,614 22,480
21 ,669 c c
-d 3 , 2 0 3 * 12,459»
6 4 1 , 4 6 0 251,469 216,531 a Includes tung, linseed, essential, and distilled and perfume-flavor oils. b Includes tung oil, linseed oil, vegetable waxes, and essential or distilled oils. e Included in miscellaneous group. • d All items included#in imports which also have export numbers are included in some other group. 0 Includes bones, glue, gelatin, casein, beeswax, and sulfur and p> rites. Source: Official U. S. statistics.
period from $14,555,000 in the first nine months of 1947. Shipments of chemicals and allied products to the United Kingdom declined 13%, to India 22%, to Australia 50%, and to New Zealand, 58%. Mexico, Argentina, Sweden, and France were among other countries to register appreciable reductions, as indicated in the table.
Major losses occurred in the industrial chemicals, paint, soap and toilet preparations, and naval stores groups; however, exports of fertilizer and fertilizer materials were double those of the 1947 period.
Many items contributed to the decline of imports of chemicals and allied products into the United States, which were valued at $216.5 million in the first nine months of 1948, compared with $251.5 million if\ the corresponding nine months of 1947. For the most part, the largest losses occurred in those commodities such as sodium sulfate, sodium cyanide, acetic acid, crude glycerol, and ethyl alcohol, which are imported to supplement domestic supplies. In contrast to these reductions, the fertilizer group stands out conspicuously, imports advancing 43% to $46 million in the first nine months of 1948 from $32.3 million in the like period of 1947. The United States has always been an outstanding purchaser of foreign nitrogenous fertilizer materials, which account for a goodly portion of total fertilizer imports. Compilations of importations by countries of origin are not yet available.
Outlook for 1949
Generally, commodities most important in world chemical trade are those which were shipped in prewar years. Programs calling for increased industrialization in many countries may sustain that trade at levels much greater than in 1938, even when peak demand subsides. Expanded research constantly unfolds new uses for raw materials, so that shifts in United States import trade may occur as industrial utilization of new materials develops.
V O L U M E 2 7, N O . 1 » » » J A N U A R Y 3, 1 9 4 9 15