exports and export diversification in sub … and export diversification in sub-saharan africa a...
TRANSCRIPT
EXPORTS AND EXPORT DIVERSIFICATION IN SUB-SAHARAN AFRICAA STRATEGY FOR POST-CRISIS GROWTH
Vera Songwe Deborah Winkler
AFRICA GROWTH INITIATIVE
WORKING PAPER 3 | DECEMBER 2012
Vera Songwe1 is a Nonresident Senior Fellow with
the Africa Growth Initiative at the Brookings Institution
and Country Director for Senegal, Cape Verde, the
Gambia, Guinea Bissau and Mauritania at the World
Bank.
Deborah Winkler2 is a consultant at the World Bank’s
International Trade Department.
Author’s Note:
The views expressed in the paper are those of the authors and should not be attributed to the World Bank, its ex-
ecutive directors or the countries they represent. The authors want to thank Punam Chuhan-Pole, Chorching Goh,
Mwangi Kimenyi and Ben Shepherd for their comments and suggestions.
Abstract:
In this paper, we are concerned with the effects of exports and export diversification on growth and the policy im-
plications for post-crisis export strategies. Using a panel of 30 selected sub-Saharan African countries over the
period 1995-2008, we estimate the impact of exports and export diversification on value added, labor productivity,
and conditional and unconditional labor demand. We find, first, that exports have a positive impact on value added,
labor productivity and labor demand. Second, we find that export diversification of products and markets increase
value added and labor productivity, but not labor demand. When we drop natural resource-intensive countries
from the sample, we can confirm these results for value added, labor productivity and unconditional labor demand.
Third, controlling for the export market share to the U.S., EU-25, China and sub-Saharan Africa, we find that the
export destination matters for growth and employment.
We also interact exports with export diversification of products and markets as well as export market shares.
Contrary to expectations, we find that the positive value added and labor productivity effects from exports are
larger the more concentrated (instead of diversified) in export products and markets the countries in our sample
are. Finally, we find that the effect of exports on growth and employment is also influenced by export destina-
tion. We argue that sub-Saharan Africa’s export structure is one of the main reasons the region has been able to
get a head start out of the recent recession. We also suggest that sub-Saharan African countries, especially the
resource-based economies, need to concentrate on improving productivity in areas where they have a compara-
tive advantage and on moving up the value chain in those commodities.
CONTENTS
1. Introduction . . . . . . . . . . . . . . . . . . . . . . . . . . . . . . . . . . . . . . . . . . . . . . . . . . . . . . . . . . . . . . . . . . . . . . . . . .1
2. Literature Review . . . . . . . . . . . . . . . . . . . . . . . . . . . . . . . . . . . . . . . . . . . . . . . . . . . . . . . . . . . . . . . . . . . 5
Exports, Export Diversification and Growth . . . . . . . . . . . . . . . . . . . . . . . . . . . . . . . . . . . . . . . . . . . . 5
Exports, Export Diversification and Labor Demand . . . . . . . . . . . . . . . . . . . . . . . . . . . . . . . . . . . . . 6
3. The Effect of Exports and Export Diversification on Growth . . . . . . . . . . . . . . . . . . . . . . . . . . . . . . . 8
Empirical Model . . . . . . . . . . . . . . . . . . . . . . . . . . . . . . . . . . . . . . . . . . . . . . . . . . . . . . . . . . . . . . . . . . . . 8
First Indicators . . . . . . . . . . . . . . . . . . . . . . . . . . . . . . . . . . . . . . . . . . . . . . . . . . . . . . . . . . . . . . . . . . . . 9
Regression Results: Value Added . . . . . . . . . . . . . . . . . . . . . . . . . . . . . . . . . . . . . . . . . . . . . . . . . . . . 12
Regression Results: Labor Productivity . . . . . . . . . . . . . . . . . . . . . . . . . . . . . . . . . . . . . . . . . . . . . . 15
4. The Effect of Exports and Export Diversification on Labor Demand . . . . . . . . . . . . . . . . . . . . . . . 18
Empirical Model . . . . . . . . . . . . . . . . . . . . . . . . . . . . . . . . . . . . . . . . . . . . . . . . . . . . . . . . . . . . . . . . . . . 18
First Indicators . . . . . . . . . . . . . . . . . . . . . . . . . . . . . . . . . . . . . . . . . . . . . . . . . . . . . . . . . . . . . . . . . . . 20
Regression Results: Conditional Labor Demand . . . . . . . . . . . . . . . . . . . . . . . . . . . . . . . . . . . . . . . 20
Regression Results: Unconditional Labor Demand . . . . . . . . . . . . . . . . . . . . . . . . . . . . . . . . . . . . . 24
5. Policy Implications for Post-Crisis Export Strategies . . . . . . . . . . . . . . . . . . . . . . . . . . . . . . . . . . . . 27
References . . . . . . . . . . . . . . . . . . . . . . . . . . . . . . . . . . . . . . . . . . . . . . . . . . . . . . . . . . . . . . . . . . . . . . . . . . 30
Endnotes . . . . . . . . . . . . . . . . . . . . . . . . . . . . . . . . . . . . . . . . . . . . . . . . . . . . . . . . . . . . . . . . . . . . . . . . . . . . 33
Appendix 1: Data . . . . . . . . . . . . . . . . . . . . . . . . . . . . . . . . . . . . . . . . . . . . . . . . . . . . . . . . . . . . . . . . . . . . . . 34
Appendix 2: Summary Statistics . . . . . . . . . . . . . . . . . . . . . . . . . . . . . . . . . . . . . . . . . . . . . . . . . . . . . . . . 35
LIST OF TABLES
Table 1: Exports and Export Diversification, 30 SSA Countries, 1995 vs. 2008 . . . . . . . . . . . . . . . . . 3
Table 2: Exports, Export Diversification and Value Added, 30 SSA Countries, 1995-2008 . . . . . . 13
Table 3: Exports, Export Diversification and Value Added, 26 SSA Countries, 1995-2008 . . . . . . 14
Table 4: Exports, Export Diversification and Labor Productivity, 30 SSA Countries, 1995-2008 . . . . . . . . . . . . . . . . . . . . . . . . . . . . . . . . . . . . . . . . . . . . . . . . . . . . . . . . . . . . . . . . . . . 16
Table 5: Exports, Export Diversification and Labor Productivity, 26 SSA Countries, 1995-2008 . . . . . . . . . . . . . . . . . . . . . . . . . . . . . . . . . . . . . . . . . . . . . . . . . . . . . . . . . . . . . . . . . . . .17
Table 6: Exports, Export Diversification and Conditional Labor Demand, 30 SSA Countries, 1995-2008 . . . . . . . . . . . . . . . . . . . . . . . . . . . . . . . . . . . . . . . . . . . . . . . . . . . . . . . . . . . . . . . . . . . 22
Table 7: Exports, Export Diversification and Conditional Labor Demand, 26 SSA Countries, 1995-2008 . . . . . . . . . . . . . . . . . . . . . . . . . . . . . . . . . . . . . . . . . . . . . . . . . . . . . . . . . . . . . . . . . . . 23
Table 8: Exports, Export Diversification and Unconditional Labor Demand, 30 SSA Countries, 1995-2008 . . . . . . . . . . . . . . . . . . . . . . . . . . . . . . . . . . . . . . . . . . . . . . . . . . . . . . . . . . . . . . . . . . . 25
Table 9: Exports, Export Diversification and Unconditional Labor Demand, 26 SSA Countries, 1995-2008 . . . . . . . . . . . . . . . . . . . . . . . . . . . . . . . . . . . . . . . . . . . . . . . . . . . . . . . . . . . . . . . . . . . 26
LIST OF FIGURES
Figure 1: Exports and Export Diversification vs. Value Added, 1995-2008, 30 SSA Countries . . . . . . . . . . . . . . . . . . . . . . . . . . . . . . . . . . . . . . . . . . . . . . . . . . . . . . . . . . . . 10
Figure 2: Exports and Export Diversification vs. Labor Productivity, 1995-2008, 30 SSA Countries . . . . . . . . . . . . . . . . . . . . . . . . . . . . . . . . . . . . . . . . . . . . . . . . . . . . . . . . . . . . . 11
Figure 3: Exports and Export Diversification vs. Employment, 1995-2008, 30 SSA Countries . . . . . . . . . . . . . . . . . . . . . . . . . . . . . . . . . . . . . . . . . . . . . . . . . . . . . . . . . . . . 21
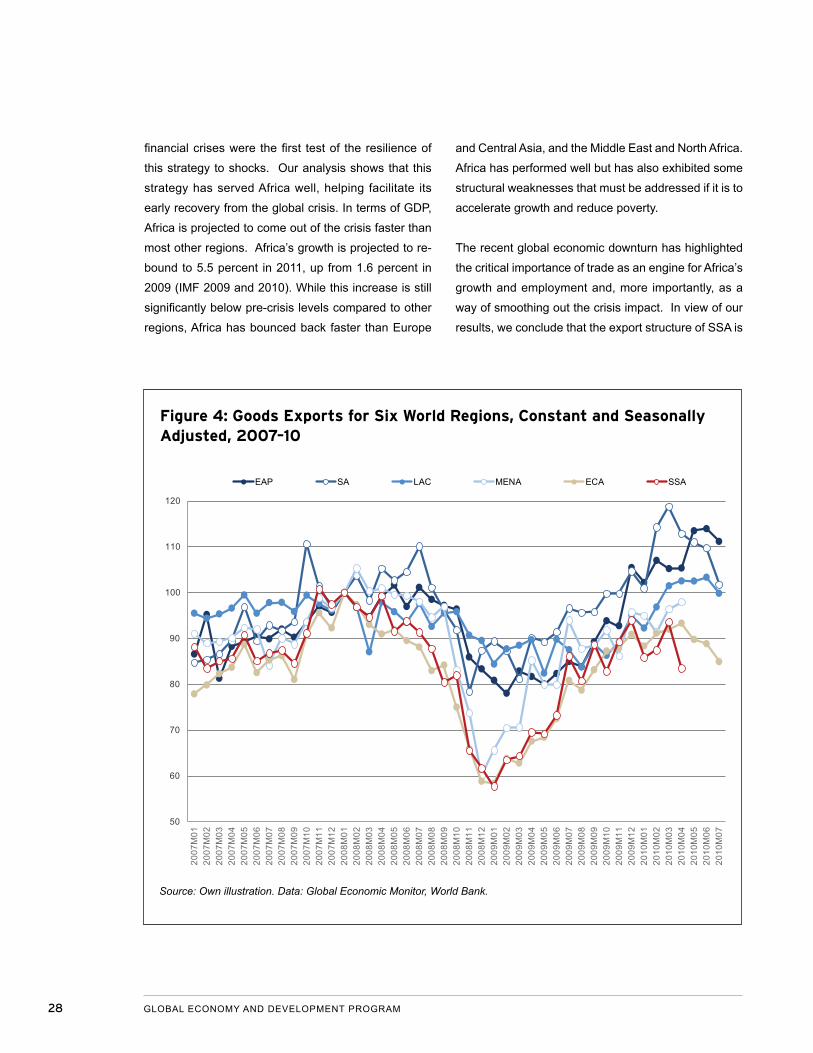
Figure 4: Goods Exports for Six World Regions, Constant and Seasonally Adjusted, 2007–10 . . . . . . . . . . . . . . . . . . . . . . . . . . . . . . . . . . . . . . . . . . . . . . . . . . . . . . . . . . . . . . . . . . . . . 28
EXPORTS AND EXPORT DIVERSIFICATION IN SUB-SAHARAN AFRICA 1
EXPORTS AND EXPORT DIVERSIFICATION IN SUB-SAHARAN AFRICAA STRATEGY FOR POST-CRISIS GROWTH
Vera Songwe and Deborah Winkler
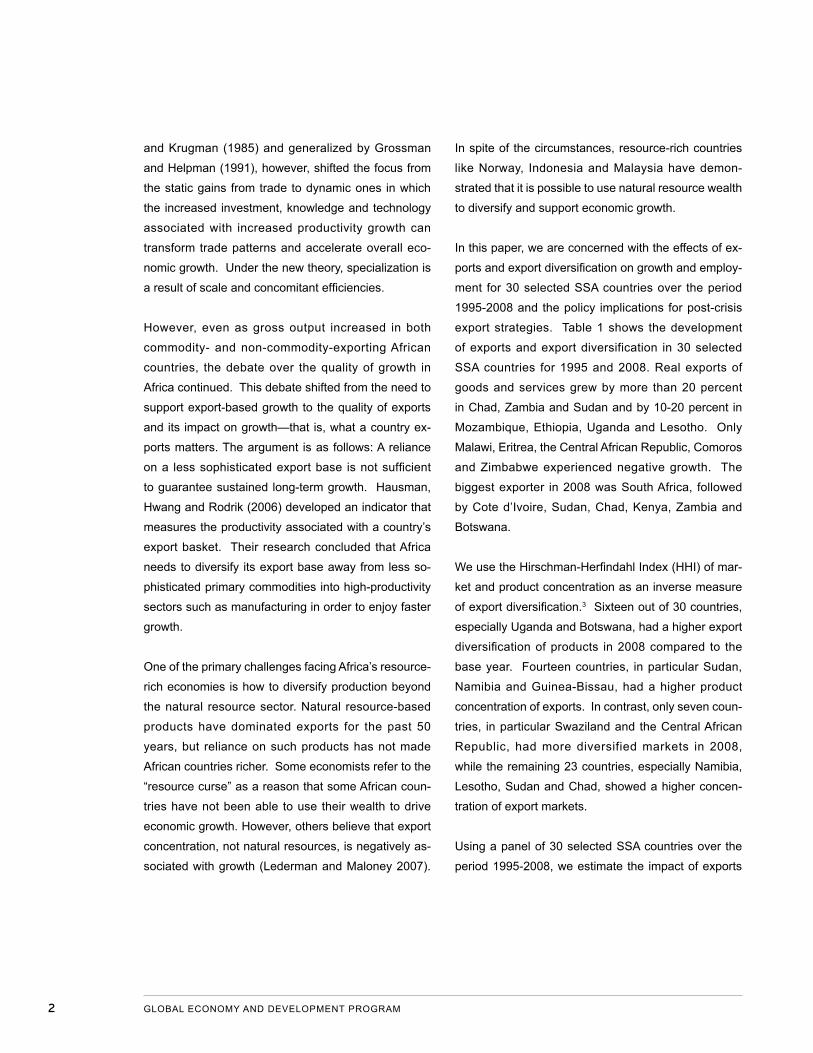
1. INTRODUCTION
The past decade has been one of great volatility for
Africa but also of substantial progress. At the turn
of the decade, many in the developing world won-
dered if Africa would become “the doomed continent”
(Quenum 2000), crippled by political and ethnic ten-
sions (Easterly and Levine 1997), or if in fact Africa
could claim the 21st century (Gelb 2000). In that en-
vironment, predictions that sub-Saharan Africa (SSA)
as a continent was about to enter the fastest growth
period of its young 50-year history would have seemed
impossible. However, between 2002 and 2008 gross
domestic product (GDP) grew by 6.5 percent annually
in the region. Commodity-exporting countries as well
as non-commodity-exporting countries experienced
high growth rates. In fact, some of the non-commodity-
exporting countries such as Burkina Faso, Mali and
Rwanda grew faster than their commodity-exporting
neighbors.
The hitherto poor macroeconomic indicators that had
become synonymous with Africa have also changed.
Inflation in most countries was brought down to single
digits for the first time in decades, debt ratios fell to sus-
tainable levels, and deficits were reduced as countries
moved to consolidate the size of government, rational-
ize spending, and obtain debt write-offs. In an overall
favorable external economic environment, these re-
forms quickly began to produce results. Foreign ex-
change reserves, including gold, increased more than
300 percent from $37 billion in 2001 to $154 billion in
2008. Net flows of foreign direct investment more than
doubled from $14 billion in 2001 to $34 billion in 2008.
Goods exports over the period 2000–2008 grew by 18
percent per year as the continent became increasingly
more open and globally connected.
The channels through which export expansion en-
hances aggregate productivity and growth are well-
known. Exports allow for specialization in a country’s
comparative advantage and thereby raise growth.
Ricardo, in his famed theory of comparative advan-
tage, showed that countries benefit by specializing in
the production of those goods with the lowest oppor-
tunity cost and trading the surplus of production over
domestic demand, taking as given appropriate ex-
change-rate regimes. Under this model, a country will
quickly specialize in sectors in which it has a compara-
tive advantage. The new trade theory à la Helpman
2 GLOBAL ECONOMY AND DEVELOPMENT PROGRAM
and Krugman (1985) and generalized by Grossman
and Helpman (1991), however, shifted the focus from
the static gains from trade to dynamic ones in which
the increased investment, knowledge and technology
associated with increased productivity growth can
transform trade patterns and accelerate overall eco-
nomic growth. Under the new theory, specialization is
a result of scale and concomitant efficiencies.
However, even as gross output increased in both
commodity- and non-commodity-exporting African
countries, the debate over the quality of growth in
Africa continued. This debate shifted from the need to
support export-based growth to the quality of exports
and its impact on growth—that is, what a country ex-
ports matters. The argument is as follows: A reliance
on a less sophisticated export base is not sufficient
to guarantee sustained long-term growth. Hausman,
Hwang and Rodrik (2006) developed an indicator that
measures the productivity associated with a country’s
export basket. Their research concluded that Africa
needs to diversify its export base away from less so-
phisticated primary commodities into high-productivity
sectors such as manufacturing in order to enjoy faster
growth.
One of the primary challenges facing Africa’s resource-
rich economies is how to diversify production beyond
the natural resource sector. Natural resource-based
products have dominated exports for the past 50
years, but reliance on such products has not made
African countries richer. Some economists refer to the
“resource curse” as a reason that some African coun-
tries have not been able to use their wealth to drive
economic growth. However, others believe that export
concentration, not natural resources, is negatively as-
sociated with growth (Lederman and Maloney 2007).
In spite of the circumstances, resource-rich countries
like Norway, Indonesia and Malaysia have demon-
strated that it is possible to use natural resource wealth
to diversify and support economic growth.
In this paper, we are concerned with the effects of ex-
ports and export diversification on growth and employ-
ment for 30 selected SSA countries over the period
1995-2008 and the policy implications for post-crisis
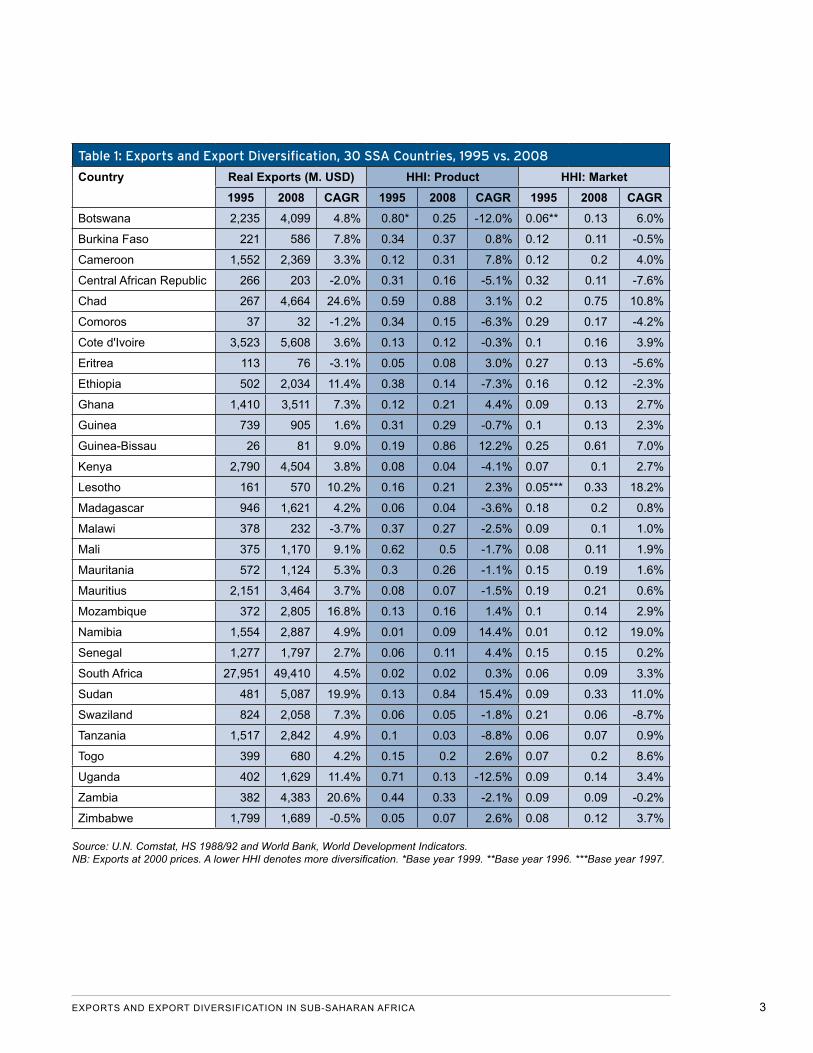
export strategies. Table 1 shows the development
of exports and export diversification in 30 selected
SSA countries for 1995 and 2008. Real exports of
goods and services grew by more than 20 percent
in Chad, Zambia and Sudan and by 10-20 percent in
Mozambique, Ethiopia, Uganda and Lesotho. Only
Malawi, Eritrea, the Central African Republic, Comoros
and Zimbabwe experienced negative growth. The
biggest exporter in 2008 was South Africa, followed
by Cote d’Ivoire, Sudan, Chad, Kenya, Zambia and
Botswana.
We use the Hirschman-Herfindahl Index (HHI) of mar-
ket and product concentration as an inverse measure
of export diversification.3 Sixteen out of 30 countries,
especially Uganda and Botswana, had a higher export
diversification of products in 2008 compared to the
base year. Fourteen countries, in particular Sudan,
Namibia and Guinea-Bissau, had a higher product
concentration of exports. In contrast, only seven coun-
tries, in particular Swaziland and the Central African
Republic, had more diversified markets in 2008,
while the remaining 23 countries, especially Namibia,
Lesotho, Sudan and Chad, showed a higher concen-
tration of export markets.
Using a panel of 30 selected SSA countries over the
period 1995-2008, we estimate the impact of exports
EXPORTS AND EXPORT DIVERSIFICATION IN SUB-SAHARAN AFRICA 3
Table 1: Exports and Export Diversification, 30 SSA Countries, 1995 vs. 2008
Country Real Exports (M. USD) HHI: Product HHI: Market1995 2008 CAGR 1995 2008 CAGR 1995 2008 CAGR
Botswana 2,235 4,099 4.8% 0.80* 0.25 -12.0% 0.06** 0.13 6.0%
Burkina Faso 221 586 7.8% 0.34 0.37 0.8% 0.12 0.11 -0.5%
Cameroon 1,552 2,369 3.3% 0.12 0.31 7.8% 0.12 0.2 4.0%
Central African Republic 266 203 -2.0% 0.31 0.16 -5.1% 0.32 0.11 -7.6%
Chad 267 4,664 24.6% 0.59 0.88 3.1% 0.2 0.75 10.8%
Comoros 37 32 -1.2% 0.34 0.15 -6.3% 0.29 0.17 -4.2%
Cote d'Ivoire 3,523 5,608 3.6% 0.13 0.12 -0.3% 0.1 0.16 3.9%
Eritrea 113 76 -3.1% 0.05 0.08 3.0% 0.27 0.13 -5.6%
Ethiopia 502 2,034 11.4% 0.38 0.14 -7.3% 0.16 0.12 -2.3%
Ghana 1,410 3,511 7.3% 0.12 0.21 4.4% 0.09 0.13 2.7%
Guinea 739 905 1.6% 0.31 0.29 -0.7% 0.1 0.13 2.3%
Guinea-Bissau 26 81 9.0% 0.19 0.86 12.2% 0.25 0.61 7.0%
Kenya 2,790 4,504 3.8% 0.08 0.04 -4.1% 0.07 0.1 2.7%
Lesotho 161 570 10.2% 0.16 0.21 2.3% 0.05*** 0.33 18.2%
Madagascar 946 1,621 4.2% 0.06 0.04 -3.6% 0.18 0.2 0.8%
Malawi 378 232 -3.7% 0.37 0.27 -2.5% 0.09 0.1 1.0%
Mali 375 1,170 9.1% 0.62 0.5 -1.7% 0.08 0.11 1.9%
Mauritania 572 1,124 5.3% 0.3 0.26 -1.1% 0.15 0.19 1.6%
Mauritius 2,151 3,464 3.7% 0.08 0.07 -1.5% 0.19 0.21 0.6%
Mozambique 372 2,805 16.8% 0.13 0.16 1.4% 0.1 0.14 2.9%
Namibia 1,554 2,887 4.9% 0.01 0.09 14.4% 0.01 0.12 19.0%
Senegal 1,277 1,797 2.7% 0.06 0.11 4.4% 0.15 0.15 0.2%
South Africa 27,951 49,410 4.5% 0.02 0.02 0.3% 0.06 0.09 3.3%
Sudan 481 5,087 19.9% 0.13 0.84 15.4% 0.09 0.33 11.0%
Swaziland 824 2,058 7.3% 0.06 0.05 -1.8% 0.21 0.06 -8.7%
Tanzania 1,517 2,842 4.9% 0.1 0.03 -8.8% 0.06 0.07 0.9%
Togo 399 680 4.2% 0.15 0.2 2.6% 0.07 0.2 8.6%
Uganda 402 1,629 11.4% 0.71 0.13 -12.5% 0.09 0.14 3.4%
Zambia 382 4,383 20.6% 0.44 0.33 -2.1% 0.09 0.09 -0.2%
Zimbabwe 1,799 1,689 -0.5% 0.05 0.07 2.6% 0.08 0.12 3.7%
Source: U.N. Comstat, HS 1988/92 and World Bank, World Development Indicators. NB: Exports at 2000 prices. A lower HHI denotes more diversification. *Base year 1999. **Base year 1996. ***Base year 1997.
4 GLOBAL ECONOMY AND DEVELOPMENT PROGRAM
and export diversification on value added, labor pro-
ductivity, and conditional and unconditional labor
demand. We find, first, that exports have a positive
impact on value added, labor productivity and labor
demand. Second, we find that export diversification
of products and markets increase value added and la-
bor productivity, but not labor demand. When we drop
natural resource-intensive countries from the sample,
we can confirm these results for value added, labor
productivity and unconditional labor demand. Third,
controlling for the export market share to the U.S.,
EU-25, China and SSA, we find that export destination
matters for growth and employment.
We also interact exports with export diversification of
products and markets as well as export market shares.
Contrary to expectations, we find that the positive
value added and labor productivity effects from exports
are larger the more concentrated (instead of diversi-
fied) in export products and markets the countries in
our sample are. Finally, we find that the effect of ex-
ports on growth and employment is also influenced by
export destination. A higher export share to the U.S. in-
creases value added and labor productivity in both the
reduced and full sample, while a higher export share
to China is only advantageous for value added when
natural resource-intensive countries are included. We
do not find such an impact for the EU-25 and SSA. In
regards to the impact on labor demand, a country’s
higher export share to the U.S., China and SSA in-
creases labor demand; while a country’s higher export
share to the EU-25 has labor demand-reducing effects.
This paper argues that Africa’s export structure is one
of the main reasons Africa has been able to get a head
start out of the recent recession. Africa has not missed
the boat, as many predicted, because of a reliance on
commodity exports; on the contrary, it has benefited
from its export structure, which enabled it to rebound
quickly after the crisis. Finally, we suggest that African
countries, especially the resource-based economies,
need to concentrate on improving productivity in areas
where they have a comparative advantage and on
moving up the value chain in those commodities.
The remainder of the paper is organized as follows. In
section two, we provide a literature overview on the im-
pact of exports and export diversification on growth and
employment. In section three, we estimate the effects
of exports and export diversification on value added
and labor productivity. We also examine whether the
effects from exports on labor productivity and value
added are influenced by export diversification of prod-
ucts and markets or export destination. Section four
focuses on the impact of exports and export diversifi-
cation on conditional and unconditional labor demand.
In the final section, we focus on the policy implications
of our results for post-crisis export strategies in SSA.
EXPORTS AND EXPORT DIVERSIFICATION IN SUB-SAHARAN AFRICA 5
2. LITERATURE REVIEW
Exports, Export Diversification and Growth
An extensive literature review on the relationship be-
tween trade openness and growth since the 1970s
can be found in Harrison and Rodríguez-Clare (2009)
and covers almost 180 studies. Most empirical papers
with a focus on Africa are cross-country or comparative
studies. Mbaku (1989) shows for 37 African countries
that export growth had a positive impact on economic
growth between 1970 and 1981. Fosu (1996), using
a cross-section from 1960 to 1970 and from 1970 to
1980, finds for 28 least developed African countries ex-
ports enhanced economic growth, but this positive im-
pact is smaller in comparison to other least developed
countries. Ukpolo (1994) finds for eight low-income
African countries that non-fuel commodity exports had
a significantly positive effect on growth between 1969
and 1988. Amoateng and Amoako-Adu (1996) confirm
the positive effect of export growth on GDP growth
for 35 African countries over the period 1970-1990.
Onafowora and Owoye (1998) also find positive effects
of exports on growth in 10 out of 12 analyzed SSA
countries from 1963 to 1993.
Ahmad and Kwan (1991) reject the hypothesis of
export-led growth using a sample of 47 developing
African countries over the period 1981-1987 and three
measures of exports (total exports, manufacturing ex-
ports, and the share of manufacturing exports in total
exports). At the country level, Egwaikhide (1992) only
finds weak evidence of positive output growth effects
of crude oil exports in Nigeria between 1973 to 1978,
while Alege (1993) cannot confirm a positive effect of
export growth on GDP growth in Nigeria between 1960
and 1985.
Some early empirical studies confirmed the positive ef-
fect of export growth on productivity (e.g., Krueger and
Tuncer 1982 for Turkey; Nishimizu and Robinson 1984
for semi-industrialized countries). Bernard and Jensen
(1995) examined the relationship between export-
ing and productivity at the firm-level and many stud-
ies have followed since. This type of study examines
whether exporting increases productivity (learning-by-
exporting) or whether more productive firms self-select
into exporting. Evidence for learning-by-exporting is
generally mixed, and there are only few studies for
African countries. In a firm-level panel data approach
covering Kenya, Ghana, Zimbabwe and Cameroon
from 1991 to 1995, Bigsten et al. (2004) confirm that
exporting raises productivity. Biesebroeck (2005)
confirms the positive productivity effects of exporting
at the firm-level for nine SSA countries between 1992
and 1996.
In addition to export growth, export diversification
can be positively associated with economic growth.
Diversity in exports can reduce income volatility for
countries with large populations living in poverty and
reduce vulnerability to sharp declines in the terms-of-
trade. Diversification also increases the potential for
generating spillovers, whereas reliance on only a few
exports generally has greater negative consequences
for growth (Lederman and Maloney 2007). However,
Lederman and Klinger (2006, p. 5) find that “a country’s
export basket becomes more diversified as income
rises until a relatively high level, at which point the pro-
cess reverses itself and specialization occurs.” Naude
and Rossouw (2011) confirm this U-shaped relation-
ship for Brazil, China, India and South Africa. As a
result, the effect of export diversification on growth de-
pends on a country’s level of economic development.
6 GLOBAL ECONOMY AND DEVELOPMENT PROGRAM
Dodaro (1991) uses panel data for 41 developing
countries and finds that a higher share of manufactur-
ing exports of total exports influences real GDP growth
positively. Pineres and Ferrantino (1997, 1999) find
a positive relationship between export diversification
and economic growth for Chile between 1962 and
1991 and for Columbia between 1967 and 1990. Al-
Marhubi (2000) confirms this positive association for
a cross-section of 91 countries from 1961 to 1988.
Hausmann et al. (2006) find that countries exporting
high-productivity goods grow faster than countries ex-
porting lower-productivity goods. Agosin (2007) finds a
strong positive impact of export diversification on per
capita GDP growth in Latin America and fast-growing
Asian economies between 1980 and 2003. Lederman
and Maloney (2007) find evidence that export concen-
tration lowers subsequent economic growth. Hesse
(2009) confirms that export concentration is detrimen-
tal for per capita GDP growth in developing countries
over five-year intervals between 1961 and 2000.
Fewer studies have examined the relationship be-
tween export diversification and productivity. Weinhold
and Rauch (1999) find a positive impact of export con-
centration on manufacturing labor productivity growth
for 39 developing countries between 1960 and 1990,
implying that increased specialization accelerates pro-
ductivity growth. Alcala and Ciccone (2004), focusing
on trade openness defined as exports plus imports as
percentage of GDP, in a gravity-model setting, also
confirm a labor productivity-enhancing effect for 138
countries in 1985.
Our literature review reveals that while some studies
have focused on the output growth effects of exports in
SSA countries, only a few have focused on productivity
effects. Second, there is a lack of studies focusing on
export diversification in African economies. Moreover,
none of the studies covers the 2000s, a period of in-
creased trade integration. Our contribution is the fol-
lowing: (i) We estimate the effect of exports on value
added and labor productivity. (ii) Our data span from
1995 to 2008 and, thus, reflect the increased trade
integration of the 2000s. (iii) Besides the effects of
exports, we also focus on the effect of export diversi-
fication.
Exports, Export Diversification and Labor Demand
Researchers have been interested in the relationship
between international trade and employment early on,
relying on an input-output, growth accounting or fac-
tor content framework. There are fewer econometric
studies on export-induced employment effects, espe-
cially for developing countries. Using firm-level data
for South Africa, Edwards (2004) finds that exporting
had a negative effect on labor demand for both skilled
and unskilled workers in large manufacturing firms
between 1997 and 1998. Manda and Sen (2004) do
not find an effect of export intensity on labor demand
in Kenyan manufacturing sectors between 1975 and
1998. Other studies find positive effects of exports
on employment for non-African developing countries.
Jenkins (2004), for example, finds that export intensity
increased employment at the sector level in Vietnam
from 1995 to 1999, but not employment growth. Fu
and Balasubramanyam (2005) confirm positive em-
ployment effects from exports using panel data for 29
Chinese provinces between 1987 and 1998.
There is only one study to our knowledge that mea-
sures the effect of export diversification on employ-
ment. Using an applied general equilibrium model,
Naude and Rossouw (2011) measure the effect of
export diversification on employment for Brazil, China,
India and South Africa from 1962 to 2000. The authors
find that export diversification shows a clearly posi-
EXPORTS AND EXPORT DIVERSIFICATION IN SUB-SAHARAN AFRICA 7
tive impact on employment only in South Africa, while
export concentration had a more beneficial effect on
employment in Brazil, China and India. The authors
explain this result with the U-shaped relationship be-
tween a country’s export basket and economic devel-
opment: Only at early stages of development might it
be fruitful to diversify exports.
The literature review above rejects the existence of
positive employment effects from exports in African
countries. Also, there is a lack of studies measuring
the impact of export diversification on employment.
Finally, none of these studies covers the 2000s. Our
paper makes the following contributions: (i) We esti-
mate the effect of exports on conditional and uncon-
ditional labor demand in SSA. (ii) Our data span from
1995 to 2008 and, thus, reflect the increasing trade
integration of the 2000s. (iii) Besides the effects of ex-
ports, we also focus on the effect of export diversifica-
tion on employment.
8 GLOBAL ECONOMY AND DEVELOPMENT PROGRAM
3. THE EFFECT OF EXPORTS AND EXPORT DIVERSIFICATION ON GROWTH
Empirical Model
We postulate the following value added function:
(Y-INP) = VA = F (K, L, T) ∂ ∂ ∂
> < >∂ ∂ ∂∂ 2
1 1 21
2 2
0, 0, 0F FFx x xx
with x1, x2 = K, L, T (1)
where capital K, labor L and technology T are the input factors, VA = (Y-INP) designates the value added and is
the difference between output Y and intermediate inputs INP. The technology shifter T = T(EX, TAR) is a function
of exports EX and tariffs TAR.
Equation (1) in log-linear form yields the following empirical model:
lnVAit = α0 + α1lnKit + α2lnLit + β1lnEXit + β2lnTARit + δiDi + δtDt + εit (2)
where i designates countries, t years, Di fixed country effects, Dt fixed year effects and εit the idiosyncratic error
term. We hypothesize that capital, labor and exports have a positive impact on value added, while tariffs—as an
inverse measure of trade liberalization—should have a negative influence.
Next, we are interested in the effects of export diversification and its interaction with exports on value added:
lnVAit = α0 + α1lnKit + α2lnLit + β1lnEXit + β2lnTARit
+ γ1lnEXit*DIVit + γDIVit + δiDi + δtDt + εit (3)
We use the HHI of market and product concentration as an inverse measure of export diversification. We also in-
clude a country’s export share to the U.S., the EU-25, China and SSA as a measure of export diversification. In a
second step, we formulate equation (2) as a labor productivity (LP) function:
ln(VA/L)it = α0 + α1ln(K/L)it + β1lnEXit + β2lnTARit + δiDi + δtDt + εit (4)
Interacting exports in equation (4) with export diversification yields the following function:
ln(VA/L)it = α0 + α1ln(K/L)it + β1lnEXit + β2lnTARit
+ γ1lnEXit*DIVit + γ2DIVit + δiDi + δtDt + εit (5)
We hypothesize the same coefficient signs as in equations (2) and (3).
EXPORTS AND EXPORT DIVERSIFICATION IN SUB-SAHARAN AFRICA 9
First Indicators
Our empirical analysis covers 30 SSA countries
for the period 1995–2008. The choice of countries
was based on data availability only. Our sample
includes Botswana, Burkina Faso, Cameroon, the
Central African Republic, Chad, Comoros, Cote
d’Ivoire, Eritrea, Ethiopia, Ghana, Guinea, Guinea-
Bissau, Kenya, Lesotho, Madagascar, Malawi,
Mali, Mauritania, Mauritius, Mozambique, Namibia,
Senegal, South Africa, Sudan, Swaziland, Tanzania,
Togo, Uganda, Zambia and Zimbabwe. For a data de-
scription, see Appendix 1.
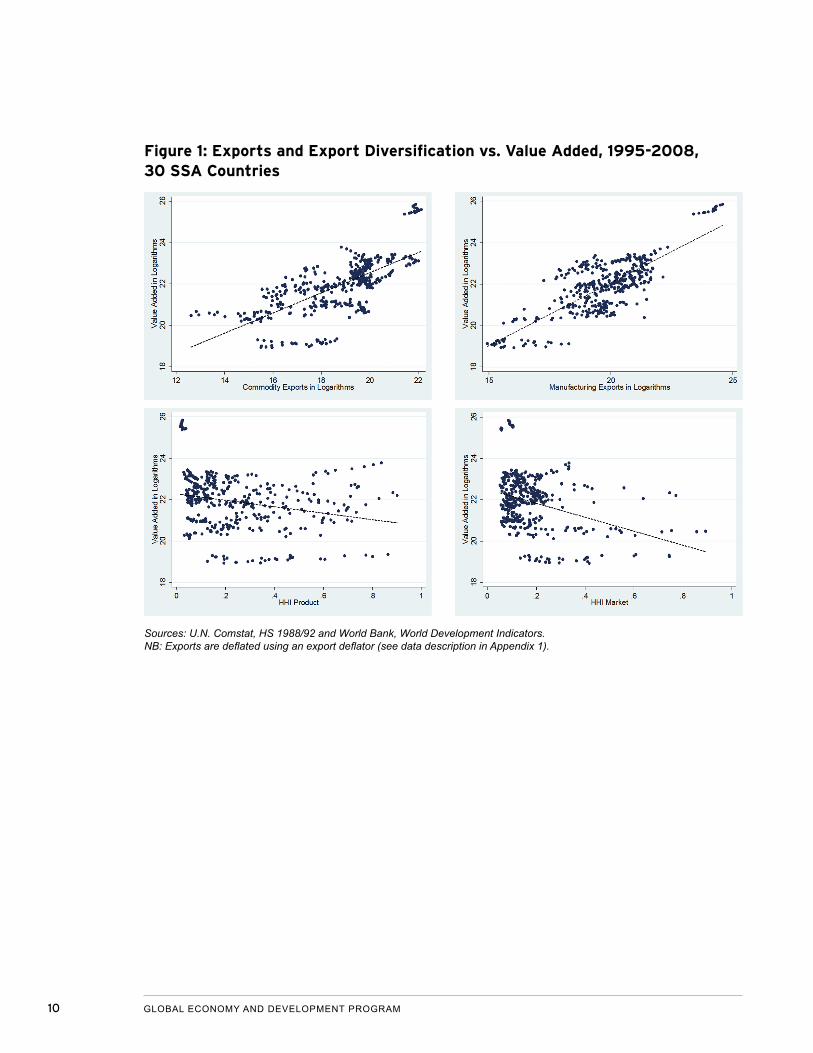
As a first indicator of the relationship between exports
and value added, we plot exports and value added
in logarithms for our country sample for 1995–2008.
Since there might be a differential effect on value
added depending on the type of exports, we split the
product sample into commodities (Figure 1, upper left)
and manufactured exports (Figure 1, upper right). The
bivariate regression lines indicate a stronger positive
relationship between exports of manufactured goods
and value added than for commodity exports. This
finding confirms results of Hausman et al. (2006) that
growth is more responsive to exports of manufactured
goods than it is to exports of commodities. Countries
exporting goods with higher value added grow faster.
While commodity exports interact positively with value
added, the effects are less pronounced.
This result confirms the “law of development,” accord-
ing to which industrialization leads to rapid economic
development in emerging markets. The East Asian
successes, for instance, relied heavily on the manu-
facturing sector to achieve rapid economic growth.
The East Asian Tigers (Hong Kong SAR, the Republic
of Korea, Singapore, and Taiwan), Japan, and the
second-generation successes (Indonesia, Malaysia,
Thailand and recently China) all have shares of manu-
facturing value added that exceed the global average
(UNIDO 2009).
In a next step, we shift our focus to export diversifica-
tion. Export diversification can take place in two ways:
exporting new products and exporting to new markets.
The first involves increasing the number of products
exported to international markets. This effort requires
discovering new products and moving up the value
chain to produce products of higher value and sophisti-
cation. Much of the developing countries’ focus on di-
versification efforts in the past has been on the process
of discovering new exports. A second component of di-
versification relates to breaking into new geographical
markets, that is, expanding market reach for products
that have already proven competitive.
As a first indication, we show the relationship between
value added and export diversification of both products
(Figure 1, bottom left) and markets (Figure 1, bottom
right) for our 30 SSA countries over 1995–2008. We
use the HHI of market and product concentration as an
inverse measure of export diversification. Export con-
centration and value added are negatively correlated,
or, analogously, export diversification and value added
have a positive relationship. The steeper regression
line in figure 1 (bottom right) suggests that the effect is
stronger for export diversification of markets.
10 GLOBAL ECONOMY AND DEVELOPMENT PROGRAM
Sources: U.N. Comstat, HS 1988/92 and World Bank, World Development Indicators. NB: Exports are deflated using an export deflator (see data description in Appendix 1).
Figure 1: Exports and Export Diversification vs. Value Added, 1995-2008, 30 SSA Countries
EXPORTS AND EXPORT DIVERSIFICATION IN SUB-SAHARAN AFRICA 11
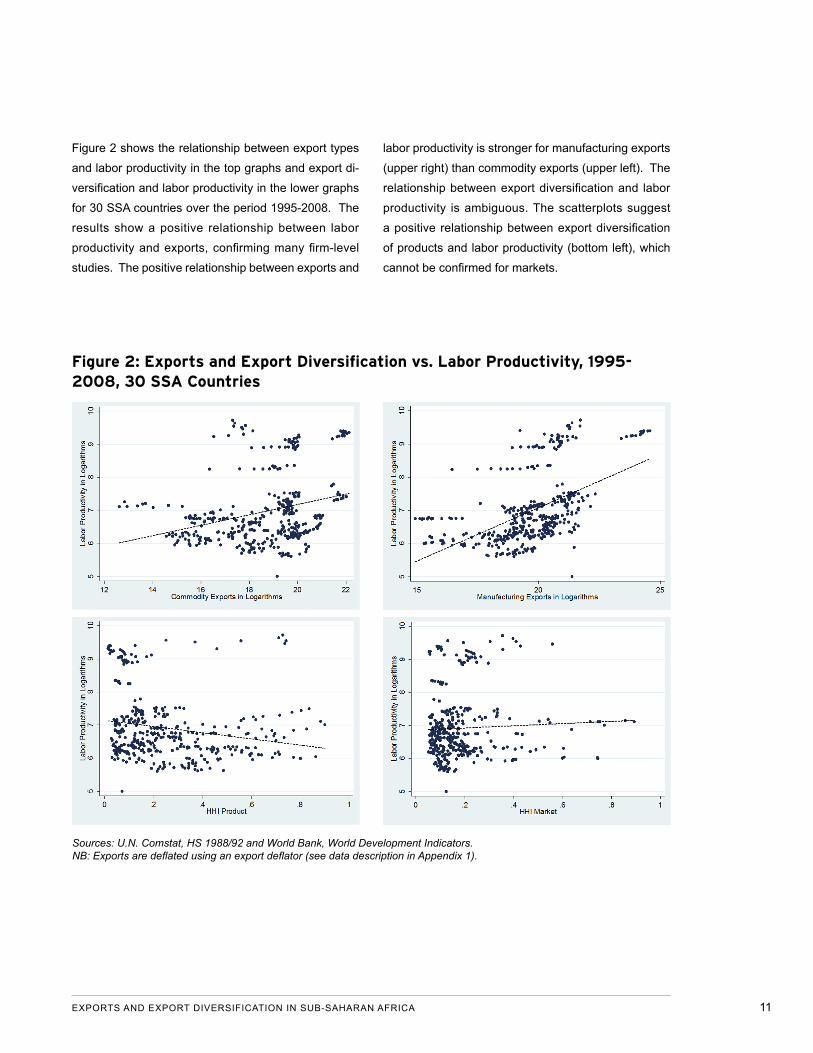
Figure 2: Exports and Export Diversification vs. Labor Productivity, 1995-2008, 30 SSA Countries
Sources: U.N. Comstat, HS 1988/92 and World Bank, World Development Indicators.NB: Exports are deflated using an export deflator (see data description in Appendix 1).
Figure 2 shows the relationship between export types
and labor productivity in the top graphs and export di-
versification and labor productivity in the lower graphs
for 30 SSA countries over the period 1995-2008. The
results show a positive relationship between labor
productivity and exports, confirming many firm-level
studies. The positive relationship between exports and
labor productivity is stronger for manufacturing exports
(upper right) than commodity exports (upper left). The
relationship between export diversification and labor
productivity is ambiguous. The scatterplots suggest
a positive relationship between export diversification
of products and labor productivity (bottom left), which
cannot be confirmed for markets.
12 GLOBAL ECONOMY AND DEVELOPMENT PROGRAM
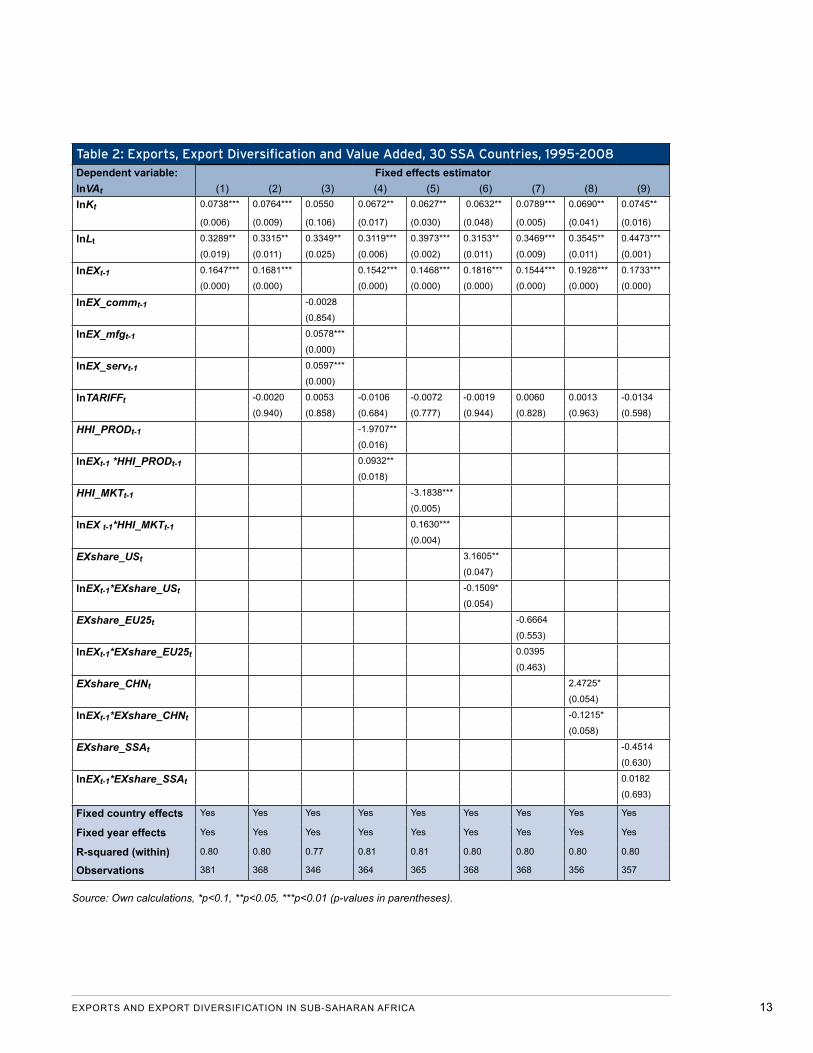
Regression Results: Value Added
Table 2 plots the value added regression results using
the fixed effects estimator for the 30 SSA countries
from 1995 to 2008. The summary statistics can be
found in Appendix 2. In order to address the poten-
tial endogeneity between exports and value added,
we use one-period lags of exports.4 As hypothesized,
capital, labor and exports have a significantly positive
effect on value added. We also split exports into three
broad product categories: commodities, manufactur-
ing and services. The positive effect of exports can
be confirmed for manufacturing and services exports
(column 3).
Remarkably, the elasticity of exports is larger than the
one of capital, while the labor elasticity is the highest.
This reflects the labor-intensive production structure
in these SSA countries. Tariffs have no influence on
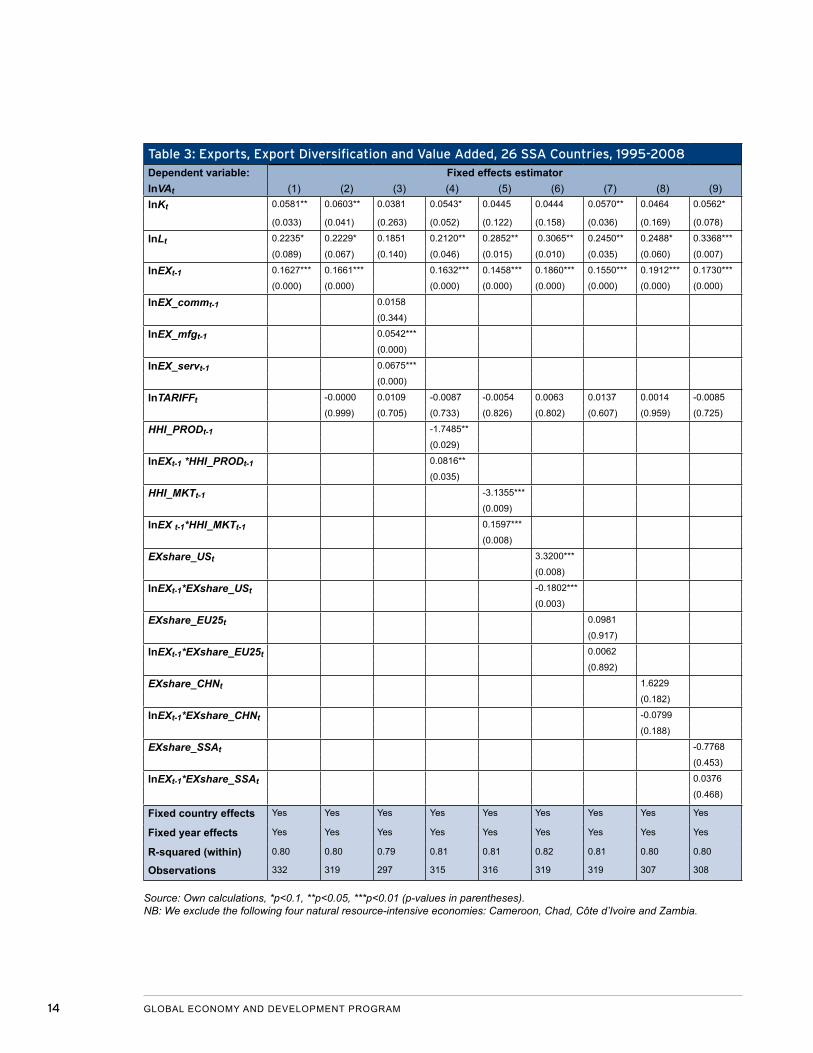
value added. Since we are concerned that the results
above could be driven by natural resource-intensive
countries, we drop four natural-resource intensive
economies (as identified by the International Monetary
Fund), namely Cameroon, Chad, Côte d’Ivoire and
Zambia, in the next regressions (see Table 3). The
results above can be confirmed.
We then focus on the effect of export diversification on
value added. We hypothesize that a higher HHI—that
is, less export diversification—has a negative effect
on value added. The regression results using the full
country sample show that both a higher HHI of mar-
ket and product concentration of exports significantly
lower value added (columns 4 and 5 of Table 2), which
is in line with our conjecture. The effects are the same
when we drop the natural resource-intensive countries
(columns 4 and 5 of Table 3).
We also examine the role of export destination on
value added. In the full country sample, a larger export
share to the U.S. and China significantly increases
value added (columns 6 and 8 of Table 2), while the
positive effect of China on value added is no longer
significant in the reduced country sample (column 8 of
Table 3).
Interacting exports with the two measures of export
concentration yields a positive coefficient, which is
significant in the full and reduced country sample
and contrary to our expectations (columns 4 and 5 of
Tables 2 and 3). That is, the positive impact of exports
on value added is higher the more concentrated ex-
ports are in terms of different products and markets.
Interacting exports with a country’s export share (col-
umns 6 and 8 of Table 2) results in a negative interac-
tion terms for the U.S. and China in the full country
sample. That is, the value added gains from exports
decline the more dependent a country is on the U.S.
and China. When we drop natural resource-intensive
countries, the negative interaction term for China is no
longer significant (column 8 of Table 3). This might be
because countries that are less natural resource-inten-
sive depend more strongly on the U.S., while natural
resource-intensive countries depend more strongly on
China as a major export destination. A country’s ex-
port share to the EU-25 or SSA does not influence the
impact of exports on value added in both the full and
reduced country sample.
EXPORTS AND EXPORT DIVERSIFICATION IN SUB-SAHARAN AFRICA 13
Table 2: Exports, Export Diversification and Value Added, 30 SSA Countries, 1995-2008Dependent variable: Fixed effects estimatorlnVAt (1) (2) (3) (4) (5) (6) (7) (8) (9)lnKt 0.0738*** 0.0764*** 0.0550 0.0672** 0.0627** 0.0632** 0.0789*** 0.0690** 0.0745**
(0.006) (0.009) (0.106) (0.017) (0.030) (0.048) (0.005) (0.041) (0.016)
lnLt 0.3289** 0.3315** 0.3349** 0.3119*** 0.3973*** 0.3153** 0.3469*** 0.3545** 0.4473***
(0.019) (0.011) (0.025) (0.006) (0.002) (0.011) (0.009) (0.011) (0.001)
lnEXt-1 0.1647*** 0.1681*** 0.1542*** 0.1468*** 0.1816*** 0.1544*** 0.1928*** 0.1733***
(0.000) (0.000) (0.000) (0.000) (0.000) (0.000) (0.000) (0.000)
lnEX_commt-1 -0.0028
(0.854)
lnEX_mfgt-1 0.0578***
(0.000)
lnEX_servt-1 0.0597***
(0.000)
lnTARIFFt -0.0020 0.0053 -0.0106 -0.0072 -0.0019 0.0060 0.0013 -0.0134
(0.940) (0.858) (0.684) (0.777) (0.944) (0.828) (0.963) (0.598)
HHI_PRODt-1 -1.9707**
(0.016)
lnEXt-1 *HHI_PRODt-1 0.0932**
(0.018)
HHI_MKTt-1 -3.1838***
(0.005)
lnEX t-1*HHI_MKTt-1 0.1630***
(0.004)
EXshare_USt 3.1605**
(0.047)
lnEXt-1*EXshare_USt -0.1509*
(0.054)
EXshare_EU25t -0.6664
(0.553)
lnEXt-1*EXshare_EU25t 0.0395
(0.463)
EXshare_CHNt 2.4725*
(0.054)
lnEXt-1*EXshare_CHNt -0.1215*
(0.058)
EXshare_SSAt -0.4514
(0.630)
lnEXt-1*EXshare_SSAt 0.0182
(0.693)
Fixed country effects Yes Yes Yes Yes Yes Yes Yes Yes Yes
Fixed year effects Yes Yes Yes Yes Yes Yes Yes Yes Yes
R-squared (within) 0.80 0.80 0.77 0.81 0.81 0.80 0.80 0.80 0.80
Observations 381 368 346 364 365 368 368 356 357
Source: Own calculations, *p<0.1, **p<0.05, ***p<0.01 (p-values in parentheses).
14 GLOBAL ECONOMY AND DEVELOPMENT PROGRAM
Table 3: Exports, Export Diversification and Value Added, 26 SSA Countries, 1995-2008Dependent variable: Fixed effects estimatorlnVAt (1) (2) (3) (4) (5) (6) (7) (8) (9)lnKt 0.0581** 0.0603** 0.0381 0.0543* 0.0445 0.0444 0.0570** 0.0464 0.0562*
(0.033) (0.041) (0.263) (0.052) (0.122) (0.158) (0.036) (0.169) (0.078)
lnLt 0.2235* 0.2229* 0.1851 0.2120** 0.2852** 0.3065** 0.2450** 0.2488* 0.3368***
(0.089) (0.067) (0.140) (0.046) (0.015) (0.010) (0.035) (0.060) (0.007)
lnEXt-1 0.1627*** 0.1661*** 0.1632*** 0.1458*** 0.1860*** 0.1550*** 0.1912*** 0.1730***
(0.000) (0.000) (0.000) (0.000) (0.000) (0.000) (0.000) (0.000)
lnEX_commt-1 0.0158
(0.344)
lnEX_mfgt-1 0.0542***
(0.000)
lnEX_servt-1 0.0675***
(0.000)
lnTARIFFt -0.0000 0.0109 -0.0087 -0.0054 0.0063 0.0137 0.0014 -0.0085
(0.999) (0.705) (0.733) (0.826) (0.802) (0.607) (0.959) (0.725)
HHI_PRODt-1 -1.7485**
(0.029)
lnEXt-1 *HHI_PRODt-1 0.0816**
(0.035)
HHI_MKTt-1 -3.1355***
(0.009)
lnEX t-1*HHI_MKTt-1 0.1597***
(0.008)
EXshare_USt 3.3200***
(0.008)
lnEXt-1*EXshare_USt -0.1802***
(0.003)
EXshare_EU25t 0.0981
(0.917)
lnEXt-1*EXshare_EU25t 0.0062
(0.892)
EXshare_CHNt 1.6229
(0.182)
lnEXt-1*EXshare_CHNt -0.0799
(0.188)
EXshare_SSAt -0.7768
(0.453)
lnEXt-1*EXshare_SSAt 0.0376
(0.468)
Fixed country effects Yes Yes Yes Yes Yes Yes Yes Yes Yes
Fixed year effects Yes Yes Yes Yes Yes Yes Yes Yes Yes
R-squared (within) 0.80 0.80 0.79 0.81 0.81 0.82 0.81 0.80 0.80
Observations 332 319 297 315 316 319 319 307 308
Source: Own calculations, *p<0.1, **p<0.05, ***p<0.01 (p-values in parentheses). NB: We exclude the following four natural resource-intensive economies: Cameroon, Chad, Côte d’Ivoire and Zambia.
EXPORTS AND EXPORT DIVERSIFICATION IN SUB-SAHARAN AFRICA 15
Regression Results: Labor Productivity
In a second step, we formulate the value added equa-
tion as a labor productivity function. Labor productivity,
defined as value added per worker, depends on capital
intensity and the technology shifter i.e., exports and
tariffs. Our study differs from studies that measure
the effect on per capita GDP in a new growth theory
model, which include exports among other control vari-
ables such as the initial per capita GDP, human capital,
population growth, terms-of-trade and investment ratio
(see e.g., Greenaway, Morgan and Wright 1999). We
hypothesize the same coefficient signs as the value
added regressions. Again, we use one-period lags of
exports to account for the potential endogeneity prob-
lem between exports and labor productivity.5 The labor
productivity regression results are plotted in Table 4.
The summary statistics can be found in Appendix 2.
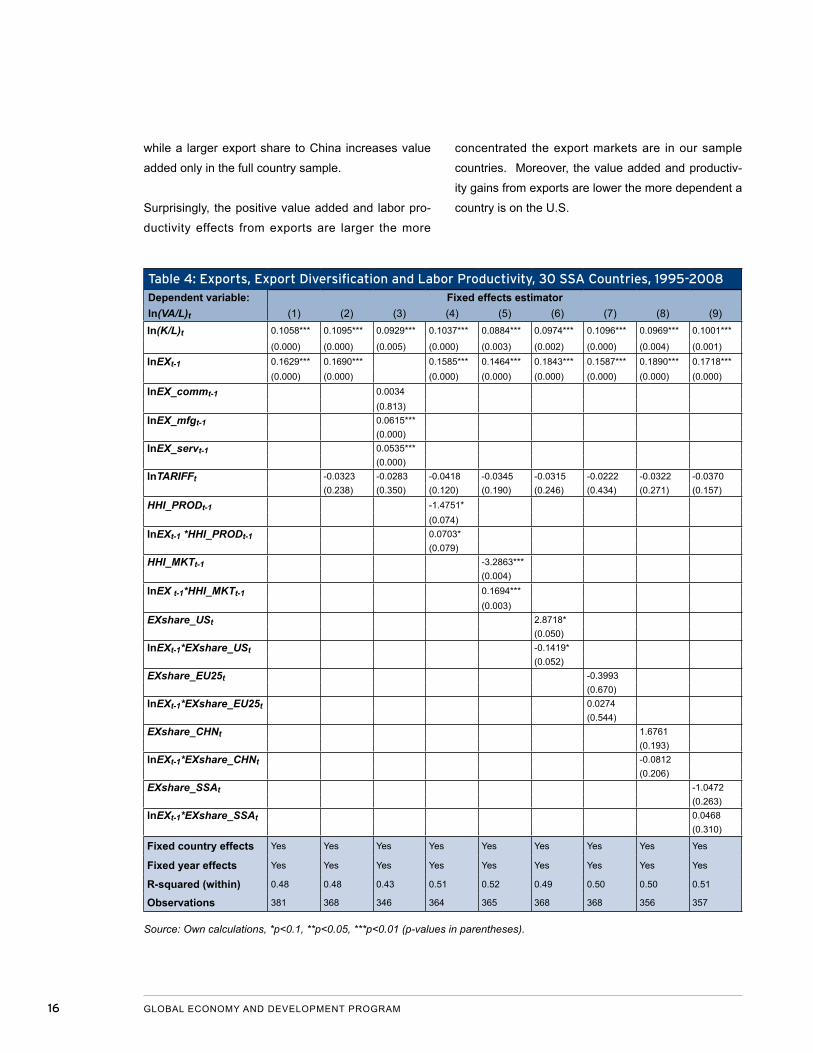
Capital intensity and exports show a significantly
positive effect on labor productivity, while tariffs have
a significantly negative impact, which is line with our
conjecture. This positive effect of exports can be con-
firmed at the broad product level for manufacturing and
services exports (column 3 of Table 4). Interestingly,
the export elasticity is higher than the one of capital
intensity, i.e., a 1 percent increase of exports results in
larger productivity gains than a 1 percent increase in
capital intensity. This reveals the potential of exports
to increase the region’s competiveness and growth.
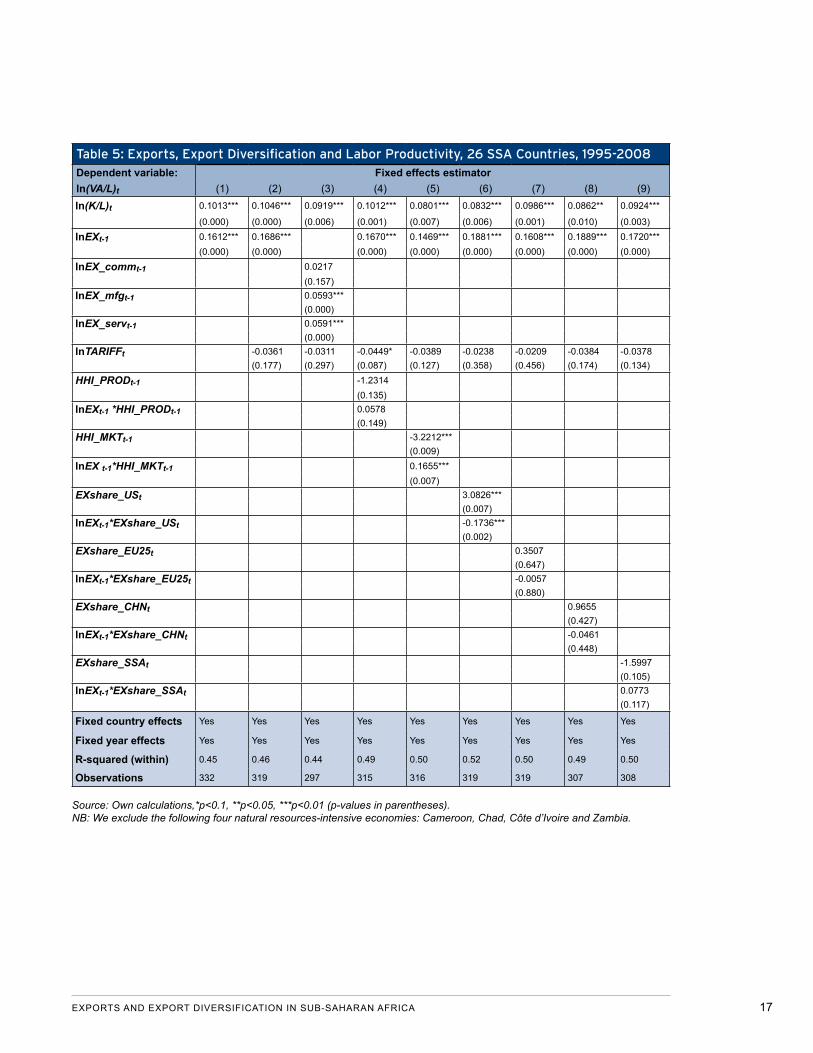
The results become more significant when we drop the
four natural-resource intensive countries (see Table 5).
Next, we show the effects of export diversification on
labor productivity (columns 4 and 5 of Table 4). Export
diversification of products and markets both increase
labor productivity. When we drop natural resource-
intensive countries from the sample, these results can
be confirmed for export diversification markets only
(column 5 of Table 5).
We also examine the role of export destination on labor
productivity. In the full country sample, only a larger
export share to the U.S. significantly increases labor
productivity, which holds for both the full and reduced
country sample (column 6 of Tables 4 and 5).
Interacting the HHI with exports, a higher product con-
centration of exports significantly increases the posi-
tive productivity effects from exports. Analogously, a
higher market concentration of exports significantly
increases the positive productivity effects from exports
(columns 4 and 5 of Table 4). These findings also
hold for market concentration of exports when natural
resource-intensive countries are excluded (column 5
of Table 5).
Finally, we interact export market shares with exports
which results in a significantly negative interaction term
for the U.S. only in both the full and reduced country
sample (column 6 of Tables 4 and 5). That is, the pro-
ductivity gains from exports decline the more depen-
dent a country is on the U.S. Higher export shares to
the EU-25, China or SSA do not influence the effect of
exports on productivity in both the full and the reduced
country sample.
To sum up, the results show that exports significantly
increase value added and labor productivity. The ex-
port elasticity is larger than the elasticity of capital in
the value added regressions, and it is larger than the
elasticity of capital intensity in the labor productivity re-
gressions. This finding reveals the potential of exports
for increasing the region’s competiveness and growth.
Moreover, the results show that greater diversification
of export products and markets has a positive impact
on value added and labor productivity. Finally, a larger
export share to the U.S. increases value added and
productivity in the full and reduced country sample,
16 GLOBAL ECONOMY AND DEVELOPMENT PROGRAM
while a larger export share to China increases value
added only in the full country sample.
Surprisingly, the positive value added and labor pro-
ductivity effects from exports are larger the more
concentrated the export markets are in our sample
countries. Moreover, the value added and productiv-
ity gains from exports are lower the more dependent a
country is on the U.S.
Table 4: Exports, Export Diversification and Labor Productivity, 30 SSA Countries, 1995-2008Dependent variable: Fixed effects estimatorln(VA/L)t (1) (2) (3) (4) (5) (6) (7) (8) (9)ln(K/L)t 0.1058*** 0.1095*** 0.0929*** 0.1037*** 0.0884*** 0.0974*** 0.1096*** 0.0969*** 0.1001***
(0.000) (0.000) (0.005) (0.000) (0.003) (0.002) (0.000) (0.004) (0.001)lnEXt-1 0.1629*** 0.1690*** 0.1585*** 0.1464*** 0.1843*** 0.1587*** 0.1890*** 0.1718***
(0.000) (0.000) (0.000) (0.000) (0.000) (0.000) (0.000) (0.000)lnEX_commt-1 0.0034
(0.813)lnEX_mfgt-1 0.0615***
(0.000)lnEX_servt-1 0.0535***
(0.000)lnTARIFFt -0.0323 -0.0283 -0.0418 -0.0345 -0.0315 -0.0222 -0.0322 -0.0370
(0.238) (0.350) (0.120) (0.190) (0.246) (0.434) (0.271) (0.157)HHI_PRODt-1 -1.4751*
(0.074)lnEXt-1 *HHI_PRODt-1 0.0703*
(0.079)HHI_MKTt-1 -3.2863***
(0.004)lnEX t-1*HHI_MKTt-1 0.1694***
(0.003)EXshare_USt 2.8718*
(0.050)lnEXt-1*EXshare_USt -0.1419*
(0.052)EXshare_EU25t -0.3993
(0.670)lnEXt-1*EXshare_EU25t 0.0274
(0.544)EXshare_CHNt 1.6761
(0.193)lnEXt-1*EXshare_CHNt -0.0812
(0.206)EXshare_SSAt -1.0472
(0.263)lnEXt-1*EXshare_SSAt 0.0468
(0.310)
Fixed country effects Yes Yes Yes Yes Yes Yes Yes Yes Yes
Fixed year effects Yes Yes Yes Yes Yes Yes Yes Yes Yes
R-squared (within) 0.48 0.48 0.43 0.51 0.52 0.49 0.50 0.50 0.51
Observations 381 368 346 364 365 368 368 356 357
Source: Own calculations, *p<0.1, **p<0.05, ***p<0.01 (p-values in parentheses).
EXPORTS AND EXPORT DIVERSIFICATION IN SUB-SAHARAN AFRICA 17
Table 5: Exports, Export Diversification and Labor Productivity, 26 SSA Countries, 1995-2008Dependent variable: Fixed effects estimatorln(VA/L)t (1) (2) (3) (4) (5) (6) (7) (8) (9)ln(K/L)t 0.1013*** 0.1046*** 0.0919*** 0.1012*** 0.0801*** 0.0832*** 0.0986*** 0.0862** 0.0924***
(0.000) (0.000) (0.006) (0.001) (0.007) (0.006) (0.001) (0.010) (0.003)lnEXt-1 0.1612*** 0.1686*** 0.1670*** 0.1469*** 0.1881*** 0.1608*** 0.1889*** 0.1720***
(0.000) (0.000) (0.000) (0.000) (0.000) (0.000) (0.000) (0.000)lnEX_commt-1 0.0217
(0.157)lnEX_mfgt-1 0.0593***
(0.000)lnEX_servt-1 0.0591***
(0.000)lnTARIFFt -0.0361 -0.0311 -0.0449* -0.0389 -0.0238 -0.0209 -0.0384 -0.0378
(0.177) (0.297) (0.087) (0.127) (0.358) (0.456) (0.174) (0.134)HHI_PRODt-1 -1.2314
(0.135)lnEXt-1 *HHI_PRODt-1 0.0578
(0.149)HHI_MKTt-1 -3.2212***
(0.009)lnEX t-1*HHI_MKTt-1 0.1655***
(0.007)EXshare_USt 3.0826***
(0.007)lnEXt-1*EXshare_USt -0.1736***
(0.002)EXshare_EU25t 0.3507
(0.647)lnEXt-1*EXshare_EU25t -0.0057
(0.880)EXshare_CHNt 0.9655
(0.427)lnEXt-1*EXshare_CHNt -0.0461
(0.448)EXshare_SSAt -1.5997
(0.105)lnEXt-1*EXshare_SSAt 0.0773
(0.117)
Fixed country effects Yes Yes Yes Yes Yes Yes Yes Yes Yes
Fixed year effects Yes Yes Yes Yes Yes Yes Yes Yes Yes
R-squared (within) 0.45 0.46 0.44 0.49 0.50 0.52 0.50 0.49 0.50
Observations 332 319 297 315 316 319 319 307 308
Source: Own calculations,*p<0.1, **p<0.05, ***p<0.01 (p-values in parentheses). NB: We exclude the following four natural resources-intensive economies: Cameroon, Chad, Côte d’Ivoire and Zambia.
18 GLOBAL ECONOMY AND DEVELOPMENT PROGRAM
4. THE EFFECT OF EXPORTS AND EXPORT DIVERSIFICATION ON LABOR DEMAND
Empirical Model
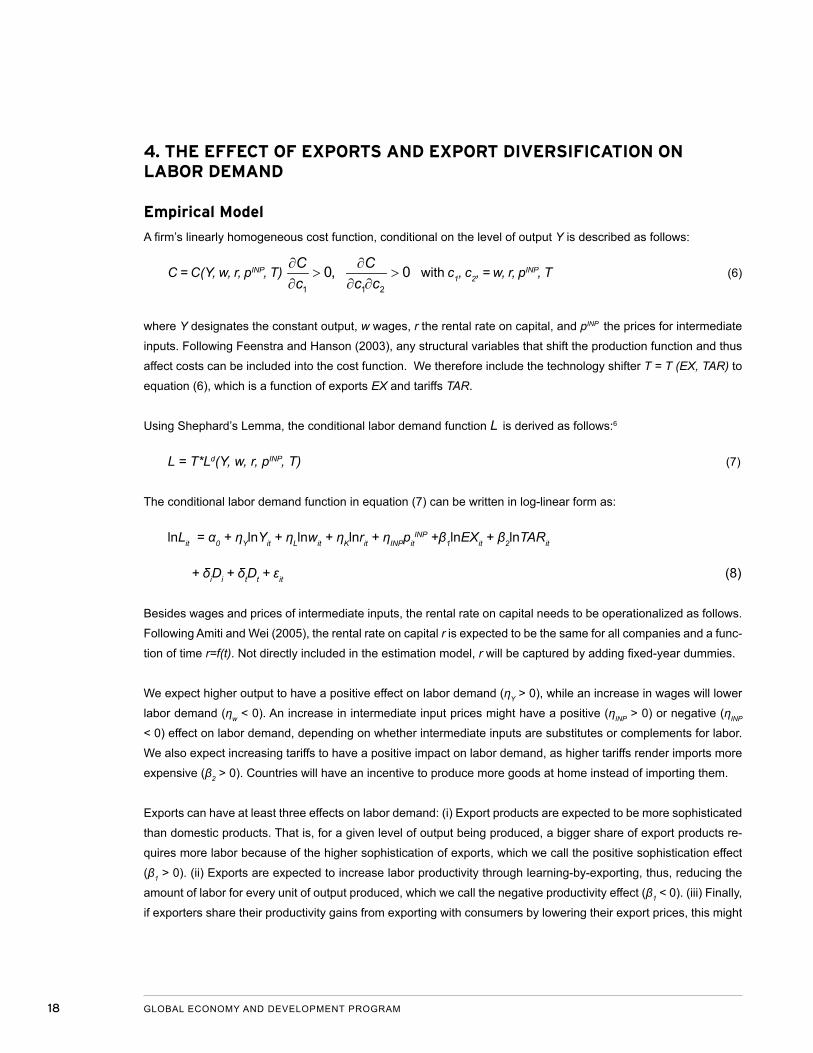
A firm’s linearly homogeneous cost function, conditional on the level of output Y is described as follows:
C = C(Y, w, r, pINP, T) ∂ ∂
> >∂ ∂ ∂1 1 2
0, 0C Cc c c
with c1, c2, = w, r, pINP, T (6)
where Y designates the constant output, w wages, r the rental rate on capital, and pINP the prices for intermediate
inputs. Following Feenstra and Hanson (2003), any structural variables that shift the production function and thus
affect costs can be included into the cost function. We therefore include the technology shifter T = T (EX, TAR) to
equation (6), which is a function of exports EX and tariffs TAR.
Using Shephard’s Lemma, the conditional labor demand function L is derived as follows:6
L = T*Ld(Y, w, r, pINP, T) (7)
The conditional labor demand function in equation (7) can be written in log-linear form as:
lnLit = α0 + ηYlnYit + ηLlnwit + ηKlnrit + ηINPpitINP +β1lnEXit + β2lnTARit
+ δiDi + δtDt + εit (8)
Besides wages and prices of intermediate inputs, the rental rate on capital needs to be operationalized as follows.
Following Amiti and Wei (2005), the rental rate on capital r is expected to be the same for all companies and a func-
tion of time r=f(t). Not directly included in the estimation model, r will be captured by adding fixed-year dummies.
We expect higher output to have a positive effect on labor demand (ηY > 0), while an increase in wages will lower
labor demand (ηw < 0). An increase in intermediate input prices might have a positive (ηINP > 0) or negative (ηINP
< 0) effect on labor demand, depending on whether intermediate inputs are substitutes or complements for labor.
We also expect increasing tariffs to have a positive impact on labor demand, as higher tariffs render imports more
expensive (β2 > 0). Countries will have an incentive to produce more goods at home instead of importing them.
Exports can have at least three effects on labor demand: (i) Export products are expected to be more sophisticated
than domestic products. That is, for a given level of output being produced, a bigger share of export products re-
quires more labor because of the higher sophistication of exports, which we call the positive sophistication effect
(β1 > 0). (ii) Exports are expected to increase labor productivity through learning-by-exporting, thus, reducing the
amount of labor for every unit of output produced, which we call the negative productivity effect (β1 < 0). (iii) Finally,
if exporters share their productivity gains from exporting with consumers by lowering their export prices, this might
EXPORTS AND EXPORT DIVERSIFICATION IN SUB-SAHARAN AFRICA 19
lead to increasing foreign demand for exports, which we call positive scale effect (β1 > 0). The net effect is ambigu-
ous depending on the relative importance of these three effects.
The conditional labor demand function in equation (8) only considers the productivity and substitution effect. Scale
effects are taken into account, when the output price P is substituted for the quantity of output Y (Amiti and Wei
2006). Allowing for scale effects, the unconditional labor demand equation is described as follows:
lnLit = α0 + ηYlnPit + ηLlnwit + ηKlnrit + ηINPpitINP +β1lnEXit + β2lnTARit
+ δiDi + δtDt + εit (9)
Next, we are interested in the effects of export diversification and its interaction with exports on labor demand. The
conditional labor demand function in equation (8) now becomes:
lnLit = α0 + ηYlnYit + ηLlnwit + ηKlnrit + ηINPpitINP +β1lnEXit + β2lnTARit
+ γ1lnEXitDIVit + γ2DIVit + δiDi + δtDt + εit (10)
The unconditional labor demand function in equation (9) turns into:
lnLit = α0 + ηYlnPit + ηLlnwit + ηKlnrit + ηINPpitINP +β1lnEXit + β2lnTARit
+ γ1lnEXitDIVit + γ2DIVit + δiDi + δtDt + εit (11)
20 GLOBAL ECONOMY AND DEVELOPMENT PROGRAM
First Indicators
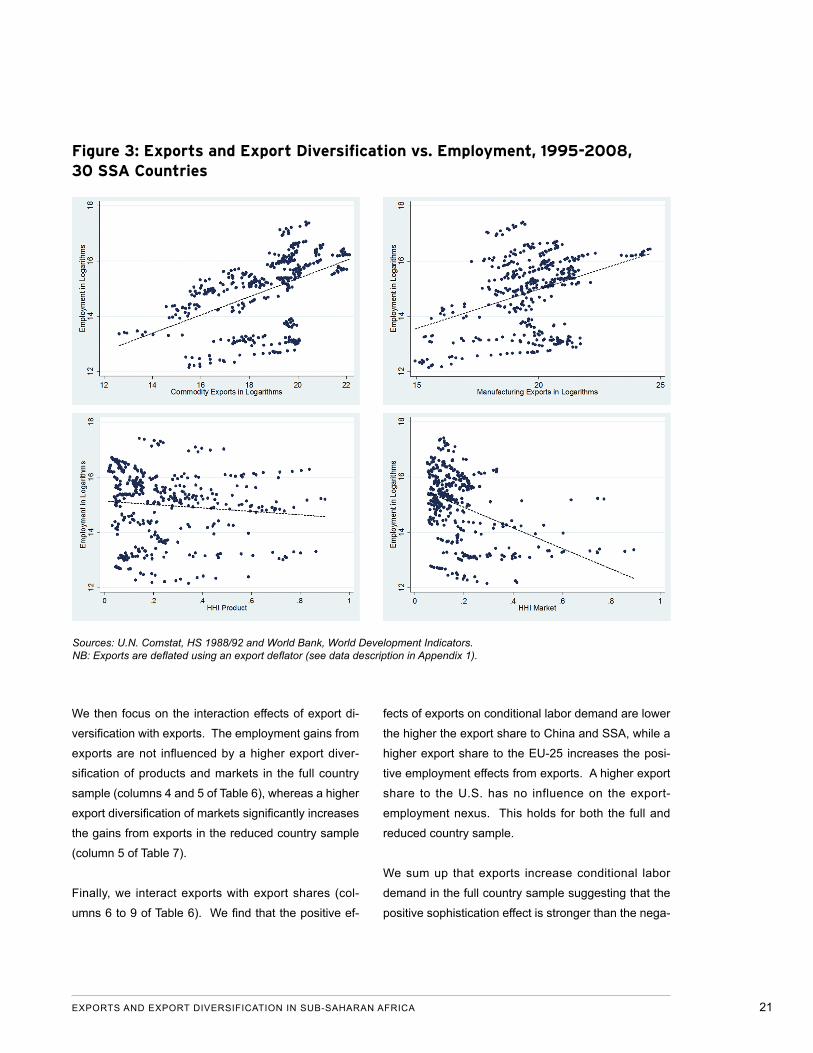
Figure 3 shows the relationship between exports,
export diversification and employment for 30 SSA
countries over the period 1995-2008. The bivariate
regression lines in the top graphs suggest a positive
correlation between commodity and manufacturing ex-
ports and employment. Interestingly, the positive effect
seems to be at least as strong for commodity products
as for manufacturing exports. One explanation would
be that indirect linkage effects on employment are
larger for commodity than manufacturing export sec-
tors. Studies have found that a strong commodity ex-
port sector in developing countries can spread over to
other sectors (e.g., Boame 1998, for Ghana). Growing
commodity exports increase labor demand in other
sectors (i) to build infrastructure e.g., roads, electricity,
water supply or capital goods (backward linkages); (ii)
to further process the exporting sector’s output (for-
ward linkage); and (iii) to produce inputs for the export-
ing sector including consumer goods, intermediates
and services (final demand linkage).
The bottom part of Figure 3 shows the relationship be-
tween export diversification and employment. While
both export diversification of products and markets
seem to have a positive correlation with employment,
this positive effect appears to be much more pro-
nounced for market diversification. That is, exporting
to different markets seems to matter more for labor de-
mand than exporting different types of products.
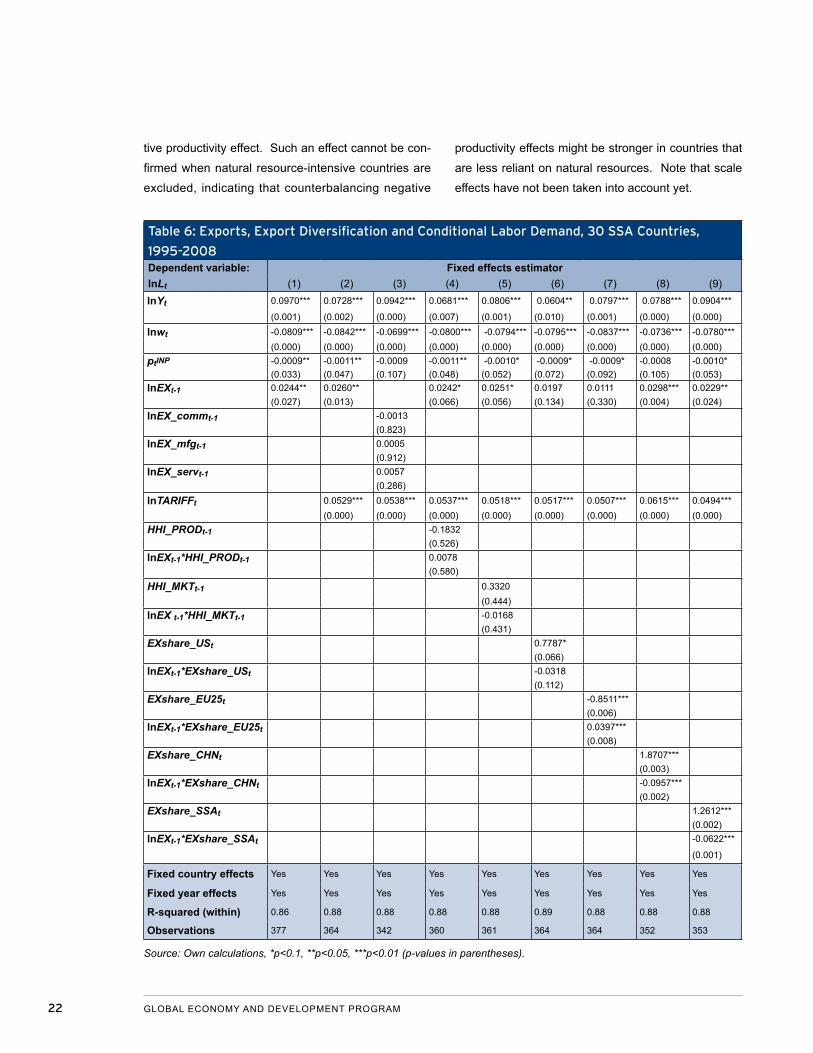
Regression Results: Conditional Labor Demand
Table 6 reports the conditional labor demand regres-
sions as specified in equations (8) and (10) for all 30
SSA countries covering the period 1995-2008. The
summary statistics can be found in Appendix 2. As
expected, output has a positive impact on condi-
tional labor demand. Wages and intermediate input
prices show a negative influence on conditional labor
demand, which is stronger and more significant for
wages. Exports have a positive effect on conditional
labor demand, which is significant in most specifi-
cations. As hypothesized, increasing tariffs have a
positive impact on labor demand, as higher tariffs tax
imports and encourage domestic production. This
positive effect of exports cannot be confirmed at the
broad product level (column 3 of Table 6).
To test whether these results are driven by resource-
intensive countries, Table 7 shows the results for the
conditional labor demand regressions for our reduced
country sample. While the results for output, wages,
intermediate input prices and tariffs can be confirmed,
we only find a positive effect of exports on conditional
labor demand in one specification (column 8 of Table
7). That is, natural resource-intensive countries seem
to have driven the results of Table 6. However, the
coefficients are all positive and similar in terms of coef-
ficient size.
Export diversification of products and markets do not
affect conditional demand in the full country sample
(columns 4 and 5 of Table 6), while a higher export con-
centration of markets has a significantly positive effect
on conditional labor demand in the reduced country
sample (column 5 of Table 7).
Next, we focus on the role of export destination for
conditional labor demand. A higher export share to
the U.S., China and SSA significantly increases condi-
tional labor demand, while a higher export share to the
EU-25 significantly lowers it in the full country sample
(columns 6 to 9 of Table 6). The results are the same in
the reduced country sample (columns 6 to 9 of Table 7)
except for the export share to the U.S., which no longer
shows a significant impact.
EXPORTS AND EXPORT DIVERSIFICATION IN SUB-SAHARAN AFRICA 21
Figure 3: Exports and Export Diversification vs. Employment, 1995-2008, 30 SSA Countries
Sources: U.N. Comstat, HS 1988/92 and World Bank, World Development Indicators.NB: Exports are deflated using an export deflator (see data description in Appendix 1).
We then focus on the interaction effects of export di-
versification with exports. The employment gains from
exports are not influenced by a higher export diver-
sification of products and markets in the full country
sample (columns 4 and 5 of Table 6), whereas a higher
export diversification of markets significantly increases
the gains from exports in the reduced country sample
(column 5 of Table 7).
Finally, we interact exports with export shares (col-
umns 6 to 9 of Table 6). We find that the positive ef-
fects of exports on conditional labor demand are lower
the higher the export share to China and SSA, while a
higher export share to the EU-25 increases the posi-
tive employment effects from exports. A higher export
share to the U.S. has no influence on the export-
employment nexus. This holds for both the full and
reduced country sample.
We sum up that exports increase conditional labor
demand in the full country sample suggesting that the
positive sophistication effect is stronger than the nega-
22 GLOBAL ECONOMY AND DEVELOPMENT PROGRAM
tive productivity effect. Such an effect cannot be con-
firmed when natural resource-intensive countries are
excluded, indicating that counterbalancing negative
productivity effects might be stronger in countries that
are less reliant on natural resources. Note that scale
effects have not been taken into account yet.
Table 6: Exports, Export Diversification and Conditional Labor Demand, 30 SSA Countries,
1995-2008Dependent variable: Fixed effects estimatorlnLt (1) (2) (3) (4) (5) (6) (7) (8) (9)lnYt 0.0970*** 0.0728*** 0.0942*** 0.0681*** 0.0806*** 0.0604** 0.0797*** 0.0788*** 0.0904***
(0.001) (0.002) (0.000) (0.007) (0.001) (0.010) (0.001) (0.000) (0.000)lnwt -0.0809*** -0.0842*** -0.0699*** -0.0800*** -0.0794*** -0.0795*** -0.0837*** -0.0736*** -0.0780***
(0.000) (0.000) (0.000) (0.000) (0.000) (0.000) (0.000) (0.000) (0.000)ptINP -0.0009** -0.0011** -0.0009 -0.0011** -0.0010* -0.0009* -0.0009* -0.0008 -0.0010*
(0.033) (0.047) (0.107) (0.048) (0.052) (0.072) (0.092) (0.105) (0.053)lnEXt-1 0.0244** 0.0260** 0.0242* 0.0251* 0.0197 0.0111 0.0298*** 0.0229**
(0.027) (0.013) (0.066) (0.056) (0.134) (0.330) (0.004) (0.024)lnEX_commt-1 -0.0013
(0.823)lnEX_mfgt-1 0.0005
(0.912)lnEX_servt-1 0.0057
(0.286)lnTARIFFt 0.0529*** 0.0538*** 0.0537*** 0.0518*** 0.0517*** 0.0507*** 0.0615*** 0.0494***
(0.000) (0.000) (0.000) (0.000) (0.000) (0.000) (0.000) (0.000)HHI_PRODt-1 -0.1832
(0.526)lnEXt-1*HHI_PRODt-1 0.0078
(0.580)HHI_MKTt-1 0.3320
(0.444)lnEX t-1*HHI_MKTt-1 -0.0168
(0.431)EXshare_USt 0.7787*
(0.066)lnEXt-1*EXshare_USt -0.0318
(0.112)EXshare_EU25t -0.8511***
(0.006)lnEXt-1*EXshare_EU25t 0.0397***
(0.008)EXshare_CHNt 1.8707***
(0.003)lnEXt-1*EXshare_CHNt -0.0957***
(0.002)EXshare_SSAt 1.2612***
(0.002)lnEXt-1*EXshare_SSAt -0.0622***
(0.001)
Fixed country effects Yes Yes Yes Yes Yes Yes Yes Yes Yes
Fixed year effects Yes Yes Yes Yes Yes Yes Yes Yes Yes
R-squared (within) 0.86 0.88 0.88 0.88 0.88 0.89 0.88 0.88 0.88
Observations 377 364 342 360 361 364 364 352 353
Source: Own calculations, *p<0.1, **p<0.05, ***p<0.01 (p-values in parentheses).
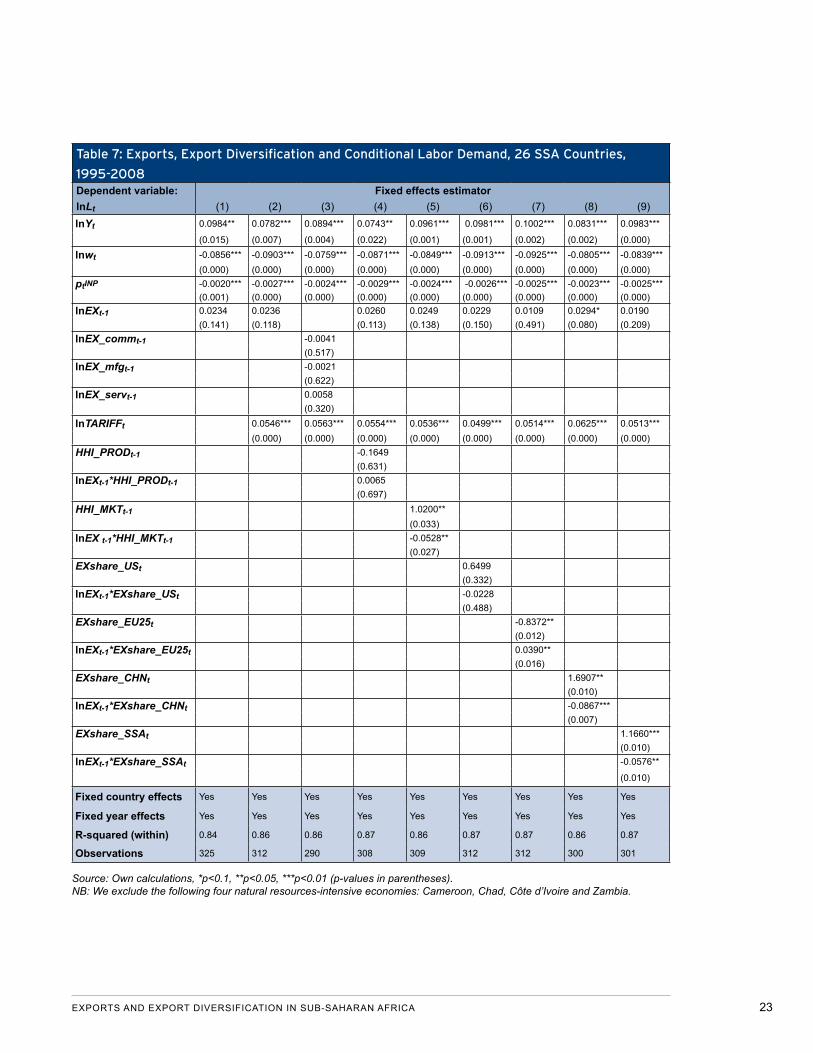
EXPORTS AND EXPORT DIVERSIFICATION IN SUB-SAHARAN AFRICA 23
Table 7: Exports, Export Diversification and Conditional Labor Demand, 26 SSA Countries,
1995-2008Dependent variable: Fixed effects estimatorlnLt (1) (2) (3) (4) (5) (6) (7) (8) (9)lnYt 0.0984** 0.0782*** 0.0894*** 0.0743** 0.0961*** 0.0981*** 0.1002*** 0.0831*** 0.0983***
(0.015) (0.007) (0.004) (0.022) (0.001) (0.001) (0.002) (0.002) (0.000)lnwt -0.0856*** -0.0903*** -0.0759*** -0.0871*** -0.0849*** -0.0913*** -0.0925*** -0.0805*** -0.0839***
(0.000) (0.000) (0.000) (0.000) (0.000) (0.000) (0.000) (0.000) (0.000)ptINP -0.0020*** -0.0027*** -0.0024*** -0.0029*** -0.0024*** -0.0026*** -0.0025*** -0.0023*** -0.0025***
(0.001) (0.000) (0.000) (0.000) (0.000) (0.000) (0.000) (0.000) (0.000)lnEXt-1 0.0234 0.0236 0.0260 0.0249 0.0229 0.0109 0.0294* 0.0190
(0.141) (0.118) (0.113) (0.138) (0.150) (0.491) (0.080) (0.209)lnEX_commt-1 -0.0041
(0.517)lnEX_mfgt-1 -0.0021
(0.622)lnEX_servt-1 0.0058
(0.320)lnTARIFFt 0.0546*** 0.0563*** 0.0554*** 0.0536*** 0.0499*** 0.0514*** 0.0625*** 0.0513***
(0.000) (0.000) (0.000) (0.000) (0.000) (0.000) (0.000) (0.000)HHI_PRODt-1 -0.1649
(0.631)lnEXt-1*HHI_PRODt-1 0.0065
(0.697)HHI_MKTt-1 1.0200**
(0.033)lnEX t-1*HHI_MKTt-1 -0.0528**
(0.027)EXshare_USt 0.6499
(0.332)lnEXt-1*EXshare_USt -0.0228
(0.488)EXshare_EU25t -0.8372**
(0.012)lnEXt-1*EXshare_EU25t 0.0390**
(0.016)EXshare_CHNt 1.6907**
(0.010)lnEXt-1*EXshare_CHNt -0.0867***
(0.007)EXshare_SSAt 1.1660***
(0.010)lnEXt-1*EXshare_SSAt -0.0576**
(0.010)
Fixed country effects Yes Yes Yes Yes Yes Yes Yes Yes Yes
Fixed year effects Yes Yes Yes Yes Yes Yes Yes Yes Yes
R-squared (within) 0.84 0.86 0.86 0.87 0.86 0.87 0.87 0.86 0.87
Observations 325 312 290 308 309 312 312 300 301
Source: Own calculations, *p<0.1, **p<0.05, ***p<0.01 (p-values in parentheses). NB: We exclude the following four natural resources-intensive economies: Cameroon, Chad, Côte d’Ivoire and Zambia.
24 GLOBAL ECONOMY AND DEVELOPMENT PROGRAM
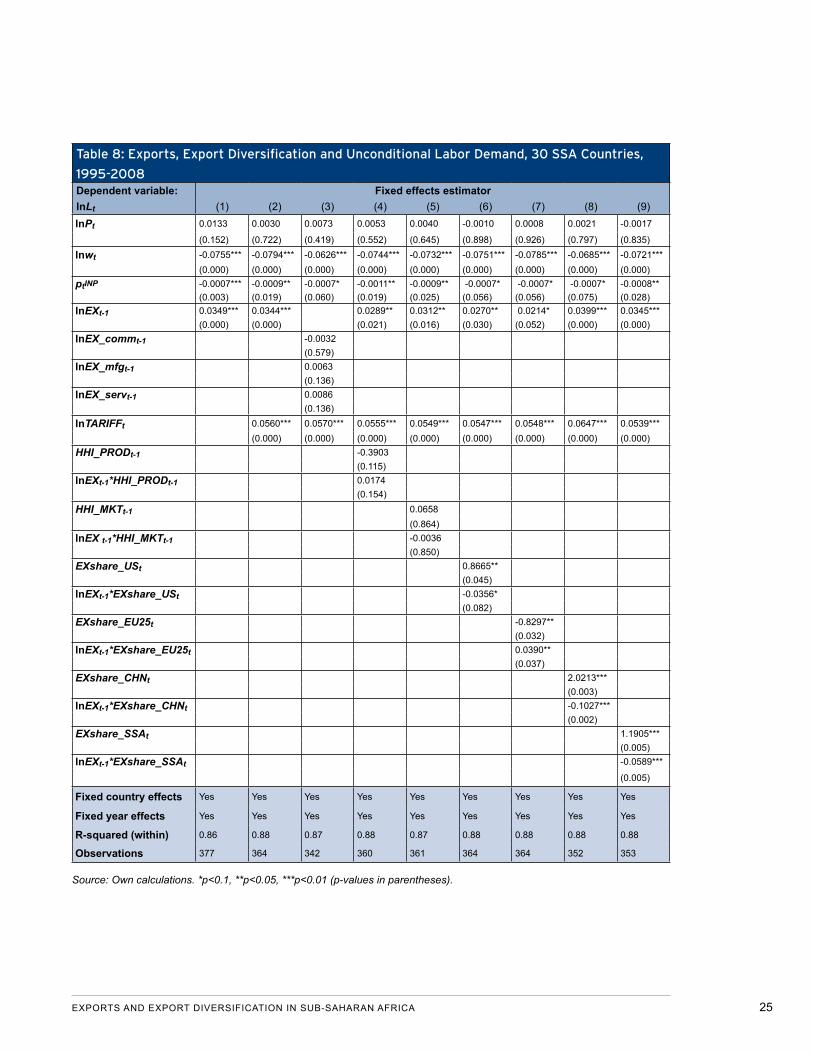
Regression Results: Unconditional Labor Demand
In this section, we focus on the effect of exports on
unconditional labor demand allowing for scale effects.
Table 8 reports the results for the whole 30-country
sample. These results confirm the negative effect of
wages and intermediate input prices and the positive
effect of tariffs on unconditional labor demand. Exports
increase unconditional labor demand, which is signifi-
cant across all specifications and shows slightly larger
coefficients compared to the conditional labor demand
regressions. Again, the positive effect of exports can-
not be confirmed at the broad product category level
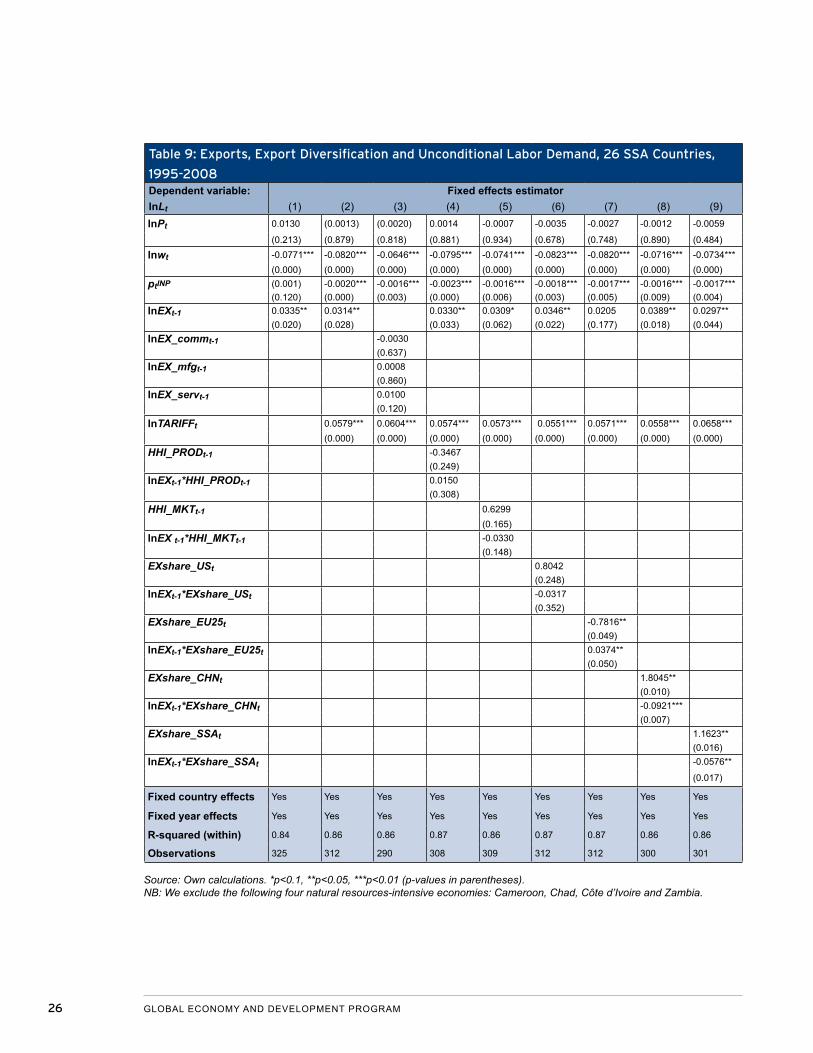
(column 3 of Table 8). These results also hold for the
reduced country sample (Table 9).
Export diversification of products and markets has no
impact on unconditional labor demand in the full and
reduced country sample (columns 4 and 5 of tables 8
and 9). As in the conditional labor demand regressions,
a higher export share to the U.S., China and SSA
significantly increases labor demand, while a higher
export share to the EU-25 significantly lowers it in the
full country sample (columns 6 to 9 of Table 8). The
results are the same in the reduced country sample
(columns 6 to 9 of Table 9) except for the export share
to the U.S., which no longer shows a significant impact.
The interaction of exports with export diversification
of products and markets is insignificant in the full and
reduced country sample (columns 4 and 5 of Tables 8
and 9). In the full sample, the interaction terms of ex-
ports with export share to the U.S., China and SSA are
negative, indicating that the employment gains from
exports are lowered, while the gains from exports in-
crease with a higher export share to the EU-25. These
results also hold for the reduced country sample, ex-
cept for the export share to the U.S., which is no longer
significant (columns 6 to 9 of Table 9).
We sum up that exports have a positive effect on
unconditional labor demand in both the full and the
reduced country sample. This result suggests that
positive scale and sophistication effects are stronger
than negative productivity effects. The positive effect
of exports on conditional labor demand can only be
confirmed when natural resource-intensive countries
are included in the model, implying that counterbal-
ancing negative productivity effects might be stronger
in countries that are less reliant on natural resources.
EXPORTS AND EXPORT DIVERSIFICATION IN SUB-SAHARAN AFRICA 25
Table 8: Exports, Export Diversification and Unconditional Labor Demand, 30 SSA Countries,
1995-2008Dependent variable: Fixed effects estimatorlnLt (1) (2) (3) (4) (5) (6) (7) (8) (9)lnPt 0.0133 0.0030 0.0073 0.0053 0.0040 -0.0010 0.0008 0.0021 -0.0017
(0.152) (0.722) (0.419) (0.552) (0.645) (0.898) (0.926) (0.797) (0.835)lnwt -0.0755*** -0.0794*** -0.0626*** -0.0744*** -0.0732*** -0.0751*** -0.0785*** -0.0685*** -0.0721***
(0.000) (0.000) (0.000) (0.000) (0.000) (0.000) (0.000) (0.000) (0.000)ptINP -0.0007*** -0.0009** -0.0007* -0.0011** -0.0009** -0.0007* -0.0007* -0.0007* -0.0008**
(0.003) (0.019) (0.060) (0.019) (0.025) (0.056) (0.056) (0.075) (0.028)lnEXt-1 0.0349*** 0.0344*** 0.0289** 0.0312** 0.0270** 0.0214* 0.0399*** 0.0345***
(0.000) (0.000) (0.021) (0.016) (0.030) (0.052) (0.000) (0.000)lnEX_commt-1 -0.0032
(0.579)lnEX_mfgt-1 0.0063
(0.136)lnEX_servt-1 0.0086
(0.136)lnTARIFFt 0.0560*** 0.0570*** 0.0555*** 0.0549*** 0.0547*** 0.0548*** 0.0647*** 0.0539***
(0.000) (0.000) (0.000) (0.000) (0.000) (0.000) (0.000) (0.000)HHI_PRODt-1 -0.3903
(0.115)lnEXt-1*HHI_PRODt-1 0.0174
(0.154)HHI_MKTt-1 0.0658
(0.864)lnEX t-1*HHI_MKTt-1 -0.0036
(0.850)EXshare_USt 0.8665**
(0.045)lnEXt-1*EXshare_USt -0.0356*
(0.082)EXshare_EU25t -0.8297**
(0.032)lnEXt-1*EXshare_EU25t 0.0390**
(0.037)EXshare_CHNt 2.0213***
(0.003)lnEXt-1*EXshare_CHNt -0.1027***
(0.002)EXshare_SSAt 1.1905***
(0.005)lnEXt-1*EXshare_SSAt -0.0589***
(0.005)
Fixed country effects Yes Yes Yes Yes Yes Yes Yes Yes Yes
Fixed year effects Yes Yes Yes Yes Yes Yes Yes Yes Yes
R-squared (within) 0.86 0.88 0.87 0.88 0.87 0.88 0.88 0.88 0.88
Observations 377 364 342 360 361 364 364 352 353
Source: Own calculations. *p<0.1, **p<0.05, ***p<0.01 (p-values in parentheses).
26 GLOBAL ECONOMY AND DEVELOPMENT PROGRAM
Table 9: Exports, Export Diversification and Unconditional Labor Demand, 26 SSA Countries,
1995-2008Dependent variable: Fixed effects estimatorlnLt (1) (2) (3) (4) (5) (6) (7) (8) (9)lnPt 0.0130 (0.0013) (0.0020) 0.0014 -0.0007 -0.0035 -0.0027 -0.0012 -0.0059
(0.213) (0.879) (0.818) (0.881) (0.934) (0.678) (0.748) (0.890) (0.484)lnwt -0.0771*** -0.0820*** -0.0646*** -0.0795*** -0.0741*** -0.0823*** -0.0820*** -0.0716*** -0.0734***
(0.000) (0.000) (0.000) (0.000) (0.000) (0.000) (0.000) (0.000) (0.000)ptINP (0.001) -0.0020*** -0.0016*** -0.0023*** -0.0016*** -0.0018*** -0.0017*** -0.0016*** -0.0017***
(0.120) (0.000) (0.003) (0.000) (0.006) (0.003) (0.005) (0.009) (0.004)lnEXt-1 0.0335** 0.0314** 0.0330** 0.0309* 0.0346** 0.0205 0.0389** 0.0297**
(0.020) (0.028) (0.033) (0.062) (0.022) (0.177) (0.018) (0.044)lnEX_commt-1 -0.0030
(0.637)lnEX_mfgt-1 0.0008
(0.860)lnEX_servt-1 0.0100
(0.120)lnTARIFFt 0.0579*** 0.0604*** 0.0574*** 0.0573*** 0.0551*** 0.0571*** 0.0558*** 0.0658***
(0.000) (0.000) (0.000) (0.000) (0.000) (0.000) (0.000) (0.000)HHI_PRODt-1 -0.3467
(0.249)lnEXt-1*HHI_PRODt-1 0.0150
(0.308)HHI_MKTt-1 0.6299
(0.165)lnEX t-1*HHI_MKTt-1 -0.0330
(0.148)EXshare_USt 0.8042
(0.248)lnEXt-1*EXshare_USt -0.0317
(0.352)EXshare_EU25t -0.7816**
(0.049)lnEXt-1*EXshare_EU25t 0.0374**
(0.050)EXshare_CHNt 1.8045**
(0.010)lnEXt-1*EXshare_CHNt -0.0921***
(0.007)EXshare_SSAt 1.1623**
(0.016)lnEXt-1*EXshare_SSAt -0.0576**
(0.017)
Fixed country effects Yes Yes Yes Yes Yes Yes Yes Yes Yes
Fixed year effects Yes Yes Yes Yes Yes Yes Yes Yes Yes
R-squared (within) 0.84 0.86 0.86 0.87 0.86 0.87 0.87 0.86 0.86
Observations 325 312 290 308 309 312 312 300 301
Source: Own calculations. *p<0.1, **p<0.05, ***p<0.01 (p-values in parentheses). NB: We exclude the following four natural resources-intensive economies: Cameroon, Chad, Côte d’Ivoire and Zambia.
EXPORTS AND EXPORT DIVERSIFICATION IN SUB-SAHARAN AFRICA 27
5. POLICY IMPLICATIONS FOR POST-CRISIS EXPORT STRATEGIES
In 2008, the world economy was plunged into a deep
and prolonged crisis—the worst recession since the
Great Depression. Global GDP contracted for the first
time on record. Africa’s hard-won gains came under
threat from the crisis. Growth in SSA plunged from a
6.5 percent average between 2000 and 2007 to 1.6
percent in 2009 (IMF 2009 and 2010). Between 2007
and 2008, SSA was hit by a triple shock—the food, fuel
and financial crises.
The first hint of an impending crisis was the rapid rise
in food prices caused by the high price volatility of oil
markets, which was transferred to corn markets as
oil prices rose above $50 per barrel, and use of corn-
based ethanol increased. Second, many financial
institutions, seeking safety and an exit from the more
risky and less transparent derivatives market, diversi-
fied into commodity markets, putting further pressure
on commodity prices (Songwe 2011).
In addition to increased use of crops for bio-fuels and
rising oil prices, the standard literature on the food
price crisis has attributed the rise in prices to increased
food and meat consumption in emerging markets due
to rising incomes and a growing world population. The
rising commodity prices had a mixed impact on the
continent: Commodity-exporting countries such as
Angola, the Democratic Republic of the Congo and
Nigeria benefited from the steep increase in prices,
while the non-commodity-exporting countries suffered
from increases in food prices and deterioration in their
balance of payments.
Third, the collapse of Lehman Brothers in September
2008 marked the beginning of the financial crisis.
Asset values contracted as stock markets hit historic
lows. According to some estimates (Bollard and Ng
2009), the amount of money lost in global stock mar-
kets totaled $30 trillion dollars. This amount is equiva-
lent to over 71 percent of the amount raised by the
International Development Association for the 2012-
2014 period, $42 billion over three years.
The crisis reached SSA through three main channels
of transmission: labor markets, capital markets and
export markets. The impact of the crisis on trade was
devastating for SSA, which was the hardest hit region
in terms of exports. SSA goods exports alone fell by
more than 40 percent in January 2009 compared to
January 2008 (see Figure 4). It is no surprise that the
collapse in commodity trade following the real sector
collapse in the West affected SSA so severely, given
that one-third of the world’s resource-dependent coun-
tries are in the region.
During the second half of 2008, non-energy commodity
prices plunged 38 percent. In December, non-energy
prices fell 6.8 percent, down for the fifth consecutive
month. Oil prices fell 69 percent between July and
December 2008, reversing the oil price increases of
the previous three and a half years. Oil exporters suf-
fered a loss, but many of them, such as Nigeria, had
built up a savings cushion during the boom years and
were better able to withstand the crisis. By end 2009,
however, oil prices had recovered from their low point
of $40 in December 2008 to about $70. Some poorer
countries suffered particularly large shocks. Many of
them experienced terms-of-trade losses of over 3 per-
cent of 2008 GDP, with losses exceeding 5 percent in
Chad, Guinea, Mozambique and Zambia.
Over the last decade, many developing countries em-
braced export-led strategies as an engine for growth
and employment and have increasingly diversified
both export markets and products. The food, fuel and
28 GLOBAL ECONOMY AND DEVELOPMENT PROGRAM
financial crises were the first test of the resilience of
this strategy to shocks. Our analysis shows that this
strategy has served Africa well, helping facilitate its
early recovery from the global crisis. In terms of GDP,
Africa is projected to come out of the crisis faster than
most other regions. Africa’s growth is projected to re-
bound to 5.5 percent in 2011, up from 1.6 percent in
2009 (IMF 2009 and 2010). While this increase is still
significantly below pre-crisis levels compared to other
regions, Africa has bounced back faster than Europe
and Central Asia, and the Middle East and North Africa.
Africa has performed well but has also exhibited some
structural weaknesses that must be addressed if it is to
accelerate growth and reduce poverty.
The recent global economic downturn has highlighted
the critical importance of trade as an engine for Africa’s
growth and employment and, more importantly, as a
way of smoothing out the crisis impact. In view of our
results, we conclude that the export structure of SSA is
50
60
70
80
90
100
110
120
2007
M01
2007
M02
2007
M03
2007
M04
2007
M05
2007
M06
2007
M07
2007
M08
2007
M09
2007
M10
2007
M11
2007
M12
2008
M01
2008
M02
2008
M03
2008
M04
2008
M05
2008
M06
2008
M07
2008
M08
2008
M09
2008
M10
2008
M11
2008
M12
2009
M01
2009
M02
2009
M03
2009
M04
2009
M05
2009
M06
2009
M07
2009
M08
2009
M09
2009
M10
2009
M11
2009
M12
2010
M01
2010
M02
2010
M03
2010
M04
2010
M05
2010
M06
2010
M07
EAP SA LAC MENA ECA SSA
Figure 4: Goods Exports for Six World Regions, Constant and Seasonally Adjusted, 2007–10
Source: Own illustration. Data: Global Economic Monitor, World Bank.
EXPORTS AND EXPORT DIVERSIFICATION IN SUB-SAHARAN AFRICA 29
one of the main reasons why it has been able to get a
head start out of the recession. Africa has not missed
the boat, as many predicted, because of its reliance on
commodity exports; on the contrary, it has benefited
from its export structure, particularly because of high
demand from China. In sum, while Africa’s rally was
mainly the result of sound macroeconomic fundamen-
tals in place before the crisis, the structural composi-
tion of Africa’s exports also supported the region’s
economic resurgence.
While pre-crisis trade discussion on Africa focused
on the need for increased product diversification, the
crisis has demonstrated that increased market diver-
sification is equally important for growth as product
diversification. Our findings also imply that export con-
centration in a few products in which countries have a
high comparative advantage yields more benefits than
product diversification in goods in which they have less
comparative advantage. In cases where countries
have a revealed comparative advantage in a few com-
modities, specialization should precede diversification.
Product diversification must therefore be managed
to safeguard market share of exports. For example,
Nigeria and other oil-exporting countries could move
into the pharmaceuticals industry, while Côte d’Ivoire
and other cocoa-producing countries could move into
the manufacturing of chocolate-based products such
as biscuits and drinks. These results also indicate that
while product and market diversification is important
for growth, the effects may be nonlinear: Product spe-
cialization even at the commodity stage might be more
beneficial for short-term growth than product diversifi-
cation over the medium term.
Despite the strong rebound, the crisis has interrupted
the growth acceleration experienced on the continent:
Growth averages have dropped. African countries will
need to do more, better and faster to catch up to pre-
2008 growth levels. The first order of business should
be to protect past gains in macroeconomic stability
and continue structural reforms. Second, countries
should put in place policies that exploit the increas-
ing benefits of South-South trade, including improved
intra-regional trade. Growth in exports to low- and
middle-income countries offers Africa a chance to di-
versify export markets further while it works to diversify
its product market.
Most importantly, SSA countries must pursue a dual
strategy of diversifying both export markets and
product markets to accelerate growth. African coun-
tries need to work to protect market share in existing
commodity markets by retaining and increasing their
competitiveness in the areas where they have a com-
parative advantage. The crisis has shown that this
strategy allows countries to manage economic down-
turns better. The above analysis also shows that ex-
ports of manufactures contribute more to growth than
exports of commodities.
Therefore, while acquiring new markets for com-
modities, countries also need to expand and diversify
exports to high-value markets such as the U.S. Our
analysis shows that while export market share to the
developed countries is dropping, a higher export share
to the U.S. has positive growth effects in non-resource-
intensive countries. Part of the strategy is to put in
place policies that attract more foreign direct invest-
ment in order to facilitate more technology transfer.
Countries therefore need to improve their business
regulation, property rights legislation and, most impor-
tantly, the governance environment for business.
30 GLOBAL ECONOMY AND DEVELOPMENT PROGRAM
REFERENCES
Agosin, M. (2007), “Export Diversification and Growth
in Emerging Economies”, Serie Documentos de
Trabajo N 233, Universidad de Chile , Santiago.
Ahmad, J. and A. Kwan (1991), “Causality Between
Exports and Economic Growth: Empir ical
Evidence from Africa”, Economics Letters, Vol. 37,
Issue 3, pp. 397-416.
Alcala, F. and A. Ciccone (2004), “Trade and
Productivity”, Quarterly Journal of Economics, Vol.
119, Issue 2, pp. 613-646.
Alege, S. (1993), “Export and Growth in the Nigerian
Economy: A Causality Test”, Indian Journal of
Economics, Vol. 73, pp. 397-416.
Al-Marhubi, F. (2000), “Export Diversification and
Growth: An Empirical Investigation”, Applied
Economics Letters, Vol. 7, Issue 9, pp. 559-562.
Amiti, M. and S.-J. Wei (2005), “Fear of Service
Outsourcing: Is it Justified?”, Economic Policy,
Vol. 20, Issue 42, pp. 308–347.
Amiti, M. and S.-J. Wei (2006), “Service Offshoring,
Productivity and Employment: Evidence from the
US”, CEPR Discussion Paper 5475, February.
Amoateng, K. and B. Amoako-Adu (1996), “Economic
Growth, Export and External Debt Causality: The
Case of African Countries”, Applied Economics,
Vol. 28, Issue 1, pp. 21-27.
Baum, C., M. Schaffer, and S. Stillman (2007),
“IVREG2: Stata Module for Extended Instrumental
Variables/2SLS, GMM and AC/HAC, LIML and
K-class Regression”, http://ideas.repec.org/c/boc/
bocode/s425401.html
Bernard, A. and Jensen, J. (1995) Exporters, Jobs,
and Wages in U.S. Manufactur ing: 1976-
1987. Brookings Papers on Economic Activity:
Microeconomics, pp. 67-119.
Biesebroeck, V. (2005), “Exporting Raises Productivity
in Sub-Saharan African Manufacturing Firms”,
Journal of International Economics, Vol. 67, Issue
2, pp. 373-391.
Bigsten, A., Collier, P., Dercon, S., Fafchamps, M.,
Gauthier, B., Gunning, J., Oduro, A., Oostendorp,
R., Pattillo, C., Soderbom, M., Teal, F. and A.
Zeufack (2004), “Do African Manufacturing Firms
Learn from Exporting?”, Journal of Development
Studies, Vol. 40, Issue 3, pp.115-141.
Boame, A. (1998), “Primary-Export-Led Growth:
The Evidence of Ghana”, Journal of Economic
Development, Vol. 23, Issue 1, pp. 175-194.
Bollard, A. and T. Ng (2009), “Coping with Global
Financial and Economic Stresses,” An ad-
dress to the Canterbury Employers’ Chamber of
Commerce on 30 January 2009, link: http://www.
rbnz.govt.nz/speeches/3507679.html
Dodaro, S. (1991), “Comparative Advantage, Trade
and Growth: Export-led Growth Revisited”, World
Development, Vol. 19, Issue 9, pp. 1153-1165.
Easterly, W. and R. Levine (1997), “Africa’s Growth
Tragedy: Policies and Ethnic Division”, Quarterly
Journal of Economics, Vol. 112, Issue 4, pp. 1203-
1250.
Edwards, L. (2004), “A Firm Level Analysis of Trade,
Technology and Employment in South Africa”,
Journal of International Development, Vol. 16,
Issue 1, pp. 45-61.
EXPORTS AND EXPORT DIVERSIFICATION IN SUB-SAHARAN AFRICA 31
Egwaikhide, F. (1992), “Oil Export and Economic
Growth In Nigeria: A Preliminary Investigation”,
Indian Journal of Economics, Vol. 73, pp. 221-232.
Feenstra, R. and G. Hanson (2003), “Global Production
Sharing and Rising Inequality: A Survey of Trade
and Wages,” in Handbook of International Trade,
E. Cho and J. Harrigan (eds), Malden, MA:
Blackwell Publishing, pp. 146–185.
Fosu, A. (1996), “Primary Exports and Economic
Growth in Developing Countries”, World Economy,
Vol. 19, Issue 4, pp. 466-475.
Fu, X. and V. Balasubramanyam (2005), “Exports,
Foreign Direct Investment and Employment: The
Case of China”, The World Economy, Vol. 28,
Issue 4, pp. 607-625.
Gelb, Alan H. (2000), Can Africa Claim the 21st
Century?, Washington DC: The World Bank.
Greenaway, D., W. Morgan and P. Wright (1999),
“Exports, Export Composition and Growth”,
The Journal of International Trade & Economic
Development, Vol. 8, Issue 1, pp. 41-51.
Grossman, G., and E. Helpman (1991), Innovation and
Growth in the Global Economy, Cambridge, MA:
MIT Press.
Hall, R. and C. Jones (1999), “Why Do Some Countries
Produce So Much More Output Per Worker Than
Others?”, Quarterly Journal of Economics, Vol.
114, Issue 1, pp. 83-116.
Harrison, A. and A. Rodríguez-Clare (2009), “Trade,
Foreign Investment, and Industrial Policy for
Developing Countries”, NBER Working Paper No.
15261.
Hausman, R., J. Hwang, and D. Rodrik (2006), “What
You Export Matters”, Working Paper. Center for
International Development, Harvard University.
Helpman, E. and P. Krugman (1985), Market Structure
and Foreign Trade. Increasing Returns, Imperfect
Competition, and the International Economy,
Cambridge, MA: MIT Press.
Hesse, H. (2009), “Export diversification and economic
growth”, In Breaking into New Markets, Emerging
Lessons for Export Diversification, R. Newfarmer,
W. Shaw, and P. Walkenhorst (eds.), Washington
DC: The World Bank, pp. 55-80.
IMF (2009), World Economic Out look, Cr is is
and Recovery, April 2009, Washington DC:
International Monetary Fund.
IMF (2010), World Economic Outlook, Rebalancing
Growth, April 2010, Washington DC: International
Monetary Fund.
Jenkins, R. (2004), “Vietnam in the Global Economy:
Trade, Employment and Poverty”, Journal of
International Development, Vol. 16, Issue 1, pp.
13-28.
Krueger, A. and B. Tuncer (1982), “Growth of Factor
Productivity in Turkish Manufacturing Industries”,
Journal of Development Economics, Vol. 11, Issue
3, pp. 307-25.
Lederman, D. and B. Klinger (2006), “Diversification,
Innovation, and Imitation off the Global Technology
Frontier”, World Bank Policy Research Paper No.
3872, Washington DC: World Bank.
Lederman, D., and W. F. Maloney (2007), “Trade
Structure and Growth.” In Natural Resources:
Neither Curse Nor Destiny, D. Lederman and W.F.
32 GLOBAL ECONOMY AND DEVELOPMENT PROGRAM
Maloney (eds.), Palo Alto: Stanford University
Press.
Manda, D. and K. Sen (2004), “The Labour Market
Effects of Globalization in Kenya”, Journal of
International Development, Vol. 16, Issue 1, pp.
29-43.
Mbaku, J. M. (1989), “Export Growth and Economic
Performance in Developing Countries: Further
Evidence from Africa”, Journal of Economic
Development, Vol. 14, Issue 2, pp. 127-142.
Naude, W. and R. Rossouw (2011) , “Expor t
Diversification and Economic Performance:
Evidence from Brazil, China, India and South
Africa”, Economic Change and Restructuring, Vol.
44, Issue 1, pp. 99-134.
Nishimizu, M. and S. Robinson (1984), “Trade Policies
and Productivity Change in Semi-Industrialized
Countries”, Journal of Development Economics,
Vol. 16, Issues 1-2, pp. 177-206.
Onafowora, O. and O. Owoye (1998), “Can Trade
Liberalization Stimulate Economic Growth in
Africa?”, World Development, Vol. 26, Issue 3, pp.
497-506.
Pineres, A. and M. Ferrantino (1997), “Export
Diversification and Structural Dynamics in the
Growth Process: The Case of Chile”, Journal of
Development Economics, Vol. 52, Issue 2, pp.
375-91.
Pineres, A. and M. Ferrantino (1999), “Export Sector
Dynamics and Domestic Growth: The Case of
Colombia”, Review of Development Economics,
Vol. 3, Issue 3, pp. 268–280.
Quenum, B.M. (2000), “Is Africa doomed? The African
Challenge”, Africa Business Magazine, December
2000.
Songwe, V. (2011), “The food and financial crises and
complex derivatives: a tale of high stakes inno-
vation and diversification”, in D. R. Lee, and M.
Ndulo (eds.), The Food and Financial Crises in
Sub-Saharan Africa: Origins, Impacts and Policy
Implications, pp. 101-121.
Ukpolo, V. (1994), “Export Composition and Growth of
Selected Low-Income African Countries: Evidence
from Time-Series Data”, Applied Economics, Vol.
26, Issue 5, pp. 445-449.
UNIDO (2009), “Breaking In and Moving Up: New
Industrial Challenges for the Bottom Billion
and the Middle-Income Countries”, Industrial
Development Report 2009, United Nations
Industrial Development Organization.
Weinhold, D. and J. Rauch (1999), “Openness,
Specialization, and Productivity Growth in Less
Developed Countries”, Canadian Journal of
Economics, Vol. 32, Issue 4, pp. 1009-1027.
EXPORTS AND EXPORT DIVERSIFICATION IN SUB-SAHARAN AFRICA 33
ENDNOTES1. Advisor, World Bank, Washington DC, USA.
Email: [email protected].
2. Consultant, World Bank, Washington DC, USA. Email: [email protected].
3. The HHI of market concentration is defined as the sum over a country’s squared market shares of ex-port destinations. If a country exports to only one destination, the HHI would be 1, while a lower HHI reflects a higher regional export diversification. Ac-cordingly, the HHI of product concentration is de-fined as the sum over a country’s squared market shares of different export products. For a descrip-tion of the data, see Appendix 1.
4. We tested for endogeneity of exports in the val-ue added regressions using the first three period lags as instruments (Baum, Schaffer and Stillman
2007). As expected, the results reject the null hypothesis that the specified endogenous export variable is exogenous (Chi2(1)p-value=0. 0716). However, when we perform the same test on the lagged value of exports using the three previous lags as instruments, the results cannot reject the null hypothesis (Chi2(1)p-value=0.2537).
5. Performing the same endogeneity tests as de-scribed above (Baum et al. 2007), the results can-not reject the null hypothesis in both cases. While endogeneity seems to be less of a problem in the labor productivity regressions, we still apply one-period lags.
6. According to Shephard’s Lemma, factor demand is determined by the first partial derivative of the cost function with respect to the corresponding factor price, regardless of the kind of production function.
34 GLOBAL ECONOMY AND DEVELOPMENT PROGRAM
APPENDIX 1: DATA
Our panel data regression covers the following
30 sub-Saharan African countries over the period
1995-2008: Botswana, Burkina Faso, Cameroon,
the Central African Republic, Chad, Comoros, Cote
d’Ivoire, Eritrea, Ethiopia, Ghana, Guinea, Guinea-
Bissau, Kenya, Lesotho, Madagascar, Malawi,
Mali, Mauritania, Mauritius, Mozambique, Namibia,
Senegal, South Africa, Sudan, Swaziland, Tanzania,
Togo, Uganda, Zambia and Zimbabwe. We identify the
following four natural resource-intensive economies:
Cameroon, Chad, Côte d’Ivoire and Zambia, which we
exclude in some specifications.
We retrieved the following variables from the World
Development Indicators (WDI) Database: gross value
added (constant 2000 U.S. dollars), GDP (constant
2000 U.S. dollars), gross fixed capital formation (con-
stant 2000 U.S. dollars), total employment, exports of
goods and services (constant 2000 U.S. dollars) and
tariffs (mfn, weighted average). We calculated capital
stock applying the perpetual inventory method assum-
ing a depreciation rate of 6 percent. Since initial capital
stock levels were not available, we calculated initial
capital stocks following Hall and Jones (1999).
The calculation of intermediate input prices involved
three steps: (i) We first subtracted a country’s value
added from its GDP (both in current U.S. dollars) to ob-
tain the value of intermediates (in current U.S. dollars).
(ii) Second, we subtracted a country’s value added
from its GDP (both in constant 2000 U.S. dollars) to
obtain the volume of intermediates (in constant 2000
US$); value added and GDP data were obtained from
the WDI Database. (iii) Finally, we obtained intermedi-
ate input prices by dividing the value of intermediates
by the volume of intermediates.
We retrieved data on a country’s wages and salaries
(current LCU) from the African Development Indicators
Database which we converted into U.S. dollars using
official exchange rates (LCU per U.S. dollars, period
average) from the WDI Database. Wages and salaries
consist of all payments in cash to employees in return
for services rendered, before deduction of withholding
taxes and employees contributions to social security
and pension funds. We deflated the wage bill using a
value added deflator which we constructed by divid-
ing a country’s nominal value added by its real value
added (constant 2000 U.S. dollars). Both were ob-
tained from the WDI Database. In order to obtain aver-
age wages per worker, we divided the wage bill by the
number of employees.
We obtained commodity and manufacturing exports
from the U.N. Comtrade Database and deflated these
using an export deflator, which we constructed by
dividing a country’s total nominal exports by its total
real exports (constant 2000 U.S. dollars). Both are re-
trieved from the WDI database. We calculated the HHI
of market and product concentration using detailed
bilateral and sectoral trade data from U.N. Comtrade
based on the HS 1988/92 product classification at the
6-digit product level. We inter- and extrapolated miss-
ing data in order to maintain a sufficient number of
observations.
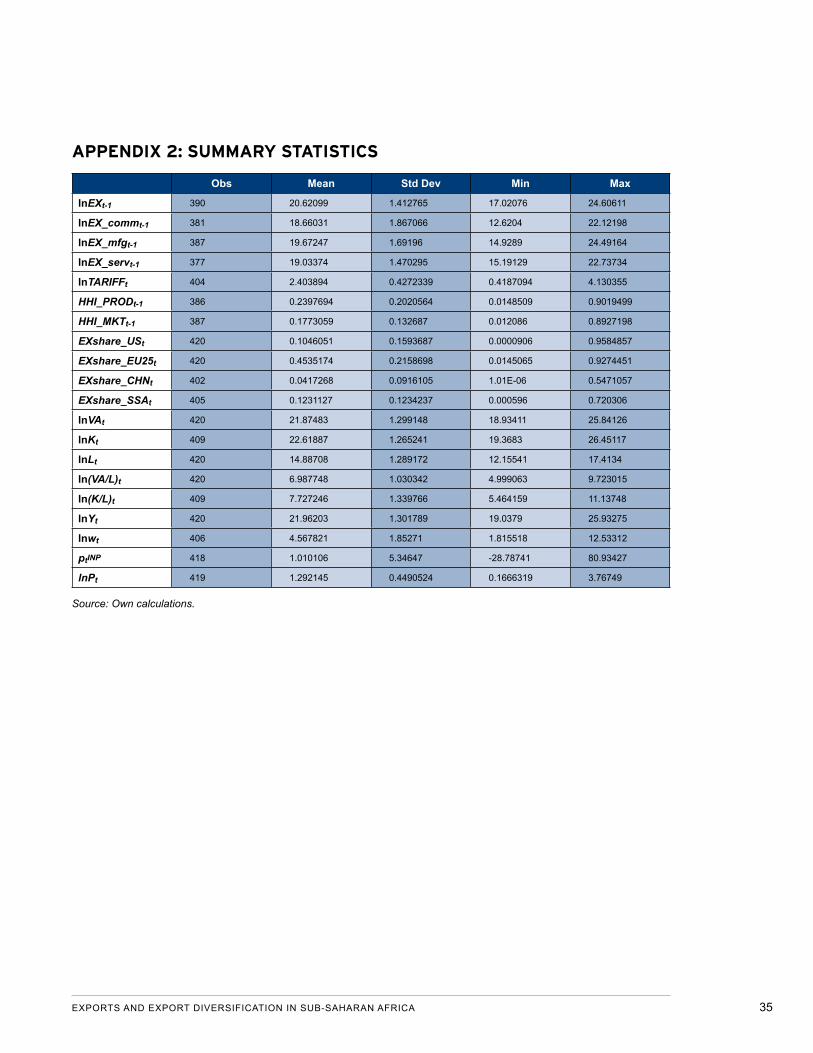
EXPORTS AND EXPORT DIVERSIFICATION IN SUB-SAHARAN AFRICA 35
Obs Mean Std Dev Min Max
lnEXt-1 390 20.62099 1.412765 17.02076 24.60611
lnEX_commt-1 381 18.66031 1.867066 12.6204 22.12198
lnEX_mfgt-1 387 19.67247 1.69196 14.9289 24.49164
lnEX_servt-1 377 19.03374 1.470295 15.19129 22.73734
lnTARIFFt 404 2.403894 0.4272339 0.4187094 4.130355
HHI_PRODt-1 386 0.2397694 0.2020564 0.0148509 0.9019499
HHI_MKTt-1 387 0.1773059 0.132687 0.012086 0.8927198
EXshare_USt 420 0.1046051 0.1593687 0.0000906 0.9584857
EXshare_EU25t 420 0.4535174 0.2158698 0.0145065 0.9274451
EXshare_CHNt 402 0.0417268 0.0916105 1.01E-06 0.5471057
EXshare_SSAt 405 0.1231127 0.1234237 0.000596 0.720306
lnVAt 420 21.87483 1.299148 18.93411 25.84126
lnKt 409 22.61887 1.265241 19.3683 26.45117
lnLt 420 14.88708 1.289172 12.15541 17.4134
ln(VA/L)t 420 6.987748 1.030342 4.999063 9.723015
ln(K/L)t 409 7.727246 1.339766 5.464159 11.13748
lnYt 420 21.96203 1.301789 19.0379 25.93275
lnwt 406 4.567821 1.85271 1.815518 12.53312
ptINP 418 1.010106 5.34647 -28.78741 80.93427
lnPt 419 1.292145 0.4490524 0.1666319 3.76749
APPENDIX 2: SUMMARY STATISTICS
Source: Own calculations.

The views expressed in this working paper do not necessarily reflect the official position of Brookings, its board or the advisory council members.
© 2012 The Brookings Institution
ISSN: 2166-5184 (online) | 2166-5176 (print)
Cover photos courtesy of (left to right): Trevor Samson / World Bank, Hansjoerg Richter, John Hogg / World Bank, Andrew Martin Green, Lorenzo Codacci, Eric Miller / World Bank, Ami Vitale / World Bank
1775 Massachusetts Avenue, NW Washington, DC 20036 202-797-6000 www.brookings.edu/global