export taxes, industrial policy and the value chain in ... · export taxes, industrial policy and...
TRANSCRIPT
Export Taxes, Industrial Policy and the Value
Chain in China After WTO
Jason GarredLondon School of Economics
January 2014
FOR GEP POSTGRADUATE CONFERENCE APPLICATIONPRELIMINARY - PLEASE DO NOT CIRCULATE OR CITE
Abstract
Well-known results in international trade theory suggest that govern-ments may achieve equivalent improvements in their terms of trade viamore than one set of policy instruments. So it is puzzling that importtariffs are usually seen as the main instrument of trade policy worldwide,and that the decline in trade restrictiveness associated with GATT andWTO has not, as far as we know, been followed by substitution towardsother policy instruments not covered by those agreements. In this paper,I carefully document changes in China’s export policies over a ten-yearperiod after its accession to WTO, and find that China’s average exporttax rates increased significantly during this time. This occurred mainlyvia decreases in rates of VAT refunds for exporters, a policy not coveredby WTO rules. However, I find little evidence that the sectoral distri-bution of China’s post-WTO export tax rises is consistent with terms-of-trade concerns. Instead, both empirical evidence and statements frompolicymakers suggest the presence of ongoing industrial policy favouringdownstream industries: China’s export tax increases are concentrated inindustries where its WTO-induced import tariff cuts were smallest, and asubstantial part of this relationship is explained by relatively larger cutsto tariffs on processed goods being followed by relatively larger rises inexport taxes on raw materials. I thus suggest a simple theory of unilateraltrade policy in the context of a two-stage value chain in which policymak-ers’ aim is to move domestic factors into downstream sectors at minimumshort-run cost to real income. In this model, an import tariff on processedgoods is the preferred policy, while an export tax on raw materials, if fea-sible, may achieve the same goal but with inferior terms-of-trade effects.
1 Introduction
It is a longstanding result in the theory of international trade that a given out-come desired by a government may be achieved through more than one set of
1
policy instruments. Textbooks often introduce students to the theory of tradepolicy by showing that either a unilateral import tariff or a unilateral export taxmay improve domestic welfare by raising the world price of a country’s exportsrelative to its imports. Yet it is import tariffs rather than export taxes thatare generally acknowledged to be the key instruments of real-world trade policy.Moreover, although the international negotiations associated with the GeneralAgreement on Tariffs and Trade (GATT) and the World Trade Organization(WTO) are credited with decreasing the restrictiveness of trade policy world-wide, mainly via large reductions in average import tariffs, these agreementsdo not cover all possible instruments of trade policy. If these agreements leaveroom for such policies to be continued via other instruments, is there a reasonwhy governments do not substitute towards these, or have we simply failed toobserve such substitution in practice?
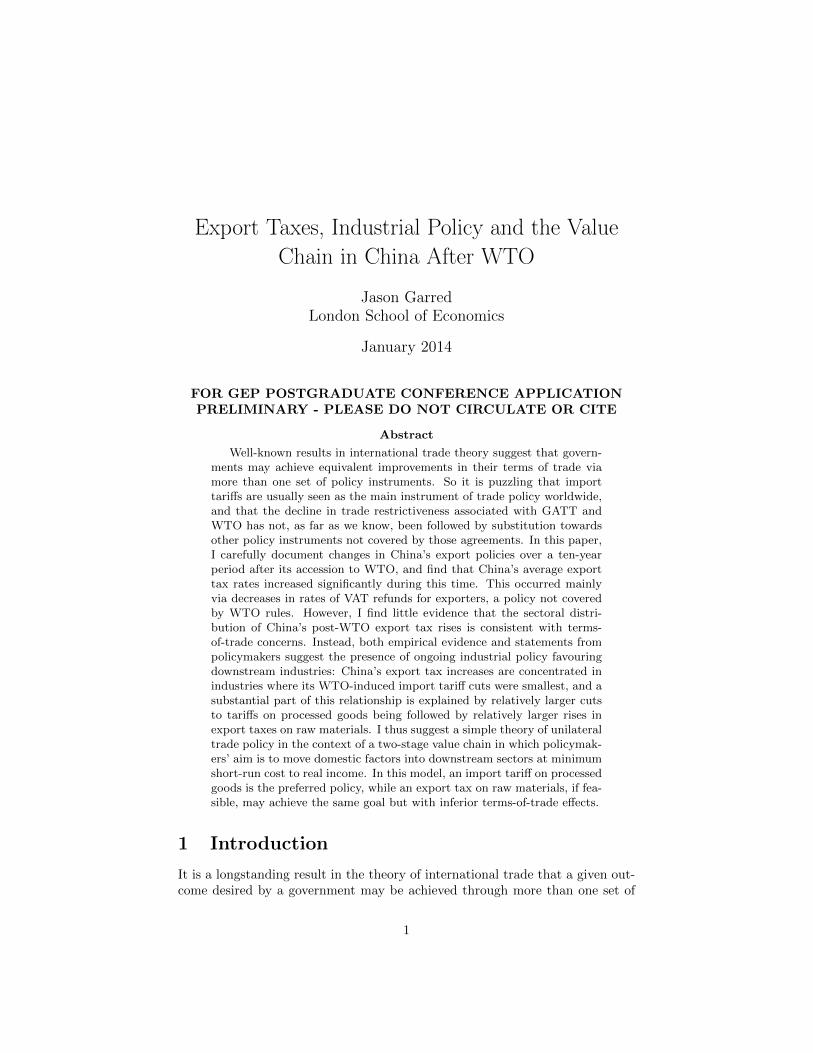
Figure 1: Mean product-level nonagricultural export taxes 2002-2011 and im-port tariffs 1999-2011
In this paper, I examine some of the trade policies imposed by a large recententrant into WTO – China – after its December 2001 accession, which was as-sociated with a decline in import tariffs to internationally agreed (bound) rates.I find that in the decade after its WTO entry, several of China’s export poli-cies have seen significant changes, including, among others, two policies whichmay be readily aggregated into a single measure of export tax rates: the rateat which value-added tax (VAT) was rebated to exporters, and duties chargedon exports. Figure 1 shows the evolution of China’s average nonagricultural
2
export taxes across industries by this measure starting in 2002: while importtariffs fell towards their bound levels, export taxes rose by an average of 7%across industries between 2002 and 2011. This was mostly due to changes inVAT rebate policy, an instrument not covered by GATT/WTO.1
The imposition of export taxes after import tariffs are removed appears con-sistent with theoretical results in the optimal trade policy literature. In a recentcontribution, Costinot et al. (2013) have characterized the set of unilateral op-timal trade policies in a two-country, multi-sector Ricardian framework, findingthat domestic real income may be maximized with, among other policies, a uni-form positive tariff accompanied by export subsidies or a set of export taxesalong with zero barriers to imports.2 The emergence of export taxes thus seemsto be a natural response to the cuts in import tariffs and prohibition of exportsubsidies required as a condition of WTO accession, due to these terms-of-tradeconsiderations.
However, statements from policymakers about China’s post-WTO exportpolicies do not appear to focus on their effects on the terms of trade. They in-stead tend to suggest that these policies were set with industrial policy in mind,and in particular by a desire to ‘move up the value chain’ – i.e. to stimulateprocessed goods industries using export restrictions on their raw materials:3
China’s industrial strategy is to leverage and exploit the differencesin the international and domestic markets for raw materials anddownstream, processed products, using restraints on exports as thelinchpin. – US government submission to China - raw materialsWTO dispute (WTO 2011)
Resource-rich regions all want to expand into the more-profitabledownstream processing sectors instead of just supplying the rawmaterials, said a government official with Baotou city in the InnerMongolia Autonomous Region, one of China’s major mining centers.– Wall Street Journal, August 2010
We are certainly not focusing on the short-term benefits of raisingthe rare earth price. Our wish is for Baotou in Inner Mongolia tobecome the world’s ‘Rare Earths Valley’, the world’s rare earths in-dustrial base. – Zhao Shuanglian, Vice Chairman of Inner Mongolia,September 2009 (china.com.cn 2009)
Below, I attempt to understand the determinants of the post-WTO growthin China’s export taxes by testing both the terms-of-trade and industrial policy
1China has argued that its export duties are also consistent with its GATT/WTO commit-ments, but this has been challenged by the US and EU using the WTO’s dispute settlementmechanism; see Section 2.1 below for a full discussion.
2Lerner (1936) demonstrates the symmetry between an import tariff and an export tax ina two-sector model.
3While this characterization emphasizes the intended encouragement of a particular set ofindustries, the policies are also often portrayed using an alternative industry-level rationale:the discouragement of ‘highly polluting, energy-intensive’ industries.
3
hypotheses using variation in export tax growth across products and industries.First, while standard models of optimal trade policy would suggest that China’sexport tax rates should increase in China’s market power, I find little evidencethat rises in export taxes between 2002 and 2011 were correlated with either oftwo product-level proxies of market power: the market share of Chinese goodsin total world trade and the import demand elasticities of its largest tradingpartner during the period, the United States.
However, the data does provide evidence for the claim that China’s tradepolicy has been driven by ongoing industrial policy preferences, as I find thatgrowth in export taxes after WTO accession was significantly larger in indus-tries that experienced smaller WTO-induced decreases in import tariffs. Inother words, the largest increases in support via trade policy (in the form ofsmaller export taxes, and thus relatively larger export subsidies) were affordedto industries that had experienced the largest falls in such support due to thetariff cuts associated with WTO accession.
Using several different definitions of ‘raw materials’, I also confirm that in-creases in export taxes in China have been significantly larger for raw materialsindustries than for industries producing processed goods. I then show that thisrelationship accounts for a large part of the correlation between rises in exporttaxes and WTO-induced declines in import tariffs. Thus, while the extent of‘tariff escalation’ – larger tariffs on processed goods than on raw materials –in China’s tariff schedule declined as a result of WTO accession, this has sincebeen replaced with rising gaps between export taxes on these two stages ofproduction.
Having established these stylized facts about China’s policies, I suggest asimple theory of unilateral trade policy when industrial policy preferences fordownstream goods are the primary motivation for conducting trade policy. Inparticular, I model a two-stage value chain in which the aim of policymakers isto move a fixed proportion of domestic factors into downstream sectors, but thepolicy by which this is accomplished is chosen according to a standard staticreal income maximization problem. Of the four simple trade policies considered– an import tariff or export subsidy on downstream sectors, or an export taxor import subsidy on raw materials – I show that in a two-country symmetricframework, an import tariff on downstream goods is strictly preferred. This isbecause although the import tariff is one of two policies that improve domesticterms-of-trade, the other such policy – the export tax on raw materials – has twokey disadvantages: its effects on raw materials prices are partly passed throughto domestic consumers via imports of foreign goods, and it leads to inefficientchanges in the global allocation of factors across the two stages of production.
I then briefly explore the relevance of this theory for trade policy outsideChina, noting that the observed import tariff and export tax policies of othercountries are also consistent with a preference for downstream sectors. However,few countries share the land endowments and capital stock that have madeChina a leading producer of a wide range of raw materials, suggesting a possibleexplanation for the apparent rarity of export taxes in practice: an unwillingnessto shift production away from desirable downstream sectors, along with the
4
inability of many countries to use taxes on exports of raw materials in order tostimulate them.
This paper contributes to the wider trade policy literature on several dimen-sions. First, it forms part of an active empirical literature on the determinants oftrade policy. Some of this literature has focused on the compatibility of observedtrade policies with theories in which welfare gains occur via improvements incountries’ terms of trade. These studies have used data on such policy instru-ments as noncooperative tariffs (Broda, Limao and Weinstein 2008), cooperativetariffs (Bagwell and Staiger 2011) and antidumping tariffs (Bown and Crowley2013); one innovation of this paper is to conduct such a test using variation inexport taxes rather than import policies. The paper also informs another branchof this literature that considers the relative importance of terms-of-trade con-siderations and industry-level determinants, usually political-economy factors,in trade policymaking (e.g. Goldberg and Maggi 1999).
The paper also relates to the literature exploring the symmetry betweendifferent trade policy instruments. Lerner’s (1936) two-sector study of symmetrybetween export taxes and import tariffs has been extended to various morecomplex contexts; like this paper, McKinnon (1966) explores the topic in amodel with intermediate goods. Few papers have attempted to reconcile thissymmetry with the relative rarity with which export taxes are observed, thoughEthier (2004, 2007) has twice made theoretical contributions to this question.
Empirical studies of export taxes are relatively rare, partly because of thescarcity of export tax data; both the dataset and the empirics in this paper thusserve as contributions to the trade policy literature in this sense. An importantrecent dataset has been compiled by Solleder (2013), who identifies 111 countriesimposing export taxes and compiles product-level panel data on export tax ratesfrom twenty of these. Although Solleder’s dataset of tax rates includes China, itincorporates only China’s export duties and not its VAT rebate or other exportpolicies. The OECD has also recently collected data on export restrictions; seeKim (2010) and Fliess and Mard (2012).
As I will discuss below, many researchers have commented on the existenceof ‘tariff escalation’, higher tariffs on processed goods as compared to raw ma-terials. Like this paper, a subset of these studies also discuss the relative exporttax rates of these two stages of production, including Golub and Finger (1979)and Latina, Piermartini and Ruta (2011). Dixit and Grossman (1982) studyoptimal trade policy in the context of multistage production.
Finally, the paper adds to a growing literature on trade policy in China,which has mostly focused on the effects of its recent policy changes rather thantheir determinants. Chandra and Long (2013) calculate the elasticity of Chineseexports to VAT rebate rates, using firm-level data on VAT payments. Khandel-wal, Schott and Wei (2013) examine the impact of the local institutional reformassociated with the removal of externally imposed export quotas on textiles andapparel after the end of the Multifiber Arrangement. Chen and Ravallion (2004)and Brandt et al. (2012) consider the effects of the tariff cuts associated withWTO accession, at the household and firm level respectively.
The remainder of the paper is laid out as follows. Section 2 introduces the
5
two export policies (export VAT rebates and export duties) that will be thepaper’s primary focus, conducts an empirical analysis of their determinants andthen checks whether these two policies have been complemented or offset bychanges in China’s other export policies during this period. Section 3 presentsthe theoretical framework. Section 4 then discusses the real-world relevance ofthe paper’s theoretical findings and draws conclusions.
2 Export taxes in China after WTO
2.1 China’s export tax policies
This section will discuss two types of export policies that have been substantiallyamended in China since 2002: rebates of VAT for exporters and export duties.Both policies vary at the product level; lists of products subject to export dutiesand the corresponding rates are published by China annually along with itsschedule of import tariffs, while the calculation of VAT for exporting firmsdepends on the VAT rebate rates for which their exported products are eligible,which are updated and disseminated on an ad hoc basis. Since the officialrebate rates for many products are lower than the rate of VAT, the latter policyis effectively also an export tax; as noted by Feldstein and Krugman (1990), in asystem where countries charge VAT on imports (as do China and other countrieswith value-added taxes), the nondistortionary policy is for countries to also fullyrebate VAT on exports, so that the total VAT charged on domestically producedand imported goods is equalized within each country.
Although the WTO’s Trade Policy Reviews of China agree that China’s less-than full VAT rebates constitute a “levy on exports” (WTO 2008), such a policydoes not contravene WTO rules. Members of the WTO are restricted fromimposing quantitative restrictions on exports or export subsidies, but neitherVAT rebate policy nor export duties are ruled out by the articles of GATT orWTO agreements. However, use of export duties is in principle restricted forChina, which agreed in its WTO accession agreement to “eliminate all taxesand charges applied to exports” with exceptions only allowed for a set of 84eight-digit goods for which maximum export duty rates were explicitly agreed.When some of China’s export duties were challenged on this basis by the US,EU and Mexico via the WTO’s dispute settlement mechanism, China arguedthat its export duties were covered by Article XX of the GATT, which allowsfor exceptions from GATT rules for measures “relating to the conservation ofexhaustible natural resources” or “necessary to protect human, animal or plantlife or health”.4 The WTO panel for the case rejected this argument in 2011,ruling that the language in China’s accession agreement did not allow for theapplication of GATT Article XX to its export duties.5
4While these were the two exceptions called upon by China in its defense in the China -raw materials dispute, Article XX also allows for several other possible exceptions; see GATT(1947, 1994).
5This aspect of the panel’s ruling was upheld on appeal in 2012. The ruling in a subsequentcase addressing China’s export policies (China - rare earths) had not been publicly released
6
The analysis below will examine the changes in China’s export policies fromthe beginning of 2002, the year following its December 2001 WTO accession,to the beginning of 2011, the year of the WTO panel ruling clarifying China’sineligibility to impose export duties via GATT Article XX. Because both the listof products (and their maximum duties) included in its accession agreement andthe potential for the justification of additional export duties under GATT ArticleXX may have affected the products on which China chose to impose exportduties, I consider both the export taxes jointly implied by both incompleteVAT rebates and export duties, and the export tax equivalent of China’s VATrebate policy alone.
In particular, product-level data on export taxes is generated by using infor-mation on both policies to calculate a single rate of export tax for each product(with and without export duties), using the principle that a product affordeda full VAT rebate and not subject to an export tax has a total export tax rateof zero.6 Product-level data on export duties is sourced directly from the rele-vant official annual notices, while product-level data on VAT rates and exportrebate rates is based on the archive of official export VAT refund schedules pub-licly available at www.taxrefund.com.cn (a privately run web site), and checkedagainst information from ad hoc official notices.
The raw data uses a ten-digit (or sometimes eight-digit) Chinese productclassification based on the international six-digit Harmonized System (HS) clas-sification. I create a panel dataset at the six-digit level by taking simple averagesof these taxes, first at the eight-digit and then at the six-digit level, and thenusing correlation tables available from the United Nations Statistics Divisionweb site to concord products across the various versions of the HS classification.I then define taxes at the annual level using the rates effective on January 1 ofeach year. Finally, for many applications, I average these six-digit taxes at thelevel of the four-digit industry as defined by the Chinese industrial classification.The analysis is conducted only for nonagricultural sectors, where the distinc-tion between ‘raw materials’ and ‘processed goods’ is clearest, as I will discussin section 2.2.3 below.7 After concordances of industry and product definitionsand omission of agricultural goods, 239 four-digit industries and 3831 six-digitproducts remain.
Figure 1 (in the introduction) summarizes how China’s nonagricultural ex-port taxes, averaged across four-digit industries, changed from 2002 to 2011.Much of the growth in export taxes during this time was driven by falls in VATrebate rates, the first major reform of which took effect at the beginning of2004. Several subsequent reforms to VAT rebates steadily increased the averageeffective export tax rate, with a short-run peak in the late 2000s. The number
as of this writing.6A full explanation of this calculation may be found in Appendix 1.7In particular, I omit all goods covered by the WTO’s agreement on agriculture, which
includes both primary agricultural products and processed agricultural goods such as food,beverages and tobacco products. I also omit fisheries and their products, which are mostlyfound within the food and beverages sectors, as well as key inputs to agriculture (fertilizersand pesticides).
7
of four-digit nonagricultural industries (six-digit products) with an export taxequivalent via VAT rebate policy of 5% of more rose from 7 (65) in 2002 to121 (1542) in 2011. The maximum export tax achieved using incomplete VATrebates is 17%, China’s standard industrial VAT rate; as of 2011, 693 productsacross 82 industries were subject to this maximum export tax, including 40industries for which all products fell in this category.
China’s export duties have affected a relatively narrower set of products andindustries, with only 188 six-digit products across 44 industries subject to anonzero export duty in 2011. The incidence of export duties rose quickly from2005 to 2008; while export duties applied to only 24 six-digit nonagriculturalproducts across 11 industries in 2005, this had grown to 229 products in 45industries as of the beginning of 2008.8 From 2008 to 2011, export duties wereimposed only on goods that were also assigned VAT rebate rates of zero, andthus had already reached the maximum export tax possible via VAT rebatepolicy.
2.2 Determinants of China’s export taxes
In this section, three stylized facts are presented about the export taxes adoptedin China between 2002 and 2011. First, I find little evidence that rises inexport taxes over this period are related to Chinese market power, as definedby either its world share in export markets or the import demand elasticity ofits largest trading partner, the United States. Second, growth in export taxes issignificantly larger in industries which experienced smaller tariff cuts associatedwith WTO accession. Third, rises in export taxes are systematically larger forraw materials industries as compared to industries producing processed goods.I show that this third phenomenon accounts for a large part of the second:much of the correlation between rises in export taxes and falls in import tariffsis due to shrinking gaps in tariffs between raw materials and processed goodsbeing replaced with rising gaps between export taxes on these two stages ofproduction.
2.2.1 Terms-of-trade and export taxes
I first test the hypothesis that China’s export taxes are set in line with terms-of-trade incentives. In its simplest form, this hypothesis is based on a monopolyargument: if there are multiple Chinese firms competing in a given sector, Chinabenefits from raising the price of these firms’ exports to the level that wouldbe set by those firms if they could successfully form a cartel. The textbooktwo-country partial-equilibrium treatment of export taxes under assumptions ofperfect competition thus suggests that in a sector for which import demand forChina’s goods is less than infinitely elastic, China gains from imposing an exporttax, and that the optimal export tax is an inverse function of its trading partner’s
8As noted above, this analysis does not include agricultural goods and their inputs, someof which were also subject to export duties during this period; many of the highest rates wereapplied to fertilizers.
8
import demand elasticity. In a recent paper, Costinot et al. (2013) extendthis standard result to multiple sectors within a Ricardian general-equilibriumframework, and find that optimal export taxes should weakly increase with acountry’s comparative advantage, with the optimal average level of taxes (orsubsidies) depending on the level of import tariffs. Again, the key finding isthat optimal export taxes are higher in sectors in which the country’s marketpower is larger.
Two measures of market power are used here. I first use world trade data for2002 and 2003 – i.e. after China joined the WTO but before the first increasein its export taxes – to calculate the average market share of Chinese exportsin world trade. In particular, for each year, the value of Chinese exports ineach product category is calculated and divided by the total value of worldtrade in that product, and the resulting shares are then averaged across the twoyears.9 This measure makes clear that China is a large country in the worldtrading system: across six-digit HS products, the value of the 25th, 50th and75th percentile of the share of Chinese exports in world trade is 1.4%, 4.6% and14.2% respectively.
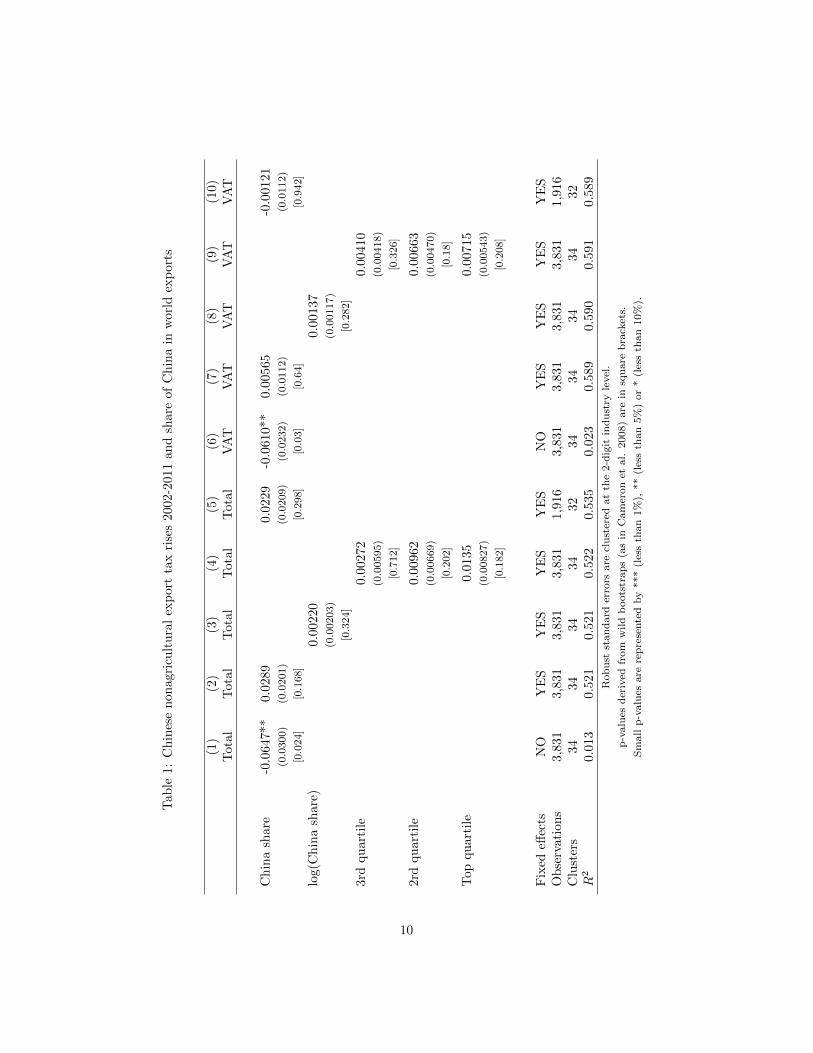
A second measure is provided by a product-level dataset of estimated tradeelasticities for the United States, the largest importer of Chinese goods dur-ing this period, from Broda and Weinstein (2006). Their paper uses a Krugman(1980) framework, assuming a constant elasticity of substitution across varietiesof each traded product, where varieties are defined at the product-country level.Within the theory, lower product-level elasticities imply less willingness by USconsumers to substitute away from Chinese varieties to those from other coun-tries, and thus, other things equal, higher Chinese market power. Using data onUS imports from 1990 to 2001, Broda and Weinstein calculate these elasticitiesat several different levels of aggregation; I use data at the five-digit level of theSITC classification, which provides the closest match in level of aggregation tosix-digit HS product codes.10
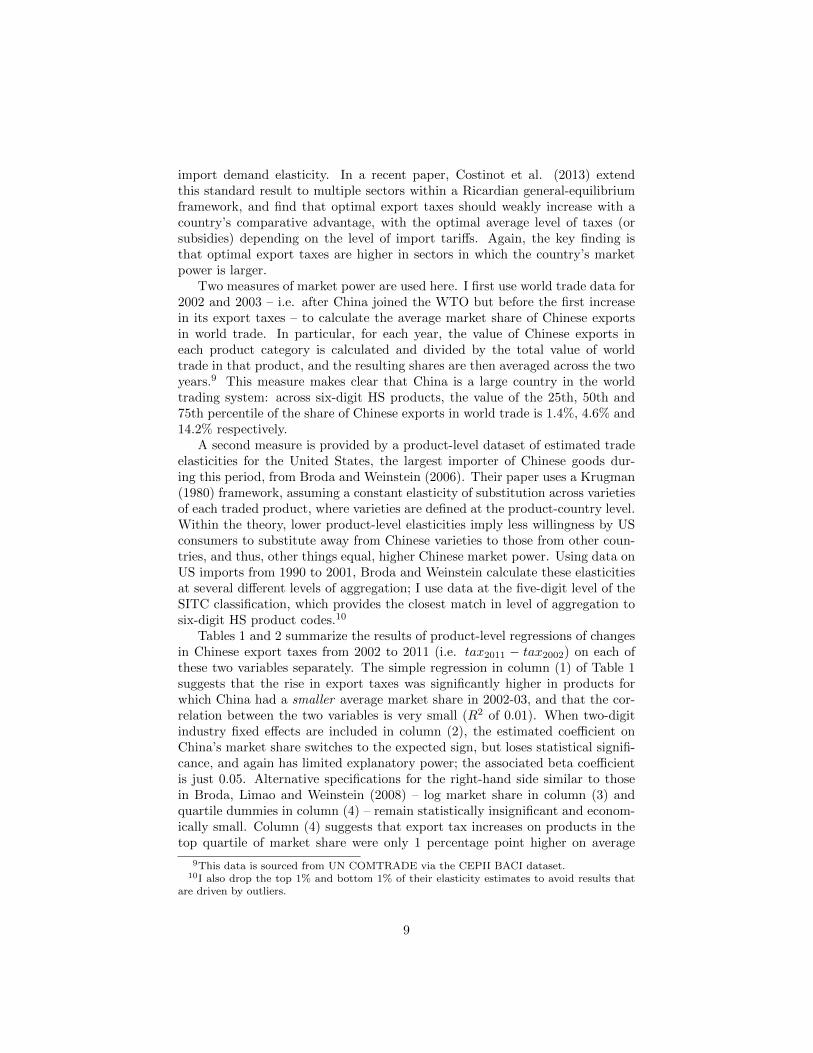
Tables 1 and 2 summarize the results of product-level regressions of changesin Chinese export taxes from 2002 to 2011 (i.e. tax2011 − tax2002) on each ofthese two variables separately. The simple regression in column (1) of Table 1suggests that the rise in export taxes was significantly higher in products forwhich China had a smaller average market share in 2002-03, and that the cor-relation between the two variables is very small (R2 of 0.01). When two-digitindustry fixed effects are included in column (2), the estimated coefficient onChina’s market share switches to the expected sign, but loses statistical signifi-cance, and again has limited explanatory power; the associated beta coefficientis just 0.05. Alternative specifications for the right-hand side similar to thosein Broda, Limao and Weinstein (2008) – log market share in column (3) andquartile dummies in column (4) – remain statistically insignificant and econom-ically small. Column (4) suggests that export tax increases on products in thetop quartile of market share were only 1 percentage point higher on average
9This data is sourced from UN COMTRADE via the CEPII BACI dataset.10I also drop the top 1% and bottom 1% of their elasticity estimates to avoid results that
are driven by outliers.
9
Tab
le1:
Ch
ines
en
onagr
icu
ltu
ral
exp
ort
tax
rise
s2002-2
011
an
dsh
are
of
Ch
ina
inw
orl
dex
port
s
(1)
(2)
(3)
(4)
(5)
(6)
(7)
(8)
(9)
(10)
Tot
alT
otal
Tot
al
Tota
lT
ota
lV
AT
VA
TV
AT
VA
TV
AT
Ch
ina
shar
e-0
.064
7**
0.02
890.0
229
-0.0
610**
0.0
0565
-0.0
0121
(0.0
300)
(0.0
201)
(0.0
209)
(0.0
232)
(0.0
112)
(0.0
112)
[0.0
24]
[0.1
68]
[0.2
98]
[0.0
3]
[0.6
4]
[0.9
42]
log(
Ch
ina
shar
e)0.
00220
0.0
0137
(0.0
0203)
(0.0
0117)
[0.3
24]
[0.2
82]
3rd
qu
arti
le0.0
0272
0.0
0410
(0.0
0595)
(0.0
0418)
[0.7
12]
[0.3
26]
2rd
qu
arti
le0.0
0962
0.0
0663
(0.0
0669)
(0.0
0470)
[0.2
02]
[0.1
8]
Top
qu
arti
le0.0
135
0.0
0715
(0.0
0827)
(0.0
0543)
[0.1
82]
[0.2
08]
Fix
edeff
ects
NO
YE
SY
ES
YE
SY
ES
NO
YE
SY
ES
YE
SY
ES
Ob
serv
atio
ns
3,83
13,
831
3,83
13,8
31
1,9
16
3,8
31
3,8
31
3,8
31
3,8
31
1,9
16
Clu
ster
s34
3434
34
32
34
34
34
34
32
R2
0.01
30.
521
0.52
10.5
22
0.5
35
0.0
23
0.5
89
0.5
90
0.5
91
0.5
89
Rob
ust
stan
dard
erro
rsare
clu
ster
edat
the
2-d
igit
ind
ust
ryle
vel
.
p-v
alu
esd
eriv
edfr
om
wild
boots
trap
s(a
sin
Cam
eron
etal.
2008)
are
insq
uare
bra
cket
s.
Sm
all
p-v
alu
esare
rep
rese
nte
dby
***
(les
sth
an
1%
),**
(les
sth
an
5%
)or
*(l
ess
than
10%
).
10
than those in the bottom quartile, and that this difference is not statisticallysignificant.
If the Ricardian model inspiring this specification is taken seriously, thecorrect approach is to study taxes only on net export products, since only exporttaxes on these goods will be effective in practice. Column (5) thus drops allsix-digit goods for which China’s trade balance was negative in either 2002 or2003, but this results in little change in the estimated coefficient. Also, asdiscussed above, although China imposed export duties in this period that wentbeyond those allowed by its accession agreement, its flexibility in doing so mighthave been constrained by its perceived ability to defend these taxes within theGATT/WTO rules. I thus run the regressions in columns (1) through (5) againusing only the export taxes implied by variation across products in VAT exportrebates; the results are similar to those in columns (1) to (5).
In Table 2, tax changes are regressed on the US elasticities of substitutionfrom Broda and Weinstein (2006) at the five-digit SITC level. Column (1) showsthat export taxes increased by more on products with lower inverse elasticities,again the opposite sign from that implied by the terms-of-trade hypothesis,though the result is not statistically significant. This time, however, addingfixed effects (now at the two-digit SITC product level) does not reverse the signof the estimated coefficient, nor do the alternative specifications in columns (3)and (4) or limitation to VAT policy in columns (5) through (8).
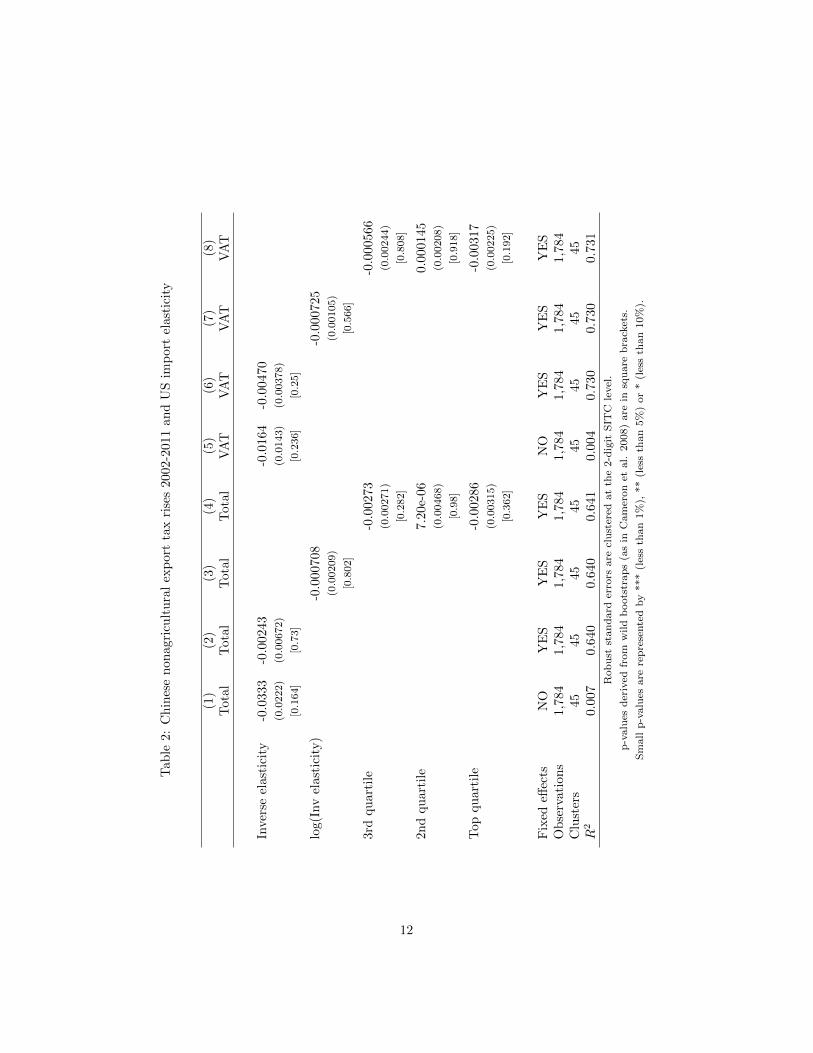
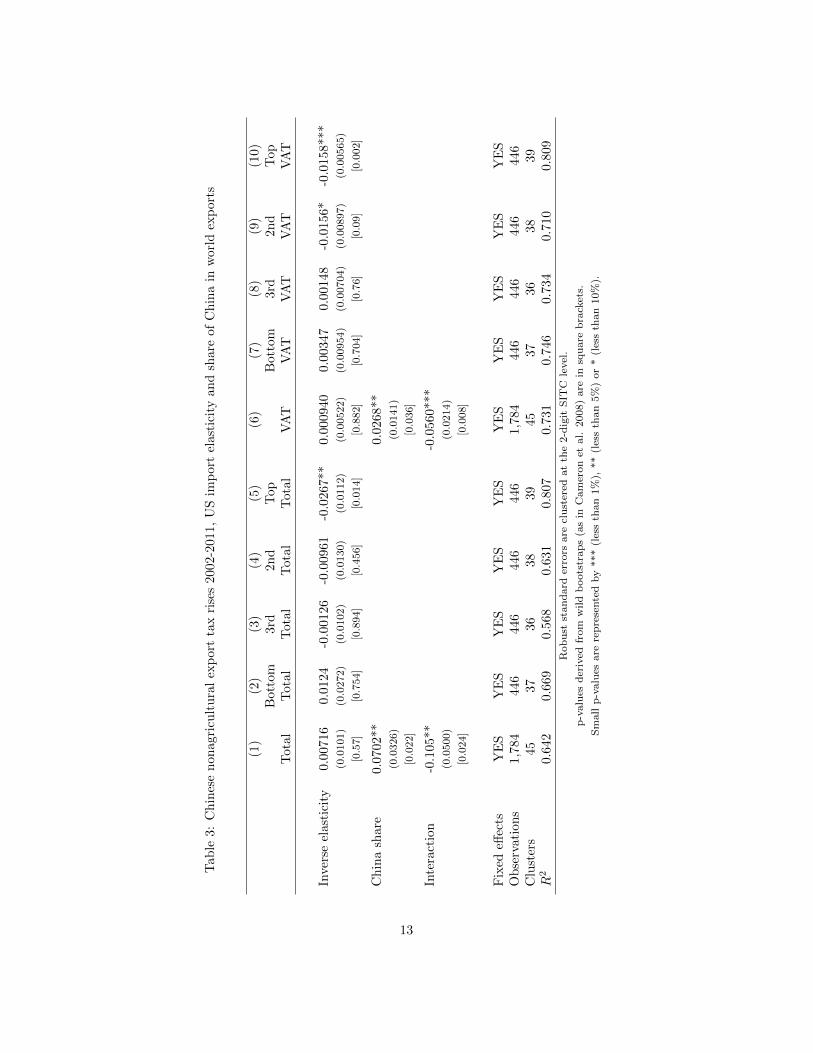
Columns (1) and (6) of Table 3 display the results of a regression with aninteraction of the two variables, again with two-digit SITC product fixed ef-fects. This shows that export tax rises actually do increase in China’s share ofworld trade for goods perceived by US consumers as relatively homogeneous,but that this relationship declines as substitutability between varieties becomeslower. This might be because increases in export taxes are relatively high forall differentiated goods within a given industry (in which even a small countrymay wield market power; see Gros (1987) for the case of optimal import tariffs)but only for homogeneous goods in which China has a large market share. Theregression in column (2) of Table 2 is thus rerun for each quartile of the distri-bution of Chinese market share across products, in columns (2) to (5) for totalexport taxes and (7) to (10) for export taxes via VAT policy only. These resultsinstead suggest that the finding in columns (1) and (6) is driven by the top endof the distribution of products by market share; among products in which Chinahad a large market share in 2002 and 2003, more homogeneous products (fromthe perspective of US consumers) experienced relatively larger increases in ex-port taxes between 2002 and 2011 than more differentiated products. Whilethis result may appear puzzling from the perspective of the terms-of-trade hy-pothesis, it will be discussed further in Section 4 in light of the other stylizedfacts presented below.
2.2.2 Import tariff cuts and export taxes
The quotes in the introduction, emphasizing the support for particular industriesprovided by China’s export policies rather than their effects on terms of trade,
11
Tab
le2:
Ch
ines
en
onag
ricu
ltu
ral
exp
ort
tax
rise
s2002-2
011
an
dU
Sim
port
elast
icit
y
(1)
(2)
(3)
(4)
(5)
(6)
(7)
(8)
Tot
alT
otal
Tota
lT
ota
lV
AT
VA
TV
AT
VA
T
Inve
rse
elas
tici
ty-0
.033
3-0
.002
43-0
.0164
-0.0
0470
(0.0
222)
(0.0
0672)
(0.0
143)
(0.0
0378)
[0.1
64]
[0.7
3]
[0.2
36]
[0.2
5]
log(
Inv
elas
tici
ty)
-0.0
00708
-0.0
00725
(0.0
0209)
(0.0
0105)
[0.8
02]
[0.5
66]
3rd
qu
arti
le-0
.00273
-0.0
00566
(0.0
0271)
(0.0
0244)
[0.2
82]
[0.8
08]
2nd
qu
arti
le7.2
0e-
06
0.0
00145
(0.0
0468)
(0.0
0208)
[0.9
8]
[0.9
18]
Top
qu
arti
le-0
.00286
-0.0
0317
(0.0
0315)
(0.0
0225)
[0.3
62]
[0.1
92]
Fix
edeff
ects
NO
YE
SY
ES
YE
SN
OY
ES
YE
SY
ES
Ob
serv
atio
ns
1,78
41,
784
1,7
84
1,7
84
1,7
84
1,7
84
1,7
84
1,7
84
Clu
ster
s45
4545
45
45
45
45
45
R2
0.00
70.
640
0.6
40
0.6
41
0.0
04
0.7
30
0.7
30
0.7
31
Rob
ust
stan
dard
erro
rsare
clu
ster
edat
the
2-d
igit
SIT
Cle
vel
.
p-v
alu
esd
eriv
edfr
om
wild
boots
trap
s(a
sin
Cam
eron
etal.
2008)
are
insq
uare
bra
cket
s.
Sm
all
p-v
alu
esare
rep
rese
nte
dby
***
(les
sth
an
1%
),**
(les
sth
an
5%
)or
*(l
ess
than
10%
).
12
Tab
le3:
Ch
ines
en
onag
ricu
ltu
ral
exp
ort
tax
rise
s2002-2
011,
US
imp
ort
elast
icit
yan
dsh
are
of
Ch
ina
inw
orl
dex
port
s
(1)
(2)
(3)
(4)
(5)
(6)
(7)
(8)
(9)
(10)
Bot
tom
3rd
2n
dT
op
Bott
om
3rd
2n
dT
op
Tot
alT
otal
Tot
al
Tota
lT
ota
lV
AT
VA
TV
AT
VA
TV
AT
Inve
rse
elas
tici
ty0.
0071
60.
0124
-0.0
0126
-0.0
0961
-0.0
267**
0.0
00940
0.00347
0.0
0148
-0.0
156*
-0.0
158***
(0.0
101)
(0.0
272)
(0.0
102)
(0.0
130)
(0.0
112)
(0.0
0522)
(0.0
0954)
(0.0
0704)
(0.0
0897)
(0.0
0565)
[0.5
7]
[0.7
54]
[0.8
94]
[0.4
56]
[0.0
14]
[0.8
82]
[0.7
04]
[0.7
6]
[0.0
9]
[0.0
02]
Ch
ina
shar
e0.
0702
**0.0
268**
(0.0
326)
(0.0
141)
[0.0
22]
[0.0
36]
Inte
ract
ion
-0.1
05**
-0.0
560***
(0.0
500)
(0.0
214)
[0.0
24]
[0.0
08]
Fix
edeff
ects
YE
SY
ES
YE
SY
ES
YE
SY
ES
YE
SY
ES
YE
SY
ES
Ob
serv
atio
ns
1,78
444
644
6446
446
1,7
84
446
446
446
446
Clu
ster
s45
3736
38
39
45
37
36
38
39
R2
0.64
20.
669
0.56
80.6
31
0.8
07
0.7
31
0.7
46
0.7
34
0.7
10
0.8
09
Rob
ust
stan
dard
erro
rsare
clu
ster
edat
the
2-d
igit
SIT
Cle
vel
.
p-v
alu
esd
eriv
edfr
om
wild
boots
trap
s(a
sin
Cam
eron
etal.
2008)
are
insq
uare
bra
cket
s.
Sm
all
p-v
alu
esare
rep
rese
nte
dby
***
(les
sth
an
1%
),**
(les
sth
an
5%
)or
*(l
ess
than
10%
).
13
imply that the post-WTO growth in Chinese export taxes may instead haveresulted from the desire to use trade policy to stimulate a chosen subset ofindustries. Indeed, much of the variation in export tax growth during thisperiod occurred at the industry level; a regression of tax changes on a full setof four-digit industry dummies results in an adjusted R2 of 0.73. This suggestsa testable hypothesis: if the Chinese government intended its trade policy tosupport the same set of industries after its WTO entry as before, then one wouldexpect that the industries whose protection via import tariffs saw the largestdecline due to WTO entry would be those with the largest relative rise in ratesof export subsidy (i.e. the smallest rise in export taxes) afterwards.
This hypothesis is examined in Table 3, again with the change in exporttaxes from 2002 to 2011 as the dependent variable. On the right-hand side,the variable max{tar1999− tarbound, 0}, where tar1999− tarbound, the differencebetween China’s 1999 applied tariffs and its bound (negotiated) tariffs, is usedas a proxy for the tariff cuts due to China’s WTO entry.11 Because the agreedschedule for implementation of China’s bound tariffs extended from 2000 to 2010(with most tariffs to be reduced to their bound rates by 2005), 1999 representsa year in which China’s tariffs were in principle unconstrained by its WTOagreements, while all of its tariffs should have been reduced to bound levelsbefore 2011.12 Indeed, this variable corresponds almost exactly to the actualdifference between 1999 and 2011 applied tariffs, with a correlation coefficientof 0.97 between the two variables at the six-digit product level.
Table 4 provides evidence in favour of the hypothesis that China’s exporttaxes have been driven by ongoing industrial policy. Column (1) shows thatsix-digit products whose tariffs were reduced by one additional percentage pointfrom their 1999 levels due to WTO accession saw a 0.4 percentage point smallerincrease in export taxes from 2002 to 2011; that is, export tax increases werelarger for products whose tariffs fell by less. When the analysis is conducted atthe industry level by taking simple averages of tariff cuts and tax rises withineach four-digit industry, the estimated coefficient rises in absolute value to al-most 0.9. When only VAT policy is taken into account, the size of each of theseeffects becomes smaller, but the explanatory power of the regression remainsapproximately the same; the values of R2 for these regressions suggest that ap-proximately 20% of variation in changes in export taxes (by either definition)across industries is explained by the tariff cuts associated with WTO accession.
I also consider whether this result is robust to considering export taxes onlyon goods of which China was a net exporter in both 2002 and 2003, and importtariffs only on products for which China was a net importer in each of these
11Product-level panel data on China’s applied tariffs, along with its schedule of boundtariffs, is sourced from WTO Tariff Analysis Online and UNCTAD TRAINS at the eight-digitlevel and averaged at the six-digit level.
12In practice, however, according to Branstetter and Lardy (2008), China’s 1999 tariffswere already an outcome of the process of WTO accession, as China unilaterally liberalizedtariffs starting in the early 1990s “to gain credibility with its negotiating partners that it wasseriously committed to opening up its economy”. Nonetheless, Branstetter and Lardy alsoreport that China agreed to additional commitments in 1999 with the United States thatformed part of its actual WTO accession agreement.
14

Tab
le4:
Ch
ines
en
onag
ricu
ltu
ral
exp
ort
tax
rise
s2002-2
011
an
dta
riff
cuts
ass
oci
ate
dw
ith
WT
Oacc
essi
on
(1)
(2)
(3)
(4)
(5)
(6)
Tot
alT
ota
lT
ota
lV
AT
VA
TV
AT
Tar
iffcu
t-0
.413
***
-0.8
90***
-0.6
01**
-0.3
28**
-0.5
71***
-0.4
65**
(0.1
03)
(0.2
54)
(0.1
88)
(0.0
828)
(0.1
36)
(0.1
41)
[0.0
04]
[0.0
08]
[0.0
22]
[0.0
16]
[0.0
04]
[0.0
16]
Un
itP
rod
uct
Ind
ust
ryIn
du
stry
Pro
du
ctIn
du
stry
Ind
ust
ryO
bse
rvat
ion
s3,
827
239
149
3,8
27
239
149
Clu
ster
s34
34
31
34
34
31
R2
0.13
20.2
16
0.1
82
0.1
64
0.2
30
0.2
17
Rob
ust
stan
dard
erro
rsare
clu
ster
edat
the
two-d
igit
ind
ust
ryle
vel
.
p-v
alu
esd
eriv
edfr
om
wild
boots
trap
s(a
sin
Cam
eron
etal.
2008)
are
insq
uare
bra
cket
s.
Sm
all
p-v
alu
esare
rep
rese
nte
dby
***
(les
sth
an
1%
),**
(les
sth
an
5%
)or
*(l
ess
than
10%
).
15
two years. This still allows for a comparison of the two policies at the industrylevel, but the regression’s two industry-level variables are now generated by twononintersecting sets of six-digit products. As shown in columns (3) and (6) ofTable 4, the results remain statistically significant.
2.2.3 Raw materials and export taxes
A second suggestion provided by the quotes in the introduction about the na-ture of China’s post-WTO trade policy is that it reflects the aim to stimulateindustries producing processed goods via restrictions on exports of raw materi-als. The two recent WTO dispute settlement cases relating to China’s exportrestrictions have both focused entirely on products usually described as ‘rawmaterials’; indeed, the first case was titled “China – Measures Related to theExportation of Various Raw Materials”.13 In this section, I examine the ex-tent to which China’s export taxes were raised on raw materials industries ascompared to industries producing processed goods, and then relate this to therelationship between tax rises and tariff cuts discussed above.
Before conducting an empirical analysis, it is necessary to clearly definewhich industries produce ‘raw materials’ and which industries produce ‘pro-cessed goods’. This amounts to determining a dividing line somewhere in theindustrial value chain turning products of the extractive industries (e.g. logs,ores, or crude oil) into goods for final consumption (e.g. envelopes, machines, orplastic toys). While it might initially seem natural to draw this line immediatelyafter the extractive stage, some manufacturing industries are also producers ofgoods often considered as raw materials (e.g. paper pulp, pig iron, or polymers).Indeed, coke, a manufactured product of coal, was one of the products includedin the China - raw materials WTO dispute. I thus use three perspectives onthe concept of ‘raw materials’ in order to define them below: that they tend tobe homogeneous; used as intermediates by industry; but not yet describable as‘articles’ or their ‘parts’.
The primary definition that will be used in the empirical analysis belowis based mainly on the last of these three perspectives, as embedded in theHarmonized System (HS) classification of traded goods. The headings of manymajor categories of the HS system (e.g. “Plastics and articles thereof”, “Woodand articles of wood”; “Textiles and textile articles”) imply a progression froma particular raw material to articles made from this material, which is thenreflected in the order in which the six-digit HS products are numbered. TheHS-based definition of raw materials used here is thus based on the dividing linebetween the raw material and “articles thereof” within each such section of theHS classification, with other sections classified as entirely constituted of eitherraw materials (e.g. “Ores, slag and ash”) or processed goods (e.g. “Clocks andwatches and parts thereof”).
A second definition is based on the United Nations Broad Economic Cat-egories classification, which categorizes six-digit HS products as consumption
13The other case is titled “China – Measures Related to the Exportation of Rare Earths,Tungsten and Molybdenum”.
16
goods, capital goods or intermediate goods according to the System of NationalAccounts. I define raw materials products as all intermediate products withthe exception of two categories described as “parts and accessories”. As a thirdalternative, I also use the ‘liberal’ measure of homogeneous goods provided byRauch (1999), who identifies a set of SITC products that are either sold on orga-nized exchanges or reference-priced; if a good is in either of these two categories,I classify it as a raw material.
In each case, I define a four-digit industry as a ‘raw materials industry’ ifmore than half of the products associated with that industry fall under the rel-evant definition above. Reassuringly, the three measures are highly correlated:the three correlation coefficients range from 0.58 to 0.70 at the product leveland from 0.60 to 0.73 at the industry level. This means that in line with in-tuition about the industrial value chain, homogeneous goods according to theoften-used classification of Rauch (1999) tend to be intermediates (according toBEC) but not ‘articles’ or their ‘parts’ (according to HS).14
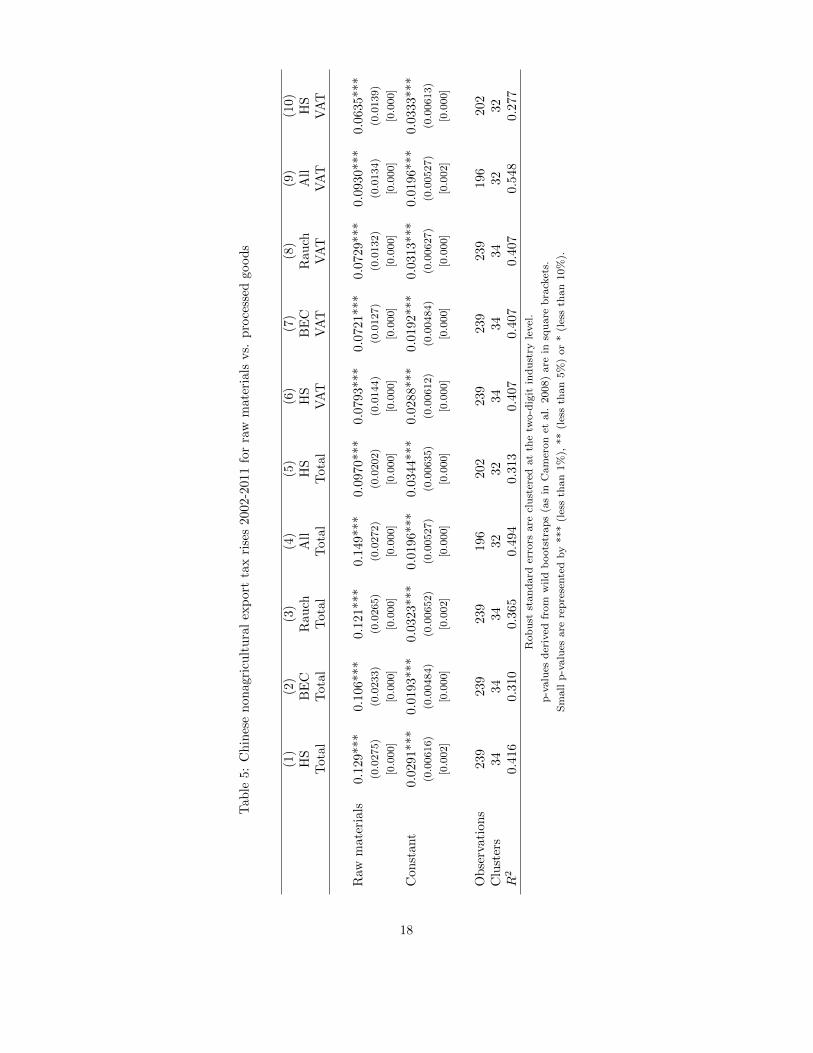
Columns (1) to (3) of Table 5 display the results of regressing averageindustry-level changes in export taxes from 2002 to 2011 on each of the threedummy variables defined above. The results show that the average rise in taxeson processed goods industries was relatively small – around 2 to 3 percentagepoints – while average increases in export taxes on raw materials sectors weresignificantly higher, by at least 10 percentage points. The values of R2 for theseregressions should also be noted; for example, the variable using the HS defini-tion of raw materials accounts for 42% of variation in average export tax risesacross industries.
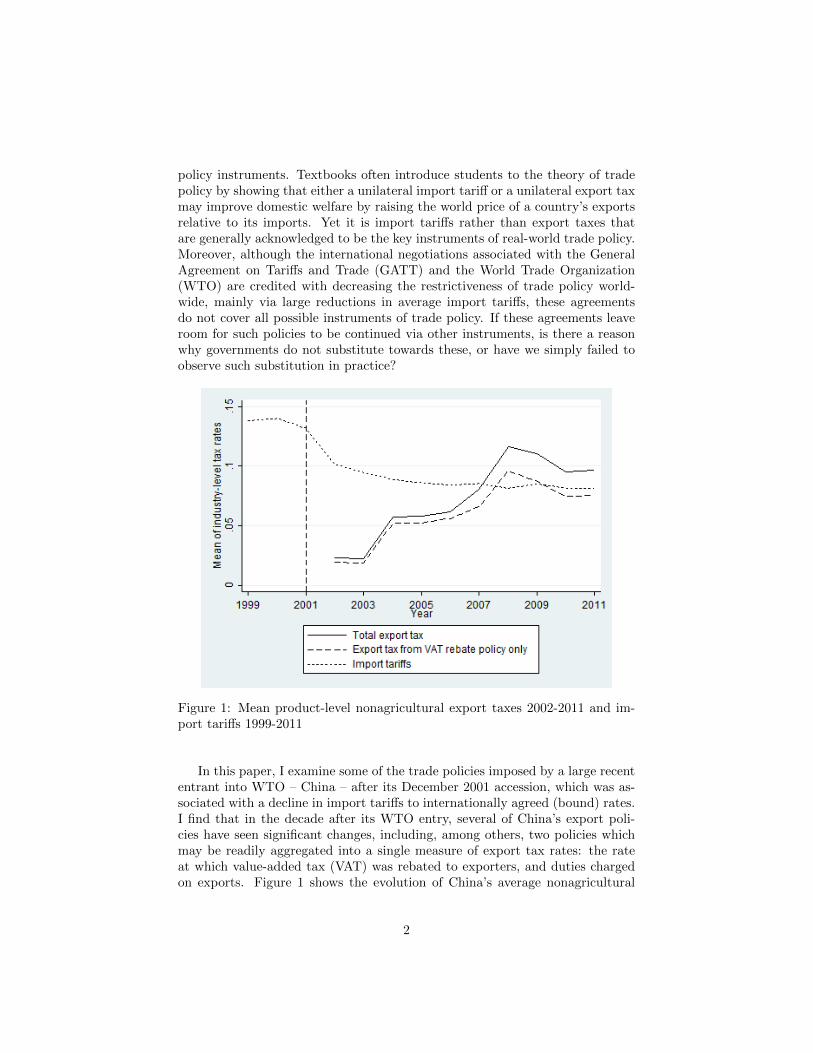
As discussed in section 2.1, one possible reason for this variation in exporttaxes across sectors is that China may have been constrained in its imposition ofexport duties by its accession agreement and the perceived potential to defendits measures through exceptions in Article XX of the GATT (e.g. “conservationof exhaustible natural resources”). However, identical regressions using onlyvariation in VAT rebate policy, whose results are displayed in columns (6) to(8), produce qualitatively similar results. Figure 2 displays a time series ofChina’s average export taxes across industries with and without export duties,using the HS definition of raw materials.
I also run identical regressions in which all products for which the threedefinitions do not all agree are dropped before taxes are averaged at the industrylevel. As shown in columns (4) and (9), including only these ‘unambiguous’observations boosts both the magnitude of the effect – now 15 percentage pointsfor total export taxes and 9 percentage points for VAT policy only – and theregressions’ explanatory power. The baseline regression using the HS definition
14This relationship is much weaker for agricultural products. This is especially true forfood and beverage sectors, in which the ‘raw materials’-‘processed goods’ dichotomy is alsoless intuitively clear: many products of primary industries, such as fruits, vegetables, eggs andmilk, are also often consumed as final goods, and much processing is done in service industries(e.g. restaurants) or as home production. Therefore, as discussed in footnote 7 above, I havenot included agricultural goods in the analysis in this paper. Note that no agricultural goodswere included in the two WTO dispute settlement cases discussed above.
17
Tab
le5:
Ch
ines
en
onag
ricu
ltu
ral
exp
ort
tax
rise
s2002-2
011
for
raw
mate
rials
vs.
pro
cess
edgood
s
(1)
(2)
(3)
(4)
(5)
(6)
(7)
(8)
(9)
(10)
HS
BE
CR
au
chA
llH
SH
SB
EC
Rau
chA
llH
ST
otal
Tot
al
Tota
lT
ota
lT
ota
lV
AT
VA
TV
AT
VA
TV
AT
Raw
mat
eria
ls0.
129*
**0.
106*
**0.
121***
0.1
49***
0.0
970***
0.0
793***
0.0
721***
0.0
729***
0.0
930***
0.0
635***
(0.0
275)
(0.0
233)
(0.0
265)
(0.0
272)
(0.0
202)
(0.0
144)
(0.0
127)
(0.0
132)
(0.0
134)
(0.0
139)
[0.0
00]
[0.0
00]
[0.0
00]
[0.0
00]
[0.0
00]
[0.0
00]
[0.0
00]
[0.0
00]
[0.0
00]
[0.0
00]
Con
stan
t0.
0291
***
0.01
93**
*0.
0323***
0.0
196***
0.0
344***
0.0
288***
0.0
192***
0.0
313***
0.0
196***
0.0
333***
(0.0
0616)
(0.0
0484)
(0.0
0652)
(0.0
0527)
(0.0
0635)
(0.0
0612)
(0.0
0484)
(0.0
0627)
(0.0
0527)
(0.0
0613)
[0.0
02]
[0.0
00]
[0.0
02]
[0.0
00]
[0.0
00]
[0.0
00]
[0.0
00]
[0.0
00]
[0.0
02]
[0.0
00]
Ob
serv
atio
ns
239
239
239
196
202
239
239
239
196
202
Clu
ster
s34
3434
32
32
34
34
34
32
32
R2
0.41
60.
310
0.365
0.4
94
0.3
13
0.4
07
0.4
07
0.4
07
0.5
48
0.2
77
Rob
ust
stan
dard
erro
rsare
clu
ster
edat
the
two-d
igit
ind
ust
ryle
vel
.
p-v
alu
esd
eriv
edfr
om
wild
boots
trap
s(a
sin
Cam
eron
etal.
2008)
are
insq
uare
bra
cket
s.
Sm
all
p-v
alu
esare
rep
rese
nte
dby
***
(les
sth
an
1%
),**
(les
sth
an
5%
)or
*(l
ess
than
10%
).
18
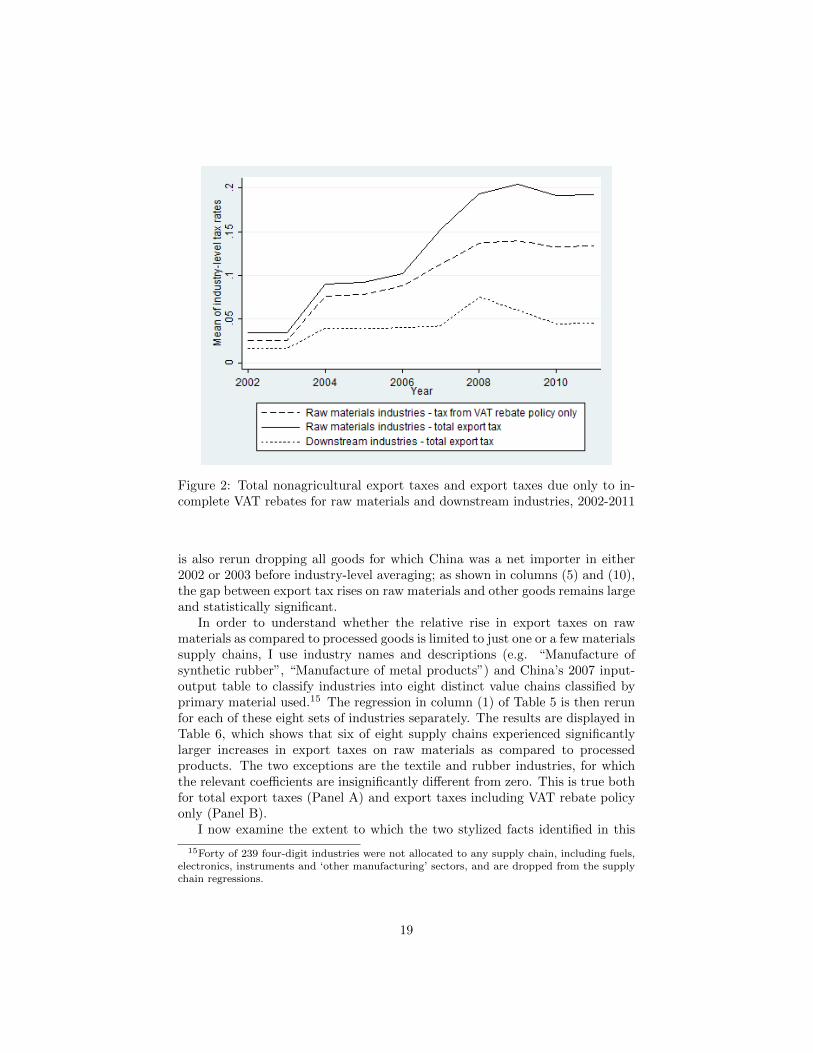
Figure 2: Total nonagricultural export taxes and export taxes due only to in-complete VAT rebates for raw materials and downstream industries, 2002-2011
is also rerun dropping all goods for which China was a net importer in either2002 or 2003 before industry-level averaging; as shown in columns (5) and (10),the gap between export tax rises on raw materials and other goods remains largeand statistically significant.
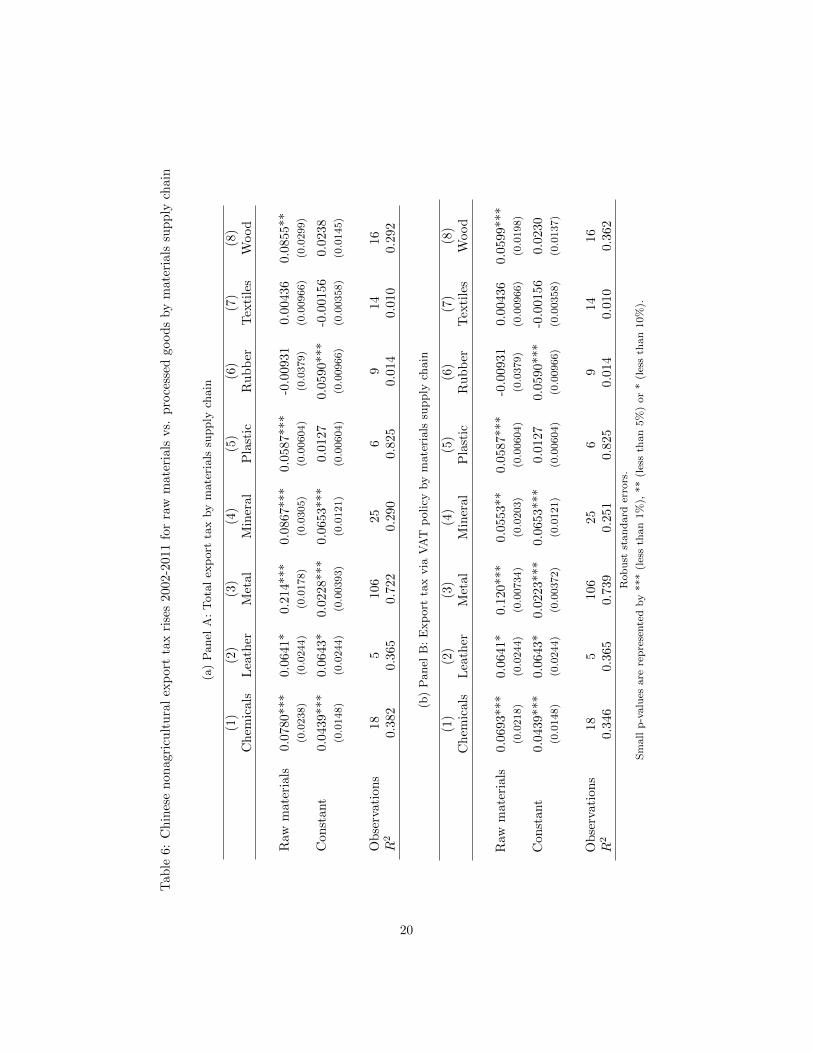
In order to understand whether the relative rise in export taxes on rawmaterials as compared to processed goods is limited to just one or a few materialssupply chains, I use industry names and descriptions (e.g. “Manufacture ofsynthetic rubber”, “Manufacture of metal products”) and China’s 2007 input-output table to classify industries into eight distinct value chains classified byprimary material used.15 The regression in column (1) of Table 5 is then rerunfor each of these eight sets of industries separately. The results are displayed inTable 6, which shows that six of eight supply chains experienced significantlylarger increases in export taxes on raw materials as compared to processedproducts. The two exceptions are the textile and rubber industries, for whichthe relevant coefficients are insignificantly different from zero. This is true bothfor total export taxes (Panel A) and export taxes including VAT rebate policyonly (Panel B).
I now examine the extent to which the two stylized facts identified in this
15Forty of 239 four-digit industries were not allocated to any supply chain, including fuels,electronics, instruments and ‘other manufacturing’ sectors, and are dropped from the supplychain regressions.
19
Tab
le6:
Ch
ines
en
onag
ricu
ltu
ral
exp
ort
tax
rise
s2002-2
011
for
raw
mate
rials
vs.
pro
cess
edgoods
by
mate
rials
sup
ply
chain
(a)
Panel
A:
Tota
lex
port
tax
by
mate
rials
supply
chain
(1)
(2)
(3)
(4)
(5)
(6)
(7)
(8)
Ch
emic
als
Lea
ther
Met
al
Min
eral
Pla
stic
Ru
bb
erT
exti
les
Wood
Raw
mat
eria
ls0.
0780
***
0.06
41*
0.2
14***
0.0
867***
0.0
587***
-0.0
0931
0.0
0436
0.0
855**
(0.0
238)
(0.0
244)
(0.0
178)
(0.0
305)
(0.0
0604)
(0.0
379)
(0.0
0966)
(0.0
299)
Con
stan
t0.
0439
***
0.06
43*
0.0
228***
0.0
653***
0.0
127
0.0
590
***
-0.0
0156
0.0
238
(0.0
148)
(0.0
244)
(0.0
0393)
(0.0
121)
(0.0
0604)
(0.0
0966)
(0.0
0358)
(0.0
145)
Ob
serv
atio
ns
185
106
25
69
14
16
R2
0.38
20.
365
0.7
22
0.2
90
0.8
25
0.0
14
0.0
10
0.2
92
(b)
Panel
B:
Exp
ort
tax
via
VA
Tp
olicy
by
mate
rials
supply
chain
(1)
(2)
(3)
(4)
(5)
(6)
(7)
(8)
Ch
emic
als
Lea
ther
Met
al
Min
eral
Pla
stic
Ru
bb
erT
exti
les
Wood
Raw
mat
eria
ls0.
0693
***
0.06
41*
0.1
20***
0.0
553**
0.0
587***
-0.0
0931
0.0
0436
0.0
599***
(0.0
218)
(0.0
244)
(0.0
0734)
(0.0
203)
(0.0
0604)
(0.0
379)
(0.0
0966)
(0.0
198)
Con
stan
t0.
0439
***
0.06
43*
0.0
223***
0.0
653***
0.0
127
0.0
590***
-0.0
0156
0.0
230
(0.0
148)
(0.0
244)
(0.0
0372)
(0.0
121)
(0.0
0604)
(0.0
0966)
(0.0
0358)
(0.0
137)
Ob
serv
atio
ns
185
106
25
69
14
16
R2
0.34
60.
365
0.7
39
0.2
51
0.8
25
0.0
14
0.0
10
0.3
62
Rob
ust
stan
dard
erro
rs.
Sm
all
p-v
alu
esare
rep
rese
nte
dby
***
(les
sth
an
1%
),**
(les
sth
an
5%
)or
*(l
ess
than
10%
).
20
Tab
le7:
Ch
ines
en
onag
ricu
ltu
ral
imp
ort
tari
ffs
1999
an
dd
iffer
ence
sw
ith
bou
nd
tari
ffs
for
raw
mate
rials
vs.
pro
cess
edgood
s
(a)
Panel
A:
1999
tari
ffs
(1)
(2)
(3)
(4)
(5)
(6)
(7)
(8)
(9)
All
Ch
emic
als
Lea
ther
Met
al
Min
eral
Pla
stic
Ru
bb
erT
exti
les
Wood
Raw
mat
eria
ls-0
.096
5***
-0.0
774*
**-0
.110***
-0.1
34***
-0.1
22***
-0.0
235**
-0.0
326
-0.0
882***
-0.0
708
(0.0
182)
(0.0
252)
(0.0
0479)
(0.0
123)
(0.0
225)
(0.0
0785)
(0.0
493)
(0.0
239)
(0.0
511)
[0.0
02]
Con
stan
t0.
171*
**0.
161*
**0.
246***
0.1
61***
0.1
77***
0.1
81***
0.1
89***
0.2
87***
0.1
59***
(0.0
102)
(0.0
238)
(0.0
0479)
(0.0
101)
(0.0
196)
(0.0
0785)
(0.0
279)
(0.0
124)
(0.0
422)
[0.0
00]
Ob
serv
atio
ns
239
185
106
25
69
14
16
R2
0.24
80.
237
0.9
78
0.3
93
0.5
27
0.3
10
0.0
59
0.4
98
0.1
46
(b)
Panel
B:
Diff
eren
ces
bet
wee
n1999
tari
ffs
and
bound
tari
ffs
(1)
(2)
(3)
(4)
(5)
(6)
(7)
(8)
(9)
All
Ch
emic
als
Lea
ther
Met
al
Min
eral
Pla
stic
Ru
bb
erT
exti
les
Wood
Raw
mat
eria
ls-0
.033
3***
-0.0
465*
*-0
.0947**
-0.0
456***
-0.0
465***
-0.0
0197
-0.0
00591
-0.0
164
-0.0
616
(0.0
0986)
(0.0
180)
(0.0
260)
(0.0
0642)
(0.0
124)
(0.0
0432)
(0.0
216)
(0.0
278)
(0.0
398)
[0.0
04]
Con
stan
t0.
0632
***
0.07
62**
*0.
107**
0.0
551***
0.0
503***
0.0
880***
0.0
426**
0.1
33***
0.1
09***
(0.0
0531)
(0.0
169)
(0.0
260)
(0.0
0551)
(0.0
118)
(0.0
0432)
(0.0
162)
(0.0
206)
(0.0
337)
[0.0
00]
Ob
serv
atio
ns
239
185
106
25
69
14
16
R2
0.09
50.
181
0.524
0.2
05
0.3
51
0.0
10
0.0
00
0.0
32
0.1
81
Rob
ust
stan
dard
erro
rs;
thes
eare
clu
ster
edat
2-d
igit
ind
ust
ryle
vel
inco
lum
n(1
)in
both
pan
els.
p-v
alu
esd
eriv
edfr
om
wild
boots
trap
s(a
sin
Cam
eron
etal.
2008)
are
insq
uare
bra
cket
s.
Sm
all
p-v
alu
esare
rep
rese
nte
dby
***
(les
sth
an
1%
),**
(les
sth
an
5%
)or
*(l
ess
than
10%
).
21
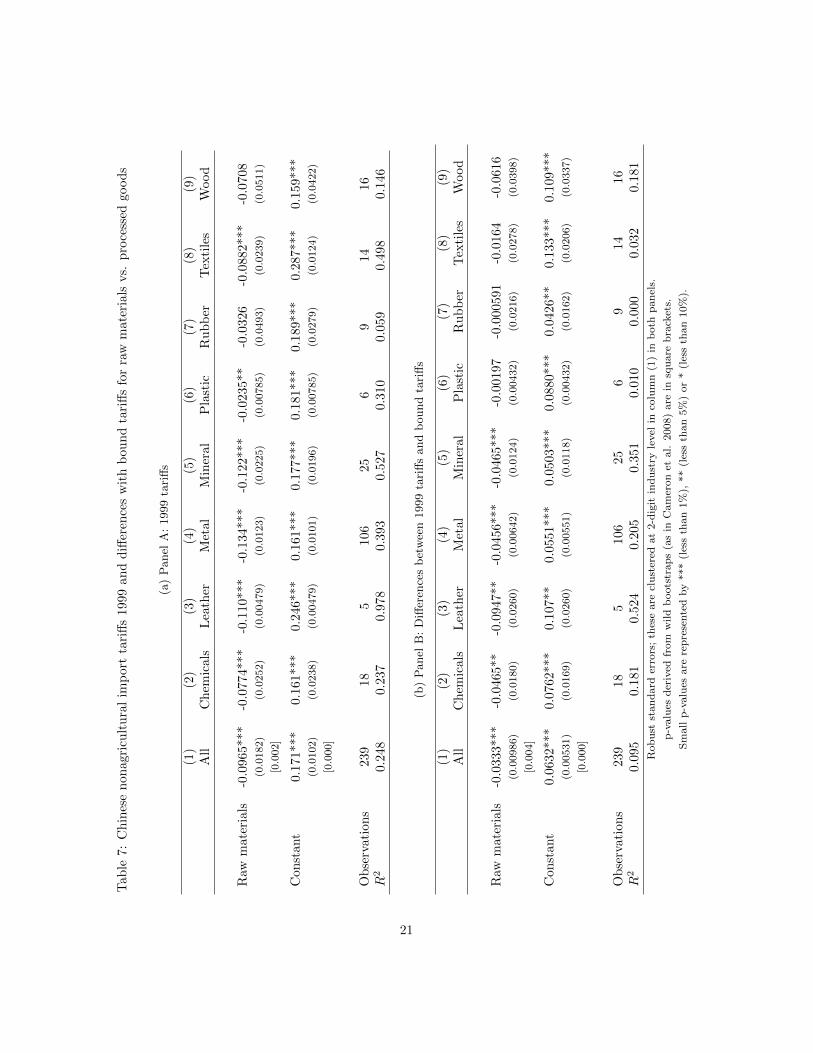
section and the previous one are linked: to what extent is the finding in theprevious section driven by relatively higher tariff cuts for processed goods beingreplaced by relatively higher export tax increases for raw materials? I firstobserve that China’s pre-WTO tariff schedule was characterized by systematictariff escalation; i.e. higher tariffs on processed goods as compared to rawmaterials. Using the HS definition of raw materials, Panel A of Table 7 showsthat China’s applied tariffs in 1999 were higher on processed goods than rawmaterials overall (column (1)) and within each of the eight raw materials supplychains (columns (2) through (9)), with this result being statistically significantfor six of eight supply chains.
Unsurprisingly, China’s WTO accession involved import tariff cuts that werehigher on goods whose initial tariffs were already high (Brandt et al. 2013).Using the tariff cut variable from section 2.2.2 (i.e. max{tar1999− tarbound, 0}),Panel B of Table 7 shows that this involved an overall decline in tariff escalation(column (1)): average tariffs on processed goods industries declined by twice asmuch as average tariffs on raw materials due to WTO accession, a statisticallysignificant difference. Columns (2) to (9) also show that tariff escalation wassignificantly reduced in four of eight supply chains, with a fifth (wood) seeinglarger declines in average processed goods tariffs by 6 percentage points, thoughwith a relatively large standard error. Notably, the three supply chains forwhich the extent of tariff escalation does not appear to have fallen include bothof those which did not experience relatively higher rises in export taxes on rawmaterials (textiles and rubber).
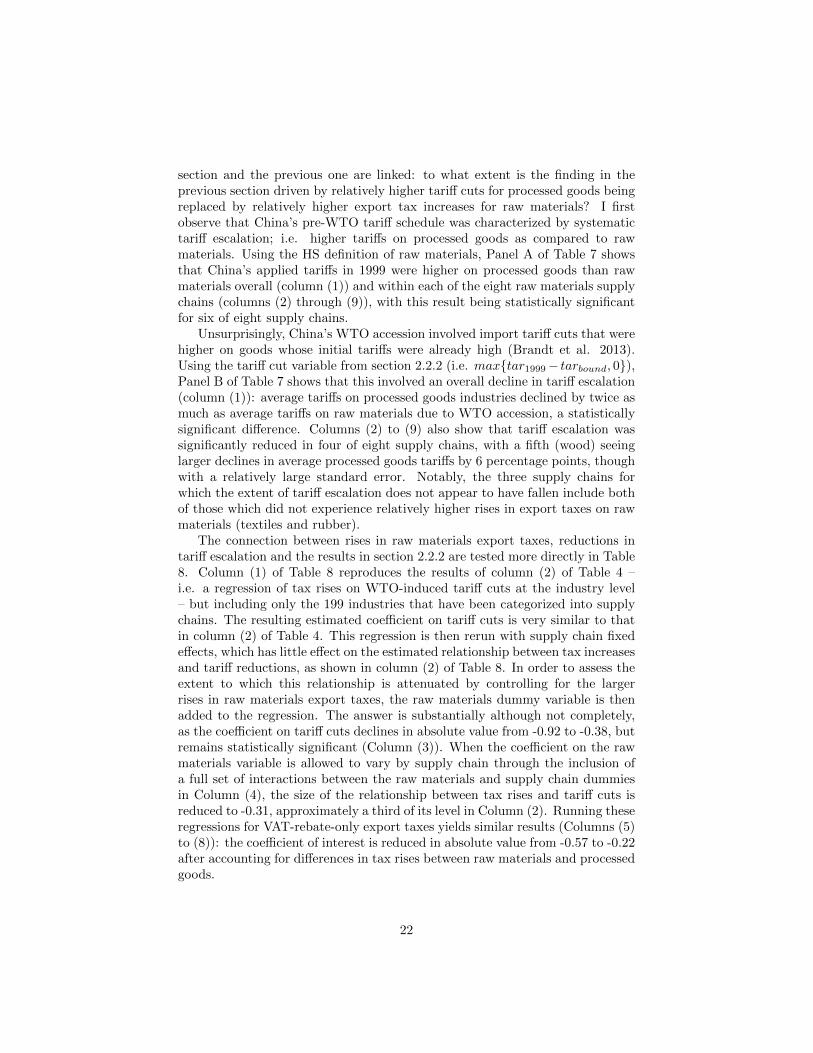
The connection between rises in raw materials export taxes, reductions intariff escalation and the results in section 2.2.2 are tested more directly in Table8. Column (1) of Table 8 reproduces the results of column (2) of Table 4 –i.e. a regression of tax rises on WTO-induced tariff cuts at the industry level– but including only the 199 industries that have been categorized into supplychains. The resulting estimated coefficient on tariff cuts is very similar to thatin column (2) of Table 4. This regression is then rerun with supply chain fixedeffects, which has little effect on the estimated relationship between tax increasesand tariff reductions, as shown in column (2) of Table 8. In order to assess theextent to which this relationship is attenuated by controlling for the largerrises in raw materials export taxes, the raw materials dummy variable is thenadded to the regression. The answer is substantially although not completely,as the coefficient on tariff cuts declines in absolute value from -0.92 to -0.38, butremains statistically significant (Column (3)). When the coefficient on the rawmaterials variable is allowed to vary by supply chain through the inclusion ofa full set of interactions between the raw materials and supply chain dummiesin Column (4), the size of the relationship between tax rises and tariff cuts isreduced to -0.31, approximately a third of its level in Column (2). Running theseregressions for VAT-rebate-only export taxes yields similar results (Columns (5)to (8)): the coefficient of interest is reduced in absolute value from -0.57 to -0.22after accounting for differences in tax rises between raw materials and processedgoods.
22
Tab
le8:
Ch
ines
en
onag
ricu
ltu
ral
exp
ort
tax
rise
s2002-2
011,
diff
eren
ces
bet
wee
n1999
imp
ort
tari
ffs
an
dW
TO
bou
nd
tari
ffs
and
stag
eof
pro
cess
ing
(1)
(2)
(3)
(4)
(5)
(6)
(7)
(8)
Tot
alT
otal
Tota
lT
ota
lV
AT
VA
TV
AT
VA
T
Tar
iffcu
t-0
.932
**-0
.917
***
-0.3
81***
-0.3
13*
-0.5
95***
-0.5
74***
-0.2
60**
-0.2
18*
(0.2
75)
(0.2
89)
(0.1
15)
(0.1
21)
(0.1
43)
(0.1
59)
(0.0
799)
(0.0
939)
[0.0
12]
[0.0
06]
[0.0
06]
[0.0
72]
[0.0
06]
[0.0
02]
[0.0
16]
[0.0
82]
Raw
mat
eria
ls0.1
26***
0.0
739***
(0.0
261)
(0.0
129)
[0.0
00]
[0.0
00]
Fix
edeff
ects
NO
YE
SY
ES
YE
SN
OY
ES
YE
SY
ES
Inte
ract
ion
sN
ON
ON
OY
ES
NO
NO
NO
YE
SO
bse
rvat
ion
s19
919
9199
199
199
199
199
199
Clu
ster
s25
2525
25
25
25
25
25
R2
0.23
40.
247
0.5
44
0.6
82
0.2
55
0.2
970.5
72
0.6
67
Rob
ust
stan
dard
erro
rsare
clu
ster
edat
the
two-d
igit
ind
ust
ryle
vel
.
p-v
alu
esd
eriv
edfr
om
wild
boots
trap
s(a
sin
Cam
eron
etal.
2008)
are
insq
uare
bra
cket
s.
***
p<
0.0
1,
**
p<
0.0
5,
*p<
0.1
23
2.3 Other export policies
A potential problem with the export tax measures used in the empirical analysisabove is that they only take account of two instruments that are readily quan-tified and aggregated – export duties and VAT rebates – but ignore changes inChina’s other export policies. For example, it is possible that there was substi-tution between export instruments during the period of interest: rising exportduties and VAT rebates might have acted as replacements for other export poli-cies of declining restrictiveness. In this case, the inferences about substitutionbetween import and export policies reached in the sections above might beinvalid because of the bias induced by other policies omitted in the relevantregressions.
I have thus collected data on all other product-level measures identified as‘policies affecting exports’ in the four WTO Trade Policy Reviews of China(WTO 2006, 2008, 2010, 2012): prohibition of exports via processing trade;export licensing; export quotas; state trading requirements; and export prohibi-tions.16 In all cases, data is sourced from official policy notices: annual schedulesof products subject to export licenses, quotas and state trading requirements,and ad hoc announcements of changes in policy regarding prohibition of exports(via processing trade or otherwise).
Among these instruments, the largest change in policy after China’s WTOaccession was to the list of products for which export via processing trade is pro-hibited. Processing trade accounted for approximately half of Chinese exportsthroughout the period of interest, and its existence is particularly important tothe analysis of this paper because exports via processing trade are duty-free,implying the possibility of tax-induced substitution between the ‘ordinary trade’and ‘processing trade’ regimes.
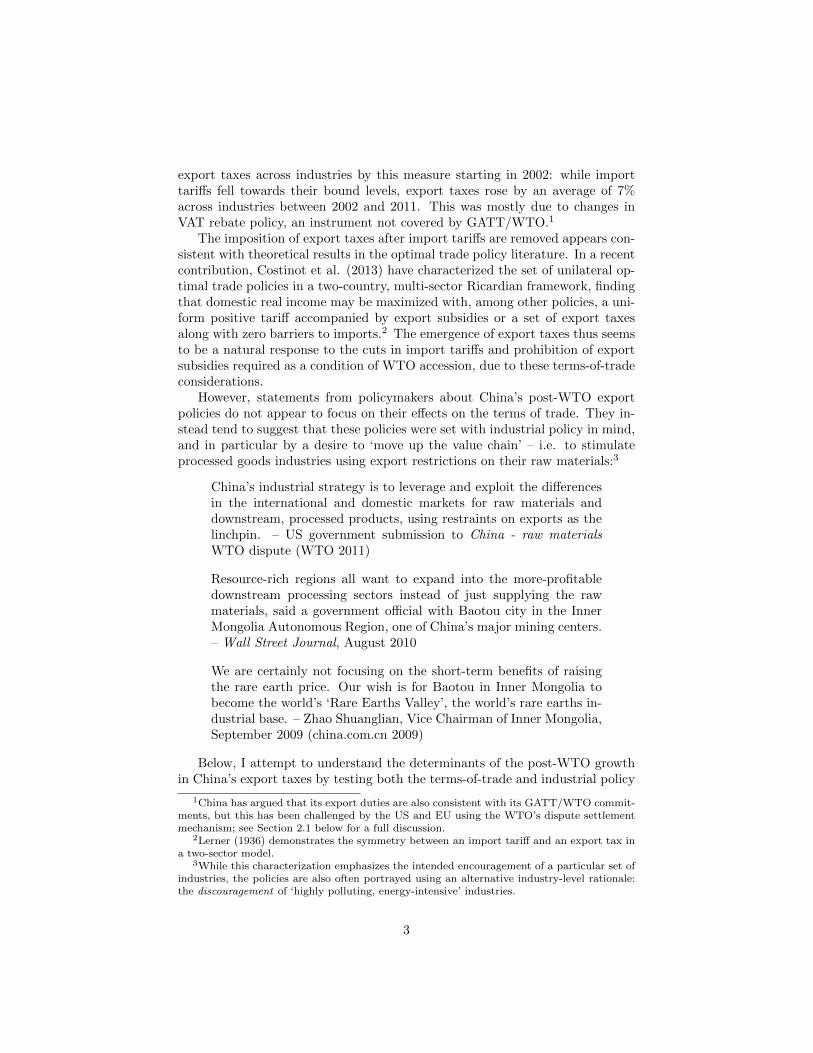
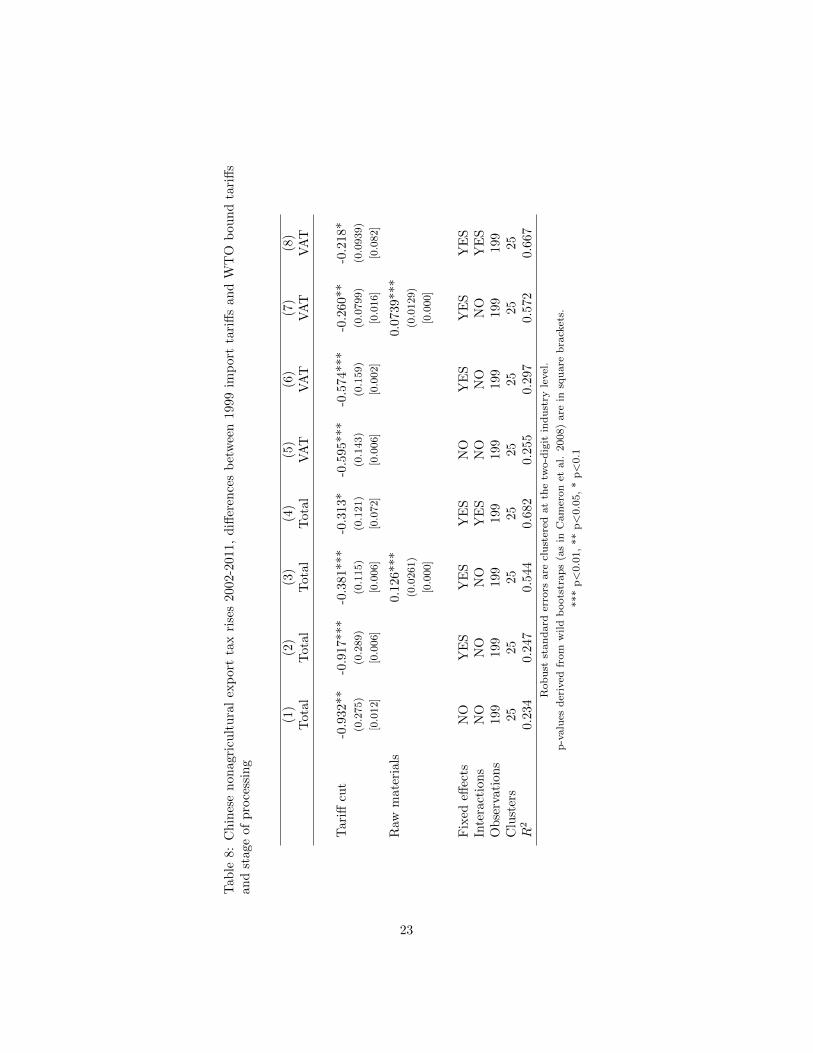
The data I record on prohibitions of export via processing trade begins withan official notice from 2004 declaring that “[a]djustments and updates will bemade annually to the list of prohibited processing trade goods ... in accordancewith the country’s economic development and industrial policies.”17 As shownin Figure 3, from 2005 (the first full year after the list of goods in this noticebecame effective) to 2011, the list of products banned from export via processingtrade expanded greatly.18 Moreover, the products prohibited from export viaprocessing trade corresponded very closely to the products on which export taxesincreased during the period. Among goods whose total export tax increase (asdefined in section 2.1 above) between 2002 and 2011 was among the top 5%across products, 73% were included on the prohibited list for processing tradein 2011. This was also true of 43% of other products in the top quartile ofexport tax rises, but only 3% of other products. Increases in export taxes and
16Some policies that are identified in the WTO reviews but that do not vary primarily atthe product level, such as tax concessions to foreign-invested enterprises, are not consideredhere.
17See Shangwubu, haiguanzongshu, guojiahuanjingbaohuzongju gonggao (2004) no. 55.18Note that I classify a six-digit product as being prohibited from export via processing trade
if I observe at least one eight-digit or ten-digit good within that six-digit product category onthe list of prohibited goods at the beginning of a given year.
24
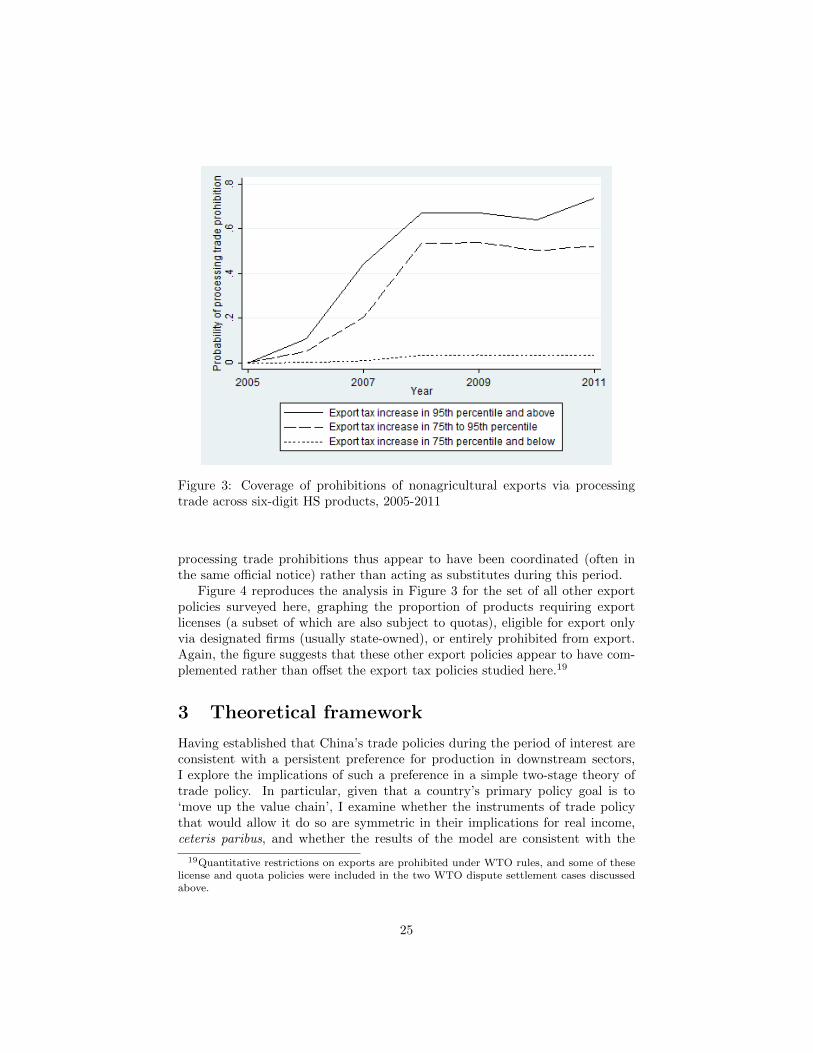
Figure 3: Coverage of prohibitions of nonagricultural exports via processingtrade across six-digit HS products, 2005-2011
processing trade prohibitions thus appear to have been coordinated (often inthe same official notice) rather than acting as substitutes during this period.
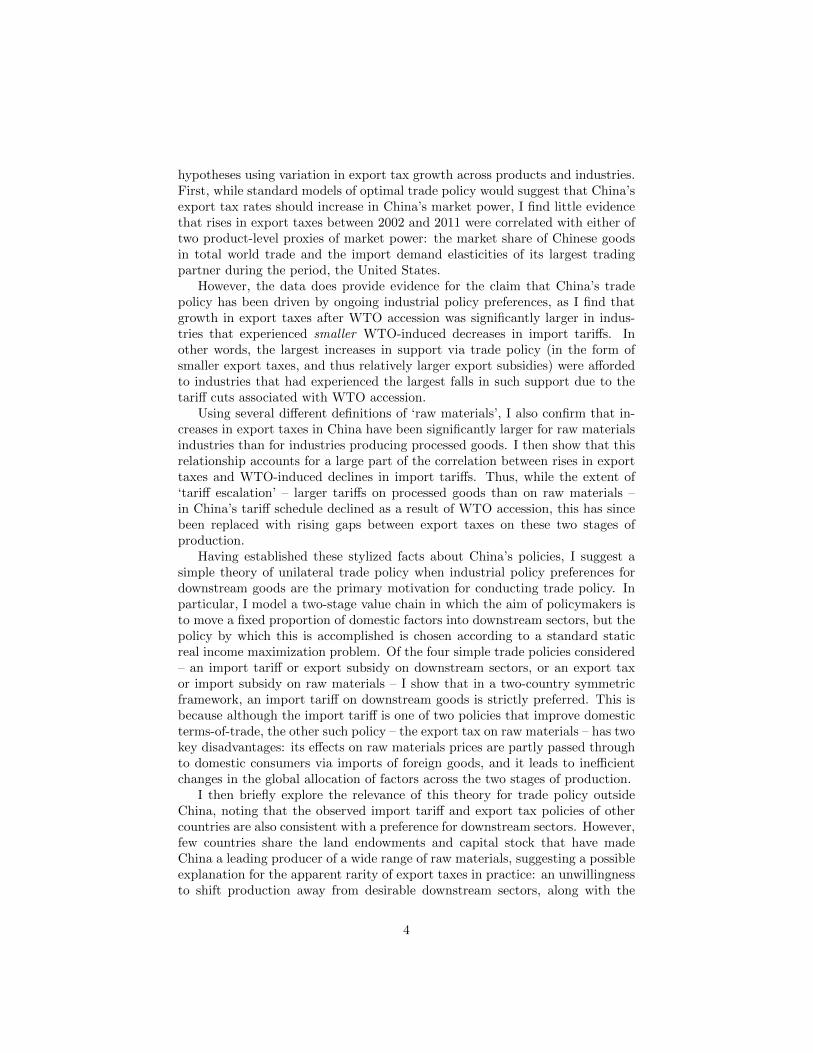
Figure 4 reproduces the analysis in Figure 3 for the set of all other exportpolicies surveyed here, graphing the proportion of products requiring exportlicenses (a subset of which are also subject to quotas), eligible for export onlyvia designated firms (usually state-owned), or entirely prohibited from export.Again, the figure suggests that these other export policies appear to have com-plemented rather than offset the export tax policies studied here.19
3 Theoretical framework
Having established that China’s trade policies during the period of interest areconsistent with a persistent preference for production in downstream sectors,I explore the implications of such a preference in a simple two-stage theory oftrade policy. In particular, given that a country’s primary policy goal is to‘move up the value chain’, I examine whether the instruments of trade policythat would allow it do so are symmetric in their implications for real income,ceteris paribus, and whether the results of the model are consistent with the
19Quantitative restrictions on exports are prohibited under WTO rules, and some of theselicense and quota policies were included in the two WTO dispute settlement cases discussedabove.
25
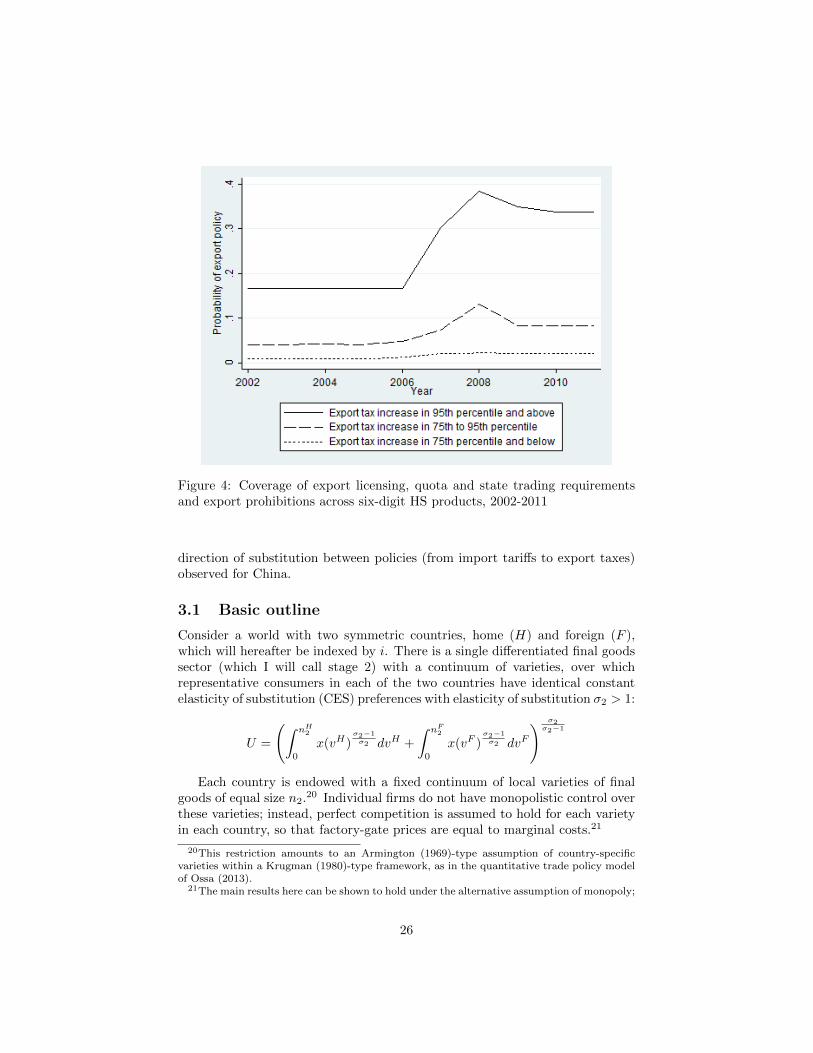
Figure 4: Coverage of export licensing, quota and state trading requirementsand export prohibitions across six-digit HS products, 2002-2011
direction of substitution between policies (from import tariffs to export taxes)observed for China.
3.1 Basic outline
Consider a world with two symmetric countries, home (H) and foreign (F ),which will hereafter be indexed by i. There is a single differentiated final goodssector (which I will call stage 2) with a continuum of varieties, over whichrepresentative consumers in each of the two countries have identical constantelasticity of substitution (CES) preferences with elasticity of substitution σ2 > 1:
U =
(∫ nH2
0
x(vH)σ2−1σ2 dvH +
∫ nF2
0
x(vF )σ2−1σ2 dvF
) σ2σ2−1
Each country is endowed with a fixed continuum of local varieties of finalgoods of equal size n2.20 Individual firms do not have monopolistic control overthese varieties; instead, perfect competition is assumed to hold for each varietyin each country, so that factory-gate prices are equal to marginal costs.21
20This restriction amounts to an Armington (1969)-type assumption of country-specificvarieties within a Krugman (1980)-type framework, as in the quantitative trade policy modelof Ossa (2013).
21The main results here can be shown to hold under the alternative assumption of monopoly;
26
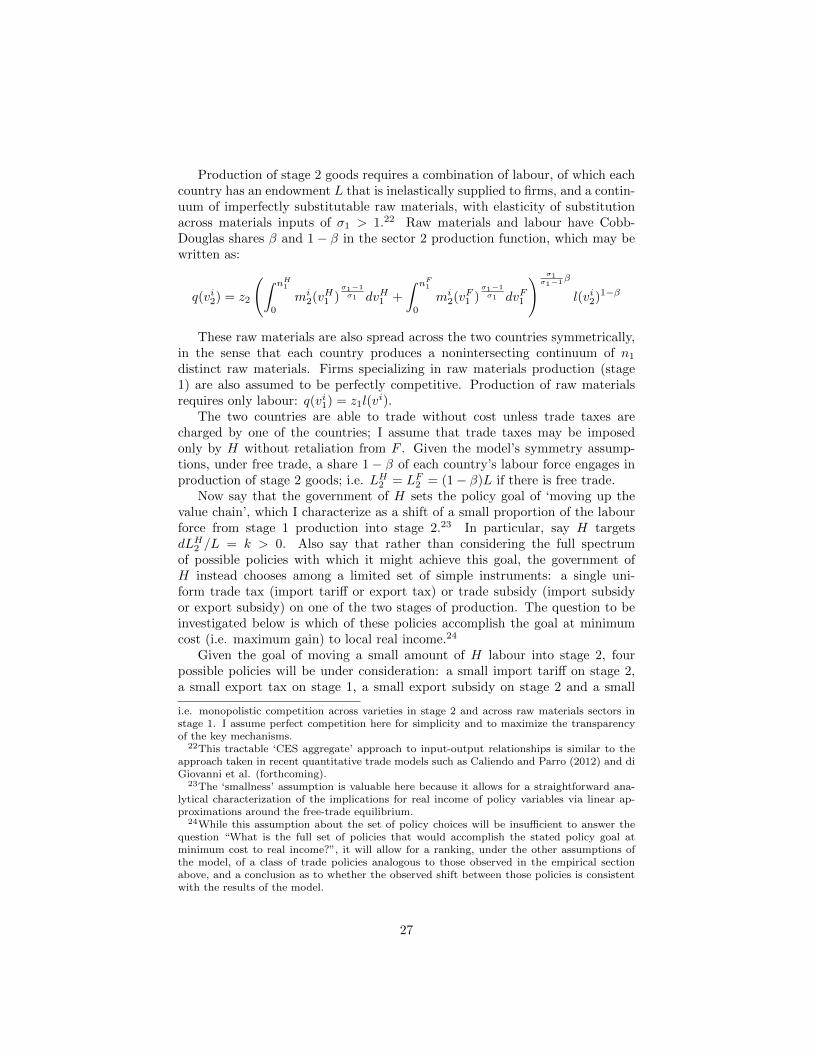
Production of stage 2 goods requires a combination of labour, of which eachcountry has an endowment L that is inelastically supplied to firms, and a contin-uum of imperfectly substitutable raw materials, with elasticity of substitutionacross materials inputs of σ1 > 1.22 Raw materials and labour have Cobb-Douglas shares β and 1− β in the sector 2 production function, which may bewritten as:
q(vi2) = z2
(∫ nH1
0
mi2(vH1 )
σ1−1σ1 dvH1 +
∫ nF1
0
mi2(vF1 )
σ1−1σ1 dvF1
) σ1σ1−1β
l(vi2)1−β
These raw materials are also spread across the two countries symmetrically,in the sense that each country produces a nonintersecting continuum of n1distinct raw materials. Firms specializing in raw materials production (stage1) are also assumed to be perfectly competitive. Production of raw materialsrequires only labour: q(vi1) = z1l(v
i).The two countries are able to trade without cost unless trade taxes are
charged by one of the countries; I assume that trade taxes may be imposedonly by H without retaliation from F . Given the model’s symmetry assump-tions, under free trade, a share 1− β of each country’s labour force engages inproduction of stage 2 goods; i.e. LH2 = LF2 = (1− β)L if there is free trade.
Now say that the government of H sets the policy goal of ‘moving up thevalue chain’, which I characterize as a shift of a small proportion of the labourforce from stage 1 production into stage 2.23 In particular, say H targetsdLH2 /L = k > 0. Also say that rather than considering the full spectrumof possible policies with which it might achieve this goal, the government ofH instead chooses among a limited set of simple instruments: a single uni-form trade tax (import tariff or export tax) or trade subsidy (import subsidyor export subsidy) on one of the two stages of production. The question to beinvestigated below is which of these policies accomplish the goal at minimumcost (i.e. maximum gain) to local real income.24
Given the goal of moving a small amount of H labour into stage 2, fourpossible policies will be under consideration: a small import tariff on stage 2,a small export tax on stage 1, a small export subsidy on stage 2 and a small
i.e. monopolistic competition across varieties in stage 2 and across raw materials sectors instage 1. I assume perfect competition here for simplicity and to maximize the transparencyof the key mechanisms.
22This tractable ‘CES aggregate’ approach to input-output relationships is similar to theapproach taken in recent quantitative trade models such as Caliendo and Parro (2012) and diGiovanni et al. (forthcoming).
23The ‘smallness’ assumption is valuable here because it allows for a straightforward ana-lytical characterization of the implications for real income of policy variables via linear ap-proximations around the free-trade equilibrium.
24While this assumption about the set of policy choices will be insufficient to answer thequestion “What is the full set of policies that would accomplish the stated policy goal atminimum cost to real income?”, it will allow for a ranking, under the other assumptions ofthe model, of a class of trade policies analogous to those observed in the empirical sectionabove, and a conclusion as to whether the observed shift between those policies is consistentwith the results of the model.
27
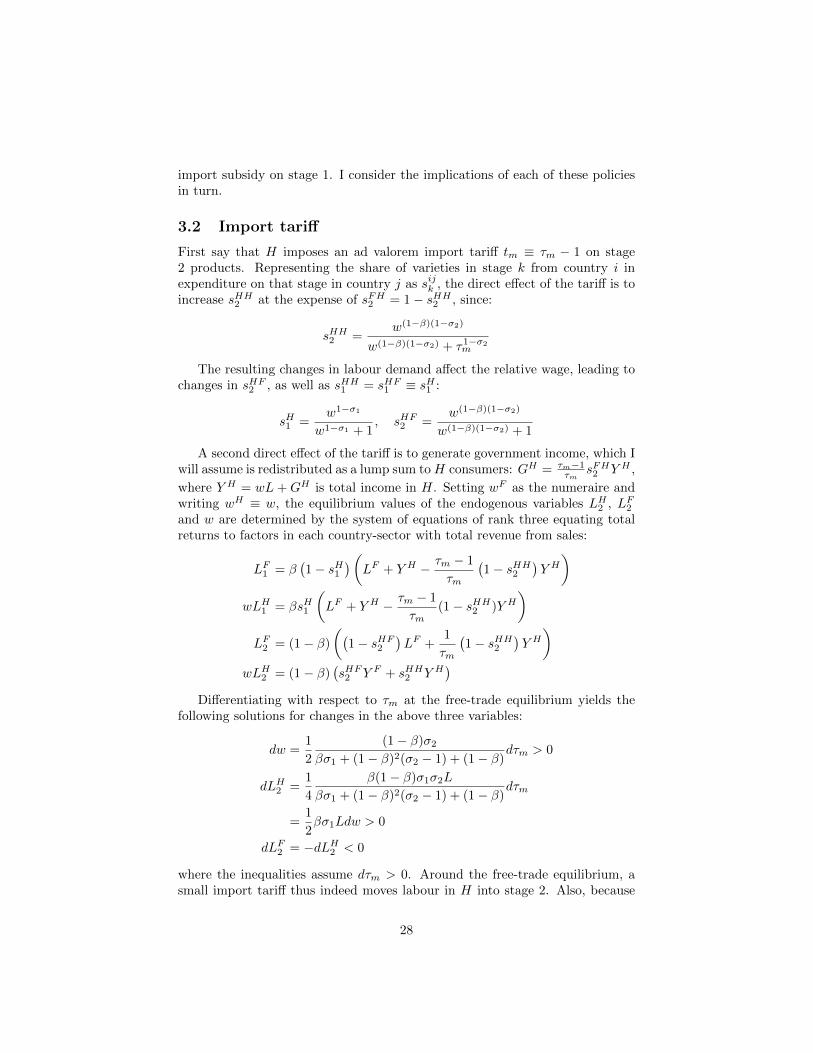
import subsidy on stage 1. I consider the implications of each of these policiesin turn.
3.2 Import tariff
First say that H imposes an ad valorem import tariff tm ≡ τm − 1 on stage2 products. Representing the share of varieties in stage k from country i inexpenditure on that stage in country j as sijk , the direct effect of the tariff is toincrease sHH2 at the expense of sFH2 = 1− sHH2 , since:
sHH2 =w(1−β)(1−σ2)
w(1−β)(1−σ2) + τ1−σ2m
The resulting changes in labour demand affect the relative wage, leading tochanges in sHF2 , as well as sHH1 = sHF1 ≡ sH1 :
sH1 =w1−σ1
w1−σ1 + 1, sHF2 =
w(1−β)(1−σ2)
w(1−β)(1−σ2) + 1
A second direct effect of the tariff is to generate government income, which Iwill assume is redistributed as a lump sum toH consumers: GH = τm−1
τmsFH2 Y H ,
where Y H = wL+GH is total income in H. Setting wF as the numeraire andwriting wH ≡ w, the equilibrium values of the endogenous variables LH2 , LF2and w are determined by the system of equations of rank three equating totalreturns to factors in each country-sector with total revenue from sales:
LF1 = β(1− sH1
)(LF + Y H − τm − 1
τm
(1− sHH2
)Y H)
wLH1 = βsH1
(LF + Y H − τm − 1
τm(1− sHH2 )Y H
)LF2 = (1− β)
((1− sHF2
)LF +
1
τm
(1− sHH2
)Y H)
wLH2 = (1− β)(sHF2 Y F + sHH2 Y H
)Differentiating with respect to τm at the free-trade equilibrium yields the
following solutions for changes in the above three variables:
dw =1
2
(1− β)σ2βσ1 + (1− β)2(σ2 − 1) + (1− β)
dτm > 0
dLH2 =1
4
β(1− β)σ1σ2L
βσ1 + (1− β)2(σ2 − 1) + (1− β)dτm
=1
2βσ1Ldw > 0
dLF2 = −dLH2 < 0
where the inequalities assume dτm > 0. Around the free-trade equilibrium, asmall import tariff thus indeed moves labour in H into stage 2. Also, because
28
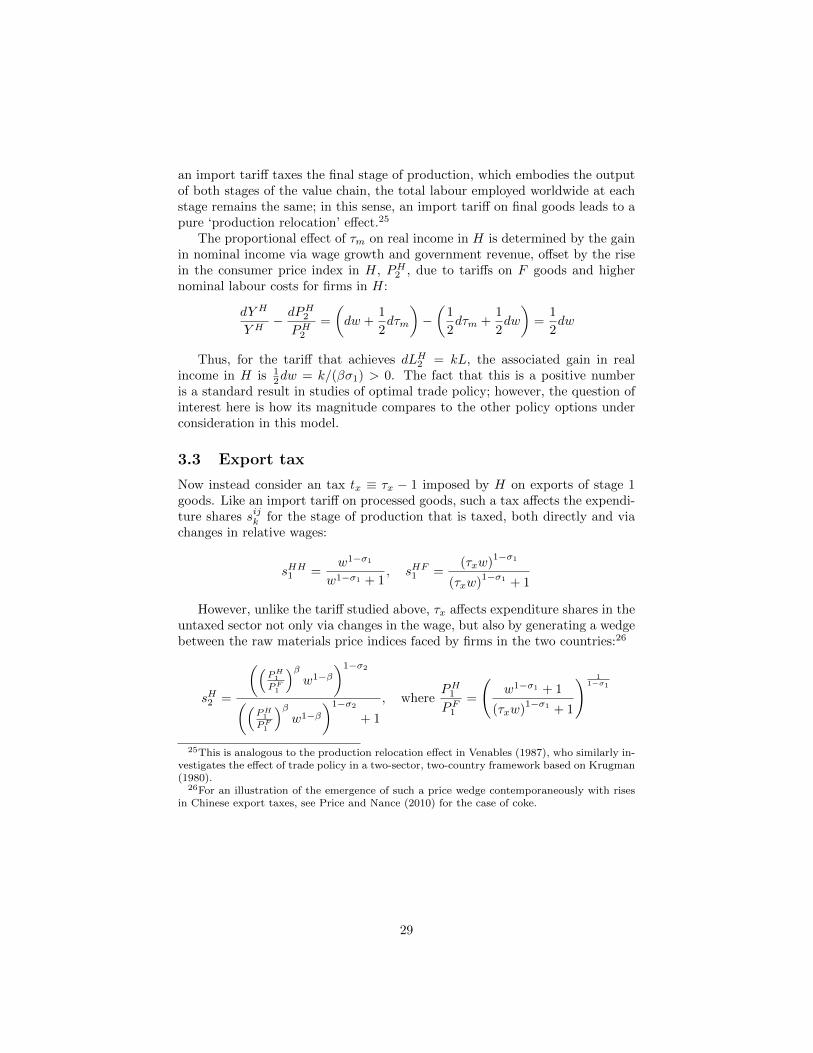
an import tariff taxes the final stage of production, which embodies the outputof both stages of the value chain, the total labour employed worldwide at eachstage remains the same; in this sense, an import tariff on final goods leads to apure ‘production relocation’ effect.25
The proportional effect of τm on real income in H is determined by the gainin nominal income via wage growth and government revenue, offset by the risein the consumer price index in H, PH2 , due to tariffs on F goods and highernominal labour costs for firms in H:
dY H
Y H− dPH2
PH2=
(dw +
1
2dτm
)−(
1
2dτm +
1
2dw
)=
1
2dw
Thus, for the tariff that achieves dLH2 = kL, the associated gain in realincome in H is 1
2dw = k/(βσ1) > 0. The fact that this is a positive numberis a standard result in studies of optimal trade policy; however, the question ofinterest here is how its magnitude compares to the other policy options underconsideration in this model.
3.3 Export tax
Now instead consider an tax tx ≡ τx − 1 imposed by H on exports of stage 1goods. Like an import tariff on processed goods, such a tax affects the expendi-ture shares sijk for the stage of production that is taxed, both directly and viachanges in relative wages:
sHH1 =w1−σ1
w1−σ1 + 1, sHF1 =
(τxw)1−σ1
(τxw)1−σ1 + 1
However, unlike the tariff studied above, τx affects expenditure shares in theuntaxed sector not only via changes in the wage, but also by generating a wedgebetween the raw materials price indices faced by firms in the two countries:26
sH2 =
((PH1PF1
)βw1−β
)1−σ2
((PH1PF1
)βw1−β
)1−σ2
+ 1
, wherePH1PF1
=
(w1−σ1 + 1
(τxw)1−σ1 + 1
) 11−σ1
25This is analogous to the production relocation effect in Venables (1987), who similarly in-vestigates the effect of trade policy in a two-sector, two-country framework based on Krugman(1980).
26For an illustration of the emergence of such a price wedge contemporaneously with risesin Chinese export taxes, see Price and Nance (2010) for the case of coke.
29
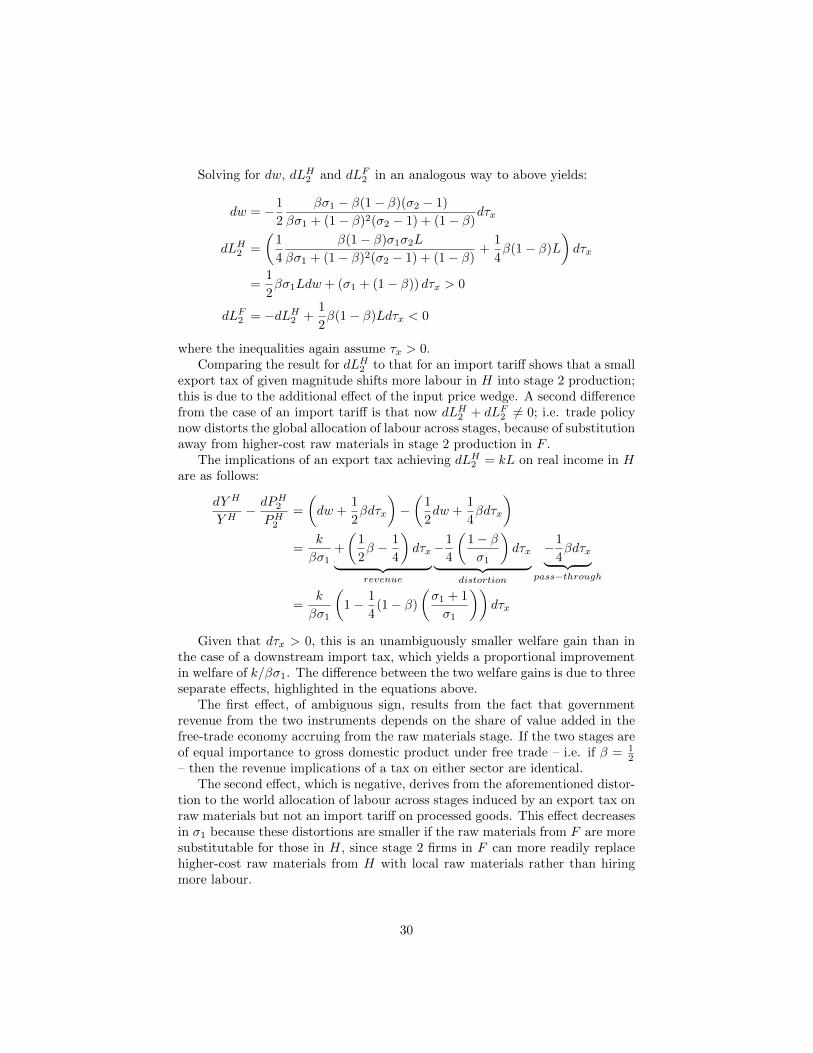
Solving for dw, dLH2 and dLF2 in an analogous way to above yields:
dw = −1
2
βσ1 − β(1− β)(σ2 − 1)
βσ1 + (1− β)2(σ2 − 1) + (1− β)dτx
dLH2 =
(1
4
β(1− β)σ1σ2L
βσ1 + (1− β)2(σ2 − 1) + (1− β)+
1
4β(1− β)L
)dτx
=1
2βσ1Ldw + (σ1 + (1− β)) dτx > 0
dLF2 = −dLH2 +1
2β(1− β)Ldτx < 0
where the inequalities again assume τx > 0.Comparing the result for dLH2 to that for an import tariff shows that a small
export tax of given magnitude shifts more labour in H into stage 2 production;this is due to the additional effect of the input price wedge. A second differencefrom the case of an import tariff is that now dLH2 + dLF2 6= 0; i.e. trade policynow distorts the global allocation of labour across stages, because of substitutionaway from higher-cost raw materials in stage 2 production in F .
The implications of an export tax achieving dLH2 = kL on real income in Hare as follows:
dY H
Y H− dPH2
PH2=
(dw +
1
2βdτx
)−(
1
2dw +
1
4βdτx
)=
k
βσ1+
(1
2β − 1
4
)dτx︸ ︷︷ ︸
revenue
−1
4
(1− βσ1
)dτx︸ ︷︷ ︸
distortion
−1
4βdτx︸ ︷︷ ︸
pass−through
=k
βσ1
(1− 1
4(1− β)
(σ1 + 1
σ1
))dτx
Given that dτx > 0, this is an unambiguously smaller welfare gain than inthe case of a downstream import tax, which yields a proportional improvementin welfare of k/βσ1. The difference between the two welfare gains is due to threeseparate effects, highlighted in the equations above.
The first effect, of ambiguous sign, results from the fact that governmentrevenue from the two instruments depends on the share of value added in thefree-trade economy accruing from the raw materials stage. If the two stages areof equal importance to gross domestic product under free trade – i.e. if β = 1
2– then the revenue implications of a tax on either sector are identical.
The second effect, which is negative, derives from the aforementioned distor-tion to the world allocation of labour across stages induced by an export tax onraw materials but not an import tariff on processed goods. This effect decreasesin σ1 because these distortions are smaller if the raw materials from F are moresubstitutable for those in H, since stage 2 firms in F can more readily replacehigher-cost raw materials from H with local raw materials rather than hiringmore labour.
30
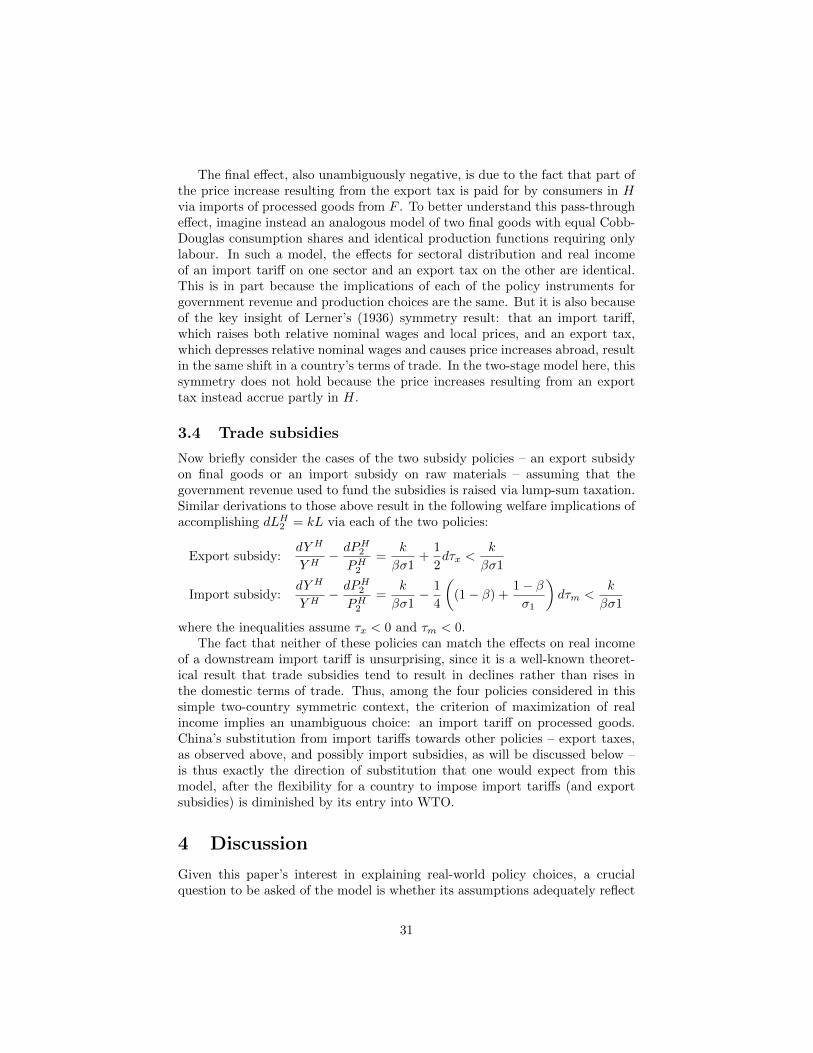
The final effect, also unambiguously negative, is due to the fact that part ofthe price increase resulting from the export tax is paid for by consumers in Hvia imports of processed goods from F . To better understand this pass-througheffect, imagine instead an analogous model of two final goods with equal Cobb-Douglas consumption shares and identical production functions requiring onlylabour. In such a model, the effects for sectoral distribution and real incomeof an import tariff on one sector and an export tax on the other are identical.This is in part because the implications of each of the policy instruments forgovernment revenue and production choices are the same. But it is also becauseof the key insight of Lerner’s (1936) symmetry result: that an import tariff,which raises both relative nominal wages and local prices, and an export tax,which depresses relative nominal wages and causes price increases abroad, resultin the same shift in a country’s terms of trade. In the two-stage model here, thissymmetry does not hold because the price increases resulting from an exporttax instead accrue partly in H.
3.4 Trade subsidies
Now briefly consider the cases of the two subsidy policies – an export subsidyon final goods or an import subsidy on raw materials – assuming that thegovernment revenue used to fund the subsidies is raised via lump-sum taxation.Similar derivations to those above result in the following welfare implications ofaccomplishing dLH2 = kL via each of the two policies:
Export subsidy:dY H
Y H− dPH2
PH2=
k
βσ1+
1
2dτx <
k
βσ1
Import subsidy:dY H
Y H− dPH2
PH2=
k
βσ1− 1
4
((1− β) +
1− βσ1
)dτm <
k
βσ1
where the inequalities assume τx < 0 and τm < 0.The fact that neither of these policies can match the effects on real income
of a downstream import tariff is unsurprising, since it is a well-known theoret-ical result that trade subsidies tend to result in declines rather than rises inthe domestic terms of trade. Thus, among the four policies considered in thissimple two-country symmetric context, the criterion of maximization of realincome implies an unambiguous choice: an import tariff on processed goods.China’s substitution from import tariffs towards other policies – export taxes,as observed above, and possibly import subsidies, as will be discussed below –is thus exactly the direction of substitution that one would expect from thismodel, after the flexibility for a country to impose import tariffs (and exportsubsidies) is diminished by its entry into WTO.
4 Discussion
Given this paper’s interest in explaining real-world policy choices, a crucialquestion to be asked of the model is whether its assumptions adequately reflect
31
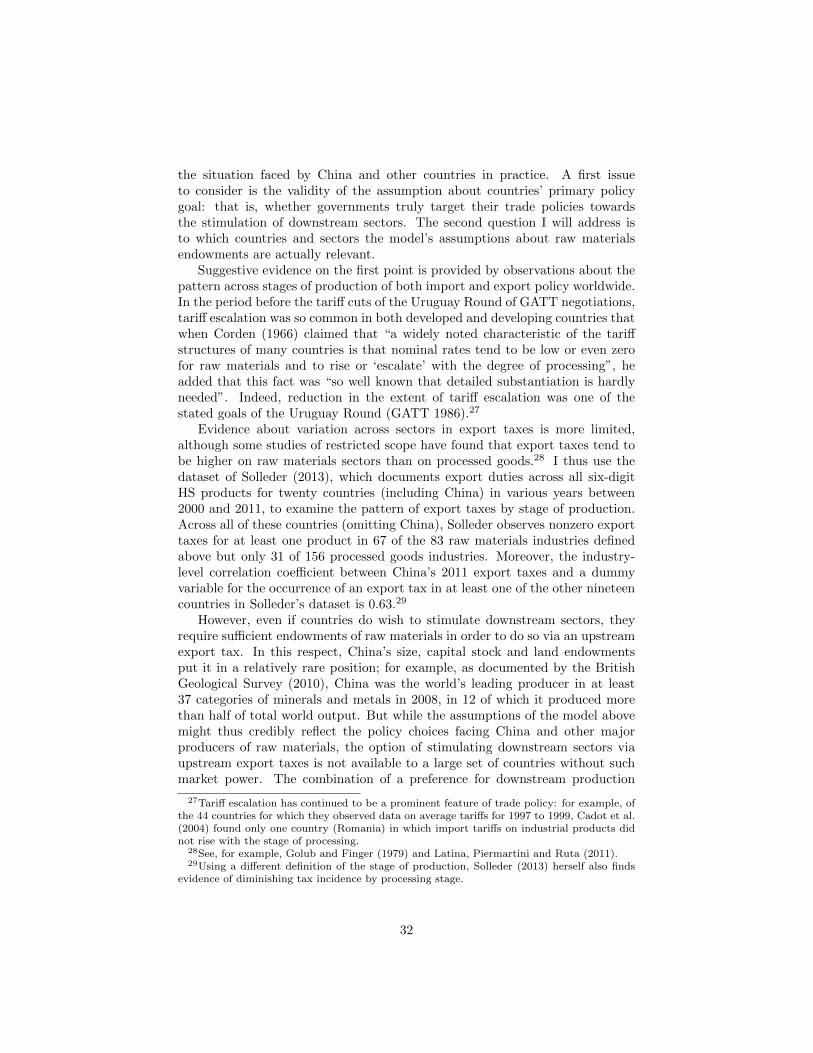
the situation faced by China and other countries in practice. A first issueto consider is the validity of the assumption about countries’ primary policygoal: that is, whether governments truly target their trade policies towardsthe stimulation of downstream sectors. The second question I will address isto which countries and sectors the model’s assumptions about raw materialsendowments are actually relevant.
Suggestive evidence on the first point is provided by observations about thepattern across stages of production of both import and export policy worldwide.In the period before the tariff cuts of the Uruguay Round of GATT negotiations,tariff escalation was so common in both developed and developing countries thatwhen Corden (1966) claimed that “a widely noted characteristic of the tariffstructures of many countries is that nominal rates tend to be low or even zerofor raw materials and to rise or ‘escalate’ with the degree of processing”, headded that this fact was “so well known that detailed substantiation is hardlyneeded”. Indeed, reduction in the extent of tariff escalation was one of thestated goals of the Uruguay Round (GATT 1986).27
Evidence about variation across sectors in export taxes is more limited,although some studies of restricted scope have found that export taxes tend tobe higher on raw materials sectors than on processed goods.28 I thus use thedataset of Solleder (2013), which documents export duties across all six-digitHS products for twenty countries (including China) in various years between2000 and 2011, to examine the pattern of export taxes by stage of production.Across all of these countries (omitting China), Solleder observes nonzero exporttaxes for at least one product in 67 of the 83 raw materials industries definedabove but only 31 of 156 processed goods industries. Moreover, the industry-level correlation coefficient between China’s 2011 export taxes and a dummyvariable for the occurrence of an export tax in at least one of the other nineteencountries in Solleder’s dataset is 0.63.29
However, even if countries do wish to stimulate downstream sectors, theyrequire sufficient endowments of raw materials in order to do so via an upstreamexport tax. In this respect, China’s size, capital stock and land endowmentsput it in a relatively rare position; for example, as documented by the BritishGeological Survey (2010), China was the world’s leading producer in at least37 categories of minerals and metals in 2008, in 12 of which it produced morethan half of total world output. But while the assumptions of the model abovemight thus credibly reflect the policy choices facing China and other majorproducers of raw materials, the option of stimulating downstream sectors viaupstream export taxes is not available to a large set of countries without suchmarket power. The combination of a preference for downstream production
27Tariff escalation has continued to be a prominent feature of trade policy: for example, ofthe 44 countries for which they observed data on average tariffs for 1997 to 1999, Cadot et al.(2004) found only one country (Romania) in which import tariffs on industrial products didnot rise with the stage of processing.
28See, for example, Golub and Finger (1979) and Latina, Piermartini and Ruta (2011).29Using a different definition of the stage of production, Solleder (2013) herself also finds
evidence of diminishing tax incidence by processing stage.
32
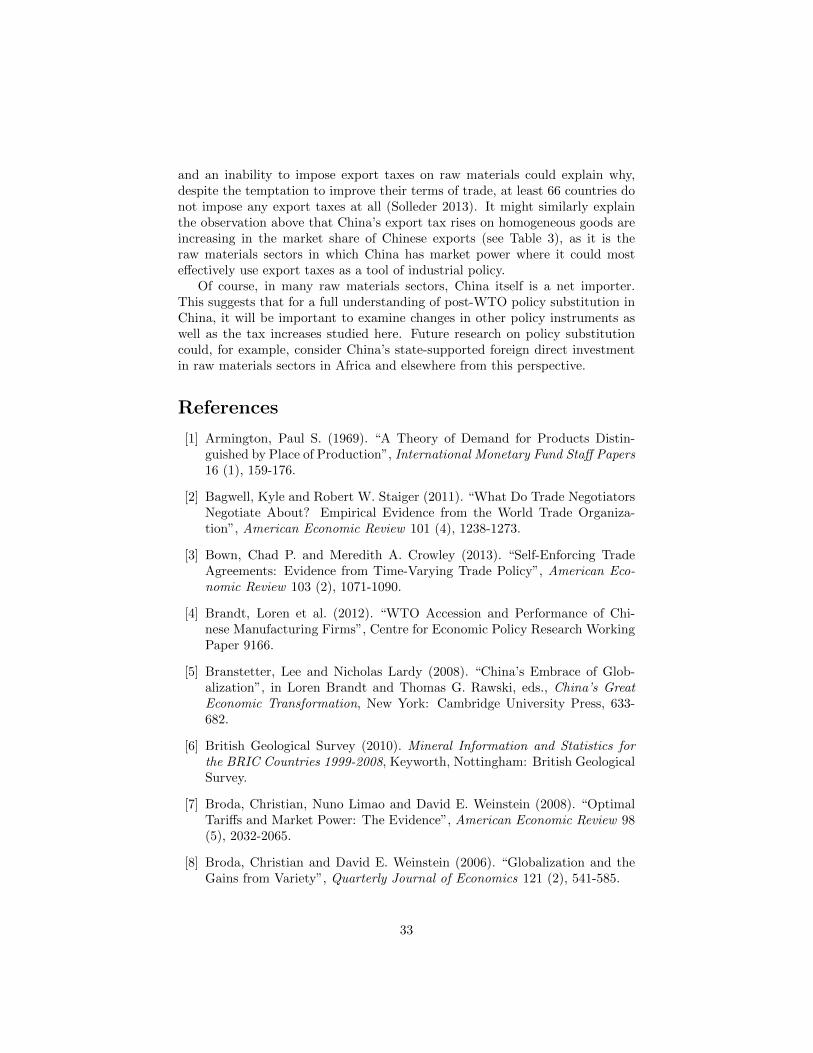
and an inability to impose export taxes on raw materials could explain why,despite the temptation to improve their terms of trade, at least 66 countries donot impose any export taxes at all (Solleder 2013). It might similarly explainthe observation above that China’s export tax rises on homogeneous goods areincreasing in the market share of Chinese exports (see Table 3), as it is theraw materials sectors in which China has market power where it could mosteffectively use export taxes as a tool of industrial policy.
Of course, in many raw materials sectors, China itself is a net importer.This suggests that for a full understanding of post-WTO policy substitution inChina, it will be important to examine changes in other policy instruments aswell as the tax increases studied here. Future research on policy substitutioncould, for example, consider China’s state-supported foreign direct investmentin raw materials sectors in Africa and elsewhere from this perspective.
References
[1] Armington, Paul S. (1969). “A Theory of Demand for Products Distin-guished by Place of Production”, International Monetary Fund Staff Papers16 (1), 159-176.
[2] Bagwell, Kyle and Robert W. Staiger (2011). “What Do Trade NegotiatorsNegotiate About? Empirical Evidence from the World Trade Organiza-tion”, American Economic Review 101 (4), 1238-1273.
[3] Bown, Chad P. and Meredith A. Crowley (2013). “Self-Enforcing TradeAgreements: Evidence from Time-Varying Trade Policy”, American Eco-nomic Review 103 (2), 1071-1090.
[4] Brandt, Loren et al. (2012). “WTO Accession and Performance of Chi-nese Manufacturing Firms”, Centre for Economic Policy Research WorkingPaper 9166.
[5] Branstetter, Lee and Nicholas Lardy (2008). “China’s Embrace of Glob-alization”, in Loren Brandt and Thomas G. Rawski, eds., China’s GreatEconomic Transformation, New York: Cambridge University Press, 633-682.
[6] British Geological Survey (2010). Mineral Information and Statistics forthe BRIC Countries 1999-2008, Keyworth, Nottingham: British GeologicalSurvey.
[7] Broda, Christian, Nuno Limao and David E. Weinstein (2008). “OptimalTariffs and Market Power: The Evidence”, American Economic Review 98(5), 2032-2065.
[8] Broda, Christian and David E. Weinstein (2006). “Globalization and theGains from Variety”, Quarterly Journal of Economics 121 (2), 541-585.
33
[9] Cadot, Olivier et al. (2004). “Lobbying, Counterlobbying, and the Structureof Tariff Protection in Poor and Rich Countries”, World Bank EconomicReview 18 (3), 345-366.
[10] Caliendo, Lorenzo and Fernando Parro (2012). “Estimates of the Tradeand Welfare Effects of NAFTA”, National Bureau of Economic ResearchWorking Paper 18508.
[11] Cameron, A. Colin, Jonah B. Gelbach and Douglas L. Miller (2008).“Bootstrap-based Improvements for Inference with Clustered Errors”, Re-view of Economics and Statistics 90 (3), 414-427.
[12] Chan, Alfred (2008). “An Overview of the VAT Export Refund Rules inChina”, Tax Notes International 49 (2), 159-164.
[13] Chandra, Piyush and Cheryl Long (2013). “VAT Rebates and Export Per-formance in China: Firm-Level Evidence”, Journal of Public Economics103, 13-22.
[14] Chen, Shaohua and Martin Ravallion (2004). “Welfare Effects of China’sAccession to the World Trade Organization”, World Bank Economic Re-view 18 (1), 29-57.
[15] china.com.cn (2009). “Inner Mongolia Restructuring and IntegratingRare Earths Industry, Planning to Set Up Reserve System to StabilizePrices”, press conference transcript, accessed via stock.hexun.com/2009-09-02/120928664.html
[16] Corden, W. M. (1966). “The Structure of a Tariff System and the EffectiveProtective Rate”, Journal of Political Economy 74 (3), 221-237.
[17] Costinot, Arnaud et al. (2013). “Comparative Advantage and OptimalTrade Policy”, National Bureau of Economic Research Working Paper19689.
[18] Deloitte Touche Tomatsu (2005). China Master Tax Guide 2005, TheHague: Kluwer Law International
[19] di Giovanni, Julian, Andrei A. Levchenko and Jing Zhang (forthcoming).“The Global Welfare Impact of China: Trade Integration and TechnologicalChange”, American Economic Journal: Macroeconomics.
[20] Dixit, Avinash K. and Gene M. Grossman (1982). “Trade and Protectionwith Multistage Production”, Review of Economic Studies 49 (4), 583-594.
[21] Ethier, Wilfred J. (2004). “Political Externalities, Nondiscrimination, anda Multilateral World”, Review of International Economics 12 (3), 303-320.
[22] Ethier, Wilfred J. (2007). “The Theory of Trade Policy and Trade Agree-ments: A Critique”, European Journal of Political Economy 23 (3), 605-623.
34
[23] Feldstein, Martin S. and Paul R. Krugman (1990). “International TradeEffects of Value-Added Taxation”, in Assaf Razin and Joel Slemrod, eds.,Taxation in the Global Economy, University of Chicago Press, 263-282.
[24] Fliess, Barbara and Tarja Mard (2012). “Taking Stock of Measures Re-stricting the Export of Raw Materials: Analysis of OECD Inventory Data”,OECD Trade Policy Paper 140.
[25] GATT (1947, 1994). General Agreement on Tariffs and Trade, accessed viahttp://www.wto.org/english/docs e/legal e/legal e.htm
[26] GATT (1986). Punta del Este Ministerial Declaration, accessed viahttp://www.sice.oas.org/trade/Punta e.asp
[27] Goldberg, Pinelopi Koujianou and Giovanni Maggi (1999). “Protection forSale: An Empirical Investigation”, American Economic Review 89 (5),1135-1155.
[28] Golub, Stephen S. and J. M. Finger (1979). “The Processing of Pri-mary Commodities: Effects of Developed-Country Tariff Escalation andDeveloping-Country Export Taxes”, Journal of Political Economy 87 (3),559-577.
[29] Gros, Daniel (1987). “A Note on the Optimal Tariff, Retaliation and theWelfare Loss from Tariff Wars in a Framework with Intra-Industry Trade”,Journal of International Economics 23 (3-4), 357-367.
[30] Khandelwal, Amit K., Peter K. Schott and Shang-Jin Wei (2013). “TradeLiberalization and Embedded Institutional Reform: Evidence from ChineseExporters”, American Economic Review 103 (6), 2169-2195.
[31] Kim, Jeonghoi (2010). “Recent Trends in Export Restrictions”, OECDTrade Policy Paper 101.
[32] Krugman, Paul (1980). “Scale Economies, Product Differentiation, and thePattern of Trade”, American Economic Review 70 (5), 950-959.
[33] Latina, Joelle, Roberta Piermartini and Michele Ruta (2011). “NaturalResources and Non-Cooperative Trade Policy”, International Economicsand Economic Policy 8 (2), 177-196.
[34] Lerner, A. P. (1936). “The Symmetry Between Import and Export Taxes”,Economica 3 (11), 306-313.
[35] McKinnon, Ronald I. (1966). “Intermediate Products and Differential Tar-iffs: A Generalization of Lerner’s Symmetry Theorem”, Quarterly Journalof Economics 80 (4), 584-615.
[36] Ossa, Ralph (2013). “Trade Wars and Trade Talks with Data”, mimeo.
35
[37] Price, Alan H. and D. Scott Nance (2010). “Export Barriers and the SteelIndustry”, in OECD (2010), The Economic Impact of Export Restrictionson Raw Materials, OECD Publishing.
[38] Rauch, James E. (1999). “Networks Versus Markets in InternationalTrade”, Journal of International Economics 48 (1), 7-35.
[39] Solleder, Olga (2013). “Panel Export Taxes (PET) Dataset: New Data onExport Tax Rates”, Graduate Institute of International and DevelopmentStudies Working Paper 07/2013.
[40] Venables, Anthony J. (1987) “Trade and Trade Policy with Differenti-ated Products: A Chamberlinian-Ricardian Model”, Economic Journal 97(387), 700-717.
[41] Wall Street Journal (2010). China Dangles Rare-Earth Resources to In-vestors, August 16, accessed via http://online.wsj.com/article/SB20001424052748703321004575427050544485366.html
[42] WTO (2001). Accession of the People’s Republic of China.
[43] WTO (2006). Trade Policy Review: Report by the Secretariat, People’sRepublic of China.
[44] WTO (2008). Trade Policy Review: Report by the Secretariat, China.
[45] WTO (2010). Trade Policy Review: Report by the Secretariat, China.
[46] WTO (2011). China - Measures Related to the Exportation of Various RawMaterials: Reports of the Panel.
[47] WTO (2012). Trade Policy Review: Report by the Secretariat, China.
A1 Calculation of total export taxes
A1.1 Export duties
According to Chinese regulations, for a published export duty rate tkx for aproduct k (hereafter this k is dropped), the tax owing on export sales of thatproduct is calculated according to:
tx ·exportsalesFOB
tx + 1
Here, the FOB price is the price at which goods are sold abroad (i.e. theprice of goods after clearing customs). This implies a tax rate of tx on exportsales in terms of pre-duty prices.
36
A1.2 VAT export rebates
For each product and time period, the data specifies a VAT rate, a rebate rateand the type of rebate policy applied to the product. Different policy typesimply different calculations of equivalent export taxes based on the associatedChinese regulations (see e.g. Chan 2008, Deloitte Touche Tomatsu 2005).
First note that firms whose sales are entirely domestic normally pay VAT onvalue added (at rate tkv for product k), by paying VAT on sales while claimingcredit for the VAT paid on purchases of inputs; i.e. they are charged for ‘outputVAT’ while claiming credit for ‘input VAT’. This corresponds to the followingformula (again omitting k):
tv ·sales
tv + 1− inputV AT
A1.2.1 Nonzero rebate, not tax-exempt
Consider a firm which produces the goods it sells abroad, and which exportsin a single product category for which the rebate rate is not zero. Such a firmmay calculate its VAT payable as the difference of output VAT on local salesand input VAT on local purchases as above, plus a third term d:
d = (exportsalesFOB,k −∑k′
bondedk′)(V ATratek − rebateratek)
where bondedk′
corresponds to purchases of imported inputs in sector k′ thatdo not go through customs, which may be nonzero if the firm participates inprocessing trade.
Say that the firm does not purchase bonded imports, and that its inputpurchases may be unambiguously allocated across inputs used for goods solddomestically and inputs used for exported goods. Then the tax applicable onexports is:
exportsalesFOB,k · (V ATratek − rebateratek)− inputV AT
Under the assumption that the nondistortionary policy is a full rebate ofVAT on exports, this would imply an export tax bill on a given product withVAT rate tv and rebate rate r of:
(tv − r) · exportsalesFOB
While the firm’s actual tax bill will differ from this depending on its inputVAT, the firm may be assumed to take reimbursement of input VAT into accountwhen purchasing inputs; i.e. the reimbursement of input VAT may be consideredto be a component of input prices. This implies a tax rate of tv−r
1−(tv−r) on pre-tax
export sales.Note that if the firm does not produce the goods exported, but instead buys
these from another firm for export, then input VAT (here, the amount of VAT
37
paid by the firm producing the goods to be exported) is rebated to this firmaccording to the prevailing rebate rate, so that it should be the pre-tax ratherthan the FOB price that is used in the calculation above. I abstract fromthis distinction by assuming that all exporters are the producers of the goodsexported.
A1.2.2 Zero rebate, not tax-exempt
Products with a zero rebate rate are treated as products sold domestically, sothat the applicable formula for tax payable is:
tv ·sales
tv + 1− inputV AT
Again assuming that that the nondistortionary policy is a full rebate of VATon exports, this implies a tax rate of tv on pre-export sales.
A1.2.3 Exempt from taxes
A small subset of products are classified as ‘exempt from taxes’, which meansthat they pay no output VAT on exports, but their input VAT is not reimbursed.I model the applicable export tax in this case as equal to exporters’ input VAT. Iuse the 2007 Chinese input-output table, in which I observe pre-tax gross outputand input shares, to calculate the rate of implied export tax per unit of pre-taxgross output for a given input-output industry. I then use a concordance betweenHS codes and 2007 Chinese input-output industries to apply these export taxrates to each product in the ‘tax-exempt’ category. This assumes uniformity ofproduction functions across products within input-output industries.
The export tax rate per unit of output for a given input-output sector k willthus be calculated to be: ∑
k′
βkk′ tk
′
v
1 + tk′v
where βkk′
is the observed expenditure share per unit currency of (pre-tax)output of industry k on inputs from industry k′.
A1.3 Aggregating the two taxes
Here, I calculate the export tax rate jointly implied by the two policies above,for each of the three types of VAT export rebate policies.
A1.3.1 Nonzero rebate, not tax-exempt
The applicable export taxes are:
txtx + 1
exportsales+ (tv − r) · exportsales
38
We may calculate the tax rate on pre-tax export sales using:
ppretax = pFOB − txtx + 1
pFOB − (tv − r) · pFOB
=⇒ pFOB =
(1− tx
tx + 1− (tv − r)
)−1ppretax
=⇒ pFOB =
(tx + (tv − r) + tx(tv − r)1− (tv − r)− tx(tv − r)
+ 1
)ppretax
So the applicable export tax rate on pre-tax export sales is tx+(tv−r)+tx(tv−r)1−(tv−r)−tx(tv−r) .
A1.3.2 Zero rebate, not tax-exempt
The applicable export taxes are:
txtx + 1
exportsales+tv
tv + 1exportsales
We may calculate the tax rate on pre-tax export sales using:
ppretax = pFOB − txtx + 1
pFOB − tvtv + 1
pFOB
=⇒ pFOB =
(1− tx
tx + 1− tvtv + 1
)−1ppretax
=⇒ pFOB =
(tx + tv + 2txtv
1− txtv+ 1
)ppretax
So the applicable export tax rate on pre-tax export sales is tx+tv+2txtv1−txtv .
39