exploring elements of exchange rate theory in a controlled environment eric fisher...
TRANSCRIPT
Exploring Elements of Exchange Rate Theory in a Controlled
EnvironmentEric Fisher ([email protected])
Virginia Tech, Ohio State University
Federal Reserve Bank of Cleveland
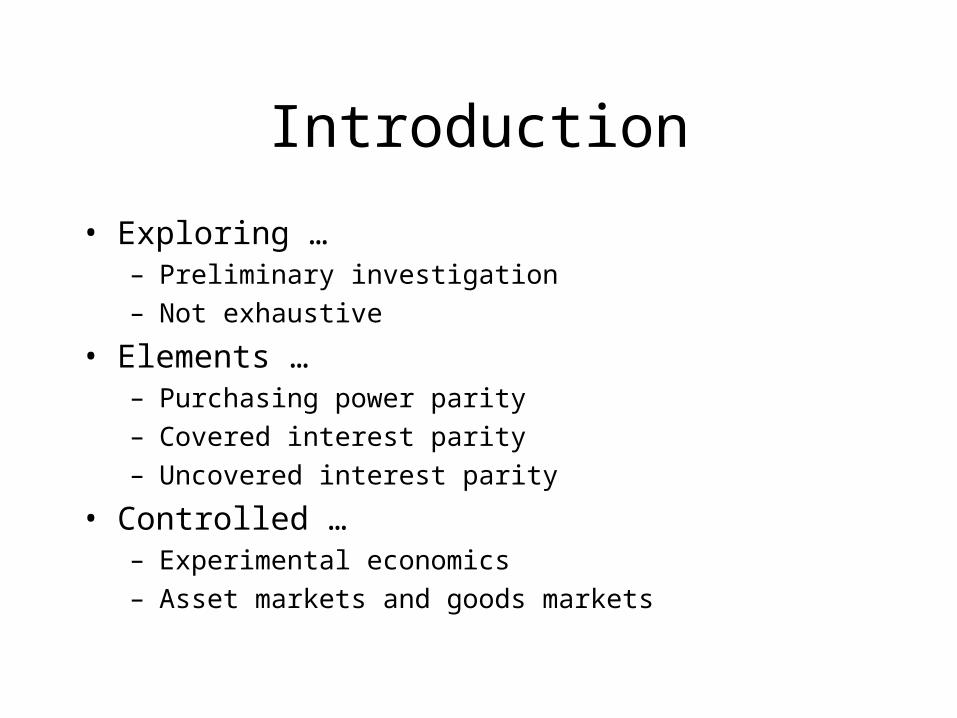
Introduction
• Exploring …– Preliminary investigation
– Not exhaustive
• Elements …– Purchasing power parity
– Covered interest parity
– Uncovered interest parity
• Controlled …– Experimental economics
– Asset markets and goods markets
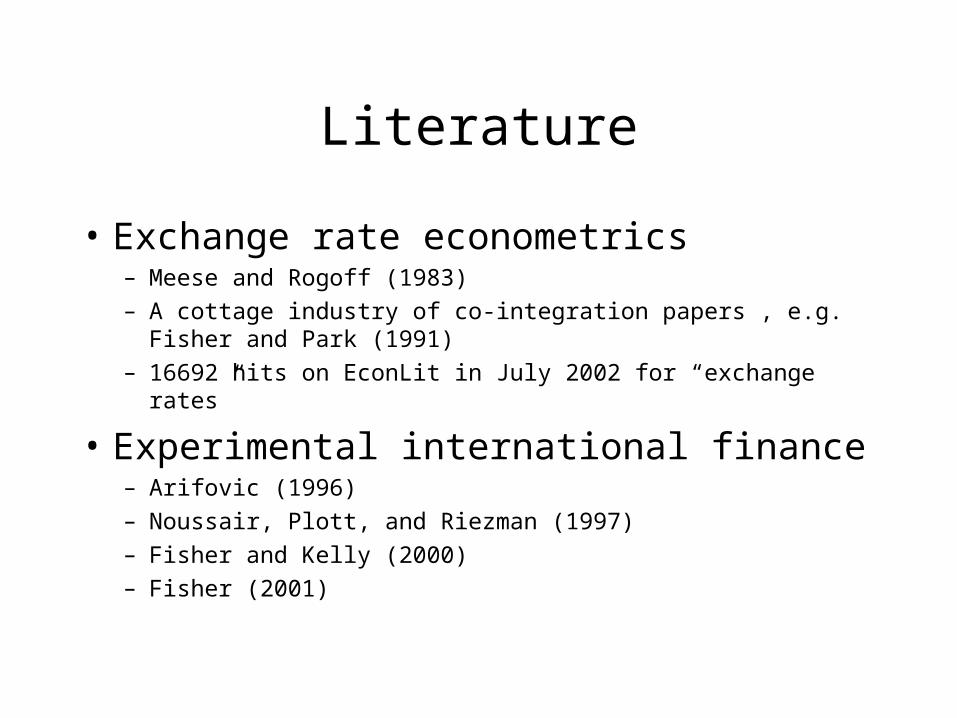
Literature
• Exchange rate econometrics– Meese and Rogoff (1983)
– A cottage industry of co-integration papers , e.g. Fisher and Park (1991)
– 16692 hits on EconLit in July 2002 for “exchange rates”
• Experimental international finance– Arifovic (1996)
– Noussair, Plott, and Riezman (1997)
– Fisher and Kelly (2000)
– Fisher (2001)
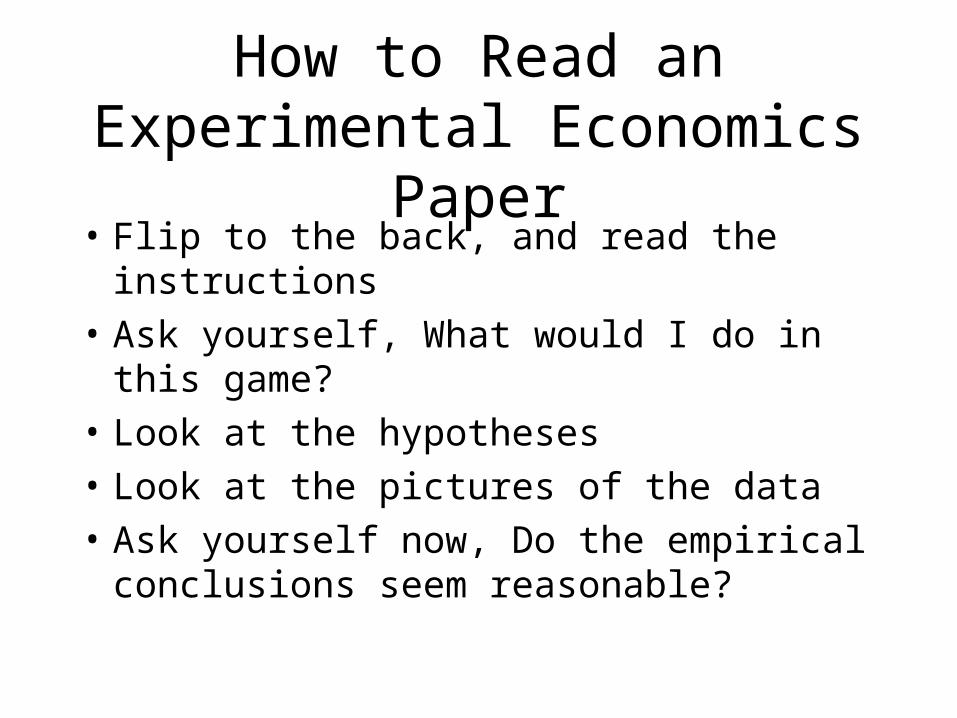
How to Read an Experimental Economics Paper
• Flip to the back, and read the instructions
• Ask yourself, What would I do in this game?
• Look at the hypotheses
• Look at the pictures of the data
• Ask yourself now, Do the empirical conclusions seem reasonable?
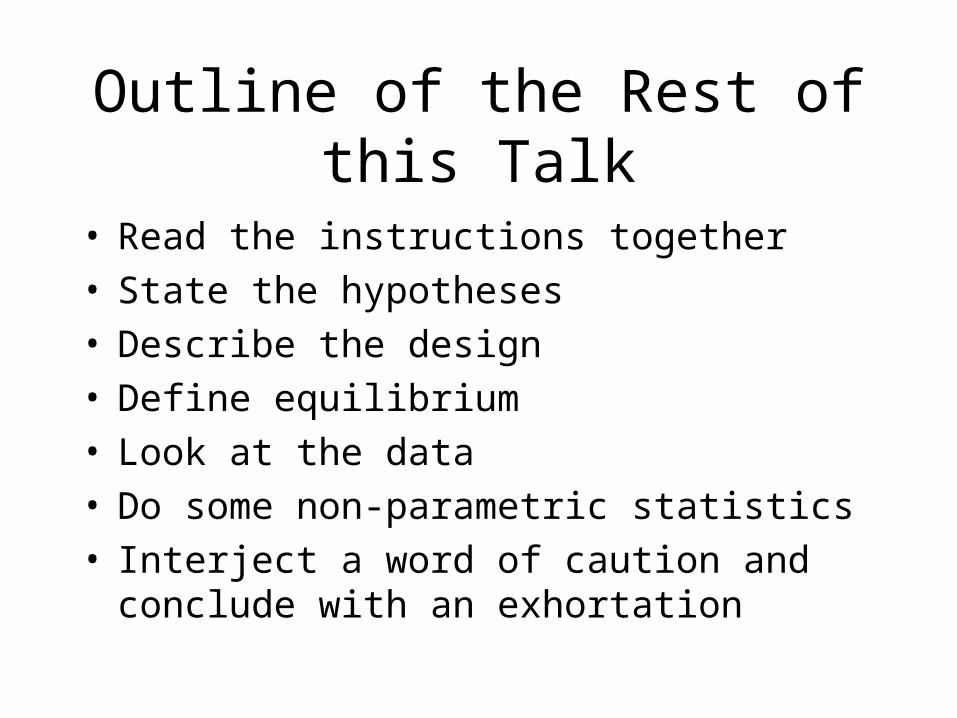
Outline of the Rest of this Talk
• Read the instructions together• State the hypotheses• Describe the design• Define equilibrium• Look at the data• Do some non-parametric statistics• Interject a word of caution and conclude with an
exhortation
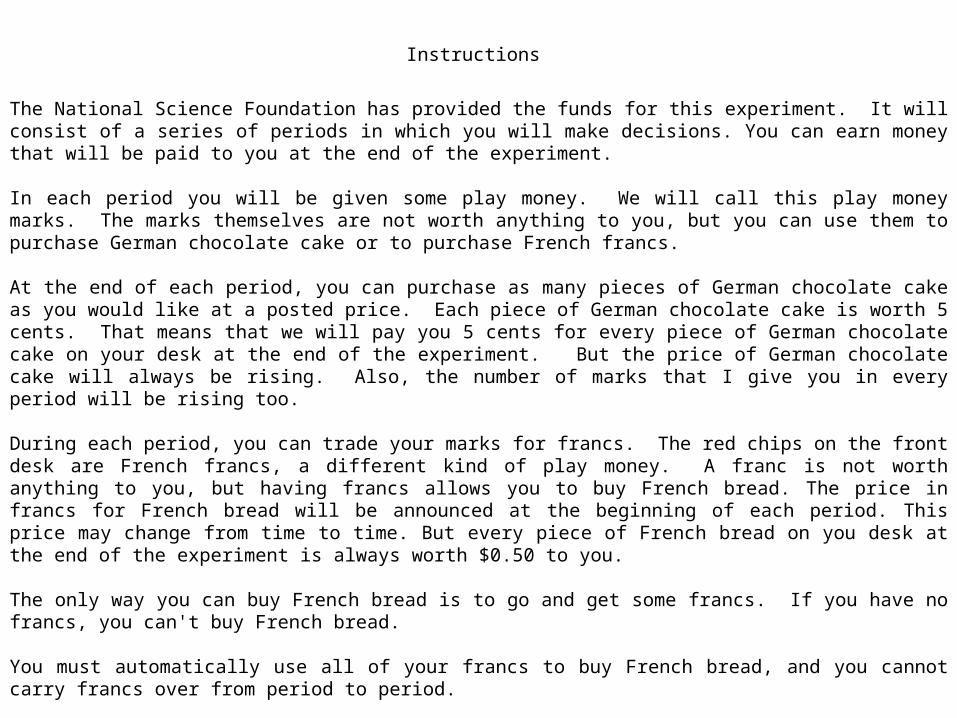
Instructions
The National Science Foundation has provided the funds for this experiment. It will consist of a series of periods in which you will make decisions. You can earn money that will be paid to you at the end of the experiment. In each period you will be given some play money. We will call this play money marks. The marks themselves are not worth anything to you, but you can use them to purchase German chocolate cake or to purchase French francs. At the end of each period, you can purchase as many pieces of German chocolate cake as you would like at a posted price. Each piece of German chocolate cake is worth 5 cents. That means that we will pay you 5 cents for every piece of German chocolate cake on your desk at the end of the experiment. But the price of German chocolate cake will always be rising. Also, the number of marks that I give you in every period will be rising too. During each period, you can trade your marks for francs. The red chips on the front desk are French francs, a different kind of play money. A franc is not worth anything to you, but having francs allows you to buy French bread. The price in francs for French bread will be announced at the beginning of each period. This price may change from time to time. But every piece of French bread on you desk at the end of the experiment is always worth $0.50 to you. The only way you can buy French bread is to go and get some francs. If you have no francs, you can't buy French bread. You must automatically use all of your francs to buy French bread, and you cannot carry francs over from period to period. You can buy a French franc by bidding for it. Just write down on the piece of paper how many marks you will pay for one French franc. Once I have collected everyone's pieces of paper, I will put the bids in order, from highest to lowest. This is the demand curve for French francs. I have a fixed supply of 4 francs that I will sell in each period. Where the demand curve crosses the supply curve determines the price of francs. I will
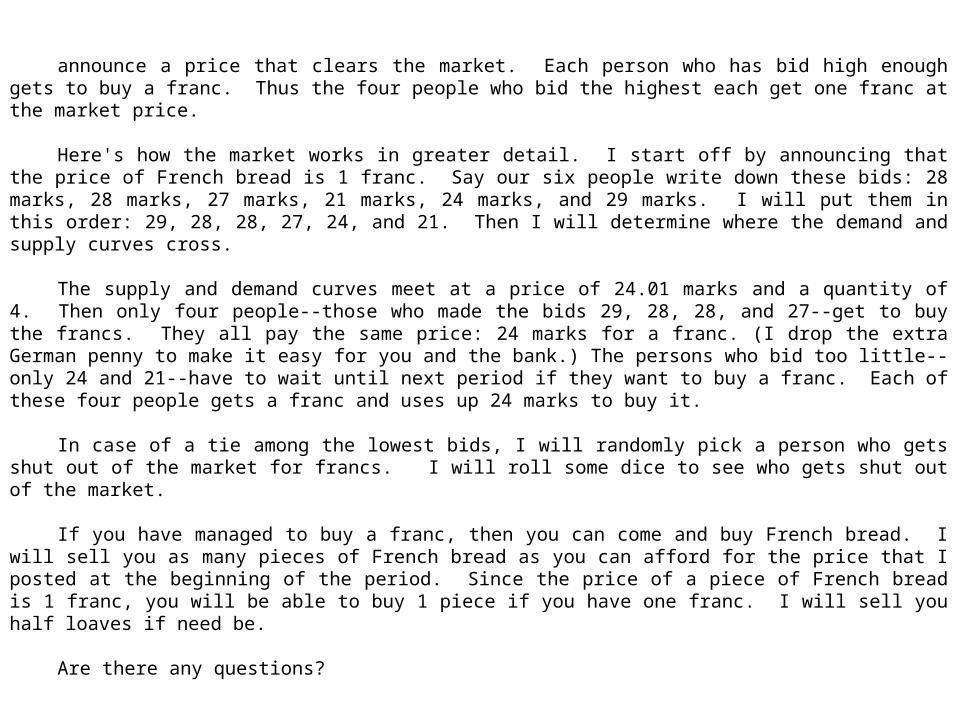
announce a price that clears the market. Each person who has bid high enough gets to buy a franc. Thus the four people who bid the highest each get one franc at the market price.
Here's how the market works in greater detail. I start off by announcing that the price of French bread is 1 franc. Say
our six people write down these bids: 28 marks, 28 marks, 27 marks, 21 marks, 24 marks, and 29 marks. I will put them in this order: 29, 28, 28, 27, 24, and 21. Then I will determine where the demand and supply curves cross.
The supply and demand curves meet at a price of 24.01 marks and a quantity of 4. Then only four people--those who
made the bids 29, 28, 28, and 27--get to buy the francs. They all pay the same price: 24 marks for a franc. (I drop the extra German penny to make it easy for you and the bank.) The persons who bid too little--only 24 and 21--have to wait until next period if they want to buy a franc. Each of these four people gets a franc and uses up 24 marks to buy it.
In case of a tie among the lowest bids, I will randomly pick a person who gets shut out of the market for francs. I will
roll some dice to see who gets shut out of the market. If you have managed to buy a franc, then you can come and buy French bread. I will sell you as many pieces of
French bread as you can afford for the price that I posted at the beginning of the period. Since the price of a piece of French bread is 1 franc, you will be able to buy 1 piece if you have one franc. I will sell you half loaves if need be.
Are there any questions?
GERMAN CHOCOLATE CAKE IS WORTH 5 CENTS
FRENCH BREAD IS WORTH 0.5 DOLLAR
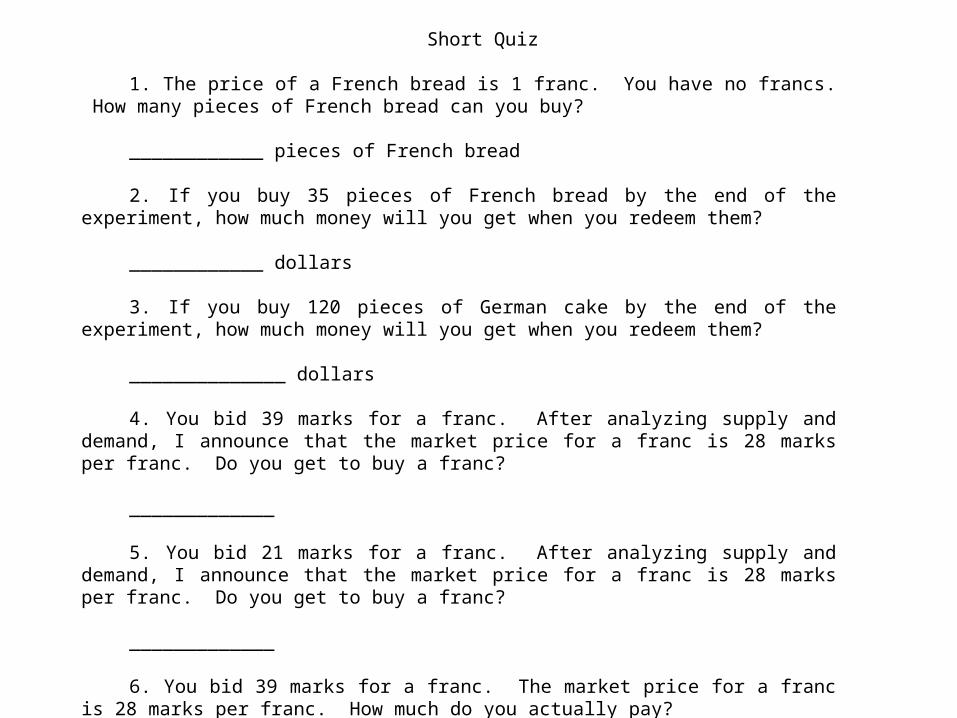
Short Quiz
1. The price of a French bread is 1 franc. You have no francs. How many pieces of French
bread can you buy? ____________ pieces of French bread 2. If you buy 35 pieces of French bread by the end of the experiment, how much money will
you get when you redeem them? ____________ dollars 3. If you buy 120 pieces of German cake by the end of the experiment, how much money will
you get when you redeem them? ______________ dollars 4. You bid 39 marks for a franc. After analyzing supply and demand, I announce that the
market price for a franc is 28 marks per franc. Do you get to buy a franc? _____________ 5. You bid 21 marks for a franc. After analyzing supply and demand, I announce that the
market price for a franc is 28 marks per franc. Do you get to buy a franc? _____________ 6. You bid 39 marks for a franc. The market price for a franc is 28 marks per franc. How
much do you actually pay? _____________ marks
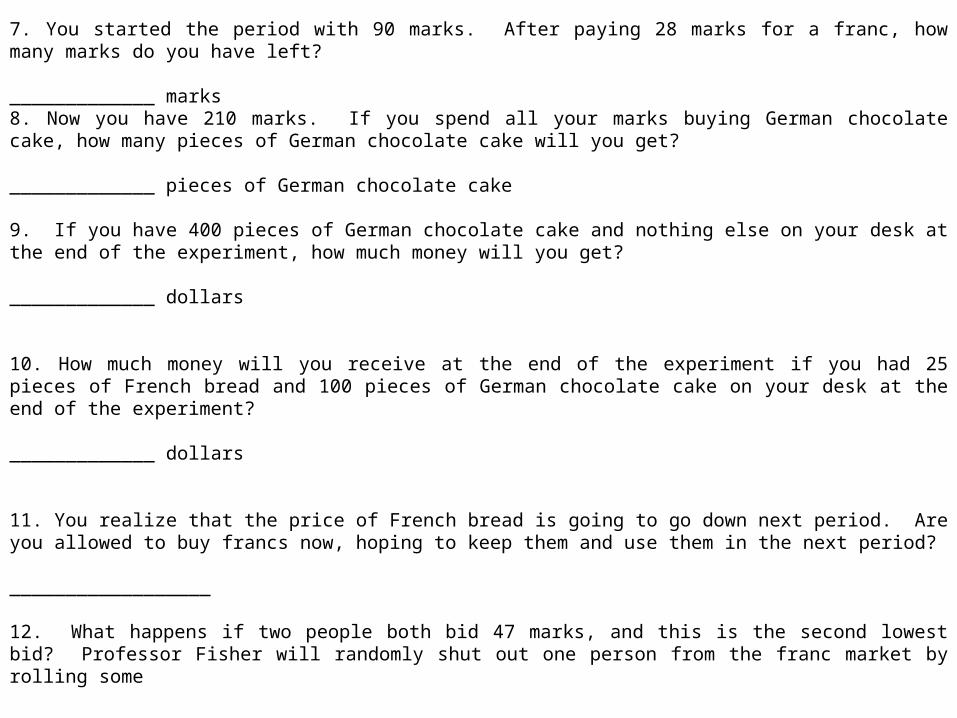
7. You started the period with 90 marks. After paying 28 marks for a franc, how many marks do you have left? _____________ marks8. Now you have 210 marks. If you spend all your marks buying German chocolate cake, how many pieces of German chocolate cake will you get? _____________ pieces of German chocolate cake 9. If you have 400 pieces of German chocolate cake and nothing else on your desk at the end of the experiment, how much money will you get? _____________ dollars 10. How much money will you receive at the end of the experiment if you had 25 pieces of French bread and 100 pieces of German chocolate cake on your desk at the end of the experiment? _____________ dollars 11. You realize that the price of French bread is going to go down next period. Are you allowed to buy francs now, hoping to keep them and use them in the next period? __________________ 12. What happens if two people both bid 47 marks, and this is the second lowest bid? Professor Fisher will randomly shut out one person from the franc market by rolling some ______________________.
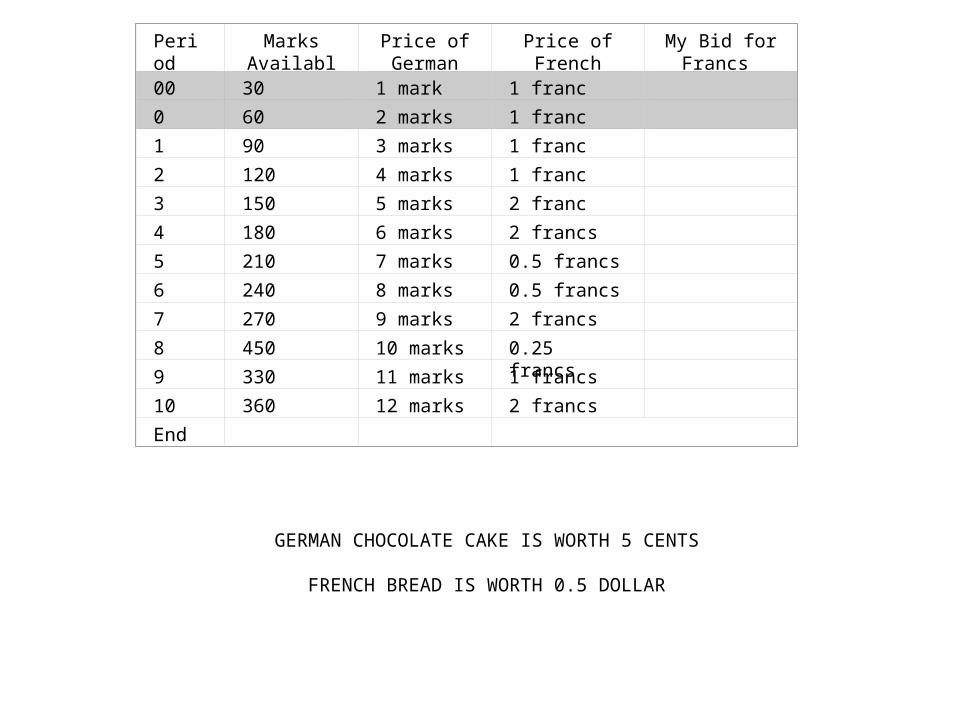
Period Marks Available
Price of German
Cake
Price of French Bread
My Bid for Francs
00 30 1 mark 1 franc
0 60 2 marks 1 franc
1 90 3 marks 1 franc
2 120 4 marks 1 franc
3 150 5 marks 2 franc
4 180 6 marks 2 francs
5 210 7 marks 0.5 francs
6 240 8 marks 0.5 francs
7 270 9 marks 2 francs
8 450 10 marks 0.25 francs
9 330 11 marks 1 francs
10 360 12 marks 2 francs
End
GERMAN CHOCOLATE CAKE IS WORTH 5 CENTS
FRENCH BREAD IS WORTH 0.5 DOLLAR
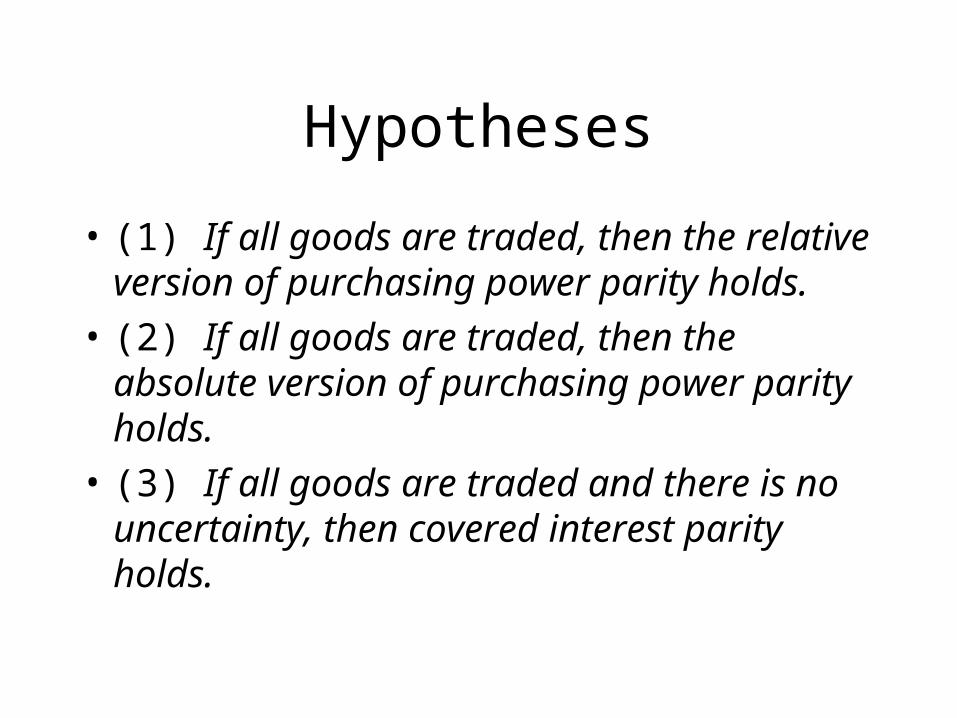
Hypotheses
• (1) If all goods are traded, then the relative version of purchasing power parity holds.
• (2) If all goods are traded, then the absolute version of purchasing power parity holds.
• (3) If all goods are traded and there is no uncertainty, then covered interest parity holds.
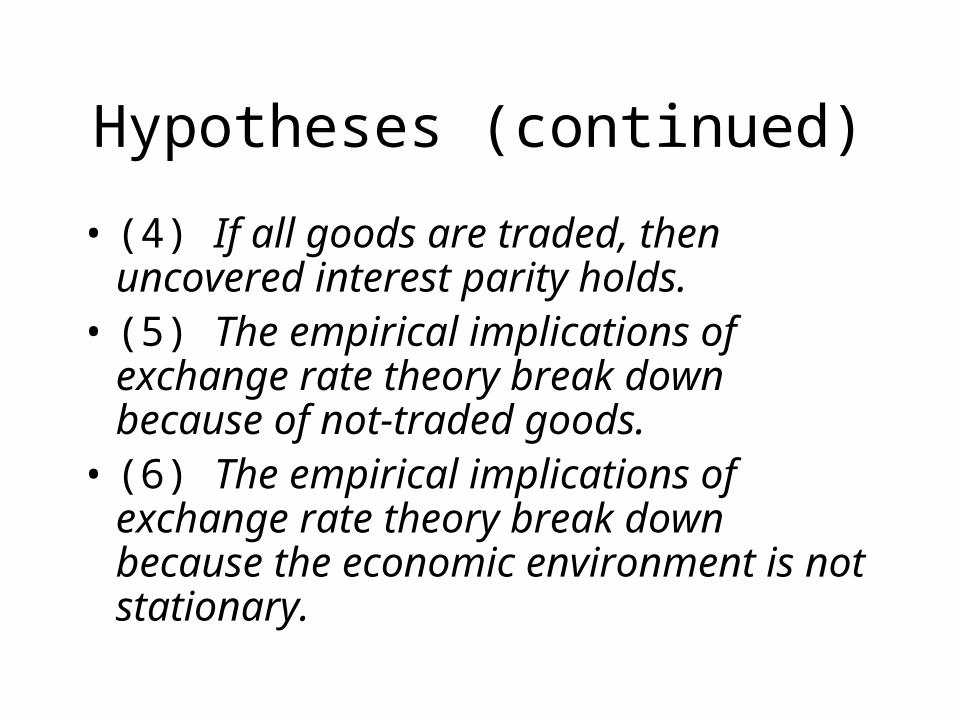
Hypotheses (continued)
• (4) If all goods are traded, then uncovered interest parity holds.
• (5) The empirical implications of exchange rate theory break down because of not-traded goods.
• (6) The empirical implications of exchange rate theory break down because the economic environment is not stationary.
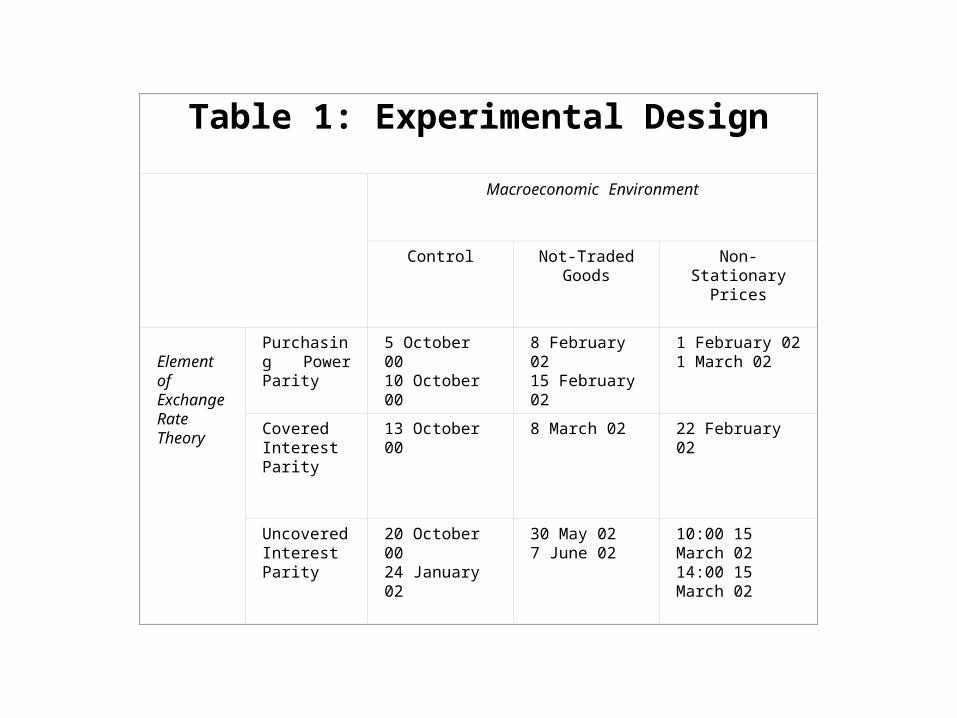
Table 1: Experimental Design
Macroeconomic Environment
Control Not-Traded Goods
Non-Stationary Prices
Element of Exchange Rate Theory
Purchasing Power Parity
5 October 0010 October 00
8 February 0215 February 02
1 February 021 March 02
Covered Interest Parity
13 October 00 8 March 02 22 February 02
Uncovered Interest Parity
20 October 0024 January 02
30 May 027 June 02
10:00 15 March 0214:00 15 March 02
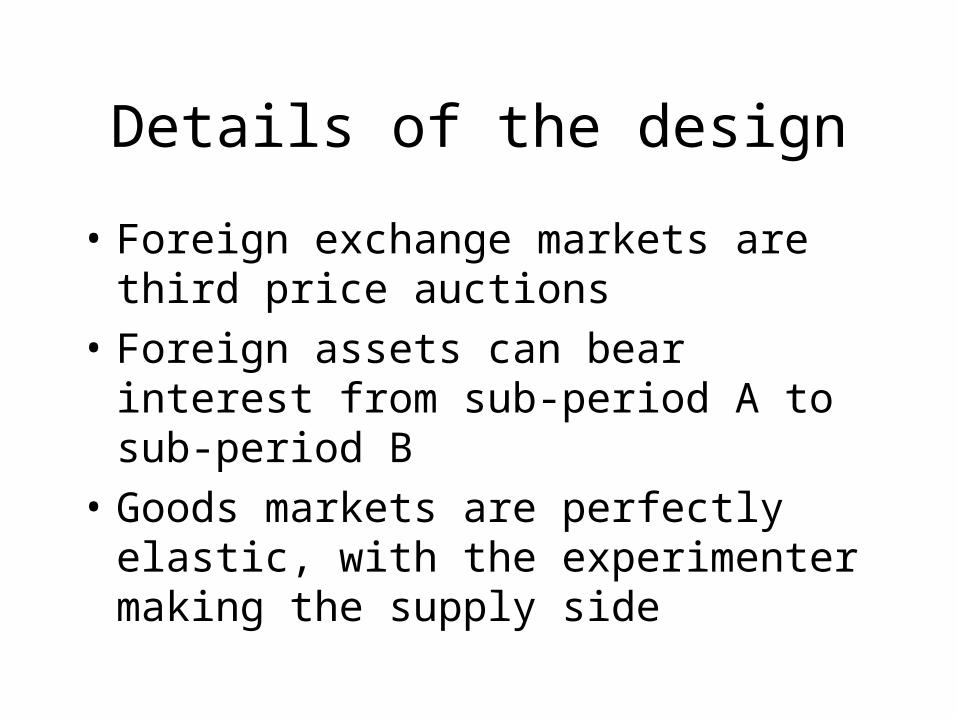
Details of the design
• Foreign exchange markets are third price auctions
• Foreign assets can bear interest from sub-period A to sub-period B
• Goods markets are perfectly elastic, with the experimenter making the supply side
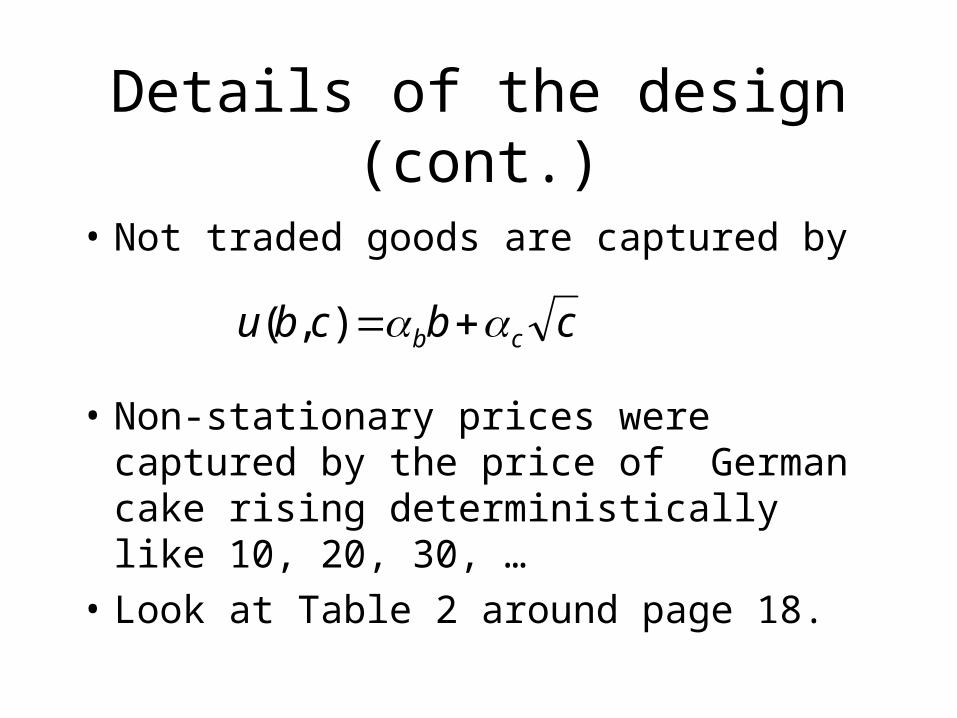
Details of the design (cont.)
• Not traded goods are captured by
• Non-stationary prices were captured by the price of German cake rising deterministically like 10, 20, 30, …
• Look at Table 2 around page 18.
cbcbu cb ),(
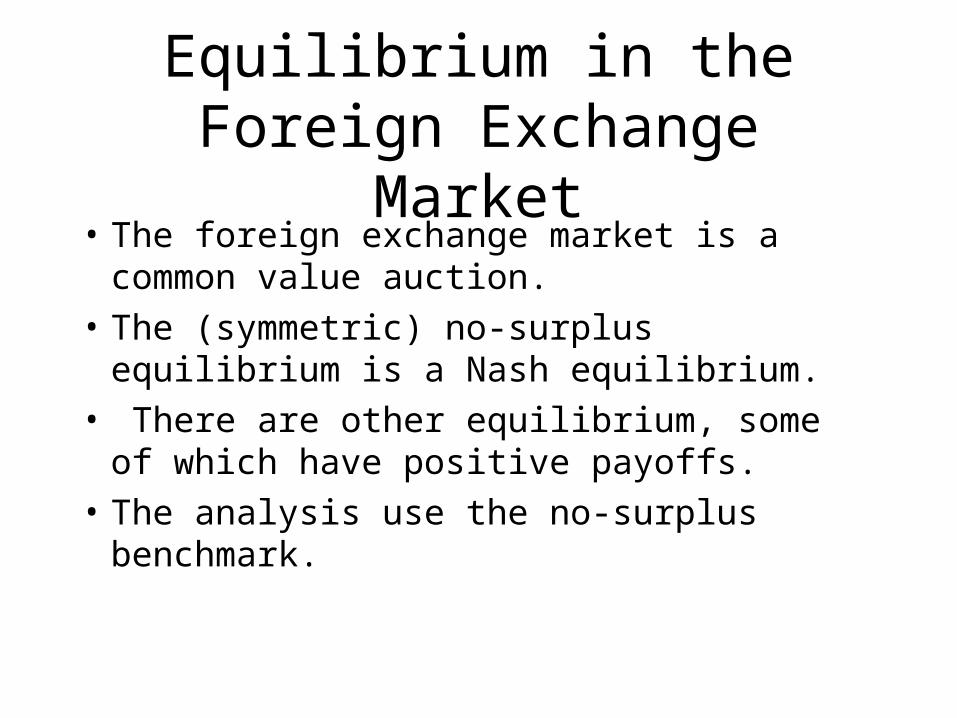
Equilibrium in the Foreign Exchange Market
• The foreign exchange market is a common value auction.
• The (symmetric) no-surplus equilibrium is a Nash equilibrium.
• There are other equilibrium, some of which have positive payoffs.
• The analysis use the no-surplus benchmark.
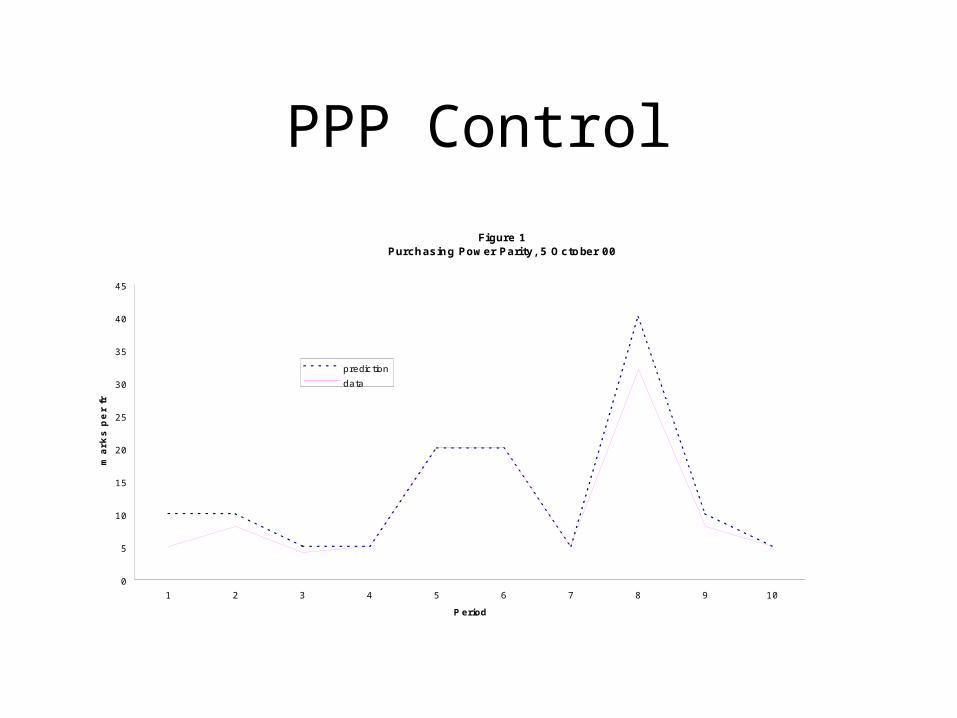
PPP Control
Figure 1Purch asing Pow er Pari ty, 5 O cto ber 00
0
5
10
15
20
25
30
35
40
45
1 2 3 4 5 6 7 8 9 10
P eriod
ma
rks
pe
r f
ran
c
predic tion
data
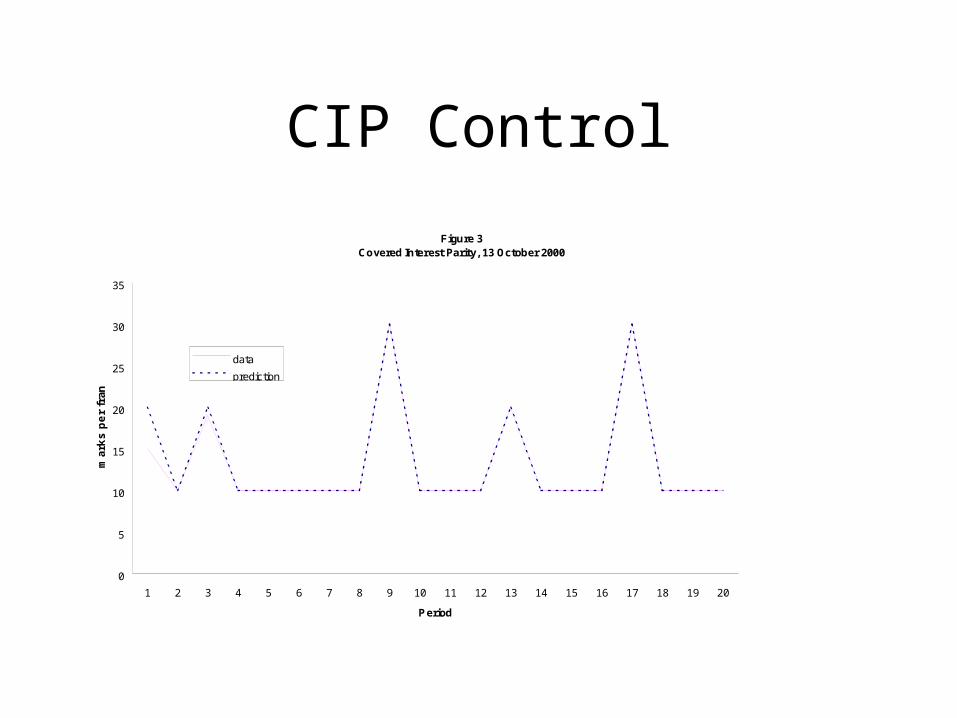
CIP Control
Figure 3Covered Interest Parity, 13 October 2000
0
5
10
15
20
25
30
35
1 2 3 4 5 6 7 8 9 10 11 12 13 14 15 16 17 18 19 20
Period
ma
rks
pe
r fr
anc
data
prediction
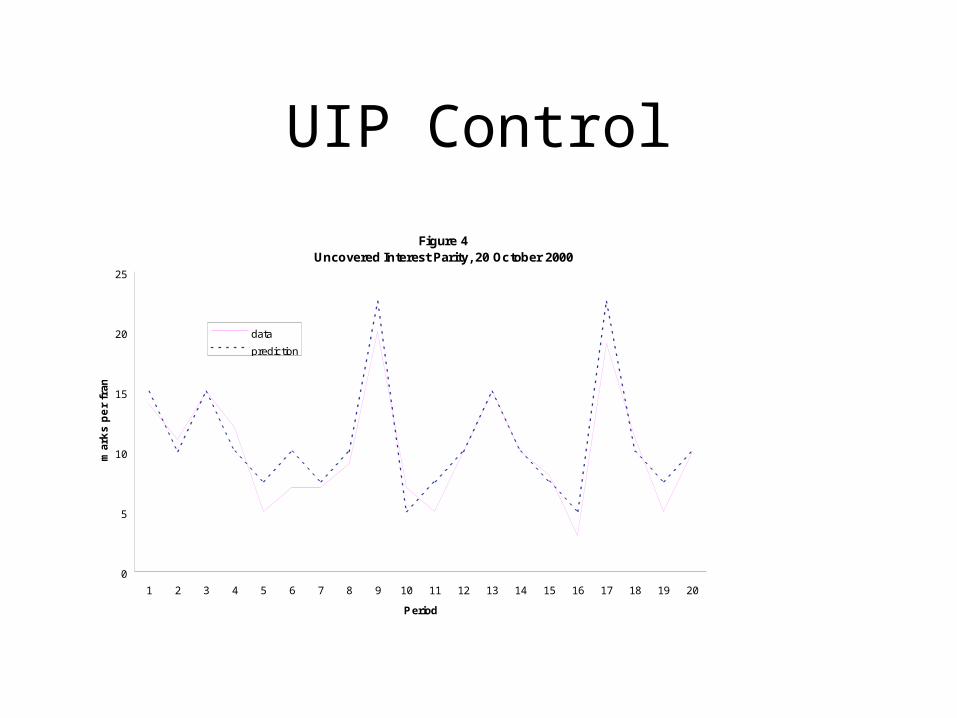
UIP Control
Figure 4Uncovered Interest Parity, 20 October 2000
0
5
10
15
20
25
1 2 3 4 5 6 7 8 9 10 11 12 13 14 15 16 17 18 19 20
Period
mar
ks
pe
r fr
anc
data
prediction
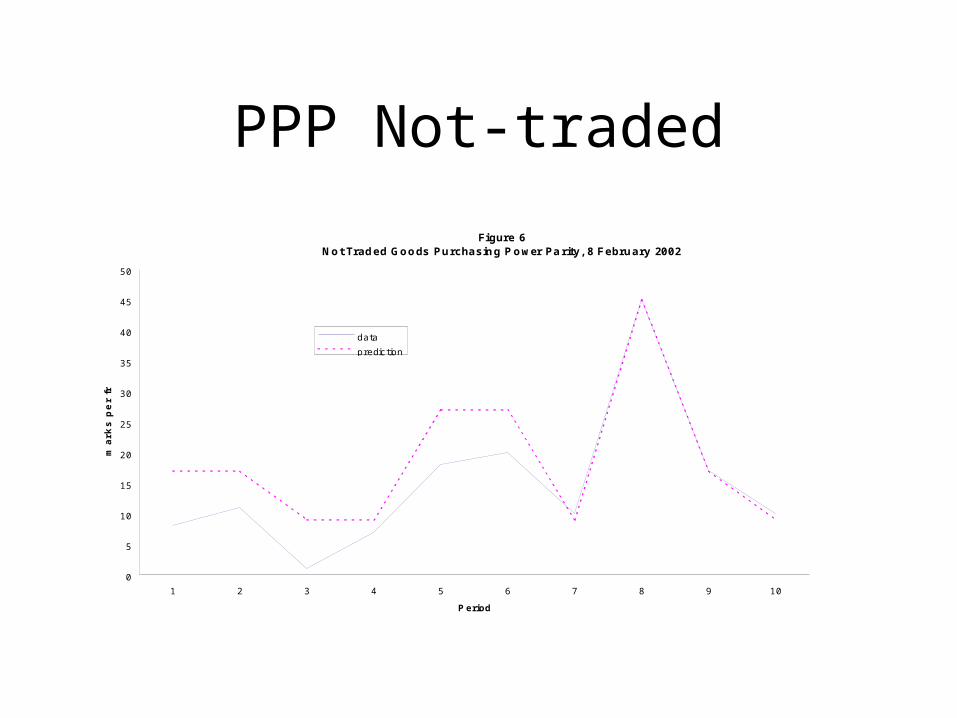
PPP Not-traded
Figure 6No t Trad ed Goo ds Purchasin g P o wer Pa rity, 8 February 2002
0
5
10
15
20
25
30
35
40
45
50
1 2 3 4 5 6 7 8 9 10
P eriod
ma
rks
pe
r f
ran
c
data
predic tion
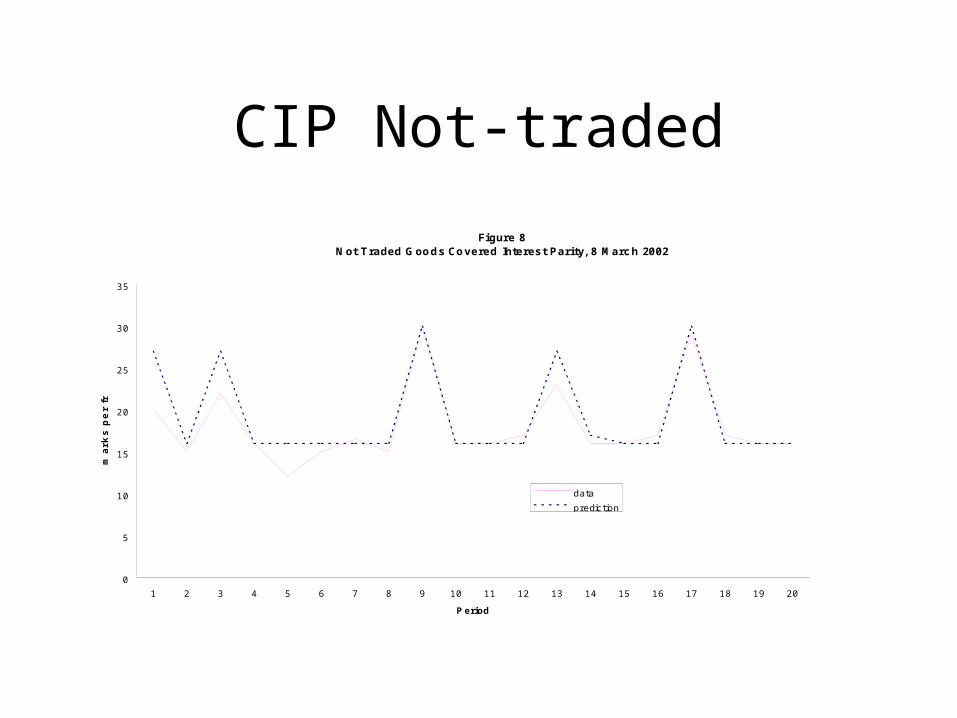
CIP Not-traded
Figure 8N ot T raded G oo d s Co vered Interest Parity, 8 Marc h 2002
0
5
10
15
20
25
30
35
1 2 3 4 5 6 7 8 9 10 11 12 13 14 15 16 17 18 19 20
P eriod
ma
rks
pe
r f
ran
c
data
predic tion
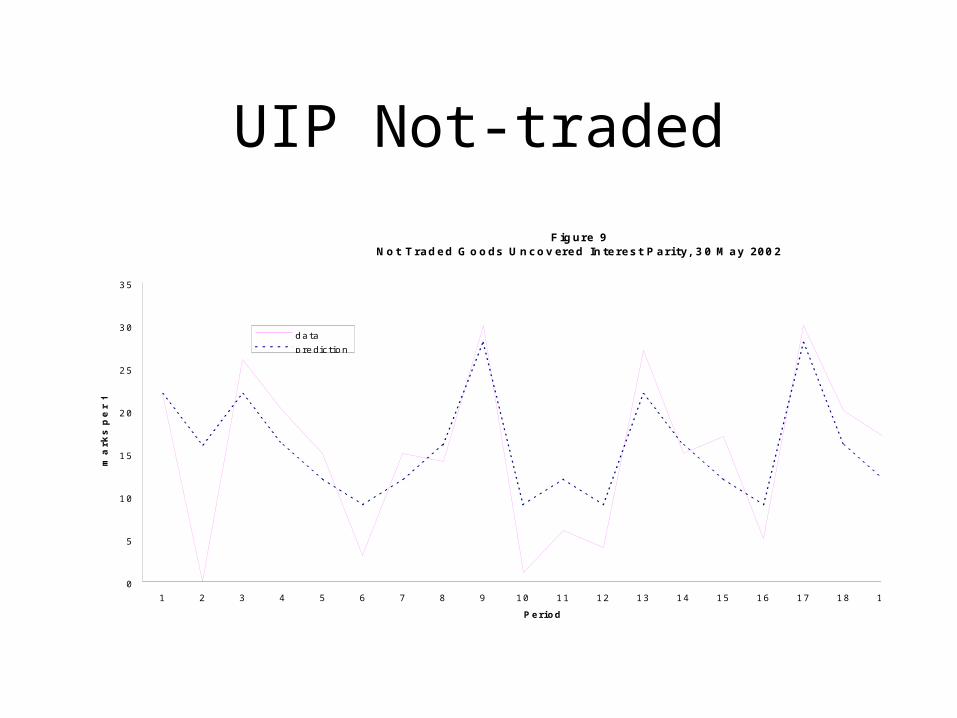
UIP Not-traded
F ig ur e 9N o t T r a d e d G o o ds U n c o v er e d In te r e s t P a r i ty, 3 0 M a y 20 0 2
0
5
1 0
1 5
2 0
2 5
3 0
3 5
1 2 3 4 5 6 7 8 9 1 0 1 1 1 2 1 3 1 4 1 5 1 6 1 7 1 8 1 9 2 0
P e r i o d
ma
rk
s p
er
fra
nc
d a t a
p re dic t io n
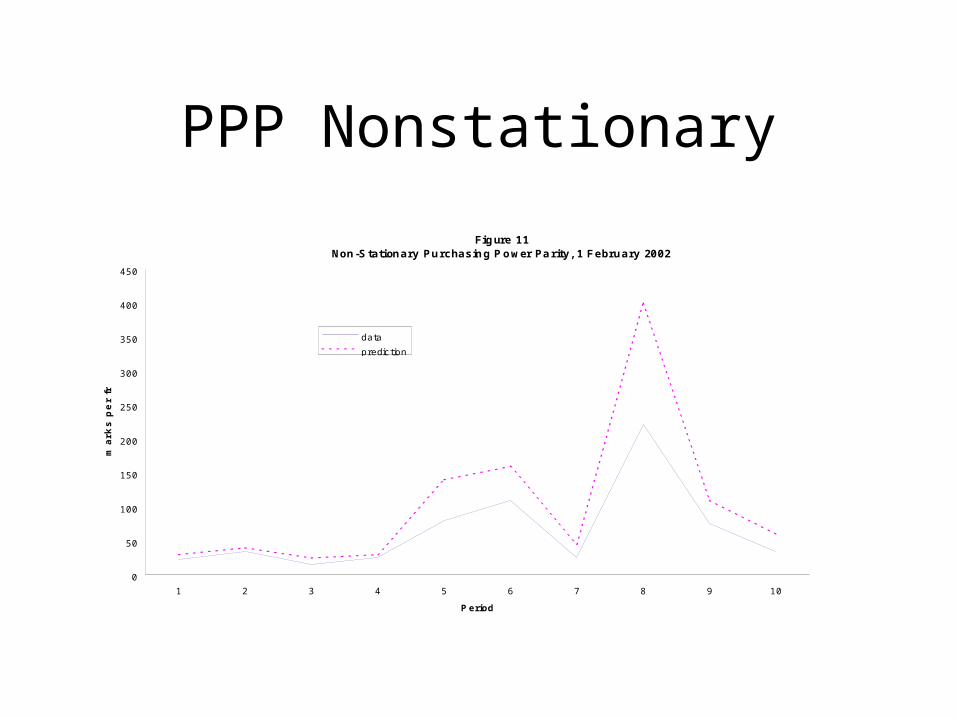
PPP Nonstationary
Fig ure 11Non-S tationary Purchasin g P o wer Pa rity, 1 February 2002
0
50
100
150
200
250
300
350
400
450
1 2 3 4 5 6 7 8 9 10
P eriod
ma
rks
pe
r f
ran
c
data
predic tion
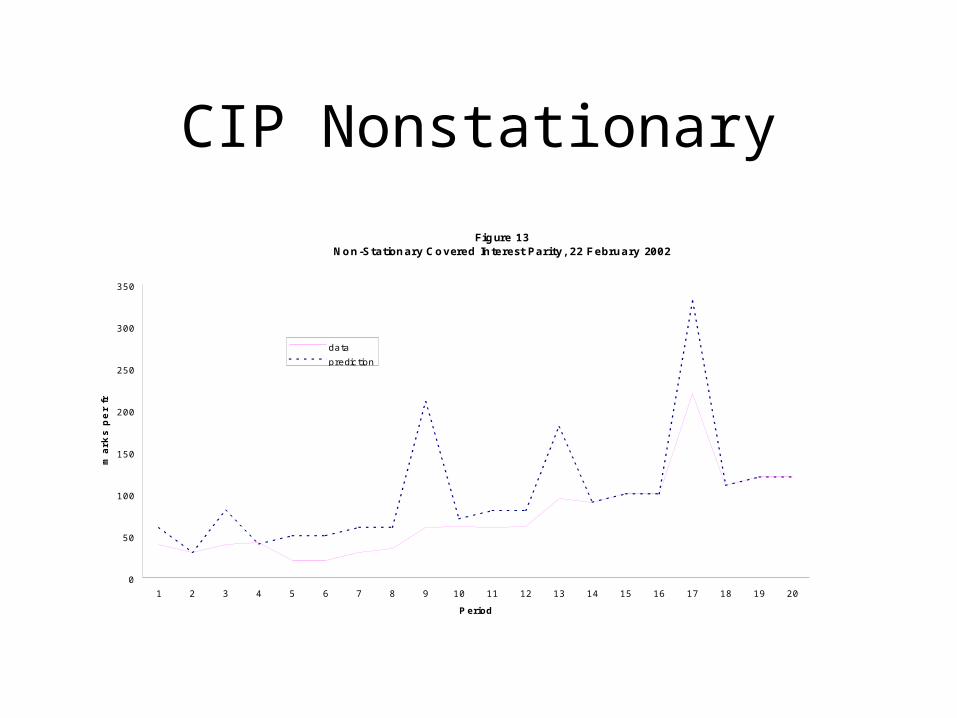
CIP Nonstationary
Fig ure 13No n -Station ary Co vered In terest Parity, 22 February 2002
0
50
100
150
200
250
300
350
1 2 3 4 5 6 7 8 9 10 11 12 13 14 15 16 17 18 19 20
P eriod
ma
rks
pe
r f
ran
c
data
predic tion
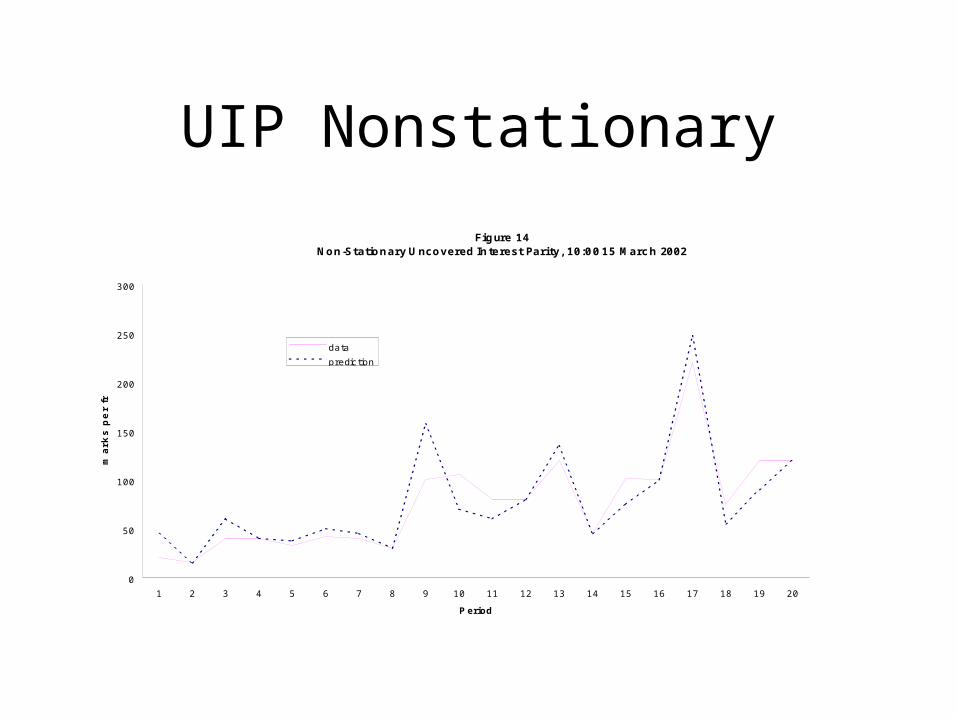
UIP Nonstationary
Fig ure 14Non -Station ary U ncovered In terest Parity, 10:0 0 15 Marc h 2002
0
50
100
150
200
250
300
1 2 3 4 5 6 7 8 9 10 11 12 13 14 15 16 17 18 19 20
P eriod
ma
rks
pe
r f
ran
c
data
predic tion
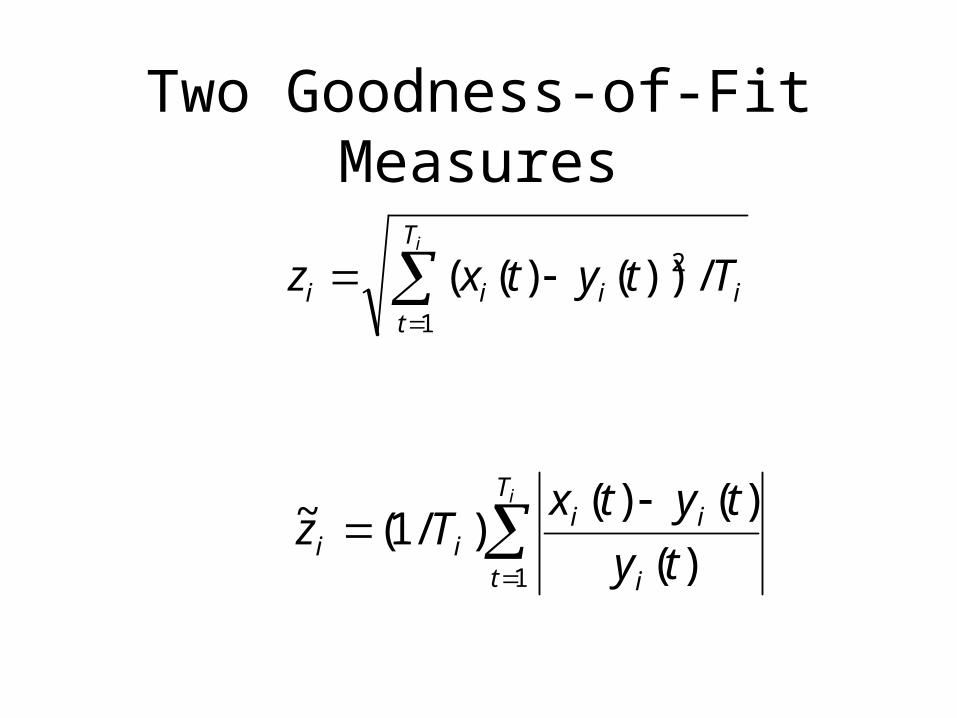
Two Goodness-of-Fit Measures
iT
tiiii Ttytxz
1
2 /))()((
iT
t i
iiii ty
tytxTz
1 )(
)()()/1(~
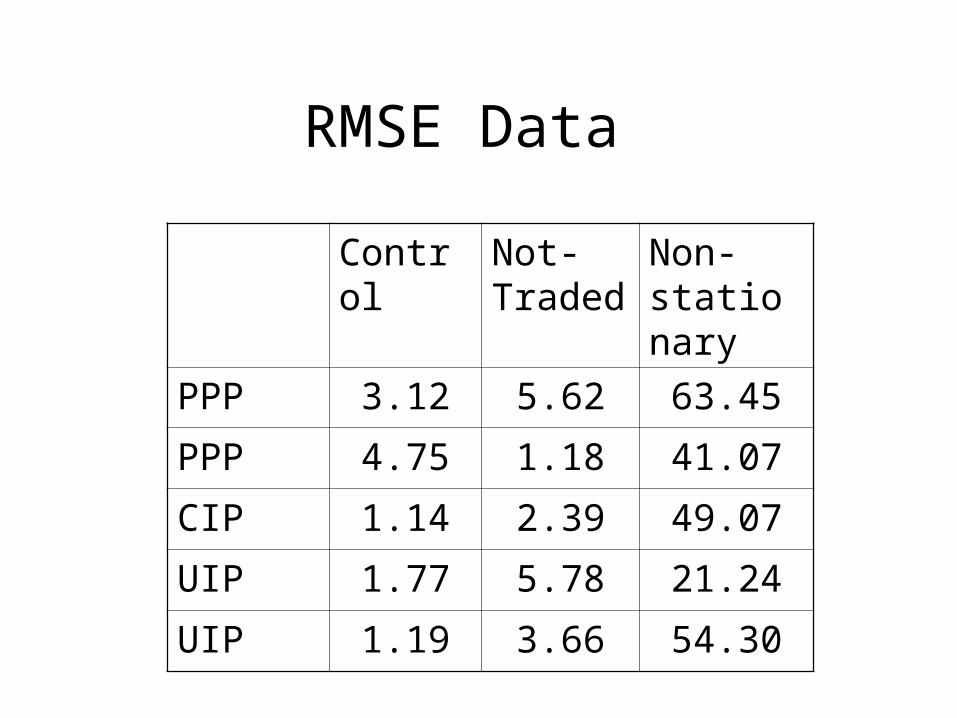
RMSE Data
Control Not-Traded
Non-stationary
PPP 3.12 5.62 63.45
PPP 4.75 1.18 41.07
CIP 1.14 2.39 49.07
UIP 1.77 5.78 21.24
UIP 1.19 3.66 54.30
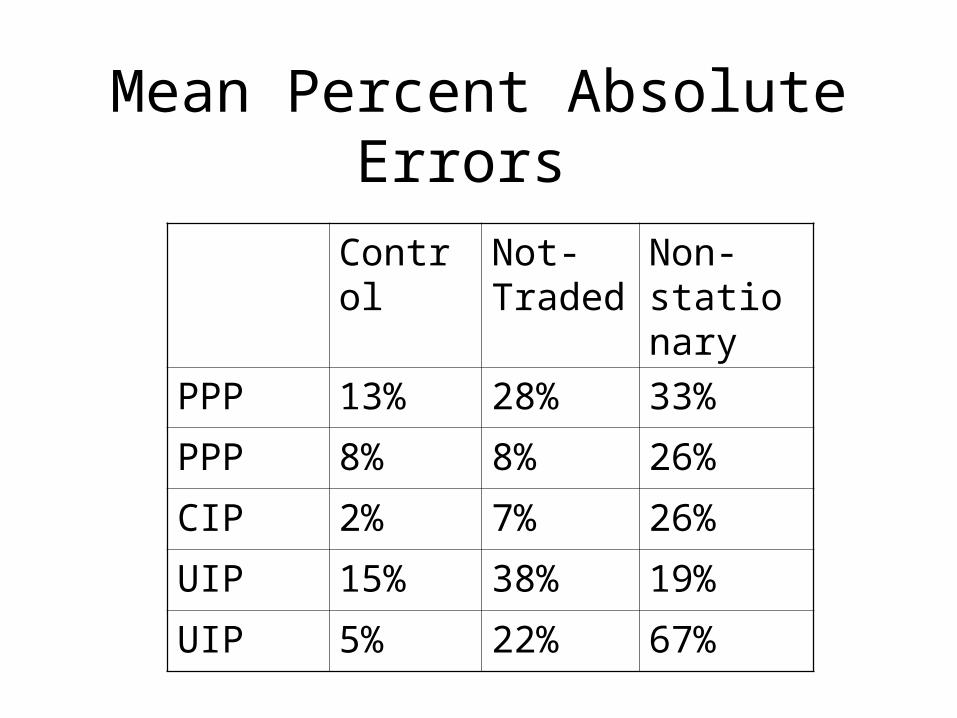
Mean Percent Absolute Errors
Control Not-Traded
Non-stationary
PPP 13% 28% 33%
PPP 8% 8% 26%
CIP 2% 7% 26%
UIP 15% 38% 19%
UIP 5% 22% 67%
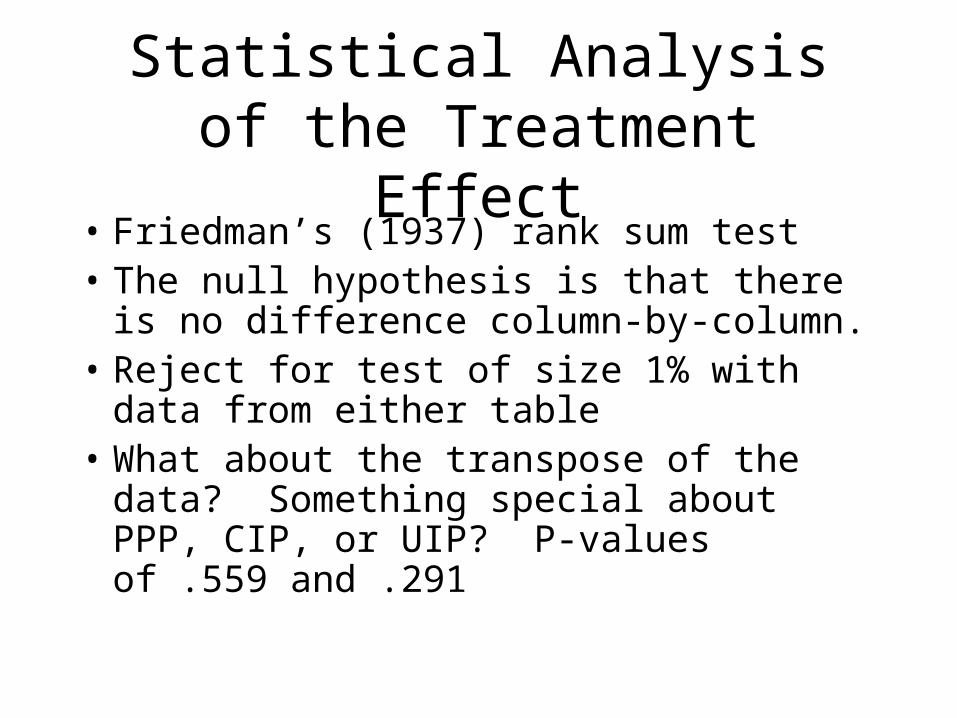
Statistical Analysis of the Treatment Effect
• Friedman’s (1937) rank sum test• The null hypothesis is that there is no
difference column-by-column. • Reject for test of size 1% with data from
either table• What about the transpose of the data?
Something special about PPP, CIP, or UIP? P-values of .559 and .291
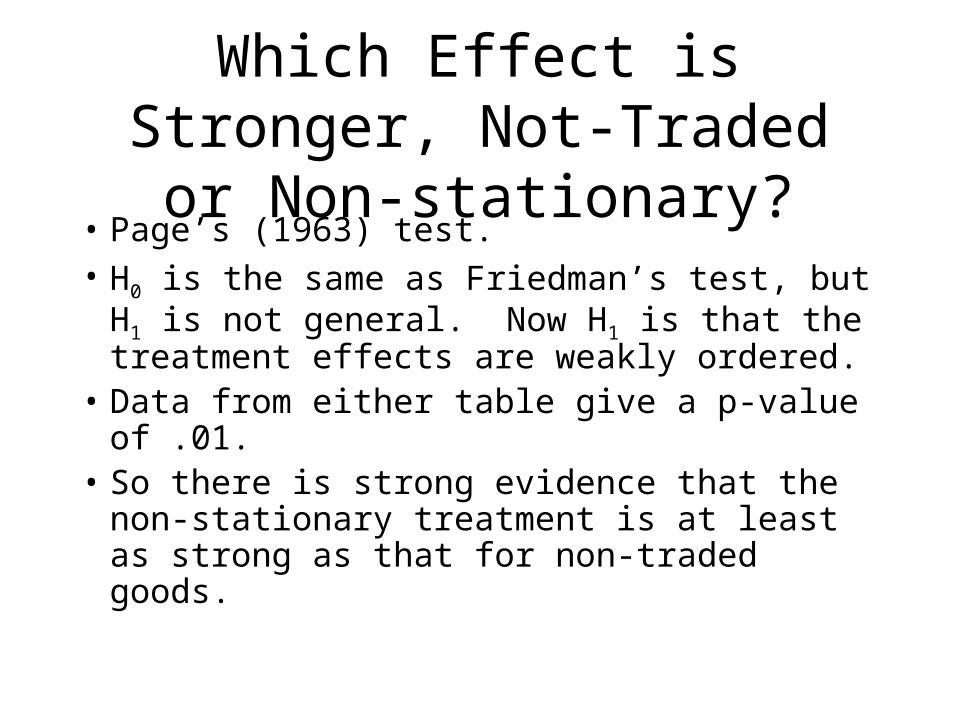
Which Effect is Stronger, Not-Traded or Non-stationary?
• Page’s (1963) test.• H0 is the same as Friedman’s test, but H1 is
not general. Now H1 is that the treatment effects are weakly ordered.
• Data from either table give a p-value of .01.• So there is strong evidence that the non-
stationary treatment is at least as strong as that for non-traded goods.
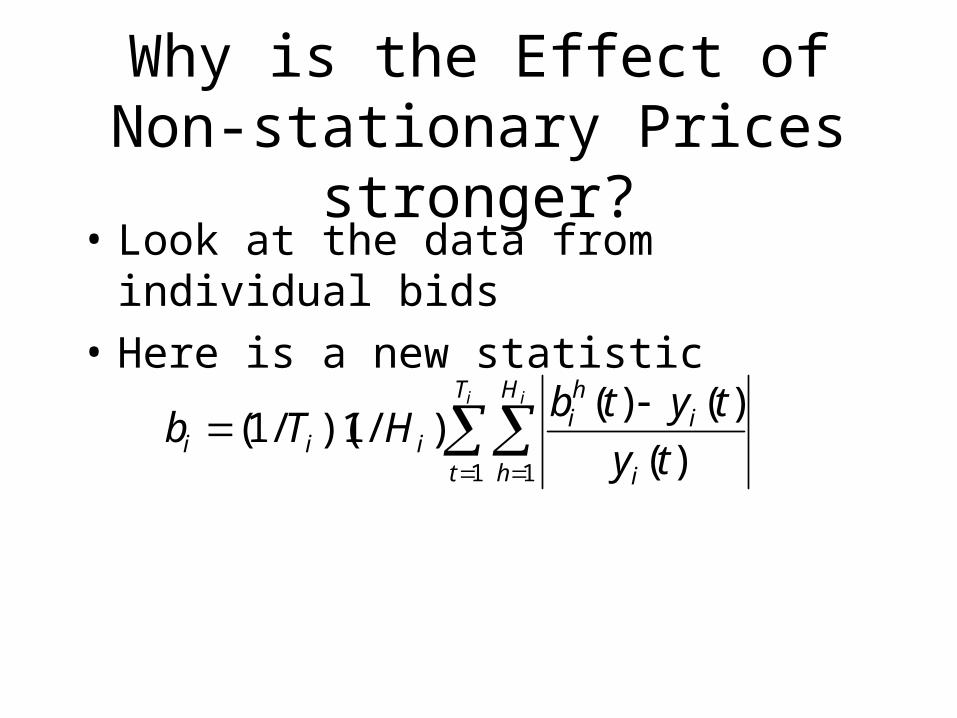
Why is the Effect of Non-stationary Prices stronger?
• Look at the data from individual bids
• Here is a new statistic
i iT
t
H
h i
ihi
iii ty
tytbHTb
1 1 )(
)()()/1)(/1(
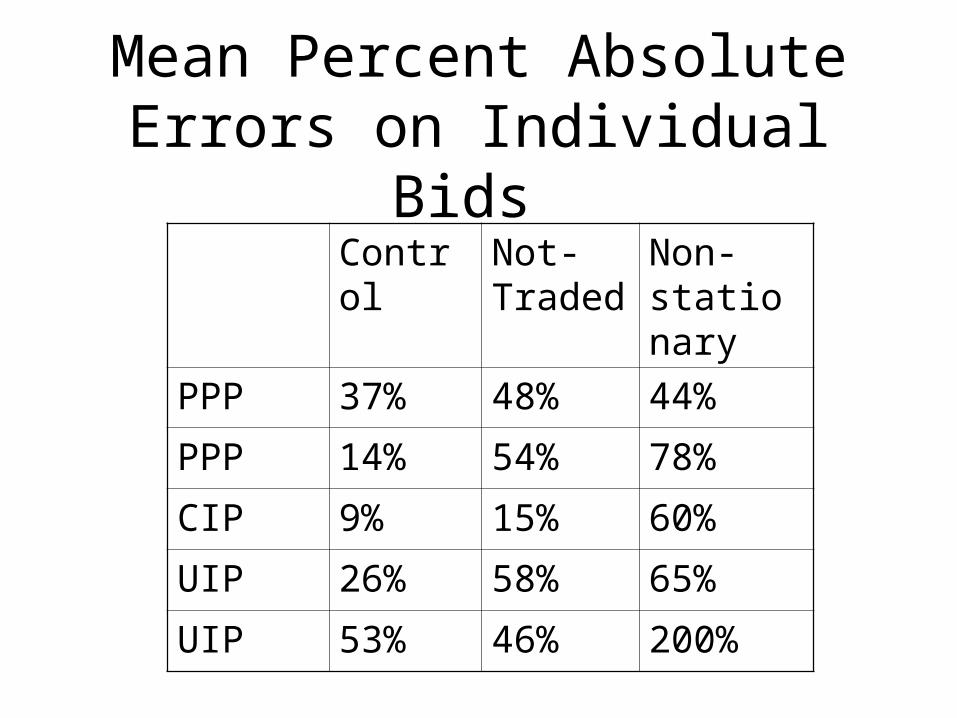
Mean Percent Absolute Errors on Individual Bids
Control Not-Traded
Non-stationary
PPP 37% 48% 44%
PPP 14% 54% 78%
CIP 9% 15% 60%
UIP 26% 58% 65%
UIP 53% 46% 200%
Are the infra-marginal bidders confused?
• These spreads are much bigger than the analogs for the market prices.
• Page test rejects for a test of size 1%. Thus the bids are more dispersed in the non-stationary treatment
• Marginal bidders are not so confused; they make the exchange rate.
Word of Caution
• Two different drugs to three related species
• The placebo has the lowest mortality rate, then the rates are ordered
• What can I say about the doses? Did I get them right?
Conclusions
• These elements seem to bear up well in general. Hypotheses 1, 2, 3, and 4 are true.
• Hypothesis 5 is false
• Hypothesis 6 is true
• Public exhortation: let’s do more “serious” empirical work in macro and finance.