exploratory data analysis - uc...
TRANSCRIPT
1
Exploratory Data Analysis
Maneesh Agrawala
CS 294-10: Visualization Fall 2013
Last Time: Visualization Designs
2
3
4
5
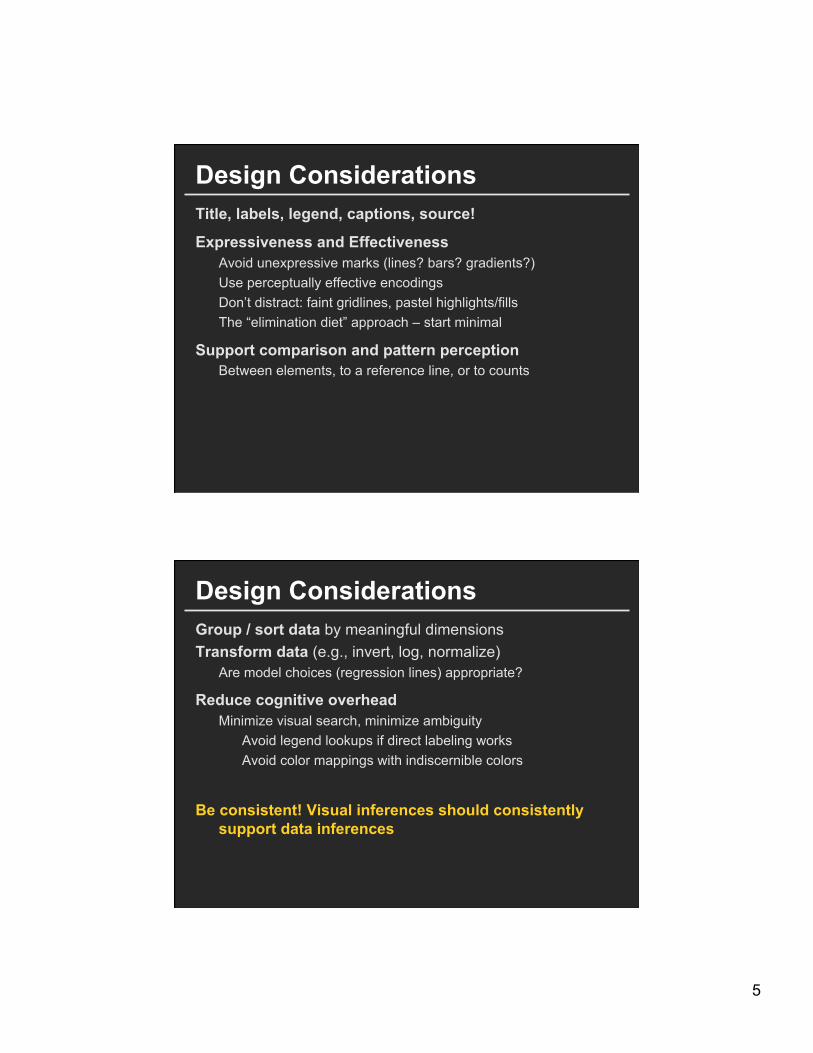
Design Considerations Title, labels, legend, captions, source!
Expressiveness and Effectiveness Avoid unexpressive marks (lines? bars? gradients?) Use perceptually effective encodings Don’t distract: faint gridlines, pastel highlights/fills The “elimination diet” approach – start minimal
Support comparison and pattern perception Between elements, to a reference line, or to counts
Design Considerations Group / sort data by meaningful dimensions Transform data (e.g., invert, log, normalize)
Are model choices (regression lines) appropriate?
Reduce cognitive overhead Minimize visual search, minimize ambiguity
Avoid legend lookups if direct labeling works Avoid color mappings with indiscernible colors
Be consistent! Visual inferences should consistently
support data inferences
6
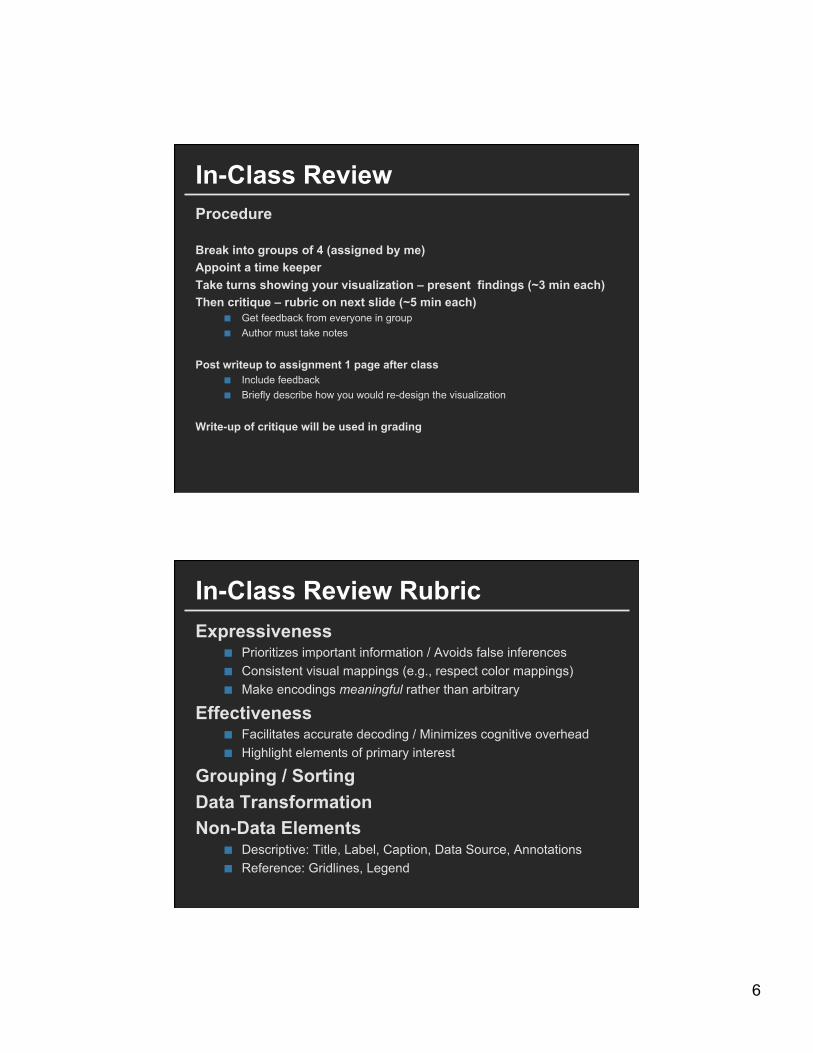
In-Class Review Procedure Break into groups of 4 (assigned by me) Appoint a time keeper Take turns showing your visualization – present findings (~3 min each) Then critique – rubric on next slide (~5 min each)
Get feedback from everyone in group Author must take notes
Post writeup to assignment 1 page after class Include feedback Briefly describe how you would re-design the visualization
Write-up of critique will be used in grading
In-Class Review Rubric Expressiveness
Prioritizes important information / Avoids false inferences Consistent visual mappings (e.g., respect color mappings) Make encodings meaningful rather than arbitrary
Effectiveness Facilitates accurate decoding / Minimizes cognitive overhead Highlight elements of primary interest
Grouping / Sorting Data Transformation Non-Data Elements
Descriptive: Title, Label, Caption, Data Source, Annotations Reference: Gridlines, Legend
7
8
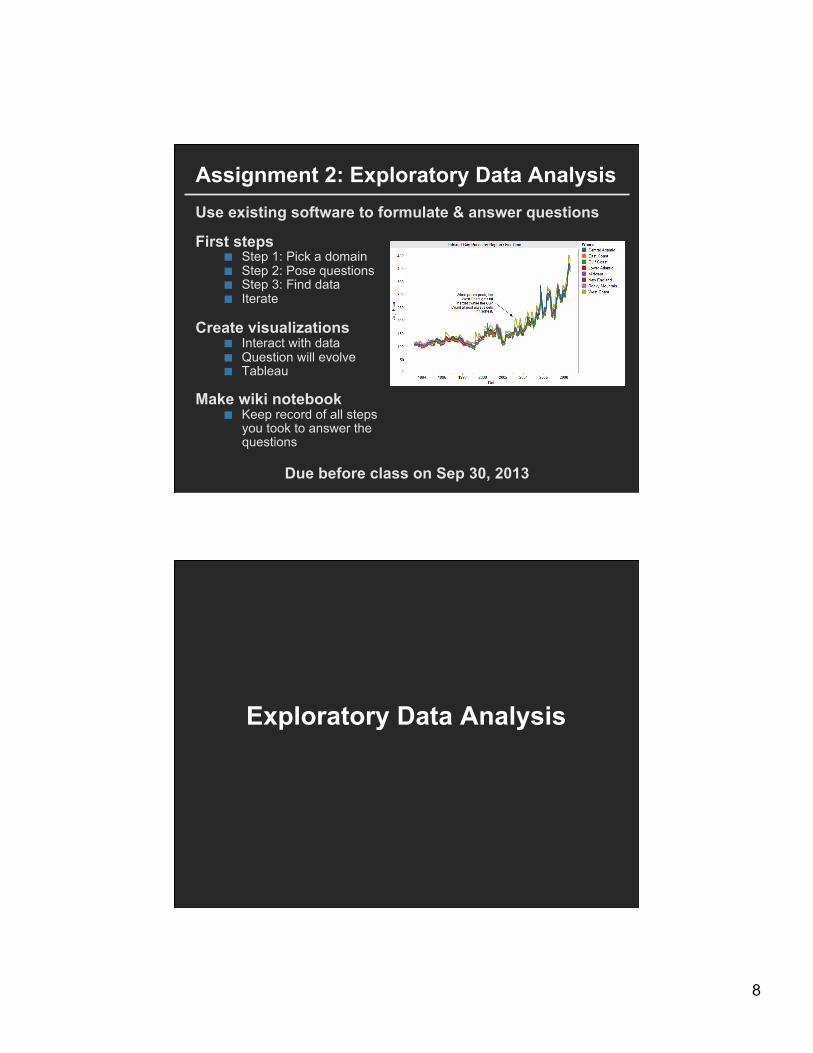
Assignment 2: Exploratory Data Analysis Use existing software to formulate & answer questions First steps
Step 1: Pick a domain Step 2: Pose questions Step 3: Find data Iterate
Create visualizations Interact with data Question will evolve Tableau
Make wiki notebook
Keep record of all steps you took to answer the questions
Due before class on Sep 30, 2013
Exploratory Data Analysis
9
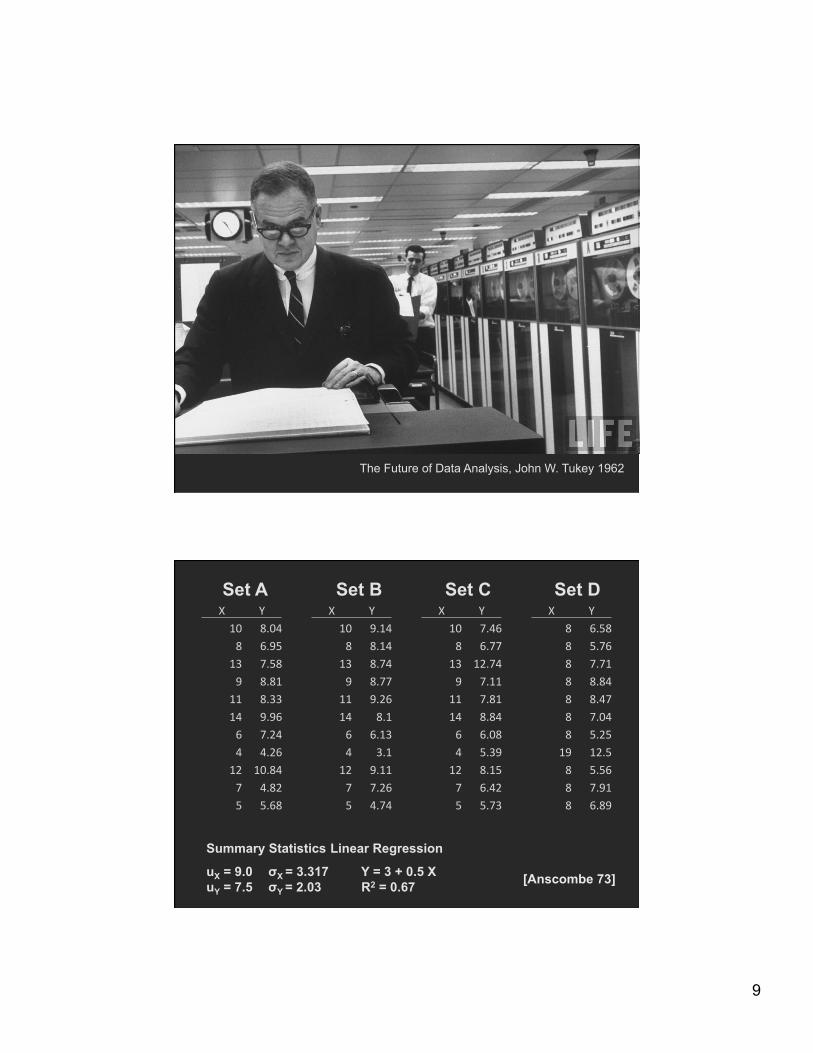
The Future of Data Analysis, John W. Tukey 1962
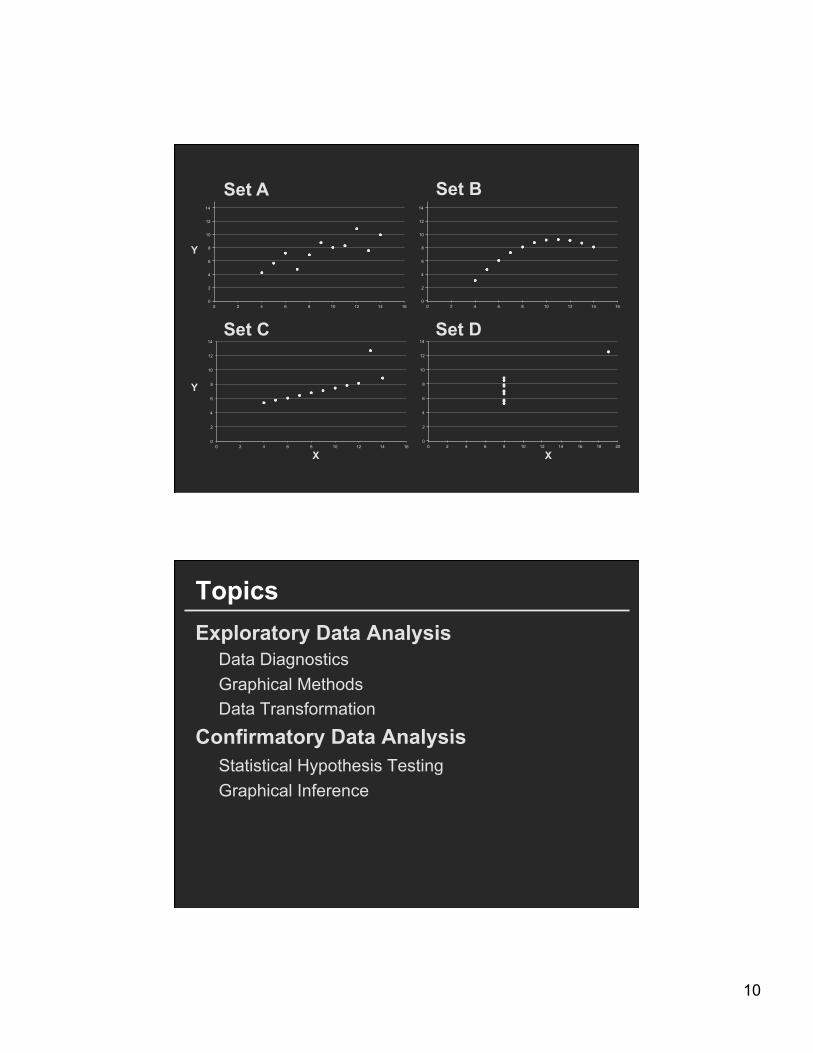
Set A Set B Set C Set D X Y X Y X Y X Y 10 8.04 10 9.14 10 7.46 8 6.58 8 6.95 8 8.14 8 6.77 8 5.76 13 7.58 13 8.74 13 12.74 8 7.71 9 8.81 9 8.77 9 7.11 8 8.84 11 8.33 11 9.26 11 7.81 8 8.47 14 9.96 14 8.1 14 8.84 8 7.04 6 7.24 6 6.13 6 6.08 8 5.25 4 4.26 4 3.1 4 5.39 19 12.5 12 10.84 12 9.11 12 8.15 8 5.56 7 4.82 7 7.26 7 6.42 8 7.91 5 5.68 5 4.74 5 5.73 8 6.89
[Anscombe 73]
Summary Statistics Linear Regression
uX = 9.0 σX = 3.317 Y = 3 + 0.5 X
uY = 7.5 σY = 2.03 R2 = 0.67
10
0
2
4
6
8
10
12
14
0 2 4 6 8 10 12 14 16
0
2
4
6
8
10
12
14
0 2 4 6 8 10 12 14 16
0
2
4
6
8
10
12
14
0 2 4 6 8 10 12 14 16
0
2
4
6
8
10
12
14
0 2 4 6 8 10 12 14 16 18 20
Set A
Set C Set D
Set B
X X
Y
Y
Topics Exploratory Data Analysis
Data Diagnostics Graphical Methods Data Transformation
Confirmatory Data Analysis Statistical Hypothesis Testing Graphical Inference
11
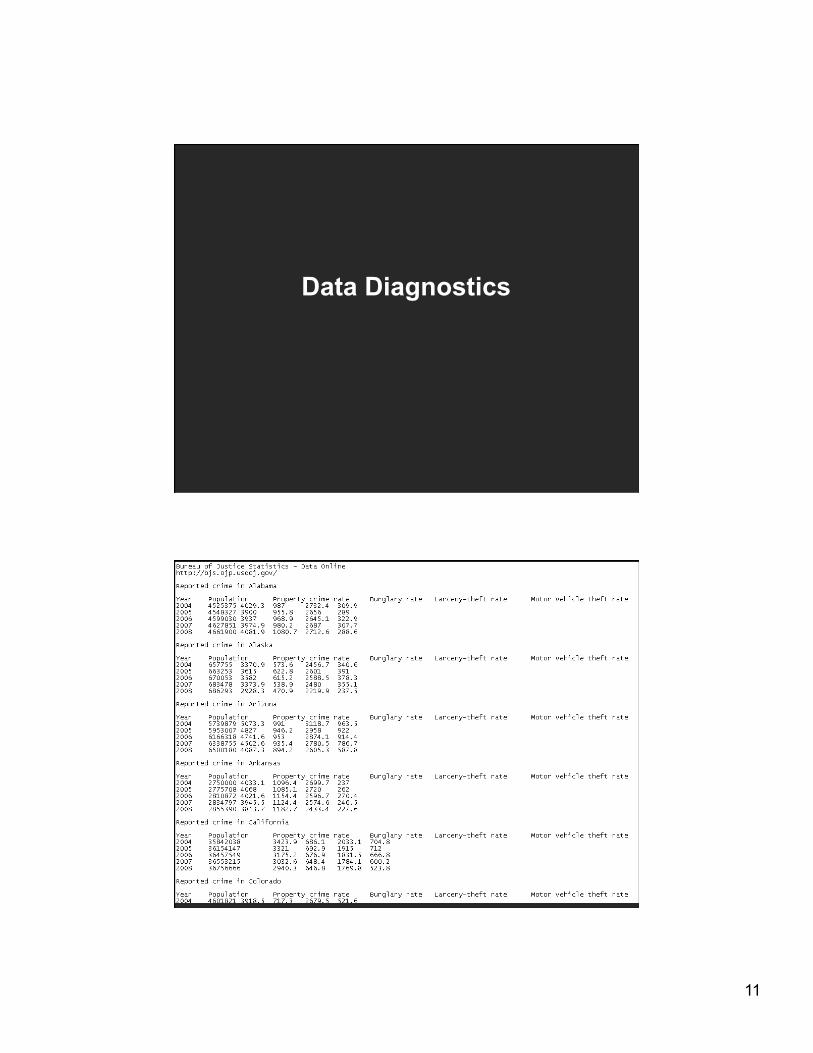
Data Diagnostics
12
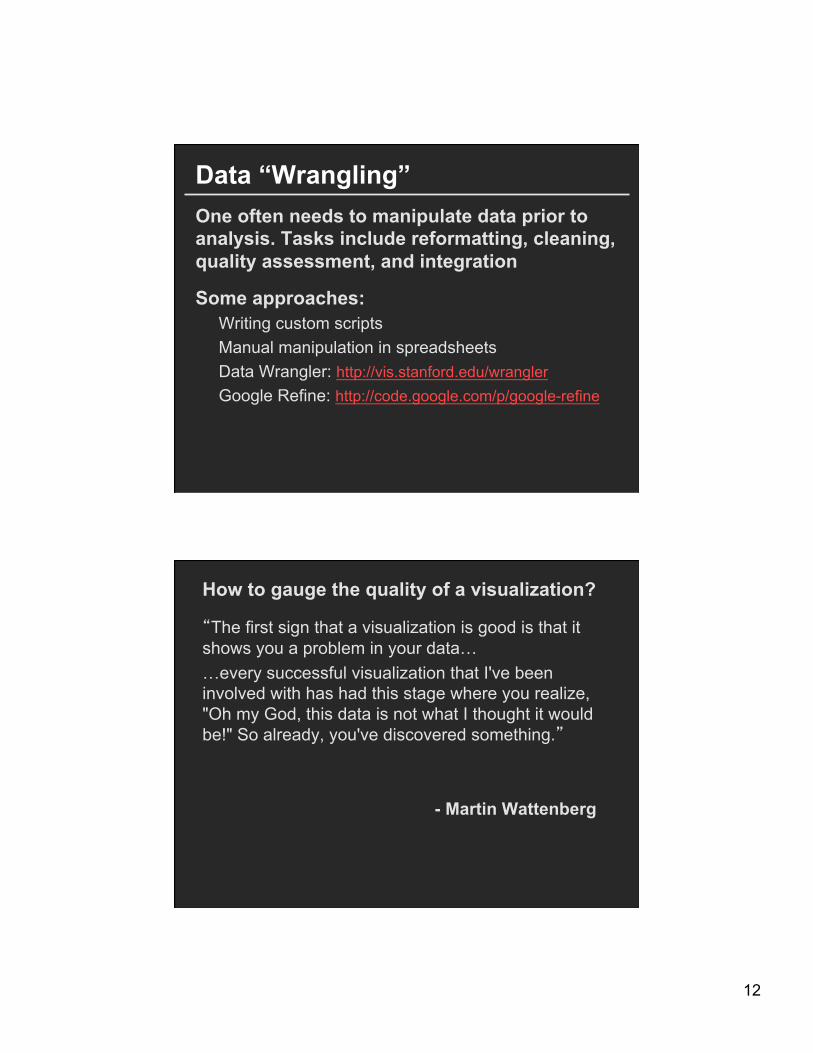
Data “Wrangling” One often needs to manipulate data prior to analysis. Tasks include reformatting, cleaning, quality assessment, and integration
Some approaches: Writing custom scripts Manual manipulation in spreadsheets Data Wrangler: http://vis.stanford.edu/wrangler Google Refine: http://code.google.com/p/google-refine
How to gauge the quality of a visualization?
“The first sign that a visualization is good is that it shows you a problem in your data… …every successful visualization that I've been involved with has had this stage where you realize, "Oh my God, this data is not what I thought it would be!" So already, you've discovered something.”
- Martin Wattenberg
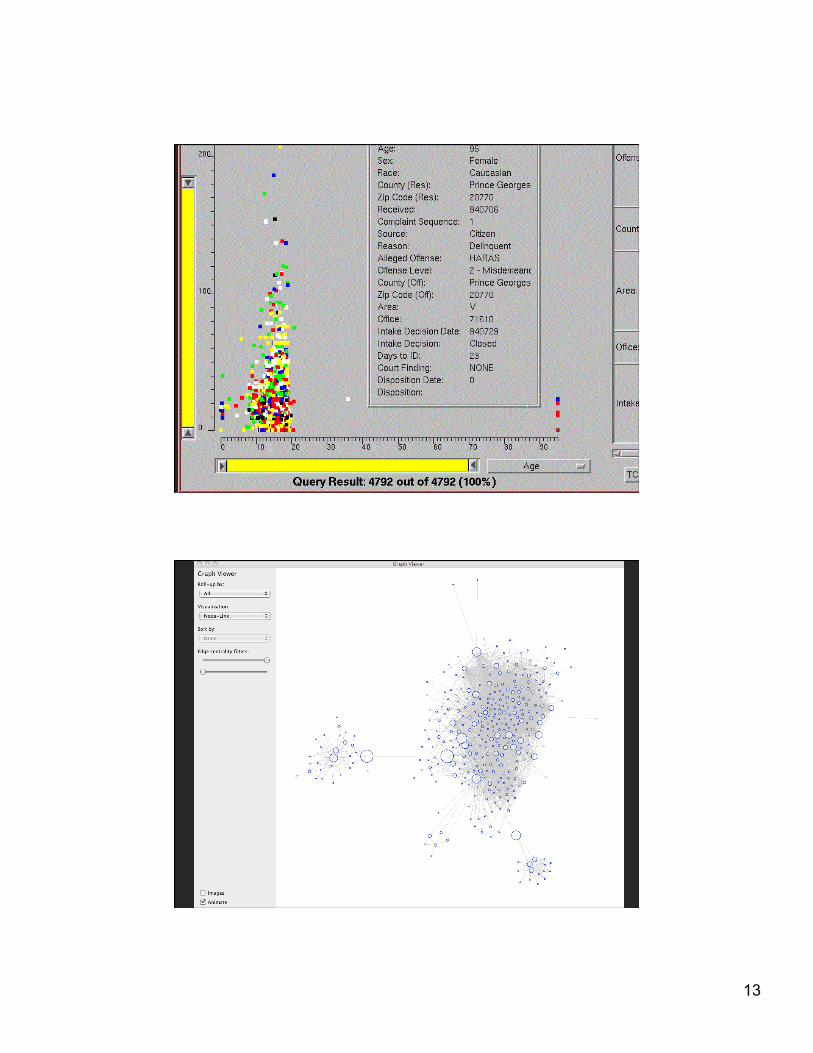
13
Node-link
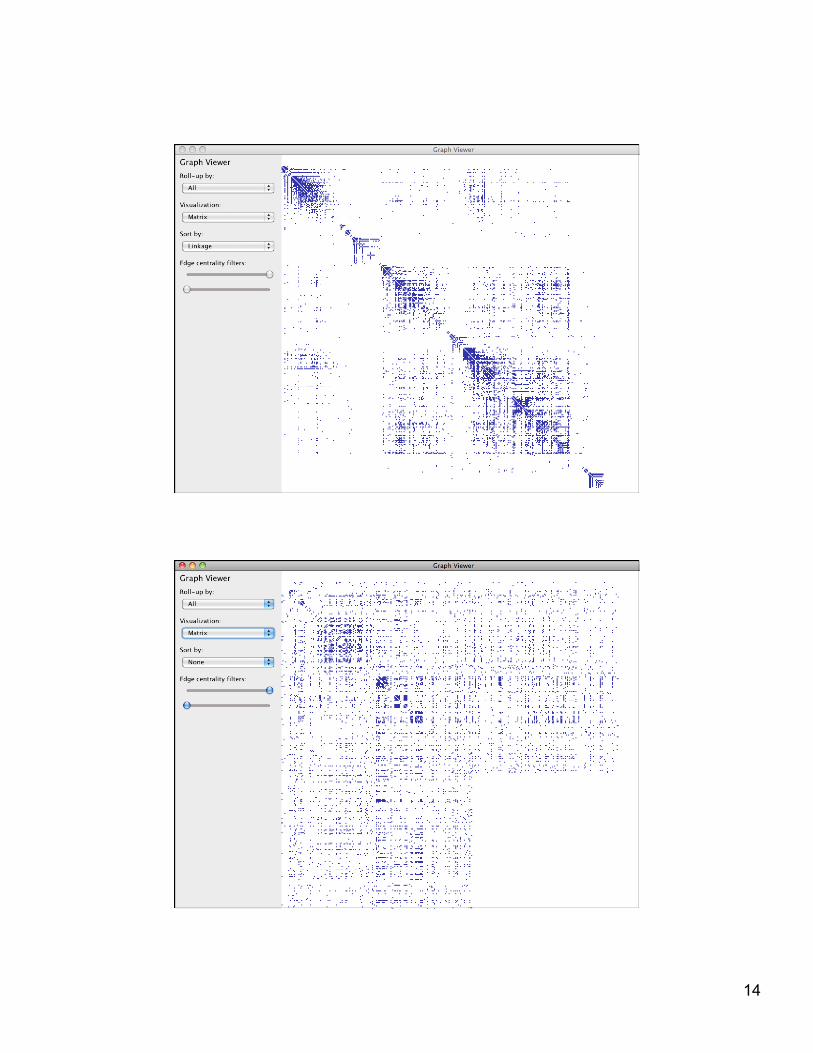
14
Matrix
Matrix
15
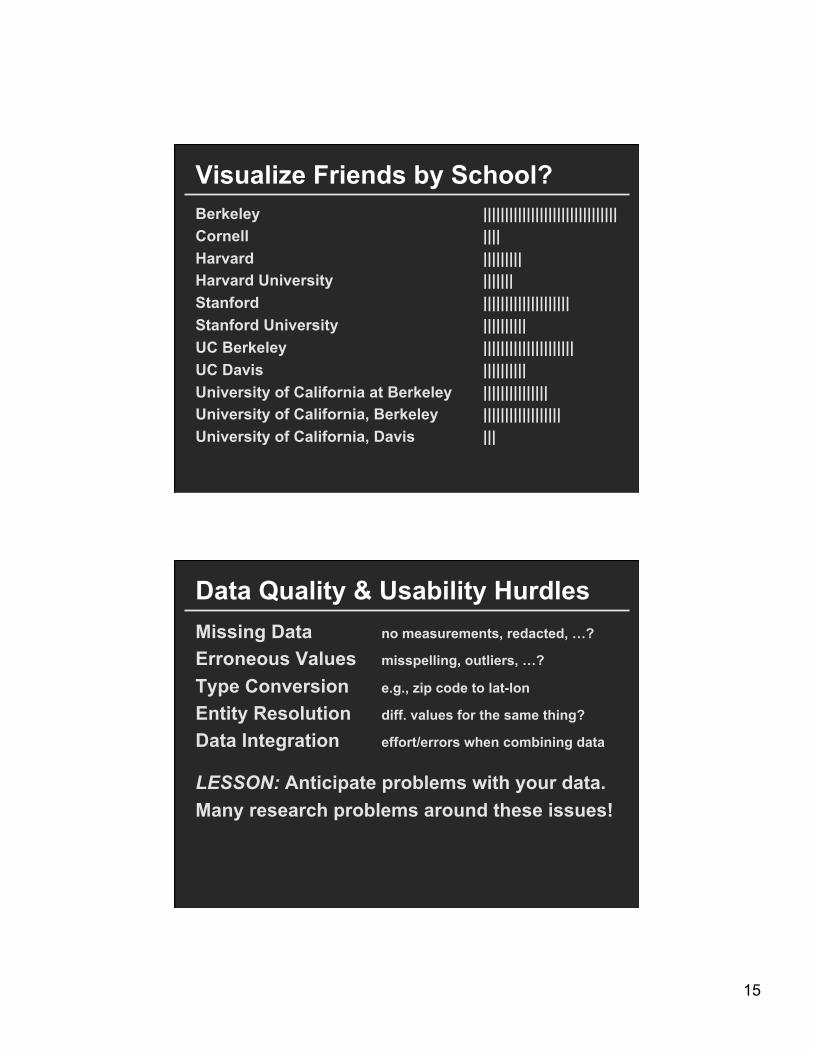
Visualize Friends by School? Berkeley ||||||||||||||||||||||||||||||| Cornell |||| Harvard ||||||||| Harvard University ||||||| Stanford |||||||||||||||||||| Stanford University |||||||||| UC Berkeley ||||||||||||||||||||| UC Davis |||||||||| University of California at Berkeley ||||||||||||||| University of California, Berkeley |||||||||||||||||| University of California, Davis |||
Data Quality & Usability Hurdles Missing Data no measurements, redacted, …? Erroneous Values misspelling, outliers, …? Type Conversion e.g., zip code to lat-lon Entity Resolution diff. values for the same thing? Data Integration effort/errors when combining data
LESSON: Anticipate problems with your data. Many research problems around these issues!
16
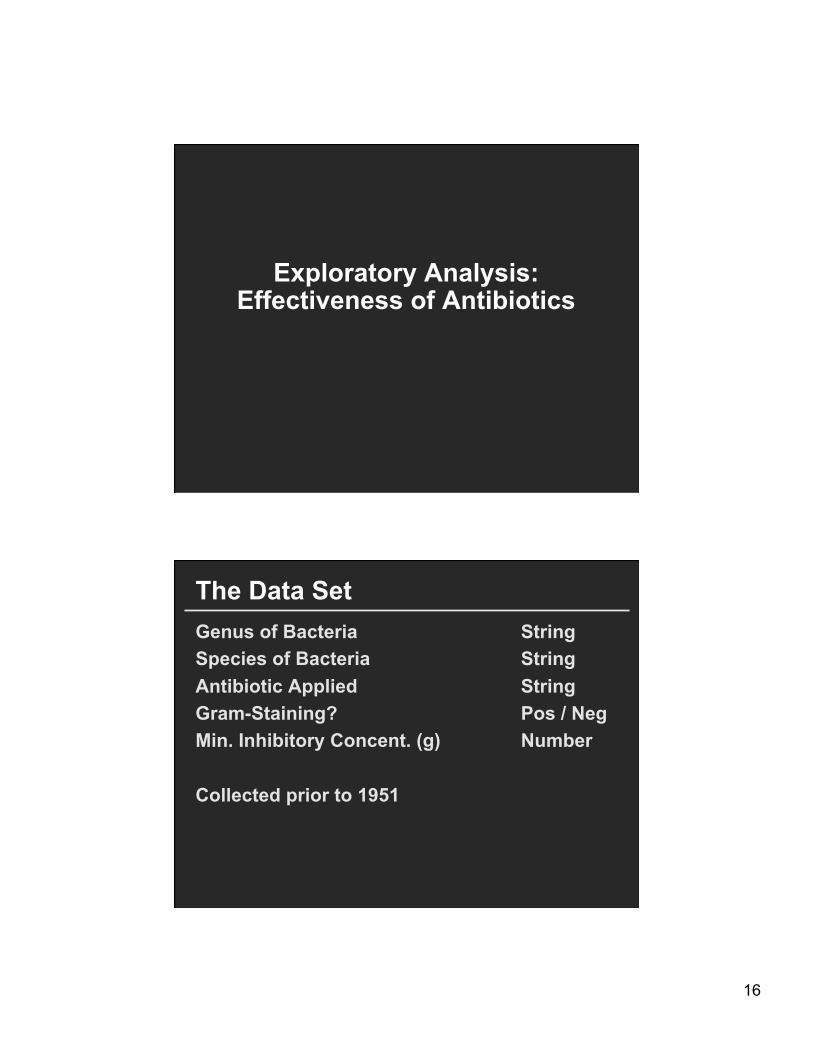
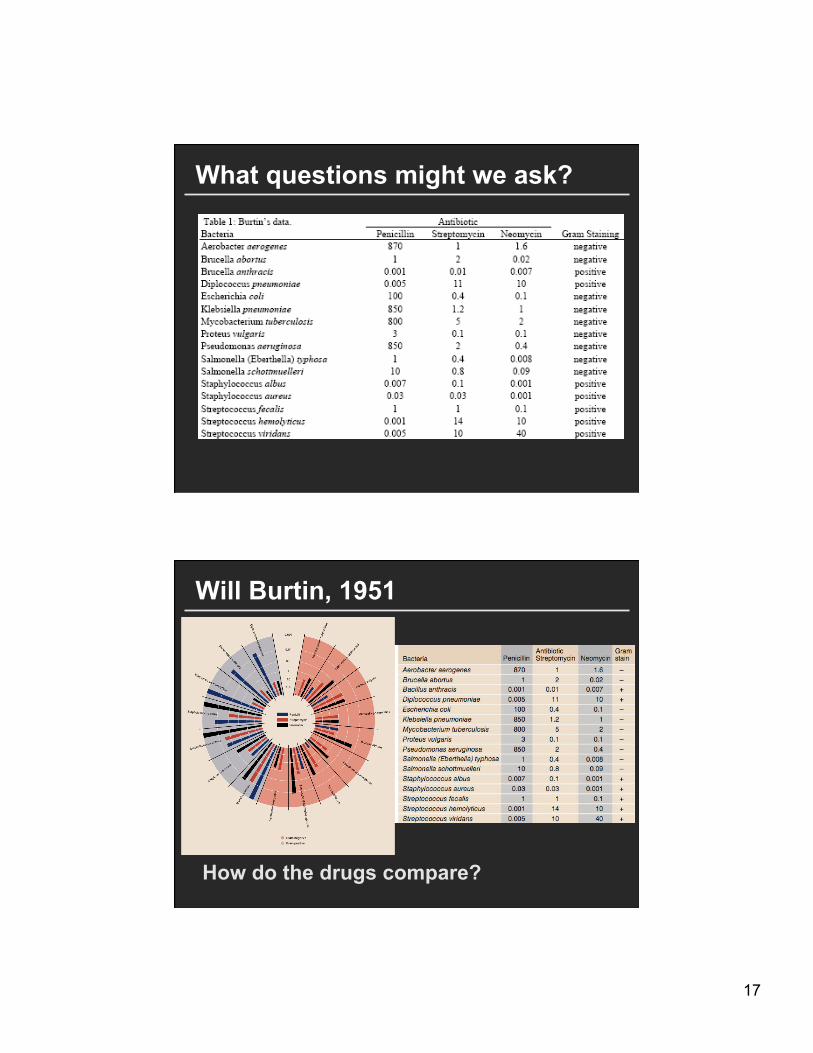
Exploratory Analysis: Effectiveness of Antibiotics
The Data Set Genus of Bacteria String Species of Bacteria String Antibiotic Applied String Gram-Staining? Pos / Neg Min. Inhibitory Concent. (g) Number Collected prior to 1951
17
What questions might we ask?
Will Burtin, 1951
How do the drugs compare?
18
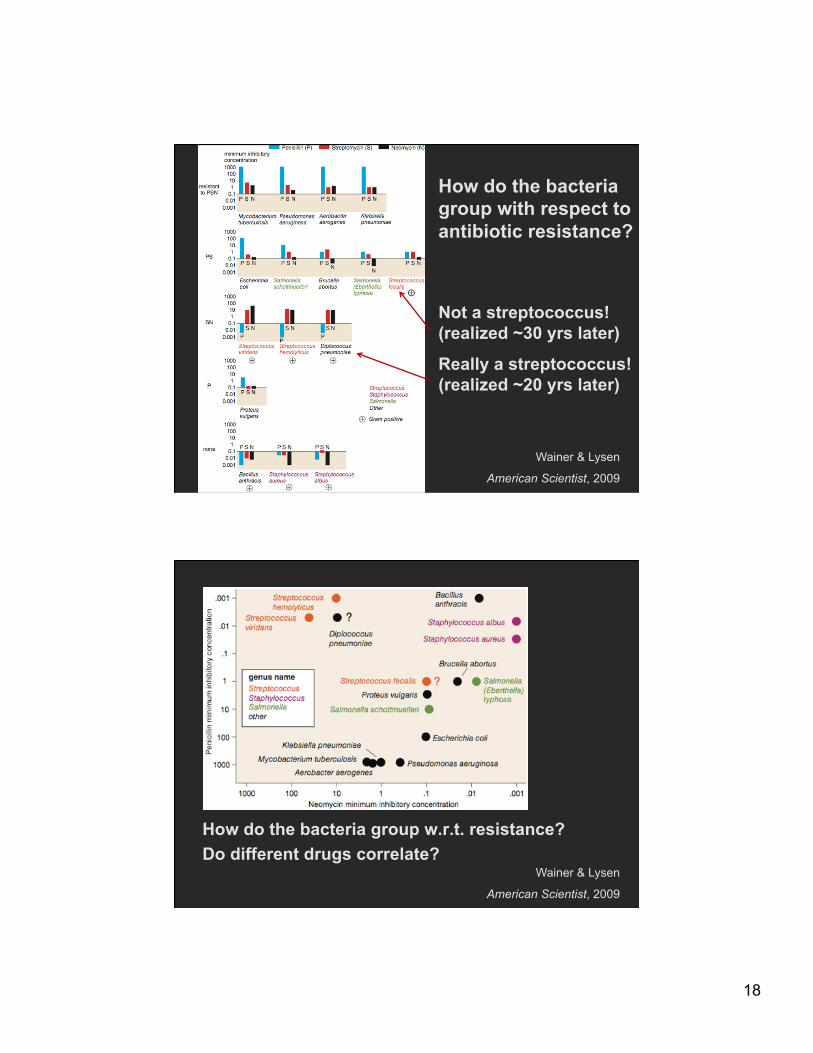
How do the bacteria group with respect to antibiotic resistance?
Not a streptococcus! (realized ~30 yrs later)
Really a streptococcus! (realized ~20 yrs later)
Wainer & Lysen
American Scientist, 2009
How do the bacteria group w.r.t. resistance? Do different drugs correlate?
Wainer & Lysen
American Scientist, 2009
19
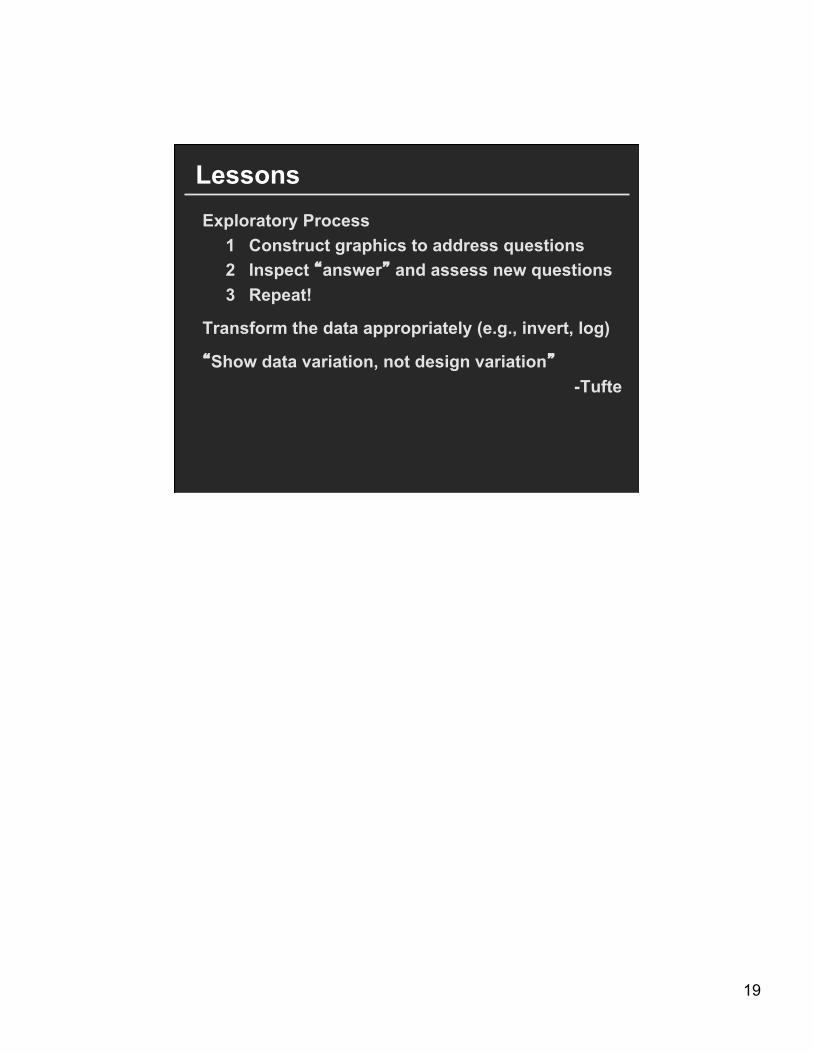
Lessons Exploratory Process
1 Construct graphics to address questions 2 Inspect “answer” and assess new questions 3 Repeat!
Transform the data appropriately (e.g., invert, log)
“Show data variation, not design variation”
-Tufte