exploration of physisorbed monolayers for molecular-scale ... · exploration of physisorbed...
TRANSCRIPT
EXPLORATION OF PHYSISORBED MONOLAYERS FOR MOLECULAR-SCALE
SURFACE PATTERNING
Thesis by
Kimberly Marshall Papadantonakis
In Partial Fulfillment of the Requirements for the
degree of
Doctor of Philosophy
CALIFORNIA INSTITUTE OF TECHNOLOGY
Pasadena, California
2008
(Defended July 16, 2008)

ii
© 2009
Kimberly Marshall Papadantonakis
All Rights Reserved

iiiACKNOWLEDGMENTS
Six years and six months ago I was thrilled to receive notice of my admission to Caltech. I
was delighted and proud to have the opportunity to study at Caltech, but was also
apprehensive about my ability to succeed in an environment possessing such an
intimidating reputation for research excellence and academic difficulty. I am truly grateful
to the many people that have since proven that the environment at Caltech is much less
intimidating than it is supportive.
I first acknowledge the support and encouragement that I have received from my advisor,
Professor Nathan Lewis. I have truly enjoyed working for Nate, and it is clear to me that
the smartest academic move that I made while at Caltech occurred during my first few
months on campus when I decided to join the Lewis group. Nate has not only allowed me
to work independently and to set the course of my research project, but has also supplied
extremely well-timed words of encouragement. Nate is a person that somehow manages to
impart keen insights and thoughtful advice in a way that “just takes five minutes”.
Bruce Brunschwig arrived at Caltech at nearly the same time that I did, and from the same
Suffolk County, Long Island paradise. For some reason, Bruce chooses to spend a lot of
time hanging around the Lewis group, and that peculiar habit has proved immensely
valuable to the group as a whole and to me in particular. Bruce is particularly good at
identifying questions about my work that I had neglected to address. He has served as a
second research advisor for me, and fittingly has been a member of my Ph.D. committee
since candidacy.
I acknowledge the remaining members of my Ph.D. committee: Mitchio Okumura, Jackie
Barton, and John Bercaw. My committee was best positioned to determine whether my
initial apprehension about the intimidating environment of Caltech would prove true.
Although this imposing group asked many difficult questions, they chose to be supportive
and to offer sound research and career advice rather than to intimidate me into surrendering
my studies.

ivI thank the members of the Lewis group with whom I have had enjoyed sharing offices
and lab space during my time at Caltech. I have appreciated the advice, helpful
discussions, and friendship that the Lewis group members have offered to me as well as
their wry sense of humor. I have particularly benefited from conversations with Matt
Traub, Kate Plass, Jim Maiolo, Lauren Webb, Stephen Maldonado, Anna Folinsky, David
Michalak, Tony Fitch, Edgardo García-Berríos, Marc Woodka, and David “DK” Knapp
who gave me my first five-minute introduction to the operation of the scanning tunneling
microscope.
Lastly I acknowledge my husband, Karl Papadantonakis. Karl is amazingly supportive and
has unfailingly encouraged me in my studies since my first year on campus. He has carried
me through the worst frustrations that my studies could offer and has celebrated every
achievement, no matter how minor, with me. I thank him for his loving support and look
forward to beginning the next chapter of our life together.

v

viFOREWORD
While I was writing this thesis, many of my colleagues commented that nobody would
actually ever read it. This is something of an axiom in academia, based upon the fact that
most other researchers will only be interested in reading peer-reviewed publications. Of
course my committee members will read through this text, but there is a particularly
important case in which the supposed axiom fails: the future Lewis group member
conducting research related to scanning tunneling microscopy and/or nanometer-scale
surface patterning. This thesis represents an opportunity for me to communicate ideas and
results that will not be published in another form. This is particularly true of Chapter 4
which describes the project that I have been working on during my final year at Caltech.
This thesis also represents an opportunity for me to offer a bit of insight into experimental
challenges and potentially productive research paths. I wish that future reader the best of
luck with their work, and invite him or her to contact me if it seems that the memory of my
experiences may be of help.
viiABSTRACT
Many simple organic molecules, such as straight-chain alkanes and simple aromatics,
spontaneously assemble into highly ordered monolayers at solid–liquid interfaces. These
monolayers are composed of molecules that lie flat at the interface without forming
chemical bonds to the surface of the solid. These monolayer structures are highly ordered
and produce patterns with features on the scale of just a single nanometer in length. The
exploitation of this physisorption phenomenon may provide a promising route toward an
inexpensive nanometer-scale surface patterning technique. However, two fundamental
challenges must be overcome before physisorbed monolayers can be useful in surface-
patterning applications: (1) absence of control over the particular pattern formed by the
molecules; and (2) pattern impermanence.
This document opens with an introductory chapter that contains background on
physisorbed monolayers and a brief description of scanning tunneling microscopy, the
experimental technique which is commonly used to study monolayers. The second and
third chapters present details on the results of experiments with a monolayer templating
technique. This templating technique involves replacement of the molecules comprising a
monolayer of either normal alkanes or symmetrical thioethers by symmetrical ethers. The
ethers are forced to conform to the structure of the existing template monolayer, which
differs from the structure of an ether monolayer formed in the absence of the template. The
monolayer templating technique offers researchers a limited method for exercising control
over the surface patterns formed by particular molecules.
The challenge of pattern impermanence is addressed in the fourth chapter of this document.
The molecules comprising physisorbed monolayers are free to exchange with molecules in
the solution contacting the surface, thus the orientation of the monolayer structure within a
particular surface region can change with time. A technique analogous to traditional
lithographic methods that may allow physisorbed monolayers to be used for permanent
surface patterning is described. The technique would employ physisorbed monolayers as
surface masks while other molecular species chemically bond to regions of the surface left

viiiuncovered by the masking monolayer. Descriptions of the progress made toward the
development of the patterning technique, and of the substantial challenges encountered
during efforts to develop such a patterning method close the chapter.
ixTABLE OF CONTENTS
Acknowledgments ..............................................................................................iii Foreword .............................................................................................................vi Abstract ..............................................................................................................vii Table of Contents................................................................................................ ix List of Figures and Tables ..................................................................................xi Nomenclature....................................................................................................xiii Chapter 1: Introduction to Physisorbed Monolayers and Scanning Tunneling Microscopy ................................................................. 1
1.1 Physisorbed Monolayers ......................................................................... 1 1.2 Scanning Tunneling Microscopy ............................................................ 3 1.3 STM Imaging of Physisorbed Monolayers............................................. 5 1.4 Summary.................................................................................................. 6 1.4 References ............................................................................................. 19
Chapter 2: Use of Alkane Monolayer Templates to Modify the Structure of Alkyl Ether Monolayers on Highly Ordered Pyrolytic Graphite. 22
2.1 Overview ............................................................................................... 22 2.2 Introduction ........................................................................................... 22 2.3 Experimental Details ............................................................................. 24 2.4 Results……………………………………………………………... ..25 2.5 Discussion……………………………………………………………28 2.6 Conclusions………………………………………………… ……….30 2.7 References ............................................................................................. 42
Chapter 3: Scanning Tunneling Microscopy Studies of Monolayer Templates: Alkylthioethers and Alkylethers .................................................... 45
3.1 Overview................................................................................................ 45 3.2 Introduction............................................................................................ 46 3.3 Experimental Details ............................................................................. 47 3.4 Results.................................................................................................... 50 3.5 Discussion.............................................................................................. 52 3.6 Conclusions ........................................................................................... 56 3.7 References.............................................................................................. 69
Chapter 4: Towards Surface Patterning Using Physisorbed Monolayers as Masks ................................................................................................................. 72
4.1 Overview................................................................................................ 72 4.2 Introduction............................................................................................ 72 4.3 Preparation of Gold Surfaces ................................................................ 77
4.3.1 Experimental Details.................................................................... 77 4.3.2 Results .......................................................................................... 78 4.3.3 Discussion..................................................................................... 79
x4.3.4 Conclusions .................................................................................. 80
4.4 Physisorbed Monolayers on Gold......................................................... 80 4.4.1 Experimental Details.................................................................... 80 4.4.2 Results .......................................................................................... 81 4.4.3 Discussion..................................................................................... 81 4.4.4 Conclusions .................................................................................. 82
4.5 Physisorbed Monolayers for Masks...................................................... 83 4.5.1 Experimental Details.................................................................... 83 4.5.2 Results .......................................................................................... 84 4.5.3 Discussion..................................................................................... 85 4.5.4 Conclusions .................................................................................. 88
4.6 Summary................................................................................................ 88 4.7 References............................................................................................ 112

xiLIST OF FIGURES AND TABLES
Figures Page
1.1 Heat of Adsorption Versus Alkane Chain Length ................................ 8
1.2 Diagram of a Scanning Tunneling Microscope..................................... 9
1.3 Models and Images of HOPG.............................................................. 11
1.4 STM Image of Hexatriacontane on HOPG ......................................... 14
1.5 STM Image of Tritriacontane on HOPG............................................. 15
1.6 STM Image of 1-Tetradecanol on HOPG ........................................... 16
1.7 STM Images of Monolayer Domain Boundaries ................................ 17
2.1 Tritriacontane on HOPG ...................................................................... 32
2.2 Di-n-octadecylether on HOPG............................................................. 34
2.3 STM Image of a Mixed Monolayer of Alkanes and Ethers................ 38
2.4 STM Image of a Templated Hexadecylether Monolayer.................... 40
3.1 STM Image and Model of a Monolayer of Hexadecylether ............... 59
3.2 STM Image and Model of a Monolayer of Hexadecylsulfide ............ 61
3.3 STM Images of Mixed Monolayers of Alkylthioethers and
Alkylethers................................................................................................... 63
3.4 Mixed Monolayer Analysis Software.................................................. 66
3.5 Solution Versus Surface Concentration............................................... 68
4.1 STM Image of a Large Monolayer Domain ........................................ 90
4.2 STM Images of Evaporated Gold Surfaces ......................................... 91
4.3 Atomic Resolution Images of Gold Samples ....................................... 98
4.4 STM Image of 1-Tetradecanol on Gold.............................................. 100
4.5 STM Images of 1,14-Tetradecanediol on Gold.................................. 101
4.6 STM Images of 1,3,5-Benzenetricarboxylic Acid (TMA)
on HOPG ................................................................................................... 103
4.7 Models of TMA Monolayer Structures .............................................. 105
4.8 STM Images of TMA on Gold............................................................ 107
xii4.9 STM Image of Fullerene C60 on HOPG ............................................. 110
4.10 STM Image of Fullerene C60 on Gold .............................................. 111
Tables Page
2.1 Molecular Names, Formulas, and Abbreviations................................ 31
2.2 Measured Monolayer Cell Dimensions ............................................... 36
3.1 Molecular Names, Formulas, and Abbreviations................................ 58
xiiiNOMENCLATURE
Domain: A region of a monolayer within which all of the unit cells are identically oriented
Domain Boundary: A region of a monolayer where at least two domains meet
ECSTM: Electrochemical scanning tunneling microscope or electrochemical scanning tunneling microscopy
HOPG: Highly oriented pyrolytic graphite. This is a high-quality, essentially single crystalline sample of graphite.
Lamella: A stripe of molecules within a monolayer domain. The width of a lamella is that of the unit cell of the monolayer structure.
Monolayer: A layer of molecules on a surface. The thickness of the layer is that of a single constituent molecule.
Physisorption: Adsorption to a surface without formation of chemical bonds between the surface and the adsorbate
STM: Scanning tunneling microscopy or scanning tunneling microscope
TMA: 1,3,5-benzenetricarboxylic acid or trimesic acid

xiv
1C h a p t e r 1
INTRODUCTION TO PHYSISORBED MONOLAYERS AND SCANNING TUNNELING MICROSCOPY
1.1 Physisorbed Monolayers
Many simple organic molecules, such as straight-chain alkanes, alcohols, and carboxylic
acids, spontaneously assemble into highly ordered monolayers at solid–liquid interfaces.
The first reports of this phenomenon were published in the scientific literature in the early
1960s when it was observed that organic molecules, in both neat liquids and in solution,
form ordered monolayers on substrates such as graphite, cast iron, and molybdenum
disulfide.1,2 At the time, this discovery was primarily of interest to the lubrication and
separation industries. The early studies of this phenomenon were conducted using
microcalorimetry and consisted of measurements of the heat of adsorption or elution of
alkanes and alcohols in contact with solids held at constant temperature. These early
studies were typically conducted by injecting solutions of alkanes into a solvent stream
flowing through an insulated cell containing a known amount of a powdered sample and
measuring heat effects. The resulting data demonstrated that the alkanes formed
monolayers on the surfaces of the solids and that the adsorption was due principally to
intermolecular interactions such as van der Waals forces and hydrogen bonding rather than
to strong interactions between the substrate and the adsorbed molecules.3–7
The heat of adsorption of long-chain alkanes onto cast iron was found to be linearly
dependent upon the chain length and to increase negatively by ~ 2.5 kcal mol-1 for each
carbon added to the chain; the measured heat effects increased with the carbon content of
the cast iron.1 This chain-length dependence is illustrated in Figure 1.1. The relationship
between the measured heats of adsorption and the chain length of the molecules in the
liquid indicates that intermolecular interactions such as van der Waals forces provide the

2driving force for the adsorption. Although interactions between the adsorbed alkanes and
the surface are relatively weak compared to the intermolecular forces in the case of long-
chain alkanes, interactions with the surface are important in the determination of whether
physisorption will occur at all on a particular surface material. The heat of adsorption of n-
dotriacontane was measured to be 36 kcal mol-1 for a graphite surface, but only 12 kcal
mol-1 for a WS2 surface, and 10 kcal mol-1 for a MoS2 surface.2 These data, combined with
the tail on the plot shown in Figure 1.1 clearly demonstrate that a portion of the measured
heats of adsorption is due to surface–adsorbate interactions. Interactions of this type,
however, are dependent upon the fixed surface area of the adsorbate and are essentially
independent of the length of the alkane chain. The potential for an adsorbate to form a
monolayer structure somewhat commensurate with that of the surface and the polarizability
of both the surface structure and the adsorbate molecules are likely to contribute to the
strength of the surface–adsorbate forces.8,9 These early studies also demonstrated that
highly branched alkanes such as squalane would not form ordered monolayers.10 The
presence of branches sterically interferes with the intermolecular van der Waals
interactions that drive physisorbed monolayer formation and can prevent the formation of
an ordered monolayer.
The data obtained using calorimetry also allowed researchers to deduce the geometric
structure of the molecular monolayer on a graphite surface. This was accomplished
through a comparison of the measured surface area of the substrate with the number of
molecules that became adsorbed to that substrate. These experimentally determined
variables were then combined with the knowledge of the surface area that each adsorbed
molecule would occupy in each possible spatial orientation. In this manner it was predicted
that the long-chain normal hydrocarbons adsorbed to a graphite surface with their carbon
skeletons lying parallel to the surface. It was also predicted that the carbon skeletons lie in
registry with the graphite surface such that each methylene unit occupied one hexagon of
the graphite basal plane, and such that the molecules were compressed by about 8–12%
relative to their crystalline structures.7
3The effect of varying the solvent was also examined using calorimetry, and it was
observed that the monolayers formed more readily when dissolved in branched solvents
than when dissolved in straight-chain solvents.11,12
The Parallel Layer Model was developed to explain the observed adsorption behavior. In
this model, it is assumed that adsorbed molecules lie flat on the surface without tails
extending into the bulk solution. Adsorption from solution is then treated as a
heterogeneous displacement reaction between the solvent and the solute. The equilibrium
expression can then be written as follows:
YXYX alla nn +=+
where n is the number of solvent molecules (X) replaced by a single solute molecule (Y).
The superscripts a and l refer to the adsorbed and liquid phases, respectively.13
1.2 Scanning Tunneling Microscopy
In the early 1980s Gerd Binnig and Heinrich Rohrer of the IBM Research Division in
Zurich introduced the scanning tunneling microscope (STM).14–16 The revolutionary
development of this instrument allowed relatively flat electrically conductive samples to be
imaged with atomic resolution without contacting or otherwise disturbing the sample
surface.
In scanning tunneling microscopy a very sharp metallic tip is scanned in a raster pattern
above a conductive sample while a constant potential is maintained between the tip and the
sample, as depicted in Figure 1.2. If the tip is sufficiently close to the sample surface a
tunneling current will flow between the tip and surface. Electronic feedback controls in the
instrument maintain either the height of the tip above the sample or the current between the
tip and sample at a constant value. When the tip is maintained at a constant height, the
current fluctuation is monitored and used to produce an image of the surface. If scanning is
conducted by maintaining a constant current between the tip and sample, the fluctuation of
4the height of the tip over the sample is monitored and used to produce the surface image.
Constant current mode imaging reduces the probability of accidental contact between the
tip and surface, while constant height mode imaging permits the use of greater scan speeds.
STM images always contain both topographic and electronic information about the sample
surface.
The sensitivity of the STM is a product of the quantum mechanical tunneling effect which
the method exploits. The magnitude of the tunneling current relates directly to the
probability of an electron tunneling through a potential barrier present between the tip and
surface, and essentially reduces to a particle-in-box problem. For a rectangular potential
barrier, the solutions to this problem have the form ze κ±=Ψ , with 2Te /)EV(m2 h−=κ ,
where E is the energy of the state and z is the distance between the tip and sample surface.
The tunneling current, JT, is related to the tunneling probability and is proportional to 2Ψ .17
Thus, )EV(m2z2
TTeeJ
−−
∝ h . The sensitivity of an STM thus arises from the exponential
dependence of the tunneling current on the distance between the tip and sample. In most
cases, the terms of VT and E are such that the magnitude of JT decreases by an order of
magnitude for a one angstrom increase in z.17
Scanning tunneling microscopy was widely adopted after it was used to solve the surface
structure of the Si(111) 7x7 surface reconstruction.18 STM is a powerful tool for the
examination of surfaces and is capable of routinely obtaining atomically resolved images
without interfering with surface processes.
Highly oriented pyrolytic graphite (HOPG) is a particularly useful surface for STM studies
and it is frequently used as a calibration standard. A fresh atomically flat surface can be
prepared simply by removing a layer from the HOPG sample using a piece of tape. Models
and STM images of HOPG are shown in Figure 1.3. The quality of an STM image
depends heavily upon the tip. Atomic resolution images of HOPG can readily be obtained
using 80:20 Pt/Ir tips mechanically cut using scissors. Approximately 25–30% of tips
prepared in this way yield STM images with resolution at the atomic scale. Of that
5number, only a few tips will yield an image as shown in Figure 1.3a; most of the 25–30%
of tips that yield images with atomic resolution produce HOPG images, as shown in Figure
1.3c.
1.3 STM Imaging of Physisorbed Monolayers
The first images of molecules lying flat on a graphite surface were published in 1988 and
were images of liquid crystals.19 STM was soon used to image alkane monolayers on
graphite.20 The stable molecular monolayers proved to be an ideal sample for study by
STM. Physisorbed monolayers can be imaged with an STM under ambient laboratory
conditions, which vastly reduces the constraints related to sample handling and vibration
isolation that are inherent to STM operation under the ultra high vacuum conditions used
for many other STM studies.
STM has been used extensively in studies of physisorbed monolayers and numerous papers
have been published on the topic.21 Many of these studies have focused on the structure of
the monolayers and the theory underlying the contrast observed in the images.22–24 These
issues were previously examined in the Lewis group by Christopher Claypool.25–27 These
particular studies consisted of a systematic investigation of the image contrast observed for
functional groups such as halides, amines, ethers, thioethers, disulfides, carboxylic acids,
double bonds, triple bonds, and nitriles. Theoretical techniques were then employed to
compute STM images for sample molecules and the results of those computations were
compared with the experimentally obtained STM images. Molecules were designed and
synthesized such that functional groups which had appeared dark in contrast (such as
bromide) were forced into a topographically different position, i.e., closer to the tunneling
tip. The theoretically calculated images and the experimentally obtained images of these
specially designed molecules underscored the fact that STM image contrast is a function
both of the monolayer topography and of the electronic environment near functional
groups.
6STM images of physisorbed monolayers on graphite can be obtained under ambient
laboratory conditions. A drop of a saturated filtered solution of the molecules of interest is
placed on an HOPG sample such that the tip of the probe is wetted by the liquid. The
solvent used is most commonly 1-phenyloctane, which possesses a low vapor pressure and
does not form a monolayer of its own on the HOPG surface. Other solvents may be used
provided that they are not electrically conductive. An image of an alkane monolayer on
HOPG is shown in Figure 1.4. The molecules are aligned with their carbon skeletons
parallel to the graphite surface. The image of the alkanes is actually that of the hydrogen
atoms along the carbon chain which are topographically located closest to the tip as it is
scanned over the surface. Individual hydrogen atoms are resolved in the image of a
monolayer of n-tritriacontane shown in Figure 1.5. The relative positions of the hydrogen
atoms indicate that the molecules lie on the surface with their carbon skeletons parallel to
the surface.
Physisorbed monolayers cover the entire surface of an adsorbent such as HOPG. The two-
dimensional monolayer structure is analogous to that of three-dimensional polycrystalline
solids in that it is composed of multiple regions within which the two-dimensional unit
cells are identically oriented. Each of these regions is called a domain and domains with
differing unit cell orientations meet at regions termed domain boundaries. A single
monolayer domain frequently covers the entire area of an STM image as shown in Figure
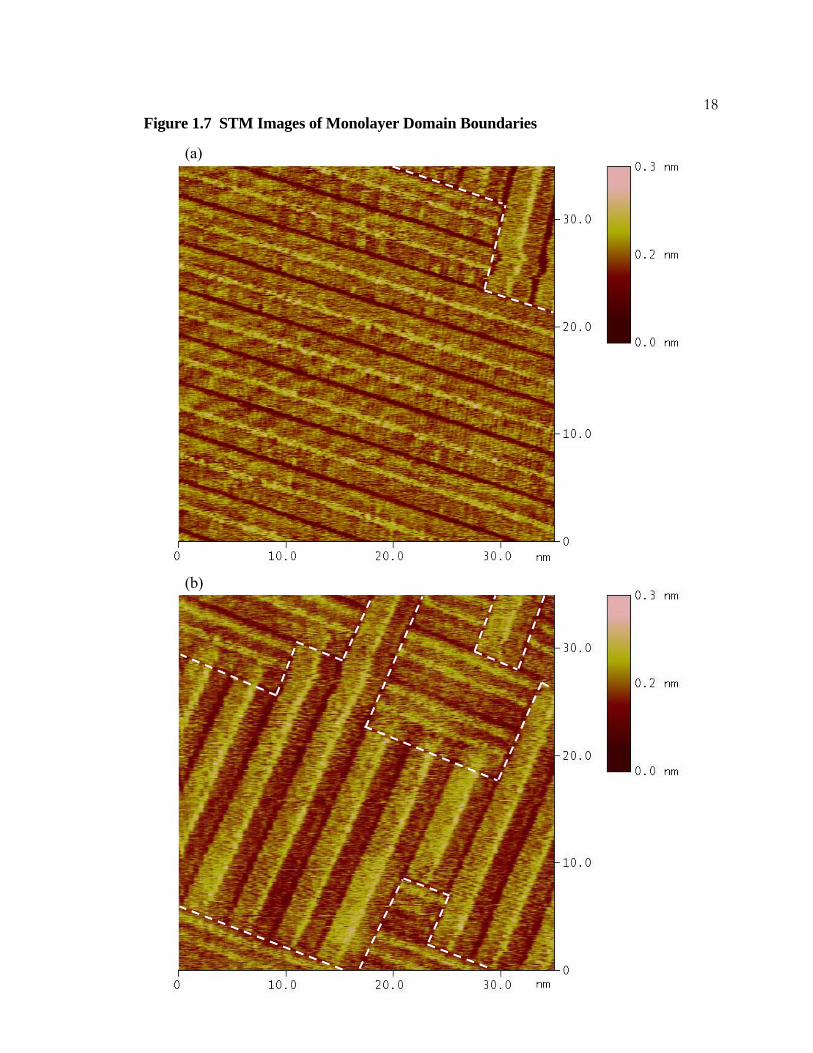
1.6. The monolayer structure is fluid and movement along domain boundaries can be
captured in successive STM images, as shown in Figure 1.7. Studies of the movement
within physisorbed monolayers and of the rates of exchange of molecules adsorbed to
surface with those in the overlying liquid have been published.28–30
1.4 Summary
Many simple organic molecules spontaneously form highly ordered monolayers on
surfaces. Early studies of this phenomenon were conducted using calorimetry and
demonstrated that the intermolecular interactions dominated the driving force for
monolayer formation. The invention of the scanning tunneling microscope provided an

7ideal tool for studying physisorbed monolayers and has allowed researchers to obtain
images with resolution factors on the atomic scale.
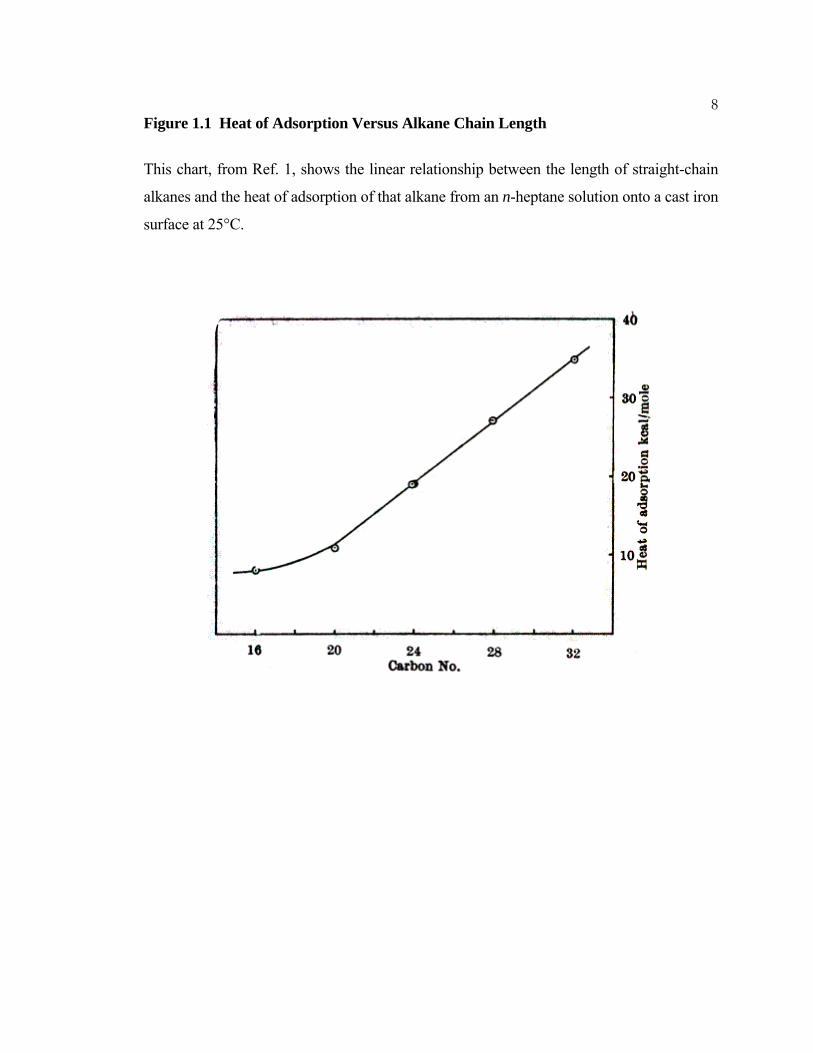
8Figure 1.1 Heat of Adsorption Versus Alkane Chain Length
This chart, from Ref. 1, shows the linear relationship between the length of straight-chain
alkanes and the heat of adsorption of that alkane from an n-heptane solution onto a cast iron
surface at 25°C.

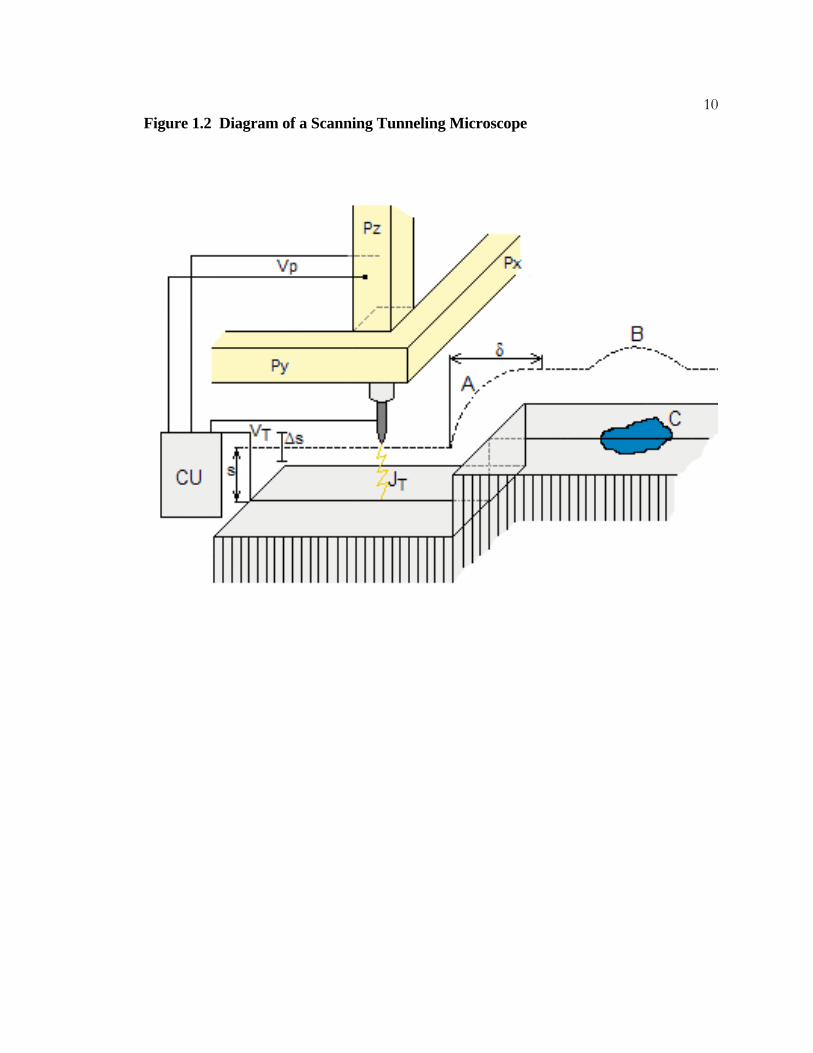
9Figure 1.2 Diagram of a Scanning Tunneling Microscope
This diagram illustrates the operation of a scanning tunneling microscope during constant-
current mode imaging and is adapted from Ref. 17. A sharp metal wire acts as the tip and
is held at a constant voltage (VT) relative to the sample. A stepper motor lowers the tip
toward the sample until a current is detected. The x and y coordinate piezoelectric
elements (PX and PY) control the movement of the tip as it is scanned above the sample
surface. The piezoelectric element PZ controls the height of the tip above the sample (s),
and the voltage controlling its position, VP, is adjusted by feedback elements in the
electronic control unit (CU) so that the tunneling current JT is held at a constant value.
In this diagram, the tip travels from left to right and the vertical position of the tip is shown
as a dotted line. The tip remains at a constant height about the sample until a surface step is
reached at point A. The position of the tip is adjusted to maintain a constant JT. A small
amount of time is required to complete the height adjustment and during that time the tip is
still being moved. This can result in a minor distortion of the apparent step width, δ. The
sample surface possesses a region of lower work function at C. In order to maintain JT, the
position of the tip is adjusted (B). The resulting STM image is a map of the position of the
tip as it is moved in a raster pattern across the surface and contains both topographic and
electronic information about the sample.
10Figure 1.2 Diagram of a Scanning Tunneling Microscope

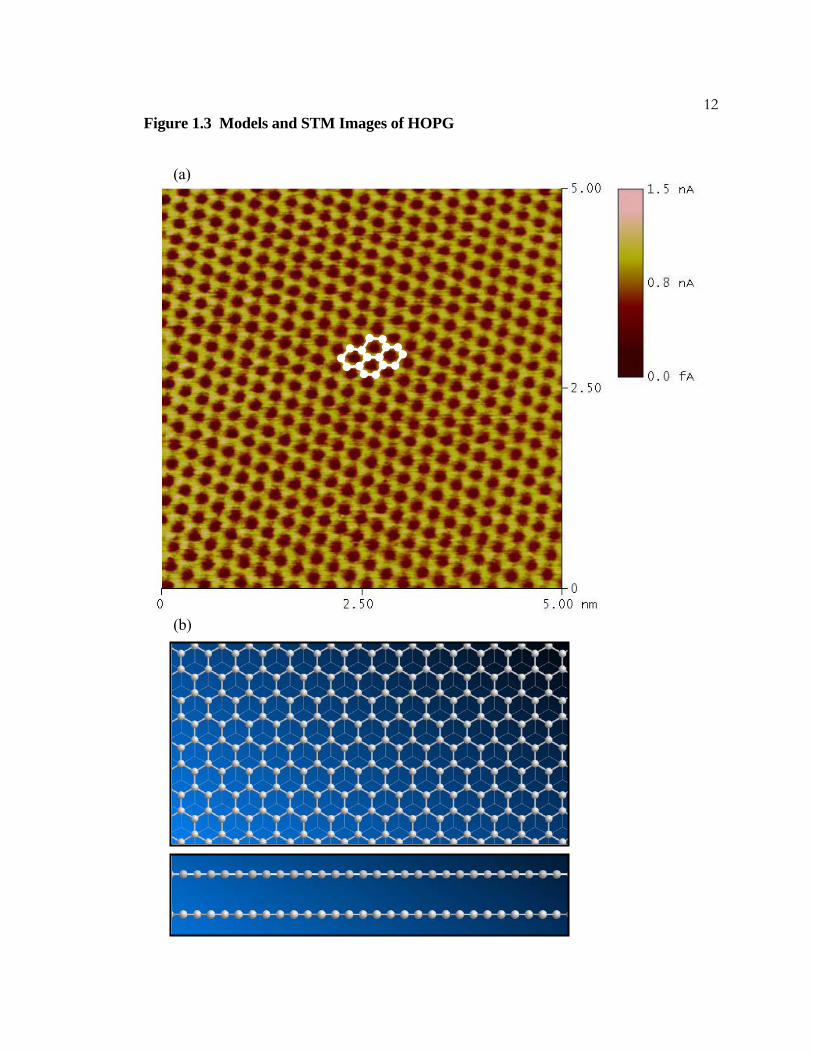
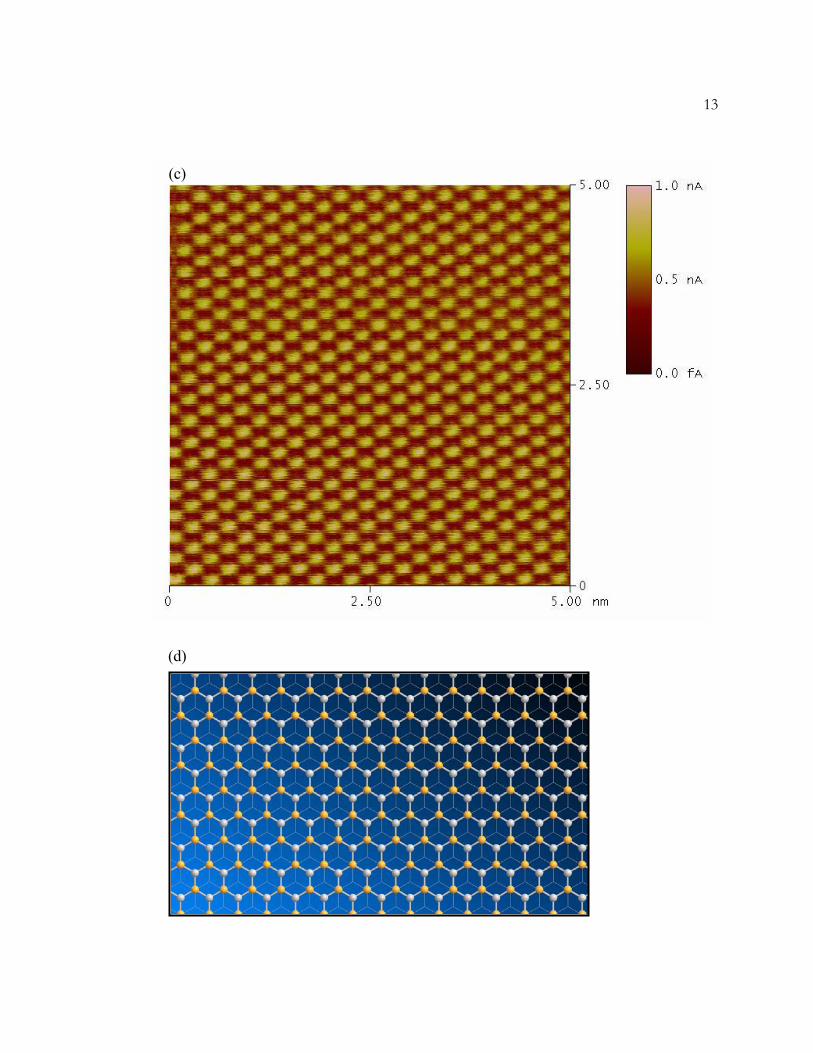
11Figure 1.3 Models and STM Images of HOPG
(a) A constant height mode STM image of HOPG. The image exhibits atomic resolution
and each carbon atom on the surface is visible. The hexagonal structure of the carbon
atoms on the surface is highlighted in white. The deviation from a perfect hexagonal grid
is due to thermal drift of the tunneling tip. Imaging conditions were 20 mV bias, 2 nA
current, and a scan rate of 30.5 Hz.
(b) Models of the HOPG surface. The model on top shows the view along the direction
normal to the surface. The atoms are separated by a distance of 1.42 Å. The model on the
bottom shows the edge-on view which illustrates the layered structure of the solid. The
distance between the layers is 3.34 Å.
(c) A typical STM image of HOPG. The image shows every other carbon atom on the
surface. Imaging conditions are identical to those in (a).
(d) A model of the HOPG surface illustrating that the surface atoms are not equivalent.
Half of the carbon atoms are positioned directly above atoms in the layer below. These
atoms are highlighted in orange. The distance between the highlighted atoms is 2.46 Å.
12Figure 1.3 Models and STM Images of HOPG
(a)
(b)
13
(c)
(d)
14
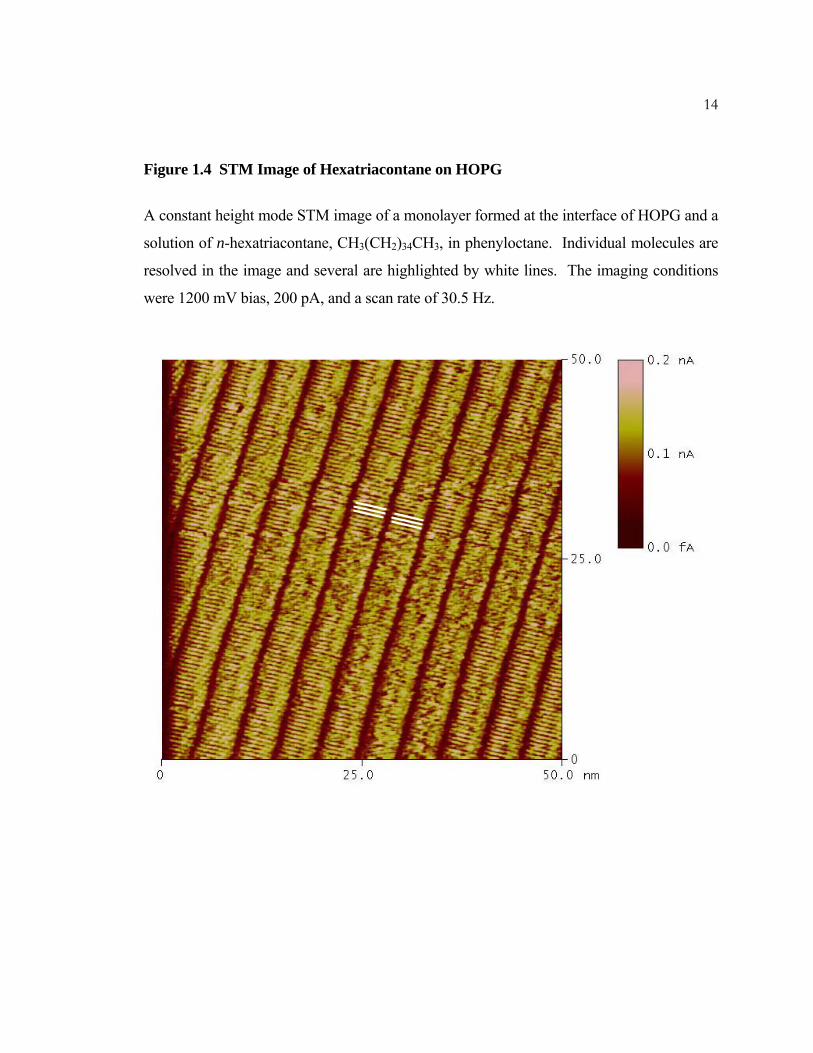
Figure 1.4 STM Image of Hexatriacontane on HOPG
A constant height mode STM image of a monolayer formed at the interface of HOPG and a
solution of n-hexatriacontane, CH3(CH2)34CH3, in phenyloctane. Individual molecules are
resolved in the image and several are highlighted by white lines. The imaging conditions
were 1200 mV bias, 200 pA, and a scan rate of 30.5 Hz.
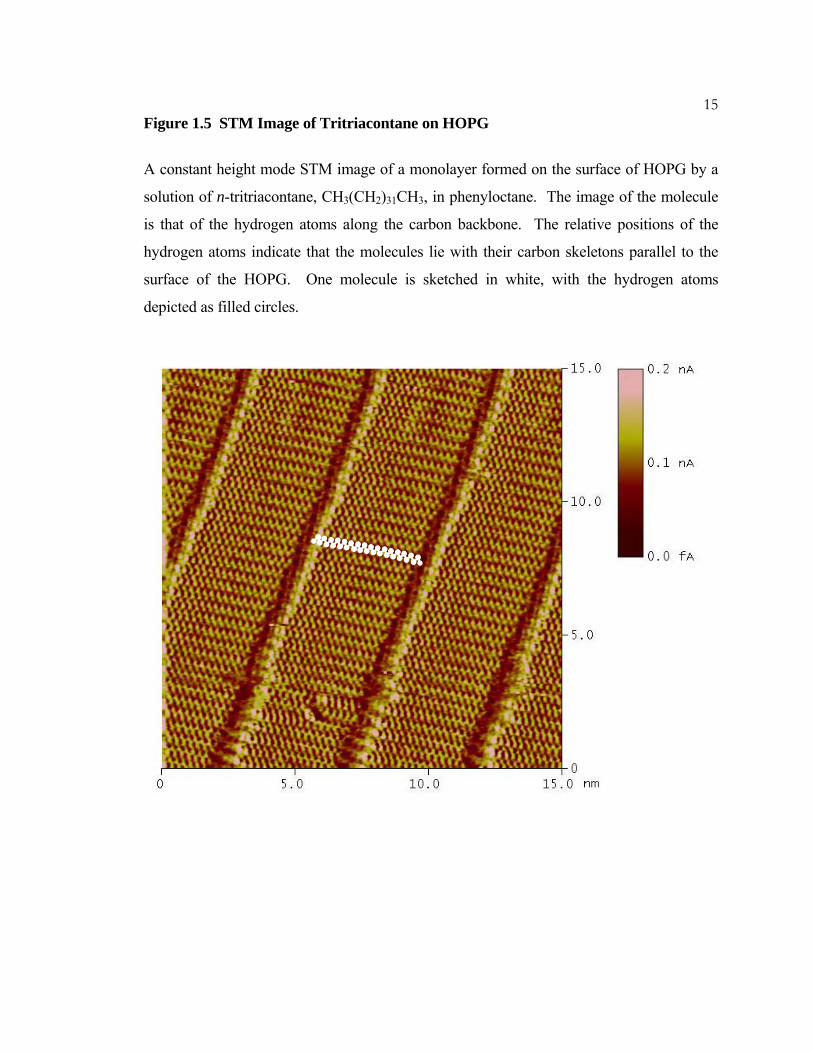
15Figure 1.5 STM Image of Tritriacontane on HOPG
A constant height mode STM image of a monolayer formed on the surface of HOPG by a
solution of n-tritriacontane, CH3(CH2)31CH3, in phenyloctane. The image of the molecule
is that of the hydrogen atoms along the carbon backbone. The relative positions of the
hydrogen atoms indicate that the molecules lie with their carbon skeletons parallel to the
surface of the HOPG. One molecule is sketched in white, with the hydrogen atoms
depicted as filled circles.
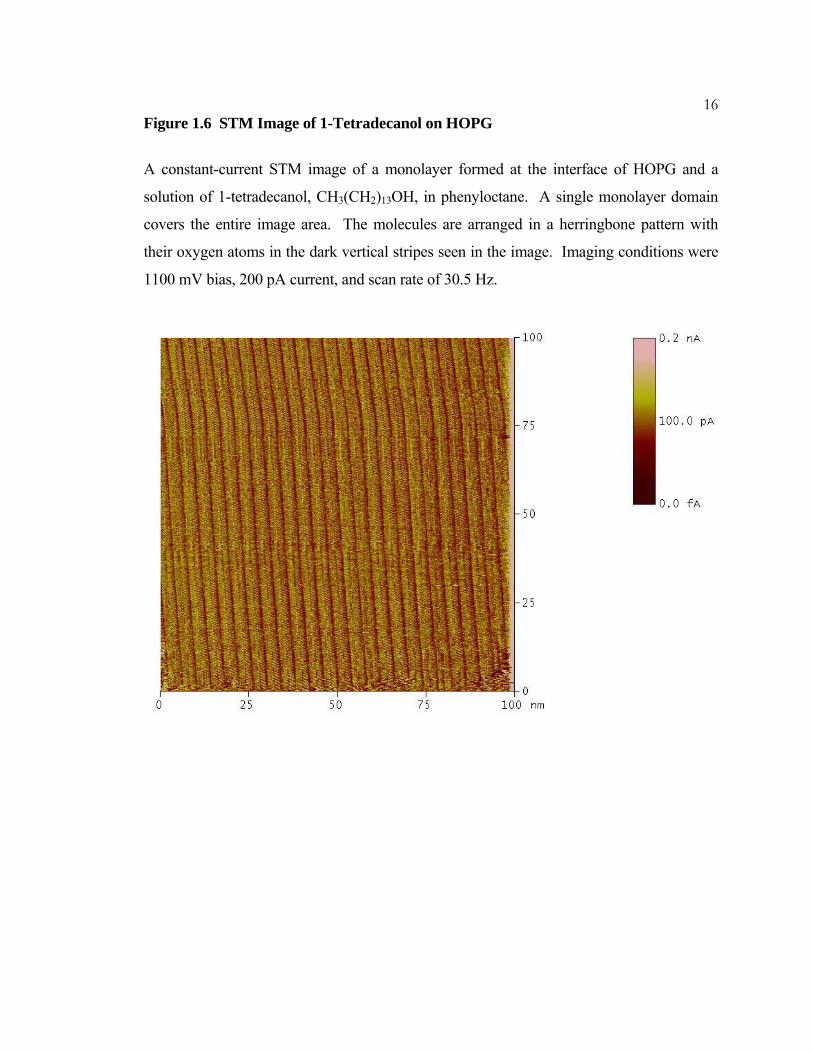
16Figure 1.6 STM Image of 1-Tetradecanol on HOPG
A constant-current STM image of a monolayer formed at the interface of HOPG and a
solution of 1-tetradecanol, CH3(CH2)13OH, in phenyloctane. A single monolayer domain
covers the entire image area. The molecules are arranged in a herringbone pattern with
their oxygen atoms in the dark vertical stripes seen in the image. Imaging conditions were
1100 mV bias, 200 pA current, and scan rate of 30.5 Hz.

17Figure 1.7 STM Images of Monolayer Domain Boundaries
Two constant height STM images of di-n-octadecylsulfide, CH3(CH2)17O(CH2)17CH3, in
phenyloctane on HOPG. The images are of the same area of the surface and the time
elapsed between them is two minutes. Domain boundaries are shown with white dashed
lines. The position and number of boundaries change with time, illustrating the fluid nature
of physisorbed monolayers. The imaging conditions were 1200 mV bias, 200 pA current,
and a scan rate of 30.5 Hz.
18
(a)
(b)
Figure 1.7 STM Images of Monolayer Domain Boundaries
191.5 References
(1) Groszek, A. J. Nature 1962, 196, 531–533.
(2) Groszek, A. J. Nature 1964, 204, 680.
(3) Everett, D. H. Transactions of the Faraday Society 1965, 61, 2478–2495.
(4) Ash, S. G.; Everett, D. H.; Findenegg, G.H. Transactions of the Faraday Society 1968,
64, 2639–2644.
(5) Hentschke, R.; Winkler, R. G. J. Chem. Phys. 1993, 99, 5528–5534.
(6) Castro, M. A.; Clarke, S. M.; Inaba, A.; Dong, C. C.; Thomas, R. K. J. Phys. Chem. B
1998, 102, 777–781.
(7) Findenegg, G. H.; Liphard, M. Carbon 1987, 25, 119–128.
(8) Groszek, A. J. Proceedings Of The Royal Society Of London Series A Mathematical
And Physical Sciences 1970, 473–498.
(9) Florio, G. M.; Werblowsky, T. L.; Muller, T.; Berne, B. J.; Flynn, G. W. J. Phys. Chem.
B 2005, 109, (10), 4520–4532.
(10) Kern, H. E.; Findenegg, G. H. J. Colloid Interface Sci. 1980, 75, 346–356.
(11) Fache, U.; Findenegg, G.H.; Kern, H.E.; Liphard, M. in Microscopic Aspects of
Adhesion and Lubrication; Georges, J.M., Ed.; Elsevier: Amsterdam, 1982; pp 709–718.
(12) Herwig, K. W.; Matthies, B.; Taub, H. Phys. Rev. Lett. 1995, 75, 3154–3157.
(13) Ash, S. G.; Everett, D. H.; Findeneg, G.H. Transactions of the Faraday Society 1970,
66, 708–722.
20(14) Binnig, G.; Rohrer, H. Helvetica Physica Acta 1982, 55, 726–735.
(15) Binnig, G.; Rohrer, H. IBM Journal of Research and Development 1986, 30, 355–369.
(16) Binnig, G.; Rohrer, H. Angewandte Chemie—International Edition in English 1987,
26, 606–614.
(17) Methods of Experimental Physics Volume 27: Scanning Tunneling Microscopy;
Stroscio, J.A., Kaiser, W.J., Eds.; Academic Press: San Diego, 1993.
(18) Binnig, G.; Rohrer, H.; Salvan, F.; Gerber, C.; Baro, A. Surf. Sci. 1985, 157, L373–
L378.
(19) Foster, J. S.; Frommer, J. E. Nature 1988, 333, 542–545.
(20) McGonigal, G. C.; Bernhardt, R. H.; Thomson, D. J. Appl. Phys. Lett. 1990, 57, 28–
30.
(21) A wealth of literature on this topic has been published by the following authors:
George W. Flynn of Columbia University; Jürgen P. Rabe of Humboldt Universität in
Berlin; Frans C. De Schryver and Steven De Feyter at Katholieke Universiteit Leuven,
Belgium; and Adam J. Matzger of the University of Michigan.
(22) Venkataraman, B.; Flynn, G. W.; Wilbur, J. L.; Folkers, J. P.; Whitesides, G. M. J.
Phys. Chem. 1995, 99, 8684–8689.
(23) Xie, Z. X.; Xu, X.; Mao, B. W.; Tanaka, K. Langmuir 2002, 18, 3113–3116.
(24) Cousty, J.; Van, L.P. Phys. Chem. Chem. Phys. 2003, 5, 599–603.
(25) Faglioni, F.; Claypool, C. L.; Lewis, N. S.; Goddard, W. A. J. Phys. Chem. B 1997,
101, 5996–6020.
21(26) Claypool, C. L.; Faglioni, F.; Matzger, A. J.; Goddard, W. A.; Lewis, N. S. J. Phys.
Chem. B 1999, 103, 9690–9699.
(27) Claypool, C. L.; Faglioni, F.; Goddard, W. A.; Gray, H. B.; Lewis, N. S.; Marcus, R.
A. J. Phys. Chem. B 1997, 101, 5978–5995.
(28) Padowitz, D. F.; Messmore, B. W. J. Phys. Chem. B 2000, 104, 9943–9946.
(29) Padowitz, D. F.; Sada, D. M.; Kemer, E. L.; Dougan, M. L.; Xue, W. A. J. Phys.
Chem. B 2002, 106, 593–598.
(30) Muller, T.; Flynn, G. W.; Mathauser, A. T.; Teplyakov, A. V. Langmuir 2003, 19,
2812–2821.
(31) Claypool, C. L.; Faglioni, F.; Goddard, W. A.; Gray, H. B.; Lewis, N. S.; Marcus, R.
A. J. Phys. Chem. B 1997, 101, 5978–5995.
22C h a p t e r 2
USE OF ALKANE MONOLAYER TEMPLATES TO MODIFY THE STRUCTURE OF ALKYL ETHER MONOLAYERS ON HIGHLY ORDERED PYROLYTIC
GRAPHITE
2.1 Overview
Scanning tunneling microscopy (STM) has been used to investigate the structure of pure
and mixed monolayers formed by adsorption of long-chain alkanes and/or ethers on highly
ordered pyrolytic graphite. Application of a pure phenyloctane solution of simple alkanes,
such as tritriacontane, CH3(CH2)31CH3, produced a monolayer within which the individual
molecular axes were oriented perpendicular to the lamellar axes. In contrast, a pure
solution of symmetrical long-chain ethers, such as di-n-hexadecylether,
CH3(CH2)15O(CH2)15CH3, produced a monolayer within which the molecular axes were
oriented at an angle of ≈ 65° relative to the lamellar axes. The compositions of the
overlying solutions were then gradually changed either from pure alkanes to nearly pure
ethers, or from pure ethers to nearly pure alkanes. When ethers replaced alkanes in the
monolayer, the ethers conformed to the orientation within the existing alkane layer, rather
than adopting the characteristic orientation of pure ether monolayers. However, when
alkanes were incorporated into monolayers that had been formed from pure ether solutions,
the orientation of the molecules within the monolayer converted to that characteristic of
pure alkanes. Alkane monolayers thus acted as templates for subsequent ether layers, but
ether monolayers did not act as templates for alkane layers.
2.2 Introduction
Long-chain alkanes in solution spontaneously form stable, ordered monolayers on a
number of surfaces, including graphite, MoS2, and WS2.1 This phenomenon is relevant to
the fields of separation, adhesion, lubrication, catalysis, and corrosion-resistance. The
23alkane monolayers can be observed using a scanning tunneling microscope (STM) when
an atomically flat surface, such as highly ordered pyrolytic graphite (HOPG), is used as a
substrate.2–4 STM observations have routinely shown the formation of single, ordered,
alkane monolayer domains > 10,000 nm2 in area. Because alkane monolayers can easily
cover surfaces in a highly ordered manner, such monolayers are potentially useful for
nanometer-scale surface patterning and for the production of novel materials. The
formation of these monolayers is driven by favorable van der Waals and hydrogen bonding
interactions between adsorbed molecules, rather than by surface–adsorbate interactions. As
a result, the organization of molecules within these layers is typically determined by the
structure of the molecules as well as by their functional groups.5–8 The inability to control
the manner in which a given molecule will orient within a monolayer has led to the
development of two auxiliary methods for generating more intricate monolayer patterns:
the use of solutions containing a mixture of molecules, and of molecules with elaborate or
chiral structures.9–15
The question of interest in this work was whether the structure of the overlayer formed by a
given molecule could be influenced, and in fact templated, by the deliberate prior formation
of a monolayer having a different structure. Such behavior would enable manipulation of
the structure of the resulting overlayers by prior chemical templating of the surface with
monolayers having a structure of interest, constituting a form of overlayer lithography.
Since the structures of alkane and ether monolayers are determined by low-energy van der
Waals interactions, a monolayer structural template that causes only a limited change to
these interactions would produce a monolayer close in energy to that of the original
structure. For a templating process to be observable, the structure of the overlayer formed
using a template must be close in energy to the structure formed without a template, and
one of the two structures must be metastable.
We report herein the results of a series of experiments in which we have examined the
structures of monolayers produced by adsorption of molecules onto a pristine substrate and
the structures formed by substitution of the molecules into a preexisting monolayer having

24a distinctly different overlayer structure. Specifically, straight-chain alkanes and ethers
have been investigated because they are known to form differently structured lamellate
monolayers on HOPG which are stable and can be imaged by STM for at least several days
after their formation. The direct application of a solution of a single alkane, such as
tritriacontane, CH3(CH2)31CH3, in phenyloctane produces a monolayer in which the alkanes
are in registry and thus have their individual molecular axes oriented perpendicular to the
lamellar axes of the monolayer. In contrast, a phenyloctane solution of a symmetrical long-
chain ether, such as di-n-hexadecylether, CH3(CH2)15O(CH2)15CH3, produces a monolayer
in which each ether molecule is offset from its neighbors.16,17 This offset produces an angle
of ≈ 65° between the molecular and lamellar axes.18 Alkane–ether pairs having the same
molecular lengths were therefore selected for study. Due to functional group-related
differences in tunneling contrast, alkanes and ethers are distinguishable in STM images that
exhibit atomic resolution. Thus, the composition of the resulting overlayer could be
determined as a function of the relative concentrations of alkanes and ethers in the
overlying solution whenever imaging conditions were ideal. In our work, the compositions
of the overlying solutions were changed either from pure alkane to nearly pure ether
solutions, or from pure ether to nearly pure alkane solutions. The structures of the resulting
overlayers were then investigated by in-situ STM experiments.
2.3 Experimental details
Experiments were performed with three length-matched (in their all trans- configuration)
pairs of alkanes and ethers: nonacosane and di-n-tetradecylether; tritriacontane and di-n-
hexadecylether; and heptatriacontane and di-n-octadecylether (all from TCI America,
> 95% purity). Table 2.1 lists the full chemical formulas and abbreviations for each of
these compounds. Pure solutions of each of the six compounds were prepared using
phenyloctane (Acros, 99% pure) as the solvent. The solvent was approximately saturated
with solute at room temperature, and the solutions were filtered before use. The
concentrations of the final solutions were determined using an HP 6890 gas chromatograph
equipped with a flame ionization detector, with 1-bromohexadecane (Aldrich) as an
25internal standard. The solubilities were determined to be: C29, 23 mM; C33, 4.5 mM;
C37, 2.0 mM; E29, 75 mM; E33, 71 mM; and E37, 4.8 mM. Hence, the solubility of the
ethers exceeded that of the alkanes, and the solubility decreased with increasing chain
length. For each length-matched pair of alkanes and ethers, mixed composition solutions
were prepared by mixing volumes of the two component solutions in 80:20, 60:40, 40:60,
and 20:80 ratios.
STM images were obtained under ambient laboratory conditions using a Digital
Instruments (Veeco) Nanoscope III ECSTM controlled by Nanoscope software version
5.12r2. Tips were mechanically cut from 80:20 Pt/Ir wire. A real-time plane-fitting
function was applied to the images while scanning. No additional image corrections were
used. Each image consisted of 512 sample scan lines. STM images of pure monolayers
were obtained under a drop of the appropriate phenyloctane solution that had been placed
on a piece of freshly cleaved HOPG. After ≈ 30–45 min, a drop of the length-matched
mixed solution having the largest concentration of the species already present on the
surface was then added to the cell. For example, after imaging a monolayer formed from a
pure C29 solution, 5 μL of an 80:20 C29/E29 mixed solution was added to the cell. STM
images of the resulting monolayer were then obtained after ≈ 30–45 min, to allow some
time for equilibration of the mixture. The composition of the overlying solution was
altered over several steps using the mixed solutions, to ultimately greatly favor the second
component of the length-matched mixture. With C29 and E29 for example, after gradually
reducing the concentration of C29 in the overlying solution, a few portions of pure E29
solution were added to the overlying solution, to further eliminate C29 from the system.
STM images were collected throughout the course of the experiments. Tunneling tips were
not changed during experiments, to avoid mechanically disturbing the monolayers.
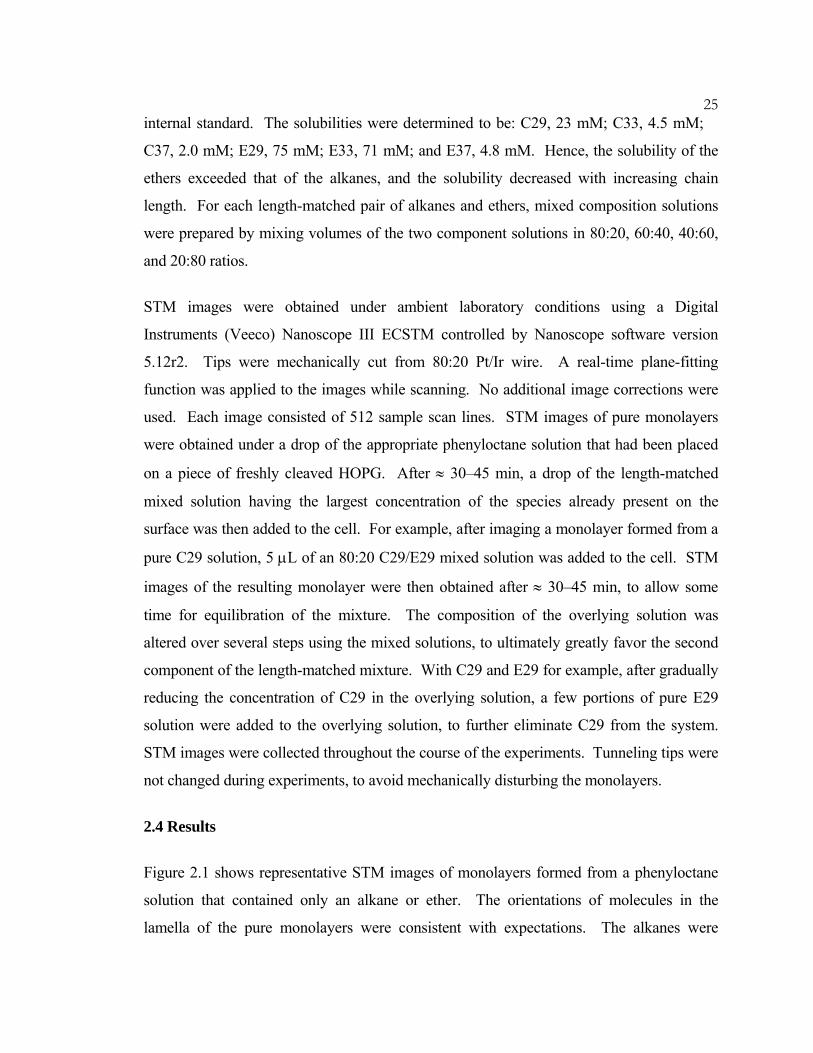
2.4 Results
Figure 2.1 shows representative STM images of monolayers formed from a phenyloctane
solution that contained only an alkane or ether. The orientations of molecules in the
lamella of the pure monolayers were consistent with expectations. The alkanes were
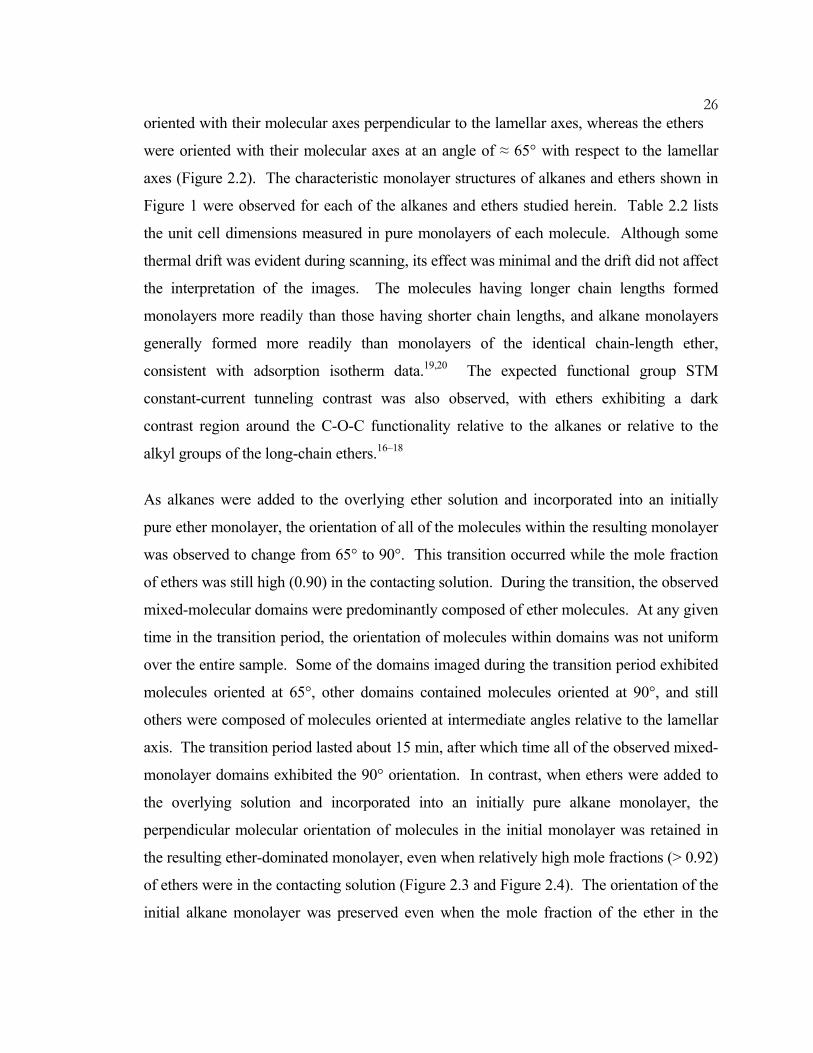
26oriented with their molecular axes perpendicular to the lamellar axes, whereas the ethers
were oriented with their molecular axes at an angle of ≈ 65° with respect to the lamellar
axes (Figure 2.2). The characteristic monolayer structures of alkanes and ethers shown in
Figure 1 were observed for each of the alkanes and ethers studied herein. Table 2.2 lists
the unit cell dimensions measured in pure monolayers of each molecule. Although some
thermal drift was evident during scanning, its effect was minimal and the drift did not affect
the interpretation of the images. The molecules having longer chain lengths formed
monolayers more readily than those having shorter chain lengths, and alkane monolayers
generally formed more readily than monolayers of the identical chain-length ether,
consistent with adsorption isotherm data.19,20 The expected functional group STM
constant-current tunneling contrast was also observed, with ethers exhibiting a dark
contrast region around the C-O-C functionality relative to the alkanes or relative to the
alkyl groups of the long-chain ethers.16–18
As alkanes were added to the overlying ether solution and incorporated into an initially
pure ether monolayer, the orientation of all of the molecules within the resulting monolayer
was observed to change from 65° to 90°. This transition occurred while the mole fraction
of ethers was still high (0.90) in the contacting solution. During the transition, the observed
mixed-molecular domains were predominantly composed of ether molecules. At any given
time in the transition period, the orientation of molecules within domains was not uniform
over the entire sample. Some of the domains imaged during the transition period exhibited
molecules oriented at 65°, other domains contained molecules oriented at 90°, and still
others were composed of molecules oriented at intermediate angles relative to the lamellar
axis. The transition period lasted about 15 min, after which time all of the observed mixed-
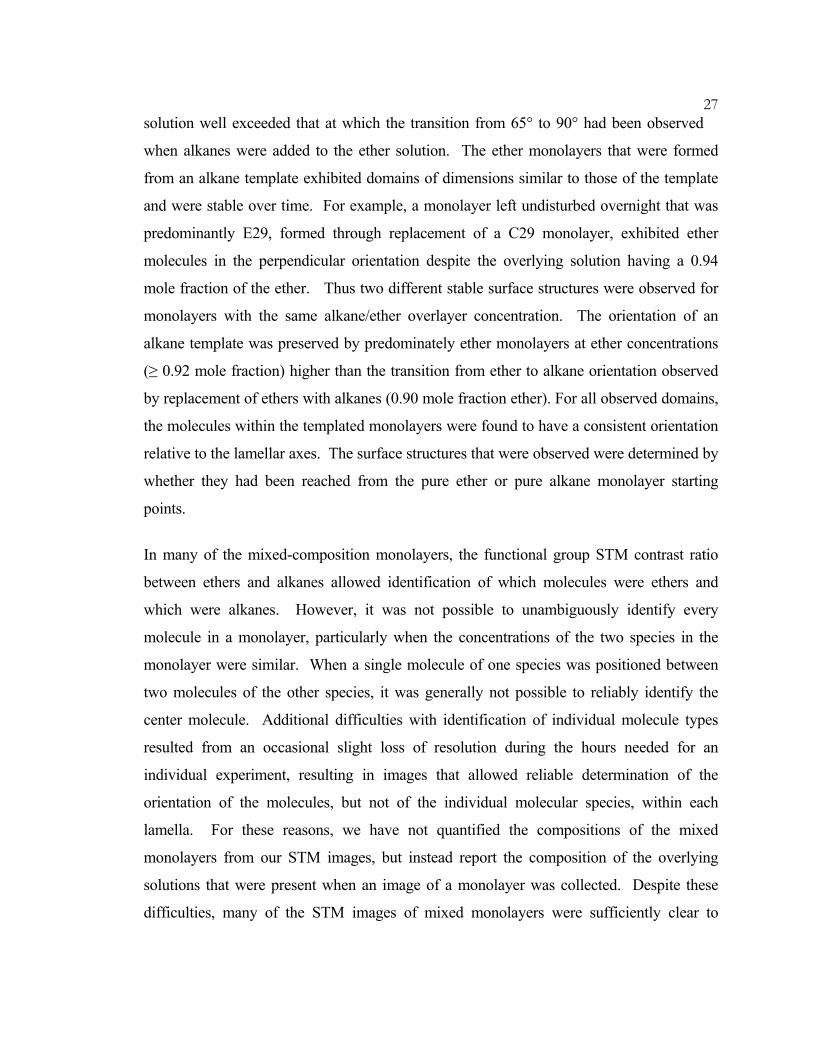
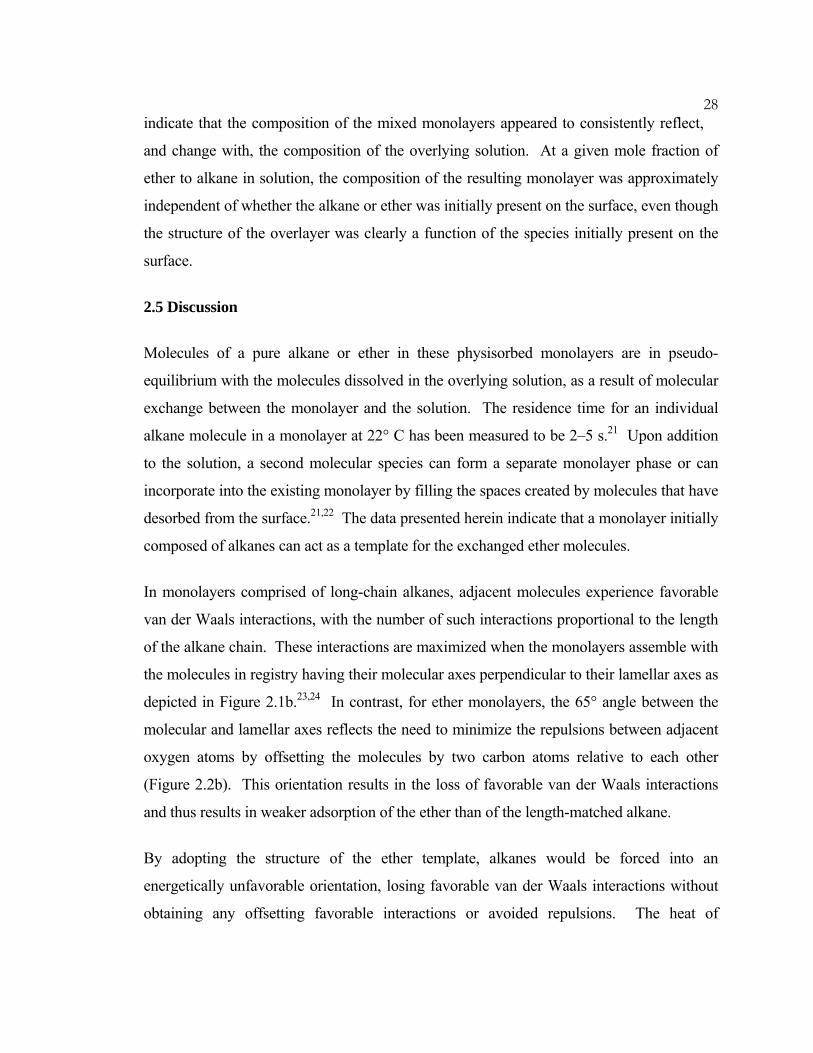
monolayer domains exhibited the 90° orientation. In contrast, when ethers were added to
the overlying solution and incorporated into an initially pure alkane monolayer, the
perpendicular molecular orientation of molecules in the initial monolayer was retained in
the resulting ether-dominated monolayer, even when relatively high mole fractions (> 0.92)
of ethers were in the contacting solution (Figure 2.3 and Figure 2.4). The orientation of the
initial alkane monolayer was preserved even when the mole fraction of the ether in the
27solution well exceeded that at which the transition from 65° to 90° had been observed
when alkanes were added to the ether solution. The ether monolayers that were formed
from an alkane template exhibited domains of dimensions similar to those of the template
and were stable over time. For example, a monolayer left undisturbed overnight that was
predominantly E29, formed through replacement of a C29 monolayer, exhibited ether
molecules in the perpendicular orientation despite the overlying solution having a 0.94
mole fraction of the ether. Thus two different stable surface structures were observed for
monolayers with the same alkane/ether overlayer concentration. The orientation of an
alkane template was preserved by predominately ether monolayers at ether concentrations
(≥ 0.92 mole fraction) higher than the transition from ether to alkane orientation observed
by replacement of ethers with alkanes (0.90 mole fraction ether). For all observed domains,
the molecules within the templated monolayers were found to have a consistent orientation
relative to the lamellar axes. The surface structures that were observed were determined by
whether they had been reached from the pure ether or pure alkane monolayer starting
points.
In many of the mixed-composition monolayers, the functional group STM contrast ratio
between ethers and alkanes allowed identification of which molecules were ethers and
which were alkanes. However, it was not possible to unambiguously identify every
molecule in a monolayer, particularly when the concentrations of the two species in the
monolayer were similar. When a single molecule of one species was positioned between
two molecules of the other species, it was generally not possible to reliably identify the
center molecule. Additional difficulties with identification of individual molecule types
resulted from an occasional slight loss of resolution during the hours needed for an
individual experiment, resulting in images that allowed reliable determination of the
orientation of the molecules, but not of the individual molecular species, within each
lamella. For these reasons, we have not quantified the compositions of the mixed
monolayers from our STM images, but instead report the composition of the overlying
solutions that were present when an image of a monolayer was collected. Despite these
difficulties, many of the STM images of mixed monolayers were sufficiently clear to
28indicate that the composition of the mixed monolayers appeared to consistently reflect,
and change with, the composition of the overlying solution. At a given mole fraction of
ether to alkane in solution, the composition of the resulting monolayer was approximately
independent of whether the alkane or ether was initially present on the surface, even though
the structure of the overlayer was clearly a function of the species initially present on the
surface.
2.5 Discussion
Molecules of a pure alkane or ether in these physisorbed monolayers are in pseudo-
equilibrium with the molecules dissolved in the overlying solution, as a result of molecular
exchange between the monolayer and the solution. The residence time for an individual
alkane molecule in a monolayer at 22° C has been measured to be 2–5 s.21 Upon addition
to the solution, a second molecular species can form a separate monolayer phase or can
incorporate into the existing monolayer by filling the spaces created by molecules that have
desorbed from the surface.21,22 The data presented herein indicate that a monolayer initially
composed of alkanes can act as a template for the exchanged ether molecules.
In monolayers comprised of long-chain alkanes, adjacent molecules experience favorable
van der Waals interactions, with the number of such interactions proportional to the length
of the alkane chain. These interactions are maximized when the monolayers assemble with
the molecules in registry having their molecular axes perpendicular to their lamellar axes as
depicted in Figure 2.1b.23,24 In contrast, for ether monolayers, the 65° angle between the
molecular and lamellar axes reflects the need to minimize the repulsions between adjacent
oxygen atoms by offsetting the molecules by two carbon atoms relative to each other
(Figure 2.2b). This orientation results in the loss of favorable van der Waals interactions
and thus results in weaker adsorption of the ether than of the length-matched alkane.
By adopting the structure of the ether template, alkanes would be forced into an
energetically unfavorable orientation, losing favorable van der Waals interactions without
obtaining any offsetting favorable interactions or avoided repulsions. The heat of
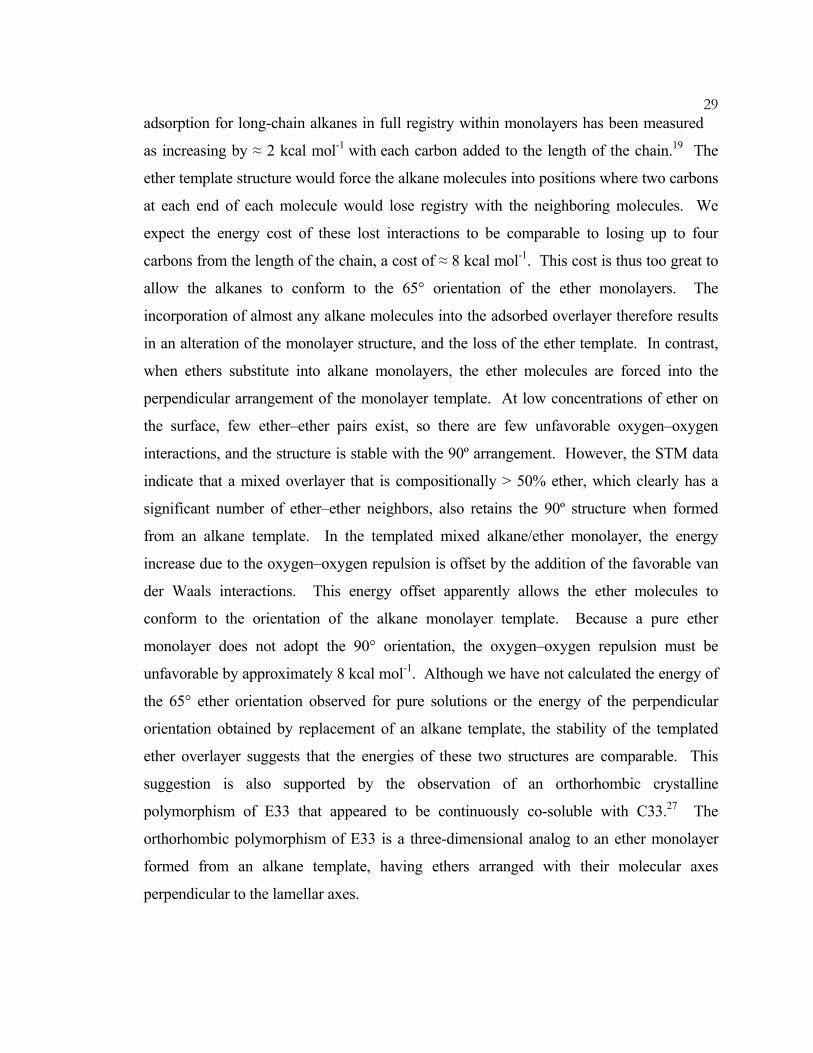
29adsorption for long-chain alkanes in full registry within monolayers has been measured
as increasing by ≈ 2 kcal mol-1 with each carbon added to the length of the chain.19 The
ether template structure would force the alkane molecules into positions where two carbons
at each end of each molecule would lose registry with the neighboring molecules. We
expect the energy cost of these lost interactions to be comparable to losing up to four
carbons from the length of the chain, a cost of ≈ 8 kcal mol-1. This cost is thus too great to
allow the alkanes to conform to the 65° orientation of the ether monolayers. The
incorporation of almost any alkane molecules into the adsorbed overlayer therefore results
in an alteration of the monolayer structure, and the loss of the ether template. In contrast,
when ethers substitute into alkane monolayers, the ether molecules are forced into the
perpendicular arrangement of the monolayer template. At low concentrations of ether on
the surface, few ether–ether pairs exist, so there are few unfavorable oxygen–oxygen
interactions, and the structure is stable with the 90º arrangement. However, the STM data
indicate that a mixed overlayer that is compositionally > 50% ether, which clearly has a
significant number of ether–ether neighbors, also retains the 90º structure when formed
from an alkane template. In the templated mixed alkane/ether monolayer, the energy
increase due to the oxygen–oxygen repulsion is offset by the addition of the favorable van
der Waals interactions. This energy offset apparently allows the ether molecules to
conform to the orientation of the alkane monolayer template. Because a pure ether
monolayer does not adopt the 90° orientation, the oxygen–oxygen repulsion must be
unfavorable by approximately 8 kcal mol-1. Although we have not calculated the energy of
the 65° ether orientation observed for pure solutions or the energy of the perpendicular
orientation obtained by replacement of an alkane template, the stability of the templated
ether overlayer suggests that the energies of these two structures are comparable. This
suggestion is also supported by the observation of an orthorhombic crystalline
polymorphism of E33 that appeared to be continuously co-soluble with C33.27 The
orthorhombic polymorphism of E33 is a three-dimensional analog to an ether monolayer
formed from an alkane template, having ethers arranged with their molecular axes
perpendicular to the lamellar axes.
30Because it was difficult to distinguish between the ethers and alkanes with certainty
when the concentrations of the two species were roughly equal in the resulting monolayer,
future experiments are planned using molecules that are more easily distinguished in STM
images. This should allow us to determine the mole fractions of the two species in the
adsorbed monolayer. Further studies, which will include other functional groups, differing
molecular lengths, and a comparison of the composition of the contacting solution with that
of the monolayer will aid in investigating the effects of changing the overlying solution and
in exploring the limitations of this technique.
2.6 Conclusions
Alkane monolayers act as templates for monolayers of the identical chain-length ethers, but
ether monolayers do not serve as templates for alkane monolayers. The orientation of
molecules within a monolayer can be controlled through the use of a monolayer template.
The molecules replacing the template layer are more likely to retain the orientation of the
template if that orientation offers offsetting favorable interactions.
31
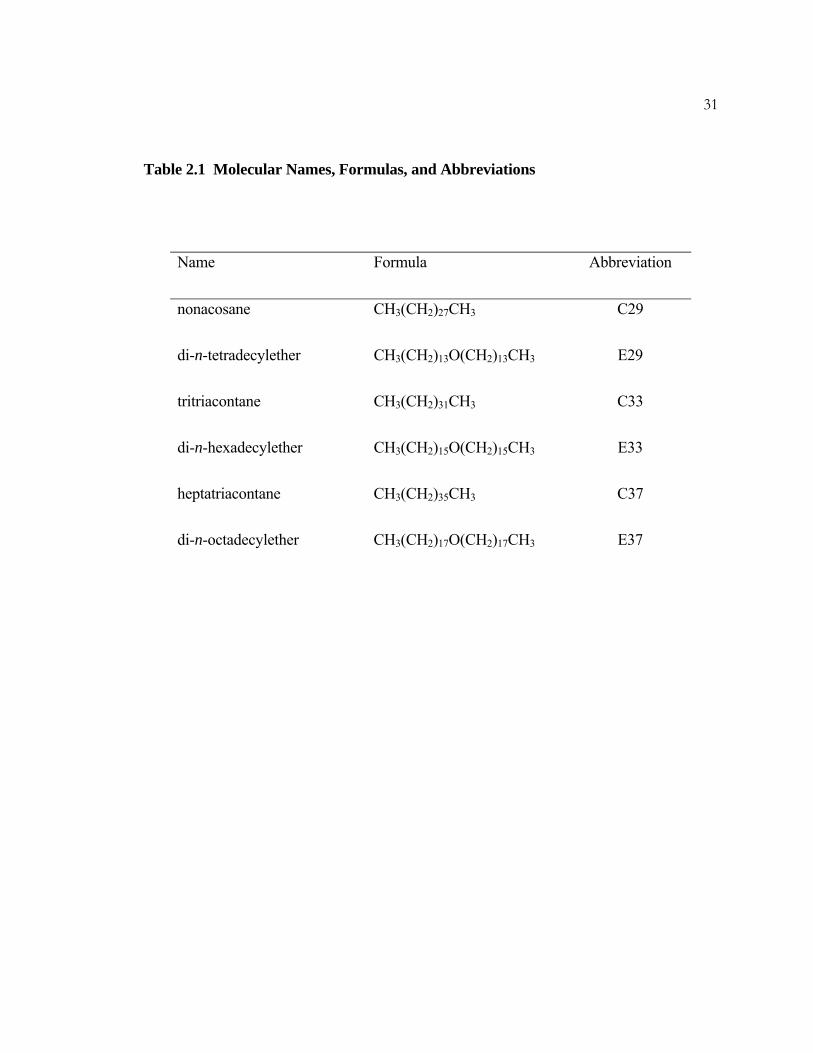
Table 2.1 Molecular Names, Formulas, and Abbreviations
Name Formula Abbreviation
nonacosane CH3(CH2)27CH3 C29
di-n-tetradecylether CH3(CH2)13O(CH2)13CH3 E29
tritriacontane CH3(CH2)31CH3 C33
di-n-hexadecylether CH3(CH2)15O(CH2)15CH3 E33
heptatriacontane CH3(CH2)35CH3 C37
di-n-octadecylether CH3(CH2)17O(CH2)17CH3 E37
32Figure 2.1 Tritriacontane on HOPG
(a) Constant-current STM image of a monolayer of tritriacontane, C33H68, adsorbed on a
graphite surface. Several molecules are marked by white lines. Imaging conditions were
current = 200 pA, Vbias = 1300 mV, and sample rate = 30.5 Hz.
(b) A model of a single lamella of an adsorbed tritriacontane monolayer. The molecules
are in registry with their molecular axes (dashed arrow) oriented perpendicular to the
lamellar axes (solid arrow) giving β = 90°.

33
(a)
(b)
β
Figure 2.1 Tritriacontane on HOPG

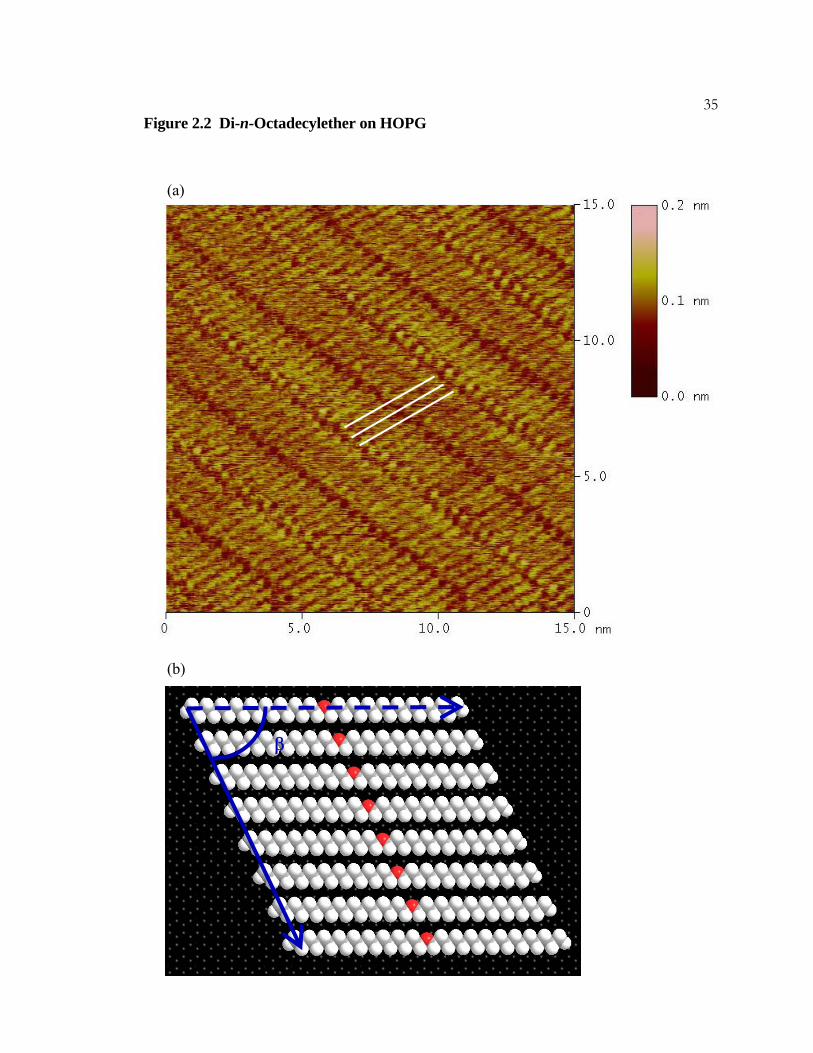
34Figure 2.2 Di-n-Octadecylether on HOPG
(a) STM image of a monolayer of octadecylether, CH3(CH2)17O(CH2)17CH3. Three
molecules are marked with white lines. The dark regions appearing in the center of the
imaged molecules result from the oxygen atoms. The imaging conditions were I = 200 pA,
Vbias = 900 mV, and sample rate = 30.5 Hz.
(b) A model of a lamella of an adsorbed octadecylether monolayer. The molecules are
offset from registry by two carbons to minimize oxygen-oxygen repulsion. The angle β
measures 65°.
35
(a)
(b)
β
Figure 2.2 Di-n-Octadecylether on HOPG
36Table 2.2 Measured Monolayer Cell Dimensions
Thermal drift of the STM tip is the principal source of measurement errors. The
dimensions are labeled to correspond with those of a crystalline unit cell. Thus a represents
the direction along the molecular axis and c represents the direction along the lamellar axis.
The length of a single molecule is a/2, and c is the distance between adjacent molecules.
Literature values from X-ray diffraction are included for comparison purposes: those for
the alkanes are from Ref. 25; those for the ether are from Ref. 26.
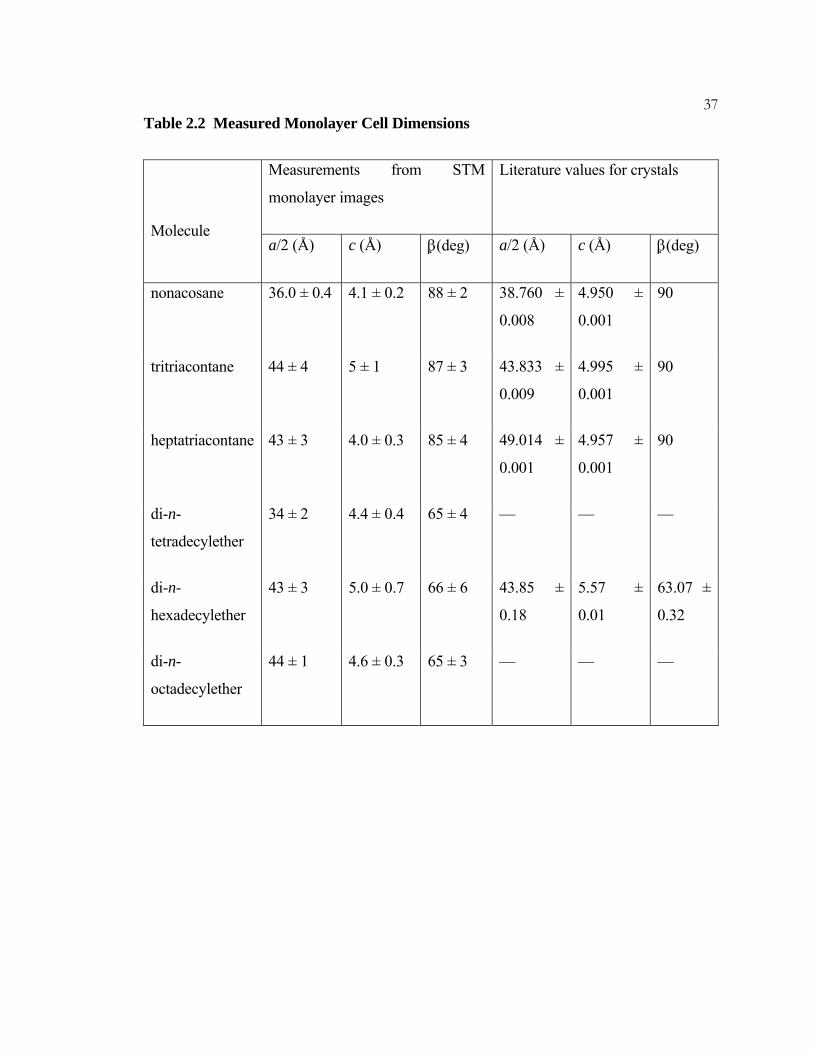
37Table 2.2 Measured Monolayer Cell Dimensions
Measurements from STM
monolayer images
Literature values for crystals
Molecule a/2 (Å) c (Å) β(deg) a/2 (Å) c (Å) β(deg)
nonacosane 36.0 ± 0.4 4.1 ± 0.2 88 ± 2 38.760 ±
0.008
4.950 ±
0.001
90
tritriacontane 44 ± 4 5 ± 1 87 ± 3 43.833 ±
0.009
4.995 ±
0.001
90
heptatriacontane 43 ± 3 4.0 ± 0.3 85 ± 4 49.014 ±
0.001
4.957 ±
0.001
90
di-n-
tetradecylether
34 ± 2 4.4 ± 0.4 65 ± 4 — — —
di-n-
hexadecylether
43 ± 3 5.0 ± 0.7 66 ± 6 43.85 ±
0.18
5.57 ±
0.01
63.07 ±
0.32
di-n-
octadecylether
44 ± 1 4.6 ± 0.3 65 ± 3 — — —

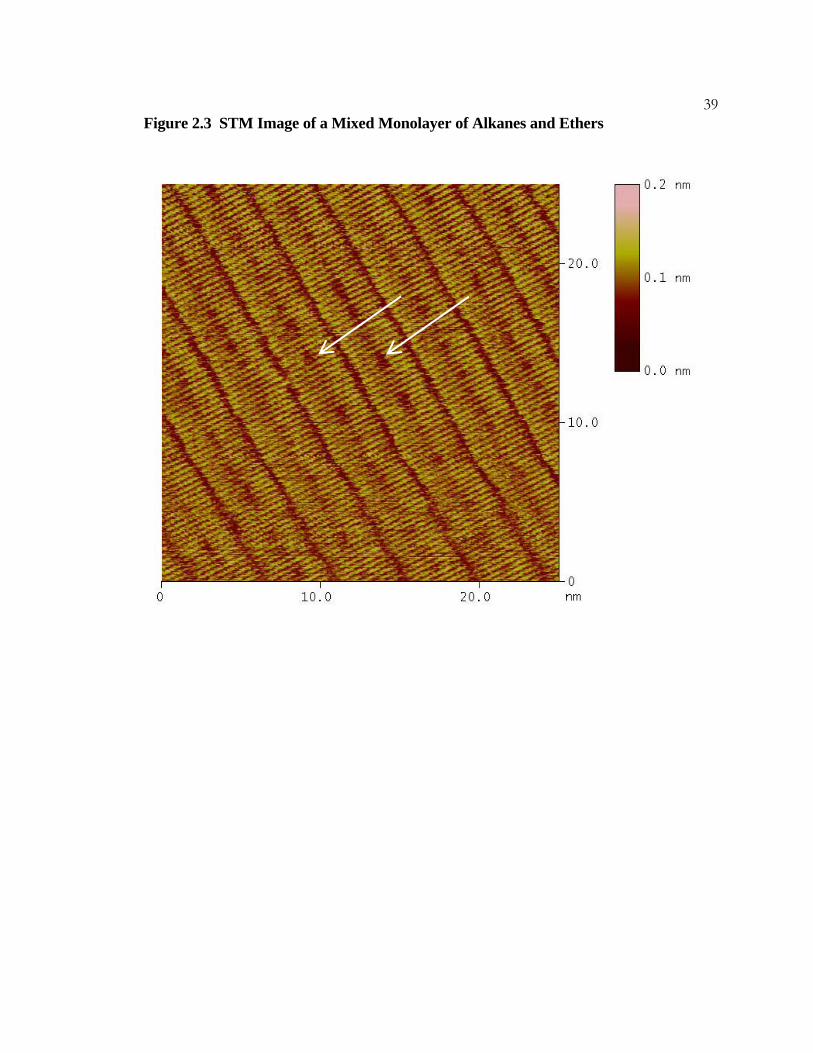
38Figure 2.3 STM Image of a Mixed Monolayer of Alkanes and Ethers
A constant-current STM image of a mixed monolayer of tritriacontane and di-n-
hexadecylether on graphite. The ether molecules can be distinguished by the dark spots in
the center of the molecules. Two clusters of ethers are indicated by white arrows. Imaging
conditions were I = 200 pA, Vbias = 1300 mV, and scan rate = 20.3 Hz.
39Figure 2.3 STM Image of a Mixed Monolayer of Alkanes and Ethers

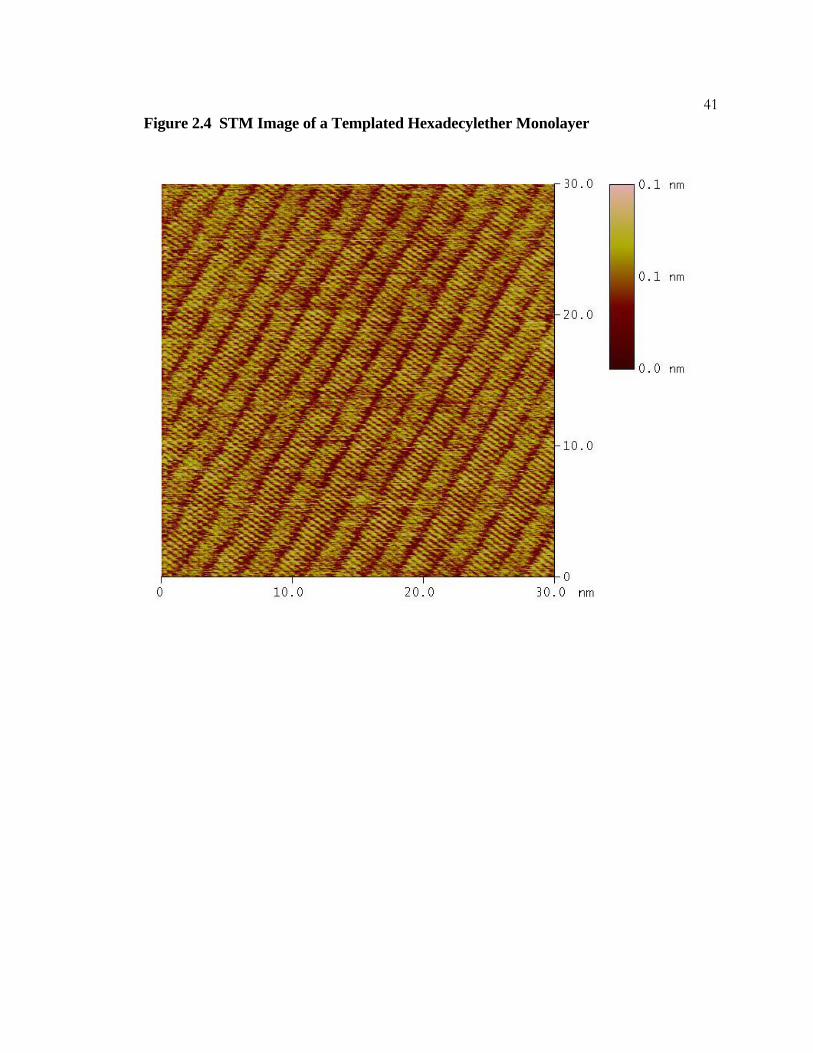
40Figure 2.4 STM Image of a Templated Hexadecylether Monolayer
Constant-current STM image of a hexadecylether monolayer formed from a tritriacontane
template. The molecules are oriented in the manner typical of alkanes; i.e., with their
molecular axes perpendicular to the lamellar axes. The mole fraction of ether in the
overlying solution is 0.97. The imaging conditions were I = 200 pA, Vbias = 1400 Mv, and
scan rate = 30.5 Hz.
41Figure 2.4 STM Image of a Templated Hexadecylether Monolayer
42 2.7 References
(1) Groszek, A. J. Nature. 1964, 204, 680.
(2) McGonigal, G. C.; Bernhardt, R. H.; Thomson, D. J. Appl. Phys. Lett. 1990, 57, 28–
30.
(3) Venkataraman, B.; Flynn, G. W.; Wilbur, J. L.; Folkers, J. P.; Whitesides, G.M. J.
Phys. Chem. B. 1995, 99, 8684–8689.
(4) Rabe, J. P. and Buchholz, S. Science 1991, 253, 424–427.
(5) McGonigal, G. C.; R. H. Bernhardt; Yeo, Y. H.; Thomson, D. J. J. Vac. Sci. Technol.,
B: Microelectron. Nanometer Struct. —Process., Meas., Phenom. 1991, 9, 1107–1110.
(6) Freund, J. E.; Edelwirth, M.; Krobel, P.; Heckl, W. M. Phys. Rev. B: Condens. Matter
Mater. Phys. 1997, 55, 5394-5397.
(7) Gorman, C. B.; Touzov, I.; Miller, R. Langmuir 1998, 14, 3052–3061.
(8) Yin, S. X.; Wang, C.; Xu, Q. M.; Lei, S. B.; Wan, L. J.; Bai, C. L. Chem. Phys. Lett.
2001, 348, 321–328.
(9) Yablon, D. G.; Giancarlo, L. C.; Flynn, G. W. J. Phys. Chem. B 2000, 104, 7627–
7635.
(10) Xie, Z. X.; Xu, X.; Mao, B. W.; Tanaka, K. Langmuir 2002, 18, 3113–3116.
(11) De Feyter, S.; Larsson, M.; Schuurmans, N.; Verkuijl, B.; Zoriniants, G.; Gesquiere,
A.; Abdel-Mottaleb, M. M.; van Esch, J.; Feringa, B.L.; van Stam, J.; De Schryber, F.
Chem.— Eur. J. 2003, 9, 1198–1206.
(12) Nanjo, H.; Qian, P.; Yokoyama, T.; Suzuki, T. M. Jpn. J. Appl. Phys., Part 1 2003,
42, 6560–6563.
43(13) Wei, Y. H.; Kannappan, K.; Flynn, G.W.; Zimmt, M. B. J. Am. Chem. Soc. 2004,
126, 5318–5322.
(14) Plass, K. E.; Kim, K.; Matzger, A. J. J. Am. Chem. Soc. 2004, 126, 9042–9053.
(15) Tao, F.; Goswami, J.; Bernasek, S. L. J. Phys. Chem. B 2006, 110, 19562–19569.
(16) Nishino, T.; Buhlmann, P.; Ito, T.; Umezawa, Y. Phys. Chem. Chem. Phys. 2001, 3,
1867–1869.
(17) Padowitz, D. F.; Sada, D. M.; Kemer, E. L.; Dougan, M. L.; Xue, W. A. J. Phys.
Chem. B 2002, 106, 593–598.
(18) Claypool, C. L.; Faglioni, F.; Goddard, W. A.; Gray, H. B.; Lewis, N. S.; Marcus, R.
A. J. Phys. Chem. B 1997, 101, 5978–5995.
(19) Groszek, A. J. Nature 1962, 196, 531–533.
(20) Duim, W. C.; Clarke, S. M. J. Phys. Chem. B 2006, 110, 23853–23859.
(21) Padowitz, D. F.; Messmore, B. W. J. Phys. Chem. B 2000, 104, 9943–9946.
(22) Stevens, F.; Beebe, T.P. Langmuir 1999, 15, 6884–6889.
(23) Kern, H. E.; Piechocki, A.; Brauer, U.; Findenegg, G. H. Progress in Colloid and
Polymer Science 1978, 65, 118–124.
(24) Claypool, C. L.; Faglioni, F.; Matzger, A. J.; Goddard; Lewis, N. S. J. Phys. Chem. B
1999, 103, 9690–9699.
(25) Craig, S. R.; Hastie, G. P.; Roberts, K. J.; Sherwood, J. N. J. Mater. Chem. 1994, 4,
977–981.
(26) Kohlhaas, R. Berichte der Deutschen Chemischen Gesellschaft 1940, 73B, 189–200.

44(27) Dorset, D. L.; Clavell-Grunbaum, D.; Snyder, R. G. J. Phys. Chem. B 2000, 104,
532–537.
45C h a p t e r 3
SCANNING TUNNELING MICROSCOPY STUDIES OF MONOLAYER TEMPLATES: ALKYLTHIOETHERS AND ALKYLETHERS
3.1 Overview
Scanning tunneling microscopy has been used to determine the molecular ordering in
stable, ordered monolayers formed from long-chain normal and substituted alkanes in
solution on highly oriented pyrolytic graphite surfaces. Monolayers were initially formed
using an overlying solution of either a symmetrical dialkylthioether or a symmetrical
dialkylether. Initially pure thioether solutions were then changed to nearly pure solutions
of the identical chain-length ether, and vice versa. The direct application of a pure solution
of long-chain symmetrical ethers onto graphite produced a lamellate monolayer within
which the individual molecular axes were oriented at an angle of ~ 65° to the lamellar axes.
In contrast, a pure solution of long-chain symmetrical thioethers on graphite produced a
monolayer within which the molecular axes were oriented perpendicular to the lamellar
axes. When ethers were gradually added to solutions overlying pure thioether monolayers,
the ethers substituted into the existing monolayer structure. Thus the ether molecules could
be forced to orient in the perpendicular thioether-like manner through the use of a thioether
template monolayer. Continued addition of ethers to the solution ultimately produced a
nearly pure ether monolayer that retained the orientation of the thioether monolayer
template. However, a monolayer of thioether molecules formed by gradual substitution
into an ether monolayer did not retain the 65° orientation typical of dialkylethers, but
exhibited the 90° orientation typical of dialkylthioether monolayers. The thioethers and
ethers were easily distinguished in images of mixed monolayers, allowing both an analysis
of the distribution of the molecules within the mixed monolayers and a comparison of the
monolayer compositions with those of the overlying solutions. Substitution of molecules
into the template monolayer did not proceed randomly; instead, a molecule within a

46monolayer was more likely to be replaced by a molecule in the overlying solution if it
was located next to a molecule that had already been replaced.
3.2 Introduction
Long-chain normal and substituted alkanes in solution spontaneously adsorb onto a number
of surfaces, including graphite, molybdenum disulfide, and tungsten disulfide.1 This
physisorption process results in the formation of stable, highly ordered monolayers at the
solid–liquid interface, and has found relevance in the fields of lubrication, separation,
adhesion, catalysis, crystallization, and corrosion-resistance. When an atomically flat
surface such as highly oriented pyrolytic graphite (HOPG) is used as a substrate, a scanning
tunneling microscope (STM) can be used to obtain images of the adsorbed monolayers.2–4
Images obtained using this method often exhibit atomic-scale resolution, and commonly
reveal a single ordered monolayer domain covering a relatively large area of the surface.
Physisorbed monolayers represent a route to the spontaneous assembly of highly ordered
surface structures with nanometer-scale features, and are thus of particular interest for
surface patterning.
The orientation of molecules within a physisorbed monolayer is determined by the shape of
the molecules and by the interactions between functional groups.5–8 The surface structures
of such physisorbed monolayers generally result in simple two-dimensional patterns.
Production of more complex patterns requires the use of overlying solutions that contain a
mixture of molecules, or the use of solutions of molecules that have elaborate or chiral
structures.9–15
In an alternate approach, we recently reported that a monolayer of long-chain normal
alkanes can act as a template for an ether monolayer.16 The templating approach allows the
production of a monolayer composed of molecules that have been forced to assume an
atypical orientation. The direct application of a pure solution of symmetrical long-chain
alkylethers or long-chain alkylthioethers onto a clean HOPG surface results in the
formation of a lamellate monolayer; however, the ether molecules lie with their molecular
47axes at an angle of ~ 65° to the lamellar axes, while the thioethers lie with their
molecular axes perpendicular to the lamellar axes.16–19 Interestingly, an ether monolayer
composed of molecules oriented in the manner typical of alkanes can be produced through
the use of an alkane monolayer template.16 When the HOPG surface is first covered by a
monolayer of the normal alkane and the composition of the overlying solution is
subsequently changed to favor the symmetrical ether of the same chain length, the ether
molecules replace the alkanes while retaining the structure of the alkane monolayer
template. Although these earlier studies readily allowed observation of the monolayer
templating effect, alkanes and ethers could not confidently be distinguished in the mixed
monolayers, due to insufficient functional group contrast in typical STM images of such
systems.
In this work, we report the results of a series of experiments involving monolayers of
symmetrical alkylthioethers and symmetrical alkylethers. The lamellate monolayers
formed on HOPG by pure solutions of symmetrical alkylthioethers are similar to those
formed by normal alkanes, in that the thioether molecules lie with their molecular axes
perpendicular to the lamellar axes. However, ether and thioether functional groups are
easily distinguished in STM images, with the oxygen atom of the ether functionality
appearing as a dark, low-contrast region, whereas the sulfur atom in an alkylthioether
appears as a bright, high-contrast region. The contrast between the oxygen and sulfur
atoms is substantially greater than the contrast observed between alkanes and alkylethers,
enabling direct and confident determination of the composition of the mixed monolayers in
STM images.19,21 By extending the study of monolayer templates to include
dialkylthioethers, we have been able to monitor the progress of template replacement, to
analyze the distribution of molecules within mixed monolayers, and to compare the
monolayer composition with that of the overlying solution.
3.3 Experimental Details
Experiments were performed using length-matched (in their all trans- configuration) pairs
of the following symmetrical dialkylthioethers and dialkylethers: di-n-tetradecylsulfide and
48di-n-tetradecylether; di-n-hexadecylsulfide and di-n-hexadecylether; di-n-
octadecylsulfide and di-n-octadecylether (all from TCI America, > 95% purity). Table 3.1
lists the chemical formulas and abbreviations used herein for these six compounds.
Solutions containing each of these compounds were prepared in phenyloctane (Acros, 99%
pure). Phenyloctane is commonly used as a solvent in studies of physisorbed monolayers
because it does not form a monolayer on HOPG, and thus does not compete with the
formation of monolayers by the dissolved species. The thioethers and ethers used in this
study are sparingly soluble in phenyloctane. The solutions were filtered before use and
were approximately saturated at room temperature. The concentrations of the solutions
were determined using an HP 6890 gas chromatograph equipped with a flame ionization
detector, with 1-bromohexadecane (Aldrich) used as an internal standard. The
concentrations of the pure solutions were as follows: E29, 75 mM; E33, 71 mM; E37, 4.8
mM; S29, 61 mM; S33, 11 mM; S37, 3.5 mM. The ethers were more soluble than the
thioethers, and shorter molecules were more soluble than longer ones. Four or more mixed
solutions were prepared for each of the three length-matched pairs of thioethers and ethers.
The mixed solutions were prepared by mixing volumes of the matched ether and sulfide
solutions in ratios of 80:20, 60:40, 40:60, and 20:80.
HOPG (Grade SPI-1 from Structure Probe Inc.) was freshly cleaved and secured in a cell
that could contain liquids while still allowing STM imaging. The surface was then imaged
under ambient conditions using a fresh, mechanically cut 80:20 Pt/Ir tip. Images were
collected using a Digital Instruments (Veeco) Nanoscope III STM controlled by Nanoscope
software version 5.12r2. Each image consisted of 512 sample lines. A real-time plane-
fitting function was applied to the images during scanning, but no further image corrections
were performed. After images of the bare HOPG were obtained at atomic-scale resolution,
a 15 μL drop of a pure thioether or ether solution was placed onto the graphite surface.
After ~ 30–45 min, the resulting monolayer was imaged with the STM. Imaging
conditions were typically 1200 mV sample bias, with a constant current of 200 pA. A 5
μL drop of the mixed solution that contained the next lower concentration of the species
already present on the surface was then added to the cell. For example, after imaging a
49monolayer formed from a pure S29 solution, 5 μL of the 80:20 S29/E29 mixture was
added to the cell. After allowing ~ 30–45 min for equilibration of the mixture, the resulting
monolayer was then observed with the STM. Once images were collected, 5 μL of liquid
were removed from the cell, and the liquid was replaced with the same volume of a mixed
solution. The relative concentration of the mixture component that was initially present on
the surface and in the initial overlying solution was gradually reduced by removing liquid
from the cell, and replacing the volume removed with equal volumes of mixed solutions
that contained successively lower amounts of the first component of the length-matched
pair. The process was continued until the solution composition greatly favored the
component that was not initially present on the surface. Solutions containing only the
second mixture component were used in the final repetitions of an experiment, to further
increase the concentration of the second mixture component in the solution above the
HOPG surface. In the example of S29 and E29 given above, after gradually reducing the
concentration of S29 in the overlying solution, a few portions of pure E29 solution were
added to the cell, to further eliminate the thioether from the system. Tunneling tips were
not changed during an experiment, to avoid mechanically disturbing the monolayers. An
internal standard was added to the portions of liquid removed from the cell during each
experiment, and gas chromatography was used to monitor the composition of the overlying
solution by analysis of such samples. These experimental procedures were conducted
multiple times, starting with overlying solutions of each of the three thioethers and each of
the three ethers.
Well-resolved STM images of physisorbed monolayers were obtained throughout the
course of these experiments. The effects of thermal drift were minimal, and the STM
images thus allowed determination of the orientation of the molecules within the
monolayers, as measured using tools available in the Nanoscope III software. The
compositions of the monolayers, and the distributions of each species within the mixed
monolayers, were then analyzed using computer software that was written for these
purposes. This software superimposed a scaled grid upon each STM image. The grid was
then adjusted by the user to correspond to the orientation of the molecules in the monolayer
50image, such that each cell of the grid corresponded to a single molecule in the STM
image. The user then selected a threshold contrast level, which the software then compared
to the average image contrast level over a region in the center of each grid cell. These
compared regions thus corresponded to the centers of the molecules, where either a dark
oxygen atom or a bright sulfur atom was present. Molecules with centers that had average
contrast values higher than the threshold were identified as thioethers, and those that had
lower contrasts than the threshold were identified as ethers. The results of the analysis
were then overlaid on the image, allowing the user to confirm that the program had
correctly performed the molecular identification function. The number and location of
molecules of each species within the image were recorded by the software, and the
observed distribution of molecules was then compared to statistics produced by 10,000
computer-generated random distributions calculated for the same monolayer structure and
composition. These random distributions were then used to calculate the likelihood of
finding each length of a cluster within the monolayer in which adjacent molecules were of
the same species. The primary role of the software was to assist in counting the large
number of molecules in each of a large number of images, and to record both the numbers
of molecules and their positions within each monolayer. The output of the program was
easily monitored and verified by the user.
3.4 Results
Figure 3.1 and Figure 3.2 show representative STM images of monolayers formed at the
interface between HOPG and a solution of either a thioether or an ether. Alkylthioether
molecules within monolayers formed in the absence of an alkylether were observed to lie
with their molecular axes perpendicular to their lamellar axes. In contrast, alkylethers
within monolayers formed in the absence of an alkylthioether were observed to lie with
their molecular axes at an angle of ~ 65° with respect to their lamellar axes.16–19 Two cases
of structural polymorphism relevant to our work have been reported, one each for
alkylthioether and alkylether monolayers. Fukumura et al. reported a second monolayer
structure for thioether S37, with molecules positioned with their axes at an angle of ~ 60°
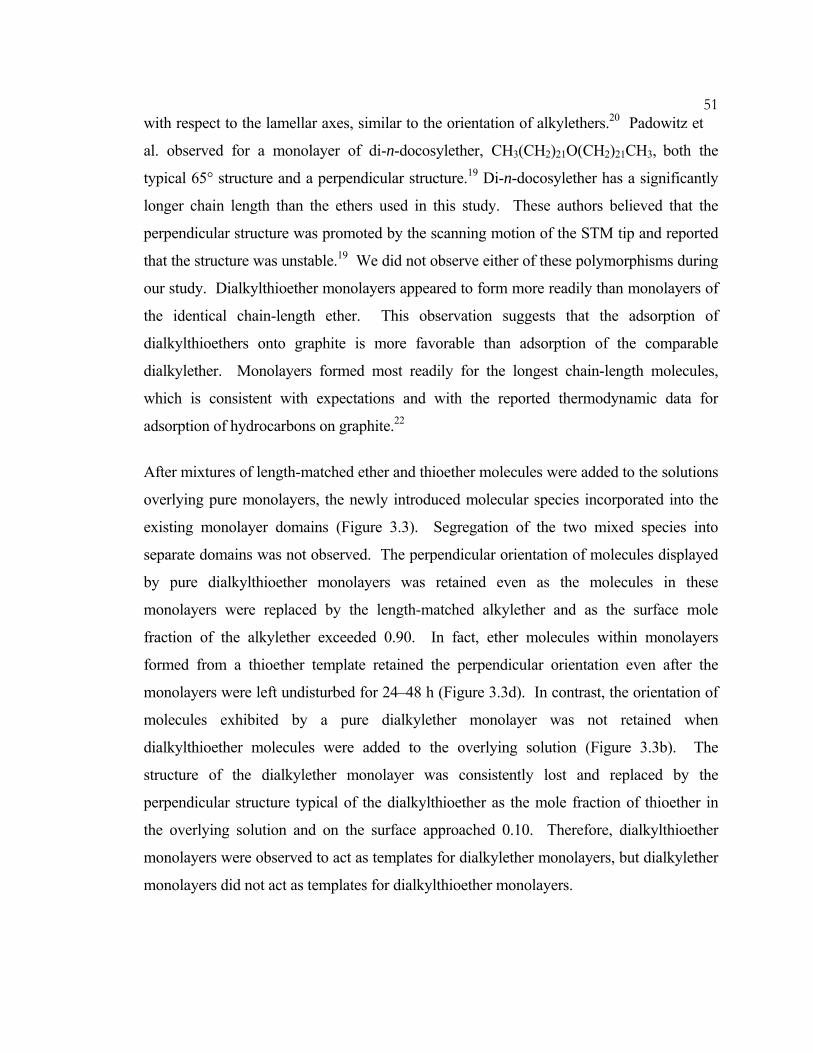
51with respect to the lamellar axes, similar to the orientation of alkylethers.20 Padowitz et
al. observed for a monolayer of di-n-docosylether, CH3(CH2)21O(CH2)21CH3, both the
typical 65° structure and a perpendicular structure.19 Di-n-docosylether has a significantly
longer chain length than the ethers used in this study. These authors believed that the
perpendicular structure was promoted by the scanning motion of the STM tip and reported
that the structure was unstable.19 We did not observe either of these polymorphisms during
our study. Dialkylthioether monolayers appeared to form more readily than monolayers of
the identical chain-length ether. This observation suggests that the adsorption of
dialkylthioethers onto graphite is more favorable than adsorption of the comparable
dialkylether. Monolayers formed most readily for the longest chain-length molecules,
which is consistent with expectations and with the reported thermodynamic data for
adsorption of hydrocarbons on graphite.22
After mixtures of length-matched ether and thioether molecules were added to the solutions
overlying pure monolayers, the newly introduced molecular species incorporated into the
existing monolayer domains (Figure 3.3). Segregation of the two mixed species into
separate domains was not observed. The perpendicular orientation of molecules displayed
by pure dialkylthioether monolayers was retained even as the molecules in these
monolayers were replaced by the length-matched alkylether and as the surface mole
fraction of the alkylether exceeded 0.90. In fact, ether molecules within monolayers
formed from a thioether template retained the perpendicular orientation even after the
monolayers were left undisturbed for 24–48 h (Figure 3.3d). In contrast, the orientation of
molecules exhibited by a pure dialkylether monolayer was not retained when
dialkylthioether molecules were added to the overlying solution (Figure 3.3b). The
structure of the dialkylether monolayer was consistently lost and replaced by the
perpendicular structure typical of the dialkylthioether as the mole fraction of thioether in
the overlying solution and on the surface approached 0.10. Therefore, dialkylthioether
monolayers were observed to act as templates for dialkylether monolayers, but dialkylether
monolayers did not act as templates for dialkylthioether monolayers.
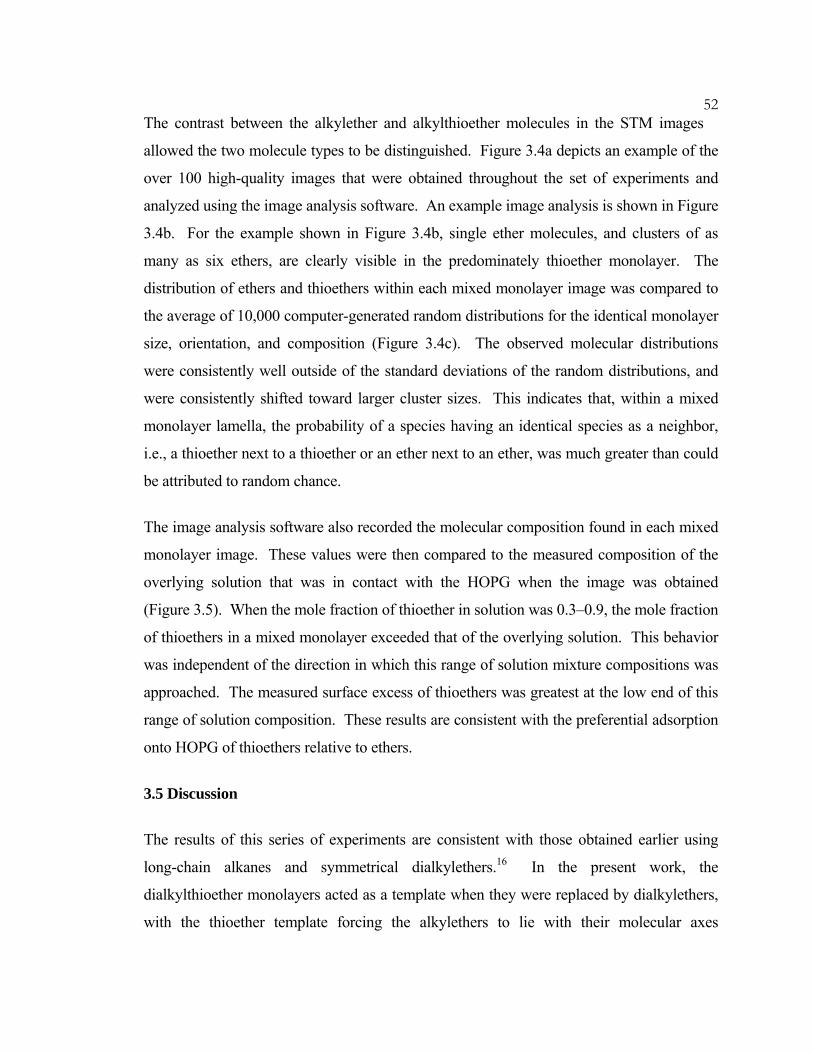
52The contrast between the alkylether and alkylthioether molecules in the STM images
allowed the two molecule types to be distinguished. Figure 3.4a depicts an example of the
over 100 high-quality images that were obtained throughout the set of experiments and
analyzed using the image analysis software. An example image analysis is shown in Figure
3.4b. For the example shown in Figure 3.4b, single ether molecules, and clusters of as
many as six ethers, are clearly visible in the predominately thioether monolayer. The
distribution of ethers and thioethers within each mixed monolayer image was compared to
the average of 10,000 computer-generated random distributions for the identical monolayer
size, orientation, and composition (Figure 3.4c). The observed molecular distributions
were consistently well outside of the standard deviations of the random distributions, and
were consistently shifted toward larger cluster sizes. This indicates that, within a mixed
monolayer lamella, the probability of a species having an identical species as a neighbor,
i.e., a thioether next to a thioether or an ether next to an ether, was much greater than could
be attributed to random chance.
The image analysis software also recorded the molecular composition found in each mixed
monolayer image. These values were then compared to the measured composition of the
overlying solution that was in contact with the HOPG when the image was obtained
(Figure 3.5). When the mole fraction of thioether in solution was 0.3–0.9, the mole fraction
of thioethers in a mixed monolayer exceeded that of the overlying solution. This behavior
was independent of the direction in which this range of solution mixture compositions was
approached. The measured surface excess of thioethers was greatest at the low end of this
range of solution composition. These results are consistent with the preferential adsorption
onto HOPG of thioethers relative to ethers.
3.5 Discussion
The results of this series of experiments are consistent with those obtained earlier using
long-chain alkanes and symmetrical dialkylethers.16 In the present work, the
dialkylthioether monolayers acted as a template when they were replaced by dialkylethers,
with the thioether template forcing the alkylethers to lie with their molecular axes
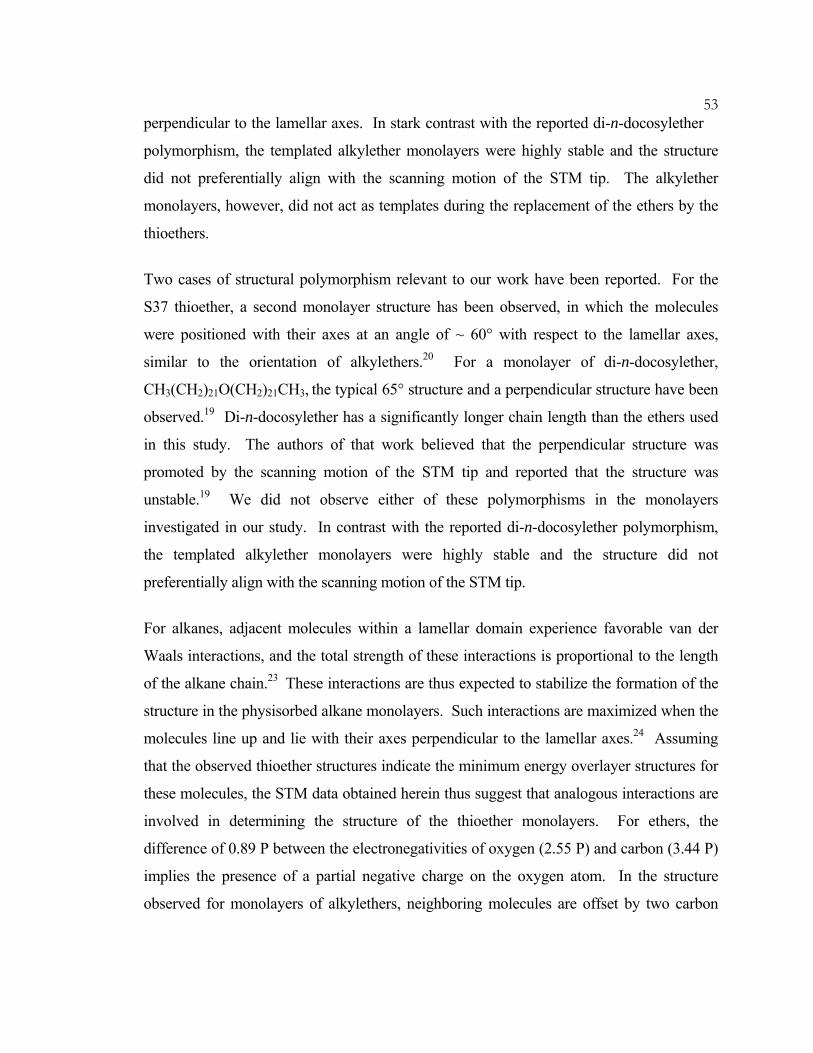
53perpendicular to the lamellar axes. In stark contrast with the reported di-n-docosylether
polymorphism, the templated alkylether monolayers were highly stable and the structure
did not preferentially align with the scanning motion of the STM tip. The alkylether
monolayers, however, did not act as templates during the replacement of the ethers by the
thioethers.
Two cases of structural polymorphism relevant to our work have been reported. For the
S37 thioether, a second monolayer structure has been observed, in which the molecules
were positioned with their axes at an angle of ~ 60° with respect to the lamellar axes,
similar to the orientation of alkylethers.20 For a monolayer of di-n-docosylether,
CH3(CH2)21O(CH2)21CH3, the typical 65° structure and a perpendicular structure have been
observed.19 Di-n-docosylether has a significantly longer chain length than the ethers used
in this study. The authors of that work believed that the perpendicular structure was
promoted by the scanning motion of the STM tip and reported that the structure was
unstable.19 We did not observe either of these polymorphisms in the monolayers
investigated in our study. In contrast with the reported di-n-docosylether polymorphism,
the templated alkylether monolayers were highly stable and the structure did not
preferentially align with the scanning motion of the STM tip.
For alkanes, adjacent molecules within a lamellar domain experience favorable van der
Waals interactions, and the total strength of these interactions is proportional to the length
of the alkane chain.23 These interactions are thus expected to stabilize the formation of the
structure in the physisorbed alkane monolayers. Such interactions are maximized when the
molecules line up and lie with their axes perpendicular to the lamellar axes.24 Assuming
that the observed thioether structures indicate the minimum energy overlayer structures for
these molecules, the STM data obtained herein thus suggest that analogous interactions are
involved in determining the structure of the thioether monolayers. For ethers, the
difference of 0.89 P between the electronegativities of oxygen (2.55 P) and carbon (3.44 P)
implies the presence of a partial negative charge on the oxygen atom. In the structure
observed for monolayers of alkylethers, neighboring molecules are offset by two carbon
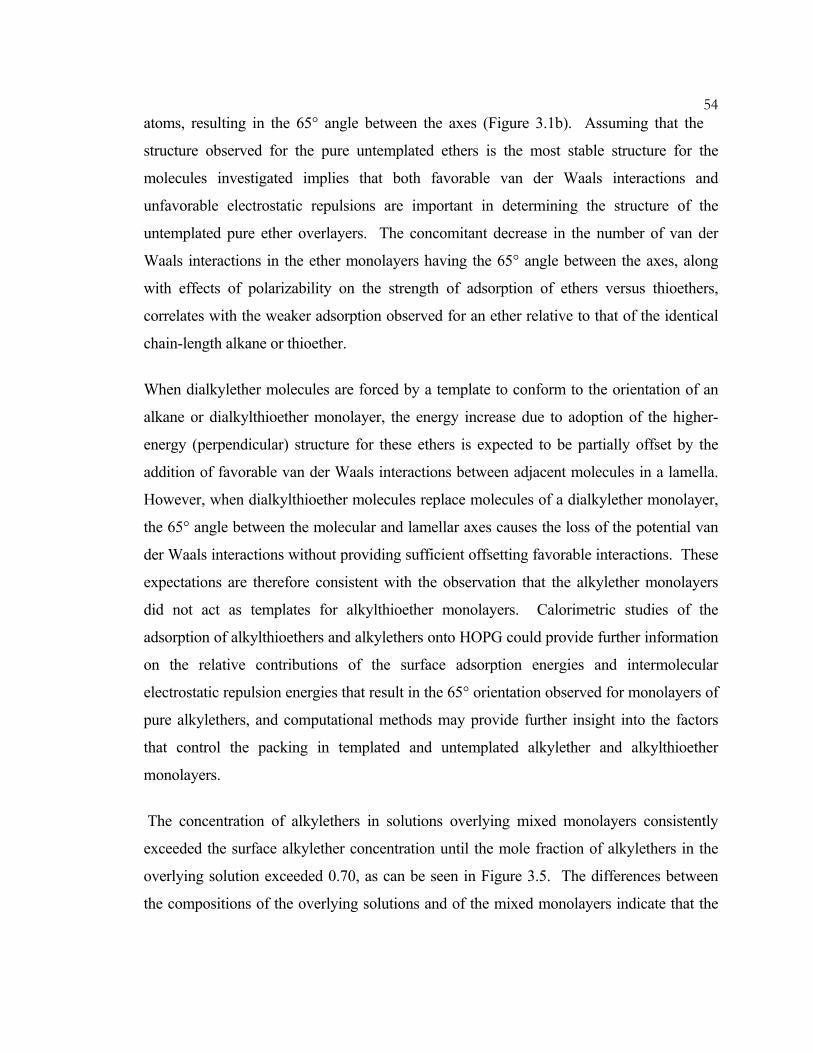
54atoms, resulting in the 65° angle between the axes (Figure 3.1b). Assuming that the
structure observed for the pure untemplated ethers is the most stable structure for the
molecules investigated implies that both favorable van der Waals interactions and
unfavorable electrostatic repulsions are important in determining the structure of the
untemplated pure ether overlayers. The concomitant decrease in the number of van der
Waals interactions in the ether monolayers having the 65° angle between the axes, along
with effects of polarizability on the strength of adsorption of ethers versus thioethers,
correlates with the weaker adsorption observed for an ether relative to that of the identical
chain-length alkane or thioether.
When dialkylether molecules are forced by a template to conform to the orientation of an
alkane or dialkylthioether monolayer, the energy increase due to adoption of the higher-
energy (perpendicular) structure for these ethers is expected to be partially offset by the
addition of favorable van der Waals interactions between adjacent molecules in a lamella.
However, when dialkylthioether molecules replace molecules of a dialkylether monolayer,
the 65° angle between the molecular and lamellar axes causes the loss of the potential van
der Waals interactions without providing sufficient offsetting favorable interactions. These
expectations are therefore consistent with the observation that the alkylether monolayers
did not act as templates for alkylthioether monolayers. Calorimetric studies of the
adsorption of alkylthioethers and alkylethers onto HOPG could provide further information
on the relative contributions of the surface adsorption energies and intermolecular
electrostatic repulsion energies that result in the 65° orientation observed for monolayers of
pure alkylethers, and computational methods may provide further insight into the factors
that control the packing in templated and untemplated alkylether and alkylthioether
monolayers.
The concentration of alkylethers in solutions overlying mixed monolayers consistently
exceeded the surface alkylether concentration until the mole fraction of alkylethers in the
overlying solution exceeded 0.70, as can be seen in Figure 3.5. The differences between
the compositions of the overlying solutions and of the mixed monolayers indicate that the
55thioethers are more strongly adsorbed onto HOPG than the ethers. This behavior is
consistent with our observations that thioether monolayers form more readily than
monolayers of the identical chain-length ether, and with the expectation that the oxygen–
oxygen interaction is repulsive. The preference for adsorption of thioethers was observed
to be independent of the species that was initially present on the surface and in the
overlying solution. Alkylether monolayers did not act as templates for the alkylthioethers,
and data collection for experiments that began with alkylether monolayers was ended once
the monolayer structure was observed to have completed the change to the structure
characteristic of thioethers. Therefore, the data presented in Figure 3.5 were collected
during the templating process and analogous data for mixed, but not templated, monolayers
were not collected.
We previously proposed that replacement of molecules within a monolayer proceeded via
filling openings left in the monolayer by molecules that had desorbed from the surface.16
Although additional factors, such as the relative concentrations of the two species in the
overlying solution and their relative energies of adsorption, are expected to affect the
details of the monolayer substitution process, the relative rates of desorption from the
monolayer will dominate the template substitution. Desorption from these monolayers is
an activated process,25 and the ease of removing a molecule from the surface depends upon
the strength of its interactions with its neighbors. For example, since the formation of the
observed ether overlayers is presumed to be less favored thermodynamically than the
formation of the observed thioether monolayers, an ether molecule that has two ether
neighbors would be expected to be more readily removed from a monolayer than an ether
molecule that has two thioether neighbors. However, once an individual molecule is
removed from a monolayer, stabilizing interactions are lost by the molecules that are
adjacent to the new vacant site. The probability that these former neighbors will also be
removed from the surface is therefore increased significantly, until the vacancy is filled by
a molecule from the overlying solution. This process would result in non-random
replacement of molecules in a template monolayer.
56In our previous work, we estimated that the non-optimal interactions in ether monolayers
resulted in a stability loss of ~ 8 kcal mol-1 in ether monolayers on HOPG relative to
monolayers formed from the identical chain-length alkane on HOPG. The adsorption of a
long-chain alkane onto graphite is believed to be primarily driven by van der Waals
interactions between neighboring molecules, in accord with the observation that the heat of
adsorption for long-chain alkanes increases linearly with increasing chain length.22 Thus, if
the energy of adsorption arises from stabilization of a molecule by two neighbors, the
stability loss that a molecule in a monolayer would experience as the result of the removal
of one of its neighbors can be estimated to be about one-half of that value. The heats of
adsorption onto graphite for the molecules used in this study have not been reported;
however, we expect the average value for these molecules to be comparable to the heat of
adsorption for n-dotriacontane, which has been measured to be ~ 35 kcal mol-1.1,22 The loss
of such interactions can thus be expected to dominate the monolayer substitution process.
Others have suggested that the replacement of molecules in a monolayer does not proceed
randomly.19 The distribution analyses described herein for mixed monolayers, and
illustrated in Figure 3.4c, support this hypothesis. Our results are therefore consistent with
a process in which the replacement of a molecule on the surface greatly increases the
probability that its neighbors will also be replaced.
3.6 Conclusions
When molecules in monolayers of symmetrical dialkylthioethers are replaced by molecules
of the identical chain-length symmetrical dialkylether, the structure of the dialkylthioether
monolayer is retained. This is not the case when molecules in monolayers of dialkylethers
are replaced by dialkylthioethers. These results supplement our earlier work with normal
alkanes and alkylethers, through the additional ability to distinguish between the thioether
and ether molecules in the STM images of mixed monolayers. This ability has allowed
confirmation that dialkylthioethers are more strongly physisorbed than the identical chain-
length dialkylether, and that the replacement of molecules in a monolayer does not proceed
randomly. Calorimetric studies of the adsorption of alkylthioethers and alkylethers onto

57HOPG would provide an accurate measure of the contribution of the electrostatic
repulsion that produces the 65° orientation in monolayers of alkylethers, and computational
methods may provide further insight into packing in templated alkylether monolayers.
Additional work with mixtures that contain molecules having differing lengths and other
functional groups may allow monolayer templates to serve as a practical tool for
controlling the structure of physisorbed monolayers.
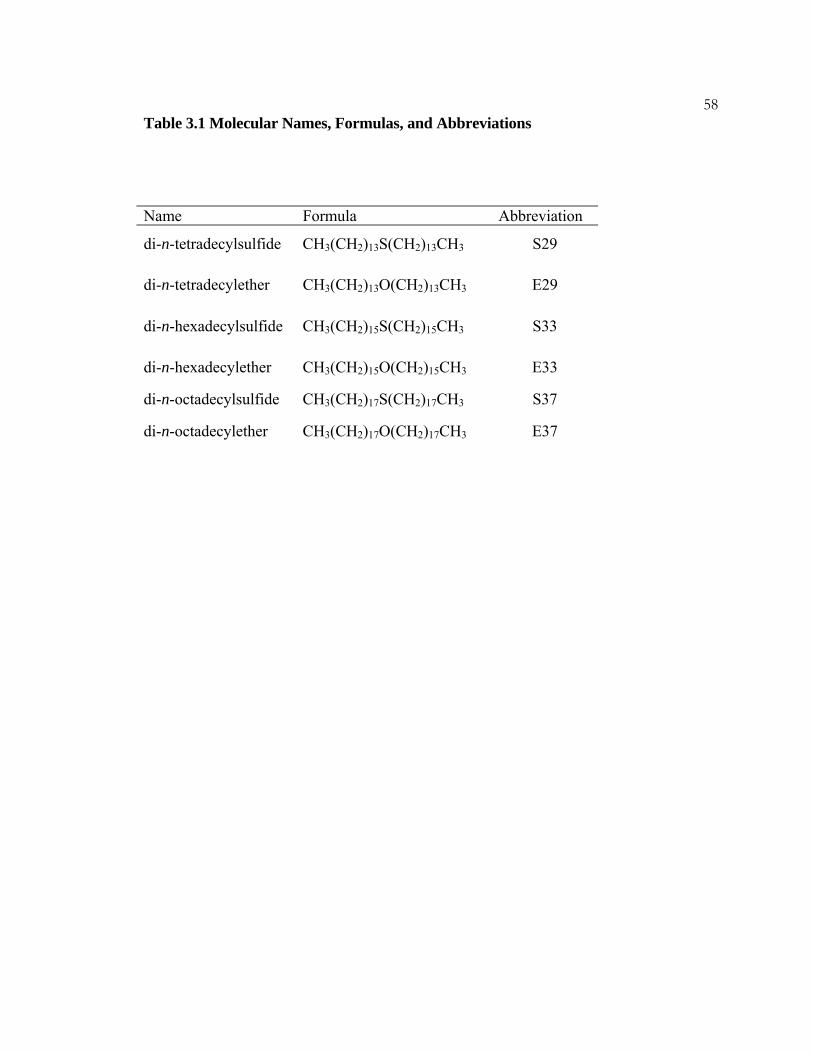
58Table 3.1 Molecular Names, Formulas, and Abbreviations
Name Formula Abbreviation
di-n-tetradecylsulfide CH3(CH2)13S(CH2)13CH3 S29
di-n-tetradecylether CH3(CH2)13O(CH2)13CH3 E29
di-n-hexadecylsulfide CH3(CH2)15S(CH2)15CH3 S33
di-n-hexadecylether CH3(CH2)15O(CH2)15CH3 E33
di-n-octadecylsulfide CH3(CH2)17S(CH2)17CH3 S37
di-n-octadecylether CH3(CH2)17O(CH2)17CH3 E37

59Figure 3.1 STM Image and Model of a Monolayer of Hexadecylether
(a) A constant-current mode STM image of di-n-hexadecylether, CH3(CH2)15O(CH2)15CH3,
on HOPG. The imaging conditions were I = 250 pA, Vbias = 1200 mV, and a scan rate of
30.5 Hz.
(b) A model of di-n-hexadecylether molecules on HOPG. The molecular axis is shown
with a dashed arrow, and the lamellar axis is shown with a solid arrow. The angle between
the two axes is 65°.
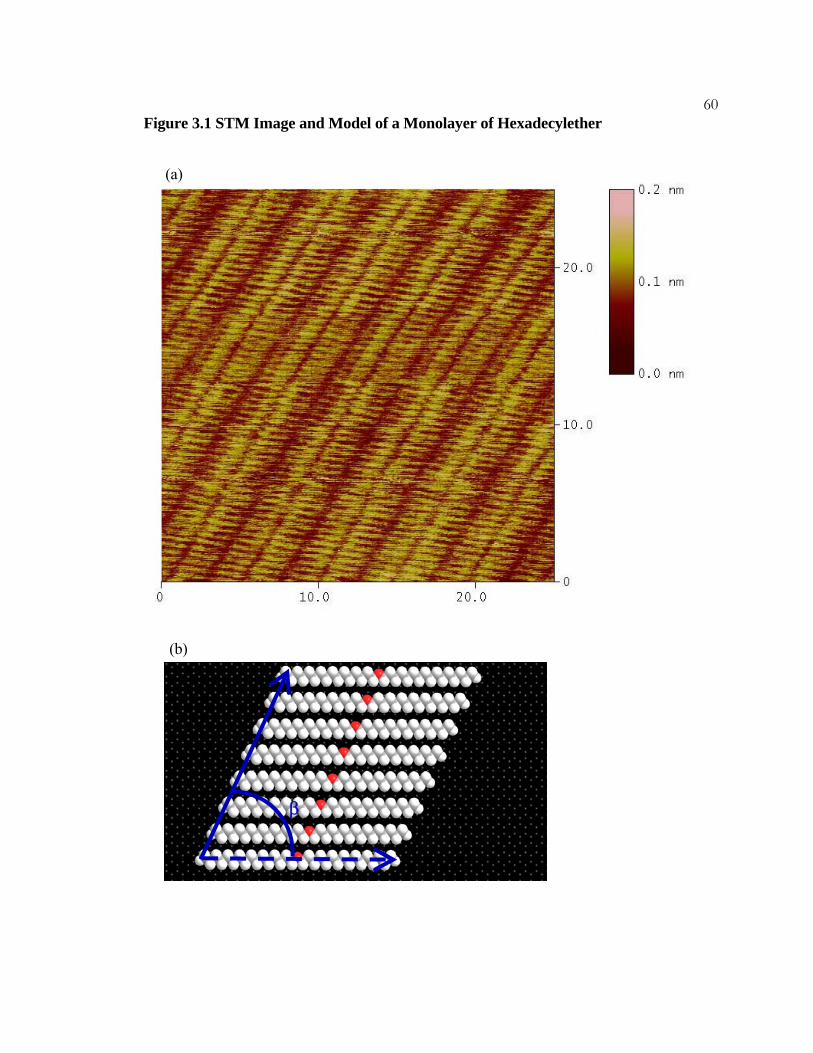
60Figure 3.1 STM Image and Model of a Monolayer of Hexadecylether
(a)
(b)
β

61Figure 3.2 STM Image and Model of a Monolayer of Hexadecylsulfide
(a) A constant height mode STM image of di-n-hexadecylsulfide,
CH3(CH2)15S(CH2)15CH3, on HOPG. The imaging conditions were I = 200 pA, Vbias =
1200 mV, and scan rate = 30.5 Hz.
(b) A model of di-n-hexadecylsulfide molecules on HOPG. The molecular axis is
perpendicular to the lamellar axis.
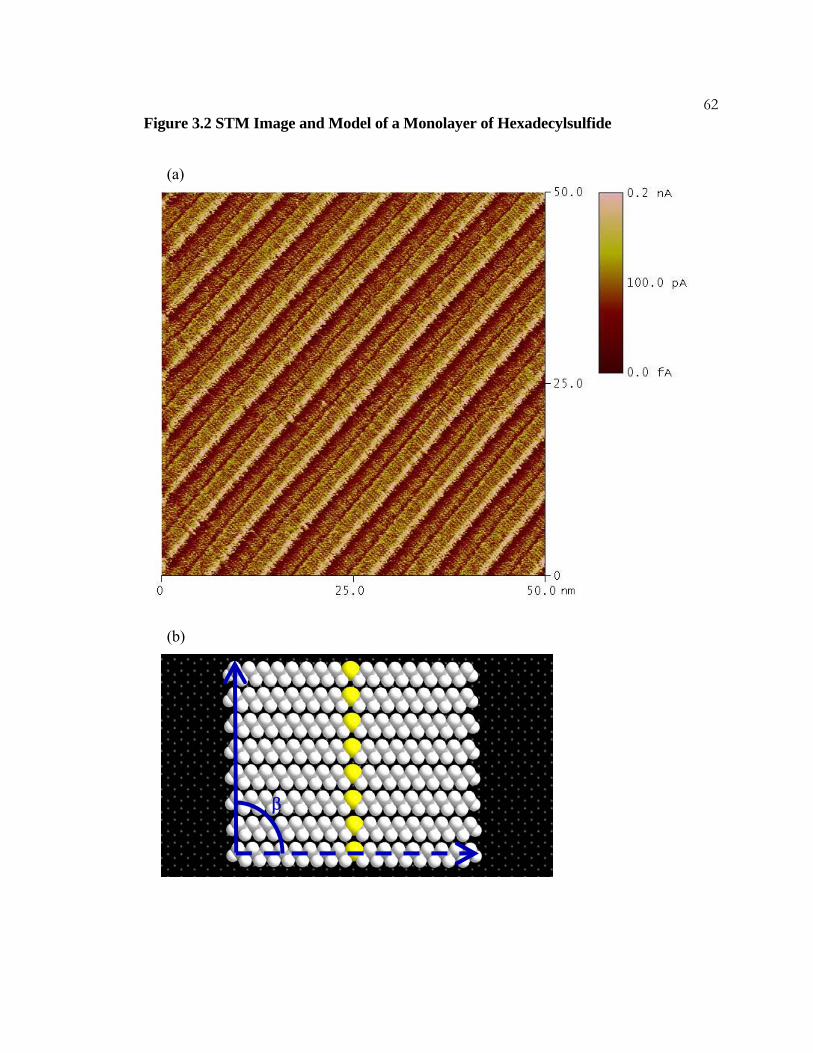
62Figure 3.2 STM Image and Model of a Monolayer of Hexadecylsulfide
(a)
(b)
β
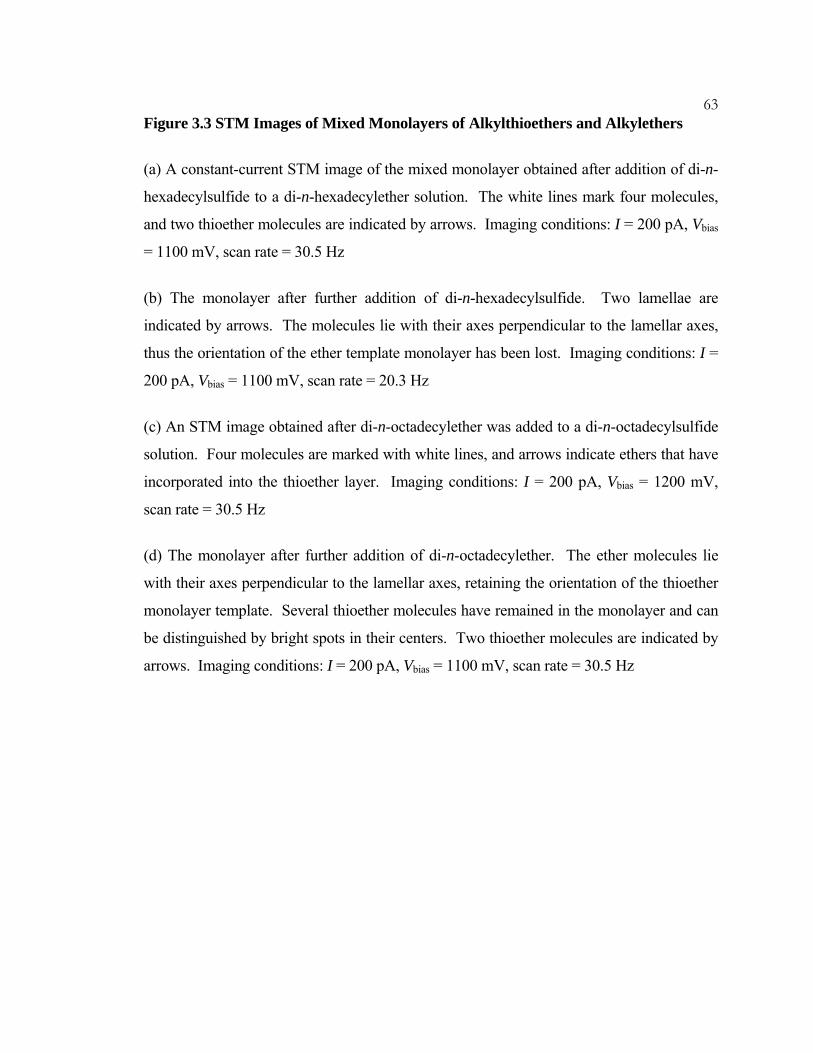
63Figure 3.3 STM Images of Mixed Monolayers of Alkylthioethers and Alkylethers
(a) A constant-current STM image of the mixed monolayer obtained after addition of di-n-
hexadecylsulfide to a di-n-hexadecylether solution. The white lines mark four molecules,
and two thioether molecules are indicated by arrows. Imaging conditions: I = 200 pA, Vbias
= 1100 mV, scan rate = 30.5 Hz
(b) The monolayer after further addition of di-n-hexadecylsulfide. Two lamellae are
indicated by arrows. The molecules lie with their axes perpendicular to the lamellar axes,
thus the orientation of the ether template monolayer has been lost. Imaging conditions: I =
200 pA, Vbias = 1100 mV, scan rate = 20.3 Hz
(c) An STM image obtained after di-n-octadecylether was added to a di-n-octadecylsulfide
solution. Four molecules are marked with white lines, and arrows indicate ethers that have
incorporated into the thioether layer. Imaging conditions: I = 200 pA, Vbias = 1200 mV,
scan rate = 30.5 Hz
(d) The monolayer after further addition of di-n-octadecylether. The ether molecules lie
with their axes perpendicular to the lamellar axes, retaining the orientation of the thioether
monolayer template. Several thioether molecules have remained in the monolayer and can
be distinguished by bright spots in their centers. Two thioether molecules are indicated by
arrows. Imaging conditions: I = 200 pA, Vbias = 1100 mV, scan rate = 30.5 Hz
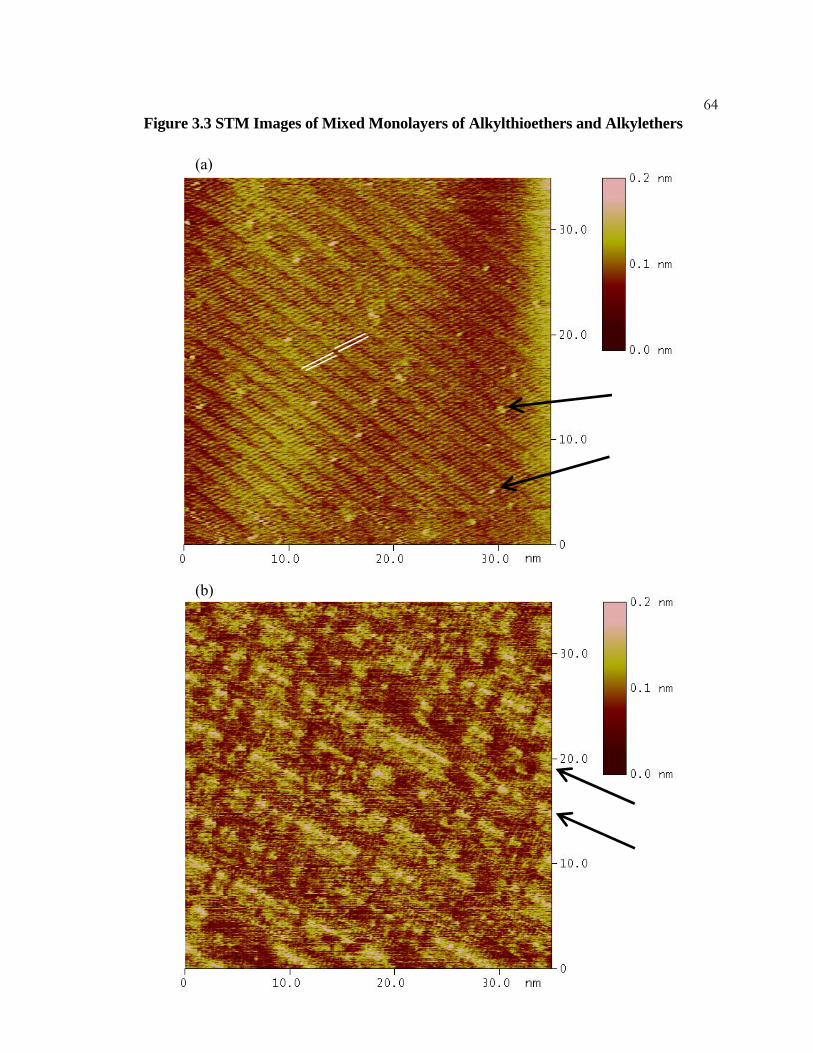
64
(a)
(b)
Figure 3.3 STM Images of Mixed Monolayers of Alkylthioethers and Alkylethers
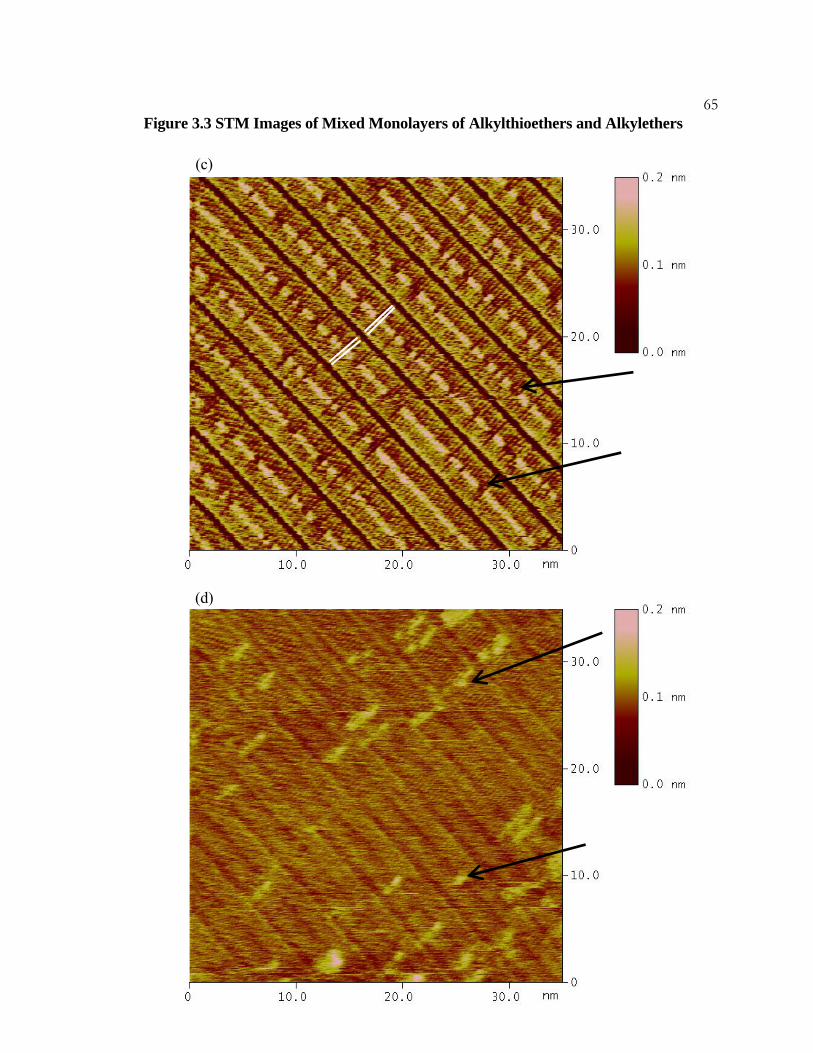
65
(c)
(d)
Figure 3.3 STM Images of Mixed Monolayers of Alkylthioethers and Alkylethers

66Figure 3.4 Mixed Monolayer Analysis Software
(a) An STM image of a mixed monolayer of di-n-octadecylsulfide and di-n-octadecylether.
The imaging conditions were I = 200 pA, Vbias = 1200 mV, and scan rate = 30.5 Hz.
(b) A grid has been superimposed upon the image by the analysis software, and the center
of each ether molecule has been marked with a black dot. The largest cluster of ethers in
the image contains six molecules.
(c) A comparison of the average observed distribution of ethers within mixed monolayers
under identical conditions as panel (a) with the average values obtained for a random
distribution of molecules. The solid bars represent the observed values and the cross-
hatched bars represent the values for a calculated random distribution of molecules.

67
0
0.2
0.4
0.6
0.8
1 2 3 4 5 6 7 8
Molecules in Cluster
Frac
tion
of C
ount
ed M
olec
ules
(c)
(a)
(b)
Figure 3.4 Mixed Monolayer Analysis Software
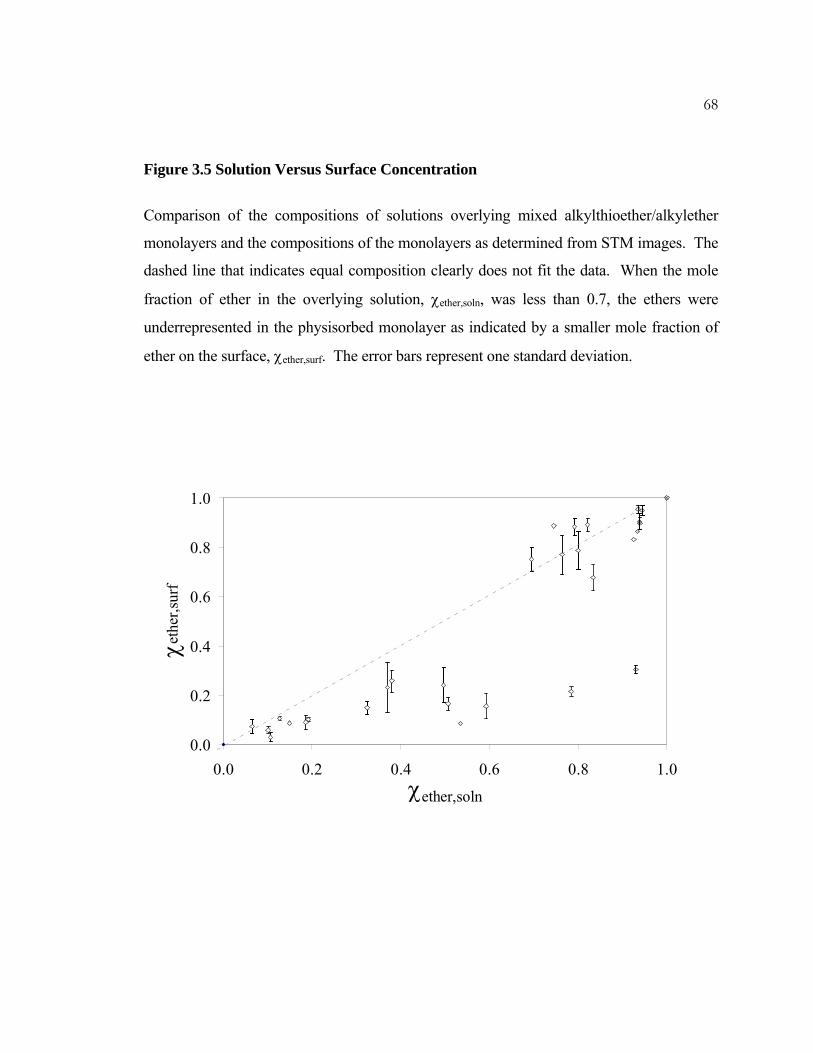
68
Figure 3.5 Solution Versus Surface Concentration
Comparison of the compositions of solutions overlying mixed alkylthioether/alkylether
monolayers and the compositions of the monolayers as determined from STM images. The
dashed line that indicates equal composition clearly does not fit the data. When the mole
fraction of ether in the overlying solution, χether,soln, was less than 0.7, the ethers were
underrepresented in the physisorbed monolayer as indicated by a smaller mole fraction of
ether on the surface, χether,surf. The error bars represent one standard deviation.
0.0
0.2
0.4
0.6
0.8
1.0
0.0 0.2 0.4 0.6 0.8 1.0χether,soln
χeth
er,su
rf

693.7 References
(1) Groszek, A. J. Nature 1964, 204, 680.
(2) McGonigal, G. C.; Bernhardt, R. H.; Thomson, D. J. Appl. Phys. Lett. 1990, 57, 28–
30.
(3) Venkataraman, B.; Flynn, G. W.; Wilbur, J. L.; Folkers, J. P.; Whitesides, G. M. J.
Phys. Chem. 1995, 99, 8684–8689.
(4) Rabe, J. P.; Buchholz, S. Science 1991, 253, 424–427.
(5) McGonigal, G. C.; Bernhardt, R. H.; Yeo, Y. H.; Thomson, D. J. J. Vac. Sci.
Technol., B 1991, 9, 1107–1110.
(6) Freund, J. E.; Edelwirth, M.; Krobel, P.; Heckl, W. M. Phys.l Rev. B 1997, 55, 5394–
5397.
(7) Gorman, C. B.; Touzov, I.; Miller, R. Langmuir 1998, 14, 3052–3061.
(8) Yin, S. X.; Wang, C.; Xu, Q. M.; Lei, S. B.; Wan, L. J.; Bai, C. L. Chem. Phys. Lett.
2001, 348, 321–328.
(9) Yablon, D. G.; Giancarlo, L. C.; Flynn, G. W. J. Phys. Chem. B 2000, 104, 7627–
7635.
(10) Xie, Z. X.; Xu, X.; Mao, B. W.; Tanaka, K. Langmuir 2002, 18, 3113–3116.
70(11) De Feyter, S.; Larsson, M.; Schuurmans, N.; Verkuijl, B.; Zoriniants, G.;
Gesquiere, A.; Abdel-Mottaleb, M. M.; van Esch, J.; Feringa, B. L.; van Stam, J.; De
Schryver, F. Chem.—Eur. J. 2003, 9, 1198–1206.
(12) Nanjo, H.; Qian, P.; Yokoyama, T.; Suzuki, T. M. Jpn. J. Appl. Phys., Part 1 2003,
42, 6560–6563.
(13) Wei, Y. H.; Kannappan, K.; Flynn, G. W.; Zimmt, M. B. J. Am. Chem. Soc. 2004,
126, 5318–5322.
(14) Plass, K. E.; Kim, K.; Matzger, A. J. J. Am. Chem. Soc. 2004, 126, 9042–9053.
(15) Tao, F.; Goswami, J.; Bernasek, S. L. J. Phys. Chem. B 2006, 110, 19562–19569.
(16) Papadantonakis, K. M.; Brunschwig, B. S.; Lewis, N. S. Langmuir 2008, 24, 857–
861.
(17) Claypool, C. L.; Faglioni, F.; Goddard III, W. A.; Gray, H. B.; Lewis, N. S.; Marcus,
R. A. J. Phys. Chem. B 1997, 101, 5978–5995.
(18) Nishino, T.; Buhlmann, P.; Ito, T.; Umezawa, Y. Phys. Chem. Chem. Phys. 2001, 3,
1867–1869.
(19) Padowitz, D. F.; Sada, D. M.; Kemer, E. L.; Dougan, M. L.; Xue, W. A. J. Phys.
Chem. B 2002, 106, 593–598.
(20) Fukumura, H.; L-i, D.; Uji-i, H.; Nishio, S.; Sakai, H.; Ohuchi, A. ChemPhysChem
2005, 6, (11), 2383–2388.
71(21) Padowitz, D. F.; Messmore, B. W. J. Phys. Chem. B 2000, 104, 9943–9946.
(22) Groszek, A. J. Nature 1962, 196, 531–533.
(23) Kern, H. E.; Piechocki, A.; Brauer, U.; Findenegg, G.H. Prog. Colloid Poly. Sci.
1978, 65, 118–124.
(24) Claypool, C. L.; Faglioni, F.; Matzger, A. J.; Goddard III, W. A.; Lewis, N. S. J.
Phys. Chem. B 1999, 103, 9690–9699.
(25) Paserba, K. R.; Gellman, A. J. J. Chem. Phys. 2001, 115, 6737–6751.
72C h a p t e r 4
TOWARDS SURFACE PATTERNING USING PHYSISORBED MONOLAYERS AS MASKS
4.1 Overview
Many small organic molecules in solution spontaneously form highly ordered physisorbed
monolayers on surfaces. The monolayers are readily observable under ambient laboratory
conditions and are highly structured with feature sizes on the scale of a small molecule. A
single monolayer domain can cover a relatively large surface area, and the structure of the
monolayer can leave areas of the underlying surface exposed. Thus a physisorbed
monolayer may be useful as a mask in an inexpensive surface patterning technique that
would be capable of producing feature sizes on the order of a few nanometers. In order to
accomplish such patterning, a physisorbed monolayer that incorporates pores in its
structure would be used to mask a surface while an additional species that reacts chemically
with the exposed areas of the surface is added to the overlying solution. The surface could
then be cleaned, removing the physisorbed masking monolayer, and exposed again to other
surface-reactive species. This procedure would leave a chemical pattern with single
nanometer-scale features on the surface. Gold is a promising substrate for such patterning
because, although it is relatively inert and thus will not corrode or degrade under ambient
laboratory conditions, it is known to react with and bond to alkylthiols. This chapter
describes an approach to patterning gold surfaces using physisorbed monolayer masks and
thiol chemistry. Gold surface preparation methods are described and molecular candidates
for mask formation are discussed. Significant challenges to obtaining stable masking
monolayers on gold surfaces were met and are discussed in detail. Electrochemical
techniques offer a promising approach to meeting these challenges.
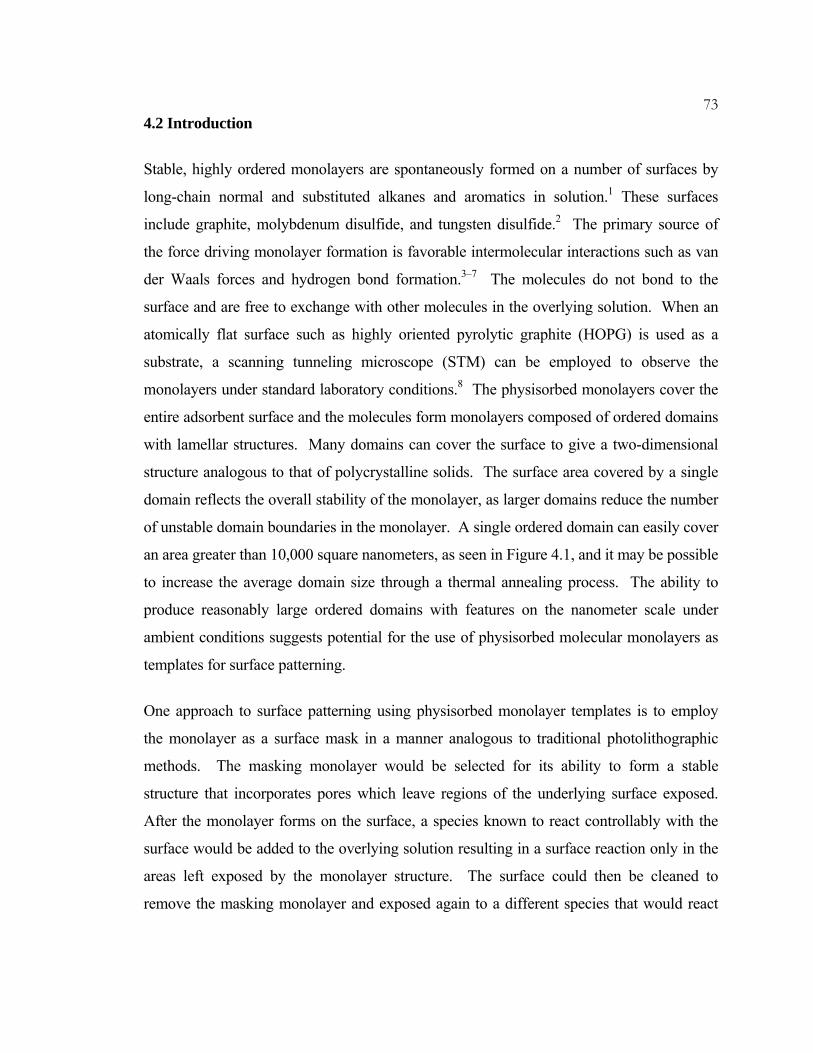
734.2 Introduction
Stable, highly ordered monolayers are spontaneously formed on a number of surfaces by
long-chain normal and substituted alkanes and aromatics in solution.1 These surfaces
include graphite, molybdenum disulfide, and tungsten disulfide.2 The primary source of
the force driving monolayer formation is favorable intermolecular interactions such as van
der Waals forces and hydrogen bond formation.3–7 The molecules do not bond to the
surface and are free to exchange with other molecules in the overlying solution. When an
atomically flat surface such as highly oriented pyrolytic graphite (HOPG) is used as a
substrate, a scanning tunneling microscope (STM) can be employed to observe the
monolayers under standard laboratory conditions.8 The physisorbed monolayers cover the
entire adsorbent surface and the molecules form monolayers composed of ordered domains
with lamellar structures. Many domains can cover the surface to give a two-dimensional
structure analogous to that of polycrystalline solids. The surface area covered by a single
domain reflects the overall stability of the monolayer, as larger domains reduce the number
of unstable domain boundaries in the monolayer. A single ordered domain can easily cover
an area greater than 10,000 square nanometers, as seen in Figure 4.1, and it may be possible
to increase the average domain size through a thermal annealing process. The ability to
produce reasonably large ordered domains with features on the nanometer scale under
ambient conditions suggests potential for the use of physisorbed molecular monolayers as
templates for surface patterning.
One approach to surface patterning using physisorbed monolayer templates is to employ
the monolayer as a surface mask in a manner analogous to traditional photolithographic
methods. The masking monolayer would be selected for its ability to form a stable
structure that incorporates pores which leave regions of the underlying surface exposed.
After the monolayer forms on the surface, a species known to react controllably with the
surface would be added to the overlying solution resulting in a surface reaction only in the
areas left exposed by the monolayer structure. The surface could then be cleaned to
remove the masking monolayer and exposed again to a different species that would react
74only at the newly uncovered regions of the surface. This sequence would produce a
chemically patterned surface with features on the single nanometer scale. Such a surface
could be useful for catalysis applications and as a way to tether nanoparticles to a surface in
an ordered array, which would allow studies of the electrochemical properties of single
nanoparticles.
HOPG is by far the most widely used substrate in studies of self-assembled physisorbed
monolayers. This is because HOPG is conductive, is inert under standard laboratory
conditions and has a layered structure that allows the easy preparation of an atomically flat
surface. The inert nature of HOPG, however, is extremely problematic if one wishes to
pattern the surface regions left exposed by a physisorbed monolayer. Thus, in order to
pursue this approach to surface patterning, it is necessary to employ a surface that is more
amenable to chemical modification. Gold has also been used successfully as a substrate in
STM studies and is a promising candidate for a substrate surface for this approach to
surface patterning. The gold surface does not significantly corrode or degrade under
laboratory conditions and physisorbed monolayer structures similar to those formed on
HOPG have been observed on the reconstructed Au(111) surface.9 Although the gold
surface is relatively inert under standard laboratory conditions, it is known to react with
alkyl sulfides, disulfides, and other soft nucleophiles.10 Gold may therefore prove to be a
useful substrate for a demonstration of surface patterning using physisorbed monolayers as
masks.
A number of methods have been used to prepare atomically flat gold surfaces. The
simplest procedure involves the deposition of gold onto a flat surface such as mica, silicon,
or glass. The surface is then flame annealed. The gold can be deposited by either
evaporation or sputtering. Gold surfaces with terraces averaging 6300 Å in width have
been prepared using this method and the surfaces that resulted were exclusively Au (111).11
A number of researchers have successfully prepared gold surfaces using similar
methods.12–14 Gold-coated mica substrates are commercially available and have been used
successfully in an STM study of liquid crystals.15 Molecular Imaging, Inc., is one such
75supplier and recommends annealing the surface in a hydrogen flame prior to use. Other
commonly used methods of gold surface preparation for STM are adaptations of the
method for the preparation of monocrystalline platinum electrodes that was detailed by
Clavilier et al.16 These methods involve the use of a single-crystalline gold bead that is
purchased or obtained by melting a pure gold wire using a hydrogen-oxygen flame. The
resulting bead is etched using either aqua regia or piranha solution, cut along the desired
direction, and annealed with a hydrogen flame. 17–19
Although HOPG is by far the most commonly used substrate for STM studies of
physisorbed monolayers, a number of researchers have published STM images of
monolayers on the reconstructed Au(111) surface. Monolayers formed at the interface of
gold and the neat normal alkanes with carbon chain lengths from 12 through 17 have been
imaged using an STM.9,17 STM images of a monolayer of hexatriacontane, C36H74,
adsorbed onto gold from a dodecane solution have also been published.20 STM images of
physisorbed monolayers at the interface between gold and other liquids have been
published more recently. These liquids include the following: normal alkanes with even
carbon chain lengths between 28 and 50 dissolved in tetradecane;21 selected normal alkanes
with carbon chain lengths of 14–38 either neat or dissolved in tetradecane;22 and selected
primary alcohols with chain lengths from 10–30 either neat or dissolved in tetradecane.23
The monolayers observed on gold surfaces are similar to those formed on HOPG in that the
molecules are arranged in lamellate domains on the surface, and in many cases a single
ordered monolayer domain covers an entire Au(111) terrace.9 STM studies involving the
potential-dependent physisorption of molecules onto gold surfaces from aqueous solutions
have also been published. He et al.18 observed potential-dependent adsorption of a
monolayer of hexadecane from a 0.1 M HClO4 solution. These monolayers formed after
the reconstruction of the gold surface was lifted by a potential step and were only stable in
the potential range of 0.15–0.55 VSCE. Researchers have also observed ordered monolayers
of 1,3,5-benzenetricarboxylic acid, or trimesic acid (TMA), on gold surfaces in 0.1 M
HClO4.24,25 Xu et al.19 obtained STM images of a monolayer of a phospholipid on gold.
76This work was also performed using an overlying HClO4 solution and the structure of the
monolayer was observed to change throughout the course of the experiment.
Images of physisorbed monolayers on HOPG surfaces which incorporate openings into
their structure have already been published.26,27 Some of the molecules which have been
shown to incorporate spaces into their monolayer structures include liquid crystals and
some derivatives of 1,3-disubstituted benzene, dehydrobenzo[12]annulene, and 1,3,5-
trisubstituted benzene. Porous monolayers have also been observed to form on Au(111)
and Ag(111) surfaces.15,28,29
It has been well established that the simple exposure of a gold surface to a solution of alkyl
thiols in ethanol results in the attachment of a single molecular layer of the thiols to the
gold surface.10 The thiols act as soft nucleophiles and attach to the gold surface as metal
thiolates (RS-M+).30 The properties of the resulting surface can be tuned by altering the
functional group on the tail of the thiol molecule.31 The gold–thiol chemistry has also been
demonstrated using solutions of thiols and disulfides in acetonitrile, isooctane, and
hexadecane.30
The energy associated with the chemisorption of a thiolate on gold is on the order of tens of
kcal mol-1.32 The energy associated with the physisorption of alkanes on gold is currently
unknown; the values that have been reported for adsorption of alkanes on graphite are
similar to those for the chemisorption of thiolates on gold.2 However, it is possible that the
heat of adsorption for alkanes on gold may be much less (~ 10–20 kcal mol-1) than the
value for adsorption on graphite. Thus, it may be necessary to arrest the chemisorption of
thiolate onto the gold surface and to select for combinations of strongly physisorbed
alkanes and weakly chemisorbed thiols. Both of the adsorption mechanisms derive a
measure of stability from van der Waals interactions between adjacent alkane chains, and
the strength of this interaction increases with the length of the alkane chain.10,33 Thus it
may be possible to decrease or slow the chemisorption of the thiolate by selecting thiols
with relatively short or branched alkyl chains. Additional approaches to controlling the
adsorption of the thiol may involve the removal of the thiol from the overlying solution
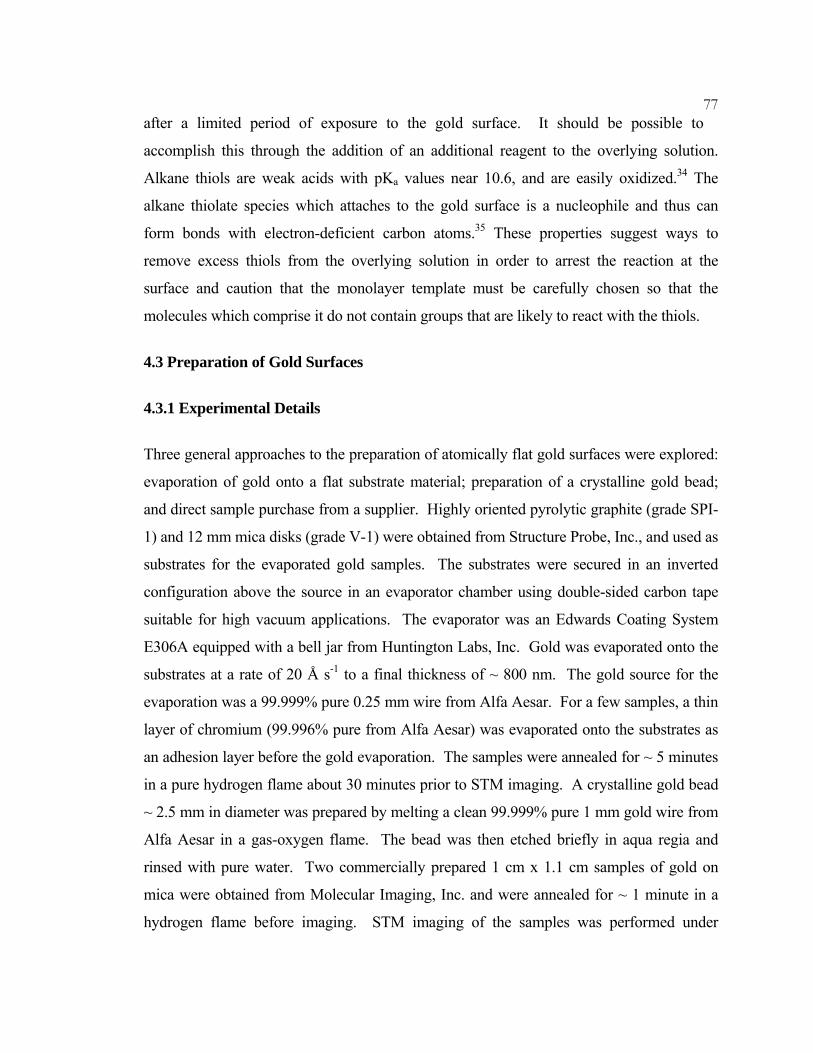
77after a limited period of exposure to the gold surface. It should be possible to
accomplish this through the addition of an additional reagent to the overlying solution.
Alkane thiols are weak acids with pKa values near 10.6, and are easily oxidized.34 The
alkane thiolate species which attaches to the gold surface is a nucleophile and thus can
form bonds with electron-deficient carbon atoms.35 These properties suggest ways to
remove excess thiols from the overlying solution in order to arrest the reaction at the
surface and caution that the monolayer template must be carefully chosen so that the
molecules which comprise it do not contain groups that are likely to react with the thiols.
4.3 Preparation of Gold Surfaces
4.3.1 Experimental Details
Three general approaches to the preparation of atomically flat gold surfaces were explored:
evaporation of gold onto a flat substrate material; preparation of a crystalline gold bead;
and direct sample purchase from a supplier. Highly oriented pyrolytic graphite (grade SPI-
1) and 12 mm mica disks (grade V-1) were obtained from Structure Probe, Inc., and used as
substrates for the evaporated gold samples. The substrates were secured in an inverted
configuration above the source in an evaporator chamber using double-sided carbon tape
suitable for high vacuum applications. The evaporator was an Edwards Coating System
E306A equipped with a bell jar from Huntington Labs, Inc. Gold was evaporated onto the
substrates at a rate of 20 Å s-1 to a final thickness of ~ 800 nm. The gold source for the
evaporation was a 99.999% pure 0.25 mm wire from Alfa Aesar. For a few samples, a thin
layer of chromium (99.996% pure from Alfa Aesar) was evaporated onto the substrates as
an adhesion layer before the gold evaporation. The samples were annealed for ~ 5 minutes
in a pure hydrogen flame about 30 minutes prior to STM imaging. A crystalline gold bead
~ 2.5 mm in diameter was prepared by melting a clean 99.999% pure 1 mm gold wire from
Alfa Aesar in a gas-oxygen flame. The bead was then etched briefly in aqua regia and
rinsed with pure water. Two commercially prepared 1 cm x 1.1 cm samples of gold on
mica were obtained from Molecular Imaging, Inc. and were annealed for ~ 1 minute in a
hydrogen flame before imaging. STM imaging of the samples was performed under
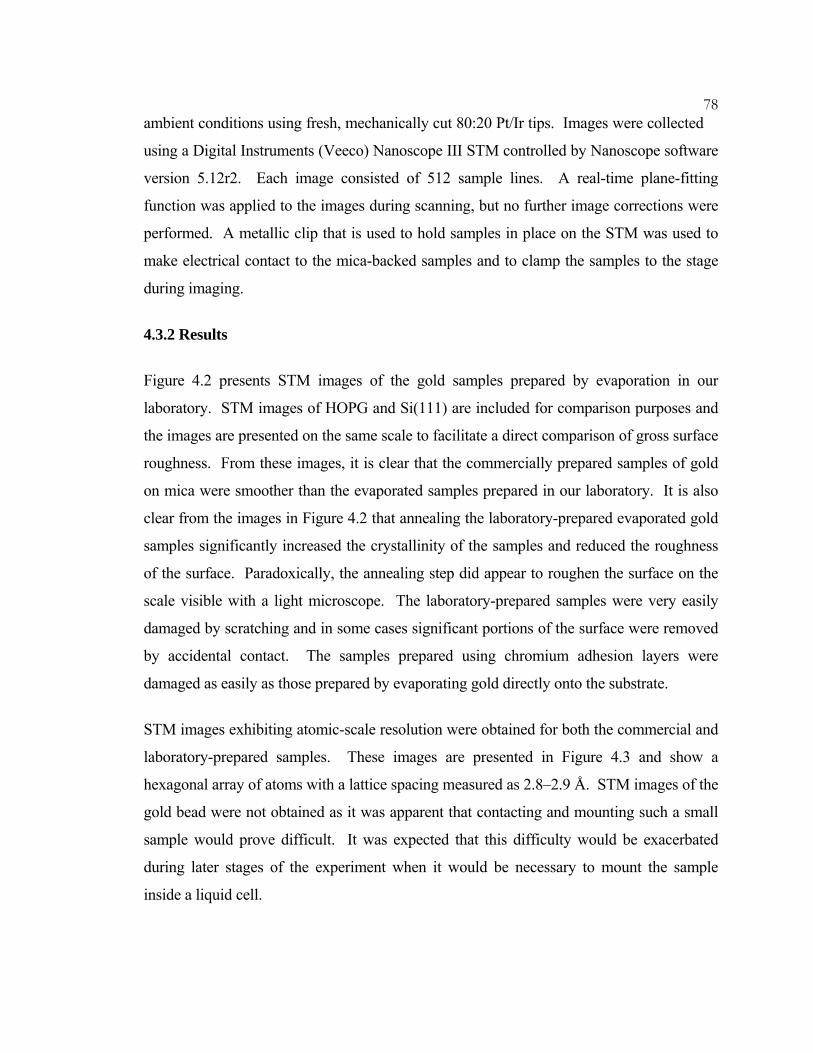
78ambient conditions using fresh, mechanically cut 80:20 Pt/Ir tips. Images were collected
using a Digital Instruments (Veeco) Nanoscope III STM controlled by Nanoscope software
version 5.12r2. Each image consisted of 512 sample lines. A real-time plane-fitting
function was applied to the images during scanning, but no further image corrections were
performed. A metallic clip that is used to hold samples in place on the STM was used to
make electrical contact to the mica-backed samples and to clamp the samples to the stage
during imaging.
4.3.2 Results
Figure 4.2 presents STM images of the gold samples prepared by evaporation in our
laboratory. STM images of HOPG and Si(111) are included for comparison purposes and
the images are presented on the same scale to facilitate a direct comparison of gross surface
roughness. From these images, it is clear that the commercially prepared samples of gold
on mica were smoother than the evaporated samples prepared in our laboratory. It is also
clear from the images in Figure 4.2 that annealing the laboratory-prepared evaporated gold
samples significantly increased the crystallinity of the samples and reduced the roughness
of the surface. Paradoxically, the annealing step did appear to roughen the surface on the
scale visible with a light microscope. The laboratory-prepared samples were very easily
damaged by scratching and in some cases significant portions of the surface were removed
by accidental contact. The samples prepared using chromium adhesion layers were
damaged as easily as those prepared by evaporating gold directly onto the substrate.
STM images exhibiting atomic-scale resolution were obtained for both the commercial and
laboratory-prepared samples. These images are presented in Figure 4.3 and show a
hexagonal array of atoms with a lattice spacing measured as 2.8–2.9 Å. STM images of the
gold bead were not obtained as it was apparent that contacting and mounting such a small
sample would prove difficult. It was expected that this difficulty would be exacerbated
during later stages of the experiment when it would be necessary to mount the sample
inside a liquid cell.
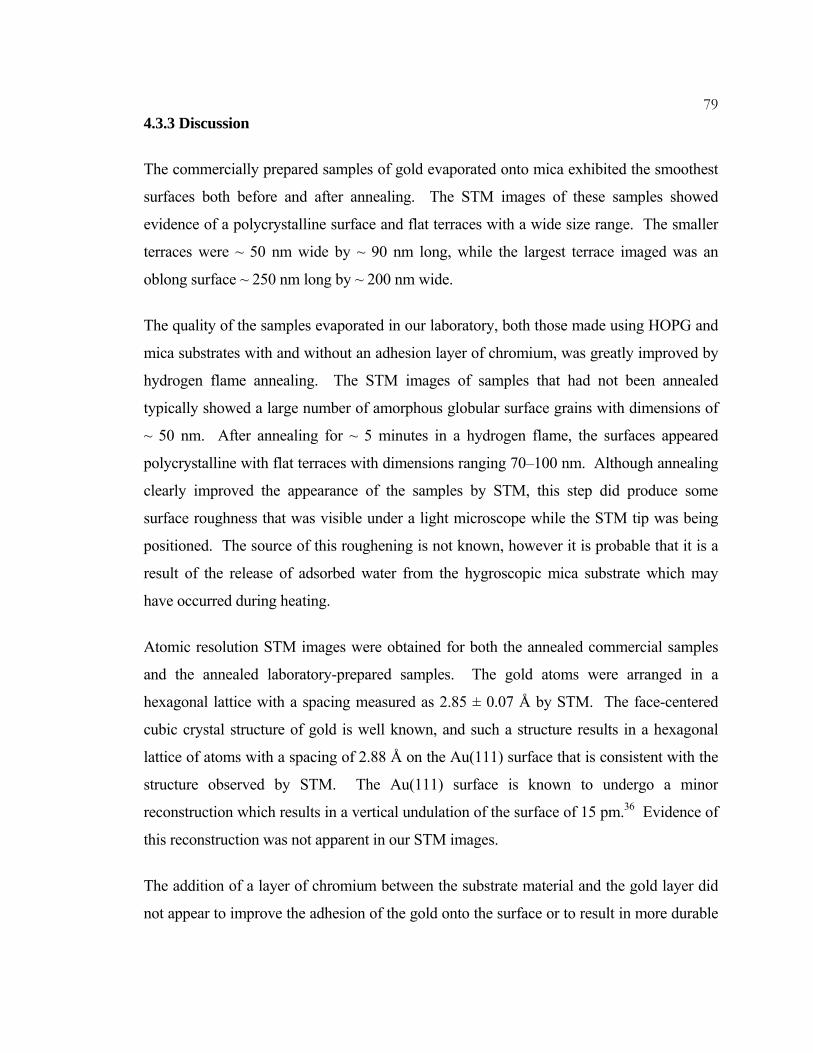
794.3.3 Discussion
The commercially prepared samples of gold evaporated onto mica exhibited the smoothest
surfaces both before and after annealing. The STM images of these samples showed
evidence of a polycrystalline surface and flat terraces with a wide size range. The smaller
terraces were ~ 50 nm wide by ~ 90 nm long, while the largest terrace imaged was an
oblong surface ~ 250 nm long by ~ 200 nm wide.
The quality of the samples evaporated in our laboratory, both those made using HOPG and
mica substrates with and without an adhesion layer of chromium, was greatly improved by
hydrogen flame annealing. The STM images of samples that had not been annealed
typically showed a large number of amorphous globular surface grains with dimensions of
~ 50 nm. After annealing for ~ 5 minutes in a hydrogen flame, the surfaces appeared
polycrystalline with flat terraces with dimensions ranging 70–100 nm. Although annealing
clearly improved the appearance of the samples by STM, this step did produce some
surface roughness that was visible under a light microscope while the STM tip was being
positioned. The source of this roughening is not known, however it is probable that it is a
result of the release of adsorbed water from the hygroscopic mica substrate which may
have occurred during heating.
Atomic resolution STM images were obtained for both the annealed commercial samples
and the annealed laboratory-prepared samples. The gold atoms were arranged in a
hexagonal lattice with a spacing measured as 2.85 ± 0.07 Å by STM. The face-centered
cubic crystal structure of gold is well known, and such a structure results in a hexagonal
lattice of atoms with a spacing of 2.88 Å on the Au(111) surface that is consistent with the
structure observed by STM. The Au(111) surface is known to undergo a minor
reconstruction which results in a vertical undulation of the surface of 15 pm.36 Evidence of
this reconstruction was not apparent in our STM images.
The addition of a layer of chromium between the substrate material and the gold layer did
not appear to improve the adhesion of the gold onto the surface or to result in more durable
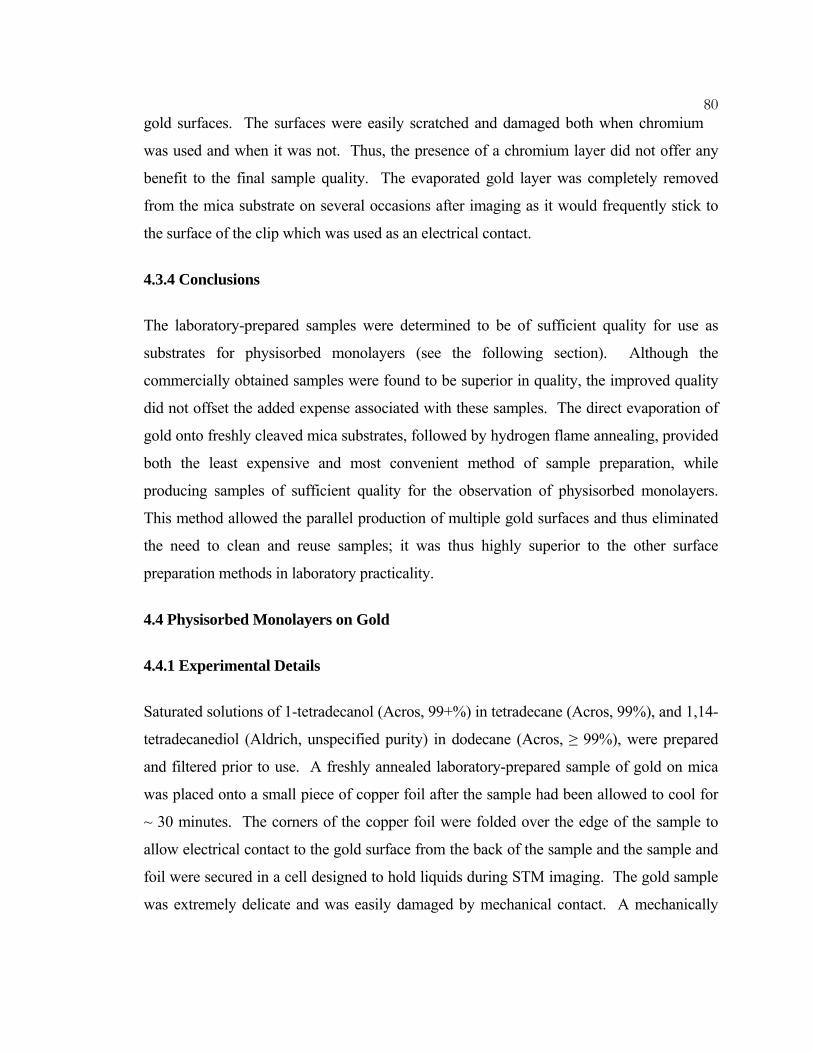
80gold surfaces. The surfaces were easily scratched and damaged both when chromium
was used and when it was not. Thus, the presence of a chromium layer did not offer any
benefit to the final sample quality. The evaporated gold layer was completely removed
from the mica substrate on several occasions after imaging as it would frequently stick to
the surface of the clip which was used as an electrical contact.
4.3.4 Conclusions
The laboratory-prepared samples were determined to be of sufficient quality for use as
substrates for physisorbed monolayers (see the following section). Although the
commercially obtained samples were found to be superior in quality, the improved quality
did not offset the added expense associated with these samples. The direct evaporation of
gold onto freshly cleaved mica substrates, followed by hydrogen flame annealing, provided
both the least expensive and most convenient method of sample preparation, while
producing samples of sufficient quality for the observation of physisorbed monolayers.
This method allowed the parallel production of multiple gold surfaces and thus eliminated
the need to clean and reuse samples; it was thus highly superior to the other surface
preparation methods in laboratory practicality.
4.4 Physisorbed Monolayers on Gold
4.4.1 Experimental Details
Saturated solutions of 1-tetradecanol (Acros, 99+%) in tetradecane (Acros, 99%), and 1,14-
tetradecanediol (Aldrich, unspecified purity) in dodecane (Acros, ≥ 99%), were prepared
and filtered prior to use. A freshly annealed laboratory-prepared sample of gold on mica
was placed onto a small piece of copper foil after the sample had been allowed to cool for
~ 30 minutes. The corners of the copper foil were folded over the edge of the sample to
allow electrical contact to the gold surface from the back of the sample and the sample and
foil were secured in a cell designed to hold liquids during STM imaging. The gold sample
was extremely delicate and was easily damaged by mechanical contact. A mechanically
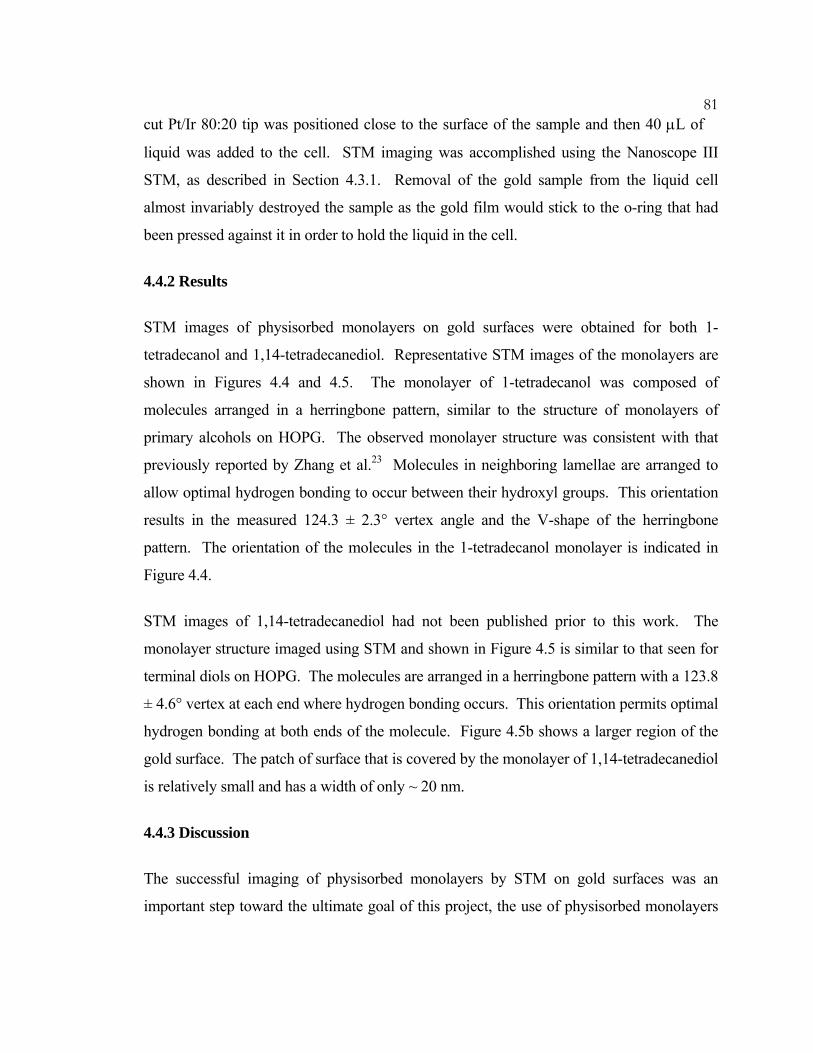
81cut Pt/Ir 80:20 tip was positioned close to the surface of the sample and then 40 μL of
liquid was added to the cell. STM imaging was accomplished using the Nanoscope III
STM, as described in Section 4.3.1. Removal of the gold sample from the liquid cell
almost invariably destroyed the sample as the gold film would stick to the o-ring that had
been pressed against it in order to hold the liquid in the cell.
4.4.2 Results
STM images of physisorbed monolayers on gold surfaces were obtained for both 1-
tetradecanol and 1,14-tetradecanediol. Representative STM images of the monolayers are
shown in Figures 4.4 and 4.5. The monolayer of 1-tetradecanol was composed of
molecules arranged in a herringbone pattern, similar to the structure of monolayers of
primary alcohols on HOPG. The observed monolayer structure was consistent with that
previously reported by Zhang et al.23 Molecules in neighboring lamellae are arranged to
allow optimal hydrogen bonding to occur between their hydroxyl groups. This orientation
results in the measured 124.3 ± 2.3° vertex angle and the V-shape of the herringbone
pattern. The orientation of the molecules in the 1-tetradecanol monolayer is indicated in
Figure 4.4.
STM images of 1,14-tetradecanediol had not been published prior to this work. The
monolayer structure imaged using STM and shown in Figure 4.5 is similar to that seen for
terminal diols on HOPG. The molecules are arranged in a herringbone pattern with a 123.8
± 4.6° vertex at each end where hydrogen bonding occurs. This orientation permits optimal
hydrogen bonding at both ends of the molecule. Figure 4.5b shows a larger region of the
gold surface. The patch of surface that is covered by the monolayer of 1,14-tetradecanediol
is relatively small and has a width of only ~ 20 nm.
4.4.3 Discussion
The successful imaging of physisorbed monolayers by STM on gold surfaces was an
important step toward the ultimate goal of this project, the use of physisorbed monolayers
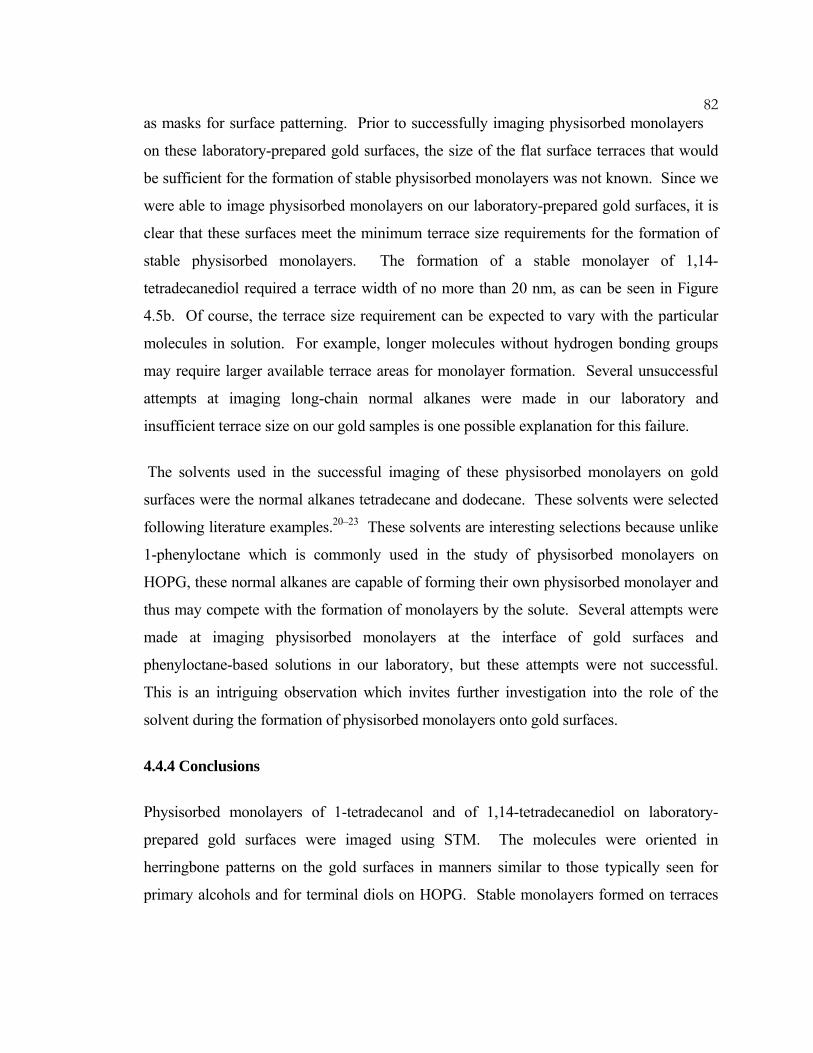
82as masks for surface patterning. Prior to successfully imaging physisorbed monolayers
on these laboratory-prepared gold surfaces, the size of the flat surface terraces that would
be sufficient for the formation of stable physisorbed monolayers was not known. Since we
were able to image physisorbed monolayers on our laboratory-prepared gold surfaces, it is
clear that these surfaces meet the minimum terrace size requirements for the formation of
stable physisorbed monolayers. The formation of a stable monolayer of 1,14-
tetradecanediol required a terrace width of no more than 20 nm, as can be seen in Figure
4.5b. Of course, the terrace size requirement can be expected to vary with the particular
molecules in solution. For example, longer molecules without hydrogen bonding groups
may require larger available terrace areas for monolayer formation. Several unsuccessful
attempts at imaging long-chain normal alkanes were made in our laboratory and
insufficient terrace size on our gold samples is one possible explanation for this failure.
The solvents used in the successful imaging of these physisorbed monolayers on gold
surfaces were the normal alkanes tetradecane and dodecane. These solvents were selected
following literature examples.20–23 These solvents are interesting selections because unlike
1-phenyloctane which is commonly used in the study of physisorbed monolayers on
HOPG, these normal alkanes are capable of forming their own physisorbed monolayer and
thus may compete with the formation of monolayers by the solute. Several attempts were
made at imaging physisorbed monolayers at the interface of gold surfaces and
phenyloctane-based solutions in our laboratory, but these attempts were not successful.
This is an intriguing observation which invites further investigation into the role of the
solvent during the formation of physisorbed monolayers onto gold surfaces.
4.4.4 Conclusions
Physisorbed monolayers of 1-tetradecanol and of 1,14-tetradecanediol on laboratory-
prepared gold surfaces were imaged using STM. The molecules were oriented in
herringbone patterns on the gold surfaces in manners similar to those typically seen for
primary alcohols and for terminal diols on HOPG. Stable monolayers formed on terraces
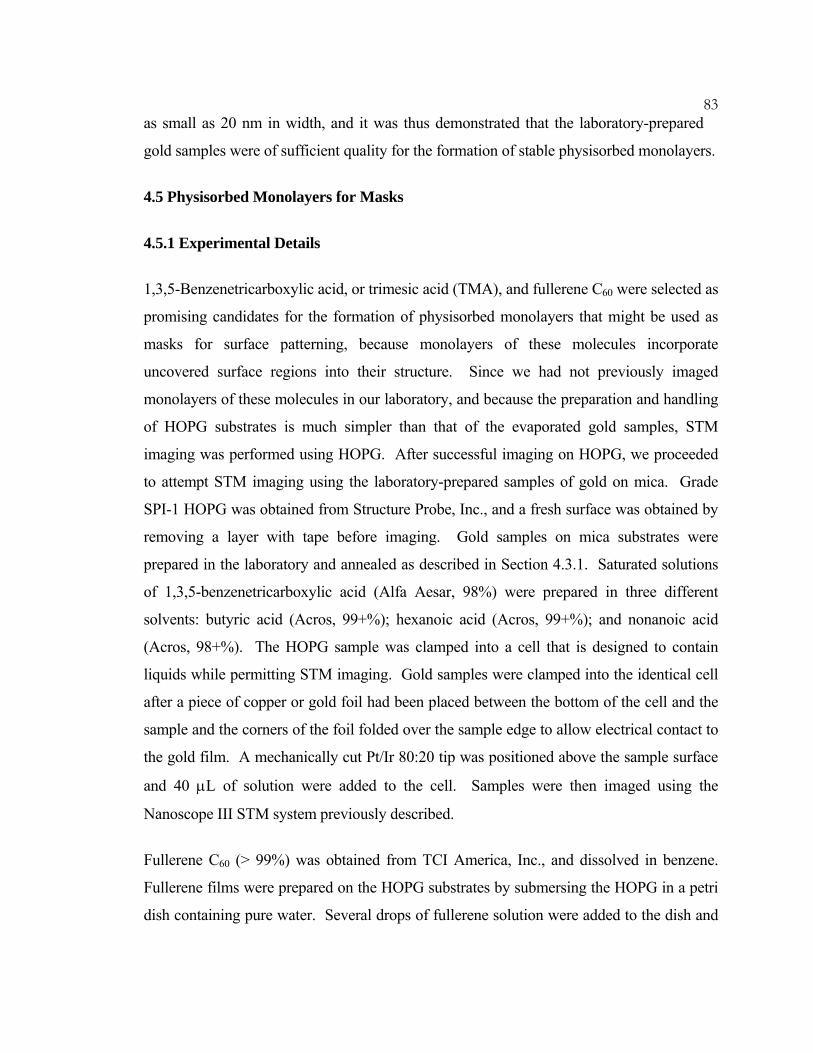
83as small as 20 nm in width, and it was thus demonstrated that the laboratory-prepared
gold samples were of sufficient quality for the formation of stable physisorbed monolayers.
4.5 Physisorbed Monolayers for Masks
4.5.1 Experimental Details
1,3,5-Benzenetricarboxylic acid, or trimesic acid (TMA), and fullerene C60 were selected as
promising candidates for the formation of physisorbed monolayers that might be used as
masks for surface patterning, because monolayers of these molecules incorporate
uncovered surface regions into their structure. Since we had not previously imaged
monolayers of these molecules in our laboratory, and because the preparation and handling
of HOPG substrates is much simpler than that of the evaporated gold samples, STM
imaging was performed using HOPG. After successful imaging on HOPG, we proceeded
to attempt STM imaging using the laboratory-prepared samples of gold on mica. Grade
SPI-1 HOPG was obtained from Structure Probe, Inc., and a fresh surface was obtained by
removing a layer with tape before imaging. Gold samples on mica substrates were
prepared in the laboratory and annealed as described in Section 4.3.1. Saturated solutions
of 1,3,5-benzenetricarboxylic acid (Alfa Aesar, 98%) were prepared in three different
solvents: butyric acid (Acros, 99+%); hexanoic acid (Acros, 99+%); and nonanoic acid
(Acros, 98+%). The HOPG sample was clamped into a cell that is designed to contain
liquids while permitting STM imaging. Gold samples were clamped into the identical cell
after a piece of copper or gold foil had been placed between the bottom of the cell and the
sample and the corners of the foil folded over the sample edge to allow electrical contact to
the gold film. A mechanically cut Pt/Ir 80:20 tip was positioned above the sample surface
and 40 μL of solution were added to the cell. Samples were then imaged using the
Nanoscope III STM system previously described.
Fullerene C60 (> 99%) was obtained from TCI America, Inc., and dissolved in benzene.
Fullerene films were prepared on the HOPG substrates by submersing the HOPG in a petri
dish containing pure water. Several drops of fullerene solution were added to the dish and
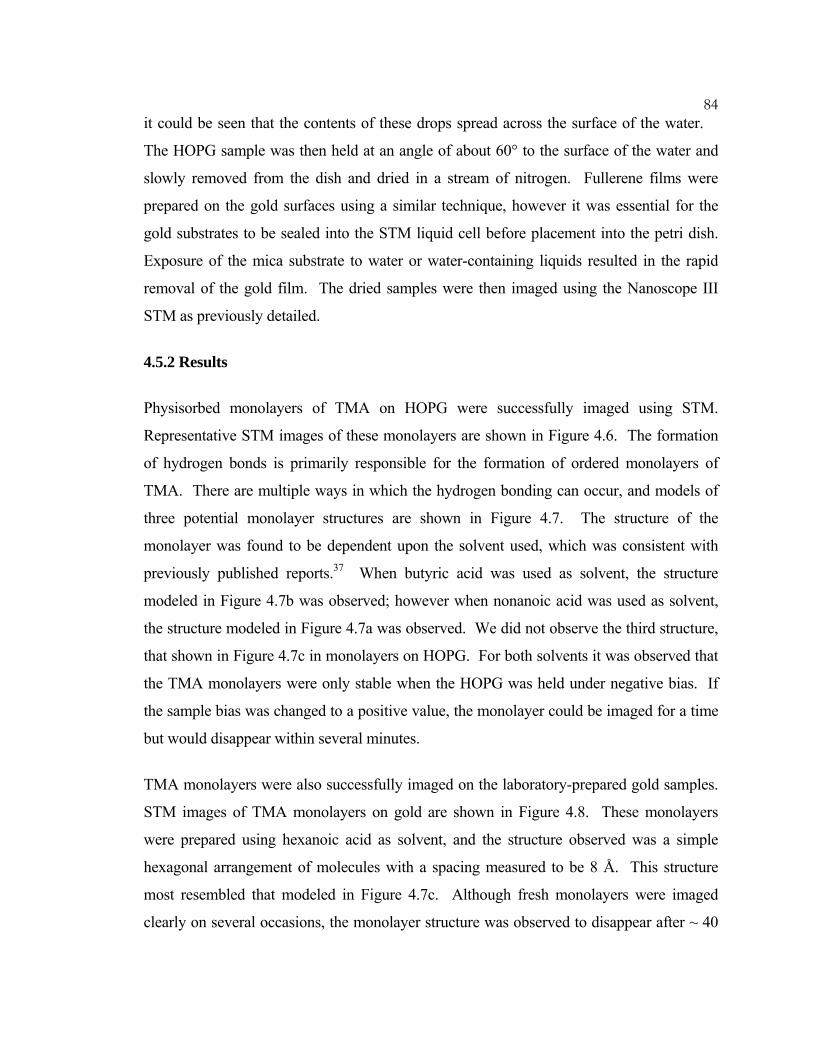
84it could be seen that the contents of these drops spread across the surface of the water.
The HOPG sample was then held at an angle of about 60° to the surface of the water and
slowly removed from the dish and dried in a stream of nitrogen. Fullerene films were
prepared on the gold surfaces using a similar technique, however it was essential for the
gold substrates to be sealed into the STM liquid cell before placement into the petri dish.
Exposure of the mica substrate to water or water-containing liquids resulted in the rapid
removal of the gold film. The dried samples were then imaged using the Nanoscope III
STM as previously detailed.
4.5.2 Results
Physisorbed monolayers of TMA on HOPG were successfully imaged using STM.
Representative STM images of these monolayers are shown in Figure 4.6. The formation
of hydrogen bonds is primarily responsible for the formation of ordered monolayers of
TMA. There are multiple ways in which the hydrogen bonding can occur, and models of
three potential monolayer structures are shown in Figure 4.7. The structure of the
monolayer was found to be dependent upon the solvent used, which was consistent with
previously published reports.37 When butyric acid was used as solvent, the structure
modeled in Figure 4.7b was observed; however when nonanoic acid was used as solvent,
the structure modeled in Figure 4.7a was observed. We did not observe the third structure,
that shown in Figure 4.7c in monolayers on HOPG. For both solvents it was observed that
the TMA monolayers were only stable when the HOPG was held under negative bias. If
the sample bias was changed to a positive value, the monolayer could be imaged for a time
but would disappear within several minutes.
TMA monolayers were also successfully imaged on the laboratory-prepared gold samples.
STM images of TMA monolayers on gold are shown in Figure 4.8. These monolayers
were prepared using hexanoic acid as solvent, and the structure observed was a simple
hexagonal arrangement of molecules with a spacing measured to be 8 Å. This structure
most resembled that modeled in Figure 4.7c. Although fresh monolayers were imaged
clearly on several occasions, the monolayer structure was observed to disappear after ~ 40
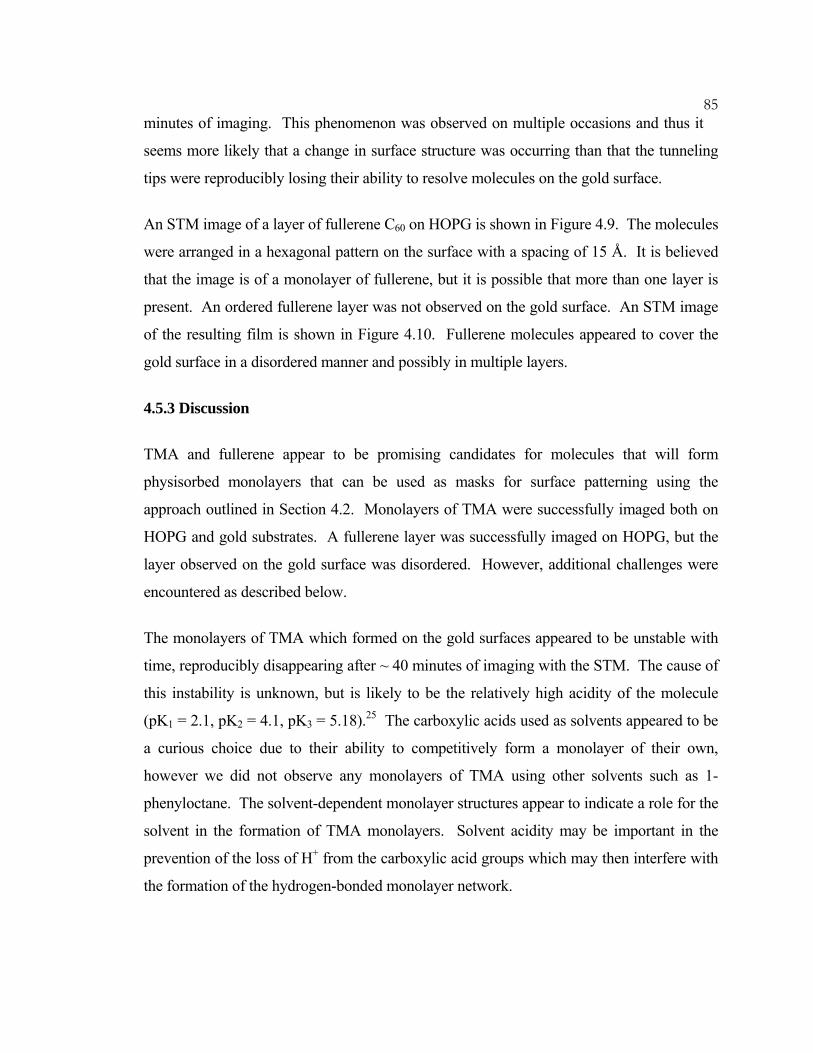
85minutes of imaging. This phenomenon was observed on multiple occasions and thus it
seems more likely that a change in surface structure was occurring than that the tunneling
tips were reproducibly losing their ability to resolve molecules on the gold surface.
An STM image of a layer of fullerene C60 on HOPG is shown in Figure 4.9. The molecules
were arranged in a hexagonal pattern on the surface with a spacing of 15 Å. It is believed
that the image is of a monolayer of fullerene, but it is possible that more than one layer is
present. An ordered fullerene layer was not observed on the gold surface. An STM image
of the resulting film is shown in Figure 4.10. Fullerene molecules appeared to cover the
gold surface in a disordered manner and possibly in multiple layers.
4.5.3 Discussion
TMA and fullerene appear to be promising candidates for molecules that will form
physisorbed monolayers that can be used as masks for surface patterning using the
approach outlined in Section 4.2. Monolayers of TMA were successfully imaged both on
HOPG and gold substrates. A fullerene layer was successfully imaged on HOPG, but the
layer observed on the gold surface was disordered. However, additional challenges were
encountered as described below.
The monolayers of TMA which formed on the gold surfaces appeared to be unstable with
time, reproducibly disappearing after ~ 40 minutes of imaging with the STM. The cause of
this instability is unknown, but is likely to be the relatively high acidity of the molecule
(pK1 = 2.1, pK2 = 4.1, pK3 = 5.18).25 The carboxylic acids used as solvents appeared to be
a curious choice due to their ability to competitively form a monolayer of their own,
however we did not observe any monolayers of TMA using other solvents such as 1-
phenyloctane. The solvent-dependent monolayer structures appear to indicate a role for the
solvent in the formation of TMA monolayers. Solvent acidity may be important in the
prevention of the loss of H+ from the carboxylic acid groups which may then interfere with
the formation of the hydrogen-bonded monolayer network.
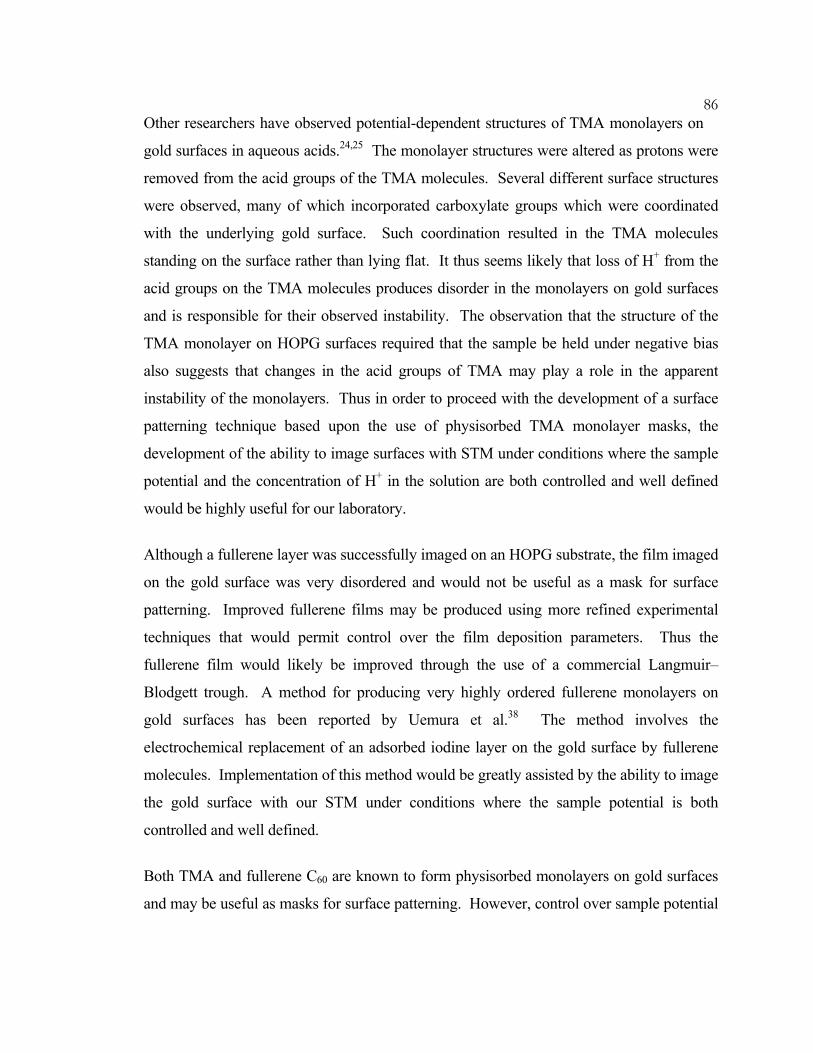
86Other researchers have observed potential-dependent structures of TMA monolayers on
gold surfaces in aqueous acids.24,25 The monolayer structures were altered as protons were
removed from the acid groups of the TMA molecules. Several different surface structures
were observed, many of which incorporated carboxylate groups which were coordinated
with the underlying gold surface. Such coordination resulted in the TMA molecules
standing on the surface rather than lying flat. It thus seems likely that loss of H+ from the
acid groups on the TMA molecules produces disorder in the monolayers on gold surfaces
and is responsible for their observed instability. The observation that the structure of the
TMA monolayer on HOPG surfaces required that the sample be held under negative bias
also suggests that changes in the acid groups of TMA may play a role in the apparent
instability of the monolayers. Thus in order to proceed with the development of a surface
patterning technique based upon the use of physisorbed TMA monolayer masks, the
development of the ability to image surfaces with STM under conditions where the sample
potential and the concentration of H+ in the solution are both controlled and well defined
would be highly useful for our laboratory.
Although a fullerene layer was successfully imaged on an HOPG substrate, the film imaged
on the gold surface was very disordered and would not be useful as a mask for surface
patterning. Improved fullerene films may be produced using more refined experimental
techniques that would permit control over the film deposition parameters. Thus the
fullerene film would likely be improved through the use of a commercial Langmuir–
Blodgett trough. A method for producing very highly ordered fullerene monolayers on
gold surfaces has been reported by Uemura et al.38 The method involves the
electrochemical replacement of an adsorbed iodine layer on the gold surface by fullerene
molecules. Implementation of this method would be greatly assisted by the ability to image
the gold surface with our STM under conditions where the sample potential is both
controlled and well defined.
Both TMA and fullerene C60 are known to form physisorbed monolayers on gold surfaces
and may be useful as masks for surface patterning. However, control over sample potential
87during STM imaging would greatly improve the likelihood of successful masking and
thus improve the likelihood of successful surface patterning using either of these
molecules. Sample potential can be controlled and defined during STM imaging through
the use of the well-established technique of electrochemical scanning tunneling microscopy
(ECSTM). ECSTM permits STM imaging in liquids that allow the flow of Faradaic
current. The sample is incorporated into an electrochemical cell and serves as the working
electrode. A counter electrode and a reference electrode are included in the cell to allow
full control over the cell potential. The technique requires that the STM tip be fully
insulated except for an extremely small (~ 10 nm2) area at the tip. The insulation is
required to limit the flow of Faradaic current at the tip to a value significantly smaller than
that of the tunneling current.
The STM tip can be modeled as a hemispherical ultra-microelectrode. The expression for
the steady state current at such an electrode is 0*OOss rCnFD2i π= , where n is the
stoichiometric number of electrons involved in the electrode reaction, F is the Faraday
constant, DO is the diffusion constant, *OC is the bulk concentration for the oxidized
species, and r0 is the radius of the hemisphere. Typical values for these variables lead to
mMmnA6.0iss ×μ
≈ . Thus, the Faradaic current can be reduced to a level where it is
significantly smaller than the tunneling current when r0 is on the order of a few nanometers.
The preparation of tips that meet this requirement and which provide adequate resolution
for STM imaging is difficult and is necessarily a low yield process. Several methods have
been described; however the experience in our laboratory indicates that the most promising
method is that which was described by Heben et al.39–41 This method involves coating
electrochemically etched Pt tips with a polymer melt. A nanometer-scale hole can then be
opened in the insulation at the very end of the pointed part of the tip using a field emission
process. Although we have recently been able to image surfaces under aqueous acidic
solutions using ECSTM techniques and tips prepared in this manner, we have not recently
achieved atomic resolution under these demanding conditions. However, this has been
88accomplished in our laboratory in the past, and therefore it appears likely that these
results can again be achieved.
4.5.4 Conclusions
Physisorbed monolayers of TMA have been observed on both HOPG and gold surfaces. A
physisorbed layer of fullerene was also observed on HOPG. Spaces are incorporated into
the monolayer structures of these molecules and thus such monolayers may be useful as
masks for a surface patterning technique. The monolayers of TMA on gold were observed
to be unstable over time, and the fullerene film observed on the gold surface was highly
disordered. ECSTM may offer remedies to both of these issues and it may prove highly
useful to redevelop this ability in our laboratory.
4.6 Summary
Physisorbed monolayers that incorporate spaces into their structure may be useful as masks
in a surface patterning technique analogous to photolithography. Gold–thiol chemistry
may provide a route toward the formation of chemical bonds to surface areas left
uncovered by the physisorbed monolayer mask. Gold surface preparation techniques were
evaluated and it was found that evaporation of gold onto mica substrates followed by
annealing of the samples in a hydrogen flame for ~ 5 minutes produced polycrystalline
gold samples with Au(111) surfaces. Physisorbed monolayers of 1-tetradecanol, 1,14-
tetradecanediol were observed on the gold surfaces. Monolayers of 1,3,5-
benzenetricarboxylic acid (TMA) were observed on both HOPG and gold surfaces. The
stability of the TMA monolayers appeared to depend upon the sample bias. It is believed
that the acidity of the TMA molecule may be the cause of the observed instability over time
of its monolayers on gold surfaces. An ordered layer of fullerene C60 was observed on
HOPG but not on a gold surface. Both TMA and fullerene are promising candidates for
masking layers for use in a nanometer scale chemical surface patterning technique;
however the formation of stable, ordered monolayers of these molecules appears to require
that our laboratory redevelop the ability to perform STM imaging in electrochemical

89environments. The development of such capability will certainly require patience and
commitment as the preparation of tips suitable for STM imaging under an electrochemical
environment is a low-yield process. However, the additional experimental capabilities
gained by redeveloping this technique in our laboratory will likely justify such efforts.
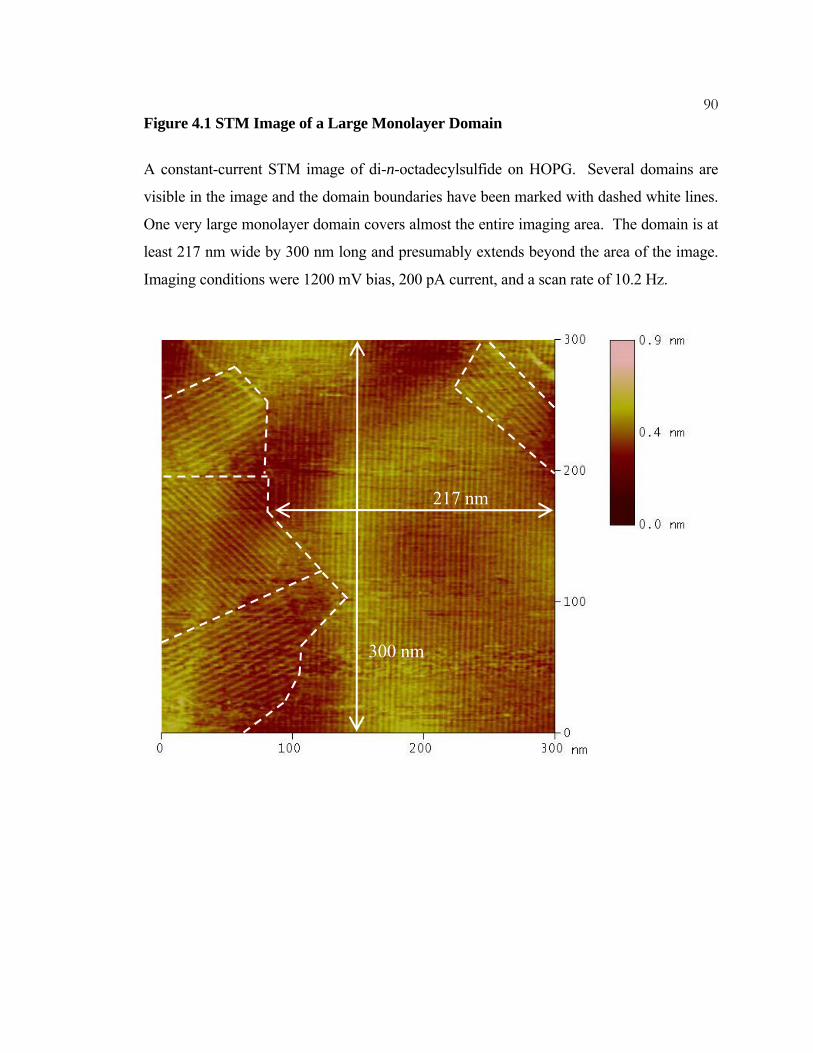
90Figure 4.1 STM Image of a Large Monolayer Domain
A constant-current STM image of di-n-octadecylsulfide on HOPG. Several domains are
visible in the image and the domain boundaries have been marked with dashed white lines.
One very large monolayer domain covers almost the entire imaging area. The domain is at
least 217 nm wide by 300 nm long and presumably extends beyond the area of the image.
Imaging conditions were 1200 mV bias, 200 pA current, and a scan rate of 10.2 Hz.
217 nm
300 nm

91Figure 4.2 STM Images of Evaporated Gold Surfaces
(a) A constant current image of HOPG for comparison purposes. Imaging conditions were
sample bias = 100mV, current = 2 nA, scan rate = 15.3 Hz.
(b) A freshly etched, hydrogen terminated, n-type Si(111) surface also for comparison
purposes. Imaging conditions: -3000 mV, 75 pA, 10.2 Hz
(c) Gold evaporated directly onto HOPG. Imaging conditions: 100 mV, 1 nA, 10.2 Hz
(d) The sample from (c) after annealing in a hydrogen flame for ~ 5 minutes. Imaging
conditions: 310 mV, 500 pA, 10.2 Hz
(e) Gold evaporated on chromium on HOPG. Imaging conditions: 300 mV, 2 nA, 10.2 Hz.
(f) The sample shown in (e) after annealing for ~ 5 minutes. Imaging conditions: 200 mV,
2 nA, 15.3 Hz
(g) Gold evaporated directly onto mica. Imaging conditions: 150 mV, 2 nA, 10.2 Hz
(h) The sample shown in (g) after annealing for ~ 5 minutes under identical imaging
conditions
(i) Gold evaporated on chromium on mica. Imaging conditions: 150 mV, 2 nA, 10.2 Hz
(j) The sample shown in (i) after annealing for ~ 5 minutes under identical imaging
conditions
(k) Purchased sample of gold on mica. Imaging conditions: 310 mV, 500 pA, 10.2 Hz
(l) The sample shown in (k) under identical imaging conditions after annealing for ~ 1
minute
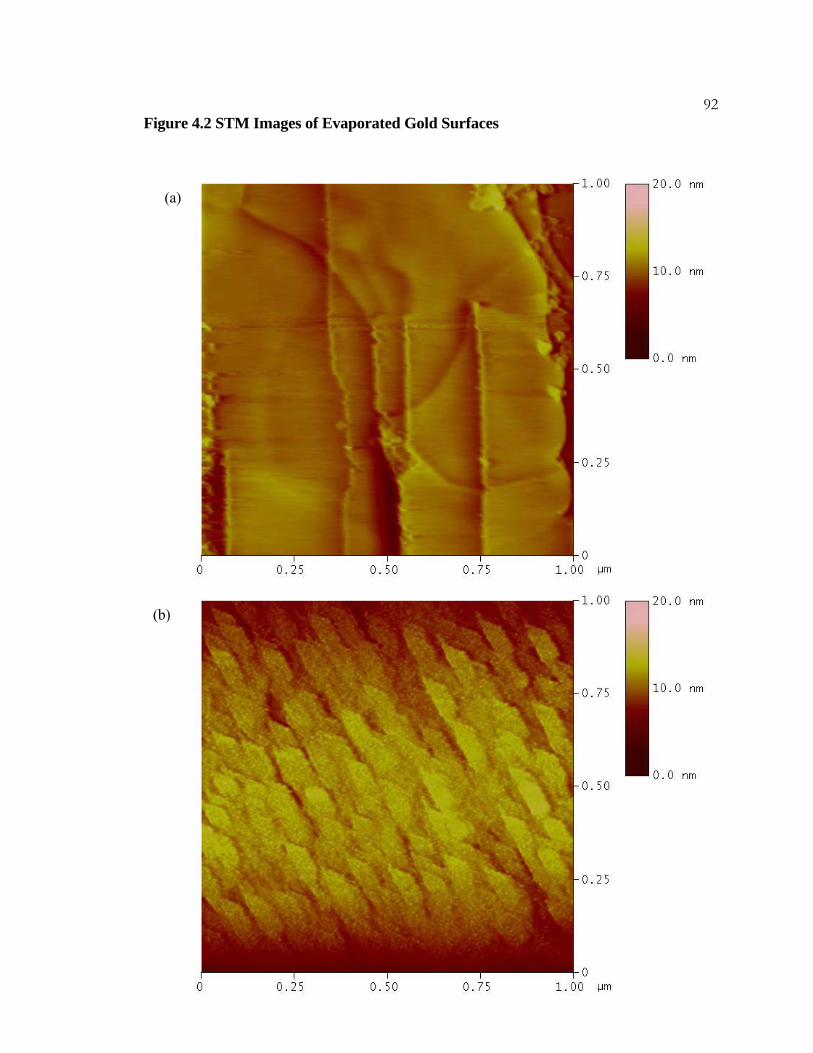
92
(a)
(b)
Figure 4.2 STM Images of Evaporated Gold Surfaces
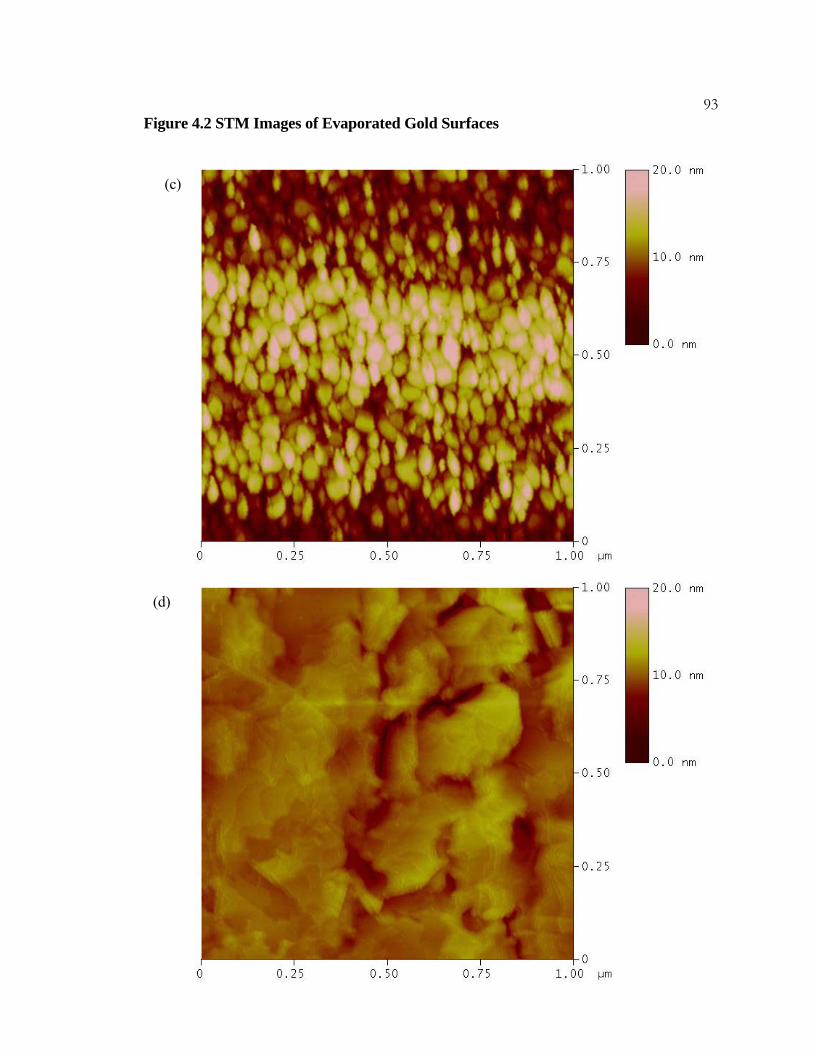
93
(c)
(d)
Figure 4.2 STM Images of Evaporated Gold Surfaces
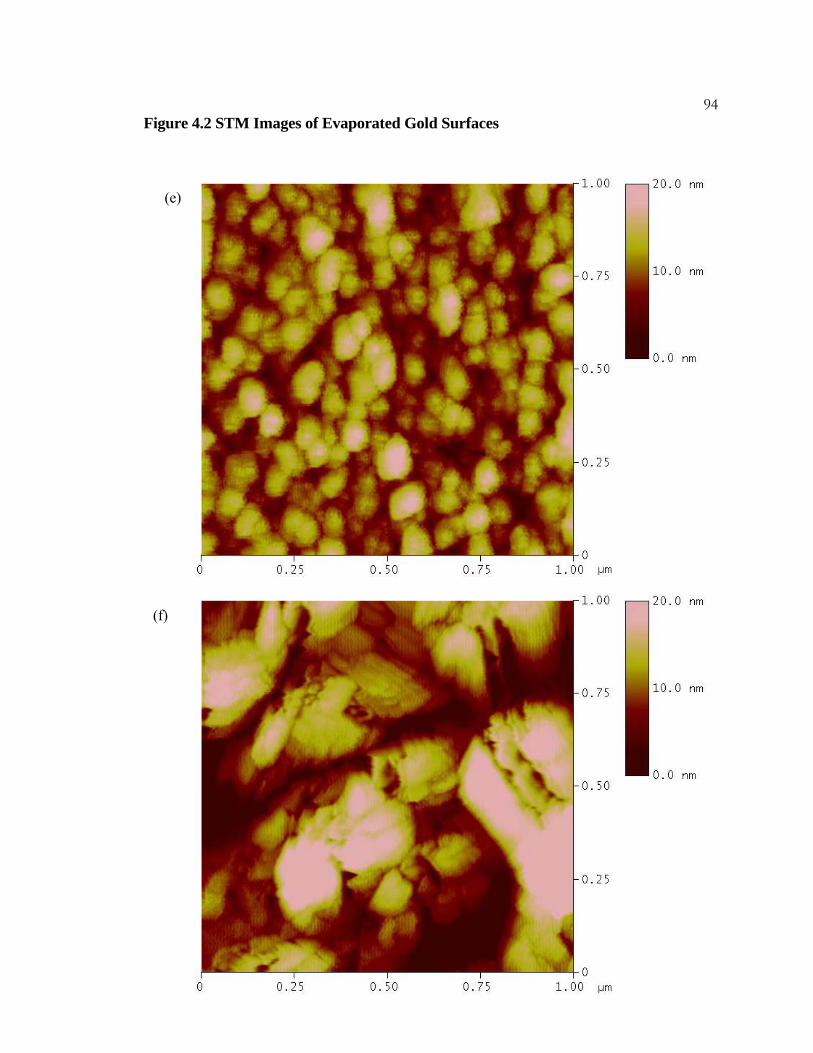
94
(e)
(f)
Figure 4.2 STM Images of Evaporated Gold Surfaces
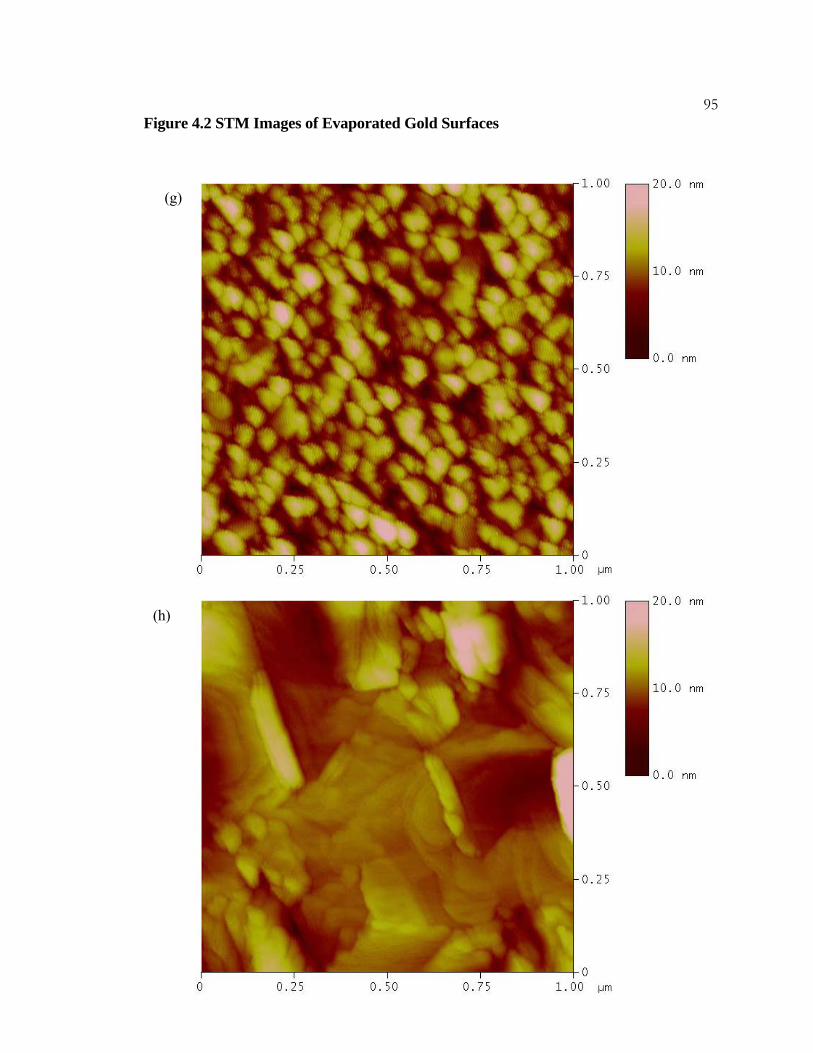
95
(g)
(h)
Figure 4.2 STM Images of Evaporated Gold Surfaces

96
(i)
(j)
Figure 4.2 STM Images of Evaporated Gold Surfaces
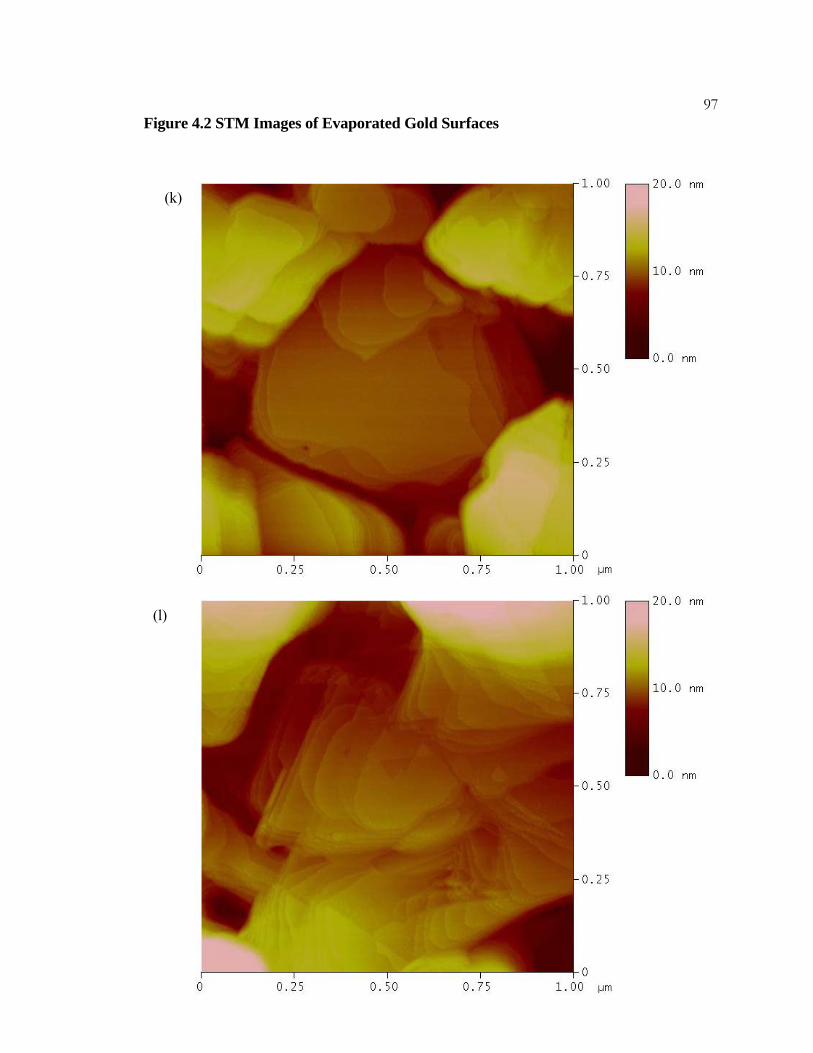
97
(k)
(l)
Figure 4.2 STM Images of Evaporated Gold Surfaces
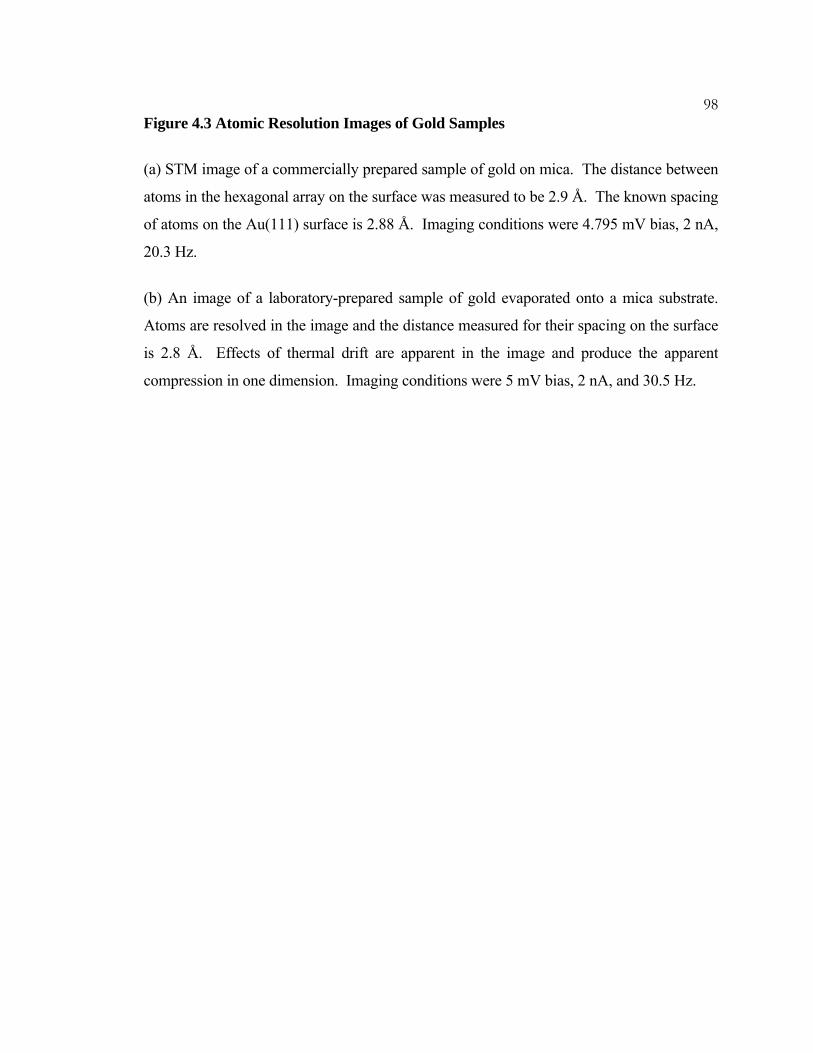
98Figure 4.3 Atomic Resolution Images of Gold Samples
(a) STM image of a commercially prepared sample of gold on mica. The distance between
atoms in the hexagonal array on the surface was measured to be 2.9 Å. The known spacing
of atoms on the Au(111) surface is 2.88 Å. Imaging conditions were 4.795 mV bias, 2 nA,
20.3 Hz.
(b) An image of a laboratory-prepared sample of gold evaporated onto a mica substrate.
Atoms are resolved in the image and the distance measured for their spacing on the surface
is 2.8 Å. Effects of thermal drift are apparent in the image and produce the apparent
compression in one dimension. Imaging conditions were 5 mV bias, 2 nA, and 30.5 Hz.
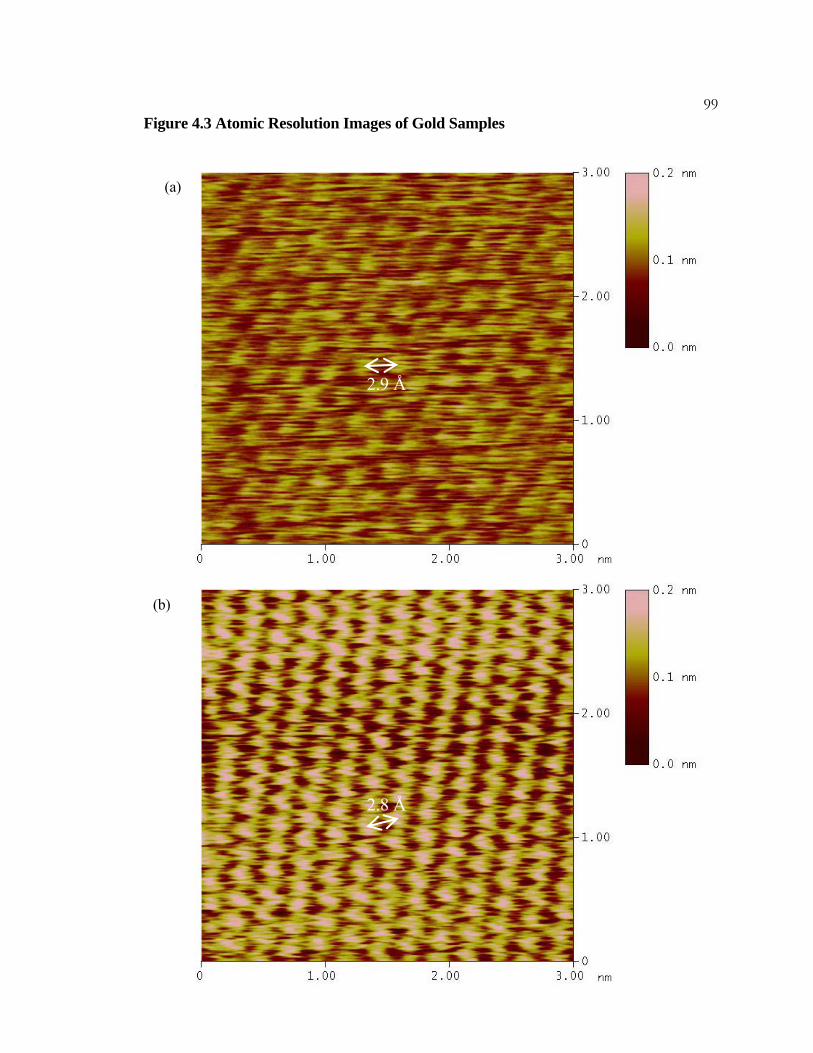
99
(a)
(b)
2.9 Å
2.8 Å
Figure 4.3 Atomic Resolution Images of Gold Samples
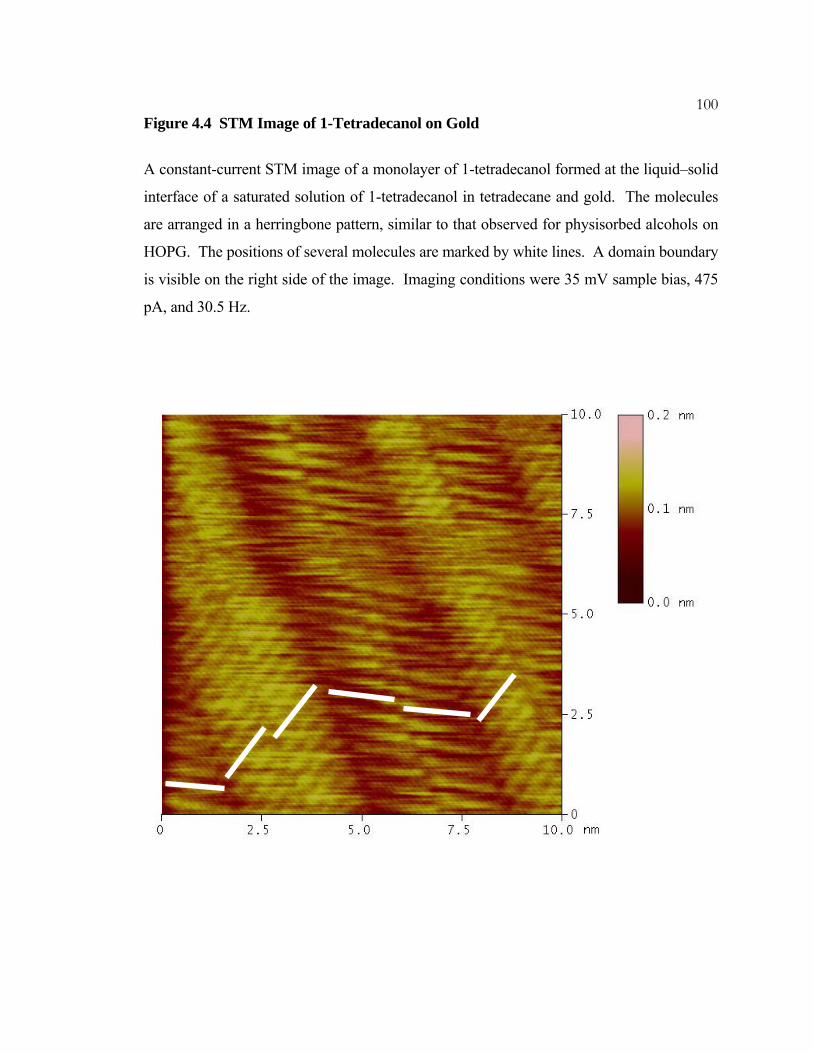
100Figure 4.4 STM Image of 1-Tetradecanol on Gold
A constant-current STM image of a monolayer of 1-tetradecanol formed at the liquid–solid
interface of a saturated solution of 1-tetradecanol in tetradecane and gold. The molecules
are arranged in a herringbone pattern, similar to that observed for physisorbed alcohols on
HOPG. The positions of several molecules are marked by white lines. A domain boundary
is visible on the right side of the image. Imaging conditions were 35 mV sample bias, 475
pA, and 30.5 Hz.

101Figure 4.5 STM Images of 1,14-Tetradecanediol on Gold
(a) A constant current STM image of a monolayer of 1,14-tetradecanediol on gold. A
herringbone pattern, typical of that seen on HOPG is clearly resolved. A domain boundary
is indicated by the dashed white line. The imaging conditions were 35 mV bias, 475 pA,
and 30.5 Hz.
(b) The monolayer shown in (a) showing a larger area of the surface. The monolayer
covers a relatively small area of the surface, and is only ~ 20 nm in width. The imaging
conditions were identical to those for (a).
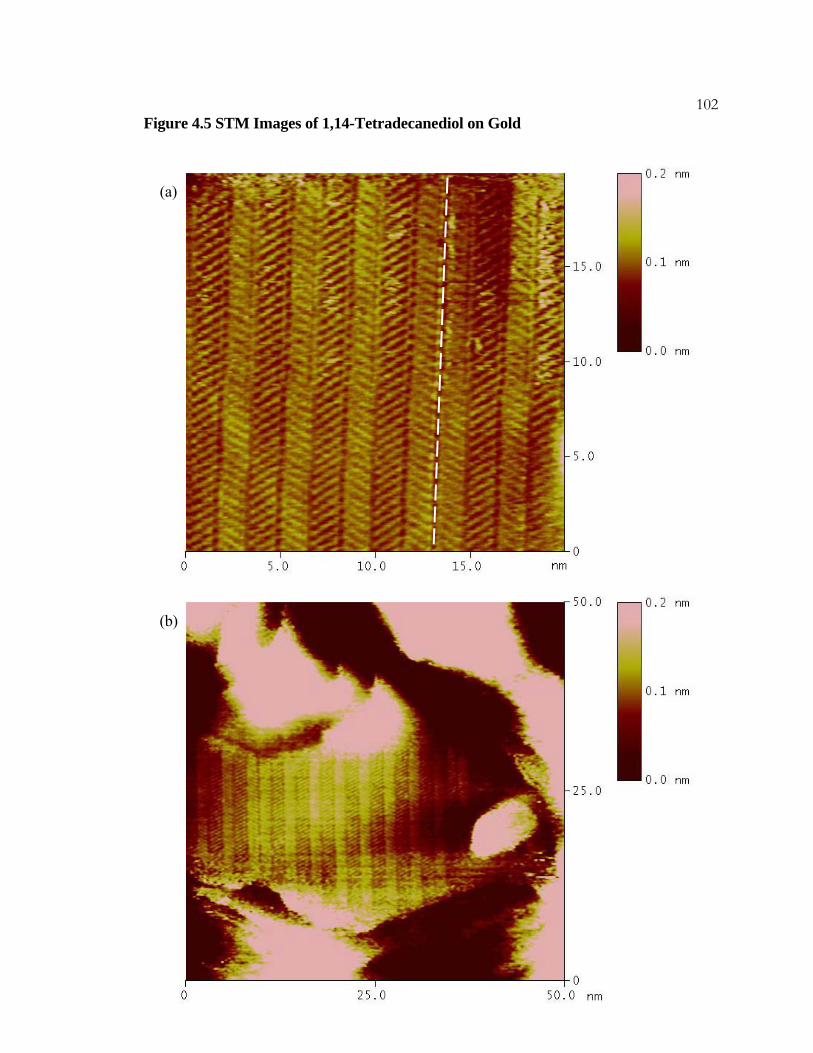
102
(a)
(b)
Figure 4.5 STM Images of 1,14-Tetradecanediol on Gold

103Figure 4.6 STM Images of 1,3,5-Benzenetricarboxylic Acid (TMA) on HOPG
(a) Constant-current STM image of TMA in butyric acid on HOPG. The monolayer
exhibits a hexagonal structure with a spacing measured to be 12 Å and a second spacing
measured to be 9 Å. This is consistent with the structure modeled in Figure 4.7b. The
imaging conditions were -1170 mV sample bias, 150 pA, and 30.5 Hz.
(b) Constant-current STM image of TMA in nonanoic acid on HOPG. The monolayer has
a hexagonal structure with a spacing measured to be 17 Å. This is the structure modeled in
Figure 4.7a. The image contrast appears to be reversed. The imaging conditions were
-1214 mV, 75 pA, and 30.5 Hz.
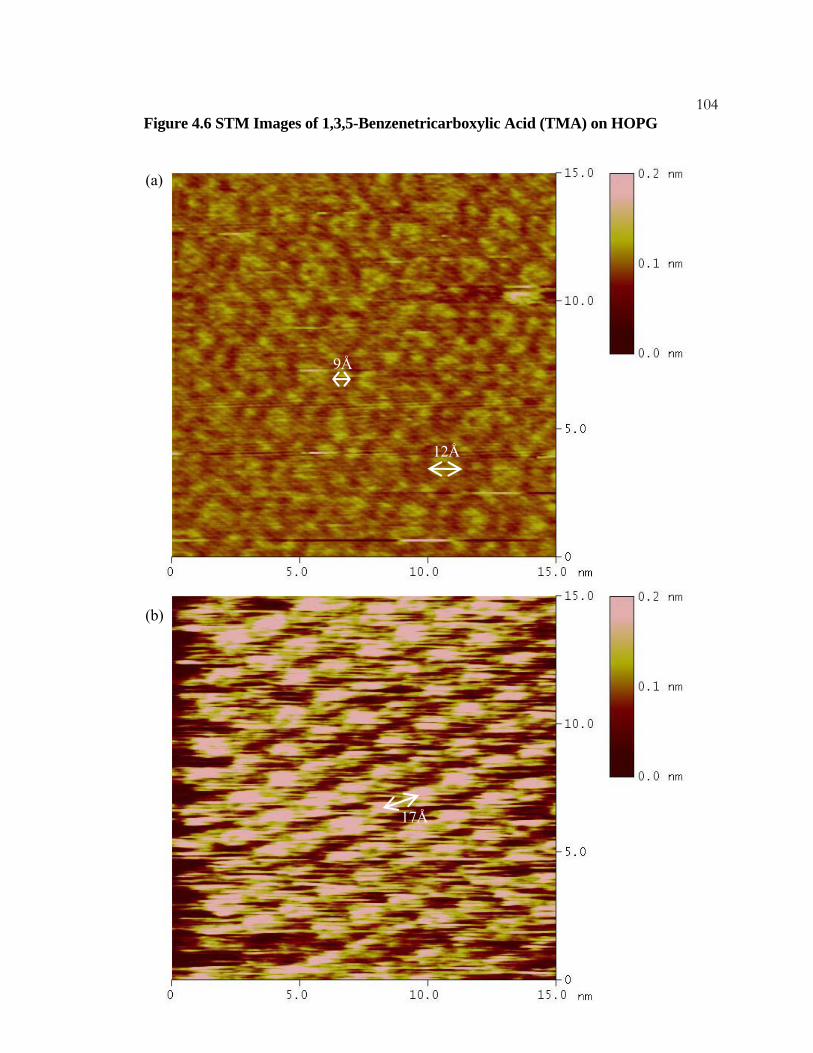
104
12Å
9Å
17Å
(a)
(b)
Figure 4.6 STM Images of 1,3,5-Benzenetricarboxylic Acid (TMA) on HOPG

105Figure 4.7 Models of TMA Monolayer Structures
Several structures are possible for physisorbed monolayers of TMA. Multiple structures
are possible because the carboxylic acid groups can form hydrogen bonds in more than one
way.
(a) This structure is known as a “chicken wire” structure. All of the carboxylic acid groups
are arranged to hydrogen bond in pairs.
(b) This structure is known as the “flower” structure. Some of the carboxylic acids form
hydrogen bonding pairs, while other hydrogen bonding groups contain three acid groups.
(c) This structure is known as the “super flower” structure. In this structure, three
carboxylic acid functional groups are involved in each hydrogen bonding group.
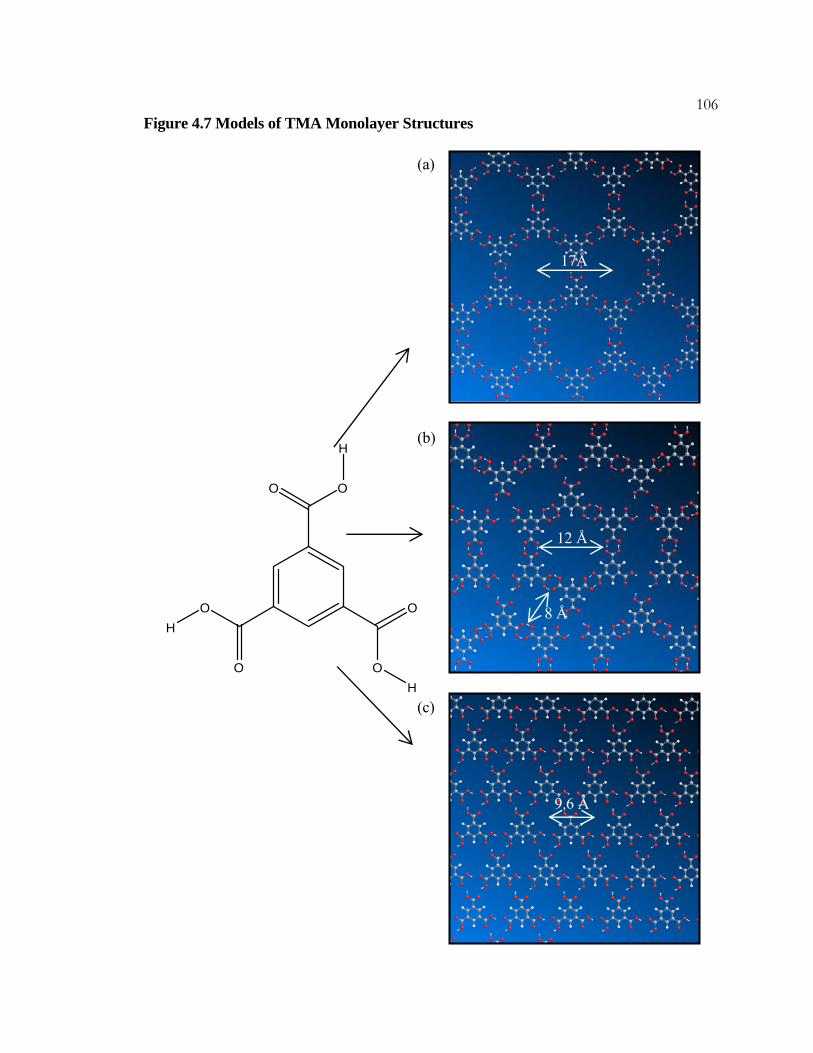
106
O
OO
O
O
O
H
H
H
17Å
12 Å
8 Å
9.6 Å
(a)
(b)
(c)
Figure 4.7 Models of TMA Monolayer Structures
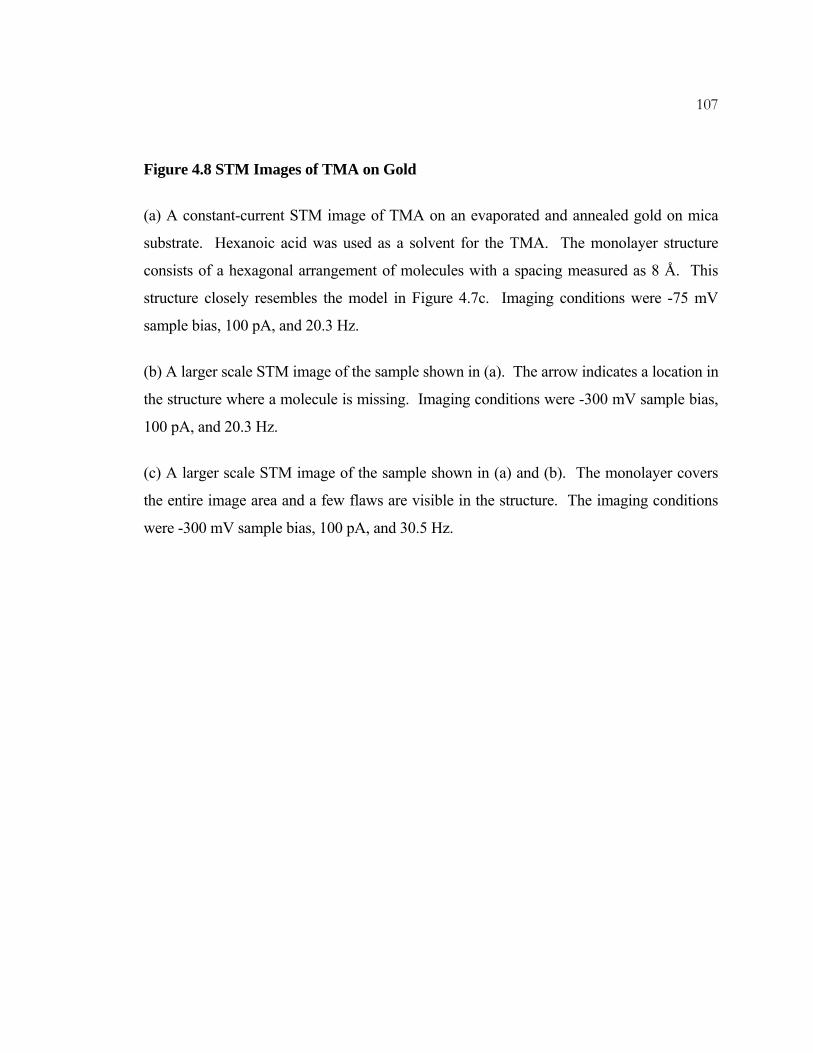
107
Figure 4.8 STM Images of TMA on Gold
(a) A constant-current STM image of TMA on an evaporated and annealed gold on mica
substrate. Hexanoic acid was used as a solvent for the TMA. The monolayer structure
consists of a hexagonal arrangement of molecules with a spacing measured as 8 Å. This
structure closely resembles the model in Figure 4.7c. Imaging conditions were -75 mV
sample bias, 100 pA, and 20.3 Hz.
(b) A larger scale STM image of the sample shown in (a). The arrow indicates a location in
the structure where a molecule is missing. Imaging conditions were -300 mV sample bias,
100 pA, and 20.3 Hz.
(c) A larger scale STM image of the sample shown in (a) and (b). The monolayer covers
the entire image area and a few flaws are visible in the structure. The imaging conditions
were -300 mV sample bias, 100 pA, and 30.5 Hz.

108Figure 4.8 STM Images of TMA on Gold
8Å
(a)
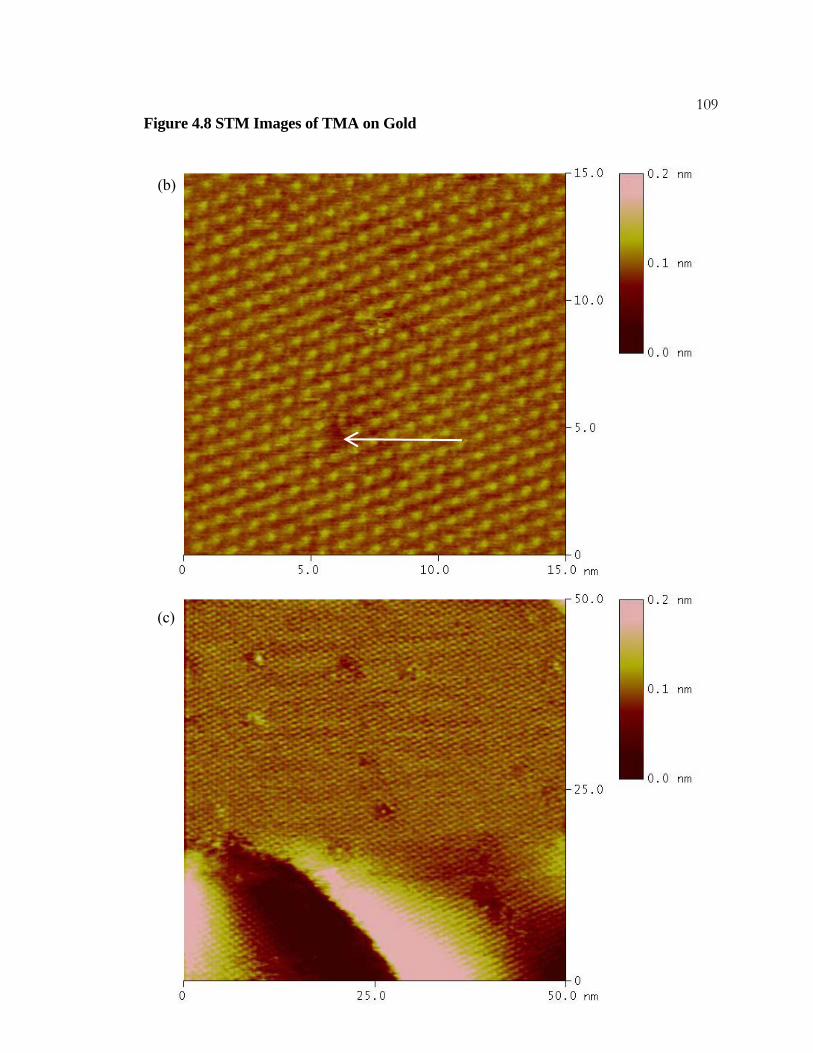
109
(b)
(c)
Figure 4.8 STM Images of TMA on Gold

110Figure 4.9 STM Image of Fullerene C60 on HOPG
A constant-current STM image of fullerene C60 on HOPG. The molecules are arranged in a
hexagonal pattern on the surface with a measured spacing of 15 Å. The imaging conditions
were -1200 mV sample bias, 2 nA, and 30.5 Hz.
15Å
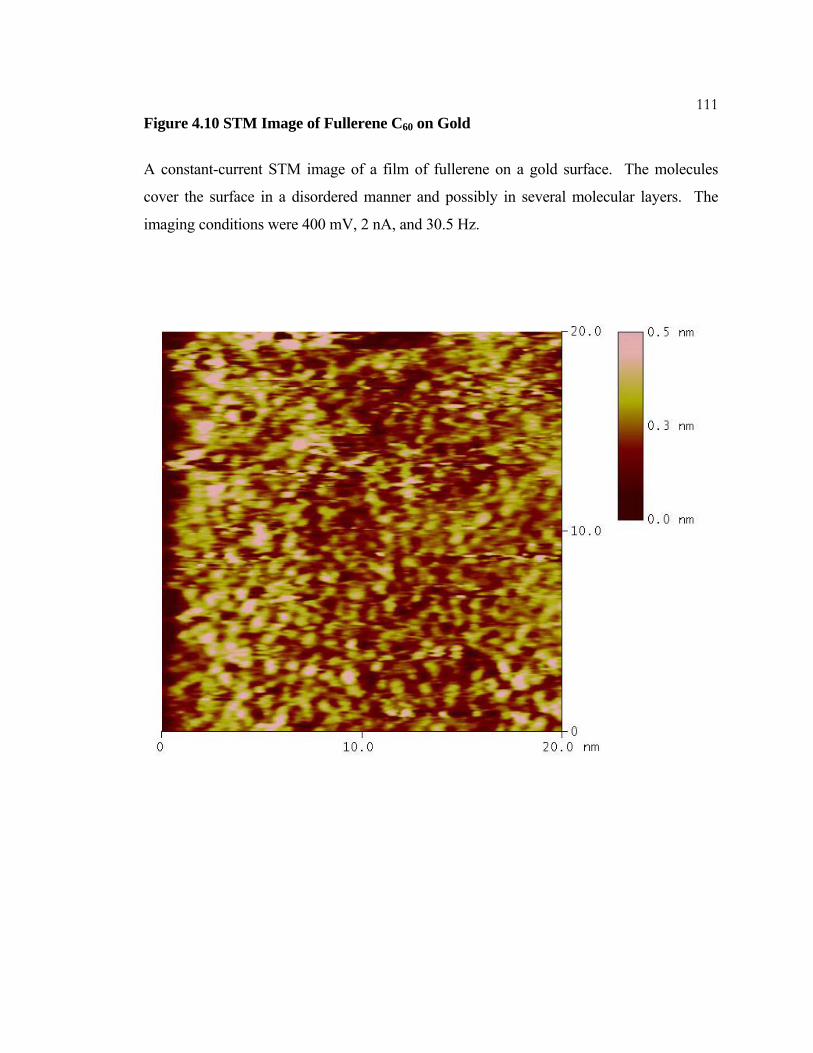
111Figure 4.10 STM Image of Fullerene C60 on Gold
A constant-current STM image of a film of fullerene on a gold surface. The molecules
cover the surface in a disordered manner and possibly in several molecular layers. The
imaging conditions were 400 mV, 2 nA, and 30.5 Hz.
1124.7 References
(1) Groszek, A. J. Nature 1962, 196, 531–533.
(2) Groszek, A. J. Nature 1964, 204, 680.
(3) Everett, D. H. Transactions of the Faraday Society 1965, 61, 2478–2495.
(4) Ash, S. G.; Everett, D. H.; Findenegg, G.H. Transactions of the Faraday Society
1968, 64, 2639–2644.
(5) Hentschke, R.; Winkler, R. G. J. Chem. Phys. 1993, 99, 5528–5534.
(6) Castro, M. A.; Clarke, S. M.; Inaba, A.; Dong, C. C.; Thomas, R. K. J. Phys. Chem. B
1998, 102, 777–781.
(7) Findenegg, G. H.; Liphard, M. Carbon 1987, 25, 119–128.
(8) McGonigal, G. C.; Bernhardt, R. H.; Thomson, D. J. Appl. Phys. Lett. 1990, 57, 28–
30.
(9) Uosaki, K.; Yamada, R. J. Am. Chem. Soc. 1999, 121, 4090–4091.
(10) Bain, C. D.; Troughton, E. B.; Tao, Y. T.; Evall, J.; Whitesides, G. M.; Nuzzo, R. G.
J. Am. Chem. Soc. 1989, 111, 321–335.
(11) Dishner, M. H.; Ivey, M. M.; Gorer, S.; Hemminger, J. C.; Feher, F. J. J. Vac. Sci.
Technol., A 1998, 16, 3295–3300.
113(12) Marchenko, A.; Xie, Z. X.; Cousty, J.; Van, L. P. Surf. Interface Anal. 2000, 30,
167–169.
(13) Xie, Z. X.; Huang, Z. F.; Xu, X. Phys. Chem. Chem. Phys. 2002, 4, 1486–1489.
(14) Yasuda, S.; Shigekawa, H. Jpn. J. Appl. Phys., Part 1 2003, 42, 4901–4904.
(15) Katsonis, N.; Marchenko, A.; Fichou, D. J. Am. Chem. Soc. 2003, 125, 13682–
13683.
(16) Clavilier, J.; Faure, R.; Guinet, G.; Durand, R. J. Electroanal. Chem. 1980, 107,
205–209.
(17) Yamada, R.; Uosaki, K. J. Phys. Chem. B 2000, 104, 6021–6027.
(18) He, Y. F.; Ye, T.; Borguet, E. J. Phys. Chem. B 2002, 106, 11264–11271.
(19) Xu, S. M.; Szymanski, G.; Lipkowski, J. J. Am. Chem. Soc. 2004, 126, 12276–
12277.
(20) Xie, Z. X.; Xu, X.; Tang, J.; Mao, B. W. J. Phys. Chem. B 2000, 104, 11719–11722.
(21) Marchenko, A.; Cousty, J.; Van, L. P. Langmuir 2002, 18, 1171–1175.
(22) Zhang, H. M.; Xie, Z. X.; Mao, B. W.; Xu, X. Chem.—Eur. J. 2004, 10, 1415–1422.
(23) Zhang, H. M.; Yan, J. W.; Xie, Z. X.; Mao, B. W.; Xu, X. Chem.—Eur. J. 2006, 12,
4006–4013.
114(24) Ishikawa, Y.; Ohira, A.; Sakata, M.; Hirayama, C.; Kunitake, M. Chemical
Communications 2002, 22, 2652–2653.
(25) Su, G. J.; Zhang, H. M.; Wan, L. J.; Bai, C. L.; Wandlowski, T. J. Phys. Chem. B
2004, 108, 1931–1937.
(26) Plass, K. E.; Kim, K.; Matzger, A. J. J. Am. Chem. Soc. 2004, 126, 9042–9053.
(27) Tahara, K.; Furukawa, S.; Uji-I, H.; Uchino, T.; Ichikawa, T.; Zhang, J.; Mamdouh,
W.; Sonoda, M.; De Schryver, F. C.; De Feyter, S.; Tobe, Y. J. Am. Chem. Soc. 2006,
128, 16613–16625.
(28) Yan, H. J.; Lu, J.; Wan, L. J.; Bai, C. L. J. Phys. Chem. B 2004, 108, 11251–11255.
(29) Ruben, M.; Payer, D.; Landa, A.; Comisso, A.; Gattinoni, C.; Lin, N.; Collin, J. P.;
Sauvage, J. P.; De Vita, A.; Kern, K. J. Am. Chem. Soc. 2006, 128, 15644–15651.
(30) Laibinis, P. E.; Whitesides, G. M. J. Am. Chem. Soc. 1992, 114, 1990–1995.
(31) Bain, C. D.; Evall, J.; Whitesides, G. M. J. Am. Chem. Soc. 1989, 111, 7155–7164.
(32) Sellers, H.; Ulman, A.; Shnidman, Y.; Eilers, J. E. J. Am. Chem. Soc. 1993, 115,
9389–9401.
(33) Kern, H. E. P., A.; Brauer, U.; Findenegg, G.H. Progress in Colloid and Polymer
Science 1978, 65, 118–124.
(34) Streitwieser, A.; Heathcock, C. H.; Kosower, E. M. Introduction to Organic
Chemistry, 4th ed.; Prentice-Hall Inc: Upper Saddle River, NJ, 1992; p 810.
115(35) Parker, A. J. “Sulfur Nucleophiles in Aromatic SN Reactions.” In Organic Sulfur
Compounds; Kharasch, N., Ed.; Pergamon Press: New York, 1961; Vol. 1, p 103.
(36) Harten, U.; Lahee, A. M.; Toennies, J. P.; Woll, C. Phys. Rev. Lett. 1985, 54, 2619–
2622.
(37) Lackinger, M.; Griessl, S.; Heckl, W. A.; Hietschold, M.; Flynn, G. W. Langmuir
2005, 21, 4984–4988.
(38) Uemura, S.; Sakata, M.; Taniguchi, I.; Kunitake, M.; Hirayama, C. Langmuir 2001,
17, 5–7.
(39) Heben, M. J.; Dovek, M. M.; Lewis, N. S.; Penner, R. M.; Quate, C. F. Journal of
Microscopy—Oxford 1988, 152, 651–661.
(40) Heben, M. J.; Penner, R. M.; Lewis, N. S.; Dovek, M. M.; Quate, C. F. Appl. Phys.
Lett. 1989, 54, 1421–1423.
(41) Heben, M. J. “Scanning Tunneling Microscopy in Electrochemical Environments.”
Ph.D. Thesis, California Institute of Technology, February 1990.
