exploiting untapped information resources in earth … · exploiting untapped information resources...
TRANSCRIPT

EXPLOITING UNTAPPED INFORMATION RESOURCES IN EARTH SCIENCE
Rahul Ramachandran NASA/MSFC, Peter Fox RPI, Steve Kempler NASA/GSFC and Manil Maskey UAH
MSFC/UAH: Patrick Gatlin, Xiang Li, Amanda Weigel, JJ Miller, Kaylin Bugbee, Ajinkya Kulkarni GSFC: Chris Lynnes, Suhung Shen, Chung-Lin Shie, Maksym Petrenko RPI: Stefan Zednik, Anirudh Prabhu
https://ntrs.nasa.gov/search.jsp?R=20160000252 2020-03-25T23:46:38+00:00Z

Outline
1. Project Overview 2. Data Curation Service 3. Rules Engine 4. Image Retrieval Service 5. Summary
2

Part 1: Project Overview
3

Motivation
• Data preparation steps are cumbersome and time consuming o Covers discovery, access and preprocessing
• Limitations of current Data/Information Systems o Boolean search on data based on instrument or
geophysical or other keywords o Underlying assumption that users have sufficient
knowledge of the domain vocabulary o Lack support for those unfamiliar with the domain
vocabulary or the breadth of relevant data available 4
DATA$$ KNOWLEDGE$Search$and$Access$ Preprocessing$
Visualiza>on$and$Analysis$
Visualiza>on$and$Analysis$
Data$Discovery$and$Explora>on$

Earth Science Metadata: Dark Resources • Dark resources - information resources that organizations
collect, process, and store for regular business or operational activities but fail to utilize for other purposes o Challenge is to recognize, identify and effectively utilize these
dark data stores
• Metadata catalogs contain dark resources consisting of structured information, free form descriptions of data and browse images. o EOS Clearing House (ECHO) holds >6000data collections, 127
million records for individual files and 67 million browse images.
5
Premise: Metadata catalogs can be utilized beyond their original design intent to provide new data discovery and exploration pathways to support science and education communities.

Goals • Design a Semantic Middleware
Layer (SML) to exploit these metadata resources o provide novel data discovery and
exploration capabilities that significantly reduce data preparation time.
o utilize a varied set of semantic web, information retrieval and image mining technologies.
• Design SML as a Service Oriented Architecture (SOA) to allow individual components to be used by existing systems
6
��� �� ������������������ ��
�������� ���
���� �������������
�����
���������
�������
������
������ �
�������
������
� � ��
�������
�����
��������
���������
��������
������������� ������������� �� � ��
� � ������������������

Science Use Cases • Dust storms, Volcanic Eruptions, Tropical Storms/
Hurricanes • Volcanic Eruptions:
o Emit a variety of gases as well as volcanic ash, which are in turn affected by atmospheric conditions such as winds.
o Role of Components • Image Retrieval Service is used to find volcanic ash
events in browse imagery • Data Curation Service suggests the relevant datasets to
support event analysis • Rules Engine invokes a Giovanni processing workflow to
assemble and compare the wind, aerosol and SO2 data for the event
7

Find Events: Browse Images
Example: MODIS-Aqua 2008-05-03 18:45 UTC Band 1-4-3 (true color) Band 7-2-1 LST
Chaitén Volcano Eruption Eruption Time period: May 2 – Nov 2008 Location: Andes region, Chile ( -42.832778, -72.645833)

Suggest Relevant Data Total SO2 mass: e.g. Chaitén is 10 (kt) =(kilotons ) , (1kt= 1000 metric tons) ftp://measures.gsfc.nasa.gov/data/s4pa/SO2/MSVOLSO2L4.1/MSVOLSO2L4_v01-00-2014m1002.txt Daily SO2: OMI/Aura Sulphur Dioxide (SO2) Total Column Daily L2 Global 0.125 deg http://disc.sci.gsfc.nasa.gov/datacollection/OMSO2G_V003.html Calibrated Radiances: MODIS/Aqua Calibrated Radiances 5-Min L1B Swath 1km http://dx.doi.org/10.5067/modis/myd021km.006 Aerosol Optical Thickness: MODIS/Aqua Aerosol 5-Min L2 Swath 10km http://modis-atmos.gsfc.nasa.gov/MOD04_L2/ SeaWiFS Deep Blue Aerosol Optical Depth and Angstrom Exponent Level 2 Data 13.5km http://disc.gsfc.nasa.gov/datacollection/SWDB_L2_V004.shtml IR Brightness Temperature: NCEP/CPC 4-km Global (60 deg N - 60 deg S) Merged IR Brightness Temperature Dataset

MODIS-Aqua 2008-05-03 18:45 UTC MODIS-Aqua 2008-05-05 18:30 UTC
http://gdata2.sci.gsfc.nasa.gov/daac-bin/G3/gui.cgi?instance_id=omil2g
Generate Giovanni SO2 Plots

MODIS-Aqua 2008-05-03 18:45 UTC
Generate Giovanni Infrared Data Plot MODIS-Aqua 2008-05-05 18:30 UTC
http://disc.sci.gsfc.nasa.gov/daac-bin/hurricane_data_analysis_tool.pl
2008.05.03 18:00Z 2008.05.05 17:00Z

Phenomena
PhysicalFeature
ObservableProperty
DataVariable
Conceptual Model • Phenomena
• Eventtype
• PhysicalFeature• Manifesta;on/Driverof
phenomena• Hasspace/;meextent• CanprecedeorlingeraBer
whatisgenerallythoughtofasthephenomenaevent
• ObservableProperty• Characteris;c/propertyof
physicalfeature
• DataVariable• Measurement/es;ma;onof
observablefeature
• Hurricane• TropicalStorm• DustStorm• Volcanic
Erup;on
• AshPlume• AreaofHighWinds• AreaofElevatedSurface
Temperature• AreaofHighPar;culate
Emissions
• Temperature• Radiance• WindSpeed• RainRate
• MOD04_L2:Op;cal_Depth_Land_and_Ocean_Mean
• MOD02HKM:bands1,3,and4• OMSO2e:ColumnAmountSO2_PBL

Part 2: Data Curation Algorithm for Phenomena
Initial Results
13

Objectives • Design a data curation (relevancy ranking)
algorithm for a set of phenomena • Provide the data curation algorithm as a stand
alone service
• Envisioned Use: o Given a phenomenon type (Ex: Hurricane), DCS returns a
list of relevant data sets (variables) • <data of data sets> = DCS(Phenomenon Type)
o For a specific phenomenon instance (event: Hurricane Katrina), these curated datasets can then be filtered based on space/time to get actual granules
14

Overview
15

Data Curation Algorithm Approaches
• Information Retrieval o Boolean (Faceted) Search
• Pros: Simple to implement • Cons: Phenomena can be
complex; User may not know all the right keywords
o Relevancy Ranking Algorithm • Pros: List most relevant
data first • Cons: Requires a custom
algorithm
16
• Text mining o Pros: Don’t need to explicitly
define the phenomena o Cons: Dependent of the
truth set; Catalog is dynamic and new data may never get classified
• Ontology Based o Pros: Best precision and
recall o Cons: Labor intensive to
build an explicit model and map to instances

Data Search for Earth Science Phenomena
17
USER TASK
INFO NEED
QUERY
SEARCH ENGINE
DOCUMENT COLLECTION
RESULTS
REFINE
Study “Hurricane”
All data sets useful in studying “Hurricane”
How to automatically
formulate query?
Best relevancy ranking
algorithm?
By pass this step for the end user
How to define a phenomenon?
Relevancy Ranking
• Search: Curation problem
• Data curation: Relevancy ranking service for a set of Earth science phenomena
18

Relevancy Ranking: Initial Exploratory Experiments
• Approaches tested: o O-Rank (Top down approach) o Wikipedia Terms o Manual Terms Experiment o Latent Semantic Index – Dual Set terms o Metadata based Ranking
• Key Takeaways: o Best results: three approaches where terms describing the
phenomenon manually constructed after exploring metadata records
o Both ontology and automated term construction (Wiki) approaches don’t map well to metadata terms/descriptions

Follow-on Experiments: Approach
20
USER TASK
INFO NEED
QUERY
SEARCH ENGINE
DOCUMENT COLLECTION
RESULTS
REFINE
Study “Hurricane”
All data sets useful in studying “Hurricane” How to
automatically formulate query?
Best relevancy ranking
algorithm?
How to define a phenomenon?
Expert select “bag of words” to
define a phenomena
Control vocabulary
(GCMD) is used for the “words”
Use well known alg: Jaccard Coef,
Cosine Similarity, Zone Ranking
Assumptions/Observations
• Metadata quality o Richness o Vocabulary o Tags
• Earth Science Phenomena can be defined using a bag of keywords
21

Experiment Setup
22

Top 20 returns (Hurricane)
23

Next: Find relevant data fields • Dataset is relevant
o now what? o how do I use the granules for the dataset?
• Need actual data variable name o for example: Giovanni uses these fields for visualization
• What we know o relevant science keywords (GCMD) – Experts o granule data fields and metadata – Auto extract*
• How do we map? o manually? May work for few datasets only
• Hundreds of data variables per granule o start with GCMD to CF Standard name o most don’t follow CF Standard names
24

Approach
25

Example: GLAS/ICESat L2 Global Thin Cloud/Aerosol Optical Depths Data (HDF5) V033 – Dataset Metadata

Example: GLAS/ICESat L2 Global Thin Cloud/Aerosol Optical Depths Data (HDF5) V033
Sample file: GLAH11.033/2006.10.25/GLAH11_633_2117_001_1275_0_01_0001.H5
Data Variables

Example: GLASICESat L2 Global Thin Cloud Aerosol Optical Depths Data (HDF5) V033
Science keyword to variable mapping • r_Surface_relh|Surface Relative Humidity
o No match
• r_Surface_temp|Surface Temperature o No match
• r_Surface_wind|Surface Wind Speed o No match
• r_cld1_od|Cloud Optical Depth at 532 nm o Score=3 keyword: ATMOSPHERE->CLOUDS->CLOUD OPTICAL DEPTH/THICKNESS o Score=2 keyword: ATMOSPHERE->AEROSOLS->AEROSOL OPTICAL DEPTH/THICKNESS
Variable to keyword mapping • ATMOSPHERE->CLOUDS->CLOUD OPTICAL DEPTH/THICKNESS
o Score=3 name: r_cld_ir_OD|Cloud Optical Depth at 1064 nm o score=3 name:i_cld1_qf|Cloud optical depth flag for 532 nm o Score=3 name:i_cld1_uf|Cloud optical depth flag for 532 nm o Score=3 name:r_cld1_od|Cloud Optical Depth at 532 nm o more with low scores
This approach can be used to assess metadata quality and also suggest keyword annotation!!

Part 3: Rules Engine

What Settings should I use to visualize this event?
Dataset?
Visualization Type?
Images from : http://globe-views.com/dcim/dreams/volcano/volcano-03.jpg , http://grecaira.users37.interdns.co.uk/essay/images/confused.png , http://disc.sci.gsfc.nasa.gov/datareleases/images/nldas_monthly_climatology_figure_9.gif
Data Variable
?
Goal:Automatedatapreprocessingandexploratoryanalysisandvisualiza;ontasks

Strategy • Service to generate and rank candidate workflow
configurations
• Use rules to make assertions about compatibility based on multiple factors
o does this data variable make sense for this feature?
o does this visualization type make sense for this feature?
o does the temporal / spatial resolution of this dataset make sense for this feature?
• Each compatibility assertion type is assigned weights.
o ex: Strong = 5, Some = 3, Slight = 1, Indifferent = 0, Negative = -1.
• Based on the aggregated compatibility assertions, we calculate the score for each visualization candidate.

Phenomena Feature Characteristic Mappings Phenomena East-
West Movement
North-South Movement
Temporal Evolution
Spatial Extent of Event
Year-to-Year Variability
May Impact Seasonal Variation
Variation with Atmospheric Height
Global Phenomena
Detection of Events
Volcano - Ash Plume
Indifferent
Indifferent Strong Slight Strong Strong Strong Strong Strong
Flood Some Some Strong Some Some Strong Some Slight Some
Dust Storm Strong Strong Strong Strong Indifferent Indifferent Strong Indifferent Some

Service to Characteristic Mappings Service Visualizatio
n East-West Movement
North-South Movement
Temporal Evolution
Spatial Extent of Event
Year-to-Year Variability
Seasonal Variation
Variation with Atmospheric Height
Global Phenomena
Detection of Events
Time-averaged
Map
Color-Slice Map ✓
Area-averaged Time Series
Time Series ✓ ✓
User-defined
Climatology
Color-Slice Map ✓
Vertical Profile
Line Plot ✓
Seasonal Time Series
Time Series ✓
Zonal Means
Line Plot ✓
Hovmoller (Longitude)
Color-Slice Grid ✓
Hovmoller (Latitude)
Color-Slice Grid ✓

Compute Compatibility
Phenomena: Volcano - Ash Plume
Service - Area Averaged Time Series
Area Averaged Time Series : bestFor →
Temporal evolution; Detection of events
Temporal Evolution
Detection of Events
Strong Strong
STRONG COMPATIBILITY
x2
Images from :http://i.dailymail.co.uk/i/pix/2010/05/18/article-1279221-09A0CCC4000005DC-385_634x433.jpg,http://disc.sci.gsfc.nasa.gov/datareleases/images/nldas_monthly_climatology_figure_9.gif,http://www.clipartbest.com/cliparts/biy/bAX/biybAXGiL.png

Next Steps • Generate rules for compatibility assertions
based on o data variables o temporal / spatial resolution o dataset processing
• Explore additional strategies for making compatibility assertions
Part 4: Image Retrieval Initial Results
36

Image Retrieval
37
• Goal: given an image of Earth science phenomenon retrieve similar images
• Challenge: “semantic gap” o low-level image pixels and high-level
semantic concepts perceived by human

Image retrieval approaches • Tradition approaches
o Image features: Color, Texture, Edge histogram… o “Shallow” architecture o User defines the feature o Preliminary experiments
• State of the Art approach o Generic o No need for domain expert
38

Deep Learning • Mimics the human brain that is organized in a deep
architecture • Processes information through multiple stages of
transformation and representation • Learns complex functions that directly map pixels to
the output, without relying on human-crafted features
39 Source: Google Research, CVPR 2014
Convolution neural network

Experiment Setup • NASA rapid response MODIS imageries • 600 imageries • 3 phenomena – Hurricane, Dust, Smoke/
Haze • Train half images with Convolutional Neural
Network • Test
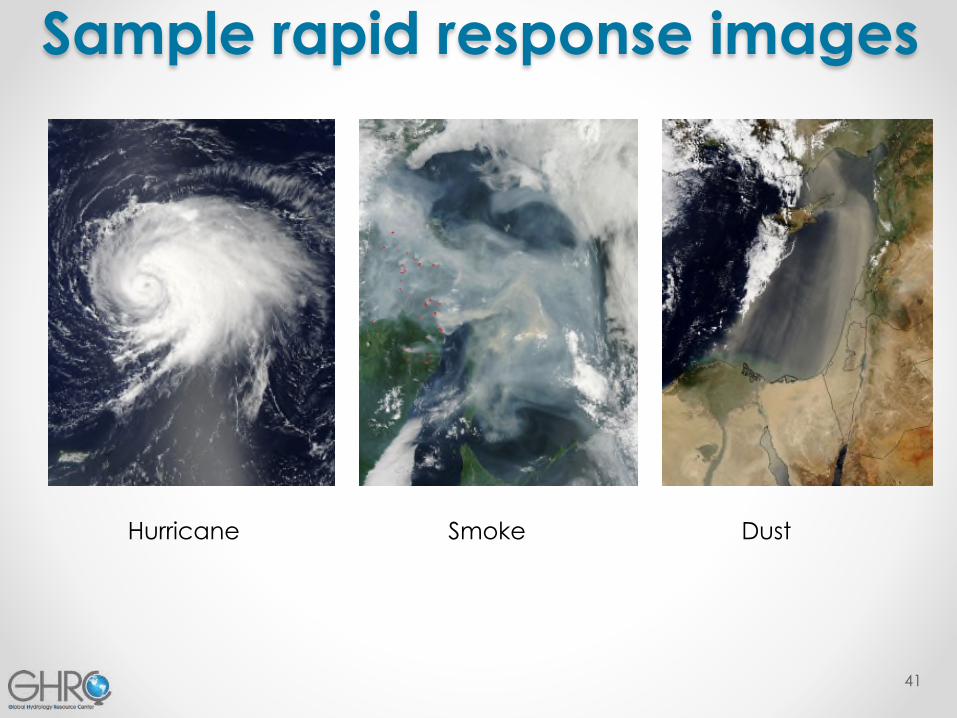
Sample rapid response images
41
Hurricane Dust Smoke

4 layers - Used number of filters in each layer = 100, 200, 400, 800
- Convolved and Pooled on every layer
- Overall accuracy ~ = as that of 5 layers (slightly better
than 6 layers)
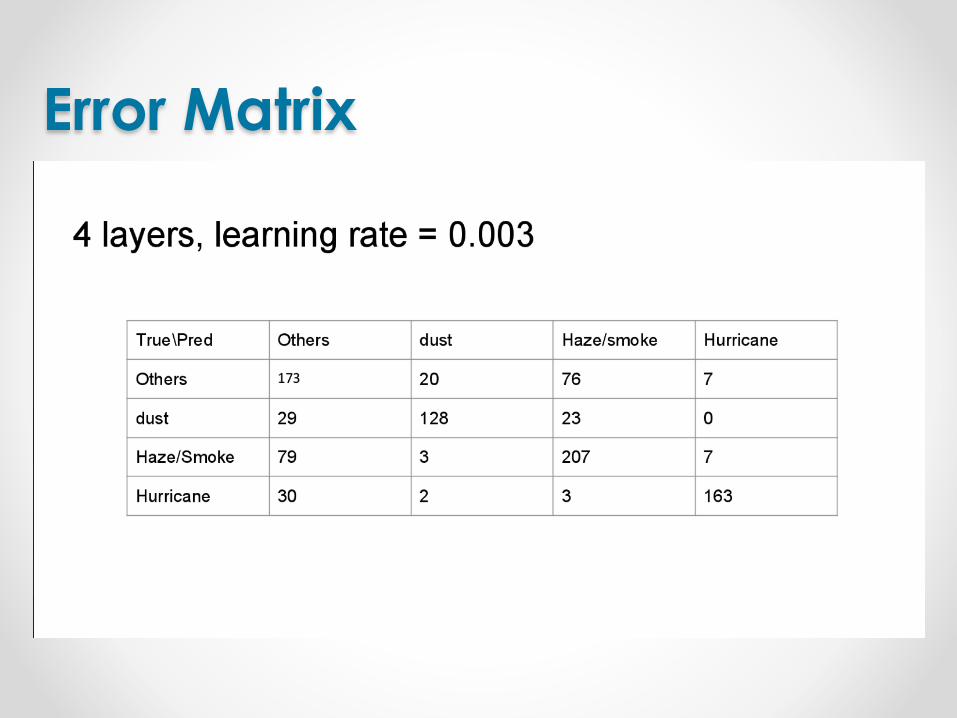
Error Matrix

Accuracy Numbers Producers Accuracy • Other: 173/311 = 55.6% • Dust: 128/153 = 83.7% • Smoke: 207/309 = 67% • Hurricane: 163/177 = 92.1%
Users Accuracy • Other: 173/276 = 62.7% • Dust: 128/180 = 71.1% • Smoke: 207/296 = 69.9% • Hurricane: 163/198 = 82.3%
Overall accuracy ~ 70.6%

Summary • Build three specific semantic middleware core
components o Image retrieval service - uses browse imagery to enable
discovery of possible new case studies and also presents exploratory analytics.
o Data curation service - uses metadata and textual descriptions to find relevant data sets and granules needed to support the analysis of a phenomena or a topic.
o Semantic rules engine - automates data preprocessing and exploratory analysis and visualization tasks.
45
Explore pathways to infuse these components into existing NASA information and data system