expert knowledge for computerized ecg interpretation jan alexander.pdf · expert knowledge for co:...
TRANSCRIPT

EXPERT KNOWLEDGE FOR COMPUTERIZED
ECG INTERPRETATION


EXPERT KNOWLEDGE FOR CO:MPUTERIZED
ECG INTERPRETATION
EXPERT-KENNIS VOOR GEAUTOMATISEERDE
ECG-INTERPRETATIE
Proefschrift
ter verkrijging van de gtaad van doctor
aan de Erasmus Universiteit Rotterdam
op gezag van de rector magnificus
prof.dr. C.J. Rijnvos
en volgens besluit van het College van Dekanen.
De openbare verdediging zal plaatsvinden op
woensdag 1 april 1992 om 15.45 uur
door
Jan Alexander Kors
geboren te Delft
v.f..Nersiteifs
~-('""" <)fi'UKKE0)
1992

Promotiecommissie
Promotor:
Co-promotor:
Overige !eden:
prof.dr.ir. J.H. van Bemmel
dr. G. van Herpen
prof.dr.ir. J.D.F. Habbema
prof.drir. A. Hasman
prof.dr. M.L. Sirnoons
Financial support by the Netherlands Heart Foundation for the publication of this thesis is
gratefully acknowledged.
ISBN 90-9004788-3

CONTENTS
Chapter 1
Chapter 2
Chapter 3
Chapter4
Chapter 5
Chapter 6
Chapter 7
Chapter 8
Chapter 9
Chapter 10
Summary
Samenvatting
Introduction
Multilead ECG Analysis
Classification Methods for Computerized Interpretation
of the Electrocardiogram
DTL: A Language to Assist Cardiologists in Improving
Classification Algorithms
Interactive Optimization of Heuristic ECG Classifiers
The Delphi Metlwd to Validate Diagnostic Knowledge in
Computerized ECG Interpretation
Reconstruction of the Frank Vectorcardiogram from Standard
Electrocardiographic Leads:
Diagnostic Comparison of Different Metlwds
Improvement of Diagnostic Accuracy by Combination of
ECG and VCG Computer Interpretations
Intrinsic Variability of ECGs Assessed by Computer Interpretation
Discussion
Curriculum vitae
Nawoord
1
9
31
47
77
87
103
119
131
149
155
161
167
169


CHAPTER 1
Introduction
1
This study was aimed at finding ways to improve the diagnostic performance of computer
progrnms for the intetpretation of the electrocardiogrnm (ECG) and the vectorcardiogrnm
(VCG). To that end, two main directions were explored. Fiist, we developed tools to facilitate
the translation of cardiological knowledge into computer algorithms. Second, we investigated
whether a better performance could be achieved by combining different sources of cardiological
knowledge. In doing this research, we had a special interest in improving our intetpretation
progrnm MEANS (Modular ECG Analysis System) [1,2].
In this chapter, we will briefly introduce the field of computerized ECG interpretation,
describe the difficulties in improving the performance ofECG computer progrnms, and indicate
the aims and scope of our investigations.
Computerized ECG interpretation
Computer interpretation of the ECG during rest staned in the early sixties, at that time on
bulky, inconvenient eqnipment [3,4]. Since then, large research efforts combined with
technological breakthroughs resulted in relatively inexpensive, portable electrocardiographs
which render an interpretation of the ECG almost instantly; a historical review was given by
Macfarlane [5].
ECG computer programs generally consist of a measurement pan and a diagnostic
interpretation pan [6]. The measurement pan takes care of data acquisition, artefact detection
and correction, wave detection, determination of onsets and ends of the various waves, and
computation of a set of measurements, such as wave amplitudes, durations, etc. Based on these
measurements, the interpretation part of the program generates a diagnostic (contour)
classification. Additionally, other types of classification may be provided, e.g., rhythm analysis,
Minnesota coding [7], and serial compatison of ECGs.
Two methods are currently being used for the construction of the classification parts of ECG
computer programs: a heuristic or deterministic one and a statistical one. In the heuristic
approach. the knowledge that a cardiologist uses in interpreting ECGs is elucidated and
incorporated in classification algorithms, usually in the form of decision trees. In the statistical
approach. a classifier is constructed from a learning set of labelled ECGs using multivariate
statistical techniques.
In this study, MEANS has been used to test and evaluate many of our ideas. When the
development of MEANS was staned, the analysis and interpretation of ECGs was split into
fourteen more or less self-contained tasks [8,9]. Each task was implemented as a separate
module. This modular set-up has over the years greatly facilitated the development, testing, and
maintenance of the system [10].
2

In the past, most research on MEANS has been devoted to the measurement part, the
rationale being that improving the classification part is only worthwhile if the measurement part
provides reliable and accurate measurements. We concluded that the measurement part was at
this level when we started the present study; evaluation results of most signal analysis modules
are reponed in Chapter 2 of this thesis.
The classification part of MEANS contains modules for contour classification of the ECG
and the VCG [11], rhythm classification [12], and Minnesota coding [13]. A heuristic approach
has been followed to develop these classification modules. The pros and cons of the heuristic
approach compared with the statistical approach are discussed in Chapter 3. Briefly, there axe
two main reasons why the heuristic approach was chosen: (1) The statistical approach requires
a very large validated database to construct a classifier. The collection of such a database was practically infeasible in our situation; (2) We wanted to be able to explain to cardiologists the
reasons for a particular classification made by the program. Heuristic classifiers are more fit to
provide such explanations than statistical classifiers.
Why computerized ECG interpretation?
The relative merits and deficiencies of computerized ECG interpretation depend on the role
of computers in the interpretation process. Computer involvement in interpreting ECGs can be
separated into four stages. In the first stage, electrocardiogtaphs are equipped with a computer
to perform quality control and determine and display a set of diagnostically important
measurements, i.e., the signal analysis part of an ECG computer progtaxn is on-line available.
In the second step, the intetpretation part of the ECG computer progtaxn is also implemented
in the electrocaxdiograph, providing automatic interpretation of the ECG shortly after it is
recorded. In a third stage, one or more electrocardiographs are connected to an ECG
management system. Such a system typically enables the on-line storage and retrieval of large
numbers of ECGs, provides overreacting facilities, and facilitates axchiving. In a fourth stage,
the ECG management system may be connected to other systems. e.g .• a hospital information
system. for the exchange of other patient data with departments within or outside the hospital.
Today. several biomedical industries offer systems which encompass the first three stages
mentioned above. Progress is being made in the definition of standards for the fourth stage [14].
Another recent development is the implementation of ECG computer programs on personal
computer systems that are equipped with dedicated hardware to record an ECG (ECG amplifiers
and AID conversion). These PC-based systems axe also able to provide much of the functionality
of ECG management systems.
3

The main advantages of computerized ECG interpretation are: (1) Improved quality control
of the ECG recording. Computer analysis enables, for example, baseline correction, removal of
mains interference, artefact detection, etc. (2) Time savings. The time spent by physicians and
clerical staff in interpreting and archiving ECGs may be reduced, mainly because ECG readers
only need to initial ECGs that were correctly interpreted by the computer and because the
storage and retrieval ofECGs, e.g., for serial comparison, is much easier. (3) Reduced inter- and
intraobserver variability. Computerized ECG analysis and interpretation does not suffer from
fa~"lle, time pressure, etc. Furthermore, observer variability may be reduced by the use of
standard reports and terminology. (4) Increased availability. A computer interpretation of the
ECG can be provided when there is no easy access to cardiological expertise, e.g., in rural
communities, or when a routine screening is performed. e.g., by general practitioners. (5)
Assistance to research projects. Specific patient groups are easily retrieved from a database of
ECGs. Other clinical data may then more easily be correlated with the ECG [15].
Computerized ECG interpretation may have the disadvantage that users will rely on it
uncritically which may result in deterioration of the quality of teaching electrocardiography. On
the other hand, ECGs which are interesting from a teaching point of view may easily be
retrieved. Furthermore. some computer programs explain a given classification by providing the
main criteria that were fulfilled.
These advantages and disadvantages are somewhat speculative as no pertinent data are
available. Furthermore, several of the advantages are conditional on adequate performance of
the interpretation program. For instance, time savings will only materialize when the computer
interpretations of most ECGs are acceptable for the cardiologist without requiring corrective
action. Computerized ECG interpretation in an environment where cardiological expertise is not
readily available will only be possible when the good quality of the diagnostic interpretation has
been proven.
Difficnlties in computerized ECG interpretation
In tltis paragraph, three problems are addressed that have to be dealt with when trying to
improve the diagnostic performance of an ECG interpretation program based on heuristic
knowledge.
Formalization of knowledge
Cardiological knowledge needs to be formalized in order to be implemented into computer
algorithms. Assunting that classification algorithms are represented by means of binaty decision
trees, three steps may be discerned in the forrualization process: (1) Selection of diagnostically
important measurements, e.g., the amplitude of a Q wave in certain leads, and definition of
4

standards, e.g., minimum wave requirements; (2) Specification of threshold values for
comparison with the measurements, the outcome of the comparison being true or false; (3)
Definition of a decision tree, structuring the decision criteria specified in the previous step.
This formalization process does not guarantee that the resulting classifier will be optimal
with respect to some performance criterion. In practice, the initially specified classifier is refmed
by trial and error, on the basis of expen knowledge.
Inter- and intraobserver variability
Cardiologists have been shown to exhibit considerable inter- and intraobserver variability in
their diagnostic classifications [16,17]. Such variability can partly be explained by differences
in training and experience. Therefore, an imponant issue in the development of heuristic ECG
classifiers is what cardiological knowledge will be translated into computer algorithms. In
practice, the most prevalent approach is to select one expert cardiologist who has proven to be
able to follow sound cardiological reasoning. Alternatively, one may try to combine the
knowledge of multiple cardiologists. At least two ways of combination can be envisaged, a
direct one and an indirect one. In the direct approach, cardiologists must make their knowledge
explicit and resolve any differences, e.g., by using a procedure aimed at finding a consensus.
In the indirect approach, different heuristic classifiers representing different sources of
knowledge are to be constructed. Such classifiers can then be combined, either by selecting
those pans which have proven to perform best, or by merging the classification results of
different classifiers into one 'combined' classification.
Evaluation
ECG classifiers are generally evaluated by assessing their performance on a test set of ECGs.
In order to avoid an optimistically biased outcome, the test set must be different from the
learning set which was used to train the classifier. Imponant choices in the evaluation of a
classifier are the reference against which performance is tested, and the kind of classification
output to be evaluated.
Two reference standards for performance testing of ECG classifiers have been used in the
past. One standard is based on visual inspection: a cardiologist judges the ECGs and hls
classifications are taken as the reference. Instead of one cardiologist, a panel of cardiologists
could judge each case and an aggregate or combined classification be derived. This approach
has been criticized because of its said lack of 'objectiveness' [18]. Therefore, several
investigators are proponents of a standard that is based upon ECG-independent evidence, such
as catheterization, autopsy, echocardiographic data, enzyme levels, etc.
ECG interpretive statements are generally distinguished into three different categories [6]:
type-A statements which refer to abnormalities that can be validated by ECG-independent
5

evidence (e.g., left and right ventricular hypertrophy, myocardial infarction); type-B statements
which denote abnormalities in the electrical conduction system of the heart and for which
criteria are derived from the ECG itself (e.g., conduction defects, arrhythmias); type-C
statements which are descriptive and do not relate to a specific diagnosis (e.g., non-specific
ST-T changes, axis deviations).
For long, the need for well-validated databases has been recognized [6,18]. An important and
influential effort in this respect has been made by the project 'Common Standards for
Quantitative Electrocardiography' (CSE), an international cooperative study for standardization
and evaluation of ECG computer programs [19]. In the framework of CSE, a database of 1,220
cases was collected, the cases being validated by means of ECG-independent clinical evidence.
Nine cardiologists also judged the cases, and a combination of their interpretation results served
as another yardstick [20]. In this study, the CSE database has been used as an independent test
set.
Aims and scope of this study
In this study, two main questions are addressed: (1) Can the time consuming and
cumbersome development and refinement of (heuristic) ECG classifiers be alleviated, and (2)
Is it possible to increase diagnostic performance of ECG computer programs by combining
knowledge from multiple sources?
Chapters 2 and 3 are of an introductory character. In Chapter 2, the measurement part of
MEANS is described and evaluated. This research largely depends on the earlier work of
Talman [11]. In Chapter 3, different methods of diagnostic ECG classification are described and
their pros and cons discussed. The issue is raised whether or not the ECG should be classified
using as much prior information as possible, and our position is made clear.
The first question~ how to ease the transfer of cardiological knowledge into computer
algorithms, is addressed in Chapters 4 and 5. The development and refinement of heuristic ECG
classifiers is impeded by two problems: (1) It generally requires a computer expert to translate
the cardiologist's reasoning into computer language without the average cardiologist being able
to verify whether his diagnostic intentions were properly realized, and (2) The classifiers are
often so complex as to obscure insight into their doings when a particular case is processed by
the classification program. To circumvent these problems. we developed a dedicated language.
DTL (Decision Tree Language), and an interpreter and compiler of that language. In Chapter
4, a comprehensive description of the DTL environment is given. In Chapter 5, the use of the
environment to optimize MEANS, following a procedure of stepwise refmement, is described.
6

The second question, whether it is feasible to combine knowledge from multiple sources in
order to increase diagnostic performance of an ECG computer program, is explored from several
perspectives in Chapters 6 tlrrough 9.
In Chapter 6, we investigated whether the Delphi method can be applied to increase the
agreement among multiple cardiologists, based both on their classifications and their reasons
for these classifications. It was hoped that the latter should reveal knowledge that would be
useful in improving the classification pan of MEANS.
In Chapters 7 and 8, we investigated whether the combined interpretations of the ECG and
the VCG classification pans of MEANS would yield a better result than that of either part
separately. A drawback of this approach is that a VCG must always be recorded in addition to
the ECG. Therefore, we studied different methods for reconstructing the VCG from the ECG
and evaluated their performance. This research is reponed in Chapter 7. The performance of the
combination of the ECG classification pan and the VCG classification pan - either processing
the original VCG or the reconstructed one - is given in Chapter 8, and the requirements for
improvement to occur, are discussed.
Yet another form of the multiple 'sonrces for knowledge' may be fonnd in the ECG itself.
In Chapter 9, we investigated whether the variability of separate complexes in the same ECG
recording exhibits information that is of diagnostic importance. Signal analysis techniques that
are used in today's ECG computer programs ignore or filter such information. We propose a
method which can take into acconnt the inttinsic variability of the ECG. In evaluating this
method with MEANS, we also assessed the stability of measurements and classifications.
References
[1] Kors JA. Talman JL. Van Bemmel JH. Multilead ECG analysis. Comput Biomed Res 1986;19:28-46.
[2] Van Bemmel.JH. Kors JA. Van Hcrpcn G. Methodology of the Modular ECG Analysis System MEANS.
Methods In£ Med 1990;29:346-53.
[31 Pipberger HV. Arms RJ. Stallmann FW. Automatic screening of normal and abnormal electrocardiograms by
means of a digital electronic computer. Proc Soc Exp Bioi Med 1961;106:130~2.
[4] Caceres CA. Steinberg CA. Abraham S, et al. Computer extraction of electrocardiographic parameters.
Circulation 1%2;25:356-62.
[5] Macfarlane PW. A brief history of computer-assisted electtocardiography. Methods lnf Med 1990;29:272-81.
[6] Rautahalju PM. Arict M. Pryor TA, et al. The quest for optimal electrocardiography. Task Force m: Computers in diagnostic electrocardiography. Am J Cardioll978;41:158~70.
[7} Blackburn H. Keys A. Simonson E. Rauraharju PM. Punsar S. The electrocardiogram in population studies.
A classification system. Circulation 1960;21:1160-75.
[8] Van Bemmel JR. Duisterhout JS, Van Herpen G. Bierwolf LG. Push-button VCG/ECG processing system.
In: Zywietz C, Schneider B. eds. Computer Application on EGG and VCG Analysis. Amsterdam: North~
Holland Pub! Comp, 1973:112-30.
7

[9] Talman JL, Van Bemmel JH. Modular software for computer-assisted ECG/VCG interpretation. In: Anderson
J, Forsythe JM, eds. Proc MEDINF0-74. Amsterdam: North-Holland Pub! Comp, 1974:653-7.
[10] Talman JL. Van Bemmel JH. The advantages of modular software design in computerized ECG analysis. Med
lnf 1986;11:117-28.
[11] Talman JL. Pattern Recognition of the ECG: A Structwed Analysis (Thesis). Amsterdam: Free University,
1983.
[12] Plokk:er HWM. Cardiac Rhythm Diagnosis by Digital Computer (Thesis). Amsterdam: Free University, 1978.
[13] Duisterhout JS, May JF, Van Herpen G. A computer program for classification of ECGs according to the
Minnesota code. In: Van Bemmel JH. Willems JL, eds. Trends in CompuJer-Processed Electrocardiograms.
Amsterdam: North-Holland Pub! Comp. 1977:345-9.
[14] Willems JL. SCP-ECG Project: Standard Communications Protocol for Computerized Electrocardiography.
Leuven: ACCO, 1991.
[15] Van Mulligen EM, Timmers T. De Leao BF. Implementation of a medical workstation for research support
in cardiology. In: :Miller RA, ed. Proc 14th Symposium on Computer Applications in Medical Care. Long
Beach: IEEE Comput Soc, 1990:769-73.
[16] Simonson E. Tuna N. Okamoto N. Toshlma H. Diagnostic accuracy of the vectorcardiogram and
electrocardiogram: A cooperative study. Am J Cardiol 1966~7:829-78.
[17] Koran LM. The reliability of clinical methods, data and judgments. Part two. N Engl J Med
1975;293:695-701.
[18] Pipberger HV, Cornfield J. What ECG computer program to choose for clinical application. The need for
consumer protection. Circulation 1973;47:918-20.
[19] Willems JL, Arnaud P, Van Bemmel JH, ctal. Common standards for quantitative electrocardiography:. Goals
and main results. Methods Inf Med 1990;29:263~71.
{20] Willems JL, Abreu-Lima C, Arnaud P. et al. Evaluation of ECG interpretation results obtained by computer
and cardiologists. Methods InfMed !990;29:308-16.
8

CHAPTER2
Multilead ECG Analysis
J.A. Kors, J.L. Talmon, J.H. van Bemmel
Department of Medical Informatics, Free University, Amsterdam, The Netherlands
Computers and Biomedical Research 1986;19:28-46
9

Abstract
This paper describes the results of our recent researcb in computer-assisted ECGNCG
interpretation. It comprises new developments which were initiated by the advent of relatively
inexpensive microcomputers. Our previous systems performed an off-line analysis of ECGs.
Currently, there is a trend to move computer power near to the patient and to provide on-line
analysis of ECGs. Besides the advantage of the direct availability of the ECG interpretation,
quality control will reduce the number of uninterpretable ECGs and hence the number of
repeated recordings. This paper describes the requirements that were established for a system
for on-line ECG analysis. The system is based on our modular approach, just like our off-line
system, Modular ECG Analysis System (MEANS). Changes in the methods and software had
to be made mainly because of the simultaneity of all ECG leads and the concurrency of the
processing tasks. Other modifications and extensions of the algorithms necessary to meet the
reqnirements of on-line ECG interpretation especially those related to processing speed, are
discussed, and evaluation results are presented.
10

Introduction
In the past, computerized ECG analysis was not integrated within the data acquisition station.
During the last few years, a number of systems have become commercially available which have
ECGNCG analysis software incorporated in the cardiograph itself. Only a few of them perform
vJrtually real-time ECGNCG analysis. For the other electrocardiographs, existing processing
systems as they were running on centralized computer facilities have been implemented on a
microcomputer system with the often overlaid program structure residing on floppy disks. In
such systems, the analysis starts just after data acquisition, resulting in a delay of one to three minutes between the completion of data acquisition and the printing of the analysis.
Such an approach is not a real step forward in computerized ECG analysis. The
disadvantages of off-line ECG analysis, such as the lack of quality control during data
acquisition and hence the less accurate analysis of noisy records, are transferred to the
electrocardiograph, and no attempt is made to improve the performance of such systems, e.g.,
by feedback to the techuician. Furthermore, these systems will in general analyze the four lead
groups, rather than take advantage of the fact that modern technology facilitates the recording
of the eight independent ECG leads simultaneously.
Our f'rrst experience in computerized ECGNCG analysis dates from the mid-1960s. In 1974
we reported on a modularly structured system for VCG/ECG analysis [1]. Several stages in the
development of the algorithms of this modular system were reported before. Among other
publications on our system, one can f'md descriptions of the QRS detection algorithm [2,3], of
artifact detection [4], of QRS typification [3,5], ofF-wave detection [6,7], and of the waveform
recognition procedure [8-10]. A complete description of the algorithms currently implemented
in our Modular ECG Analysis System (MEANS) together with an extensive evaluation of their
performance can be found in [11].
Recently, we started the development of an ECG analysis system to be integrated in an
electrocardiograph. We defined the starting points for such a development as follows:
- The system should be based on the algorithms which are used in MEANS because the good
performance of this system has been proven.
- The cardia graph should simultaneously record the eight independent leads of the 12-lead ECG
because this procedure may reveal yet-unknown diagnostic information. Both the phase
relations between the leads and the presence of isoelectric segments not seen in conventional
ECGs may be of diagnostic importance; for example, with respect to the diagnosis of inferior
myocardial infarction. Furthermore. such a recording technique will provide all information
simultaneously, so that for each processing step an optimal choice of leads can be made, and
hence the processing rime can be minimized while the performance is maximized.
11

-Processing should be done virtually in real time. This means that the electrocardiograph
should start writing the processed data and printing the analysis results as soon as possible
after the collection of a segment of reliable data is completed. In other words, the delay
between data collection and report generation should be on the order of seconds rather than
minutes. The processing speed should be such that the results of the interpretation should
become available on the same document as that on which the processed data are written.
- Extensive signal quality control should take place during data acquisition in order to be able
to guide the technician in the recording of ECGs of acceptable quality for analysis.
In order to meet the requirements of processing speed. it is essential that both the data and
the programs reside in central memory during analysis and not on an auxiliary storage device.
Funh=ore, speed is only obtained when a minimal number of operations on the signals is
performed. Our main concern has been to adapt the algorithms of MEANS in such a way that
only the essential parts remained, while a good performance is still achieved; this required, in
some instances, a compromise between what is theoretically possible and what is practically
feasible. Another way to obtain speed is to perform certain operations only on selected leads
rather than on all leads simultaneously. For example, when a cardiac event is detected in one
of a few leads, it may be assumed that it is present in all leeds. So, proper lead selection is of
importance as well
In the next section of this paper we discuss lead selection. Thereafter, some of the
modifications of the algorithms of MEANS are described, and finally we present the evaluation
results based on the 250 cases of the multilead CSE library [12], which were analyzed by both
MEANS and our multileed program.
Lead selection
It has been shown before [11] that algorithms for the detection and typification of QRS
complexes perform better for the VCG than for the conventionally recorded four lead groups
of the 12-lead ECG. The main reason for this is the dependency between leads. Lead groups
I-II-III and aVR-aVL-aVF, for example, do not display any electrical activity in the anterior
posterior direction, and hence abnormalities in the electrical activity in that direction are not
detected. This phenomenon is shown in Figure !. The abnortnal shape of the premature
ventricular beat is best seen in leads that point in an anterior direction.
When the VCG is not simultaneously available with the leads of the ECG, a better
performance of the detection and typification algorithms can only be achieved when the leads
of the ECG are recorded simultaneously, and when a more or less orthogonal set of leads is
12

1
I
II
Vl
V2
V3
V4
1 1 1 2 1 I
Figure 1. An example of a multilead EGG in which the extrasystole can best be distinguished from the
Mrmal complexes in leads Vl-V4. MEANS failed to typify the extrasystole as such in lead groups I-II-Ill
and aVR-aVL-aVF.
13

reconstructed or selected from the eight independent ones. It has been shown before by sevetal
research workers (see [13], for example) that considerable differences between original leads
and reconstructed ones will occur when general transformation coefficients are used. Others [14]
have shown that even with individual transformation coefficients, large reconstruction errors
may occur in some parts of the P-QRS-T complex. In addition, it takes quite a lot of
computational effort to generate such a lead set in real time. However, an exact reconstruction
of the waveshapes of the VCG is not our aim. The purpose of the lead selection is to have
'spatial' information of the cardiac events for detection and typification purposes.
For these reasons, we tried to find a set of three quasi-orthogonalleads out of the 12-lead
ECG that best represented the X, Y, and Z leads of the Frank VCG, instead of using some
general transformation matrix to derive a semi-Frank VCG from the 12-lead ECG. From the
multilead CSE library [12] in which the 12-lead ECG and the Frank leads are all recorded
simultaneously, the averaged QRS complexes of the 12-lead ECGs and of the Frank VCGs were
computed. The correlations between 10 amplitudes in the bandpass-filtered representative QRS
complex in each ECG lead and the three Frank leads were determined for each case. The
computation of the correlations is identical to that in the algorithm for the QRS typification of
MEANS [3]. Also, scaling factors between the bandpass-filtered complexes were determined
Table 1. The 10, 50, and 90 percentiles of the correlations between the QRS complexes in the VCG leads
and QRS complexes in. each of the 12 leads of the EGG.*
X y z
10% 50% 90% 10% 50% 90% 10% 50% 90%
I 0.58 0.96 0.99 -0.69 0.54 0.93 -0.71 026 0.90
II 0.10 0.84 0.98 0.63 0.98 0.99 -0.79 0.09 0.74
Ill -0.85 0.07 0.87 -0.09 0.87 0.99 -0.87 -0.17 0.77
aVR -0.99 -0.96 -0.72 -0.99 -0.89 -0,07 -0.86 -0.16 0.69
aVL -0.47 0.64 0.96 -0.93 -0.42 0.66 -0.84 0.17 0.90
aVF -0.53 0.62 0.95 0.60 0.98 0.99 -0.85 -0.03 0.73 VI -0.95 -0.71 0.08 -0.96 -0.58 0.42 -0.98 -0.86 -0.35 V2 -0.87 -030 0.70 -0.90 -0.43 0.52 -0.99 -0.92 -0.57
V3 -0.66 0.43 0.93 -0.80 0.06 0.83 -0.99 -0.91 -021
V4 -0.10 0.90 0.99 -0.53 0.61 0.93 -0.95 -0.56 0.43 vs 0.73 0.98 0.99 -0.24 0.73 0.97 -0.84 -0.13 0.71 V6 0.88 0.98 0.99 -0.02 0.83 0.97 -0.70 0.19 0.86
*These data were obtained from the 250 cases of the CSE multilead IJ.Orary [12].
14

by means of a least-squares fit procedure. Tables 1 and 2 give the results of this experimenL
The 10, 50, and 90 percentile values are given for the correlations and scaling factors,
respectively, for each combination of the three leads of the VCG and the ECG leads.
The best lead is found by taking the highest 50-percentile value (in the absolute sense) for
the correlation with the smallest range. It is clear that lead X is best represented by lead V6.
Although for leads Y and Z the correlations are more scattered, the selection of a lead from the
ECG could easily be made. Lead V2 gave superior results for lead Z as compared to the other
leads. For lead Y, two alternatives are available, namely II and a VF. The input system needs
only to record two extremity leads since the other four can be computed from these two. Two
out of leads I, II, and ill can be recorded by using one of the electrodes (in general the left foot)
as a reference. Leads a VR, a VL, and a VF need additional computations, and therefore lead II
was selected as a representation oflead Y. Later on, ouly the representative P-QRS-T complexes
of the four dependent leads are computed.
With respect to the scaling, it is clear that lead V2 has considerably more power than lead
z. resulting in a more favorable SNR, at least for the QRS complexes. Furthermore, by definition, its polarity is the opposite of the Z lead. In order to bring the magnitude of lead V2
in the proper range with respect to leads II and V6, a scaling factor of -'h is used.
Table 2. The 10, 50, and 90 percentiles of the scaling factors between the three VCG leads and the twelve
ECG leads.*
X y z
10% 50% 90% 10% 50% 90% 10% 50% 90%
I 0.62 1.69 3.03 -0.89 0.49 1.81 -4.08 1.65 9.88
II 0.04 1.11 2.28 0.42 0.80 1.15 -426 0.39 7.91 ill -2.00 0.03 1.72 -0.18 0.76 1.46 -852 -0.84 524
aVR -2.50 -158 -0.92 -1.78 -0.91 O.QI -9.42 -0.94 4.76
aVL -1.73 1.17 3.10 -226 -0.37 1.05 -7.62 1.60 11.64 aVF -1.10 0.75 2.52 0.45 0.90 1.47 -7.10 -0.10 7.46
VI -1.60 -0.60 0.06 -1.15 -0.30 030 -5.40 -2.81 -0.77 V2 -0.85 -0.18 0.54 -0.63 -0.14 025 -3.44 -223 -0.81 V3 -0.53 024 0.91 -0.40 0.02 052 -3.42 -2.11 -0.63 V4 -0.13 0.63 1.00 -0.23 021 0.72 -420 -1.04 0.95 V5 0.48 0.78 1.04 -0.13 0.33 0.94 -3.14 -0.01 323 V6 0.65 0.97 128 -0.08 0.43 1.00 -2.32 0.62 6.09
*Derived from the CSE multilead hOrary.
15

Sampling-rate reduction
Besides by a proper selection of the leads, the computational effort can be lessened by a
reduction of the sampling rate. In order to acquire accurate measurements for the rhythm and
the contour classification programs, the leads should preferably be sampled at a rate of 500/s
[15]. It is, however, not necessary to use all samples in the different processing steps. In
MEANS, the QRS and P-wave detection algorithms and the QRS typification procedure all work
on signals that are in sampling rate reduced to 100 Hz. In our multilead program, the sampling rate in the three quasi-orthogonal leads is also
reduced to 100 Hz. An 11-point, recursively progranuned moving averager is used. Apart from
tl;e lowpass·filtered output, the high-frequency residuals are also easily available. These high
frequency components are used in the artifact detection scheme described below. Since artifacts
can occur in each of the leads without a simultaneous distortion in the selected leads, artifact
detection must be performed in all leads. Therefore, the 11-point moving averageris applied to
each of the leads in order to obtain the high-frequency components for artifact detection while
the low-frequency components are only used in the three selected leads. Before storage of every
fifth sample of the lowpass-filtered signal of the selected leads, it is differentiated according to
y(i) = x(i) -xU -2)
in which x(l) is a 100-Hz sample of one of the leads.
QRS detection
The QRS detection of MEANS is basically an off-line detection procedure. It requites that
the complete signal is available and that all local extrema in the spatial velocity are determined
before the labelling of these extrema can be done [3].
In our on-line QRS detection algorithm, a pseudo spatial velocity is computed from the
quasi-orthogonal leads by taking the sum of the absolute values of the differentiated 100-Hz
signals. This pseudo spatial velocity is equivalent to the detection function used in MEANS. In
a leartting period of 1.6 s the maximum value of the spatial velocity is determined. This
extremum is considered to belong to a QRS complex and the threshold for the detection of the
next complex is set as a percentage of this maximum. An improved performance - in terms of
speed- of the detector is achieved by looking only for those local extrema in the spatial velocity
that exceed the detection threshold.
In order to be able to reject local extrema from P and T waves, the decision whether a local
extremum is from a QRS complex or not has to be postponed until no large local extrema are
16

found in a sufficiently long time interval. In order to make the real-time detector compatible
with the QRS detector in MEANS, the following ctiteria were used:
- When two extrema, both larger than the threshold., occur within 200 ms of each other, the
largest is taken and the other is discarded.
- When two extrema, both larger than the threshold, occur within 400 ms of each other, the
smallest of the two is discarded when its amplitude is less than 60% of the amplitude of the
largest one. Otherwise, the first extremum is considered to be a QRS complex.
Consequently. when no extremum has been found or when all extrema are eliminated within
an interval of 400 ms after a local extremum, that extremum can be labelled as resulting from
a QRS complex. After the detection of a QRS complex, the threshold for detecting QRS
complexes is updated. This threshold is set as a percentage of the average of the local extrema in the spatial velocity which were labelled as QRS complexes.
With the multilead CSE library, the number of false-positive and false-negative detections
were determined as a function of the threshold for the detection of QRS complexes (Figure 2).
This data revealed that the same threshold could be used as in the QRS detector of MEANS for
the VCG (about one-third of the average).
~ •• "'z :;.0 ~~ ,_>-~u
"'"' o>- •• o."' 0
"'w "'=--'~ o:,_
30 "-o: "-"' o"' z "'w w.,
20 ,_, ::., :E"-
0 z "' ••
p
p
p HHHH
HHHHHHNN
" p
" pppp
pp "
•• •• • ~ • • M a •
X OF PREVIOUS LABELLED EXTREMA
2:750 COMPLEXES
Figure 2. The number of false-positive (P)
and false-negative (N) detections as a
function of the threshold for accepting a
local extremum as QRS complex.
17

QRS typification
In MEANS, the reference points for the QRS typification and complex averaging are
determined in the bandpass-filtered QRS complexes of the 500-Hz signals. When such a
procedure is used for on-line analysis, the three quasi-orthogonal leads must be filtered twice:
once for detection and once for typification. Since one of our requirements was a high
processing speed, the performance of the typification algorithm using the differentiated 100-Hz
signals was investigated.
As will be shown shortly, a reliable QRS typification procedure based on 100-Hz samples
can be designed. An accurate reference point for complex averaging is determined from a small
portion of the 500-Hz signal in the vicinity of the approximate reference point found with the
typification algorithm.
According to the typification procedure of :MEANS, a reference point is determined for each
reference complex by searching for the largest of the extrema in the three differentiated leads.
Ten amplitudes in the differentiated 100-Hz signals for each QRS complex and for each lead
are used to compare the complexes. With the aid of a rough estimate of the onset and endpoint
of the QRS complex, the position of these amplitudes is determined in such a way that they
cover the reference QRS complex best. From these amplitudes. the same similarity measures
as in MEANS [3,16] are determined. These similarity measures, SIMJ and SIM2, reflect the
similarity in shape and power, respectively.
The major difference between MEANS and the on-line procedure is the resolution of the
reference point: 2 ms for MEANS but 10 ms for the on-line procedure. Due to this reduced
resolution. two complexes which are compared with each other may not be accurately aligned.
In Figure 3, an example is shown where a considerable shift in the reference point occurs due
to this reduced resolution. Aligning the complexes at the extreme values does not yield the
maximum correlation. in order to cope with this problem, the typification procedure was slightly
modified.
Similar to the procedure in :MEANS, a three-way classification scheme is used: two
complexes can either be similar or different or no definite decision can be made. For the latter
case, an additional test is performed when both similarity measures are not too far from the
region for the classification of similar complexes. When one of the sample points adjacent to
the reference point has an amplitude of at least 50% of the amplitude of the reference point,
either in the reference complex or in the complex that is compared with the reference complex,
both complexes are compared using such a point for alignment. When a shift is made, again the
three-way classifier is used. Only one relative shift to the left and one to the right is made.
18

..11 . ;I ,; ~ -A
A . ' " c' ' " ""--
j I r r -,
1 j L-L BANDPASS FILTERED COMPLEXES
II
l v: l l, l - :v .~\f.·
1 v ! :
"'V lJ
SIM1 SIH2
Figure 3. An example of an EGG in which the reduced accuracy of the reference point
results in a Mnoptimal alignment of the QRS complexes. The correlation as a function of
the shift between the two complexes shows that the maximwn value is not achieved at the
point where both extrema in the selected lead coincide.
Figure 4 shows the decision regions that are used in the real-time QRS typification
procedure. In order to have the procedure running in real time. a lot of bookkeeping is necessary
since a complex may either cenainly belong to one of the created classes or possibly belong to
(a subset of) the already created classes.
19

When a new incoming complex is assigned to a class, one has to compare all complexes that
possibly belong to that class with this newly classified complex. Also complexes which are
found to be similar to this new complex should serve as a reference complex for not-yet-labelled
complexes. Furthermore, when it is decided that one of the already processed complexes does
certainly not belong to the created classes, this complex can now serve as a reference for a new
class, and all not-yet-typified complexes have to be compared with this new class of complexes.
1.0 0.9 -
"' " ~ (1')0.4
.16
0.0
DIFFERENT
1\ \----\---S-Ht-FT0
SIM~ .195 0. 72 1.0
SIMl 2.0
Figwe 4. The decision region of the three-way classijr.er used in the real
time typification procedure.
Artifact detection
The real-time detection of artifacts is very important in on-line ECG analysis. When an
excessive amount of artifacts is detected, the technician should be given feedback about the
leads in which poor signal quality is present and be assisted in the recording of good quality
ECGs.
Of the commonly seen artifacts, powerline interference is routinely corrected using a filter
described in [17]. A more detailed analysis of this filter is found in [11].
Baseline sways are not detected in real time, except when the sample values are reaching
the maximum or min.imum amplitudes that the ND convenor can handle. The remaining
baseline wandering may be corrected in the beat averaging, using a linear correction procedure
[11]. Heavily disturbed ST-T segments are detected by means of the ST-T typification procedure
[11] and are not taken into account in the beat-averaging procedure.
The remaining types of disturbances are spikes and muscle artifacts. The high-frequency
disturbances are detected by using the residuals from the 11-point moving averager which is
20

also used for the sampling-rate reduction. An average of the absolute values of five consecutive
residuals is determined and stored in a delay line. The exponentially weighted sum of the
averages determines the amount of noise in a lead. The QRS complexes themselves also give
quite large residuals. It is even possible that these residuals become larger than those from too
noisy 1P segments. However, when a QRS complex is detected, one can skip the residuals of
the QRS complex and use only those from the signal segments between the QRS complexes in
the combination of the weighted average. Since there is a delay of 400 IDS between the
occurrence of a QRS complex and the time at which it is detected, a delay line of 500 IDS has
to be used, because a signal segment of 200 ms around the point where the QRS complex is
detected is discarded in the noise detection. A threshold of 35 )1 V proved to be an acceptable
threshold for the detection of excessive noise.
The noise-detection procedure operates on all eight leads. Whenever excessive noise is
detected in one or more leads. the data-acquisition program is reinitialized and the operator is
informed of the leads in which the noise occurs.
We suggested an off-line detection procedure for spikes that works reasonably well [11].
This procedure, however, requires a lot of computer cycles and hence is not suitable for on-line
application. However, spikes which are too small to trigger the QRS detector are sufficiently
detected by means of the noise-detection algorithm (see Figure 5 for an example).
ORIGINAL SIGNAL
-"\.,.. ;vJ ('AI """' /'.A rfv"J ~ ......, ,A
ESTIMATED NOISE
THRESHOLD ~
~ -- - - - J\ '-....... ~ -
Figure 5. An example of a spike that is detected by means of our detection
procedure for high-frequency disturbances.
21

Therefore, only those disturbances which give rise to false-positive detections have to be
dealt with. Since we may assume that each of such disturbances has a unique waveshape, one
can investigate those detected events that were given a nondominant label by the QRS
typification and that occur only once. Although such false-positive detections occurred only in
a few cases in the multilead CSE library, we established the criterion that an event occurting
only once must be considered an artifact when the maximum over the leads of the maximum
first derivative - in an absolute sense - in such an event is at least 2.5 times as high as the
maximum over the leads of the averaged values of the maximal derivatives of the dominant
complexes. The validity of this criterion was checked with the aid of the VCGs and ECGs of
data sets 1 and 2 of the CSE project.
P-wave detection
With respect to the P-wave detection, no changes were made in the algorithms of MEANS
[7,11]. During the development and subsequent improvements of the P-wave detector, much
attention was already given to speed and petfonnance. All preprocessing steps and all criteria
of MEANS as used for the VCG were implemented for the analysis of leads V6, IT, and -V2/2.
Waveform recognition
The estimation of the onsets and endpoints of the QRS complexes and P waves. as well as
the estimation of the endpoint of the T wave, can be done with the complete set of 8 or 12
simultaneous leads. It is known that the onsets and endpoints of the various components of the
P-QRS-T complex in different leads do not occur at the same instants. Using all leads for the
estimation of the earliest onset and latest end involves the use of highly redundant information,
and therefore early activity in only one or two leads may be considered noise because the
activity in the other leads stans later. It is to be expected that there will be some optimal
combination of leads for the wave recognition.
Without further research. the quasi-orthogonal lead set consisting of leads V6. II, and V2
- the latter divided by 2 - was chosen as the lead set for waveform recognition. The template
waveform-recognition procedures of MEANS [5,8,10] are also used in the multilead program.
Evaluation results
Our package for on-line ECGNCG analysis has been evaluated on the multilead CSE
library. This library consists of 250 simultaneously recorded ECG and VCG leads. The duration
of the recordings varies between 8 and 10 s. The four cases with artificial pacemaker pulses
22

were not taken into account for the evaluation results. These ECGs and VCGs were also
processed with MEANS. and hence a comparison between the performances of both systems
can be made.
QRS detection
Table 3 gives the evaluation results for the QRS detection procedures of both MEANS and
the multilead program. Although each lead group contains the same number of complexes,
differences in the total number of correctly detected and missed complexes may occur because the first and/or last complex in a lead group may be ntissed due to slight differences in the
reference points. Furthermore. there is also a small difference in the QRS detection routines of
MEANS and our multilead program with respect to the first and last time instant where a
complex may be detected. The missing of such a complex was, of course, not considered to be an error.
Table 3. Evaluation results of the QRS detection algorithm of MEANS and the mu.ltilead program..*
!!Ill! aVRLF VI V2 V3 V4 V5 V6 XYZ MULTI
Ref + + + + + +
+ 2831 10 2830 II 2845 0 2821 21 2845 2 2889 0
0 0 8 1 0
*ECGs and VCGs are of the multilead CSE hOrary.
It is clear that the multilead program performs very well in comparison with the performance
of the algorithm in MEANS in the four lead groups of the 12-lead ECG and even in comparison
with the performance for the VCG. The performance of the algorithm of MEANS for the VCG
is better than for three of the four lead groups of the ECG. The errors in the VCG were due to
the fact that one spike was falsely identified as a QRS complex and two interpolated ventricular
beats were missed.
QRS typification
Table 4 gives the evaluation results of the QRS typification algorithms for the various lead
groups. The errors of the multilead program occurred only in one record. fu this case, the wrong complex was labelled as the 'norrual' QRS complex (see Figure 6). In the analysis of the VCG
with MEANS, the first complex was also taken iuto account for the typification. Now, enough
complexes of the 'normal' type were detected to label them as such, although one type of
23

ventricular beat occurred more frequently. For the multilead program ouly two 'nonnal'
complexes were found and were given the label 3. Note that the performance of the multilead
program is better than the performance of MEANS in each of the lead groups of the 12-lead
ECG. The criteria used in the QRS typification were derived from another data set, and hence
the multilead CSE database served as a truly independent test set for this evaluation.
Table 4. Evaluation. results of the QRS typification procedure of MEANS for the jour lead groups of the 12-
lead ECG, the VCG, and the multilead program.
Ill ill aVRLF Vl V2 V3
Ref 1 2 3 4 1 2 3 4 1 2 3 4
TYPE 1 2592 9 0 2592 9 1 0 2649 2 0 0
TYPE2 3 59 0 0 3 54 0 0 3 65 0 0
TYPE3 1 0 8 0 1 2 7 0 1 1 6 0
TYPE4 1 0 0 0 0 0 0 0 0 0 0
V4 V5 V6 XYZ MULTI
TYPE l 2598 13 0 0 2696 0 0 0 2514 0 2 0
TYPE2 2 59 0 0 2 64 0 0 0 56 0 0
TYPE3 10 1 1 0 0 8 0 6 0 4 0
TYPE4 1 0 0 0 0 0 0 0 0 0
P-wave detection
The most interesting aspect of the evaluation of the P-wave detector is its performance in
the ECG as compared to the performance in the VCG. In our previous evaluation, the
performance for the lead groups of the 12-lead ECG was never considered because of the shon
duration (approximately 5 s) of those lead groups. The current data set, however, provides a
lead-group duration of 8 or 10 s. also when the data are formatted in the conventional way.
Table 5 gives the evaluation results of the P-wave detector. It is surprising to see that the
results for the multilead ECG are even better than those for the VCG. The only explanation for
these differences is that, in comparison with the VCG, P waves are more detectable in the
selected leads. This may be especially true for lead II, which is often used for the diagnosis of
atrial enlargement because of the considerable amplitude of the P wave in that lead.
24

-1 2 1 2 3 2 2
I
II
V1
V2
V3
V4
VS
V6
1 2 3 2 1 2
1 s
Figure 6. The only ECG of che multilead library in which the QRS typification proced!ue made an. error. Note that the 'normal' complexes were given labe/3.
25

Table 5. Evaluation results of the P-wave detector for the jour lead groups of the 12-lead. ECG, the VCG,
and the multilead program."'
IIIIII aVRlF VI V2 V3 V4 V5 V6 XYZ MULTI
Ref + + + + + +
+ 2152 17 2104 23 2121 48 1879 83 2143 50 2040 39
45 32 53 18 29 2
*Only cases in which no flutter waves were detected, were used in this evaluation.
The results presented in Table 5 are based on those cases in which no flutter waves were
detected. The pe:rformance of the flutter-wave detector does differ considerably for the different
lead groups. In the VCG, three cases were missed and one false-positive detection occurred. For
the mnltilead ECG, four false-positive detections were made and no false-negative ones. The
program seems to be more sensitive in a lead combination of V6, li, and V2/2 than in the VCG.
The number of cases in which real flutter waves are present is limited, and therefore the
collection of more multilead cases with flutter waves is necessary in order to have reliable
evaluation results for the flutter-wave detector.
Waveform recognition
Until now, there is no objective and generally accepted reference for the multilead CSE
library with respect to the waveform-recognition points. In order to assess the performance of
the waveform-recognition procedure for the multilead program in a more subjective way, the
following experiment was performed. The mnltilead ECGs were processed with our mnltilead
program. Subsequently, the averaged P-QRS-T complexes were formatted in the conventional
four lead groups of the 12-lead ECG. The waveform-recognition procedure of MEANS was then
applied to these lead groups and a comparison was made of the waveform-recognition points
found by both programs.
The aim of the mnltilead analysis is to find the earliest onset and the latest endpoint of the
different parts of the P-QRS-T complex. A first assessment of the achievement of this goal was
to make histograms of the differences between the waveform-recognition points found with
MEANS and the waveform-recognition points found with the multilead program. Figure 7 shows
the distribution of the differences between both programs, taking the multilead waveform
recognition points as a reference. It is clear that, in general, the assumption with respect to the
detection of the earliest onset is correct. In all lead groups except Vl-V3, the onset is on the
average later than in the mnltilead program, while in V 1-V3 the modus of the distribution is at
26

so r.
as
0
so
as
0
so r.
2S
0
so
as
0
ONSET QRS
N= 245
-s s I II III
N= 245
-s 0 s aVR ¢.UL aVF
N= 245
-s s Vl V2 V3
N= 245
-5 V4 VS VS
so r.
as
0
so %
2S
0
so %
as
0
so %
as
0
END QRS
N= 245
s
N= 245
s aVR aVL aVF
N= 245
Vl V2 V3
N== 245
5
VO
Figure 7. Histograms of the differences bezween the waveform-recognition points found
with the multilead program and tfwse found with MEANS in the various lead groups
of the 12-lead ECG. The mu.ltilead onsets and endpoinEs were taken as a reference.
Hence a positive difference indicates a point that is found at a later time insran.t than
with the multilead program.
zero difference and the variance is within acceptable limits. With respect to the endpoint of the
QRS, a different situation exists. The differences between the multi.lead program and MEANS
are much larger than for the onset points. The scatter in lead group Vl-V3 is extremely large.
A visual analysis of these cases reveals that this large scatter can be attributed to a specific type
of QRS complex in leads Vl-V2-V3. In Figure 8, a typical example is shown where two points
27

are candidates for the endpoint of the QRS complex. When we also take into account the
information of the other lead groups, it becomes clear that the first point is most likely the end
of the QRS complex.
-==
III
J I, IL I v
"J4 1
1fliv' v_j ul >-I I II Di 1
Figw-e 8. An example of an ECG in which the end of the QRS complex in lead group Vl-V3 is ambiguously
defined. Taking into account also the information of the other lead groups, the first point where a distinct change
of slope occurs seems to be the most likely point for the estimation of the end of the QRS complex.
In order to assess more quantitatively the performance of the waveform-recognition
procedure of the multilead program, those cases in which the onset point found with MEANS
was more than 4 ms earlier in at least one of the lead groups as compared with the result of the
multilead program as well as the cases in which the onsets found with MEANS were 4 ms later
in at least three lead groups as compared with the multilead onset were selected for visual
examination. This selection was made to identify those cases in which the multilead program
found the onset too late or too early, respectively. A similar procedure was used for the
endpoint estimates, but with a threshold of 8 ms. The selection criteria of 4 and 8 ms for onset
28

and endpoint, respectively, were both 2 ms less than the thresholds used by the referees of the
CSE project for differences between an individual reading, and the median of the readings of
the referees for the selection of cases that needed to be reviewed.
With the aid of this procedure, we identified four cases in which the onset found by the
multilead program was too early and eight cases in which the onset was too late. Of the latter
eight cases, four errors were due to the limitations of the template waveform~recognition
method. In the other four cases one or more leads showed earlier activity than the leads used
for the computation of the detection function. The endpoint estimate was too early in 7 cases.
In 20 cases this endpoint was too late. In the majority of the cases in which the endpoint was
too late, this was due to the fact that the endpoint in lead V2 was ill defined, as in the case
shown in Figure 8. With the aid of the referee waveform-recognition points for data set 1 of the CSE project
[18], we are currently trying to establish criteria for the identification of the problem cases such
as shown in Figure 8 in order to improve the performance of our waveform-recognition
procedure.
Summary and conclusions
We have described the modifications to MEANS, our modular ECG analysis system for off
line analysis, that were necessary to transform this system into a software package for real-time ECG analysis. The evaluation studies with the aid of the multilead CSE librnry have shown that
good performance is maintained, as compared with MEANS, and that for some modules the
performance appears to be improved.
The modularity of the software has been maintained. It has eased the development of the
modifications because both the structure of the system and the requirements, with respect to the
input and output of each of the modules, were again clearly defmed.
The modifications have been developed on a minicomputer. Hence no data are available as
yet on the true processing time of the different algorithms for a microprocessor implementation
of the system. Our current work is directed toward the implementation of the routines on a
microprocessor system. The performance of the prototype system will reveal whether a
multiprocessor approach is necessary.
Acknowledgment
We are grateful to J.L. Willems, Ph.D., coordinator of the CSE project for his permission
to use the multilead CSE librnry for our studies.
29

References
[!] Talman JL, Van Bemmel JH. Modular software for computer-assisted ECG/VCG analysis. In: Anderson J,
Forsythe JM, eds. Proc MEDINF0-74. Amsterdam: North-Holland Pub! Comp, 1974:653-7.
[2] Pronk RAF. Software QRS-wave detection of VCGs and ECGs. In: Progress Report 4. Utrecht: Institute of
Medical Physics-TNO, 1974:202-6.
[3] Talman JL, Hasman A- A new approach to QRS-detection and -typification. In: Ripley KL. Ostrow HG. eds.
Proc Computers in Cardiology 1982. Long Beach: IEEE Comput Soc, 1982:479-82.
[4] Kors J~ Talman JL. Hasman A- Artefact detection in routine ECG analysis. In: Roger FH,. Willems JL,
O'Moore R. Barber B, eds. Proc Medical Informatics Europe. Berlin: Springer-Verlag, 1984:243-8.
[5] Van Bemmel JH. Hengeveld SJ. Clustering algorithm for QRS and ST-T waveform typing. Com put Biomed
Res 1973;6:442-56.
[6] Hengeveld SJ, Van Bemmel JH. Computer detection of P waves. Comput Biomed Res 1976;9:125-32.
[7] Van Lingcn A, Talman JL, Hasman A. P-wave detection in routine ECG processing. In: Ripley KL. Ostrow
HG, eds. Proc Computers in Cardiology 1980. Long Beach: IEEE Comput Soc. 1980:53-7.
[8] Duisterhout JS, Van Bemmel JH. Hengeveld SJ. Adaptive wave-fonn recognition of VCGs by use of
amplitude-time windows. In: Rylant P, Ruttkay-Nedccky I, Schubert E. eds. Proc Xllth Intern Colloquium
Vectorcardiographicum. Brussels: Presses AcadCmiques EuropCennes, 1972:124-30.
[9] Van Bemmel JH, Talman JL, Duisterhout JS. Hengeveld SJ. Template waveform recognition applied to
ECG/VCG analysis. Comput Biomed Res 1973:6:430-41.
[10] Talmon JL, Van Bemmel JH. Template waveform recognition revisited: Results for the CSE database. In:
Ripley KL, cd. Proc Compulers in Cardiology 1983. Long Beach, IEEE Comput Soc, 1983:249-52.
[11] Talmon JL. Pattern Recognition of the EGG: A Structured Analysis (Thesis). Amsterdam: Free University,
1983.
[12] Willems JL. Common Standards for Quantitative Electrocardiography ~ 4th CSE Progress Report. Leuvcn:
ACCO,I984.
[13] WolfHK, Rautahalju PM, Unite VC. StewartJ. Evaluation of synthesized standard 12leads and Frank vector
leads. In: Abel H. ed. Advances in Car&logy (Voll6). Basel: Karger, 1976:87-97.
[14] Distelbrink CA. Van Bemmel JH, Ritsema van Eck HJ, Ascoop CA Linear transformation of a set of low
noise leads toward the Frank VCG: Validity of dipole approximations. In: Rylant P, Ruttkay-Ncdecky I,
Schubert E, eds. Proc Xllth Intern Colloquium Vectorcardiographicum. Brussels: Presses Academiques
Europeennes. 1972:108-15.
[15] Pipberger HV, et al. American Heart Association Committee Repon: Recommendations for standardization
of leads and of specifications for instruments in electrocardiography and vectorcardiography. Circulation
1975;52:11-31.
[16] Talmon JL, Hasman A. An evaluation of algorithms for QRS-typification. In: Lindberg DAB, Kaihara S, eds.
Proc MEDINF0-80. Amsterdam: North-Holland Pub! Comp, 1980:249-53.
[17] Mortara DW. Digital filters for ECG signals. In: Ostrow HG, Ripley KL, eds. Proc Computers in Cardiology
1977. Long Beach: IEEE Comput Soc. 1977:511-4.
[18] Willems JL. Common Srmuiards for Quantitative Electrocardiography - CSE Atlas: Referee Results First
Phase Library- Data Set 1. Leuven: ACCO, 1984.
30

CHAPTER3
Classification Methods for Computerized Interpretation
of the Electrocardiogram
J.A. Kors, J.H. van Bemmel
Deparnnent of Medical Informatics, Erasmus University, Rotterdam, The Netherlands
Methods of Information in Medicine 1990;29:330-6
31

Abstract
Two methods for diagnostic classification of the electrocardiogram axe described: a heuristic
one and a statistical one. In the heuristic approach, the cardiologist provides the knowledge to
construct a classifier, usually a decision tree. In the statistical approach, probability densities of
diagnostic features are estimated from a learning set of ECGs and multivariate techniques are
used to attain diagnostic classification. The relative merits of both approaches with respect to
criteria selection, comprehensibility. flexibility, combined diseases, and performance are
described. Optimization of heuristic classifiers is discussed.
It is concluded that heuristic classifiers are more comprehensible than statistical ones;
encounter less difficulties in dealing with combined categories; are flexible in the sense that new
categories may readily be added or that existing ones may be refined stepwise. Statistical
classifiers, on the other hand, are more easily adapted to another operating environment and
require less involvement of cardiologists. Funher research is needed to establish differences in
performance between both methods. In relation to performance testing the issue is raised
whether the ECG should be classified using as much prior information as possible, or whether
it should be classified on itself, explicitly discarding information other than age and sex, while
only afterwards other information will be used to reach a fmal diagnosis. Consequences of
taking one of both positions are discussed.
Key warda: ECG classification, optimization, gold standard
32

Introduction
The interpretation of the electrocardiogram (ECG) is a pattern recognition task. Computer
programs that perform this task consist of a measurement pan and a classification pan. In the
measurement part, the ECG signal is analyzed and features are extracted, i.e., a set of
measurements is computed containing all information that is necessary for classification. In the
classification part, a diagnostic interpretation is performed, i.e., based on the features a
classification procedure allocates the ECG to one or more diagnostic categories. The classification pan of ECG computer programs is the subject of this paper. The different
methods of diagnostic classification tbat are being used in computerized ECG interpretation will
be described and tbeir relative merits will be considered. Several issues related to the
optimization of diagnostic methods will be discussed.
Methods
Basically, two methods for diagnostic classification oftbe ECG can be discerned: a heuristic
one and a statistical one. In the heuristic approach one attempts to simulate the reasoning of the
cardiologist in interpreting the ECG. In the statistical approach multivariate statistical techrriques
are used.
Willems [I] has pointed out that the classification pans of most ECG computer programs
are a mixture of both approaches. Most programs that primarily use heuristic methods employ
uncertainty qualifiers for their main diagnostic categories. Statistical classification programs, on
the other hand, use heuristic knowledge to discriminate sets of disease classes prior to the
application of statistical techrriques.
Most ECG computer programs currently available predominantly use heuristic classification
methods. Table 1 gives the methods which are employed in programs participating in tbe CSE
study [2]. Some programs only analyze the vectorcardiogram (VCG). The classification metbods
to be described, however, are applicable to both tbe ECG and tbe VCG.
Heuristic approach
In the heuristic approach the objective is to simulate the reasoning and decision making of
a skilled cardiologist. Heuristic knowledge is provided by one or more cardiologists. Two
heuristic classification metbods will be described: decision-tree classifiers and fuzzy classifiers.
33

Table 1. Classification metlwds used by programs in the CSE diagnostic study.
program principal lead classification
investigators systemS method
AVA (USA) Pip berger VCG statistical
Glasgow (UK) Macfarlane ECG heuristic HES (D) Zywietz ECG+VCG statistical
HP (USA) Monroe ECG heuristic Leuven (B) Willems ECG statistical
Louvain (B) Brohet VCG heuristic Lyon (F) Arnaud. Rubel VCG heuristic Marquette (USA) Rowlandson ECG heuristic MEANS (NL) Van Bemmcl ECG+VCG hcwistic MEDIS (D) P6ppl ECG heuristic Nagoya (J) Olcljima, Ohsawa ECG heuristic Padova (J) Degani ECG heuristic
Porto (P) Abreu~Lima VCG heuristic
Decision trees
Decision trees are the most common type of classifiers for ECG interpretation. A decision
tree consists of a hierarchy of decision nodes which are connected by branches. Each node
contains a test, the outcome of which determines the branch to be taken. In its simplest form
the decision tree is binary, i.e., each decision node has only m·o descendants. The test usually
compares a feature value with a threshold. To classify an ECG, decision nodes are tested
sequentially, starting at the top node until a leaf is reached. Each leaf of the tree assigns the
ECG to a certain diagnostic category.
To express heuristic knowledge, representations other than decision trees may be used, for
instance decision tables or 'if-then' rules. These representations, however, can in principle all
be converted :o decision trees. In the following, therefore, only decision trees will be
considered.
ECG interpretation programs that use decision-tree type classifiers are often far more
complex than the above scheme suggests. First, in general not only one but many trees will be
constructed. It is often conceptually simpler to defme one or more trees for a specific diagnostic
class than having to take all classes into account in a single tree. Additional trees may be
required to deal with interactions if multiple categories are involved.
Second, the assignment to a class will often be qualified by an uncertainty statement.
Common qualifiers are: 'consistent with', 'probable' or 'possible'. In effect, since each qualified
34

category constitutes a separate category, the number of categories increases and thus the size
and complexity of the decision trees.
Third, decision nodes may contain tests which are more comprehensive than the comparison
of a feature value with a threshold. For instance, several simple threshold tests may be
combined by logical conjunctions and/or disjunctions, or the test may operate on a set of leads.
e.g., the Q duration should be greater than 20 ms in at least two leads from IL III or a VF. The
test may also have to execute special algorithms, e.g., a point scoring algorithm for the
determination of left ventricular hypertrophy.
Fourth, the heuristic classifier may contain procedural knowledge. Exclusion rules will often
be specified which inhibit certain categories in the presence of others.
The construction of a decision tree is generally guided by heuristics. No clear-cut rules are
available to select the tree structure, the features, and the threshold values. However, once the
tree structure 'md the featuies are selected, threshold values may be derived from a database of
ECGs, thus supplementing human experience [3,4].
Given a database of labelled ECGs and their featuie values, it is possible to generate
decision trees automatically. Algorithms exist which recursively partition the feature space
yielding a decision tree [5,6]. Talmon [7] used this technique to derive decision trees for the
typification of QRS complexes; it has not yet been used for the diagnostic classification of
ECGs.
Fuzzy classifiers
In expressing heuristic knowledge, cardiologists often use imprecise descriptions, e.g.,
"prolonged QRS duration" or "large Q wave". Zadeh [8] proposed a theoretical framework for
the classification problem in case of such fuzzy descriptions: fuzzy-set theory. A central notion
in this theory is the 'intensity~ with which an object belongs to a set. It is expressed by a
number, the degree of membership, which may vary between 0 (complete exclusion) and 1
(complete inclusion).
Fuzzy-set theory has also been applied to computerized ECG classification by Degani and
coworkers [9,10]. They distingnish three steps: (1) Transformation of featuie values in fuzzy
lingnistic terms resulting in a fuzzy description of the ECG; (2) Determination of the degree of
membership of the fuzzy description to each diagnostic category; (3) Ranking of the degrees
of membership in order to choose the best alternative.
Two types of heuristic knowledge need to be provided by a cardiologist. First, for the value
range of each feature three membership functions have to be specified: normal, borderline, and
abnormal. Second, tables have to be provided for each diagnostic category linking all possible
fuzzy descriptions of an ECG to three qualifiers of that category: present, possible, and absent.
35

The degree of membership of a description to a certain qualifier is specified in fuzzy tenns:
very low, low, medium, high, and very high.
Statistical approach
The main objective of the statistical approach is the allocation of an ECG to one of a set of
diagnostic categories with minimum probability of misclassification. This approach has been
advocated by Pip berger and coworkers [11-13]. They used linear discriminant analysis to arrive
at a seven-group classification.
More recently, Lesaffre and Willems [14,15] proposed a logistic discrimination procedure.
The main advantage of the logistic approach is that many different assumptions about the
distribution of the features are allowed.
Linear discriminant analysis
Let i' = (x1, ... , xp) denote the feature vector, g the number of diagnostic classes, and D, a
particular class. The g diagnostic classes are assumed to be exhaustive and mutually exclusive.
According to Bayes' rule the posterior probability of x belonging to class Di is given by:
P(D-Ix) = J;(x)P, ' Lf;(x)P;
(1)
j
in which_t;(x) is the probability density of the feature vector given diagnostic class D,, and P,
is the prior probability of class D,.
Assuming that the density functionsf.(x) are multivariate normal distributed with common
covariance matrix E, (1) reduces to
P(D-Ix) = 1
' 1 + 'I:" exp( -L.)P. £.. I I
(2)
with:
L, = (x-p.,)' E-'(x- p.,). (3)
The mean vectors Jl• and the covariance manix E are substituted by their corresponding
estimates from a database.
The probability of misclassification is minimized by assigning an ECG to the category for
which its posterior probability is largest.
36

Logistic discrimination
Now, let i' = (1, x1, ••• , x) denote the feature vector, g the number of diagnostic classes,
and D, a particular class. The g diagnostic classes are assumed "to be exhaustive and mutually
exclusive. The logistic approach to discrimination is to assume that the posterior probabilities
have the form
P(D, lx) =
with:
exp(o{x) T '
:£exp(aix) j
(4)
(5)
This assumption is satisfied by many distributions, including multivariate normal
distributions with equal and unequal covariance matrices and several families of distributions
of multivariate dichotomous variables [14,16]. Estimates of the parameter vector a are supplied
by a database of ECGs. Minimum probability of misclassification is attained by assigning an
ECG to the category for which the posterior probability is largest.
Comparison of methods
In the literature, a number of advantages and disadvantages of the above classification
methods have been put fotward [1,7,13,17,18]. Several items will be reviewed here and
discussed.
Criteria selection
Decision nodes in a heuristic classifier contain criteria which in their simplest form consist
of a feature value being tested against a threshold. The selection of criteria to be used by
heuristic methods remains somewhat arbitrary [1,13]. Criteria may have been proposed by a
single cardiologist or a group of cardiologists. However, ECG criteria are by no means
standardized, which may impede the acceptance of a certain set. On the positive side, the huge
experience with ECG classification~ which has been accumulated in the literature, is potentially
available for incorporation.
One of the aspects of the definition of criteria, the selection of features, is an imponant step
also in the design of statistical classifiers. Often, statistical techniques are used to determine the
most discriminating features [14]. However, judgmental knowledge of cardiologists is also used
to reduce the number of features [12,15].
37

Comprehensibility
Heuristic programs are designed to simulate the cardiologist's interpretation process. Thus,
the criteria employed are familiar to cardiologists. The classification of ECGs by these programs
is relatively easy to follow and comprehend [1]. Some programs provide the user with the most
relevant criteria that were fulfilled in a particular classification [17]. Statistical programs, on the
other hand, provide Jess insight in the classification procedure. To improve the
comprehensibility of their statistical classifier, Manhes et a!. [19] developed an interactive
analysis package. The user may request the values of important features used in the
classification and compare them with the values that were used in training the classifier.
Furthermore, discriminant values are shown and the relative importance of the features
contributing to the final classification is indicated. However, considerable statistical knowledge
will still be needed to appreciate the information provided by the system. This approach seems
to be most worthwhile as a tool in program development.
Flexibility
Modification and maintenance of heuristic programs is relatively easy [17]. They may be
refined step by step [7]. Statistical programs have to be based on a large database of ECGs. A
modification necessitates the recompilation of the entire material. Direct involvement of
cardiologists, however, is much less. Once a database has been acquired, construction of the
classifier is straightforward.
Statistical classifiers may readily be adapted to another operating environment, for instance,
when changing from a cardiological clinic to a health-screening situation. Only prior
probabilities pertaining to the new situation need to be inserted, assuming that the conditional
probabilities remain the same.
Combined diseases
An ECG may exhibit symptoms of more than one diagnostic category, e.g., hypertrophy and
infarction may both be present. In principle, combinations of diagnostic categories present no
problem to either heuristic or statistical methods. Since the latter. however, assume the
categories to be mutually exclusive, combined diseases have to be handled as separate
categories. This straightforward solution is often impracticable because the number of categories
then increases exponentially. As a result, the size of the database to construct the classifier soon
becomes prohibitive, let alone the difficulty of acquitiug enough ECGs for each category.
Statistical programs, therefore, are limited to the classification of a restricted number of
categuries, typically left, right, and hi-ventricular hypertrophy; anterior, inferior, and mixed
myocardial infarction; normals [15].
38

Peiformance
Performance testing ofECG interpretation programs is an intricate subject. Many difficulties
and subtleties have to be resolved, which includes the establishment of a gold standard, mapping
the output of different programs to a common set of categories, the choice of appropriate test
statistics, and the composition of the test database. These topics are discussed in other
publications [20,21]. We will only touch upon these problems as far as they are relevant for the
comparison of statistical and heuristic classification methods.
There are two important aspects of performance testing of ECG interpretation programs:
accuracy and precision. Accuracy is a measure for the correct classification rate. Precision deals
with the stability of the classification when the input data are perturbated.
The main motivation for using statistical methods is their promise of having an accuracy
surpassing the human interpreter [11,14]. The classifier has to be constructed using a database
of ECGs which have been validated by ECG-independent evidence. Heuristic programs, on the
other hand, are directly based on knowledge from cardiologists. The highest accnracy attainable
will then be that of cardiologists.
Numerous studies have been conducted to evaluate the performance of ECG computer
programs. In only a few studies, a comparison was made between heuristic and statistical
programs [1,15,18,22]. Generalization of the results of these studies is difficult since only two
or three programs were involved. Furthermore, the databases used in the comparison generally
were not available to others or difficult to transfer. Therefore, the establishment of a large well
documented database in the CSE project is very much to be welcomed. For the first time, an
independent yardstick is available to measure the performance of all interpretation programs
currently available. More pertinent results on the accuracy of programs using either
classification method may then be expected. Preliminary results of a pilot study on a well
validated database of 250 ECGs suggest that the performance of the statistical programs is
similar to those of the best heuristic programs [2]. It should be remarked, however, that
statistical programs might have been favored because almost all cases in the database were
single-disease ECGs.
The stability of statistical programs has been claimed to exceed those of heuristic programs,
the reason being that all features are considered simultaneously [!]. In heuristic programs a
small change in a feature value at a critical threshold might result in a different classification.
Several studies reported on stability experiments [23-26]. The influence of varying conditions
was tested, e.g., interpreting different periods of the same recording, resampling, adding noise,
and changing the measurement set. Only a limited number of programs was compared. Although
the statistical classifiers proved to be more stable than the heuristic ones, Dudeck [25] and
Helppi et a!. [26] also noticed large differences in the posterior probabilities of statistical
programs due to small input disturbances.
39

Optimization
Optimization of a classification algorithm assumes the existence of an optimization criterion.
In the design of a statistical classifier this criterion is the misclassification rate. On the basis of
a learning set of ECGs a classifier is determined which minimizes the probability of error. As
the number of ECGs in the learning set is a subset of the universe of ECGs, the resulting
classifier is an approximation of the (Bayes) optimal classifier [27]. Optimization in this context
consists of the construction of classifiers on the basis of ever-increasing sets of ECGs. Contrary to the formal way of designing statistical classifiers, the development of heuristic
classifiers is often a process of trial and error. Based on the experience of one or more
cardiologists, a classifier is constructed which is subsequently tested on a database. This test
may suggest improvements which again are tested on the same or another database.
Although conceptually simple, this process of stepwise refmement may face considerable
practical difficulties. The most important one stems from the difference between the knowledge
as expressed by a cardiologist and the actual implementation of this knowledge in a computer
program. In general, cardiologists will not be able to understand computer prograntS. Even if
a high-level computer language is used, a computer expert will be needed to intermediate
between the cardiologist and the program [28].
Several tools have been developed to aid the program developer. Hewlett Packard developed
a language specifically fit for the representation of cardiological knowledge: ECL (ECG Criteria
Language) [29]. Criteria in ECL can be read and written by the cardiologist himself. A compiler
translates the ECL statements and incorporates them in the interpretation program. Laks [30]
reported good experiences in using this language. Rubel et al. [31] also described a special
diagnostic language. They used the system for the interpretation of VCGs. Both approaches
taclde the representation problem; the classification part essentially remains a black box. This
may not be a problem if the classifier is simple. However, heuristic classifiers may become
quite intricate, as described above. To provide insight in the actual classification, Kors et al.
developed a decision-tree language (D1L) which may be interpreted, as well as compiled [32].
The interpreter contains comprehensive tracing and debugging facilities, e.g., setting of
breakpoints, a step mode, a verbose mode, and on-line modification of measurements and
algorithms.
40

Discussion
ECG computer programs have always been evaluated with respect to their performance.
However, performance is only one, albeit important, aspect, Others include comprehensibility,
flexibility, and the handling of combined categories. These aspects are of a more qualitative
nature, which impedes objective comparison. Doubtlessly, heuristic classifiers are more
comprehensible than statistical ones. They encounter less difficulties in dealing with combined
categories and are flexible in the sense that new categories may readily be added or that existing
ones may be refined stepwise. Statistical classifiers, on the other hand, are more easily adapted
to another operating environment by changing the prior probabilities. Once a database has been
acquired, involvement of cardiologists in the construction of the classifier is much less.
The accuracy of the statistical and heuristic approaches is difficult to compare. These
difficulties are due to the limited number of ECG computer programs which were examined in
studies on this subjeCt, the wide range in accuracy of programs that use the sarue approach [21],
and methodological problems [20,21]. More pertinent answers to differences in accuracy are to
be expected from the final results of the CSE diagnostic study.
An important performance aspect is the sensitivity of the classifier to small disturbances in
its input data. Statistical classifiers have been claimed to be more stable than heuristic ones, but
the few experiments in this respect were rather ad hoc and did not allow to draw any general
conclusions. Further research in this area is needed. The claim that statistical classifiers are able to attain a higher accuracy than heuristic ones
is, in our opinion, related to a more fundamental issue. The question is this: Should the ECG
be classified using as much prior information as possible, or should the ECG be classified on
itself, explicitly discarding information other than age and sex, while only afterwards other
information will be used to reach a final diagnosis? Taking one of both positions has
considerable consequences for the evaluation of ECG computer programs.
If the former position is held, the gold standard for the evaluation of ECG computer
programs should be a database of ECGs which are validated by ECG-independent evidence. If
the latter position is held, such a database is of value for testing the program's ability to reach
a final diagnosis on the basis of the ECG alone. However, one would also be interested. to know
the capability of the program to reach a valid classification when the ECG is interpreted without
reference to other information. In that case the gold standard has to be based on the ECG alone
and should be provided by cardiologists.
Figure 1 will be used to comment on both positions. It shows the relations between the
entities involved: ECG, ECG-independent evidence, validated databases, and computer
interpretation. Taking the second position, ECGs are validated without explicit reference to
ECG-independent information. However, criteria used to perform this validation will implicitly
41

be based on ECG-independent evidence (link b in Figure 1), i.e., the criteria were ultimately
derived from clinical studies relating physical disorders to the ECG.
(d)
ECG-independent evidence
(a)
validated ECGs
(e)
(I)
' ' ' ' ' ..... (b) ', ',
' ' ' ', ' '
ECG
(c)
(t)
computer interpretation
(2)
Figure 1. Entities involved in two positions held in computerized ECG interpretar.ion.
Position 1: The ECG should be classified using EGG-independent information;
position 2: The ECG should be classifr.ed without reference to EGG-independent
information, apart from age and sex. The links (a)-(j) are described in the text.
Objections against the second position concentrate on the inter- and intraobserver variability
of cardiologists (link c). The classical study of Simonson et al. [33] showed these variabilities
to be substantial. To reduce the interobserver variability one could follow a Delphi review
process [34,35]. This approach was taken in the CSE project to determine a gold standard of
fiducial points to test the waveform-recognition algorithms of the programs. Recently, Kors et
al. [36] used a Delphi procedure to increase the agreement of five cardiologists on diagnostic
classifications. Alternatively, one could combine the classifications of a board of cardiologists
[2]. The accuracy of the combined referees has proven to be higher than any of the individual
cardiologists or prognuns.
42

The problem of inter- and intraobserver variability also applies to tests that are used to
establish a gold standard based on ECG-independent evidence (link a in Figure 1). For instance,
definitions on infarct location or on what constitutes hypertrophy are by no means standardized.
Statistical classifiers have mainly been developed using a database of ECGs validated by
ECG-independent evidence (link e) [12,14,15]. Pipberger [13] advocated the use of additional
information in computerized ECG interpretation (link d). He distinguished different sets of prior
probabilities for the various diagnostic categories. Depending on the clinical history of a
particular patient, the appropriate set of priors is to be chosen for subsequent analysis.
Heuristic classifiers by their very nature are constructed without explicit reference to a
database validated by ECG-independent evidence (link f). ln fact, it is hard to imagine how
ECGs of patients having a disorder that could only be verified by ECG-independent means, may
help a cardiologist in the construction of a heuristic classifier.
In our opinion it is worthwhile to evaluate ECG classification methods with a database that
is validated both by ECG-independent evidence and the combined opinion of a board of
cardiologists. An evaluation that uses the former validation provides insight in the capability of
the ECG to serve as a stand-alone test, whereas the latter validation tests the clinical
acceptability of an ECG classification method.
References
[1] Willems JL. Introduction to multivariate and conventional computer ECG analysis: Pro's and contra's. In: Van
Bemmel.JH. WillemsJL, eds. Trends in Compwer-ProcessedElectrocardiograms. Amsterdam: North-Holland
Pub! Comp, 1977:213-28.
[2] Willems JL. Abreu-Lima C, Arnaud P, ct al. Testing the performance of ECG computer programs: The CSE
diagnostic pilot study. J Electrocardioll987;20:Suppl:73-7.
[3] Macfarlane PW. Watts MP. Podolski M. Shoat D. Lawrie TDV. The new Glasgow system. In: Willems JL.
Van Bemmel JH, ZywielZ C, eds. Computer ECG Analysis: Towards Standardization. Amsterdam: North
Holland Pub! Comp, 1986:31-6.
[4} Talman JL. Van Hcrpen G. Quantitative classification of T-wavc abnormalities in the VCG. In: Abel H. ed.
Advances in Cardiology (Vol 16). Basel: Karger. 1976:233-6.
[5] Brciman L. Friedman JH. Olshen RA. Stone CJ. Classlfteation and Regression Trees. Belmont: Wadswonh. 1984.
[6] Talman JL. A multiclass nonparametric partitioning algorithm. In: Gelsema ES, Kana1 LN, eds. Pattern
Recognition in Practice If. Amsterdam: North-Holland Publ Comp. 1984: 449-59.
[7] Talman JL. Pattern Recognition of the ECG: A Structured Analysis (Thesis). Amsterdam: Free University.
1983.
(8] Zadeh LA. Fuzzy sets as a basis for a theory of possibility. Fuzzy Sets and Systems 1978;1:3-28.
[9] Degani R. Pacini G. Linguistic pattern recognition algorithms for computer analysis of ECG. Proc Biosigma
1978, 18-26.
43

[10] Bortolan G, Degani R. Comparative evaluation of three models of fuzzy decision-making in
electrocaxdiogrnphy.ln: Van Bemmel lH, Ball MJ, Wigertz 0, eels. Proc MEDINF0-83. Amsterdam: North
Holland Pub! Comp. 1983:537-40.
[11] Pipberger HV, Dunn RA. Cornfield J. Fll'St and second generation computer programs for diagnostic ECG
and VCG classification. Proc XII thl nrem Colloquium Vectorcardiographicum. Brussels: Presses Acad6miques
Europ6ennes, 1972:431-9.
[12] Cornfield J, Dunn RA. BalChlor CD. Pipberger HV. Multigroup wagnosis of electrocardiograms. Comput
Biomed Res !973;6:97-120.
[13] Pipberger HV. McCaughan D, Littman D, et al Clinical application of a second generation
electrocardiographic computer program. Am J Cardiol1975;35:597-608.
[14] Lesaffre E. Logistic Discriminant Analysis wilh Applications in Electrocardiography (Thesis). Leuven:
Catholic University, 1986.
[15] Willems JL, Lesaffre E. Pardaens J, De Schreye D. Multi.group logistic classification of the standard 12- and
3-lead ECG. In: Willems JL, Van Bemmel JH, Zywietz C, cds. Computer EGG Analysis: Towards
Standardizatum. Amsterdam: North-Holland Pub! Comp, 1986:203-10.
[16] Anderson JA. Separate sample logistic discrimination. Biometrika 1972:59:19-35.
[17] Bailey JJ. Horton M. Advantages of automation ofECG analysis with conventional (heuristic) criteria. In: Van
Bemmel JH. Willems JL, eds. Trends in Computer Processed Electrocardiograms. Amsterdam: North-Holland
Pub! Comp, 1977:221-8.
[18] Brohet CR. Robert A. Derwael C, et al. Computer interpretation of pediatric orthogonal electrocardiograms:
Statistical and deterministic classification methods. Circulation 1984;70:255-63.
{19] Matthes T, GOttsch G. Zywietz C. Interactive analysis of statistical ECG diagnosis on an intelligent
electrocardiograph. In: Willems JL. Van Bemmel JH. Zywietz C~ eds. Computer ECG Analysis: Towards
Standardization. Amsterdam: North-Holland Pub! Comp. 1986:215-20.
[20] Michaelis J, Wellek S, Willems JL. Reference srandards for software evaluation. Methods Inf Med
1990;29:289-97.
[21] Willems JL. Abreu-Lima C. Amaud P. et a1. Evaluation of ECG interpretation results obtained by computer
and cardiologists. Methods lnf Med 1990;29:308-16.
[22] Bourdillon PJ, Kilpatrick D. Clinicians. the Mount Sinai program and the Veterans' Administration program
evaluated against clinico-pathological data derived independently of the electrocardiogram. Eur J Cardiel
1978;8:395-412.
[23] Bailey JJ, Horton M. Itscoitz SB. A method for evaluating computer programs for electrocardiographic
interpretation. m. Reproducibility testing and the sources of program errors. Circulation 1974;50:88-93.
[24] Bailey JJ, Horton M. Itscoitz SB. The importance of reproducibility testing of computer programs for
electrocardiographic interpretation: Application to the automatic vectorcardiographic analysis program (AVA
3.4). Comput Biomed Res 1976;9:307-16.
[25] Dudeck J. Reproducibility of diagnostic statements in first and second generation ECG programs. In: Willems
JL, Van BemmelJH, Zywietz C. eds. Computer ECG Analysis: Towards Standardization. Amsterdam: North
Holland Pub! Comp, 1986:235-1!.
[26] Helppi RR, Unite V, Wolf HK. Suggested minimal performance requirements and methods of performance
evaluation for computer ECG analysis programs. Can Med Assoc J 1973;108:1251-9.
[27] Toussaint GT. Bibliography on estimation of misclassification. IEEE Trans Info Theory 1974;20:472-9.
44

[28] Jenkins G. Clifton J, Laks Mld. The communication problem between the computer programmer. the
electrocardiographer and the ECG computer. In: Tolan GD, Pryor TA,. eds. Computerized lnterprezarion. of
the ECG IV. New York: Engin Foundation,. 1979:148-61.
[29] Balda RA. Vallance AG, Luszcz lM. Stahlin FJ, Diller G. ECL: A medically oriented ECG criteria language
and other research tools. In: Ostrow HG. Ripley KI... eds. Proc Computers in. Cardiology 1978. Long Beach:
IEEE Comput Soc. 1978:481-95.
[30] Laks :rv.tM. Experiences with electrocardiographic computer languages in the development of ECG criteria.
In: Tolan GD. Pryor TA,. eds. Computerized Interpretation. of the ECG V. New Yorlc: Engin Foundation,
1980:153-78.
[31] Rubel P, Arnaud P, Prevot D. Systeme d'aide a 1a decision. Application a l'interpr6ration automatique des
vectocardiogrammes. Int J Biomed Comput 1975;6: 193-211.
[32] Kors JA, Kamp DM. Snoeck: Henkemans DP, Van Bemmel JH. DTI..: A language to assist cardiologists in improving classification algorithms. Comput Methods Programs Biomed 1991;35:93-110.
[33] Simonson E, Tuna N. Okamoto N, Toshima H. Diagnostic accuracy of the vectorcardiogram and
electrocardiogram: A cooperative study. Am J Cardiol1966;17:829-78.
[34] Linstone HA, TuroffM. The Delphi Method: Techniques and Applications. Reading: Addison-Wesley, 1975.
[35] Kors JA. Van Remmel JH. The Delphi method: A review of its applications in medicine. In: Barber B, Cao
D. Qin D. Wagner G, eds. Proc MED/NF0-<39. Amsterdam: North-Holland Pub! Comp. 1989:156-60. [36] Kors JA, Sittig AC, Van Bemmel JH. The Delphi method to validate diagnostic knowledge in computerized
ECG nuerpremtion. Methods lnf Med 1990:29:44-50.
45


CHAPTER4
DTL: A Language to Assist Cardiologists in Improving
Classification Algorithms
J.A. Kors, D.M. Kamp, D.P. Snoeck Henkemans, J.H. van Bemmel
Department of Medical Informatics, Erasmus Uttiversity, Rotterdam, The Netherlands
Computer Methods and Programs in Biomedicine 1991;35:93-110
47

Abstract
Heuristic classifiers, e.g., for diagnostic classification of the electrocardiogram, can be very
complex. The development and refinement of such classifiers is cumbersome and time~ consuming. Generally, it reqlrires a computer expert to implement the cardiologist's diagnostic
reasoning into computer language. The average cardiologist, however, is not able to verify
whether his intentions have been properly realized and perform as he hoped for. But also for
the initiated, it often remains obscure how a particular result was reached by a complex
classification program.
An environment is presented which solves these problems. The environment consists of a
language, D1L (Decision Tree Language), that allows cardiologists to express their classification
algorithms in a way that is familiar to them,. and an interpreter and translator for that language.
The considerations in the design of D1L are described and the structure and capabilities of the
interpreter and translator are discussed.
Key words: Programming-language design, ECG classification, interpreter
48

Introduction
The prevalent approach to computerized interpretation of the electrocardiogram (ECG) is to
simulate the cardiologist's reasoning in classifying an ECG by means of decision trees [1].
Generally, these classifiers are complex. This complexity stems from the fact that many disease
categories have to be distinguished; the decision nodes may contain comprehensive tests; and
procedural knowledge is incorporated in the trees.
The development and refinement of such classifiers is an elusive task. Generally, it requires a computer expert to translate the cardiologisf s diagnostic reasoning into computer language.
The resulting program, however, is a sealed book to the average cardiologist, who thus cannot
verify whether justice has been done to his intentions, or perhaps whether his intentions would
need adjustment. But even for the expert, the workings of a complex classification program may be hidden from insight and how a particular diagnostic statement was reached may remain
obscure.
In this article we describe D1L (Decision Tree Language), a simple, easy-to-learn language
that can be used by domain experts for expressing their classification algorithms. Furthermore, we describe a D1L interpreter and translator. These tools allow the user to develop, test and
modify the classification algorithms in an interactive way~ and to generate an efficient run-time
version.
The outline of the article is as follows. Frrstly, we describe the system requirements and
motivate the approach that was taken. Secondly, we discuss language-design criteria and their
influence on the desigu of D1L. A description of the syntax and semantics of D1L can be found
in the Appendices. Thirdly, the D1L interpreter and translator will be described.
Requirements
Four requirements for the language and its environment were discerned when we started this
project:
Readability. The language should provide optimal readability for the intended users, i.e.,
cardiologists. Language constructs had to be available that allow cardiologists to express their
knowledge in a way familiar to them. Decision trees are the main vehicle to represent such
knowledge. Of particular importance is the specification of decision criteria. They involve
amplitude and time-interval measurements in the so-called ECG leads. ECG leads are signals
recorded by means of electrodes on the body surface, the standard ECG consisting of twelve
separate leads. Cardiologists often specify criteria that involve the same type of measurement
in a set of leads. They may also want to indicate that certain diaguostic categories are inhibited
by the presence of others, or that a particular algorithm needs to be executed for a set of leads.
49

The language constructs that we selected are based on material in user manuals for
electrocardiographs [2,3], previous attempts in this field [4,5], and our own experience.
Interaction. It should be possible to follow the diagnostic classification of a particular patient
and to modify and test the classification program on-line. This requirement suggests the use of
an intetpreter with at least the following capabilities: a verbose mode, the setting of breakpoints,
a step mode, on-line modification, and logging facilities. The intetpreter may be helpful during
the implementation of a classification algorithm; its main value, however, is in the help it
provides to cure diagnostic errors, inconsistencies, and omissions in a classification program that
is functioning properly from a programming point of view, but still can be improved from a
diagnostic point of view.
Compilation. It should be possible to generate a compiled version of the program_ Oassificarion
algorithms are generally evaluated by considering their performance on a large database of
ECGs. A fast run~time version of the program is necessary to process such a database in an
acceptable amount of time. The program must also be compilable because it had to be
implemented on an electrocardiograph.
Open environment. It should be possible to incotporate routines that petform dedicated
operations, such as complicated computations or J/0. The intricacies of such operations need
not bother a cardiologist. The system should operate in a UNIX environment because other
software that we use in this field runs under this operating system.
Several existing langnages or expert-system shells provide capabilities that fulf'ill pan of the
above requirements. In our opinion, none is able to fulf'ill all of them. The readability
requirement is probably the most strict one. Although the choice of the language constructs that
we deemed necessary is admittedly one out of several, we considered the constructs which are
available in existing computer languages insufficient to meet our requirement for readability.
We therefore chose to design a new language and to build an interpreter for it. In order to
generate an efficient run~time program, we decided that a translator that converts the language
into a compiled computer language would suffice.
Language
There exists extensive literature on the design of programming langnages (e.g., [6-8]).
However, guidelines for language design are hard to formalize and may be overlapping or
conflicting; programming~language design still seems to be more of an an than a science. From
the above-mentioned literature we distilled three criteria that appeared to be relevant in the
design of DTL: readability, reliability, and compilability. We do not intend to give a
comprehensive description of DTI... at this place; instead we will describe several language
50

features to illustrate how the above design criteria affected D1L. The full D1L syntax is
presented in Appendix A; a semantic description is given in Appendix B.
Readability
Many decisions io the design of D1L were influenced by the readability constraioL
Examples will be given of DTI..'s appearance, data types, expressions, and control constructs.
Appearance. The meaniog of langnage symbols should be easily recognizable. Some
characteristics which affect the appearance of D1L are: (i) Identifiers consist of letters, digits,
underscores, and primes. They can be of arbitrary length and all characters are significant; (ii)
The assignment operator is <- (left-pointing arrow). The =-operator tests for equality in
Boolean expressions; (iil) Comments start with ## and extend to the end of the line; (iv)
White space can be used freely to clarify the structure of the program.
Data types. (i) D1L has only four built-in data types: integer, real, boolean, and
string. These built-in types can be used to construct arrays and records. No pointers are
available; (ii) Symbolic constants, including array constants, can be declared; (iii) Two special
record types have been predefined: lead and location. The 12 standard ECG leads are
available as lead variables: I, II, III, aVR, aVL, aVF, Vl, V2, V3, V4, vs, V6. The lead data type is used for storing lead-dependent measurements that are relevant for
a classification, e.g., the duration of a Q wave, the amplitude of an R wave, the presence of a
QS pattern, etc. (see Fignre la). A sintilar data type location is supplied, which is used
primarily in the classification of iofarctions.
Expressions. (i) D1L supports ternaty comparison operators; (ii) Operators distingnish only five
precedence levels; (iil) Two special kinds of expression are available: lead conditions and
location conditions. The general syntax of a lead condition is:
((expression)) in [(number) of] (lead list) The (expression) can be an arbitrary D1L condition in which lead-dependent
measurements can occur. The optional {number} of clause indicates the number of lead
variables for which (expression} should at least be true in order for the lead condition
to evaluate to true. If this clause is omitted, (expression) must be true in all leads
specified io (lead list) (see Figure !b).
Control constructs. (i) D1L has a powerful set of control snu=es: 'if-then(-else)', 'for-io-do',
~loop·while', and 'loop-until'. These structures are self-bracketing, i.e., key words terminate
each construct. No 'goto'-statement is provided; (ii) A special 'for-io-do' is available which
takes lead or location variables as irs iodex variable (see Fignre !c); (iil) Procedures and
functions (program uuits) are supported. Pararceters may be passed both 'by value' and 'by
reference'. In the latter case, they have to be explicitly marked as such in the call.
51

a types lead: record
Q dur: integer; R-amp: integer; Q$_pattern: boolean; QR_ratio: real;
end_ record; end_types;
variables I: lead; II: lead;
V6: lead; end_variables;
b. (R_amp in V3 < R_amp - 50) in 1 of Vl, V2
(QRS_pos_amp- QRS_neg_amp > 1000) in I, II, (Vl .. V6)
(25 <= Q_dur < 35 and 1/4 <= QR_ratio < 1/3) in 2 of V3, V4, VS
c. for lead in I, II, (V1 .. V6) do if (Q_dur in lead > 100) then
end if; if (lead is II) then
end if; end_fo-;;
Figure 1. Examples of the DTL syntax.· (a) built-in. lead variables, (b) lead conditions. (c) special/or-loop.
The example in Figure 2 illustrates some of the above features. A (simple) rule for
classifying anterior infarction is presented. The corresponding implementation in FORTRAN,
the language in which our ECG classification program was written originally, demonstrates the
difference in readability.
Reliability
Several properties of DTL increase its reliability.
No default declaration. All variables must be explicitly declaretl before being used. The only
exception is the index variable of a lead or location for-loop. This variable is declared by DTL
52

procedure anterior_infarction() ** Location variable ANT and lead variables V2-5 are defined globally. if ( (Q_dur >= 40) in 1 of V3, V4 or
(Q_dur >= 35 and QR_ratio >= 1/3) in 2 of (V2 •• V5)) then INFARCT in ANT <- DEFINITE;
else if ((25 < Q_dur < 35 and QR_ratio >= 1/3) in 2 of (V2 .. V5)) then
INFARCT in ANT <- PROBABLE; end_if;
end_if; end _procedure;
SUBROUTINE ANTINF() INTEGER I, COUNTl, COUNT2
C Variables QDUR, QRRAT, INF and constants V2-5, ANT, DEF, PROB C are assumed to be appropriately declared.
COUNTl = 0 DO I = V3, V4
IF (QDUR(I) .GE. 40) COUNT1 END DO COUNT2 = 0 DO I = V2, V5
COUNT1 + 1
IF (QDUR(I) .GE. 35 .AND. QRRAT(I) .GE. 1.0/3.0) 1 COUNT2 = COUNT2 + 1
END DO IF (COUNT1 .GE. 1 .OR. COUNT2 .GE. 2) THEN
INF(ANT) = DEF ELSE COUNT1 = 0 DO I = V2, V5
IF (QDUR(I) .GT. 25 -~~- QDUR(I) .LT. 35 .AND. 1 QRRAT(I) .GE. 1.0/3.0) COUNT1 = COUNT1 + 1
END DO IF (COUNT1 .GE. 1) INF(ANT) = PROB END IF
RETURN END
Figure 2. Example of an algorithm to classify anterior infarction implemented in DTL (upper part) and in
FORTRAN (lower part).
upon entering the loop and deleted afterwards. Typing errors in the index variable will still be
detected because either an undeclared variable will be referenced or an alteady declared variable
will be redeclared. In both cases an error message will be given.
53

No default initialization. Variables and fields of arrays or record variables which have been
declared but have not been assigned a value, have a special value undefined. The function
undefined is the only function that can accept a variable with the value undefined. If
so, it returns true, otherwise false. Using undefined variables in numerical or string
expressions will cause an error message.
Type checking. DTL has strict rnles for the combination of values of different types: Only
integer and real types may be combined. This enables the interpreter and the translator
to detect illegal combinations of values prior to program execution.
Compilability
D1L contains several language features that ease compilation.
Static types. All variables and constants must be declared. Their types cannot change during
program execution. Thus, all information about operand types is available at compile time,
which facilitates code generation.
Static arrays. The size of arrays has to be specified by a constant expression and cannot change
during program execution. This facilitates run-time memory management and reduces the
translator's complexity.
Scope rules. DTL has simple scope rnles which facilitate compilation. Variables that are
declared in procedures or functions are only accessible from within these units (local variables).
All other variables, which must have been declared in the so-called declaration section of the
program, can be accessed throughout the program (global variables). If a variable is global and
a local variable with the same name is declared inside a certain unit, the name can only be used
within that unit to access the local variable.
Interpreter and translator
In this section the DTL interpreter and translator will be described. We will concentrate on
the functional aspects of the system; for a more technical description we refer to [9,10].
Interpreter
The interpreter consists of several functional units [11]: the command module. the parser,
the pre-run module, and the core intexpreter. The command module provides the user interface.
processes commands, handles errors, and initializes and deletes data structures. The parser
54

creates an internal representation of the DTL constructs in the form of parse trees and handles
context-dependent errors, e.g .• unbalanced parentheses, missing statement terminators. etc. The
pre-run module stores DTL objects (constants, variables, procedures, etc.) in symbol tables. It
also checks for context-dependent errors, e.g., illegal array ranges or variables that are declared
more than once. The core interpreter actually executes the program. The DTL core interpreter
is a 'linea.-izing' interpreter [11,12]. This means that the interpreter takes a parse tree
(representing, for instance, a procedure call or a control statement) and breaks it down into
simple instructions which are pushed on a control stack. Subsequently, the interpreter executes
the instructions on the control stack; values are stored and manipulated on a value stack.
Commands
We chose to have a separate command language and programming language. The other
option, to make all commands part of the programming language, would have complicated the
core interpreter considerably because of the large number of debugging commands. However,
DTL expressions and statements may be entered, prefixed by p (rint) and s (tatement)
commands, respectively. Other commands that can be issued are:
-l:> (reak)p (oint) (unit name) (line number). This command sets or removes
a breakpoint on the specified line of the specified program unit. When the interpreter is
executing a program, it checks every statement to see whether a breakpoint is set on one of
the lines it occupies. If so, the interpreter does not (yet) execute the statement, but echoes it
and enters 'break mode'. At that point the user regaius control and can issue other commands.
- c (ontinue). With this command the user can resume a program that has entered break
mode.
- clear_ everything. This command deletes all data structures that were created du..Tjng
the current session. After this command has been issued,. the interpreter is in its initial state.
-describe (ol:>ject_spec) [ (output_file) ]. This command describes the specified
DTL object(s). The optional ( output_file) specifies the name of the file to which the
description(s) should be written. Default is standard output.
- help. This command prints a short summary of the commands that the interpreter accepts.
-load (DTL_file). This command loads the DTL object that is defmed in the specified
file, e.g., a program unit, into the interpreter's memory.
- quit. This command terminates the current session.
- reset. When an error occurs inside a unit or if break mode is entered inside a unit, the
interpreter stays in that unit's environment. This means that the local variables of this unit
are visible and may hide global variables of the same name. In order to get back to the 'top
level' the reset command can be used.
55

- run (batch_ file). This command sequentially executes the interpreter commands in the
specified batch file.
- sh (shell_ command). This command is the shell escape. The rest of the line is passed
to the shell.
- step. This command toggles the step mode. When the interpreter is in step mode, the
program is executed one statement at a time. After every statement. the interpreter enters
break mode.
- verbose. This command toggles the verbose mode. When the interpreter is in verbose
mode, every statement is shown to the user before it is executed. If a conditional statement
is executed, the truth value of the condition and its possible constituents are displayed.
- warn. This command toggles the warn mode. When the interpreter is in warn mode, loading
the definition of an object that was already defmed is not possible and will result in a
warning. If the warn mode is reset, the interpreter will ovenvrite the existing object with the
newly loaded one.
The user interface has been kept small and simple. It uses the standsrd C input/output
routines and is line·oriented.
Special features
The DTL intezpreter has several special features: facilities for debugging the interpreter and
for logging, and the inclusion of foreign units.
Debugging the interpreter. There are two interpreter commands to show the contents of the
control stack and the value stack: show_ C and show_ V, respectively. They can be used to
gain insight into the operation of the interpreter and are useful when the DTL langnage is to be
modified or extended.
Logging. To increase insight in the classification process, it may be important to know how
often a variable or constant is referenced. Therefore, every variable and constant has a log flag
attached tc it. The user may toggle these flags by issuing a log command. When the log flag
of a variable is set, the interpreter counts all reads and writes performed on it. When a
constant's log flag is set, all reads are counted. If the log flag is reset, the reference counts are
not incremented. The value of the counts can be shown by means of the describe command.
The reset_refcnt command resets the read or write reference count.
Logging is conditional on the value returned by a function refcnt_permission. This
function has to return true for the logging to be performed. In the present implementation,
it is a dummy function which always returns true. It may be adjusted by the user, however,
to provide side effects or additional criteria for logging.
56

Foreign units. Foreign units are procedures or functions written in a compiled langnage (C or
C++) to be called from DTI.. programs using the ,normal calling conventions. The reasons for
providing them are that (i) foreign units enable the execution of computer-intensive
computations in a much more efficient way than would be possible in interpreted DTI.., and (ti)
they allow for the incorporation of complicated algorithms, e.g., dedicated I/0 routines, without
having to provide a large set of DTI.. statements for implementing these algorithms. Thus,
foreign units provide efficiency and extensibility to DTI.. while retaining its readability and
simplicity. Foreign units are linked with the interpreter or translator. They have access to all
variables and constants of the DTI.. program.
$ interpreter Wel.come to the DTL command inte::prete:: >run load ecg
The ECG classijicaMn programs are loaded; file load_ecg conJai.ns DTL load statements for all DTL procedures.
>s read ecg(lO) The ECG measwemen!S of a patient (no. 10) are read from a file by foreign unit read_ecg.
>s class ecg () ECG cl.asS~fication for patient 10
~robabl.e anterior infarction Definite LVH (Left Ventricu2ar Hypertrophy)
DTI.. procedure class_ecg calls the DTL classlft.eation procedures. The classification is printed by a foreign unit called by class_ecg.
>verbose ve:::bose is ON
The user wants to know why the classificat.ion "Probable anterior infarction" is made and turns on the verbose mode.
>s anterior infarction() ( 1] i.f -( (Q dur >= 40) i.n 1 of V3, V4 or ( 21 (Q-dur >= 35 and QR rati.o >= 1/3) i.n 2 of (V2 .. VS)) then false o:e false ~ fal.se -***** CONDITION IS false
5] i.£ ( (25 < Q_dur < 35 and Q..":t_rati.o >= 1/3) i.n 2 of (V2 .• VS)) then ***** CONDITION IS true
6] INFARCT i.n AS <- l?ROBABl.E; The procedure for anterior infarction is executed (cf. Figure 2), Line numbers are indicated on the left. The fust condition is false, the second is true. Truth values for subconditions are also indicaled.
>sh vi antinf.tree The user concludes that the procedure for anterior infarction is flawed and enters the standard text editor to modify the file antinftree which contains the procedure.
>load antinf.tree Upon return, the corrected procedure is loaded and may be tested once again.
>quit Do you reall.y want to qui.t (y/n) ? y $
Figure 3. Example of the use of the DTL interpreter. System owput is bold and explan.alory notes are in ilalics.
57

Figure 3 illustrates our present use of the D1L interpreter. The ECGs that we use in our
research have been processed by the signal analysis part of our ECG computer program [13].
For each ECG the measurements used by the classification program have been stored in a file.
These measurements can be retrieved with foreign unit read_ecg, obviating a reanalysis of
the ECG every time a classification is made. This setup is for research purposes only; eventual! y
a (compiled) version of the classification program is integrated with the signal analysis program.
Translator
The translator converts D1L programs to C or C++ programs which can be subsequently
compiled into executables. Its construction was relatively straightforward, since several parts of
the D1L interpreter (parser, data structures) could be used for the translator as well. The
translator does not provide extensive error checking. as programs are expected to have been
debugged with the interpreter.
Interpretation and compilation of D"fl- programs may differ in two respects. Flrst, the
translator expects one main procedure which calls other procedures and functions. In D1L, tltis
procedure starts with the key word main. The main procedure is also accepted by the
interpreter, of course. but it is not required since any procedure or function may be invoked
directly by the user during an interpreter session.
Second, differences may exist between foreign units used by the interpreter and those used
by the translator. This is caused by the fact that the interpreter's foreign units use D1L variables
which are stored in the interpreter's symbol tables, while the translator's foreign units use their
own (C or C++) variables.
Both the interpreter and the translator have been implemented in C++ [14]. We used the
Glockenspiel C++ compiler [15], operating on HP-9000 workstations.
Discussion
We developed the D1L environment to enable domain experts to express their classification
knowledge in a familiar but algorithmic way and to provide insight into the possibly complex
classification process. Our particular interest was to improve the diagnostic classification part
of our ECG computer program. In our experience, the cardiologist's way of representing
knowledge is closely resembled by the language DTL. We found that diagnostic classification
algorithms could be translated into D1L in a natural way and immediately be understood by the
cardiologist. The possibility to use dedicated routines written in a compiled computer language
within D1L programs proved to be vety useful. The interactive character of the system
facilitated experimentation. New ideas were quickly implemented and tested, showing their
58

viability. The cardiologist himself, sitting behind the computer, could follow the ptogtam's
execution and pinpoint flaws immediately [16].
In the past, other languages have been developed to facilitate the development of heuristic
ECG classifiers: DCDL (Diagnostic Criteria Decision Language) [5] and Hewlett Packard's ECL
(ECG Criteria Language) [4]. There are, however, many differences between D1L and these
languages. For instance, they do not support if-then-else, loop-constructs, and array variables;
they permit only a restricted form of progtam modularization; no foreign units can be used.
Furthermore, the programs are compiled instead of interpreted; no particular facilities are
provided to acquire insight into the actual classification process.
D1L is a concise language. Its capabilities may be extended, though, by defining new
foreign units. Their use has some disadvantages: Foreign units have to be incorporated into the
interpreter or translator, and differences exist between foreign units for the interpreter and for
the translator. We feel these drawbacks are by far outweighed by the increased flexibility.
Besides, foreign units probably will not be changed frequently, and the differences between the
translator and interpreter versions are smalL
Several useful extensions of the interpreter are possible. A history mechanism which allows
the user to recall and edit previously entered commands would increase user-friendliness.
Another extension deals with error checking. Presently., most error checking is done at run-time.
Errors that exist in infrequently used parts of a program are very hard to detect. More extensive
error checking by the pre-run module prior to interpretation may remedy this problem. The fact
that D1L is strongly typed facilitates adding static error checldng.
DTL contains several constructs dedicated to computerized ECG classification. In our
opinion, however, the language is general enough to be used in other application areas. It is easy
to learn, probably also for domain experts without programming experience. Especially those
areas where insight in complex (heuristic) classifiers and on-line experimentation is important,
may benefit from the capabilities of the interpreter.
Availability
Program source codes and executables are available from the authors.
Acknowledgment
We like to thank Dr. D. Grone (Free University, Amsterdam) for helpful discussions
concerning the paper.
59

References
[1] Kors JA. Van Bemmel JH. Classification methods for computerized classification of the electrocardiogram.
Methods lnf Med 1991)-,29:330-6.
I2J Physicians' Guide to Marquette Electronics' Resting EGG Analysis. Milwaukee: :Marquette Electronics Inc.
1987. [3] Mingocare Overreading Dictionary. Solna: Siemens-Elema AB, 1985.
[4] Balda RA, Vallance AG, Lus= JM, S!ahlin FJ, Diller G. ECL: A medically oriented ECG cri!eria language
and other research tools. In: Ostrow HG, Ripley KL. eds. Proc Computers in Cardiology 1978. Long Beach;
IEEE Comput Soc, 1978:481-95.
[5] Rubel P, Arnaud P, Prevot D. Systeme d'aide ala decision. Application a l'interpr€tati.on automati.que des
vectocardiogrammes. Int J Biomed Comput 1975;6:193-211.
[6] Hoare CAR. Hints on Programming Language Design. Report CS-73-403. Stanford University, 1973.
[7] Ghezzi C, Jazayeri M. Programming Language Concepts. New York: J Wiley & Sons, 1982.
[8] Tremblay JP, Sorenson PG. The Theory and Practice of Compiler Writing. New York: McGraw-Hill,. 1985.
[9] Kamp DM, Snoeck Henlcemans DP. An lnleracdve EnvironmerJ for AutomLZted EGG Classification. Internal report (m Dutch). Rotterdam: Dept of N dical Informatics. Erasmus University, 1989.
[10] Snoeck Henkemans DP, Kamp DM. DTL User Manual. Rotterdam: Dept of Medical Informatics. Erasmus
University, 1989.
[11] Brown PJ. Writing Interactive Compilers and Interpreters. New York: J Wiley & Sons. 1979.
[12] Bernat R. Understanding and Writing Compilers, a Do-it-yourself Guide. London: Macmillan, 1979.
[13] Kors JA, Talrnon JL, Van Bemmel JH. Multilcad ECG analysis. Comput Biomed Res 1986;19:28-46.
[14] Stroostrup B. The C++ Progromming Longuage. Reading: Addison-Wesley, 1987.
[15] The Designer C++ Programming System, User Guide and System Manual. Dublin: Glockenspiel Lim, 1988.
[16] Kors ]~Van Herpen G, DeJong T, Van Bemmel JH. Interactive optimization of heuristic ECG classifiers.
In: Proc Computers in Cardiology 1991 (in press).
60

Appendix A - DTL-syntax description
A modified version of Backus-Naur Form (BNF) is used Non-terminal symbols are
represented by strings consisting of lower-case letters and underscores, enclosed in ( and ).
Terminal symbols represent themselves, but may be enclosed in single quotes (' ') to prevent
ambiguity. The symbol -> separates the left- and right-hand sides of a production. The vertical
bar (I ) separates alternative right-hand sides of a production. Square brackets ([])enclose items
that may appear once or may be omitted (optional items). Braces (( )) enclose items that may
be omitted or that may appear one or more times.
(compile_unit) ->
(type_block) ->
(constant_bl.ock) ->
(variable_block} ->
(procedure_def}
(function_de£)
(type_def) -> I
(constant_def}
{variable_decl)
(type_block) (constant_block) (variable_block} (procedure_def) {fUnction de£} types
(type_def); !(type_def);J end_types; constants
{constant_def); {(constant_def);} end_constants; variables
{variable_decl); {(variable_decl);} end_variables; procedure (id} ([(formal_par} {, (formal_par}])
[(variable_block)] (statements)
end _procedure; main
[{variable_block)J (statements)
end_main; function {id) ([{formal_par} {, {formal_par}}J)
returns {built_in_type) [ {variable_ block)] {statements)
end_function; (~d): array '[' {int_range} ']' o£ (built_in_type) {id): record
{record_field_decl); {{record_field_decl);}
end_record {id): {built_in_type) <- {expression) {id): array<- '{' {int_const) {, {int_const}} '}' {id): {general_type}
61

(formal _par) -> (statements) -> (built_in_type) -> (int_range) -> (record_field_decl) -> (expression) ->
(int_const) -> (general_ type) -> (formal_in_par) -> (for.mal_i~out_par) -> (statement) -> (relation) ->
(simple_statement) ->
(block_ statement) -> (simple_expr} ->
(assigmnent) ->
(proc_call) -> (if_block) ->
(for_block)
62
(for.mal_in_par) I (formal_in_out_par) [(statement)]; £{statement);} integer I real I boolean I string ((int_const) .. (int_const)) (id): (built_in_type) (relation) (relation) and (expression) (relation) or (expression) (id) [ (int_literal) (id) I (built_in_type) (id): (built_in_type) & (id): (built_in_type) (simple_statement) [ (block_statement) (simple_ expr) (simple_expr) '<' (simple_expr) (simple_expr) '<=' (simple_expr) (sirnple_expr) '=' (simple_expr) (simple_expr) '>=' (simple_expr) (simple_expr) '>' (simple_expr) (simple_expr) '/=' (simple_expr) (simple_expr) '<' (simple_expr) '<' (simple_expr) (simple_expr) '<' (sirople_expr) '<=' (simple_expr) (simple_expr) '<=' (simple_expr) '<' (simple_expr) (simple_expr) '<=' (simple_expr) '<=' (simple_expr) (simple_expr) '>' (simple_expr) '>' (simple_expr) (simple_expr) '>' (simple_expr) '>=' (simple_expr) (simple_expr) '>=' (simple_expr) '>' (simple_expr) (simple_expr) '>=' (simple_expr) '>=' (simple_expr) (assignment) I (proc call) I print (expression) return (expression) T exit I stop (if_block) I (for_block) I (loop_block) (tenn) (ter.m) + (simple_expr) (ter.m) - (simple_expr) (var_expr) <- (expression) (var_expr) <- undefined (proc_name) ([(actual_par) {, (actual_par)}J) if ((expression)) then
(statements} [else
(statements)] end_if for (id) in (for_list)
(statements) end_for

(loop_block)
(term) ->
(var_expr) -> I
(proc_name) -> (actual _par) -> (for_list) -> (factor) ->
(array_field_expr) -7
(record_field_expr) -7
(actual_in_par) -t
(actual_in_out_par) -t (int_list) -t
(lead_list) -t
(loc_list) -)
(primary) -)
I I I I I
(record_var_name) -t
(lead_range) -7
(loc_range) -) (function_ call) -7
(lead_condition) -t
(lead_equality) -t
(loc_condition) -t
(loc_equality) -t
(id) ->
loop (statements)
while <(expression)) (statements)
end_loop loop
(statements) until ((expression))
(statements) end_loop (factor) I (factor} * (factor) (factor} I (factor} (factor} div (factor} (factor} mod (factor} (id) I (array_field_expr} I (record_field_expr} ((var expr}) (id) T main (actual_in_par} I (actual_in_out_par} (int_list} I (lead_list} I (loc_list} (primary} I not (primary} ] abs (primary} (primary} ** (primary} I - (primary} (id} '(' (expression} ')' (id} in (record_var_name} (expression} & (var_expr} (int_const} I (int_range} I (int_const}, (int_list) (int range), (int list) (lead) I (lead_ra~ge} I (lead), (lead_list} (lead range}, (lead list) (loc)-! (loc_range}-1 (loc), (loc_list} (loc_range), (loc_list) (int_literal) I (real_literal} (boolean_literal) I (string_literal} I (id) undefined <(expression}) I (array field expr} (record_field_expr} I (function_c;ll} -(lead condition} I (lead equality) (loc ~ondition) I (loc e~ality} I ((expression}) (id)-1 (lead) I (lee) -((lead) .. (lead)) ((lee) .. (lee)) (id} ([(actual_par) {, (actual_par)}]) ((expression}) in [(int const) of] (lead_list) (lead) is (id) I (id) i; (lead) ((expression)) in [(int const) of] (loc_list) (lee) is (id) I (id) is-(lee) (letter) { (printable} }
63

(lead} -> I I II I III I aVR ! aVL I aVF Vl I V2 I V3 I V4 I vs I V6
(loc} -> INF I HL I ANT I AS IAL I POST (int_literal} -> (digit} {(digit}) {real_literal} -> [ (int_literal)] (int_li.teral) [(exp}J
(int_literal} {exp) (boolean_literal} -> true I false (string_ literal) -> " {(string_char)} " (letter} -> a I b I c I ct I e I f I g I h I i I j I k I 1 I m
I n I o I p I q I r I s I t I u I v I wJ xi y I z
I AI B I c I D I E I F I GJ H I I I Ji KJ L IM I NJ o I P I Q I R I s I T I u I vJ wJ xi YJ z
(printable} -> {letter} I (digit} I_ I '
(digit} -> 0 I 1 I 2 I 3 I 4 I s I 6 I 7 8 9
(exp} -> e [-] {int_literal) I E [-] (int_literal) (string_ char) -> (printable} I ""
64

Appendix B - DTL-semantics description
I. Basic definitions
1.1. White space
White space is a sequence of spaces, new lines, and tabs. It is never explicitly mentioned
in the syntax description of appendix A, but it can be placed before and after any of the non
terminal symbols in the productions.
12. Identifiers
An identifier consists of a letter followed by a (possibly empty) string consisting of letters,
digits, underscores ( _ ) and primes (' ). Identifiers can be of arbitrary length and all characters
of an identifier are significant. The underscores and the case of the letters are also significant.
Identifiers are used to name the entities in a program. Some identifiers have a predefined
meaning and may not be reused. These identifiers are called key words or reserved words. The
full list of D1L key words is given in appendix C.
I 3. Literals
Literals are constants that specify their own value. Literals can be numbers, truth values or
strings.
Integer literals and real literals are numeric literals that denote numbers. Integer literals are
expressed in decimal notation and consist of one or more digits. Integers do not contain a
decimal point. Real literals are also in decimal notation and consist of one or more digits with
an optional decimal point, followed by an optional exponent part that consists of an e or E,
followed by an integer literal that is optionally preceded by a ntinus sign. A real literal must
contain an exponent part or a decimal point, or both, otherwise it cannot be distinguished from
an integer literal.
The class of Boolean literals contains only two elements, the reserved words true and
false. These literals denote truth values following the rules of Boole's algebra.
String literals are arbitrary strings of printable characters, enclosed in double quotes. If a
string literal is to contain a double quote, this double quote has to be preceded by another one.
1.4. Comment conventions
Comments start with # # and extend to the end of the line. They can contain arbitrary text
and can be placed anywhere except within a lexical element (i.e., identifier, operator or literal).
65

2. Variables~ constants and expressions
2 .1. Declaration of variables
All variables have to be explicitly declared by the user. Variables are declared in a
'variables-block'. The declaration has the form:
variables (var_name): (type_name);
{(var_name): (type_name);} end_ variables; The (var_name) can be an arbitrary identifier, as long as it is not a key word and it is
not declared more than once in the same variables-block. The (type_name) can be one of
the built-in types: integer, real. boolean or string, or it can be the name of one
of the types defined by the user (see 4.1).
22. Assignment
Values can be assigned to variables in two ways: by means of an assignment statement and
by means of a procedure or function call with in/out parameters. Procedure and function calls
will be discussed in section 5.
An assignment statement consists of two expressions. separated by a <- sign. The left-hand
side (lhs) of the assignment statement specifies the location where the value of the other
expression, the right-hand side (rhs), is to be stored. In DTI.. one can only assign to simple
variables (variables of a built-in type). As a consequence of this, the lhs is a restdcted
expression that can only be of one of the following three forms: the name of a simple variable,
the specification of a field of a record variable, and the specification of a field of an array
variable. The rhs is a general expression that is only restricted in the type of values that it can
have. This type must be the same as the type of the lhs or coercible to it.
23. Undefined variables
When variables are declared but no value has been assigned to them, they are initialized to
a special value: 'undefined'. When uudefined variables are used as part of an expression, the
expression normally also becomes undefined. An exception to this rule is the way in which
Boolean expressions (conditions) are handled (see 2.5.2).
Undefined expressions may not be used as rhs of assignment statements. A variable may be
assigned an undefined value by using the reserved word undefined as the rhs of an
assignment statement. It is also illegal to pass undefined variables as in-parameters to a
procedure or function. The only exception to this rule is the predefmed function undefined
66

which expects a genernl expression of a built-in type as its parameter and returns true if the
expression is undefined.
2.4. Symbolic constants
or
Symbolic constants are declared in a 'constants-block'. The declaration has the form:
constants (constant_def);
{(constant_def);l end_constants; Constant definitions have the following syntax:
(id): (built-in_type) <- (expression)
(id): array<- '{' (int_const) {, (int_const)l 'l' The identifier (( i d)) in the production is the name of the symbolic constant- This can be
any identifier that is not also a global variable or the name of another symbolic constant.
In the fust production, the expression that is used to supply the constant's value is an
unrestricted expression that can use all operators and all symbolic constants that are known at
the time of definition.
The second production is the syntax of the definition of array constants: symbolic constants
that represent one-dimensional arrays of integers. The indices for an array constant range from
1 to the array • s number of elements. Array constants are accessed via the same type of
expression as array variables (see 4.2).
Symbolic constants can appear in all types of expressions, but not as the lhs of an
assignment statement or as in/out parameters (see 5.3).
25. Expressions
An expression must always have a value of a built-in type. Expressions consist of literals,
symbolic constants, variables, fields of record variables, fields of array variables or constants,
function calls and ECG conditions, combined by means of operators and brackets. There are
three types of expressions: numerical, Boolean, and string.
25.1. Numerical expressions. Numerical expressions are used to supply the program with
integer or real values. The simplest numerical expressions are the ones without operators. They
can be of the following forms: Integer literal, real literal, identifier (representing a numerical
variable or constant), array field (of a numerical array variable or constant), record field (a
numerical field of a record variable), function call (of a function with a numerical return type).
The unary operators that are defmed on numerical values are: abs (absolute value), and
- (negation). The result of both operators is of the same type as the operand.
67

The binaxy operators that are defined on numerical values are: + (addition),
(subtraction), * (multiplication), I (division), ** (exponentiation), di v (integet division),
and mod (modulus). The result of +, -, and * is an integer if both opetands are integen;;
otherwise it is a real. The result of I and * * is always a real Both opetands and result of
di v and mod are integers. All numerical operators return the value undefined if one of
their operands is undefined.
252. Boolean expressions. Boolean expressions (conditions) are used in tests that are part of
conditional statements or loops. The simplest Boolean expressions are the ones without
operators. They can be of the following forms: Boolean literal, identifier (representing a Boolean
variable or constant), array field (of a Boolean array variable), record field (a Boolean field of
a record variable), function call (of a function with a Boolean return type).
There is one unary Boolean operator: not. This operator expects a Boolean operand and
returns its negation. If the operand is undefined, the result is undefined as well.
Thete are two binary Boolean operators: and and or. These operators also expect Boolean
operands and return a Boolean value. If one operand of and is undefined, and the other
one is false, the operator returns false. If the other operand is true, the operator returns
undefined. If one operand of or is undefined, and the other one is true. the operator
returns true. If the other operand is false, the operator returns undefined.
The following binary operators compare values of a built-in type and return Booleans that
describe the relation between these values: ~ (equal), 1~ (not equal), > (greater than), >~
(greater than or equal), <~ (smaller than or equal), and < (smaller than). The operands of
~ and I~ can be any of the built-in types provided they are of the same type. The opetands
of >, >=, <=,and < must be either both numerical or both strings.
D1L also supports ternary comparison operators, which can compare three numerical or
string values: > >, >= >, > >=, >= >=, <= <=, < <=, <= <, and < <.
253. String expressions. String expressions are used to store or print messages. The simplest
string expressions are those that are of one of the following fonns: String literal, identifier
(representing a string variable or constant), array field (of a string array variable), record field
(a string field of a record variable).
The only binary operator that is defined on strings is +,which concatenates two strings and
returns the result as a new sni.ng.
25.4. Operator precedence. A precedence level is associated with each operator. If an
expression contains two operators of different precedence levels, the one with the highest level
is applied first, unless parentheses are used to force another order of evaluation. Operators of
the same precedence level are left-associative.
68

The following precedence levels are distinguished:
5: * *, not, abs, (unary) -
4: div, mo~ *, I
3: +.
2: >. >=. =. <=, <, /= 1: and, or
2.6. Coercion
Most of the numeric operators that are described in 2.5.1 and all of the comparison symbols
of 2.5.2 accept combinations of reals and integers as their operands. All integers in the
expression are converted to reals and then the whole expression is evaluated, using only the
operators (or comparison symbols) for reals.
Another (but similar) use of coercion is when an integer literal is assigned to a real variable.
The literal's integer value is first convened to a real and then the assignment statement is
executed. Every other mixing of types is illegal.
3. Control structures
3 .1. If-blocks
or
if ({expression)) then {statements)
end_if;
if ({expression)) then {statements)
else {statements)
end_if; ·The first kind of if-block checks whether {expression) (a condition) has the value
true and if this is the case, executes the statements after then. If the condition has the value
false the statements after then will be skipped. In both cases the program resumes
execution after end if.
In an if-block of the second kind, the statements after else will be ignored if the
condition holds; if it does not, they will be executed.
69

3 2. Loop-blocks
or
loop (statements)
until ((expression)) (statements)
end_loop;
loop (statements)
while ((expression)) (statements)
end_loop; The first loop-block executes the statements after loop, then checks whether
(expression) holds. If it does not. the statements after the test are executed and execution
resumes at the statement following the loop key word. If the condition holds, control is
transferred to the statements following end _loop.
The second loop-block behaves almost identically to the first. The only difference is that the
condition is used as a continuation condition rather than as a termination condition.
3.3. For-blocks
for (id) in (int_list) do (statements)
end_for; ( int _list) is a list of integers and/or integer ranges, separated by commas. The integers
can be either integer literals. integer variables or integer symbolic constants. Integer ranges are
of the form ( (int_vall) _. (int_val2)), where (int_val2) is gteaterthan or equal
to (int_vall).
The index variable of an integer for-loop must be declared before it is used in the for-loop.
Its type must be integer. The value of the index variable should not be changed by the
statements in the loop. After termination of the loop, the value of the index variable is the last
value in the list.
70

4. User-defined types
4 .1. Type definition
The general format of a type definition is:
types (type_def};
{(type_def);} end_types; DTL contains two user-defined types, the array type and the record type. The specification
of an array type has the form:
(id): array '[' (int_range) ']' of (built-in_type); The specification of a record type is as follows:
(id): record (id): (built-in_type);
{(id): (built-in_type);} end_record;
42. Array variables
When a new array type has been defined, variables of this type can be declared in the
normal way. Variables of an array type can be accessed one field at the time. An array element
can be specified by the name of the array variable followed by an integer expression denoting
the index of the desired element. The integer expression must be enclosed in square brackets.
Array elements can be used in all situations where normal variables of the same type can be
used. This means that array elements can be used in expressions. as parameters to functions and
procedures and as lhs of assignment statements. Arrays cannot be returned by functions or
passed to procedures or functions. Only one-dimensional arrays are allowed.
43. Record variables
Record variables are declared in the same way as all other variables. After a record variable
has been declared. its fields are accessible via a record-field specification:
{record_field_name) in (record_var_name) The first identifier is the name of one of the fields that are defmed for records of this type.
The second identifier is the name of the record variable to be accessed. Record fields can be
used in all situations where normal variables of the same type can be used. This means that they
can be used in expressions, as parameters to functions and procedures and as lhs of assignment
statements. Record variables can only be accessed one field at the time. Record variables cannot
be returned by functions or passed to procedures or functions.
71

5. Program units
5.1. Procedures
The definition of a procedure has the following syntax:
procedure (id} ([[&J(id}: (built-in_type} {, [&] (id}: (built-in_ type}}]}
[(variables_block}] (statements}
end _procedure; The first ( id} is the name of the procedure. It is followed by the list of formal
parameters. The parameters can be preceded by an ampersand(&). An ampersand indicates that
the parameter is an in/out-parameter. whereas no ampersand means that the parameter is an in
parameter (see 5.3). The parameter list is optionally followed by a variables-block (see 2.1) that
specifies the procedure's local variables. This block, in turn, is followed by the statements that
perform the procedure's actions.
Procedures can be called by other parts of the program by specifying the name of the
procedure and a list of actual parameters that the procedure uses. The in/out-parameters must
be preceded by an ampersand.
The DTI.. compiler demands one main procedure which is the program's starting poinL Its
syntax is:
main [ (variables_block}] (statements}
end_main; A main procedure need not be specified when the interpreter is used.
52. Functions
Functions are def'med in the following manner:
function (id} ([[&] (id}: (built-in_type} {, [&] (id}: (built-in_type})J)
returns (built-in_type} [(variables_block}J (statements}
end_function; The only non-trivial difference between procedure and function definitions is the clause
returns (built-in_type}. This clause specifies the return type of the function.
72
The way a function returns a value is by executing the statement
return {expression};

When this statement is encountered, execution of the function is terminated and the value
of (expression} is returned to the calling unit. The type of (expression} must be
the same as, or coercible to, the return type of the fuuction. Return statements can be placed
anywhere within a function (even in loops) and they can occur more than once in one function
specification. If, during execution of a function, the program runs into the end_ function,
a run-time error is raised. Return statements can only occur in functions.
Function calls have the same syntax as procedure calls. Function calls can be used in general
expressions, but not as lhs of assignment statements or as in/out parameters for a procedure or
other function.
53. In- and in/out-parameters
Program units may be provided with two kinds of actual parameters: in- and in/out
parameters. An in-parameter is a parameter that the calling unit uses to supply the called
procedure or function with a value. An actual in-parameter can be any kind of expression whose
value is of the same type as the corresponding formal parameter or coercible to it. In-parameters
behave like local variables of the called unit. Their value can be used in expressions and new
values can be assigned to them but these changes do not affect the caller's variables in any way.
Functions return exactly one value. Returning multiple values is done by means of the
in/out-parameter mechanism, Both actual and formal in/out-parameters must be preceded by an
ampersand. Unlike an actual in-parameter, which specifies a value, an actual in/out-parameter
specifies a location in memory that may or may not contain a value. The called unit can use its
fortual in/out-parameters just like fortual in-parameters or local variables. The main difference
between in- and in/out-parameters is that changing a formal in/out-parameter causes the
corresponding actual parameter to change as well. Another difference is that an actual in/out
parameter needs to be of the same type as its corresponding formal one, whereas for inparameters it is enough for the actual parameter to be coercible to the formal parameter's type.
5.4. Return from a unit
There are three ways of terminating (part of) a program:
stop: Terminates the whole program, independent of the current position.
exit: Terminates the current procedure. This instruction cannot be used in functions,
since it does not specify a return value.
return: Terminates the current function, specifying a return value. This instruction can
only be used in functions.
73

55. Scope and visibility
Variables that are declared in the declaration section of the program, can be accessed
throughout the program. These variables are called 'global'. It is also possible to declare
variables in procedures or functions, in which case they are only accessible from within these
units.
If a variable is global and a local variable with the same name is declared inside a certain
unit, the global variable is 'invisible' within this unit
5.6. Notes on memory management
The current implementation of the D1L interpreter uses a static memory-management
scheme. This means that all variables and constants are allocated once and deallocated only
when the program is terminated. A consequence of this way of managing memory is that DTL
does not support recursion.
The fact that DTL uses static memory management does not mean that the local variables
in DTL are static in the FORTRAN sense. however. When a unit is exited, all its local variables
are set to undefined and their original values are lost.
6. EGG-specific features
DTL contains a number of features that make it especially fit for application in computerized
ECG classification.
6.1. Lead variables
An ECG classification program uses a number of measurements of the ECG at hand. These
measurements are time intervals or amplitudes of waves in the leads of the ECG. DTL supplies
a data type, a record type named lead, which can be used to store these lead measurements.
The language predefines twelve lead variables of which the names are key words: I, I I,
III, aVR, aVL, aVF, Vl, V2, V3, V4, vs, V6. These variables can be accessed
like normal record variables. One can make lists of these lead variables and, like integer lists,
these lists can contain ranges. The sequence that is defined on the lead variables is the one
shown above.
62. Location variables
During the classification process, the program needs to record its conclusions and
assumptions about the condition of the heart. Much of these data apply to specific locations of
the heart. DTL has a predefined record type named location for this purpose.
74

The following predefined variables are of type location: INF, HL, ANT, AS, AL,
POST. Like lead variables, location variables can be used in both lists and ranges.
6.3. Special for-loops
It is often necessary to execute repeatedly the same action for a number of leads or
locations. For this purpose, DTL has a special for-loop construct. The syntax of such a for-loop
is the same as for the normal for~ loop (see 3.3), except for the iteration list which contains leads
or locations instead of integers.
The index variable of a special for-loop can be used as a normal lead/location record
variable. The index variable is not a record variable, however. It can be printed, in which case
it yields a small integer representing the sequence number of the current lead/location. This
means that the index variable, unlike a real lead/location variable, can be used as a parameter.
All other manipulations that treat the variable as an integer are illegal.
To test whether a particular lead/location in the iteration list has been reached, D1L contains
a special comparison operator: is. This operator can be used to compare the current value of
the index variable with a particular lead/location variable. The declaration of the index variable
is done automatically. The variable is declared before the program enters the for-block and
deleted when the for-block is exited Using the variable afterwards results in a run-time error.
The name of the index variable cannot hide the name of a local variable; it must be given a
name that has not already been given to a local variable.
As in a normal for-loop. it is illegal to assign values to the index variable or use it as an
in/out-parameter.
6.4. Special conditions
A special type of condition was designed that can test multiple ECG variables at once and
that conforms to the notation that is commonly used in cardiology. These conditions can either
apply to collections of lead variables or collections of location variables and are therefore called
lead conditions or location conditions. The syntax of a lead condition is:
((expression)) in [(int_const) of] (lead_list) The (expression) can be an arbitrary DTL condition (but not a lead/location
condition), in which fields of the lead record type can occur. The (optional) (int_const)
of clause indicates the number oflead variables for which (expression) should (at least)
be true in order for the lead condition to evaluate to true. If this clause is omitted.
(expression) mustbe true inallof (lead_list)'selementsinorderforthelead
condition to become true. An undefined (expression) counts as false. The syntax
of location conditions is similar to that of lead conditions.
75

Appendix C - DTL key words
abs and array boolean constants div do else end_constants end_ for end_function end_if end_ loop end_main end _procedure end_record end_types end_variables exit false for function if in integer is loop main mod not of or print procedure real record return returns stop string then true types undefined until variables while I II III aVR aVL aVF Vl V2 V3 V4 vs V6 AL ANT AS INF POST
76
CHAPTERS
Interactive Optimization of Heuristic EGG Classifiers
J.A. Kors,1 G. van Herpen,2 T. de Jong,1 J.H. van Bemmel1
'Department of Medical Informatics, Erasmus University, Rotterdam, The Netherlands
'Division of Orrdiology, Academic Hospital, Leiden, The Netherlands
In: Proceedings of Computers in Cardiology 1991 (in press)
77

Abstract
Diagnostic classification of the electrocardiogram (ECG) by computer is mostly carried out
by means of heuristic classification algorithms, which mimic the cardiologist's way of rea
soning. We developed a dedicated Jangnage, D1L (Decision Tree Language), that allows
cardiologists to express their classification knowledge in a way that is familiar to them. DTL
can be processed by an intetpreter which enables cardiologists to follow the classifier's
operation and to interactively modify and test the algorithms. A translator is also available that
can produce a fast run-time version of the program. We followed a procedure of stepwise refinement to optimize our own ECG computer
program. Initial modifications were tested on a large database (N=1220) which was collected
in the international project 'Common Standards for Quantitative ElectrOcardiography' (CSE).
78

Introduction
In their diagnostic classification most computer programs for the interpretation of the
electrocardiogram (ECG) or vectorcardiogram (VCG) mimic the cardiologist's reasoning by
means of decision·tree logic [1]. The development and refinement of such classifiers, however,
is cumbersome and time consuming because it is difficult to mold human experience and
knowledge into computer algorithms. It requires a computer expert to implement these
algorithms in a (compiled) computer language. The average cardiologist, however, is not able
to verify the implementation and will remain in the dark whether his diagnostic intentions have
been properly realized and performed as he wished. But also for the initiated it remains obscure
in many cases how a given result was reached by the classification process. The ·program
essentially acts as a black box.
In this article we present an interactive environment which cures these problems. The
environment consists of a language, DTI... (Decision Tree Language), and an interpreter and
translator of that language. DTL allows cardiologists to express their classification knowledge
in a way that is familiar to them. With the help of the interpreter every step in the classification
process can be elucidated, and algorithms can be modified and tested interactively. The
translator produces a fast run-time version of the program. The use of this environment to
optimize our ECG computer program will be described and results of the improvement will be
given.
Decision Tree Language
The main requirement for DTL was that a cardiologist should find it easy to read and to
write. Therefore, D1L should have a notation and structure that would be familiar to him and,
in addition, programs written in DTL should provide a clear documentation of the classification
procedure. Another requirement was that DTL could be interpreted as well as compiled. An
extensive description of DTL and its interpreter and translator is given elsewhere (2]; here we
will describe the main fearures that D1L offers.
- Most of the data that the classification part of the program uses are measurements of which
the values are related to ECG leads, e.g., Q duration, R aroplimde, etc. D1L supplies a data
type lead which can be used to store these lead-related measurements. The 12 standard
leads have been predefined as lead variables. Thus, the Q aroplitude in lead a VF is accessed
by the expression: Q_amp in aVF. A similar data type location is supplied. which is
primarily used in the classification of infarctions (anterior, inferior and the like).
79

- ECG conditions are often expressed by means of set-wise operations on lead-related
measurements, e.g., "condition is true if Q amplitude is smaller than -100 JlV in at least two
of leads II, ill, and a VF". In DTI.., this would read:
(Q_amp < -100) in 2 of II, III, aVF The general syntax of these lead conditions is:
(<expression>) in [<number> of] <lead list> where items between square brackets are optional and items between angle brackets must be
specified by the user. The <expression> can be an arbitrary DTI.. condition in which
lead~related measurements can occur. The <number> of clause indicates the number of
lead variables for which <expression> should at least be true in order that the lead
condition be fulfilled. If this clause is omitted, <expression> must be true in all of the
leads specified in <lead list>. The <lead list> may contain ranges. For location
variables, location conditions may be defined in a similar syntax.
- D1L has a number of control structures. First, there are two conditional statements: The
'if-then' and 'if-then-else' constructs. Second, several looping constructs are available. The
'for·in-do, construct can be used to execute a group of statements a certain number of times.
The values of a list are successively assigned to an index variable and the group of statements
is executed at each iteration. The list may contain (ranges of) integer values. lead variables.
or location variables. The following example shows a for-loop in combination with if-then
statements:
for lead in I, II, (Vl .. V6) do if (QRS_dur in lead > 100) then ... end_if; if (lead is II) then ... else ... end_if;
end_for; Two other looping-constructs are: 'loop-while' and 'loop-until'. The former is used to execute
a group of statements for as long as a certain condition holds. the latter is executed until the
condition holds.
- D1L has to its disposition ternary comparison operators. These can compare three numerical
or string values. For instance, the following condition tests whether the ratio of the Q
amplitude and R amplitude is greater than one fourth and less than or equal to one third in
at least one of leads V3 or V4:
(1/4 < QR_ratio <~ 1/3) in 1 of (V3, V4) - DTI.. supports procedures and functions that enable modular program development. The
difference between these program units (a function or a procedure) is that a function returns
a value. whereas a procedure does not. Arguments may be passed from one program unit to
another. For instance. a function compute_ score which calculates a point score for L VH
diagnosis might be called in the L VH program unit:
point_score <- compute_score(S_amp in Vl, R_amp in V5)
80
The function takes two arguments and returns a value which is assigned ( <-) to variable
point_score.
Interpreter and translator
DTI.. may either be compiled or interpreted. The D1L translator converts DTI.. program units
to routines in a high-level computer language (Cor C++) which are subsequently handled by
the language (and system) specific compiler and linker. The DTL interpreter provides a number of facilities for tracing, logging and debugging a
D1L program. Some of its features are:
Break TtWde. While interpreting a program unit, the user may enter break mode, either by hitting
the break key or by reaching a program line where he has specified a breakpoint prior to
program execution. The user then may inspect and change data or program units, and give other
commands. With the 'continue' command execution of the program is resumed.
Verbose mode. When the interpreter is in verbose mode, every statement is shown to the user
before it is executed. Step mode. When the interpreter is in step mode, the program is executed one statement at the
time. After every statement, the interpreter enters brea.'< mode. This feature is especially useful
when combined with the verbose mode.
To enable the incorporation of complex algorithms (e.g., dedicated computer-intensive
computations and I/0 routines) in an efficient way without compromising the readability and
simplicity ofD1L, 'foreign units' can be defined. Foreign units are procedures or functions that
can be called from DTI... using the normal calling conventions, but that are written in language
other than DTI... In the current implementation, foreign units are written in C or C++ and are
linked with the interpreter.
Material
D1L was applied on the classification parts of our ECG computer program MEANS
(Modular ECG Analysis System) [3]. MEANS has subprograms for contour classification of the
ECG and the VCG [4], rhythm classification [5] and Minnesota coding [6]. All programs were
written in FORTRAN.
Various databases of ECGs were used so that learning and testing could be carried out on
independent materiaL One database served as a test set only and was collected in the project 'Common Standards for Quantitative Electrocardiography' (CSE) [7], an international
cooperative study for standardization and evaluation of ECG computer programs. It coD:tains
1220 cases which consist of simultaneously recorded ECGs and VCGs, sampled atSOO Hz for
81

8 or 10 s. The database has been validated by ECG-independent evidence. This 'gold' standard,
however, is only known to the CSE coordinating center. The composition of the database has
been made public. We will distinguish three main categories: 'hypertrophy' (N=219), including
cases with left, right, and hi-ventricular hypertrophy, 'myocardial infarction' (N=547), including
cases with infarction irrespective of location and cases with combined infarction and
hypertrophy, and 'normal' (N=382).
Interactive optimization procedure
The procedure that was used for the optimization of the classification algorithms consisted
of the following steps:
1. Translate the FORTRAN classification program into DTL. The knowledge accumulated in
the existing FORTRAN program had to be the basis for further improvement. Thus, the
initial DTL program should behave exactly the same as the FORTRAN program.
2. Test the equivalence of the FORTRAN program and the DTL program. Equivalence was
tested by Jetting both programs process a database of cases and comparing the output
statements. Each difference was traced back to its cause and the DTL program modified
accordingly. Fmally, when the outputs of the programs were completely the same, the
FORTRAN program was discarded and the DTL program became the current version of the
classification program.
3. Scrutinize the DTL program for errors and inconsistencies. The DTL program was easily
readable for a cardiologist (GvH) and could thus be checked without the services of a
computer expert.
4. Implement suggestions for improvement. A new version of the D1L program was generated
with the possible improvements proposed by the cardiologist, while retaining the previous
DTL program.
5. Test modifications. With the new version a database of ECGs was processed. The
classifications could be compared with two references for the same database: either the
classifications of the previous version of the DTL program, or the cardiologist's
interpretations.
6. Evaluate modifications. All discrepancies between the results of the new version of the D1L
program and the reference were studied. The more difficult cases were traced with the D1L
interpreter. New ideas for improvement could easily be implemented on-line and tested
interactively.
7. Repeat steps 4 to 6, with each new version in tum becoming the current version until a
'stable' version is obtained. A version was considered stable if no or only irrelevant changes
occurred between the new and current versions.
82

Results
The first and second step of the optimization procedure, the translation from FORTRAN into
D1L and the testing of their equivalence~ was time consuming, ta.lcing roughly two to three
months for each of the three programs: ECG and VCG contour classification and rhythm
analysis. This was due to the less than perfect documentation of the FORTRAN programs and
to the labor involved in tracking the reasons for differences between the FORTRAN and DTI.
versions. Although it proved easy, by means of the interpreter, to follow the classification
process in DTL, the flow of control in the FOR1RAN version could often only be traced after
singling out critical points in the program source, inserting print statements, and recompiling
and linking. The ability to include foreign program urdts in D1L was mostly used in the rhythm
analysis program where many dedicated C++ programs have been linked with the D1L
programs. The flexibility provided by special-purpose I/0 routines enabled to efficiently enter
data in the D1L program and to mimic the original FORTRAN output completely. A beneficial
side effect of meticulously translating the FORTRAN program in D1L, was that several hidden
errors in the original programs were found.
After this conversion, the actual ECG classification program was now perspicuous to the
cardiologist in our team without help of a computer expert (step 3). Modifications and
extensions were then proposed.
In the subsequent stage (steps 4 to 6 in the optimization procedure) the results of the D1L
version under consideration were compared to the reference (a previous version, or the
cardiologist's classifications). Several main categories were distinguished, such as left
ventricular hypertrophy, inferior myocardial infarction, etc. Program changes, while producing
intended improvement in some cases, xr..ay have the opposite effect in other cases. Therefore,
the program was run again on the database and all discordant results were scrutinized with the
DTL interpreter. This gave rise to new ideas that were preliminarily implemented and tested.
Finally, a set of modifications was agreed upon. Their implementation in D1L typically took
less than one hour. Then the compiled version of DTL was run on the entire database. This
process generally took a day and was repeated several times (step 7).
To assess the effect of the modifications made, the results of the ECG contour classification
program were compared against the 'clinical evidence' for the CSE database. Conform the
procedure used in the CSE project, the output statements were mapped to four main categories:
'normal', 'hypertrophy', 'infarction', and 'other'. A case was mapped to the 'other' category
when the program stated a major conduction defect (a category not present in the database) as
a single statement. In Table 1 the results of the original ('old') ECG classification program, i.e.,
prior to modification, and the results of the latest ('new') version are given. The specificity
increased from 94.6% to 97.1 %, while the positive predictive value (ppv) for normal slightly
83

increased. The sensitivity for hypertrophy dropped 8.9% which was more or less compensated
by an increase of 10.5% in the ppv. The sensitivity for infarction increased from 58.1% to
67.2% while its ppv remained similar. The total accuracy increased from 67.5% to 69.8%
(P = 0.02, equivalence tested with Wilcoxon's signed-rank test [8]). These values give au
indication of the improvement attained in a limited time spao. It should be stressed. however,
that we only scrutinized pan of the classification algorithms. We are aware of several omissions
and flaws in the remaining programs and further improvements are currently being investigated.
Table 1. Classification matrices of the ~old' and Lnew• ECG program results against the 'clin.ical
evidence' for the CSE diagnostic database (N=l220).
computer program
'old. 'new·
clinical
evidence nor hyp inf other nor hyp inf other N
normal 94.6 3.0 2.2 0.1 97.1 0.3 2.6 0.0 382
hypertrophy 35.1 51.6 72 6.1 43.0 42.5 9.1 5.4 291
infarction 31.7 5.3 58.1 4.9 26.5 2.5 672 3.7 547
positive predictive
valne 56.8 78.9 91.5 57.9 89.4 91.8
Discussion
The main objective in developing D1L and its interpreter was to create a tool for
optimization of heuristic ECG classifiers. There are no principal reasons why the results that
were attained might not have been reached by the more conventional approach, i.e., by
modifying the algorithms written in the compiled computer language directly. However, such
an approach would have been so time consuming and cumbersome as to make it impracticable.
The greatest asset of the language is its almost colloquial nature. A cardiologist, siuing
behind the terminal, can understand the functioning of the program without previous ttaining
and can pinpoint flaws and suggest improvements immediately. Errors can be fixed on-line. The
interactivity of the system stimulates experimentation: new ideas are quickly implemented and
tested as to their viability. Any diagnostic proposition from the cardiologist could so far be
readily rendered in DTI.., in an easily comprehensible form.
84
In the past, other languages have been developed to facilitate the development of heuristic
ECG classifiers: DCDL (Diagnostic Criteria Decision Language) [9] and Hewlett Packard's ECL
(ECG Criteria Language) [10]. These languages differ from DTI.. in many respects. For instance,
they do not provide if-then-else or loop-constructs, and ternary comparison operators; they
permit only a restricted form of program modularization; no foreign units can be used. Another
important difference is that the programs are compiled instead of inte~preted: No particular
facilities are provided to acquire insight into the actual classification process, and to modify and
test the algorithms interactively. These are features that we found very useful in DTI.. for
developing our classification algorithms.
The method of stepwise refinement appears to be successful. However, if the sarce database
of cases is alternatively used as a learning and test set. there is the potential danger of adjusting
to it. An experienced cardiologist,. who is well aware of this caveat, knows how to balance
between elaboration of diagnostic criteria to include cases from a limited database, and
generality of the rules. Improvement of diagnostic discrimination is not brought about by mere
adjustment of threshold values, a trade-off between sensitivity and specificity, but by application
of new or additional knowledge, hopefully increasing both sensitivity and specificity. Another
safeguard is to have a fmal evaluation performed independently: the CSE diagnostic study [11]
provides such a possibility. It should be kept in mind that it is the skill of the expen that
determines the success of the classification program. D1L is a tool to ease the job, but the tool
cannot be blamed for a disappointing result.
Acknowledgment
We are grateful to the CSE coordinating center (Dr. J.L. Willems, Catholic University
Leuven, Belgium) for providing the evaluation results on the CSE diagnostic database.
References
[1] Kors JA. Van Bcmmcl JH. Classification methods for computerized classification of the electrocardiogram.
Methods lnf Med 1990;29:330-36.
[2] Kors JA. Kamp DM. Snocck Henkemans DP. Van Bemmel JH. D1L: A language to assist cardiologists in
improving classification algorithms. Comput Methods Programs Biomed 1991:35:93~110.
[3] Van Bemmel JH, Kors JA. Van Hcrpen G. Methodology of the Modular ECG Analysis System IviEANS.
Methods lnf Med !990;29:346-53.
[4] Talman JL. Pattern Recognition of the ECG: A Struccwed Analysis (Thesis). Amsterdam: Free University,
1983.
[5] Plokker HWM. Cardiac Rhythm Diagnosis by Digital Computer (Thesis). Amsterdam: Free University. 1978.
85

[6] Duisterholl! JS, May JF, Van Herpen G. A computer program for classification of ECGs according 10 the
:Minnesota code. In: Van Bemmel JH. Willems JL. eds. Trends in Computer-Processed Electrocardiograms. Amsterdam: North-Holland Pub! Comp, 19n:345-9.
[7] Willems JL. Arnaud P. Van BemmelJH. et al. Common standards for quantitative electrocardiography: Goals
and main results. Methods lnf Med 1990:29:263-7!.
[8] Michaelis J. Wellek S. Willems JL. Reference standards for software evaluation. Methods Inf Med
1990;29:2&9-97.
[9] Rubel P. Arnaud P. Prevot D. Systeme d'aide a Ia decision. Application a l'lntcrprCtation automatique des
vectocardiogrammes. Int J Biomed Comput 1975;6:193-211.
[10] Balda RA, Vallance AG, Luszcz 1M, Stahlin FJ, Diller G. ECL: A medically oriented ECG criteria language
and other research tools. In: Ostrow HG. Ripley KL. eds. Proc Computers in Cardiology 1978. Long Beach:
IEEE Comput Soc, 1978:481-95.
[11] Willems JL. Abreu-Lima C. Arnaud P. et al. Evaluation of ECG interpretation results obtained by computer
and cardiologists. Methods lnf Med !990:29:308-16.
86
CHAPTER6
The Delphi Method to Validate Diagnostic Knowledge in
Computerized ECG Interpretation
J.A. Kors, A.C. Sittig, J.H. van Bemmel
Department of Medical Informatics, Erasmus University, Rotterdam, The Netherlands
Methods of Wormation in Medicine 1990;29:44-50
87
Abstract
We investigated the applicability of the Delphi method for increasing the agreement among
multiple cardiologists on, firstly, their classifications of a set of electrocardiograms and,
secondly, their reasons for these classifications. Five cardiologists were requested to judge the
computer classifications of a set of thirty ECGs. If a cardiologist disagreed with the computer
classification, he had to provide a new classification and a reason for this change. The results
of this first round were compiled and anonymously fed back to the cardiologists. In a second
round the cardiologists were asked once again to judge the ECGs and to rate the reasons
provided in the first round. The level of agreement was estimated by means of the kappa
statistic. The Delphi procedure substantially increased the agreement on the classifications
among the cardiologists. The final agreement was very high and comparable with the
intraobserver agreement. There was also a high level of agreement on the reasons provided by
the cardiologists. However, their use in improving the program's performance is harnpeted by
the qualitative nature of many of the reasons. Suggestions are given for a more formalized
elicitation of knowledge.
Key words: Kappa statistic, interobserver agreement. knowledge validation
88

Introduction
The central problem of this paper is: How is one to determine and possibly improve the
performance of a computer program for the classification of electrocardiograms (ECGs)? Asking
ourselves this question we had a particular interest in further improving the classification pan
of our ECG interpretation program MEANS (Modular ECG Analysis System) [1].
In order to assess the performance of a computer program one must be able to tell whether
a computer classification is (partly) right or wrong. One way to resolve this issue is by
comparing the classifications of the program with those of a cardiologist for a set of ECGs.
Such an approach, however, has ao important drawback. The interobserver agteement - i.e., the
agreement between two or more cardiologists - on the interpretation of the ECG has been
proven to be rather low [2,3]. One would like to compare the computer classifications with the
classifications that a gtoup of cardiologists have agteed upon. The problem, then, is how to
increase the agteement on ECG classification by multiple cardiologists.
If one knows for what cases the program is wrong, one may start to improve the program's
performance. Usually, learning and test sets of ECGs are used to develop and modify, and test
classification algorithms. It may be vety difficult, however, to acquire databases of snfficient
size and one may have to resort to rules or algorithms provided by the cardiologist.
Furthermore, a cardiologist may suggest new features to be used in the classification algorithms.
Again, one would like to use knowledge that a group of cardiologists has agteed upon. The
problem is how to aggregate the knowledge on ECG classification obtained from multiple
cardiologists.
Thus. for improving and maintaining ECG interpretation systems we are interested in two
types of data: the changes made by the cardiologists in the computer classifications and their
motivations for doing so. Providing there exists a high agreement among the cardiologists, the
former type would give us a clue to the performance of the program and the latter would show
the relevant knowledge of the cardiologists in those cases where the program was in error or
did lack the necessary knowledge.
The objective of this srudy was to assess the feasibility of one particular technique, the
Delphi method, to tackle the two problems mentioned above. The Delphi method, which
originated at the Rand Corporation [4], is a technique to increase the agreement among expens
on some subject matter. Essentially, it is an anonymous feedback technique. It has been used in a wide variety of fields [5,6], including medicine [7-10]. However, to the best of our
knowledge it has not yet been applied to the questions we asked ourselves in this study: How
to assess and possibly improve the performance of a computer program for the interpretation
of medical data
89

Material :md methods
The material consisted of a set of thirty ECGs. They were taken from a larger data set which
had been collected in an international study to establish and compare the petformance of
programs for computerized ECG intOipretation. In the latter study, called the CSE project
(Common Standards for Quantitative Electrocardiography) [11,12], the ECGs were validated by
means of ECG-independent material. The 'true' classification, however, was kept secret by the
coordinating center. We, therefore, asked the CSE project cooo:linator to suggest a (stratified)
random sample of thirty ECGs containing 30% normal ECGs and a mixture of pathological
ECGs.
Delphi method
The main features of the Delphi method are: (a) anonymity, and (b) feedback and iteration.
Anonymity means that every expen in the group provides his or her opinion on the subject
matter without reference to the others. Usually a questionnall'e is used. In this way the possibly
negative effects of direct group interaction are minimized. Also, there is no need to convene the
expens. After the first round a 'moderator' compiles the results which are reponed to the group
without identifying who provided which opinion. With this additional information the expens
are asked to provide their opinions again. This process may be repeated for several rounds. It
is then expected that the judgments will converge, ideally reaching some sort of consensus.
Expens
The group of expens consisted of five clinical cardiologists. Three of the cardiologists
worked in the cardiological departments of different university hospitals, the other two in
general hospitals with specialized cardiological departments. The names of the participating
cardiologists were not revealed to each other.
First round
The material which was provided to the cardiologists in the first round of the Delphi study
consisted of an ECG plot and a classification form for each of the thirty ECGs. The plots had
standard time and amplitude scales: 25 mm/s and 10 mm/mV, respectively. The classification
form listed age and sex of the patient as well as a number of categories for classification:
'normal', 'left ventricular hypertrophy' (LVH), 'right ventricular hypertrophy' (RVH), 'anterior
myocardial infarction' (AMI), 'inferior myocardial infarction' (IM!), and 'other'. The infarction
and 'other' categories were divided in subcategories in order to provide the cardiologists with
the categories that they were used to in classifying ECGs. The certainty about the presence of
a particular category had to be indicated by one of the qualifiers 'definitely', 'probably',
90

'possibly', and 'definitely not'. In the first round we indicated the computer classification on
the classification form.
The Delpbi procedure was as follows: If the cardiologist agreed with the computer
classification, no action was required. However, if he disagreed with the computer classification,
he had to provide a new classification as well as a motivation for the changes. Thus each
cardiologist judged (independently) the set of 30 cases, yielding 150 different inte!jlretations.
Second round
After this first round, for each ECG all categories that had a qualifier other than 'definitely
not' given by either the computer program or the cardiologists. were compiled on one page
together with the motivations, if present Given such a category, all four qualifiers were listed,
i.e, also the ones wbich had not been chosen by the computer program or the cardiologists. The
number of times that each qualifier had been chosen was indicated. For instance, if the computer
classification had been 'definitely' on some category and two of the five cardiologists had
agreed, one had chosen 'probably' and two had chosen 'definitely not', the form would indicate
that for this category 'definitely' had been chosen three times, 'probably' once, 'possibly' zero
times, and 'definitely not' twice. Both 'probably' and 'definitely not' would have motivations
attached. The source of the classifications and motivations, however, was not revealed except
for the computer classification.
In a second round the cardiologists were again asked to give their classifications based on
the information provided and the plots. They now had to ma.lce an explicit choice for each of
the listed categories since the computer classification was not used as a default. If they chose
a category with a qualifier for which one or more motivations had been given in the first round,
they had to label each motivation as: 'acceptable'. 'not acceptable'. or 'unclear'. If no
motivation was present. that particular combination of category and qualifier had either been
computer-generated or it had not been chosen in the first round. In the former case no further
action was required. In the latter case a motivation had to be provided as would have been the
case if a completely new category had been chosen.
Although the cardiologists were requested to be as quantitative as possible, no restrictions
were imposed on the format of their motivations.
Measure of agreement
We used the kappa statistic as a measure of agreement [13-15]. Kappa is defined by the
following expression:
k P. -P •
. appa = --, 1-p,
91

in which p. is the observed proportion of agreement aod p, is the expected proportion of
agreement, i.e., the proportion to be expected if the observers assign the cases randomly. In the
following it is assumed that the agreement between only two observers is computed.
The observed proportion of agreement is defined as
p o = ~ Wi;Pij' .., where p,1 is the proportion of cases classified in category i by the first observer and in category
j by the second, and w1; is a weighting factor between categories i and j. Generally, w1; = 1 if
i = j and wv = 0 if i,. j. Then, the observed proportion of agreementp. is equal to the sum of
the diagonal elements Pu· The use of non-zero weights fori ~ j allows one to express that cases
classified in category i by the first observer and in category j by the second still contribute to
the agreement. For instance, one may consider a case classified as anterolateral infarction by
one observer in some agreement with a classification as anteroseptal infarction by the other.
The expected proportion of agreement is defined as
Pe = L w,:;mi.mJ, i.i
where m;... is the proportion of cases classified in category i by the first observer. and mJ is the
proportion of cases classified in category j by the second observer.
Kappa equals one in case of perfect agreement because then p. = 1. Kappa equals zero if
Po = p~ ie., if the observed agreement is equal to the chance-expected agreement. The
interpretation of kappa values between zero and one is somewhat subjective. Landis and Koch
[16] distinguish several ranges of values. Kappa values below 0.40 may be taken to represent
poor agreement; values above 0.75 excellent agreement and values between 0.40 and 0.75 fair
to good agreement.
The kappa statistic has a number of desirable properties. Most notably, it can also be used
in case of more than two observers with only minor modifications in the computation of Po and
p., it takes into account chance agreement, and its variance can be estimated [14,15] which
allows for hypothesis testing.
Results
The agreement on the classifications and motivations given by the five cardiologists~ and the
change in agreement from round one to round two were studied in several ways. First, the
agreement on the classifications will be presented. The kappa statistic is used to quantify this
92

agreement. The results have been compared with the computer classifications and with the
classifications that were obtained from a panel of other cardiologists participating in the CSE
project. Secondly, the agreement on the motivations will be evaluated. Quantification here is far
more difficult because there are missing values and there are no obvious classes to assign the
motivations to; the motivations are hard to compare. The results of simply counting the number
of motivations will be given.
Classification
We investigated the agreement on the classifications for different levels of detail. A
reduction in detail is achieved if some of the original categories and qualifiers are combined.
In effect, this corresponds with a classification based on fewer categories and qualifiers. The
way in which the categories and qualifiers are combined will be called a coding scheme and the
categories that are used in the coding scheme (and possibly are a combination of the original
ones) will be referred to as 'basic' categories.
We computed the level of agreement for three coding schemes. In the first coding scheme
the basic categories are the same as the six original ones but only the absence or presence of these categories was scored. The qualifiers 'possibly' and 'definitely not' are taken to imply
absence of the category, and the qualifiers 'definitely' and 'probably' are taken to indicate
presence. The data resulting from this coding scheme are presented in Table 1.
In the second coding scheme,. only four basic categories were discerned: 'normal,.
'hypertrophy' (combining LVH and RVH), 'myocardial infarction' (combining AMI and IMI),
and 'other,. Again. only the absence or presence of the basic categories was determined as
described above. For instance, "possibly L VH" would not be scored and "probably AMI" would
be scored as 'myocardial infarction'.
Finally. we computed the agreement for a coding scheme consisting of two basic categories:
'normal' (classified by the cardiologists as 'normal' with qualifier 'definitely' or 'probably'),
and 'abnormal' (all other classifications).
In the latter coding scheme, the basic categories are mutually exclusive. The weights w;i
between category i chosen by one cardiologist, and category j chosen by another, are 1 if i = j,
and 0 otherwise. In the two other schemes, however, a particular case could have been classified
as belonging to more than one basic category. If so. it was considered to belong to a new
category made up of the given ones. The weights w;i are now defined as the number of basic
categories that category i and category j have in common (#{i (")j)) divided by the number of
different basic categories in i andj (#{i u j)).
93
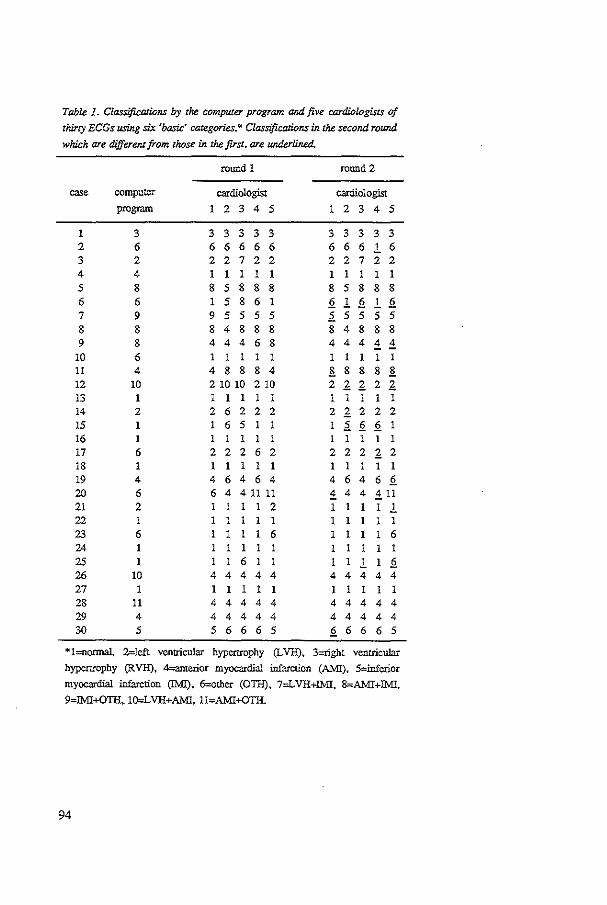
Table 1. Classifications by the computer program and five cardiologists of
thirty EGGs using six 'basic' categories.* Classifications in the second round
which are different from those in the first, are underlined.
round 1 round 2
case computer cardiologist cardiologist program 1 2 3 4 5 1 2 3 4 5
1 3 3 3 3 3 3 3 3 3 3 3 2 6 6 6 6 6 6 6 6 6 ! 6 3 2 2 2 7 2 2 2 2 7 2 2 4 4 1 l 1 1 1 1 1 I I I
5 8 8 5 8 8 8 8 5 8 8 8 6 6 1 5 8 6 1 2 ! 2 ! 2 7 9 9 5 5 5 5 .2. 5 5 5 5 8 8 8 4 8 8 8 8 4 8 8 8 9 8 4 4 4 6 8 4 4 4 ± ±
10 6 1 I I 1 1 1 I I 1 I 11 4 4 8 8 8 4 B. 8 8 8 B. 12 10 2 10 10 210 2 1 1 2 1 13 1 1 1 1 1 1 1 1 1 1 1 14 2 2 6 2 2 2 2 1 2 2 2 15 1 6 5 .2. 2 2 1 16 1 l 1 1 l l I 1 1 I 1 17 6 2 2 2 6 2 2 2 2 1 2 18 1 1 I 1 1 1 I I I I 19 4 4 6 4 6 4 4 6 4 6 2 20 6 6 4 4 11 11 ± 4 4 ±11 21 2 1 1 l 1 2 1 1 1 ! 22 1 1 1 1 1 1 1 1 23 6 1 1 I 6 1 I 1 1 6 24 I 1 1 1 l 1 25 1 1 6 1 ! 2 26 10 4 4 4 4 4 4 4 4 4 4 27 1 1 I 1 1 I 1 1 I 1 28 11 4 4 4 4 4 4 4 4 4 4 29 4 4 4 4 4 4 4 4 4 4 4 30 5 5 6 6 6 5 2 6 6 6 5
*!=normal. Z=left ventricular hypcmophy (l.VH), 3=right ventricular
hypertrophy (RVH), 4=anterior myocardial infarction (AMI), S=inferior
myo=dial infarction (IMI), 6=other (OTil), 7=L VH+IMI, 8=AMI+IMI,
9=lMI+OTil, lO=LVH+AMI, 11=AMI+OTil.
94

In Table 2 the kappa values are given for the agreement between the five cardiologists in
the first and the second round. In the first row of Table 2 the results are given for the
classification using six basic categories. The kappa value of 0.68 in round one increases to 0.81
in round 2. Assuming that kappa follows a normal distribution [14,15], this difference is
statistically significant (z = 2.61, P < 0.01). We also computed the kappa based on the results
submitted by six cardiologists participating in the CSE project. These cardiologists were from
different countries in the European Community; none of them participated in the present study.
The kappa value is in concordance with the kappa of the first round. The difference is not
statistically significant (z = 1.01, P = 0.31).
In the second row of Table 2 the kappas are given for the coding scheme consisting of four
basic categories. The first round kappa is 0. 70 and increases to a kappa of 0.81 in the second
round, a difference which is statistically significant (z = 2.32, P = 0.02). Again, the agreement
of the CSE referees (kappa = 0.66) is comparable with the kappa of the first round (z = 0.59,
p > 0.50).
The last row in Table 2 shows the kappas for the two-class coding scheme. The fnst and
second round kappa and the kappa of the CSE project are almost the same. Applying this coding
scheme, the Delphi procedure did not result in an increase of agreement.
Table 2. Kappa values reflecting the degree of agreement in classifying thirty ECGs for
three coding schemes.
coding scheme Delphi round 1
six basic categories 0.68 (0.06*)
four basic categories 0.70 (0.06)
two basic categories 0.83 (0.07)
*standard error of the kappa statistic.
Delphi round 2
0.81 (0.06)
0.81 (0.06)
0.83 (0.07)
CSE study
0.62 (0.05)
0.66 (0.06)
0.77 (0.07)
Table 3 shows kappa values which reflect the intraobserver agreement between the
cardiologist's classifications of round one and those of round two for the three coding schemes.
Since the results of the second round were obtained after (anonymous) feedback, these
agreements are not intraobserver agreements in the strict sense; however, they still give a
measure for the instability within one observer. The interobserver agreement of the first round
is consistently lower than the intraobserver agreements for the coding schemes that use four or
six basic categories. The interobserver agreement of the second round, however, is similar to
the intraobserver agreement for all coding schemes.
95

Table 3. Kappa values reflecting the inzraobserver agreement of five
cardiologists for three coding schemes.
coding scheme cardiologist
1 2 3 4 s
six basic categories 0.82 0.85 0.85 0.75 0.76
four basic categories 0.83 0.83 0.83 0.74 0.79
two basic categories 0.93 0.93 093 0.80 0.78
We also determined the agreement between the computer program on the one hand and the
cardiologists on the other hand. The kappa values for the first and second Delphi rounds are
given in Table 4. The agreement between the program and the cardiologists is substantially
lower than the agreement between the cardiologists alone (cf. Table 2). The kappa values of the
second round are lower than those of the first. Apparently, the cardiologists' classifications in
the second round, while showing an increasing agreement, are further away from the computer
classification as compared to their first-round classifications.
Table 4. Kappa values reflecting the degree of
agreement between the computer program and the
group of five cardiologists for three coding schemes.
coding scheme
six basic categories
four basic categories
two basic categories
Motivations
round 1
0.56
0.57
0.66
round 2
0.50
0.52
0.61
The cardiologists were asked to motivate any change which they made in the computer
classifications they were presented with in the first round. If, in the second round, they
classified a case as belonging to a certain category-qualifier combination for which one or more
motivations were given in the first round, they had to rate these motivations as one of
~acceptable'. 4not acceptable', or ~unclear·. In the first round 167 motivations were given. These
were rated 599 times in the second round.
96

We were especially interested in those cases that showed a discrepancy between the
computer classification and the classifications of the cardiologists prov:ided that they had reached
some sort of consensus. We assumed consensus on a ca:;e to be present if at least four of the
five catdiologists agreed on its classification.
Taking the coding scheme for six basic categories, in thirteen cases the computer
classification (partially) diffeted from such a consensus classification (cf. Table 1). In Table 5
the ratings of the motivations after the second round are given for these cases. Three classes are
distinguished: 'acceptable', 'not acceptable', and 'unclear'. If a cardiologist did not rate a
motivation that he was expected to, it was counted as 'unclear'. Only 23% of the 'unclear'
scores were explicitly marked as such. Striking is the low number of 'not acceptable' ratings:
4.3% (9 out of 211 ratings). The number of cardiologists that rated a motivation as 'not
acceptable' exceeded the number of cardiologists rating it as 'acceptable' for only three
motivations (out of a total of 53). Even if all 'unclear' ratings would be added to the 'not
acceptable' rating, for still 75% of the motivations (40 of 53) the number of cardiologists that
rated a motivation as 'acceptable' would be greater than those rating it othervvise.
In Table 5 motivations occur that were rated by less than five cardiologists. This
phenomenon is due to the fact that only those motivations had to be rated that were attached
to the chosen category-qnalifier combination. For instance, the computer classification was
"definitely not LVH", and three of the five cardiologists chose "probably LVII" and the
remaining two "definitely L VH" in round two. Complete agteement was reached but the
motivations that had been prov:ided in the first round were rated only two and three times.
Table 5. Acceptability of che modvarions that were given by the cardiologists
when changing the computer classification. The motivations are rated as one of
~acceptable' (ace), 'not acceptable', or 'unclear'. The motivations pertain. to
thirteen cases where the compU1er cbo.ssification differed from a consensus
classification of the cardiologists.
number of number of number of ratings
cardiologists rating different
a motivation motivations ace not ace unclear
1 4 2 0 2
2 4 4 0 4
3 9 22 0 5
4 8 19 1 12
5 28 82 8 50
53 129 9 73
97

Discussion
We investigated the feasibility of the Delphi technique to solve the two central problems of
this study: (a) How to increase the agreement on ECG ciassification by multiple cardiologists
and (b) how to acquire the knowledge that they are using. Our interest in these questions was
motivated by the difficulties we encountered in assessing and possibly improving the
performance of a program for the interpretation of ECGs.
We will first discuss the results of the Delphi procedure with respect to the classifications
and motivations. Thereafter we will address some general issues related to the Delphi method
and indicate the lessons learned from this smdy.
Classification
Although many Delphi studies have been conducted in the medical field, few were directed
at increasing the agreement on a ciassification task. In one study by Nagy et a!. on the
classification of premalignant urothelial abnormalities [9], the severity of only one category was
scored. The scores. which were on an ordinal scale, were assigned numerical values and the
mean and standard deviation were taken to represent the group opinion and dispersion of the
opinions respectively. In ECG classification such an approach is not feasible since multiple,
partially nonexclusive, categories may be scored.
Two other studies to improve the diagnostic accuracy of radiologists were reponed [7,10].
In both studies the percentage of correct diagnoses as compared to a gold standard is used to
quantify the effect of the Delphi procedure. This approach has two important limitations. Firstly,
the percentage of correct diagnoses (which is the observed proportion of agreement Po in case
of two observers and weights wii that are one if i = j and zero otherwise) does not take into
account the chance-expected agreement. Secondly, effectively two 'experts• are compared: one
'expen' is the gold standard, the other 'expen' is the group of referees. If more than two experts
need to be compared the agreement will be harder to quantify.
These problems are remedied by the use of the kappa statistic. We advocate its use as a
means to quantify the agreement between experts and the changes between various rounds of.
e.g., a Delphi procedure.
The agreement on the ECG classification depended on the coding scheme that was used to
codify the original data. The results show that the agreement on the classification into 'normal,
and 'abnormal, in round one was similar to the agreement in round two. Furthermore, the initial
agreement was already very high. However, if the abnormal class is subdivided, the kappa
values show that a Delphi procedure increases the agreement substantially. The fmal agreement
is similar to the agreement which was obtained in the two-category classification. It is also
comparable to the intraobserver agreement of the individual cardiologists.
98

After the first round, the agreement between the computer classification and the
cardiologists' classifications proved to be considerably lower than the agreement between the
classifications of the cardiologists alone. The disagreement was even higher after the second
round. Apparently~ the computer classification is not yet at an expert level and has to be further
improved.
Motivations
The cardiologists were asked to provide a motivation for each change that they made in the
computer-generated classification. In the second Delphi round we expected a convergence in the
multitude of motivations which had been given in the first. Thus, as we hoped, some of the
knowledge which cardiologists use in ECG classification might emerge.
We were especially interested in the motivations given for those cases where the
cardiologists' classifications showed a consensus which differed from the computer
classification. As it turned out, very few of the motivations were considered 'not acceptable •.
The acceptance of the motivations is apparently very high, even if in the first round more than
one motivation had been given for a particular category-qualifier combination. Three
observations may, at least partially, explain the high agreement. Fitstly, we did not attempt to
aggregate multiple motivations that were given in the first round. Thus, while the phrasing of
the motivations was different, their meaning might have been the same.
Secondly, in several cases multiple motivations tended to stress different criteria. Each
criterion then was rated as being an ·acceptable' motivation. This was most prominent for
motivations which subsumed others, for instance one motivation that listed a Q in both V5 and
V6 and another (on the same category-qualifier combination) that listed a Q in V5 only. Both
motivations then were rated as •acceptable.
Thirdly, many motivations were of a qualitative nature. Expressions like "large Q", "normal
R~wave progression", ••1ow T", .. no voltage criteria", were very frequent and will have been
accepted more easily than truly quantitative criteria.
Is the Delphi procedure the answer to the central problems of this study? Firstly, the Delphi
procedure was successful in increasing the agreement on ECG classification by multiple
cardiologists and thus may be used to determine the performance of a computer program.
Secondly, in asking the cardiologists to provide motivations we hoped for the elicitation of
knowledge that might be used for the improvement of our current ECG classification program.
This goal proved to be too ambitious, at least in the current setup. Although the agreement on
the motivations after the second Delphi round was very high, the motivations were too
incomplete and too fuzzy to be useful in the adaptation and creation of classification algorithms.
In order to be useful, a more formalized approach has to be followed. The cardiologists should
no longer provide qualitative motivations but, instead, should comment on features and rules
99

in a decision model (e.g., a decision tree). Both the computer classification and the relevant part
of the decision tree which resulted in that classification should be presented to the cardiologists.
In this way the comments of the cardiologists will be directly related to the classification
algorithm.
The Delphi method has been criticized for its possible lack of accuracy even if a high
agreement has been reached. For example, two cardiologists may agree on the interpretation of
an ECG, and yet both be wrong as compared to conclusive evidence acquired by catheterization
or autopsy. Indeed, we feel there are no intrinsic reasons why the application of the Delphi
procedure would result in an accurate outcome. In our opinion the Delphi method is most
valuable in situations where the ~truth~ is unknown. This situation also occurs in ECG
interpretation. Spodick [17], amongst others, takes the stand that in order to minimize bias, the
ECG in fust instance should be judged on its own, i.e., without the use of ECG-independent
data except for the patient's age and sex. A final diagnosis based on all clinical data might of
course deviate from the ECG classification. Yet, this would not invalidate the initial
classification.
The present research indicates that still another application of the Delphi method is useful.
In the field of computerized ECG interpretation we are in need of validated databases of ECGs
that are to be used as learning and test sets for classification algorithms. The Delphi procedure
proves to be a means to reach a very high agreement on the classification of ECGs and may
thus be used to validate a large database.
Our study is to be considered as having an explorative character. It taught us that the Delphi
procedure can be used to reach a very high agreement on the classification of ECGs among
multiple experts. Thus, it is possible to detect cases where a computer program is in error or
lacks knowledge. This is an indirect way to use the Delphi procedure as a vehicle to acquire the
knowledge needed to actually improve and maintain a computer program for the interpretation
of medical data A direct way to improve a program is dependent on the way experts' feedback
can be formalized.
Acknowledgments
The authors would like to thank Dr. G. van Herpen (University Hospital, Leiden) who made
valuable suggestions concerning the questionnaires, and the cardiologists who participated in the
Delphi procedure: Dr. N. van Heme! (St. Antonius Hospital, Nieuwegein), Prof. P.G. Hugenholtz
(Thorax Center, Rotterdam), Dr. J.F. May (University Hospital, Groningen), Prof. E.O. Robles
de Medina (University Hospital, Utrecht), Dr. F.C. Visser (Free University Hospital,
Amsterdam). We are grateful to Prof. J .L. Willems, coordinator of the CSE project, for his
p=ission to use the CSE library for our stndies.
100

References
[1] Kors JA. Talman JL, Van Bemmel JH. Multilead ECG analysis. Comput Biomed Res 1986;19:2846.
[2) Acheson RM. Observer error and variation in the interpretation of electrocardiograms in an epidemiological
study of coronacy heart disease. Br J Prev Soc Med 1960;14:99-122.
[3] Simonson E. Tuna N, Okamoto N, Toshima H. Diagnostic accuracy of the vectorcardiogram and
electrocardiogram: A cooperative stndy. Am J Cardiel 1966;17:829~78.
[4] Dalkey NC. An experimenlal study of group opinion: The Delphi method. Furores 1969;2:408-26.
[5] LiDstone HA, TuroffM. The Delphi Method: Techniques and Applications. Reading: Addison-Wesley, 1975.
[6] Pill J. The Delphi method: Substance. context. a critique and an annotated bibliography. Socio-Econ Plan Sci
1971;5:57-71.
I7J Hillman BJ, Hessel SJ. Swensson RG. Herman PG. Improving diagnostic accuracy: A comparison of
interactive and Delphi consultations. Invest Radioll977;12:112-5.
[8] :Milholland AV, Wheeler SG, Heieck JJ. Medical assessment by a Delphi group opinion technique. N Engl
J Med 1973;288:1272-5.
[9] Nagy GK. Frable WJ, Murphy WM. Classification of premalignant urothelial abnormalities: A Delphi study
of the national bladder cancer collaborative group A. Pathol Annu 1982;17:219-33.
[10] Stargarde A, Lilning M. Die Delphi-Methode zur kollektiven Diagnosefmdung. Radiol Diagn 1982;23: 172-6.
[11] The CSE Working Party. Recommendations for measurement standards in quantitative electrocardiogrnphy.
Eur Heart J 1985;6:815-25.
[12] Willems JL, Arnaud P, Van Bemmel JH, et al. Assessment of the performance of electrocardiographic
computer programs with the use of a reference data base. Orculation 1985;71:523-34.
[13] Cohen J. A coefficient of agreement for nominal scales. Educ Psychol Measurcm 1960;20:37-46.
[14] Fleiss JL. Statistical Methods for Rates and Proportions. New York: J Wiley & Sons, 1981.
(15] Schouten HJA. Statistical Measruement of Inter observer Agreement (Thesis). Ronerdam: Erasmus University,
1985.
{16] Landis JR. Koch GG. The measurement of observer agreement for categorical data. Biometrics 1977;33:671-9.
[17] Spod.ick DR On experts and expertise: The effect of variability in observer performance. Am J Cardiol
1975;36:592-6.
101


CHAPTER 7
Reconstruction of the Frank Vectorcardiogram from Standard
Electrocardiographic Leads:
Diagnostic Comparison of Different Methods
J.A. Kors,1 G. van Herpen,2 A.C. Sittig/ J.H. van Bemmel1
'Department of Medical Informatics, Erasmus University, Rotterdam, The Netherlands
'Division of Cardiology, Academic Hospital, Leiden, The Netherlands
European Heart Joumall990;11:1083-92
103

Abstract
Three methods for reconstructing the Frank VCG from the standard 12-lead ECG were
studied. The first was based on multivariate regression, the second on a model of the cardio
electtical activity, and the thitd method used a quasi-otthogonal set of ECG leads.
The methods were evaluated on a test set of 90 cases by a numetical distance measure and
by the agreement in diagnostic classification of the original and reconstructed VCGs. The
original and reconstructed VCGs were presented separately and in random otder to three
referees. Eighteen of the original VCGs were presented three times to estimate the intraobsetver
agreement. Kappa statistics were used to quantify the agreement between diagnostic
classifications. Separately, one referee was simultaneously presented the original VCG and its
three reconstructions for all cases. Each reconstructed VCG was classified as either
diagnostically 'same' as the original, 'borderline'. or 'different'.
The performance of the regression method and the model-based method was comparable.
Both methods were preferable to the quasi-otthogonal method. The kappa values for the
preferred methods indicated a good to excellent diagnostic agreement between the original and
reconstructed VCGs. Only one out of ninety VCGs that were reconstructed with the regression
method was classified as 'different' compered to the original VCGs; three VCGs were classified
as 'different' with the model-based method. It was also found that estimation of similatity by
a distance measure could not replace diagnostic evaluation by skilled observers.
Key words: VCG reconstruction, evaluation of diagnoses, kappa statistic
104

Introduction
The usefulness of vectorcardiography has repeatedly been recognized [1-3]; its use, however,
has declined. From several possible explanations, the two most pertinent probably are that the
conventional vectorcardiogram (VCG) registration technique (photography, X-Y ploner) was
slower and more cumbersome than that of the electrocardiogram (ECG); and that users tended
to dislike the additional electrodes in unusual arrangements and positions that are required by
vectorcardiographic lead systems. The latter obstacle might be removed if the VCG could be
adequately synthesized from conventional ECG leads. Modern electrocardiographs, equipped
with microprocessors and fast printer-planers, could carry out this task instantaneously aod
produce a VCG plot in addition to an ECG, thus eliminating the first-mentioned inconvenience
as well. The present study deals with three such methods of reconstruction and evaluates their
results.
Methods
Materials
Two sets ofECGs were used: One containing 147 cases and serving as a learning set in the
statistical approach (described below), the other containing 90 cases and serving as a test set.
All cases were taken from data sets used in the study 'Common Standards for Quantitative
Electrocardiography' (CSE) carried out by the CSE Working Party [4]. Although the validated
diagnosis for each case was not revealed by the CSE coordinating center, the overall
composition of the databases was known. The learning set contained about 30% normal cases,
15% cases with hypertrophy, 30% cases with myocardial infarction, and 25% other cases. The
test set contained about 30% normals, 25% hypertrophies, 30% myocardial infarctions, and 15%
others. Each case consisted of eight independent leads of the standard ECG (leads I, II, V1 to
V6) and the Frank VCG (leads X, Y, Z). All leads were recorded simultaneously. The data were
sampled at 500 Hz during 10 s. The digitized data were processed off-line by the ECG
interpretation program MEANS (Modular ECG Analysis System) [5] which yielded ao averaged
P-QRS-T complex for each lead. Only such averaged complexes were used in this study.
Reconstruction methods
Reconstruction of a particular VCG lead can be performed by computing a linear
combination of the ECG leads, for which the coefficients are arranged in a reconstruction
matrix. Three different ways can be envisaged for determination of the reconstruction
coefficients:
105
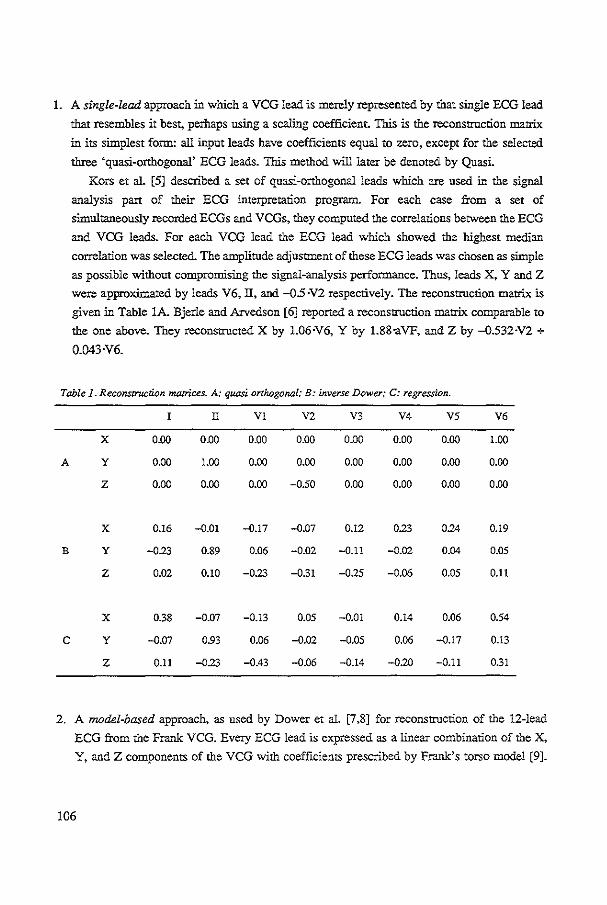
1. A single-lead approach in which a VCG lead is merely represented by that single ECG lead
that resembles it best, perhaps using a scaling coefficient. This is the reconstruction matrix
in its simplest form: all input leads have coefficients equal to zero, except for the selected
three 'quasi-orthogonal' ECG leads. This method will later be denoted by Quasi.
Kors et al. [5] described a set of quasi-or"J10gonal leads which are used in the signal
analysis pan of their ECG interpretation program. For each case from a set of
simultaneously recorded ECGs and VCGs, they computed the correlations between the ECG
and VCG leads. For each VCG lead the ECG lead which showed the highest median
correlation was selected. The amplitude adjustment of these ECG leads was chosen as simple
as possible without compromising the signal-analysis performance. Thus, leads X, Y and Z
were approximated by leads V6, IT, and -05 ·V2 respectively. The reconstruction matrix is
given in Table lA. Bjerle and Arvedson [6] reported a reconstruction matrix comparable to
the one above. They reconstructed X by 1.06·V6, Y by 1.88-aVF, and Z by -0.532·V2 +
0.043·V6.
Table 1. Reconscruction matrices. A: quasi orthogonal; B: inverse Dower; C: regression.
l II VI V2 V3 V4 V5 V6
X 0.00 0.00 0.00 0.00 0.00 0.00 0.00 LOO
A y 0.00 LOO 0.00 0.00 0.00 0.00 0.00 0.00
z 0.00 0.00 0.00 -0.50 0.00 0.00 0.00 0.00
X 0.16 -O.Ql -0.17 -O.Q7 0.12 0.23 024 0.19
B y -023 0.89 0.06 -0.02 -0.11 -0.02 0.04 0.05
z 0.02 0.10 -0.23 -031 -025 -0.06 0.05 0.11
X 0.38 -0.07 -0.13 0.05 -0.01 0.14 0.06 0.54
c y -0.07 0.93 0.06 -0.02 -0.05 0.06 -0.17 0.13
z 0.11 -023 -0.43 -0.06 -0.14 -020 -0.11 031
2. A model-based approach, as used by Dower et al. [7,8] for reconstruction of the 12-lead
ECG from the Frank VCG. Every ECG lead is expressed as a linear combination of the X,
Y, and Z components of the VCG with coefficients prescribed by Frank's torso model [9].
106
Recently, the model approach was also used in reverse mode: Edenbrandt and Pablm
[10,11] computed an 'inverse' matrix from the Dower data for reconstruction of the Frank
VCG from the 12-lead ECG. In Table lB the reconstruction coefficients are given for this
method, later to be denoted by Invers.
3. A statistical approach by which the reconstruction matrix is derived by a regression
technique. Based on a lea.-ning set of simultaneously recorded ECGs and VCGs, the
reconstruction coefficients are found by minimizing the sum of the squared differences
between the target lead and its reconstruction. Such transformations were first calculated by
Burger et al. [12] between different VCG systems in order to make VCGs from one system
resemble those of another. Several investigators used this technique for reconstructing the
ECG from the VCG [13-16]. Conversely, Wolf et al. [15] reconstructed the VCG from the
ECG in this way but did not publish the reconstruction matrix.
With the BMDP statistical package [17] a multivariate regression was performed on our
learning set. Various reconstruction matrices were derived for different segments of the
P-QRS-T complex. A visual comparison of the reconstruction results for a subset of the
learning population, using different reconstruction matrices, revealed only very small
differences. Therefore, we decided to funher use the reconstruction matrix which resulted
from the regression on the QRS complex ouly and which was subsequently applied to the
whole P-QRS-T complex. The reconstruction coefficients are given in Table 1C. This
method will later be denoted by Regres.
Evaluation methods
For the evaluation we reconstructed VCGs from the ECG leads in the test set. Evaluation
of the various reconstruction methods is based upon comparisons between the original and
reconstructed VCGs. Evaluation was performed by computing a numerical distance measure
(morphologic comparison) and by determining the agreement in the diagnostic classification
(semantic comparison). For illustration purposes we also present the differences between the
original and reconstructed VCGs for one diagnostically important parameter: the occurrence of
a Q wave in lead X and lead Y, and an initial R wave in lead Z.
Firstly, we used a numerical distance measureD:
where V, and v; are the original and reconstructed VCG respectively, and k ranges over those
sample points in the QRS complex for which the spatial amplitude, JV,J, exceeded a certain
107

threshold. 1bis threshold value was set because very small values of IV, I might influence the
distance measure disproportionally. K denotes the number of sample points taken into account.
The rationale for this measure is that differences occurring at relatively small spatial amplitudes,
e.g., in a Q wave, ate generally of more diagnostic importance than the same differences at
larger amplitudes, e.g., in an R wave, and should be weighted more heavily. If D equals zero,
the reconstructed VCG resembles the original perfectly; if D equals one, the difference between
the VCGs is on average equal to the spatial amplitude of the original VCG at each time instant.
Secondly, we determined the diagnostic agreement between the original VCGs and their
reconstructions. Two situations are distinguished:
A. All VCGs, both the originals and their reconstructions~ were classified separately and in
random order. The classifications were made independently by three referees. In order to
estimate intraobserver variabiliry, eighteen of the original VCGs were presented two
additional times. Thus, each referee classified 396 VCGs ((1+3)x90 + 2xl8). The scalar X,
Y, and Z leads as well as their usual planar projections were provided for each original or
reconstructed VCG.
The r-...ferees used a form which listed six main categories: normal, left ventricular
hypertrophy, right ventricular hypertrophy, anterior infarction, inferior infarction, and other.
Of course, more than one category could be applicable in a particular case. For each case
an overall classification was also required, namely: normal, probably normal, possibly
pathological. probably pathological, and pathological.
B. In a separate evaluation, for each case from the test set the original VCG and its three
reconstructions were presented on one page. The scalar X, Y, and Z leads of the original
VCG and its usual projections as well as the projections of each of the reconstructed VCGs
were provided.. The latter were presented in random order without identifying which of the
three reconstruction methods was employed.
Taking the original VCG as a reference, a cardiologist had to classify each of the
reconstructed VCGs in one of three classes: diagnostically 'same', i.e. both the original and
the reconstructed VCG showed the same diagnostic categories, ~different', and 'borderline'.
The kappa statistic was used as a measure of agreement [18-20]. Kappa is defined by the
following expression:
ka P.-P. ppa = __ , 1-P.
in which p o is the observed proportion of agreement and p .e is the expected proportion of
agreement, i.e., the proportion to be expected if the observers assign the cases randomly. In the
following short explanation of kappa it is assumed that we have only two observers.
108

The observed proportion of agreement is defined as:
p • = :E Wi;Pij' iJ
where p" is the proportion of cases classified in category i by the first observer and in category
j by the second, and w" is a weighting factor between categories i andj. Generally, W;; = 1 for
i = j and 0 otherwise. Then the observed proportion of agreement p. is eqnal to the snm of the
diagonal elements Pu.· The use of non-zero weights for i ;: j allows one to express that cases
classified in category i by the first observer and in category j by the second still contribute to
the agreement. For instance, one may consider a case classified as "probably pathological" by
one observer being in some agreement with a classification as ''possibly pathological" by the
other.
The expected proportion of agreement is defined as:
Pe = Lwiimi.m.j' ij
where mi. is the proportion of cases classified in category i by the first observer, and mJ is the
proportion of cases classified in category j by the second observer. Kappa equals one in case of perfect agreement because then p 0 = 1. Kappa equals zero if
p o = p c• i.e. if the observed agreement is equal to the chance-expected agreement. The
interpretation of kappa values is discussed by Landis and Koch [21], amongst others, who
distinguish three ranges. Values below 0.40 may be taken to represent poor agreement; values
above 0.75 excellent agreement and values between 0.40 and 0.75 fair to good agreement.
The kappa statistic has a nnmber of desirable properties. Most notably, it can be used in case
of more than two observers, it takes into account chance agreement, and its variance can be
estimated [19,20] allowing for hypothesis testing.
Resnlts
In this study, all three methods were used to reconstruct the Frank VCG from the 12-lead
ECG. Original and reconstructed VCGs were compared by a numerical measure, by differences
in a parameter value. and by the agreement in diagnostic classification.
Firstly, Figure 1 shows the cumulative distribution of the nnmerical distance measure given
for each reconstruction method. The threshold value used in the computation of the distance
measure, is 10 JIV. Other thresholds, which we varied between 5 and 25 ).!V, yielded almost
identical distance values. Applying the sign test, the differences between method Regres and
either Invers or Quasi are statistically significant (P < 0.01). Figures 2, 3, and 4 show examples
of original VCGs and their reconstructions with distance measures at approximately the 10, 50,
and 90 percentile values respectively.
109

100 c
~ If 0
.; 0 +X 0 50
~ "
0 '"' Figure 1. Cumu.lative distribution of the numerical distance measure D for the
reconstructUm methods Regres (-<>-). Invers (-x-), and Quasi H-). A, B. and C
indicate three particular cases which are shown in Figures 2, 3, and 4 respectively.
Figure 2. Performance of the three reconstruction methods for a rbeuer tJum average' case (A in Figure
1). Shown are the original XYZ leads and the horizontal,fromal. and sagittal projections of the original
and reconstructed VCGs. The values of the distance measure are 019, 032, and 035 for method
Regres. Invers, and Quasi respectively. The ~+'-mark denotes the time instant at 36 ms after QRS onset.
110

Figure 3. Performance of the three reconslTUCtion methods for an 'average' case (Bin Figure 1). Shown
are the original Xl'Z leads and the horizonral, frontal, and sagittal projections of the original and
reconstructed VCGs. The values of the distance measure are 039, 053. and 052 for method Regres,
Invers, and Quasi respectively. The '+'--mark c'~notes the time instant at 36 ms after QRS onset.
o~iQinol
lmV-
X \ ') '\\ t '<.") +-' -f-.' +----·. +' ~ x .... :x;::o,.Xi.'\X
~
2:00ms
~t--\ X+··: .. X t---:· X+·"'-T X y --A.,j~ ~~ .. .. •
y y y y
~ ~---, ~------ ~----.. ·. :)z ~~ . ...._./Z ···-.... }Z ····..._iz z ._.-. ·- ~- ._
y y y y
Figure 4. Performance of the three reconstruction methods for a 'worse than average' case (C in Figure
1). Shown are the on'ginal Xl'Z leads and the horizontal,fron.tal, and sagittal projections of the original
and reconstructed VCGs. The values of the distance measure are 0.60. 0.80, and 0.76 for metlwd
Regres, Invers, and Quasi respectively. The '+'-mark denotes the time instant at 36 ms after QRS onset.
111

Secondly, to illustrate the ability of the reconstruction methods to reproduce a diagnostically
important parameter, Table 2 gives the results for detection of Q waves in leads X and Y, and
for detection of an initial R wave in lead Z, respectively. Wave detection was performed by the
MEANS program [5]. There is a remarkably large number of false-negative detections in lead
Y. Further inspection, however, revealed that most of these Q waves were small (duration < 20
ms, amplitude < 100 Jl V) and diagnostic evaluation proved most of these Q waves to be
diagnostically insignificant.
Table 2. Wave detection in the original VCG and its reconstructions by the MEANS program
according to presence (+)and absence (-) of waves. X: Q waves in lead X; Y: Q waves in
lead Y; Z: initial R waves in lead Z.
quasi orthogonal inverse Dower regression
+ + +
0 + 39 5 36 8 40 4 X
r 12 34 1 45 45
g + 45 23 52 16 47 21 y
1 21 4 18 2 20
n
a + 8 4 8 4 10 2 z
8 70 6 72 3 75
Thirdly, the agreement in the classification of the original and reconstructed VCGs was
measured. The two above-described situations are distingnished: (A) The VCGs are presented
separately and randoruly, and (B) for each case the original and the reconstructed VCGs are
presented together.
A. We discern two situations: one where we used the classification in six main categories, and
one where we used the overall classification of the referees. In a particular case a referee
may have decided that more than one main category was present; such a combination is handled as an additional category. In computation of the observed agreement Po and the
expected agreement p., weights are used. The weights w,i are defmed as the number of main
categories that category i and category j have in common divided by the number of main
categories in either category i or j, whichever is largest.
112
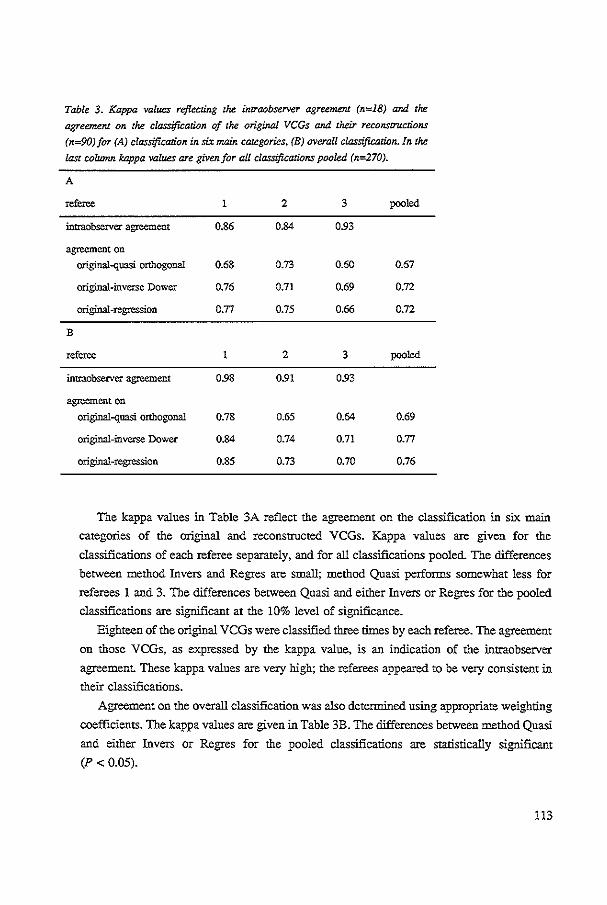
Table 3. Kappa values reflecting the imraobserver agreement (n=18) and the
agreement on the classification of the original VCGs and their reconscructions
(n=90)for (A) classification in six main categories. (B) overall classification. In the
last column kappa values are given. for all classifications pooled (n=270).
A
referee 1 2 3 pooled
intraobserver agreement 0.86 0.84 093
agreement on original-quasi orthogonal 0.68 0.73 0.60 0.67
original-inverse Dower 0.76 0.71 0.69 0.72
original-regression 0.77 0.75 0.66 0.72
B
referee 2 3 pooled
intraobserver agreement 098 0.91 093
agreement on original-quasi orthogonal 0.78 0.65 0.64 0.69
original-inverse Dower 0.84 0.74 0.71 0.77
original-regression 0.85 0.73 0.70 0.76
The kappa values in Table 3A reflect the agreement on the classification in six main
categories of the original and reconstructed VCGs. Kappa values are given for the
classifications of each referee separately, and for all classifications pooled. The differences
between method Invers and Regres are small; method Quasi performs somewhat less for
referees 1 and 3. The differences between Quasi and either Invers or Regres for the pooled
classifications are significant at the 10% level of significance.
Eighteen of the original VCGs were classified three rimes by each referee. The agreement
on those VCGs, as expressed by the kappa value, is an indication of the intraobserver
agreement. These kappa values are very high; the referees appeared to be very consistent in their classifications.
Agreement on the overall classification was also detennined using appropriate weighting
coefficients. The kappa values are given in Table 3B. The differences between method Quasi
and either Invers or Regres for the pooled classifications are statistically sigrrificant
(P < 0.05).
113

In order to exemplify some of the kappa values, Table 4 provides the data used to
compute the agreement on overall classification between the original and reconstructed
VCGs. The classifications of the three referees have been pooled.
Table 4. The results of classifying the original VCGs and their reconstructions as normal(--), probably
normal (-), possibly pathological (0), probably pathological (+), or pathological (++). The
classifications of the three referees have been pooled (n=270).
quasi orthogonal inverse Dower regression
0 + ++ 0 + ++ 0 + ++
0 32 9 2 2 0 30 !I 2 2 0 33 7 3 1 1 r
8 5 3 1 9 5 2 0 2 7 7 2 1 1
g i
0 6 3 1 4 0 4 5 2 2 1 4 4 5 1 0
n + 4 0 3 0 2 1 3 3 0 2 2 a I ++ 8 7 10 10 !50 0 3 17 9 !56 4 4 9 11 157
B. In a separate study, referee 1 (who showed one of the highest intraobserver agreements)
classified each of the reconstructed VCGs in one of the classes: diagnostically 'same',
'borderline', and 'different', taking the original VCG as a reference. In Table 5 the results
for the three reconstruction methods are given. Clearly, method Quasi is performing least
well and method Regres is not significantly better than Invers. For method Regres, only one
case was classified as ~different': the reconstructed VCG was considered normal while the
corresponding original VCG showed an inferior infarction.
Table 5. The classification of the reconstruczed VCGs compared
with the original VCG for each of the three reconstruction methods
by one referee.
quasi orthogonal
inverse Dower
regression
same borderline different
67
77
79
13
10
10
10
3
Finally. we investigated whether the numerical distance measure could replace the laborious
diagnostic classification for evaluating reconstruction methods. We compared the distance
114

measure with the classification in classes 'same', ~borderline', and ~differenf, pooled over the
three reconstruction methods. In Figure 5 the cumulative distribution of the distance measure
for each class is given. Although the median distance value is highest for the 'dllferent" class.
considerable overlap remains. Especially the ~same' and 'borderline' classes are hard to
discriminate on the basis of the distance measure. The difference in median values was
statistically not significant (Mann-Wbimey test statistic [22]. P = 0.24); yet about 10% of the
cases classified as 'same• have a distance value greater than the median distance value for the
'different' class.
100
11" 111 . X
"; 50
~ • u
0 1-<l
Figure 5. Relation. between the numerical distance measureD and the classification.
of all pairs of the original and reconstructed VCGs. Shown is the cumulative
distribution of the distance measure for the three classes: 'same' ( ·<H, 'borderline'
(-x-), and 'differenJ' (-+-).
Discussion
To establish the diagnostic accuracy of a reconstruction method,. we decided that evaluation
should primarily be based on a comparison of the cardiologists" classification of the original and
reconstruCted VCGs (semantic comparison). Such an approach contains two major difficulties.
First. the classification results for dllferent methods are difficult to compare. This probably
115

accounts for the use in the literature of other, more objective criteria such as differences in amplitude and interval measurements, or the correlation between the original and reconstructed
leads [10,13,15,16]. We used the kappa statistic as a means to quantify the diagnostic
agreement. Although the kappa statistic allows for chance-expected agreement, interpretation of the kappa value remains subjective. Secondly, the diagnostic classification is time-consuming
for the collaborating cardiologists. An evaluation criterion excluding involvement of
cardiologists would be preferable, provided the results agree with those of the diagnostic
classification. Therefore, we investigated whether a distance measure could be used instead of
the cardiologists' classification. As shown in Fignre 5, there is a considerable overlap of the
distance values for the three classes 'same•, 'borderline', and 'different'. The value of the
distance measure is a rather poor predictor for classification of a particular case. Although low
distance values(< 0.4) are an indication for classes 'same' or 'borderline', high distance values
have a low discrintinating power. We therefore conclude that an evaluation based on
classifications made by a cardiologist remains necessary or, in other words, a morphologic
comparison does not replace a semantic one.
There are several reports on reconstruction of the VCG from the ECG [6,10,1!,14,15) but,
generally, a single reconstruction method was used in these studies. Solely Edenbrandt and
Pablm [10,11] compared four methods, including Dower's inverse matrix and quasi-orthogonal
leads; the inverse matrix gave the best results. Their conclusion was based on a visual
comparison of the original and reconstructed VCGs where the cardiologists had to indicate
which reconstructed VCG resembled best the original. No regression techniques, however, were
used in that study nor a diagnostic evaluation. A proper comparison with the methods described
in all other studies is severely hampered by the use of different evaluation methods.
The results for the nnmerical distance measure in this study indicate that the method based
on multivariate regression is superior in a mathematical sense to both other methods. The
diagnostic evaluation. however, showed no significant differences between the regression and
the inverse Dower methods; both being preferable to the quasi-orthogonal method. Apparently,
the distance measure which largely represents information of morphologic nature, does not fully
take into account the semantic information used in the diagnostic process.
The diagnostic accuracy of the reconstruction methods was established in two ways. In the
first evaluation by three referees, the kappa values indicated a good to excellent agreement on
the diagnostic classification of the original and reconstructed VCG. In a second evaluation, one
cardiologist was simultaneously presented the original VCG and its reconstructions for all cases.
The results for the reconstruction based on regression show that only one case out of ninety was
classified diagnostically 'different'; for the reconstruction with the inverse matrix three cases
were classified 'different'.
116

Both evaluations provide strong indications that the semantic (diagnostic) information,
present in the original VCG, is also contained in the simultaneously recorded 12-lead ECG. For
this reason we pose the central question of this study: Do reconstructed VCGs sufficiently
resemble the originals to be used instead? Previous studies on the reconstruction of the VCG
from the ECG and vice versa differ in their conclusions. Some concluded that the reconstruction
can only be performed accurately when, for each patient, an individual matrix is computed,
because the variability between patients is too large to allow for a generally applicable
reconstruction matrix [13,14]. Others concluded that the reconstructed leads may reveal valuable
diagnostic information in addition to the leads which are used for the reconstruction [6,15]. In
one study, it is even concluded that the reconstructed (ECG) leads give more accurate diagnoses
than the original leads [8].
One reason for these divergent conclusions is that there is no generally accepted criterion
to decide whether a reconstruction method is good enough. Is it accepted only if perfect
agreement on the classification of the original and reconstructed VCGs is realized, or is some
difference in diagnostic performance acceptable - but then: how much?
In our opinion the reconstructed VCG may be most valuable not as a substitute of the
original VCG (or the ECG) but in addition to the 12-lead ECG. Electrocardiographs displaying
the reconstructed VCG may provide cardiologists with important additioual information, e.g. by
showing phase relations between leads more explicitly. Our particular interest is in further
improvement of computerized ECG interpretation by supplementing it with the interpretation
of the reconstructed VCG.
Acknowledgments
The authors would like to thank Dr. C. Brohet, M.D., Ph.D. (Universite Catholique de
Louvain, Brussels, Belgium) and Dr. P.W. Macfarlane, Ph.D. (Royal Infirmary, Glasgow, U.K.)
for their collaboration in the diagnostic evaluation. We are grateful to the CSE coordinating
center (Dr. J.L. Willems, Katholieke Universiteit Leuven, Leuven, Belgium) for providing the
recordings in the learning set and test set.
References
[ll Chou TC. When is the vectorcardiogram superior to the scalar electrocardiogram? J Am Coil Cardiel 1986;8:791·9.
[2] Hurd PH, Starling :MR, Crawford MH. Dlabal PW, O'Rourke RA. Comparative accuracy of
electrocardiographic and vectorcardiographic criteria for inferior myocardial infarction. Circulation
1981;63:1025·9.
117

[3] Piccolo E. Delise P, Trevi G, et al. Diagnostic value of electrocardiognun and vecton:ardiognun in
postinfarction ventricular synOQO'. J Electrocardioll984;17:169-78.
[4] The CSE Working Party. Recommendations for measmem.ent standards in quantitative electrocardiography.
Eur Heart J 1985;6:815-25.
[5] Kor.; JA, Talmon JL, Van Bemmel JH. Multilead ECG Analysis. Comput Biomed Res 1986;19:28-46.
[6] Bjerle P. Arvedson 0. Comparison of Frank vectorcardiogram with two different vectorcardiograms derived
from conventional ECG-lea.ds. In: Proc Engineering Founda.rion. Conference 11. 1986:13-26.
[7] Dower GE. A lead synthesizer for the Frank system to simulate the standard 12-lead electrocardiogram.
J Electrocardioll968;J:IO!-l6.
[8] Dower GE, Machado HB. Osborne JA On deriving the electrocardiognun from vectorcardiogrnphic leads.
Oin Cardiol1980",3:87-95.
[9] Frnnk E. An accurate, cliniC3lly practical system for spatial vectoiCardiogrnphy. CUculation 1956;13:737-49.
[10] Edenbrandt L. Pahim 0. Comparison of various methods for synthesizing Frank-like vectorcardiograms from
the conventionall2-lead ECG. Jn: Ripley KL, ed. Proc Compwers in Cardiology 1987. Washingron: IEEE
Comput Soc, 1987:71-4.
[Ill EdenbrandtL,Pahlm 0. VectoiCardiognun synthesized from a 12-leadECG: Superiority of the inverse Dower matrix. J Electrocardiol 1988;21:361-7.
[12] Burger HC. Van Brummelen AGW. Van Herpen G. Compromise in vectorcardiography: Alterations of
coefficients as a means of adapting one lead system to another. Am Heart I 1962;63:666-78.
[13] Cady LD. KwanT. VogtFB. Population electrocardiographic lead transformations. In: FogellJ, George FW.
eds. Progress in Biomedical Engineering. Washington: Spartan Books, 1967:151-8.
[14] Distelbrink CA, Van Bemmel JH. Ritsema van Eck IU, Ascoop CA Linear transformation of a set of low
noise leads towards the Frank VCG: Validity of dipole approximations. In: Rylant P, Ruttkay~Nedecky I.
Schubert E, eds. Proc Xllth Jnrern Colloquium on Vectorcardiography. Brussels: Presses Academiques
Europeennes. 1973:108-15.
[IS] Wolf IlK, Rautaharju PM, Unite VC. Stewart J. Evaluation of synthesized standard 121eads and Frnnk vector
leads. Jn: Abell!, ed. Advances in Cardiology (Vol16). Basel: Karger, 1976:87-97.
[16) Zywietz C. Abel H. Mock HP, Rosenbach B. Comparison between conventional ECGs simultaneously
recorded and those reconstructed from Frank lead system. In: Abel H,. ed. Advances in. Cardiology (V o116).
Basel: Karger. 1976:82-6.
(17] Dixon WJ, Brown MB. Engelman L. et al. BMDP Statistical Software Manual. Berkeley: University of
California Press. 1981:235-63.
[18] Cohen J. A coefficient of agreement for nominal scales. Educ Psycho! Measurcm 1960;20:37-46.
[19] Fleiss JL. Statistical Methods for Rates and Proportions. New York: Wiley. 1981:211~36.
[20] Schouten IDA. Statistical Measurement of Inrerobserver Agreement (Thesis). Rotterdam: Erasmus University,
1985.
[21] Landis JR Koch GG. The measurement of observer agreement for categorical data. Biometrics 1977;33:671~9.
[22] Siegel S. Castellan NJ. Nonparamelric Statistics. New York: McGraw~Hill, 1988:128~37.
118

CHAPTER 8
Improvement of Diagnostic Accuracy by Combination of
EGG and VCG Computer Interpretations
J.A. Kors,' G. van Herpen,2 J.L. Willems,' J.H. van Bemmel1
'Department of Medical Informatics, Erasmus Univetsity, Rotterdam, The Nethetlands
"Division of Cardiology, Academic Hospital, Leiden, The Netherlands 3Division of Medical Informatics, Catholic University, Leuven, Belgium
Submitted for publication
119

Abstract
In the international project 'Common Stan&rrds for Quantitative Electrocardiography' (CSE),
diagnostic results of different computer programs for the interpretation of the electrocardiogram
(ECG) and of the vectorcardiogram (VCG) were combined and it was shown that the 'combined
program' performs better than each program separately. As our own program MEANS (Modular
ECG Analysis System) comprises two different classification programs - one for the ECG, the
other for the VCG - we investigated whether the combination of the two would yield a better
diagnostic result than either one separately. This approach requires that a VCG be always
recorded in addition to the ECG. To circumvent this complication, the VCG was reconstructed
from the simultaneously recorded ECG leads. This reconstructed VCG (rVCG) was then
intetpreted by the VCG classification program, whereupon the interpretations of the ECG and
the rVCG were combined. For the validation, the CSE database of documented ECGs and VCGs
(N=l,220) was used.
The combination of the ECG and VCG interpretation programs proves to perform
significantly better than eacb program separately (total accuracy 74.2% (ECG+VCG) versus
69.8% (ECG) and 70.2% (VCG), P < 0.001 in both cases). The results of the rVCG (total
accuracy 70.5%) are comparable with those of the ECG and the VCG (P > 0.10 in both cases).
The performance of the combination ofECG andrVCG (total accuracy 73.6%) is approximately
the same as that of the combined ECG and VCG (P > 0.10). Thus, the performance of an ECG
computer program can be improved by incorporating both ECG and VCG classificatory
knowledge, using only the ECG itself. The more general question which conditions underlie the
improved performance of a combination of classification programs is also discussed.
Key words: ECG interpretation program, reconstructed vectorcardiogram
120

Introduction
"Two heads are better than one" is a saying that also appears to hold for the interpretation
of the electrocardiogram (ECG) - and perhaps the more heads the better. In the international
project 'Common Standards for Quantitative Electrocardiography' (CSE) [I] it was shown that
a 'synthetic ECG diagnostician', produced by merging the interpretations of eight ECG readers,
performed better than each reader separately [2,3]. The same proved to be the case for computer
programs for the interpretatiC'n of the ECG or of the vectorcardiogram (VCG). In the present
study, we have sought to take adva."ltage of this effect to improve the results of our ECG
interpretation program "MEANS (Modular ECG Analysis System) [4,5]. This is feasible because
"MEANS comprises two different classification programs: One for the ECG, the other for the
VCG. The combination of the two may then possibly yield a better result than that of either one
separately. The obvious objection, that this approach requires that a VCG always be recorded
in addition to the routine 12-lead ECG, can be met by a technical artifice: It is possible to
synthesize the VCG from the simultaneously recorded ECG leads [6]. The reconstructed VCG
(rVCG) is a near-replica of the authentic (Frank) VCG and can be processed in the usual way
by the VCG classification program.
We will show that combining the computer interpretations of the ECG and the VCG indeed
improves diagnostic accuracy, and that equally good results are obtained when the rVCG
replaces the VCG. In view of these results, we will discuss wbich conditions need to be satisfied
in order to have a combination of observers perform better than each observer separately.
Material and methods
Database
For testing purposes, the diagnostic database that was collected in the CSE project [1,7] was
used. This database consists of 1,220 ECG and VCG recordings. In each case, all leads of the
ECG and VCG were recorded simultaneously at a sampliug rate of 500 Hz during 8 or 10 s.
All cases have been validated by ECG-independent cliuical evidence, such as echocardiography,
enzyme levels, etc. [8]. The following eight main categories were distinguished: Normal
(N=382), left ventricular hypertrophy (LVH; N=l83), right ventricular hypertrophy (RVH;
N=55), biventricular hypertrophy (BVH; N=53), anterior infarction (AMI; N=170), inferior
infarction (IMI; N=273), combined infarction (N=73), and infarction with manifest hypertrophy
(N=31). Major conduction defects, such as complete right and left bundle-branch block, were
excluded. Each case in the database was also read independently by nine cardiologists (ECGs
read by eight, VCGs read by five of them). For every case, the cardiologists' interpretations
were combined. These 'combined cardiologist, results served as another reference set in the
121

present study. Both the 'clinical evidence' and the 'combined cardiologist' result is classified
information that remains under lock and key at the CSE coordinating center. Thus, an
independent database for testing ECG computer programs can be maintained.
Computer program
The MEANS program was used for our investigations. In its signal analysis part, one and
the same algorithm is employed to process the 12-lead ECG (using three reconstructed
orthogonal leads) or the VCG [4]. The classification parts of the ECG and VCG programs use
a heuristic approach by means of decision-tree logic.
Reconstruction
Each of the three VCG leads, X, Y and Z, can be reconstructed through a linear combination
of ECG leads, i.e., by multiplying each of the eight independent simultaneous ECG leads with
an appropriate coefficient and adding the re-scaled leads. The reconstruction coefficients,
computed using multivariate regression, are given in Table 1 [6].
Table 1. Reconstruction cceffLCiemsjor symhesizing the VCG from the ECG.
n VI V2 V3 V4 VS V6
X 0.38 -om -0.13 0.05 -Q.OI 0.14 0.06 0.54 y -om 0.93 0.06 -0-02 -o.os 0.06 -Q.I7 0.13
z O.ll -Q23 -Q.43 -o.06 -Q.l4 -Q20 -o.u 0.31
Coding of diagnostic results
The statements produced by the ECG and VCG classification parts of MEANS were
rendered into diagnostic codes according to the CSE coding scheme [8]. A code comprises a
diagnostic category and a qualifier. The pathological categories are L VH, AMI, etc.,
corresponding to the diagnostic groups in the clinical database. When the program stated a
major conduction defect (a category not present in the database) as a single statement, the case was mapped to a category 'other'. When the program cited none of the major pathological
categories but only non-major abnormalities such as ST-T changes, left anterior or posterior
fascicular block, etc., the CSE rules prescribe mapping to the 'normal' category. This category
thus contains, in addition to true normals, also ECGs that are not normal in an
electrocardiographic sense. To avoid misunderstanding, this category has been labelled 'no
structural abnormality' (NSA). Further, one of three qualifiers had to be used: definite, probable,
or possible.
122

Combinati<>n of diagnostic results
The same method that was used in the CSE project to merge results from different observers
or different programs into a combined interpretation, has been applied in the present study to
combine results from the ECG and the VCG programs, and the ECG and the rVCG programs.
The qualifier in each diagnostic code is assigned points corresponding to the level of certainty:
'definite' 3 points, 'probable' 2 points, and 'possible' 1 point. This is done separately for each
reader or each program. The combined result for a particular case is then detennined by adding
the qualifier points of corresponding categories over the contributing readers or programs, and
dividing by their number. The resulting value, between 0 and 3, is then rounded. For instance,
when in our study the ECG program would list: "probable (=2) LVH'' and the VCG program:
"possible (=1) LVH, probable (=2) AMI'', the combined program result would be: "probable
((2+1)/2->2) LVH, possible ((0+2)/2->1) AMI".
Classification matrices
In the CSE coordinating center, our program results were compared with the 'clinical
evidence' and with the 'combined cardiologist'. The CSE approach has been to score by case
rather than by diagnostic category. Thus, each case contributes one single point to a
classification matrix. If more than one diagnostic category is associated with a particular case,. only the category with the highest degree of certainty is counted. lf two or more categories have
equal qualifiers at the highest level, the one point to be allotted is evenly divided over the
appropriate cells of the classification matrix. Cases with BVH, combined infarction, or a
combination of hypertrophy and infarction, are subject to different mapping schemes the details
of which have been described previously [8]. Briefly, a case with BVH is counted as partially
correct when it was classified as L VH or RVH, i.e., half of the point will be allotted to category
BVH and the other half to category 'other'. Likewise, cases with combined infarction or with
a combination of hypertrophy and infarction are counted as partially correct when one of the
constituent categories was cited.
Results
The results of all interpretations by MEANS, i.e., for the ECG, VCG, rVCG, combined ECG
and VCG, and combined ECG and rVCG, were compared with both the 'clinical evidence' and
the 'combined cardiologist'. For each comparison, a classification matrix for the main categories
was computed. From these 8-by-8 matrices, 3-by-3 matrices were derived for the categories 'no
structural abnormality' (NSA), 'hypertrophy' (HYPER, including left, right, and hi-ventricular
hypertrophy), and 'infarction' (Ml, including anterior, inferior, mixed infarction and infarction
123

with manifest hypertrophy). As an example, the 3-by-3 classification matrix of the ECG
intezpretation against the 'clinical evidence' is given in Table 2.
Table 2. Classification matrix of the ECG program result again.st the 'clinical
evidence" (in %).
computer
clinical evidence NSA HYPER Ml OTHER N
NSA 97.1 03 2.6 0.0 382
HYPER 43.0 42.5 9.1 5.4 291
Ml 265 25 672 3.7 547
NSA=no sttuctmal abnormality, HYPER=hypertrOphy, MI=myocnrdial infarction,
OTHER=other abnormality; N=number of cases.
The diagonal elements of the 3-by-3 classification matrix of each program against the
'clinical evidence' are given in Table 3. The specificity, i.e., the sensitivity for NSA, of the
ECG interpretation (97.1 %) is higher than that of any other: The combination ofECG and VCG
(ECG+VCG) yields a specificity of 91.6% (P < 0.001, equivalence tested with Wilcoxon's
signed-rank test [9]), and the combination of ECG and rVCG (ECG+rVCG) a specificity of
94.4% (P = 0.003). The positive predictive values for NSA of the ECG program and of the two
combinations are 76.0%, 86.4%, and 83.7%, respectively. The sensitivities for HYPER and MI
of both the ECG+VCG and ECG+rVCG interpretation are significantly higher than those of the
ECG program (P < 0.001 in all cases).
Table 3. Agreement (%)between rhe program results and the 'clinical evidence'.
ECG VCG rVCG ECG+VCG ECG+rVCG
NSA
HYPER
M!
total accuracy
97.1
42.5
672
69.8
86.6
45.8
76.0
70.2
94.0
463
702
70.5
91.6
49.1
77.9
742
NSA=no structural abnormality. HYPER=hypenrophy. MI=myocardial :infarction;
N=number of cases. based on 'clinical evidence'.
124
94.4
49.7
74.4
73.6
N
382
291
547

The 'combined cardiologist' as the reference appears in Table 4. The comparisons show the
same pattern as those with the 'clinical evidence': the specificities of the ECG+ VCG and
ECG+rVCG interpretations drop slightly with respect to that of the ECG program, while the
sensitivities for HYPER and MI improve.
Table 4. Agreement (%) between the program results and the ~combined cardiologist'.
ECG VCG rVCG ECG+VCG ECG+rVCG N"
NSA 96.8 84.8 91.2 91.0 93.1 503
HYPER 63.1 663 65.8 725 72.5 2035
Ml 79.7 89.8 83.7 92.2 88.0 4815
total accuracy 803 78.1 79.0 84.1 83.3
NSA=no stmctur.ll abnormality, HYPER-=hypertrophy, M!=myocardial infarction; N=number of cases, based on the 'combined cardiologist' result.
*32 cases were classified as 'other' by the 'combined cardiologist' and have not been considered here.
Total accuracies were computed from the 8-by-8 classificarion matrices of all main
categories, taking either the 'clinical evidence' or the 'combined cardiologist' as the reference
(Tables 3 and 4). In both cases, the total accuracies of the combined interpretations proved to
be significantly higher than those of the individual interpretations (P < 0.001 in all cases). These
total accuracies have been entered in the scatter plot of Figure 1, together with those of the
individual cardiologists from whom the 'combined cardiologist' was derived, and of the other
interpretation programs which participated in the CSE smdy [7].
Total accuracy depends on the composition of the database. In the CSE database, about 30%
of the cases belongs to category NSA according to 'clinical evidence'. If the composition of the
database would be shifted to contain more and more NSA cases, a point would finally be
reached where the total accuracy of the ECG interpretation would exceed that of any of the
combined interpretations, as the ECG program shows highest specificity. We determined the
total accuracies for different percentages of NSA cases; the numbers of cases in the other
categories were adjusted in proportion to the initial numbers in the CSE database. If the number
of cases in the database belonging to category NSA stays under 62% (71 %), the total accuracy
of the ECG+VCG (ECG+rVCG) interpretation remains larger than that of the ECG
interpretation.
125

65~4-L-~~-+~~+-+-~~-+~+-+-~~ _.J_j _ _l__ _L.J __ L_ _____ \ ___ L_.L_ -·- _.J_ . .J_.i._L_
90 total accuracy against 'clinical evidence'(%)
Figure 1. Total accuracies of the individual (indicated by ECG. VCG. and rVCG) and the combined
(ECG+VCG and ECG+rVCG) MEANS interpretation programs. Also, the total accuracies of the other
programs and of the cardiologists participating in the CSE study have been plotted. From these cardiologists
the ~combined cardiologist was derived. All interpretation results are compared with the 'clinical evidence'
(horizontal) and the 'combined cardiologist' (vertical).
126

Discussion
"Two heads are better than one", and apparently this saying holds for our ECG and VCG
(orrVCG) computer interpretations, for at least the total accuracies (Figure!). The sensitivities
for hypertrophy and infarction are also better, but the specificity is in between (Tables 3 and 4).
Under what conditions, then, do two observers (cardiologists or programs) perform better
than each one separately? Suppose that there are only two mutually exclusive categories: X and
non-X, i.e., either X is present ('definite') or non-X. It can easily be shown (see Appendix) that
the sensitivity and specificity of the interpretations of two observers when combined under the
CSE rules is the average of their individual sensitivities and specificities. This, however, is not
the case when we combine om two computer programs. For instance, the sensitivities for
hypertrophy of the interpretation of the ECG, of the VCG, and of the ECG and VCG combined
are 42.5%, 45.8%, •nd 49.1 %, respectively (Table 3). The reason is, in the first place, that not
one qualifier ('definite') but three qualifiers are used ('definite', 'probable', 'possible'). Thus,
a case may be graded as "definite X" by one observer and as "possible X, probable non-X'' by
the other. Assuming that X is the correct diagnosis, the first observer classified correctly, and
the second incorrectly because the CSE mapping procedure only retains the highest ranking
category. The combined result will then be "probable (=(3+1)/2->2) X, possible (=(0+2)/2->1)
non-X'' and one full point will be allocated to X in the classification mattix. In the first, simple
(binary) model, the case would have been assigned the same qualifier for X by the frrst and
non-X by the second observer, and the one point would have been split in half between the
equal-ranking X and non-X. In the more expanded model, the grading and decision procedures
can salvage a full point to the correct diagnosis. This happens when the correct interpretation
is stated with confidence and the incorrect one with hesitance.
There is a second reason why the sensitivity or specificity of the combined interpretation
may be better than that of each interpretation separately. In reality there are not two but more
diagnostic categories, which need not be mutually exclusive. For example, the classification
"probable hyperttophy, definite infarction" is perfectly legal. The qualifier that both observers
formerly attached to category non-X, may now be assigned to one category, say, Y, by the frrst
observer, and to another, say, Z, by the second: the statement "probable X, possible Y" by the
first observer and "possible X, probable Z" by the second would combine to "probable X,
possible Y, possible Z", and a full point would be assigned to X in the classification matrix.
Both observers may even be wrong whereas the combination is partly correct, e.g., "possible
X, probable Y" by the first and "possible X, probable Z" by the second observer wonld yield
"possible X, possible Y, possible Z" for the combination, thus allotting 1/3 point to X.
127

When more than two interpretations are combined, as was done in the CSE study, the
combinatorics may become quite complex. A discussion of this topic is outside the scope of this
article.
In the present study, we integrated two classification programs at the level of their outputs,
i.e., their diagnostic statements. This approach is simple, but it is also a rather crude and indirect
way of combining diagnostic classification knowledge. A more direct combination procedure
would be to integrate into one program the qualities of the ECG and VCG approaches. Such a
selective combination of knowledge requires a precise understanding of the strong and weak
points in the classification logic and will be an issue for further research.
The results of the reconstructed VCG are in between those of the ECG and the VCG (Tables
3 and 4); the total accuracies of ECG, VCG, and rVCG are very similar. In a previous study
[ 6], cardiological interpretations of a series of original VCGs and of reconstructed VCGs, were
proven to be comparable. This suggests that rVCG and VCG are equivalent in information
contenL Since the rVCG is nothing more than a mathematical conversion of the ECG, this
implies that ECG and VCG carry the same diagnostic information. The equivalence of
information in the ECG and VCG was also pointed out in another study [10], where statistical
classifiers for the ECG and the VCG, detertuined with the same technique, proved to have
similar performance.
As the rVCG contains only the electrical information enclosed in the ECG, it is remarkable
that processing the same information, frrst in the form of the ECG, then, after its mathematical
conversion, in the form of the VCG, should yield results that are able to improve on each other
when combined. This suggests that representing and processing the signals in VCG form utilizes
information that is neglected in ECG interpretation: presumably information on phase
relationships between the ECG signals. Conversely, the ECG carries proximity information that
is probably lost in the VCG approach. The practical implication of this all is that the
performance of an ECG computer program can be improved by applying VCG criteria to the
ECG itself.
The conclusions from our study are as follows: (1) A 'combined program', produced by
merging the interpretations of our ECG and VCG computer programs, performs better than each
program separately (using the CSE database as a test set). (2) Simultaneously recorded ECG
leads enable the reconstruction of the VCG. The results of the interpretation of this
reconstructed VCG are comparable to those of the authentic VCG. (3) The combination of the
interpretations of the ECG and the reconstructed VCG has a performance similar to that of the
combination of ECG and authentic VCG.
128

Acknowledgments
The CSE project was supported by the European Commission within the frame of its
Medical and Public Health Research Programmes, and by various funding agencies in member
states of the European Community. We axe grateful toR. Reniers (Catholic University Leuven,
Belgium) for technical and programming help.
References
(1] Willems JL. Arnaud P, Van Bemmel JH. etal. Common standards for quantitative electtocard.iography: Goals
and main resullS. Methods lnf Med 1990;29:263-71.
[2] Willems JL, Abreu-Lima C, Arnaud P, et aL Effect of combining electrocardiographic interpretation results
on diagnostic accuracy. Eur Heart J 1988;10:1348-55.
[3] Willems JL. Abreu-Lima C, Arnaud P, et aL Evaluation of ECG interpretation resullS obtlined by computer
and cardiologists. Methods lnf Med 1990;29:308-16.
[4] Kors JA, Talmon JL. Van Bemmel JH. Multilead ECG analysis. Comput Biomed Res 1986;19:28-46.
[5] Van Bemmel JH, Kors JA. Van Herpen G. Methodology of the Modular ECG Analysis System MEANS.
Methods lnf Med 1990;29:346-53.
[6] Kors JA. Van Herpen G. Sittig AC, Van Bemmel JH. Reconstruction of the Frank vectorcardiogram from standard electrocardiographic leads: diagnostic comparison of different methods. Eur HeartJ 1990;11: 1083-92.
[7] Willems n., Abreu-Lima C, Arnaud P, et a1. The diagnostic performance of computer programs for the
interpretation of electrocardiogwns. N Eng! J Med 1991;325:1767-73.
(8] Willems JL. Common Standards for Quantitative Elecrrocardiography - 6th CSE Progress Report. Leuven: ACCO, 1986.
[9] Michaelis J. Wellek S. Willems JL. Reference standards for software evaluation. Methods Inf Med
1990;29:289-97.
[I 0] Willems JL. Lesaffre E, Pardaens J, De Schreye D. Multigroup logistic classification of the standard 12- and
3~lead ECG. In: Willems JL, Van Bemrnel .JH,. Zywietz C, eds. Computer ECG Analysis: Towards
Srandordizatibn. Amsterdam: North-Holland Publ Comp, 1986:203-10.
129

Appendix
Let us assume that two obsetVers (referees or programs) classify a group of subjects into one
of two disease categories, D and D. P(D) is the a priori probability that a subject has disease
D, P(D) = 1 - P(D) is the probability that he has noL The observers classify a subject as having
the disease (X) or not having the disease (X). The sensitivity of the first observer, SE1, is the
probability that this observer will classify a subject with the disease positively: SE1 = P(X1 I D).
The sensitivity of the second observer is SE, = P(X2 1 D). The sensitivity of a 'combined
observer' is SE, = P(X1X2 1 D) + (P(X,X, I D) + POC1X, I D))/2, i.e., the sum of the probability
that both observers will classify a subject positively and the average probability that one of both
observers will do so, given the disease. The latter term is the result of the CSE combination
procedure: If two (or more) categories with equal qualifiers at the highest level are given, the
one point to be allocated in the classification matrix is evenly divided over the correspondi..~g
cells. Since P(X1 1 D)= P(X1X2 1 D)+ P(X1X, I D) andP(X2 1 D) =P(X1X2 1 D)+ P0C1X, I D), it
follows that SE, = (P(X1 I D) + PCX, I D))/2 = (SE1 + SE,)/2. Thus, the sensitivity of the
'combined observer' is the average of the sensitivities of the separate observers. Note that this
result holds whether the observers' interpretations are statistically independent or not. Similarly,
the specificity of the 'combined observer' is the average of the specificities of both obsetVers.
130

CHAPTER 9
Intrinsic Variability of EGGs Assessed by Computer
Interpretation
J.A. Kors,t G. van Herpen,Z J.H. van Bemmel1
'Department of Medical Informatics, Erasmus University, Rotterdam, The Netherlands
"Division of Cardiology, Academic Hospital, Leiden, The Netherlands
Submitted for publication
131

Abstract
Variability in the electrocardiogram (ECG) can be due to 'extrinsic' sources, such as
powerline interference, baseline wander or electromyographic noise, or can be caused by
'intrinsic' factors, such as changes in the volume conductor or in the heart itself. Computer
programs for the interpretation of the ECG base their diagnostic classification on one set of
measurements which characterize the ECG. To reduce the influence of noise, the set of
measurements can be derived from a representative P-QRS-T complex or it can be computed
by taking the median from the measurements for each complex in the recording. However, these
methods may fail to do justice to the intrinsic variability that may be present in the ECG. Au
alternative method is proposed: Derive a set of measurements from each complex in the
recording and classify all complexes separately. The classifications of all complexes are then
combined in one final classification.
This procedure has been evaluated on a validated database (N=l,220) using our own ECG
computer program. The total accuracy against the 'clinical evidence' increased from 69.8% for
the interpretations of the averaged complexes to 71.2% for the 'combined' interpretations of the
singnlar complexes (P < 0.001). The effect of beat-to-beat variation on the measurements is
demonstrated and the influence of extrinsic and intrinsic variability on the classifications is
assessed.
Key words: ECG classification, coherent averaging, stability
132

Introduction
Beat-to-beat variability in the electrocardiogram (ECG) can arise from different sources. The
ECG may show noise components from 'extrinsic' sources, such as powerline interference,
electromyographic noise, baseline wander, and noise from the signal acquisition device.
Variability may also be induced by changes in the volume conductor (the thorax) due to
respiration or movement of the heart and, finally, by changes in the heart itself, e.g., in the
electrical conduction pattern. The last two types of variability will be termed 'intrinsic'
variability.
To reduce the influence of noise, ECG computer programs apply one of two methods. One
method is to determine which P-QRS-T complex in the recording shows least distortion, and
derive measurements from that complex [1,2]. A generalization of this method is to determine
measurement values for every complex in the recording and subsequently take the median value
of measurements from complexes which are morphologically of the same type [3-5]. The other
method is to compute the coherent average or take the median of similar complexes and to
determine the measurement values from this averaged or median complex [6-11]. Both methods
result in only one set of measurements which is the basis for diagnostic classification.
However, these methods may fail to do justice to the intrinsic variability in the ECG. When
only one complex is considered, any intrinsic variability is neglected by definition. When
measurements or complexes are averaged, the intrinsic variability is also averaged. Therefore,
we propose an alternative method which allows to take into account the intrinsic variability in
the ECG: For each complex in the recording, a set of measurements is derived and a diagnostic
classification is made. The classifications of all complexes are then combined into one final
classification using a combination rule. As a consequence of this procedure, the complexes from
which measurements are derived are likely to contain more ('extrinsic') noise than the
representative complex used in the other methods. Therefore, the stability of an ECG computer
program, i.e., the influence of noise on measurements and classifications, is also of imponance.
Using our own ECG computer program MEANS (Modular ECG Analysis System) [7,12],
this alternative procedure has been evaluated. The stability of the program was assessed by
comparing the measurements and classifications of the separate complexes in an ECG recording
with those of the representative average complex.
133
Material and methods
Database
The database that was used in our experiments was collected in the project 'Common
Standards for Quantitative Electrocardiography' (CSE) [13,15], an international cooperative
study for standardization and evaluation of ECG computer programs. It contains 1,220 ECGs
and VCGs, of which we used only the ECGs. The ECGs consist of eight simnltaneously
recorded leads sampled at a rate of 500Hz during 8 or 10 s. Each case was validated by ECG
independent clinical evidence [14]. The diagnostic classification of individual cases is only
known to the CSE coordinating center, but the overall composition of the database has been
made public [15]: left ventricular hypertrophy (L VH; N=l83), right ventricular hypertrophy
(RVH; N=55), biventricular hypertrophy (BVH; N=53), anterior myocanlial infarction (Al\.11;
N=170), inferior myocardial infarction (IMI; N=273), combined infarction (MIX; N=73),
infarction with manifest hypertrophy (VH+MI; N=31), and nonnal (NOR; N=382). The NOR
group includes 'ambulatory' nonnals (N=286) and 'catheterized' nonnals (N=96).
ECG computer program
MEANS was used for the analysis and interpretation of the ECGs. It contains algorithms to
detect spikes, to correct for baseline wander, and to suppress mains interference. Beats that do
not belong to the dominant rhythm (i.e., extrasystoles) are removed as are dntstically different
beats such as in intermittent complete right bundle-branch block. Noise reduction is achieved
by coherent averaging of the dominant QRS complexes. The resulting averaged P-QRS-T
complex is used in subsequent steps of the analysis, i.e., wave boundary recognition and
measurement extraction. F~ally, a diagnostic classification is generated. The classification part of MEANS is based on heuristic knowledge, structured by means of decision-tree logic.
ECG processing
In this study, each ECG was processed twice. FJrst, MEANS operated under usual
conditions, producing measurements and a classification based on the averaged complex.
Subsequently, measurements and a classification were determined for every singnlar complex
which had been used in the averaging procedure. All measurements and classifications were
stored in a database for further processing.
Measurements
From each averaged and from each singular complex, an extensive series of measurements
was taken. We here will consider the amplitudes of the Q, R, and S waves, as well as the
durations of the QRS complex, PQ interval, and QT interval. All amplitude measurements are
134

lead dependent; durations are measured for all leads simultaneously. The noise content in each
lead was estimated by the root-mean-square (rms) of amplitude values in an interval of 40 ms,
preceding the QRS complex. This procedure has previously been used in the CSE project [16].
Coding of diagnostic results
The statements produced by the ECG classification pan of MEANS were mapped onto
diagoostic codes following the CSE coding scheme [14]. A code comprises a diagoostic
category and a qualifier. Diagoostic categories are NOR, L VH, RVH, BVH, AMI, IMI, MIX,
VH+Ml, and 'other'. A case is mapped to the 'other' category when the program states a major
conduction defect, e.g., complete left bundle-branch block (a condition known not to be present
in the database), as a single statement. One of three qualifiers can be used: definite, probable,
or possible.
Combination of diagnostic results from singular complexes
The same method that was used in the CSE project to combine diagoostic results from
different programs or different observers, was applied in the present study to combine the
intetpretation results of singulat complexes of the same recording. The qualifier of each
diagoostic code was assigoed points corresponding to the level of certainty: 'definite' 3 points,
'probable' 2 points, and 'possible' 1 point. This was done sepatately for each singolat complex.
The combined result for a particular recording was then determined by adding the qualifier
points of corresponding categories over the conTributing complexes, and dividing by their
number. The resulting value, a score between 0 and 3, is then rounded. For instance, when a
recording would contain five complexes of which two would have been cited by the program
as "possible (=1) LVH, probable (=2) AMI" and three as "deflnire (=3) LVH", the combined
result would be "probable ((2xl+3x3)/5->2) LVH, possible ((2x2+3x0)/5->l) AMI".
Classification marrices
Program results for the averaged complexes and for the singular complexes were compared
with each other and with the 'clinical evidence'. Comparisons with the 'clinical evidence' took
place in the CSE coordinating center. The mapping procedure that has been applied, is the same
as used in the CSE project [15]. Each case conTributes one point in the classification marrix. If
more than one diagnostic category is associated with a particular case, only the category with
the highest degree of certainty is retained. If two or more categories have equal qualifiers at the
highest level, the one point to be allotted is evenly divided over the appropriate cells of the
classification marrix. Cases with B VH, combined infarction, or a combination of hypertrophy
and infarction, are subject to additional testing of which the details have been described
previously [14]. Briefly, a case with BVH is counted as partially correct when it was classified
135

as L VH or RVH. Likewise, cases with combined infarction or with a combination of
hypertrophy and infarction are counted partially correct when one of the constituent categories
was cited.
Assessment of extrinsic and intrinsic variability
We tried to assess the separate influence of extrinsic variability on the computer's
interpretations. For this, we assume that the disagreement in classification between the averaged and the singular complexes is mainly the result of extrinsic noise. An equivalent disagreement
is then to be expected when we compare the original averaged complexes with the averaged
complexes after contamination with extrinsic noise amounting to that present in the singular
complexes. To simulate the extrinsic noise, Gaussian noise with different rms values was added
to the averaged complexes. The classifications of the averaged complexes contaminated with
additive noise were then compared with those of the original averaged complexes.
Resnlts
The 1,220 ECG recordings in the database contained 9,833 singular complexes which were
used in the computation of the averaged complexes. Thus, in total ll,053 (1,220+9,833)
complexes were analyzed. In the following, the 1,220 cases for which an averaged complex was
computed will be referred to as 'averaged' cases, and the 9,833 as 'singular' cases. In Figure
I, the (smoothed) distributions of the rms noise values are given for singular and averaged
complexes. Since the distributions for the various extremity leads were comparable, they have
been lumped; the same applies to the precordial leeds. The medians of the rms noise values of
the averaged and of the singular complexes are 3.6 and 8.4 Jl V, respectively, for the extremity
leads and 2.8 and 5.6 11 V, respectively, for the precordial leads.
When wave measurements of averaged and singular complexes are compared, one of the
intricacies is that a wave which is detected in the averaged complex may not be detected in a
singular complex, or vice versa. This phenomenon will be called detection instability. For
instance, a Q wave in the averaged complex may be just large enough to fulfill the minimum
wave detection requirements, whereas this Q wave is not detected in some of the singular
complexes: the Q wave is "deleted'. However, detection instability may also affect the labelling
of waves, due to the presence or absence of a small initial R wave. If it is detected in a singular
case while the averaged case shows a QR panem, an R wave is 'created' and the waves labelled
as Q and R in the averaged complex will pass as S and R' waves, respectively, in the individual
complex. Conversely, deletion of an initial R relabels the subsequent S into a Q (or QS).
136
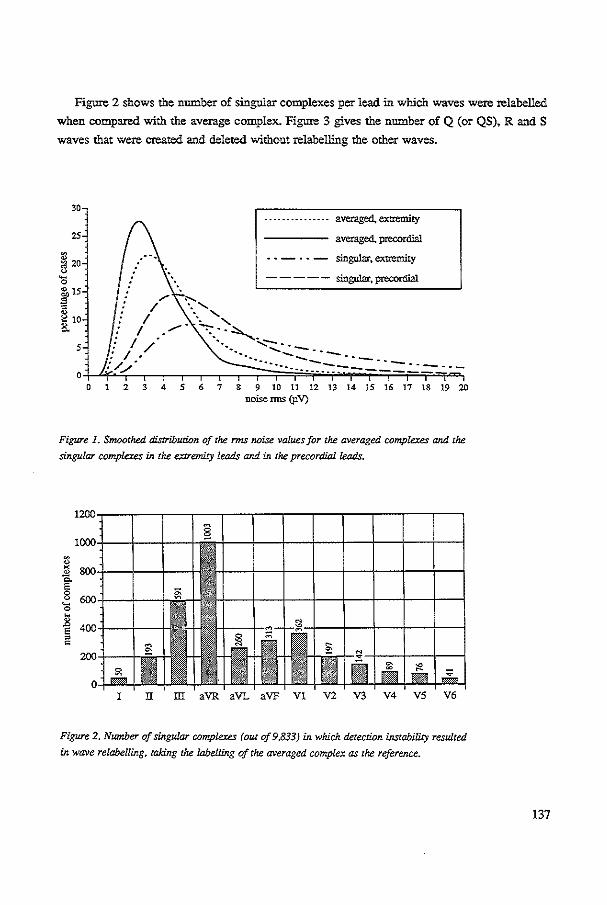
Figure 2 shows the number of singular complexes per lead in which waves were relabelled
when compared with the average complex. Figure 3 gives the number of Q (or QS), RandS
waves that were created and deleted without relabelling the other waves.
30
25
~ 20
'0 i 15 c
[10 5
0 0
" ·.' . '
.... -.. - .. -- .. - averaged, extremity
averaged, precordial
• ~ - · • - singular. extremity
----- singular, precordial
. ~:.._ ....... /' · ... :::..-...
··--... :......-:::...::_--.-·----- --- -.------------------ ---
2 3 4 s 6 7 8 9 10 11 n 13 u IS 16 n 18 19 w noise nns (p.V)
Figwe 1. Smoothed distribution of the rms noise values for the averaged complexes and the
singular complexes in the extremity leads and in the precordial leads.
I II ill aVR aVL aVF Vl V2 V3 V4 VS V6
Figure 2. Number of singular complexes (out of9,833) in. which detection instability resulted
in wave relabelling, taking the labelling of the averaged complex as the reference.
137

• created • deleted
Qwaves
l II ill aVR aVL aVF VI V2 V3 V4 VS V6
R waves
700 <~
<~
0 I o_-._ I~ fa - I~~ IE I~~ ~~~ ~ I ~-~- 0 00
I II ill aVR aVL aVF VI V2 V3 V4 VS V6
S waves
I II ill aVR aVL aVF VI V2 V3 V4 VS V6
Figure 3. Number of waves created or deleted in the singular complexes, taking the absence or
presence of a wave in the averaged complex as the reference. Singular complexes with relabelled
waves have not been considered.
138

Table 1 shows the median and the 10 and 90 percentiles of the differences between each
singular and its corresponding averaged complex for the amplitude measurements of the Q, R,
and S waves. Differences were computed if a wave had been detected in at least one of the two
complexes to be compared. The percentiles were derived from the differences of all leads. For
QRS duration the median of the differences between singular and averaged cases was 0 ms (10
percentile -6 ms, 90 percentile 10 ms), for PQ interval 0 ms (-6 ms, 6 ms), and for QT interval
2 ms (-8 ms, 22 ms).
Table 1. Medians of the amplitude differences (in f,lV) between the singular and the averaged complexes
for the Q, R, and S waves of all leads. A difference, i.e., the wave amplitude of a singular complex
minus that of the averaged complex, was compured if a wave was present in at least one of the
complexes. In parentheses are the 10 and 90 percentiles of the differences.
no wave relabelling wave relabelling
wave in both wave created wave deleted wave in at least
complexes one complex
Q -4 (-31/17) -44 (-78/-28) 39 (28/63) 47 (-974/876)
R 4 (-38/50) 66 (52/106) -Q7 (-113/-52) -5 (-316/186)
s -5 (-51{38) -Q6 (-109/-52) 64 (52/113) -53 (-875/953)
Classification matrices of the interpretations of singular complexes versus corresponding
averaged complexes are shown in Table 2 for each of three groups: 'normal', 'hypertrophy'
(including LVH, RVH, and BVH), and 'infarction' (including AMI, !MI, MIX, and VH+MI).
When the program stated two categories belonging to the same grcup, the highest qualifier was
retained. For example, the statement "definite AMI, possible IMf' turns into "definite
infarction''. Since the computer program does not generate statements that are coded as "possible
normal'', one row and one column in the classification matrix for 'normal' is empty. The figures
in the extreme off-diagonal cells are smallest in the case of hypertrophy, which is therefore the
stablest classification, no doubt related to the fact that the R wave is the stablest feature in
waveform recognition.
139
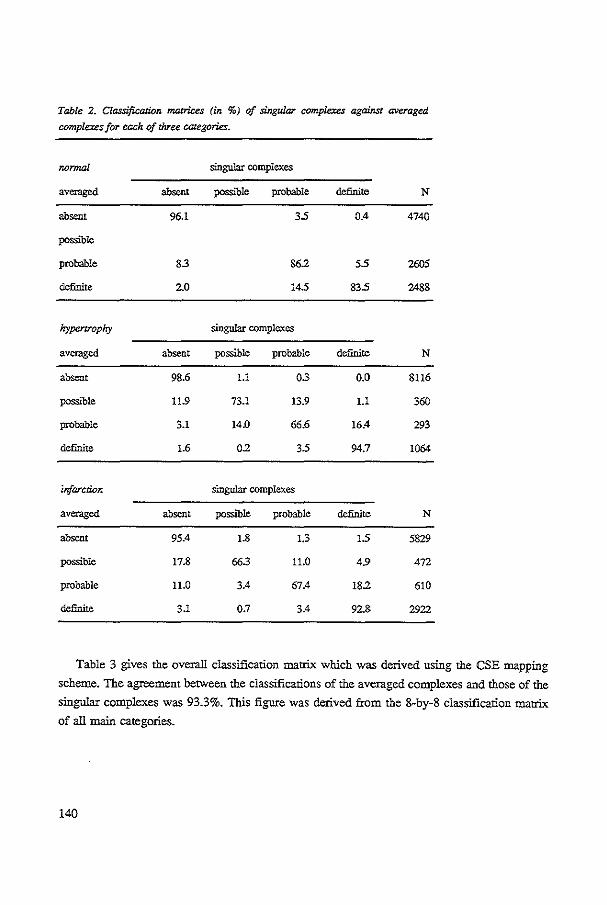
Table 2. Classification matrices (in %) of singular complexes against averaged
complexes for each of chree categories.
nonnal singular complexes
averaged absent possible probable definite N
absent 96.1 35 0.4 4740
possible
probable 83 862 55 2605
definite 2.0 145 835 2488
hypertrophy singular complexes
averaged absent possible probable definite N
absent 98.6 Ll 03 0.0 8116
possible 11.9 73.1 13.9 Ll 360
probable 3.1 14.0 66.6 16.4 293
definite 1.6 02 35 94.7 1064
infarction singular complexes
averaged absent poSSlble probable definite N
absent 95.4 1.8 1.3 15 5829
possible 17.8 66.3 11.0 4.9 4n
probable 11.0 3.4 67.4 182 610
definite 3.1 0.7 3.4 92.8 2922
Table 3 gives the overall classification matrix which was derived using the CSE mapping
scheme. The agreement between the classifications of the averaged complexes and those of the
singular complexes was 93.3%. This figure was derived from the 8-by-8 classification matrix
of all main categories.
140

Table 3. Overall classifica!Wn matrix (in %) of singular complexes against averaged
complexes.
singular complexes
averaged NOR HYP INF OTH N
NOR 94.8 1.1 3.1 1.0 5093
HYP 25 93.2 3.0 13 1218
INF 43 0.8 94.1 0.8 3461
orn 9.8 3.3 295 57.4 61
NOR=nonnal; HYP=hypertrophy; INF=infarction; OTII=o!her abnormalities.
It is interesting to know how the classifications deviating from that of the averaged complex,
are disttibuted over the ECG recordings. We only consider differences of at least two qualifier
points between the classifications of the singular and averaged complex for corresponding
categories. For instance, in the statements "probable (=2) LVH, possible (=1) AM!" for one
complex and "definite (=3) AMI'' for the other, there is a difference of two qualifier points both
for L VH and for AM!. For each ECG recording, the number of singular complexes that deviate
in the above sense has been counted; in 333 ECGs one or more two-point deviations occurred.
Figure 4 shows a histogram of the number of deviating complexes per ECG. It appears that
discordant classifications often occur only once in a particular ECG.
200,---------------------------,
~ 150
~ 'Oroo .8 ~ 50
-
1 2 3 4 5 6 7 8 9 w number of deviating classifications
Figzue 4. Distribution of the number of
deviating classifications per ECG record
ing, comparing the classifications of
singular and averaged complexes. The
classification of a singular complex devi
ates from the classlfLCation of the aver
aged complex if the quallfrers for any of
the main categories differ at least two
points.
141

The classifications of the averaged complexes contaminated with additional noise were
compared with the classifications of the original averaged complexes. In Figure 5, the
percentage agreement is depicted for noise values of 5, 10, 15, 25, and 35 p.V nns.
100E=a=!==s=3 r-+·- +--- --+--·-1-- -- --
~ 95 1-- -1--r----·lr- --
5 -+·· -- -E -1--f---1-- -· --' 90 -[---!---· ---·-
1----- -·-·--- -·- --·
-t-+--1------- ---·-·1-- --·- --- ·-·-- --
85-\-.....f-..,..,.,~f..,+,.,.j-,....,;H 0 5101520253035
noise nns (Jl V)
Figure 5. Agreement between the classijicaricns of the averaged complexes conr.aminated with random noise of
different rms values and the classifications of the averaged
complexes without contaminating Mise (N=l ,220).
We submitted the classifications based on the averaged complex and the 'combined\ i.e.,
weighted, classifications based on the singular complexes to the CSE cootdinating center for
comparison with the 'clinical evidence'. Classification matrices for the eight main categories
were computed. From these 8-by-8 matrices, 3-by-3 matrices were derived for the categories
'normal', 'hypertrophy', and 'infarction'. The results are shown in Table 4. The specificity and
the sensitivities of the combined singular interpretations are slightly higher than for the averaged
complex. The total accuracy, derived from the 8-by-8 classification matrices, increased from
69.8% to 71.2% (P < 0.001, equivalence tested with Wilcoxon's signed-rank test [17]).
Discussion
Beat-to-bear variation
In several studies [11,18,19], beat-to-beat variation has been demonstrated in the form of
variability of measurements in different complexes of the same recording. The recordings that
were used in these studies were selected because of their low noise content, so that variation
due to extrinsic sources was minimized. The distinction between intrinsic and extrinsic
variability is elusive, however, because no reference signal is available. Therefore, in the present
study no attempt was made to reduce either one source of variation a priori.
The results of this study demonstrate that large beat-to-beat variation can occur when
detection instability results in the relabelling of waves. For instance, Table 1 shows that in
142

Table 4. Classification matrices of the interpretations of the averaged complexes (upper
part) and of the 'combinecf interpretations of the singular complexes (lbwer part)
against the 'clinical evidence' for the CSE dalabase (N=1220).
averaged complexes
clinical NOR HYP INF OTH N evidence
NOR 97.1 0.3 2.6 0.0 382
HYP 43.0 425 9.1 5.4 291
INF 265 25 672 3.7 547
•combined' singular complexes
clinical NOR HYP INF OTH N evidence
NOR 97.4 0.3 2.4 0.0 382
HYP 42.1 44.8 9.1 4.0 291
INF 24.6 2.7 69.0 3.7 547
NOR=normal; HYP=hypertrophy; INF=infarction; OTH=other abnormalities.
twenty percent of the cases the amplitudes for a created or deleted Q wave exceeds -97 4 !' V
or +876 pV, respectively, which means that these waves may have a huge impact on diagnosis.
Detection instability can also create and delete waves without relabelling the other waves.
According to Table 1, the median values and the dispersions of their amplitudes are rather
small. When no wave relabelling occurs and both waves are present, the medians of the wave
differences are close to zero, while the dispersions are comparable to those of created or deleted
waves.
Fignre 2 indicates that leads ill, aVR, aVF, and V1 are most liable to wave relabelliog. The
higb number of relabelliogs in a VR corresponds to the number of Q waves created or deleted
in the oppositely oriented inferolateral and lateral leads I, II, a VI-, V4, V5, and V6 (Figure 3).
The latter usually have a main positive deflection: the presence or absence of a small initial
negativity does not affect wave labelliog. The corresponding manifestation of a small initial R
in the mainly negative aVR, however, will relabel a Q or QS into an S, and vice versa. The R
143

waves in a VR. referred to in Figure 3, are terminal since they occur without relabelling. They
correspond to S waves in the inferolateral and lateral leads where terminal negativity often is
marginal. Figure 3 shows that the R wave is a very stable feature in waveform recognition,
except for a VR which plays a minor or no role in diagnostic classification anyway. In Vl, as
in aVR. the label of the usually prominently negative deflection depends on an initial R, which
however in Vl is more consistent in its manifestation than in a VR. In lead m small variations
of the electrical axis, which tends to be perpendicular to this lead, are able to cause the creation
or deletion of any wave component, often with relabelling. To a lesser degree tltis applies also
to lead aVF.
Averaging complexes, measurements, or classifications
To reduce noise from extrinsic sources, ECG signals are 'ftltered', either by averaging
complexes or measurements, or by selecting one single (low-noise) complex. The method
proposed in tltis paper refrains from ftltering the signal but, instead, 'filters' diagnostic
statements of singular complexes by weighting the certainty qualifiers of each category. Thus,
variability, both extrinsic and intrinsic, will be taken into account in the classification process. (It should be noted that MEANS also performs signal conditioning other than coherent
averaging, such as removal of mains interference, baseline correction, etc.) Since noise from
extrinsic sources is less reduced, measurement errors are likely to occur more often in singular
complexes than in averaged ones, and classification errors may occur more frequently. This is
no real drawback. however. because the weighting procedure will remove the erroneous category
or reduce the qualifier to 'possible". Another way to reduce the effect of measurement errors
not pursued here is to apply consistency checks on measurements values. When an outlier is
detected, the corresponding complex could be rejected from further processing.
The approach may have two other advantages. First. the dispersion in the diagnostic
statements pertaining to the singular complexes, can be communicated to the user of the
program, providing information about the stability of the 'aggregate' classification, and
suggesting alternative classifications. Such information may be expected to be more pertinent
than information about measurement variability, as the relationship between measurements and
classification will remain obscure to the average user. Second, large discrepancies between
classifications of singular complexes may be caused by a high degree of intrinsic variability of
the ECG, but may also be the result of flaws in the classification logic. For instance, when
adjacent decision regions in the classification space for the same category differ two or three
qualifier 'steps' (e.g., "definite LVH" and "possible L VH"), small differences in measurements
may result in large differences in diagnostic classification. Thus, the approach offers an entry
to detect weak parts in the classification algorithms.
144

Stability testing
The method described in this paper can also be used to test the stability of an ECG computer
program. Stability testing procedures expand a test set ofECGs by generating 'new' ECGs; they
explore the program's behavior in an enlarged area of the feature space.
In one approach, a set of low-noise recordings was selected [20-23]. Noise of various types
(e.g., high-frequency noise, mains interference, baseline sways) and of vatying amplitudes is
generated and superimposed on the original ECG. Differences are then deterntined between the
ECGs contaminated with noise and the original ECGs. In another approach, a comparison is
made between ECGs that are expected to differ in their natural noise content; no noise is added.
For this purpose, several ECG recordings of the same patient have been analyzed [24], the same
analog recordings have been repeatedly digitized [25], or alternate samples have been processed
from ECGs that had been sampled at twice the sampling rate [26,27].
Our study differs from previous approaches in at least one of the following aspects: the size
of the database, the assessment of the effect of disturbances, and the type of disturbance.
Size of the database. The original test set contained 1,220 cases, and was expanded to 11,055
cases. This database is (much) larger than used in other stUdies; whether it is large enough,
remains an open question.
Assessmenr of the influence of noise. The relationship between measurements and classifications
is generally obscure. Large differences in diagnosis may be brought about by small differences
in measurement values and, conversely, large differences in measurements need not be of
diagnostic importance. Therefore, the stability of an ECG computer program should also be
evaluated by assessing the influence of disturbances on the program's diagnostic classifications.
Type of disturbances. Our procedure makes use of the disturbances that are namrally present in
the original ECGs. The precise nature of the noise, however, is not considered and the influence
of a specific type of noise on program performance is difficult to assess. This need not be a
problem, provided that the test set is large enough to represent all kinds of disturbances that can
be expected in reality. The advantage of the approach is that the program's stability under 'real'
operating conditions is tested.
Extrinsic and intrinsic variability
Fignre 5 shows that the agreement between the classifications of the averaged complexes
contaminated with noise and the original averaged complexes gradually decreases when
increasing amounts of noise are added. Noise levels beyond 35 )lV rms may be expected to
further reduce the agreement rate; eventually so much noise might be added to the averaged
complexes that 'random' interpretations would result.
The average difference in noise level between averaged complexes and singular complexes
is in the order of 5 )IV rms (Fignre 1). If an amount of 5-10 )IV rms is added to the averaged
145

complexes, agreement with the original averaged complexes drops to about 97% (Figure 5),
whereas the agreement between singular complexes and averaged complexes was 93.3%. The
latter level of agreement is apparently only reached after addition of as much as 25 p.V of noise
to the averaged complex. This finding lead us to think it unlikely that the observed differences
in classification between averaged and singular complexes are fully attributable to the influence
of extrinsic noise: intrinsic variability also matters.
Diagnostic accuracy When tested on a large validated database, the total accuracy of the combined classifications
of the singular complexes proved to be higher than that of the classifications of the averaged
complexes. One explanation of the good performance of the combined classifications is that any
intrinsic variability is not averaged. But there may be other reasons as well. When an averaged
complex is being analyzed, errors in the measurement part of the program can have large
consequences for the interpretation. The same applies to singular complexes: errors here are
even more likely because singular complexes, in general, are noisier than averaged complexes.
The final combined interpretation, though, will be less affected because the weighting procedure
will 'filter' the erroneous interpretation, provided that most singular complexes are correctly
analyzed. A possible second reason for improvement might be that a small amount of jitter
occurred in the reference points which are used to align the singular complexes, yielding an
averaged complex that is no longer representative.
The main conclusions of our investigations are as follows: (1) Beat-to-beat variation in the
measurements of different complexes is largest when detection instability results in wave
relabelling; (2) Beat-to-beat variation in the diagnostic interpretations of different complexes is
influenced both by extrinsic noise and intrinsic variability; (3) The performance of the
'combined' interpretations of singular complexes is bener than that of the interpretation of the
averaged complex; furthermore, the interpretation of singular complexes can provide the user
with information about the program's stability and may be used to detect flaws in the
classification logic.
Acknowledgments
We are grateful to Dr. J.L. Willems and R. Reniers in the CSE coordinating center (Catholic
University Leuven, Belgium) for processing the .MEANS results. The CSE project was supported
by the European Commission within the frame of its Medical and Public Health Research
Programmes, and by various funding agencies in the member states of the European Community.
146

References
[1] Broce RA, Yarnall SR. Reliability and normal variations of computer analysis of Frank electrocardiog::rams
by Smith-Hyde program (1968 version). Am J Qlrdiol1972;29:389-96.
[2] Arnaud P, Rubel P. Morlet D, Fayn J, Fortini MC. Methodology ofECG interpretation in the Lyon program.
Methods lnf Med 1990;29:393-402.
[3] Balda RA, Diller G. Deardorff E, Doue J, Hsieh P. The HP ECG analysis program. In: Van Bemmel JH,
Willems JL, eds. Trends in Computer-Processed Electrocardiograms. Amsterdam: North-Holland Publ Camp,
19n:197-204.
[4] Degani R, Bortolan G. Methodology of ECG interpretation in the Padova program. Methods Inf Med
1990;29:386-92.
[5] Pipberger HV, McManus CD, Pipberger HA. Methodology of ECG liuerpretation m the AVA program.
Methods lnf Med 1990,29:337-40.
[6] Rowlandson GI. The Marquette 12SL program. In: Willems JL, Van Bemmel m. Zywietz C, eds. Computer
ECG Analysis: Towards Standardization. Amsterdam: North-Holland Publ Camp, 1986:49-52.
[7] Van Bemmel JH, Kors JA, Van Herpen G. Methodology of the Modular ECG Analysis System MEANS.
Methods lnf Med 1990,29:346-53.
[8] Brohet CR. Derwael C, Robert ~ Fesler R. Methodology of ECG interpretation in the Louvain program.
Methods lnf Med 1990;29:403-9.
[9] Macfarlane PW, Devme B, Latif S, McLaughlm S, Shoat DB, Watts MP. Methodology ofECG interpretation
in the Glasgow program. Methods lnf Med 1990,29:354-61.
[10] Rautaharju PM, Macinnis PJ, Warren JW, Wolf HK, Rykers PM, Calhoun HP. Methodology of ECG
interpretation in the Dalhousie program; NOV ACODE ECG classification procedures for clinical trials and
population health surveys. Methods lnf Med 1990;29:362-74.
[11] Zywietz C, Borovsky D, Gt>tsch G, Joseph G. Methodology of ECG interpretation in the Hannover program. Methods lnf Med 1990;29:375-85.
[12] Kors JA, Talman JL, Van Bemmet ffi. Multilcad ECG analysis. Comput Biomed Res 1986;19:28-46.
[13] Willems JL, Arnaud P. Van Bemmel JH. et al. Common standards for quantitative electrocardiography: Goals
and main results. Methods lnf Med 1990;29:263-71.
[14] Willems JL. Common Standards for Quantitative Electrocardiography- 6th CSE Progress Report. Leuven:
ACCO, 1986.
[15] Willems JL. Abreu-Lima C, Arnaud P, ct al. The diagnostic performance of computer programs for the
interpretation of electrocardiograms. N Engl J Med 1991;325:1767-73.
[16] Willems JL. Arnaud P. Van Bemmcl JH, et al. Assessment of the performance of electrocardiographic
computer programs with the use of a reference data base. Circulation 1985;71:523-34.
[17] Michaelis J, Wellek S, Willems JL. Reference standards for software evaluation. Methods Inf Med
1990;29:289-97.
[18] Fischmann E, CosmaJ, Pip berger HV. Beat to beat and obscr.rer variation of the electrocardiogram. Am Heart
J 1968;75:465-73.
[19] Borovsky D. Zywietz C. Accuracy and beaHo-beat variation in ECG computer measurements. In: Abel H. ed. Advances in Cardiology (Voll6). Basel: Karger, 1976:176-81.
147

[20] Helppi RK. Unite V. Wolf HK. Suggested minimal perfonnance requirements and methods of performance
evaluation for computer ECG analysis programs. Can Med Assoc J 1973:108:1251-9.
[21] Wolf IlK, Sherwood JD, Kanon DJ. The effect of signal noise on the perfonnance of several ECG programs.
In: Ostrow HG. Ripley KL. eds. Proc Computers in Cardiology 1976. Long Beach: IEEE Comput Soc
1976:303-5.
[22] Willems JL, Zywietz C, Arnaud P. et al. Influence of noise on wave boundary recognition by ECG measurement programs. Comput Biomed Res 1987;20:543-62.
[23] Zywiett C. Willems JL. Arnaud P, Van Bemrnel lH. Degani R, Macfarlane PW. Stability of computer ECG
amplitude measurements in the presence of noise. Comput Biomed Res 1990;23:10-31.
[24] Hagan AD. Alpert JS. Evaluation of computer programs for clinical electrocardiography. In: Cady LD. ed.
Computer Techniques in. Cardiology. New York: Marcel Dekker. 1979:77-96.
[25] Willems JL. Pardaens J. Reproducibility of diagnostic results by a multivariare ccmpurer ECG analysis
progmm (AVA 3.5). Eur J Cardiol1977;6:229-43.
[26] Bailey JJ. Horton M. Itscoitz SB. A method for evaluating computer programs for electrocardiographic inteipretation. m. Reproducibility testing and the sources of program errors. Circulation 1974;50:88-93.
[27] Bailey JJ, Horton M, !tsccitt SB. The importance of reproducibility resting of computer programs for
electrocardiographic interpretation: Application to the automatic vectorcardiographic analysis program (AVA
3.4). Comput Biomed Res 1976;9:307-16.
148

CHAPTER 10
Discussion
149

Three problem areas in computerized electrocardiography were distinguished in the
introduction of this thesis: formalization of knowledge, observer variability, and evaluation. We
will discuss om investigations in relation to these issues, and suggest <fuect:ions for further
research.
Formalization of knowledge
Our main contribution to the problem of knowledge formalization has been the construction
of a specialized language, D1L (Decision Tree Language), and the development of an interpreter
and a translator for that langnage. Using these tools, cardiologists can express their classification
algorithms in a way that is familiar to them, and can easily verify whether their diagnostic
intentions have been realized properly.
Still, the development of a heuristic ECG classifier remains a process of trial and error. First,
a cardiologist will generally not be able to foresee all effects of the modifications or extensions
that he proposes. These may often only become apparent at a later stage when the modified
algorithms have been tested on a large database of ECGs. Second, and more fundamental,
flawed parts of the decision trees may not be noticed because of the limited size of the test set.
Two extensions of the DTL system can be envisaged to accommodate these problems. First, a
closer integration of the D1L interpreter, the D1L translator, and the database could be realized.
This should allow. for instance, the alternative execution of interpreted and compiled versions
of D1L programs using (part of) the database. Thus, a cardiologist would be able to receive
information about the overall effect of modifications almost instantly.
Information about weak parts in the classification logic might be provided by the stability
analysis that was described in Chapter 9: the differences between interpretations of singnlar
complexes of the same recording may provide a handle for error detection. Such 'sensitivity
analysis • is an area of further research. For example, the effect of controlled disturbances of one
or more measurement values may be studied, or the effect of systematically modifying threshold
values in the decision nodes. The DTL system should be extended to enable the logging,
analysis. and comparison of the classification paths, ie.. the decision nodes that were
encountered in classifying particular cases.
Observer variability
Cardiologists may show considerable variability in their diagnostic interpretations. Even
greater variability may be expected to exist in the classificatory knowledge which is the basis
for their interpretations. We investigated a 'direct' approach and an 'indirecf approach to deal with these variabilities. In the direct approach, a procedure is applied which aims at resolving
150
the differences between cardiologists. In the indirect approach, no consensus is sought, but
instead the cardiologists' outputs are 'aggregated' by some son of combination rule.
The Delphi procedure, described in Chapter 6, is an example of the direct approach. We
investigated whether classification differences between multiple cardiologists could be resolved,
and whether a consensus could be reached on their reasons for disagreeing with the computer
classifications. The reasons were expected to reflect classificatory knowledge, and would
hopefully be useful in improving the computer program. The Delphi procedure was found to
increase the consensus on the classifications. However, its use for program improvement appears to be problematic because the reasons provided by the cardiologists were too diffuse to be
directly useful
There is another option, not pursued in this study, to use the Delphi procedure for program
improvement. Algorithms exist to generate decision trees automatically from a learning set of
cases, where for each case feature values and a classification label have been provided [1,2].
A Delphi procedure could be applied to obtain a consensus on the classification labels for a set
of ECGs. The advantage of this approach would be twofold. First, the decision tree would be
trained using the consensus opinion of multiple expens and may be expected to reflect this
opinion. Second, the reasons for a particular classification could easily be explained, thus
obviating an important disadvantage of statistical classifiers. However, as the criteria in the
decision nodes are determined automatically, they may appear 'illogical' to cardiologists.
Research is needed to determine the 4intelligibility' of the decision trees, and to investigate
whether interactive control of the tree generation procedure is wonhwhile.
The indirect approach has been used in Chapters 8 and 9. In our investigations, we combined
interpretations given by computer programs that incorporate the (formaliaed) knowledge of
cardiologists, rather than interpretations given by cardiologists themselves (which was done in
the CSE project). Combination at the level of classificatory knowledge remains an issue for
further research.
Evalnation
The project 'Common Standards for Quantitative Electrocardiography' (CSE) [3,4] has been
of invaluable help in evaluating the MEANS interpretation programs described in this study: we
heavily used the CSE multilead and diagnostic databases, and we adopted many of the
evaluation methods developed in the CSE project. The availability of well-validated databases
has been, and will remain to be, a sine qua non for the proliferation of ECG interpretation
programs. For example, testing agencies like the FDA (Food and Drug Administration) have
staned to formulate performance requirements for medical software [5]. Such requirements can
only be met when large databases are available for testing purposes.
151

90',-.-~,-.-,~~~.-~~-.,-.-~,-.-r-r-r.-.-~-.-.~ -t-\ -t--- \ ; ·\ +-1--t--t--t-+-i\-+I ~c;;l---~-\ ; -~-; i \ i
! j i ! ! i ! i i
Ill 'old'ECG
-• 'new'ECG
A VCG --.., rVCG
D sECG
0 ECG+VCG -
.6. ECG+rVCG
<> heuristic programs
-+-+-·+-- -- -·- --+-+--\-- ~--l--\--- -· -4--+-+--+·-· • statistical programs
181 cardiologists
I 85 90
total accuracy against 'clinical evidence'(%)
Figure 1. Total accuracies of the MEANS interpretation programs: .. old' EGG, 'new.>' EGG, VCG, and
reconstructed VCG (rVCG) interpretation, 'combined' ECG interpretation of singular complexes (sECG),
and 'combined: ECG+ VCG and ECG+rVCG inl.erpretations. The total accuracies of the other programs
and cardiologists participating in the CSE study have also been entered. From these cardiologists the
'combined cardiologisr' was derived.
!52

All interpretation programs that were described in this thesis, have been evaluated using the
CSE diagnostic database. Two reference standards have been used: the 'clinical evidence' and
the 'combined cardiologist' result. The total accnracies of all MEANS interpretation ptograms
against these two standatds are depicted in Fignre 1. Total accuracies have also been entered
for the other programs participating in the CSE study, and for the cardiologists from which the
'combined cardiologist' was derived [6]. Several remarks can be made:
- The influence of different references used in building heuristic and statistical ECG computer
programs is illustrated in Fignre 1. The four statistical programs that participated in the CSE
study have been trained on databases that were validated by means of 'clinical evidence'. The
other, heuristic, programs are based on classification algorithms rendered by cardiologists.
Hence, the agreement of the statistical progtams with the 'clinical evidence' may be expected
to be higher than that of the heuristic programs, while the revetse it true for the agteement
with the 'combined cardiologisf.
- Three versions of the ECG interpretation program have been evaluated: the 'old' (i.e., prior
to modification with DTI..) ECG program, the 'new' ECG program which interprets the
averaged complex, and the 'new' ECG progtam which classifies each individual complex in
the recording separately and subsequently combines the multiple classifications into a final
result (sECG). Of these three program versions, the sECG progtam performs best. However,
Fignre I also shows that the ECG program still needs further improvement in order to reach
a performance comparable to that of most cardiologists.
- Total accnracies of the 'combined' interpretation programs (ECG+ VCG and ECG+rVCG) are
significantly higher than those of each interpretation program separately; they are comparable
with those of the cardiologists. In the CSE study, the cardiologists always interpreted the ECG
or the VCG separately. It would be interesting to investigate whether a cardiologist is able
to improve his diagnostic performance by interpreting the ECG and the VCG (or rVCG)
simultaneously.
Finally, it should be realized that the total accuracy is dependent on the composition of the
database. A patient distribution such as in the CSE diagnostic database may be considered
representative for a clinical environment. Therefore, conclusions from the above comparison of
program results may not be applicable to other operating environments.
!53

References
[1] Breiman L, Friedman JH. Olshen RA. Stone CJ. Classiju;ation and Regression Trees. Belmont: Wadsworth,.
1984.
[2] Talman JL. A multiclass nonparametric partitioning algorithm. In: Gelsema ES. Kana! IN, eds. Pattern
Recognition in Practice II. Amsterdam: North·Holland Publ Camp, 1984:449-59.
[3] Willems JL, Arnaud P, Van Bemmel JH. et al Common standards for quantitative electrocardiography: Goals and main results. Methods Inf Med 1990;29:263-71.
[4] Willems JL, Abreu-Lima C, Arnaud P, et al. The diagnostic perfonnance of computer programs for the
interpretation of electrocardiograms. N Engl J Med 1991;325:1767-73.
[5] Young FE. Validation of medical software: present policy of the Food and Drug Administration. Ann Jnt Med
1987;106:628-9.
[6] Willems JL. Common Standards for Quantitative Electrocardiography -1Oth CSE Progress Report. Leuven:
ACC0.1990.
!54

SUMMARY
155

This study addresses two main questions: (1) How can the transfer of cardiological
knowledge into computer algorithms be facilitated, and (2) Can the diagnostic performance of
an ECG computer program be improved by combining different sources of cardiological
knowledge? In posing these questions, we had a particular interest in improving our own ECG
interpretation program MEANS (Modular ECG Analysis System).
In Cbapter 2, we describe the signal analysis algorithms incorporated in the measurement
part of MEANS and the procedure that was adopted to process multilead ECGs, i.e., standard
12-1ead ECGs with eight independent leads recorded simultaneously. The algorithms were
evaluated on a library of 250 simultaneously recorded ECG and VCG leads, wbich had been
collected in the international project 'Common Standards for Quantitative Electrocardiography'
(CSE). Results were determined for the multilead ECG, the four lead groups of the 12-lead ECG
(wbich had always been processed in previous versions of MEANS), and the VCG. It proved
that the performance of MEANS for the multilead ECG is comparable to that for the VCG, and
at least as good as that for each of the four lead groups. The measurement part of MEANS
described in Chapter 2 has been used throughout all our investigations.
In Chapter 3, the two prevalent methods for diagnostic ECG classification, statistical and
heuristic, are described. In the heuristic approach, the cardiologist provides the knowledge to
construct a classifier, usually a decision tree. In the statistical approach, probability densities of
diagnostic features are estimated from a learning set of ECGs and multivariate techniques are
used to attain diagnostic classification. The relative merits of both approaches are discussed.
Heuristic classifiers are more comprehensible than statistical ones, encounter less difficulties in
dealing with combined categories, and allow that new categories be readily entered or that
existing ones be refined in a stepwise manner. On the other hand, statistical classifiers are easily
adapted to another operating environment and require less involvement of cardiologists.
We alao argue that two reference standsrds are of importance in the evaluation of ECG
classification methods: ECG-independent clinical evidence and the combined judgment of a
board of cardiologists. Tills point of view is the consequence of our position that the ECG
should be classified on itself, discarding information other than age and sex, while only
afterwards other information is used to reach a final diagnosis.
The first question - how to ease the transfer of cardiological knowledge into computer
algorithms? - is considered in Chapters 4 and 5. Two key issues were discerned: (1) While a
computer expert is required to translate the cardiologisfs way of reasoning into computer
language, most often the average cardiologist is not able to verify whether his intentions were
properly realized, and (2) The operations of the program, when classifying a particular case, are
often obscure to the program developer and impede program debugging and modification. The
first problem ('representation') was solved by designing a dedicated language, D1L (Decision
Tree Language), which enables cardiologists to express their classification knowledge in a way
156

familiar to them. The second problem ('insight') was dealt with by developing an interpreter for
D1L which enables cardiologists to interactively trace the operation of the program and to
modify the algorithms. A D1L translator was also developed to produce a fast run-thne version
of D1L programs. A comprehensive description of the considerations in designing these tools
together with their functionality is given in Chapter 4.
The D1L environment was used to improve the ECG interpretation part of MEANS. In
Chapter 5, a procedure is described to refine an ECG computer program step by step,
alternatively using a database as learoing set and test set. The almost colloquial nature of the
D1L language and the interactivity of the system proved to be of great advantage. Initial
modifications were tested on an independent database (N~l,220). which was collected and
validated in the CSE project. Total accuracy against the 'clinical evidence' increased from
67.5% to 69.8%.
Transfer of cardiological knowledge into computer algorithms could also have been carried
out by the more conventional approach, in which the computer expert acts as an intermediate
between the cardiologist and the computer program. In our opinion, such an approach would
be so time consum.ing and cumbersome as to make it impracticable. It should be kept in mind,
however, that DTL and its interpreter and translator are tools to ease the transfer of knowledge
and identify possible flaws in the (formalized) knowledge; they are not a panacea for the
possibly low quality of such knowledge.
The second question - can diaguostic performance be improved by combining knowledge
from multiple sources? -is smdied in Chapters 6 through 9 from different perspectives.
Multiple cardiologists. In Chapter 6, it was investigated whether the Delphi method could be
applied to elucidate knowledge from multiple experts in order to improve computer-supponed
ECG interpretation. To that end, five cardiologists were asked to judge the computer
interpretation of thirty ECGs. The Delphi procedure was aimed at increasing the agreement
among the cardiologists for two data items: (1) the changes made by the cardiologists in the
computer classifications, and (2) their reasons for doing so.
It was found that the Delphi procedure produced a substantial increase of agreement in the
cardiologists' classifications; the final agreement, quantified by kappa statistics, was comparable
to the intraobserver agreement of the individual cardiologists. The agreement on the reasons was
also vety high. However, the reasons proved to be too incomplete and too fuzzy to be directly
useful for program improvement.
Multiple programs. We investigated whether a combination of two interpretation programs, one
for ECG classification, the other for VCG classification, would yield a better performance than
each program separately. As such an approach would require that a VCG be always recorded
in addition to the ECG, we also investigated whether the VCG could be adequately
!57

reconstructed from the ECG. Such a reconstructed VCG (rVCG) could then be processed in the
usual way by the VCG classification program.
In Chapter 7, three methods for reconstructing the VCG from the ECG were studied: a
single-lead method using a quasi-orthogonal set of ECG leads, a method based on a model of
the cardiac electrical activity, and a statistical method using multivariate regression. Their
evaluation was primarily based on a comparison of the diagnostic classifications of the original
and reconstructed VCGs. Using a test set of 90 cases, the original and reconstructed VCGs were
presented separately and in random order to three referees. Kappa statistics were used to
quantify the agreement between diagnostic classifications. Separately, one referee was
simultaneously presented the original VCG and its three reconstructions. Each reconstructed
VCG was classified as diagnostically 'same' as the original, 'borderline' or 'different'.
The diagnostic evaluation showed no significant differences between the regression method
and the model-based method, both being preferable to the quasi-orthogonal method. Kappa
values indicated a good to excellent diagnostic agreement between the original and reconstructed
VCGs. Only one out of ninety VCGs that were reconstructed with the regression method was
classified as 'different' compared with the original VCGs; three VCGs were classified as
'different' with the model-based method.
In Chapter 8, two 'combined' programs were considered, one produced by merging the ECG
and VCG interpretations of MEANS, the other by combining the ECG and rVCG interpretations.
The performance of the programs was evaluated with the CSE diagnostic libraty. It was shown
that a 'combined program', produced by merging the classifications of the ECG and VCG
interpretation programs, performs better than each program separately. The combination of ECG
and rVCG interpretations had a performance similar to that of the combination of ECG and
VCG interpretations. This finding implies that the performance of an ECG computer program
can be improved by means of VCG criteria without needing the VCG to be recorded.
Multiple classifications. In Chapter 9, we investigated the effect of beat-to-beat variability on
the diagnostic classifications of MEANS. Two sources of variability were distinguished:
'extrinsic~ sources, e.g., powerline interference, baseline wander or electromyographic noise, and
'intrinsic' sources, e.g., changes in the volume conductor or the heart itself. Conventional
approaches of ECG processing base their diagnostic classification on one set of measurements
which is derived from a representative 'averaged' complex or by taking the median from the
measurements for each complex in the recording. We propose and evaluate an alternative
procedure in which each singular complex in the ECG recording is classified separately and the
multiple classifications are then combined in one final classification.
Taking the averaged complex as a reference, it was shown that beat-to-beat variation in the
measurements of singular complexes from the same recording was considerable. Variation was
158

largest when instability in the detection of waves resulted in wave relabelling. Leads Ill, a VR,
aVF, and Vl proved to be most liable to wave relabelling.
The agreement between the diagnostic interpretations of singular complexes and
corresponding averaged complexes was 93.3%. It was made plausible that both extrinsic noise
and intrinsic variability illi"luence the diagnostic interpretations.
The CSE diagnostic database was used to assess the performance of the 'combined' ECG
interpretations of singular complexes. Total accuracy was 71.2%, a slight increase over the total
accuracy of 69.8% that was obtained with the interpretations of averaged complexes. The
interpretation of singular complexes may also provide the user with information about the
program's stability and may be used to detect flaws in the classification logic.
In Chapter 1 0~ we discuss our investigations in relation to the difficulties encountered in improving computerized ECG interpretation. It is concluded that the performance of the
MEANS ECG interpretation program is not yet at the level of the best cardiologists who
participated in the CSE study. The combination of ECG and VCG classificatory knowledge at
the level of criteria and 'sensitivity analysis' of the interpretation programs appear to be the
most promising research areas to further improve ECG interpretation by computer.
159


SAMENV ATTING
161

In deze smdie staan twee vragen centraal: (1) hoe kan de overdracht van cardiologische
kennis naar computeralgoritmes worden vergemakkelijkt, en (2) kan de diagnostische prestatie
van een ECG-computerprogramma worden verlleterd door comblnatie van verschillende
'bronnen' van cardiologische kennis? Deze vragen werden mede ingegeven door de wens ons
ECG-interpretatieprogramma MEANS (Modular ECG Analysis System) te verbeteren.
Hoofdstuk 2 bevat een beschrijving van de signaalanalyse-algoritmes in MEANS en van de
procedure voor de verwerking van 'multilead' ECG's (standaard 12-afleidingen ECG's waarvan
acht onafhankelijke afleidingen simultaan zijn opgenomen). Een hestand van 250 simultaan
opgenomen ECG- en VCG-afleidingen werd gebruikt om de algoritmes te evalueren. Dit bestand
werd verzameld in bet kader van het intemationale project 'Common Standards for Quantitative
Electrocardiography' (CSE). Evaluatieresultaten werden bepaald voor het multileadECG, de vier
afleidingsgroepen van het 12-afleidingen ECG (deze groepen werden in voorgaande versies van
MEANS gebruikt), en het VCG. De prestaties van MEANS voor bet multilead ECG bleken
vergelijkbaar met die voor bet VCG, en minstens zo goed als die voor elk van de vier
afleidingsgroepen. Het in hoofdstuk 2 beschreven signaalanalysedeel van MEANS is gebruikt
bij alle experimenten. In hoofdstuk 3 worden de twee voomaamste methodes voor diagnostische ECG-classificatie
beschreven: de heuristische en de statistische. In de heuristische benadering Ieven een
cardioloog de kennis voor bet maken van een classificator, meestal in de vonn van een
beslissingsboom. In de statistische benadering schat men kansdichtheden van diagnostische
kenmerken aan de hand van een Ieerverzameling van ECG's. Vervolgens wordt met multivariate
technieken een diagnosti.sche classificatie bereikt. De voor- en nadelen van beide methodes
worden besproken. Heuristische classificatoren zijn inzichtelijker dan statistische. geven minder
problemen met gecombineerde categorieen. en laten op eenvoudige wijze het roevoegen van nieuwe categorieen of het stapsgewijs verfijnen van bestaande categorieen toe. Statistische
classificatoren daarentegen kunnen makkelijker voor een andere verwerkingsomgeving geschikt
gemaakt worden en vereisen minder betrokkenheid van cardiologen.
Oak wordt betoogd dat twee referentiestandaarden van belang zijn bij de evaluatie van ECG
classificatiemethodes: ECG-onafhankelijk klinisch materiaal en de gecombineerde ECG
beoordeling van een groep van cardiologen. Deze positie is het gevolg van ons standpunt dat
het ECG op zichzelf geclassificeerd dient te worden zonder informatie anders dan leeftijd en
geslacht. Na classificatie kan additi.onele informatie worden gebroikt om de uiteindelijke
diagnose te bepalen.
De eerste vraag - hoe kan de overdracht van cardiologische kennis naar computeralgoritmes
vergemakkelijkt worden? - komt aan de orde in de hoofdstukken 4 en 5. Twee problemen
werden onderscheiden: (1) er is een computerexpert nodig om de manier van redeneren van een
cardioloog in computenaal om te zetten. maar de gemiddelde cardioloog is niet in staat te
162

verifieren of zijn bedoelingen op de juiste wijze werden gerealiseerd, en (2) de werking van bet
programma, bij bet classificeren van een bepaald geval, is vaak onduidelijk voor de prograrnma
ontwikk:elaar en bemoeilijkt bet oplossen van fouten en het wijzigen van het programma Het
eerste probleem ('representatie') werd opgelost door een speciale taal te ontwerpen, DTI..
(Decision Tree Langnage), die cardiologen in staat stelt hun classificatiekenuis op een hun
vertrouwde wijze uit te drukken. Het tweede probleem ('inzicht') werd opgelost door een
interpretator voor DTI... te ontwikkelen. Deze stelt cardiologen in staat op een interactieve manier
de werking van het programma te volgen en algoritmes te wijzigen. Daamaast werd een DTI..
vertaler ontwikkeld waarmee een snelle executeerbare versie van de D1L-programma,s
gegenereerd kan worden. Een uitgebreide beschrijving van de ontwerpcriteria en van de
functi.onaliteit van deze hulpmiddelen is gegeven in hoofdstuk 4.
De DTL-omgeving werd gebruikt om het ECG-interpretatiedeel van MEANS te verbeteren.
In hoofdstuk 5 wordt een procedure beschreven om een ECG-computerprograrnma stapsgewijs
te veifijnen, waarbij een ECG-bestand afwisselend als leer- en testverzameling gebruikt wordt.
Het gemak waarmee cardiologische kennis in D1L uitgedrukt kon worden en de interactiviteit
van bet systeem bleken zeer nuttig. De eerste wijzigingen werden getest op een onafhankelijk
hestand (N;l220) dat werd verzameld en gevalideerd in het leader van het CSE-project. Het
percentage correcte classificaties, met het 'klinisch materiaal' als referentie, steeg van 67~%
naar 69,8%.
Cardiologische kennis had ook op een meer conventionele manier in computeralgoritmes
omgezet kunnen worden. De computerexpert fungeert dan als een schakel tussen cardioloog en
computerprogramma. Wij meenden echter dat deze benadering dermate tijdrovend en moeizaam
zou zijn, dat zij praktisch onuitvoerbaar was. Overigens, D1L en de interpretator en vertaler zijn
hulpmiddelen om de overdracht van kennis te vergemakkelijken en lacunes in de
(geformaliseerde) kennis op te sporen; zij vormen geen panacee voor de eventuele geringe
kwaliteit van die kennis.
De tweede vraag - kunnen diagnostische prestaties worden verbeterd door kennis uit
verschillende bronnen te combineren? - is in de hoofdstukken 6 tot en met 9 vanuit
verschillende perspectieven belicht.
Verschillende cardiologen. ln hoofdstuk 6 werd onderzocht of de Delphi-methode kon worden
toegepast om kennis aan verschillende card.iologen te ontlokken ter verbetering van
computerondersteunde ECG-interpretatie. Daartoe werd aan vijf cardiologen gevraagd de
computerinterpretatie van dertig ECG's te beoordelen. Het doe! van de Delphi-procedure was
om de overeenstemming tussen de cardiologen te verhogen wat betreft (1) de door hen gemaakte
veranderingen in de computerclassificati.es, en (2) hun redenen voor die veranderingen.
163

De Delphi-procedure leidde tot een aanzien!ijke toename in overeenstemming voor wat
betreft de canliologische classificalies; de uiteinde!ijke overeenstemming, uitgedrukt in kappa
waardes, was vergelijkbaar met de overeenstemming van elke cardioloog met zichzelf. De
overeenstemming voor de redenen was ook hoog, maar de redenen bleken niet compleet genoeg
en te vaag om direct bruikbaar te zijn voor programmaverbetering.
Verschillende programmds. Onderzocht werd of een combinatie van de programma's voor
ECG-classificalie en voor VCG-classificatie een betere prestatie zou leveren dan elk programma
afzonderlijk. Omdat deze benadering vereist dat naast bet ECG ook het VCG beschikbaar is,
werd tevens onderzocht of het VCG uit het ECG gereconstrueerd kon worden. Het
gereconstrueerde VCG (rVCG) zou dan op de gebruikelijke manier door het VCG
classificatieprogramma verwerkt kunnen worden.
In hoofdstuk 7 werden drie methodes besmdeerd voor het reconstrueren van het VCG uit het
ECG: een methode die drie qnasi-orthogonale ECG-afleidingen gebruikt, een methode gebaseerd
op een model van de elektrische hartactiviteit, en een statistische methode die gebruik maakt
van meervoudige regressie. De evaluatie van de methodes vond plaats door de diagnostische
classificaties van de originele en gereconstroeerde VCG's te vergelijken. Voor een testbestand
van negentig gevallen werden de originele en gereconstrueerde VCG's afzonderlijk en in
willekeurige volgorde gepresenteerd aan drie beoordelaars. Kappa-waardes werden gebruikt om
de overeenstemming in diagnostische classificaties te kwant:ificeren. Daamaast werden aan een
beoordelaartegelijkerlijd een urigineel VCG met de bijbehorende drie reconstructies voorgelegd.
Elk gereconstrueerd VCG werd geclassificeerd als diagnostisch 'hetzelfde' als het origineel,
'g:rensgevar of 'verschillend'.
Uit de diagnostische evaluatie bleken geen significante verschillen tussen de
regressiemethodi: en de modelgebaseerde methode; beide verdienden de voorkeur boven de
·quasi-orthogonale methode. Kappa-waardes gaven aan dat er een goede tot uitstekende
diagnostische overeenstemming tussen de originele en gereconstrueerde VCG's bestond. Slechts een van de negentig VCG's die met de regressiemethode werden gereconstrueerd. werd als
'verschillend' geclassificeerd vergeleken met de originele VCG's; drie VCG's werden als
'verschillend' geclassificeerd met de modelgebaseerde methode.
In hoofdstuk 8 werden twee 'gecombineerde' programma's bestudeerd. Een programma werd
gemaakt door de ECG- en VCG-interpretaties van MEANS te combineren, de ander door de
ECG- en rVCG-interpretaties te combineren. Het diagnostische CSE-bestand werd gebruikt om
de programma's te evalueren. Er werd aangetoond dat een 'gecombineerd' programma bestaande
uit de gecombineerde classificaties van de ECG- en VCG-interpretatieprogramma's, betere
resultaten geeft dan elk programma afzonderlijk. De combinatie van ECG- en rVCG
interpretaties gaf vergelijkbare prestaties als de combinatie van ECG- en VCG-interpretaties. Dit
164

resultaat betekent clat de prestaties van een ECG-computerprogramma verbeterd kunnen worden
met behulp van VCG-criteria zonder clat het VCG hoeft te worden opgenomen.
Verschil/ende classificaties. In hoofdstuk 9 werd de invloed van slag-op-slag variabiliteit op de
diagnostische classificaties van MEANS onderzocht. Twee bronnen van variabiliteit werden
onderscheiden: 'exttinsieke, bronnen, bv. netstoring, basislijnverstoringen of elektrom.yografische
ruis, en 'intrinsieke' bronnen, bv. veranderingen in de volum.egeleider of in het hart zelf.
Conventionele benaderingen voor ECG~verwerking baseren hun diagnostische classificatie op
een verzameling van metingen die worden bepaald in een representatief 'gemid.deld' complex
of door de mediaan te nemen van de metingen voor elk complex in de ECG-opname. Een
alternatieve procedure werd voorgesteld en geevalueerd waarin elk singulier complex in de
opname afzonderlijk geclassificeerd wordt en de verschillende classificaties vervolgens tot een
classificatie gecombineerd worden.
Het bleek dat een aanzienlijke slag-op-slag variabiliteit optrad in de metingen van singuliere
complexen van dezelfde opname. De grootste variabiliteit trad op, als instabiliteit in de detectie
van golven een verandering in de golfbenaming veroorzaalcte. Afleidingen ill, a VR a VF en Vl
bleken claarvoor het meest gevoelig.
De overeenstemming tussen de diagnosti.sche interpretaties van singuliere complexen en
bijbehorende gemiddelde complexen was 93,3%. Er werd plausibel gemaakt clat zowel
extrinsieke ruis als intrinsieke variabiliteit van invloed is op diagnostische interpretatie.
Het diagnostisch CSE-bestand werd gebruikt om de prestatie te bepalen van de
'gecombineerde, ECG-interpretaties van singuliere complexen. Het percentage correcte
dassificaties was 71,2%, een Iichte toename in vergelijking met de 69,8% die werd verkregen
met de interpretaties van de gemiddelde complexen. De interpretatie van singuliere complexen
kan oak informatie over de programmastabiliteit verschaffen en kan gebruikt worden om fouten
in de classificatie-logica te ontdekken.
In hoofdstuk 10 worden onze bevindingen gerelateerd aan de moeilijkheden die een rol
spelen bij de verbetering van geautomatiseerde ECG-interpretatie. De prestatie van het 11EANS
ECG-interpretatieprogramma blijkt nog niet op het niveau van de beste cardiologen die aan de
CSE-studie deelnamen. Combinatie van ECG- en VCG-classificatiecriteria en
'gevoeligheidsanalyse' van het interpretatieprogramma lijken veelbelovende onderzoeksgebieden
voor verdere verbetering van geautomatiseerde ECG-interpretatie.
165


CURRICULUM VITAE
167

Jan Alexander Kors was born on October 23rd, 1958 in Delft, The Netherlands. He received
his undergraduate education at the H=ann Wesselink College (Gymnasium 13) in Amstelveen.
In 1976, he graduated and started a study in electrotechnical engineering at the Technical
University in Delft. He obtained his degtee ('ingenieursexamen') in 1983.
During his civil service of one and a half year, he worked at the Department of Medical
Inforruatics at the Free University in Amsterdam. After this period, he started his Ph.D. research
at the same department.
In 1987, he moved to the Department of Medical Informatics at the Erasmus University in
Rotterdam where he continued his Ph.D. research.
Jan Kors is presently a scientific staff member at the Department of Medical Informatics at
the Erasmus University.
168

NAWOORD
169

Where is the Life we have lost in living?
Where is the wisdom we have lost in knowledge?
Where is the knowledge we have lost in information?
T.S. Eliot
Velen hebben, direct of indirect, aan de totstandkoming van dit proefschrift bijgedragen. Ret
plezier waarmee ik. eraan gewerkt heb, werd, naast de aard van het onderzoek, m belangr:i.jke
mate door deze contacten bepaald. Maar hoe aangenaam of belangrijk het maken van een
proefschrift ook mag zijn, hetleven bestaat nit (vee!) meer dan werk. Ret heeft mij steeds de
kunst geleken dit goed in het oog te houden, en ook daaraan droegen velen, direct of indirect,
bij. Van aldie mensen wil ik er een aantal in het bijzonder noemen:
Jan van Bemmel, die mij geregeld op nieuwe sporen zette, die mij met zijn enthousiasme en
opt:imisme stimuleerde verder te gaan, en met wie bet ook buiten het werk aangenaam verpozen
was;
Gerard van H erpen, met wie ik de afgelopen jaren, zeer tot genoegen, intensief samenwerkte,
en die met zijn veelzijdige eruditie altijd gtaag het gesprek aanging over onderwerpen die de
elektrocardiografie verre te buiten gingen;
Kine Sittig, die tijdens een dee! van het onderzoek mijn directe begeleidster was, en die mij
leerde steeds kritisch te vragen bij datgene waar ik mee bezig was;
Jan Talmon., die mij inwijdde in de geautomatiseerde analyse van ECG's, en wiens grate enthousiasme voor verschillende onderwerpen die niets met dit vak te maken hebben,
aanstekelijk werkte;
mijn ouders, die in belangrijke mate de wijze waarop ik in hetleven sta bepaalden, en waar ik
altijd een 'thuis' vond;
Irmgard Ballast, die de juiste woorden vond als ze nodig waren, die zweeg als er niets hoefde
te worden gezegd, en die mij steeds weer bepaalt bij bet Leven dat geleefd moet worden.
170