experiments on whistler wave filamentation … · experiments on whistler wave filamentation and...
TRANSCRIPT

JOURNAL DE PHYSIQUE Colloque C6, suppldment au no 12, Tome 38, Dkcembre 1977, page C6-89
EXPERIMENTS ON WHISTLER WAVE FILAMENTATION AND VLF HISS IN A LABORATORY PLASMA (*)
R. L. STENZEL (**)
TRW Systems, Redondo Beach, CA 90278, U. S. A.
R6sum6. - Avec le developpement de grande source B plasma magnetise, il est devenu possible d'etudier des problkmes de physique des plasmas spatiaux en laboratoire. D'abord ont Cte explores les effets non lineaires associks B l'excitation de modes siffleurs de grande amplitude. On trouve que la pression de rayonnement de l'onde et les effets thermiques produisent une depression de densite alignee avec le champ, dans laquelle I'onde devient completement piegee. Des filaments hyperfins sont observes, dont les diametres sont petits par rapport B la longueur d'onde parallele. Ensuite, a ete Ctudik la stabilite des modes siffleurs obliques en presence d'un faisceau d'electrons. Une instabilitk de siffleur, de large bande, est observee et identifiee comme une interaction Cerenkov entre les electrons du faisceau et les siffleurs se propageant auprbs du c6ne de resonance. Ces observations confirment le present modble pour la production des signaux de trks basse frequence apparaissant B l'aube.
Abstract. - With the development of a large magnetized plasma source it has become possible to investigate space plasma physics problems in the laboratory. First, the nonlinear effects asso- ciated with the excitation of a large amplitude whistler wave have been explored. It is found that the radiation pressure of the wave and thermal effects give rise to a field-aligned density depression in which the wave becomes completely trapped. Hyperfine filaments with diameters small compared with the parallel wavelength are observed. Second, the stability of oblique whistler waves in the presence of an electron beam has been studied. A broadband whistler instability is observed and identified as a Cherenkov interaction between beam electrons and whistlers propagating near the resonance cone. These observations confirm the present model for the generation of VLF hiss in the aurora.
1. Introduction. - In order to investigate space plasma physics problems such as whistler waves in the laboratory a fundamental requirement is a plasma source of dimensions large compared with the charac- teristic damping or growth length of the wave. In the present work a quiescent uniform plasma column of approximately 112 m diameter and 3 m length has been constructed, corresponding to approximately 10 electromagnetic whistler wavelengths across and 60 wavelengths along the magnetic field, respectively. The plasma can be penetrated by an electron beam of the same diameter.-These source dimensions are adequate for wave propagation experiments free from boundary effects.
The exictation and propagation of a large amplitude whistler wave is a problem of fundamental and practi- cal interest. Although the stability of electromagnetic whistlers has been analyzed in theory and computer
(*) This work was supported in part by the Nations1 Aero- nautics and Space Administration under Contract Nos. NASA- 31175, NASW-2953, and in part by TRW Independent Research and Development Funds.
(**) Department of Physics, University of California, Los Angeles, California 90024, U. S. A.
simulations [I-31, i t is difficult to predict the nonlinear effects for a spectrum of oblique whistlers excited by a finite-size antenna. Is the present experiment the phase and amplitude distribution of antenna-launched whistlers is investigated at both small and large wave amplitudes. At small amplitudes the ducting of whistlers [4] in field-aligned density non-uniformities is demonstrated. At large amplitudes the wave modi- fies by its radiation pressure the initially uniform plasma so as to create a field-aligned density trough. The wave refracts into this path which further enhances the nonlinear process. A filamentation instability [5-81 results whereby the initially diverging radiation pattern collapses into a narrow channel of high wave intensity. Pencil-shaped antenna radiation pat- terns are observed. The wave-generated duct is also used to guide small amplitude whistlers over a wide frequency range and ordinary electromagnetic waves near the average plasma frequency of the duct
Since whistlers propagate, in general, oblique to the magnetic field the stability of these modes is an important topic. While transverse electromagnetic
Article published online by EDP Sciences and available at http://dx.doi.org/10.1051/jphyscol:1977609
C6-90 R. L. STENZEL
whistlers are unstable to perpendicular temperature anisotropies oblique whistlers can be subject to electro- static instabilities due to an electron beam [9, 101. A Cherenkov-type instability 1111 arises when the beam velocity matches the parallel phase velocity component of an oblique whistler. For sIow electron beams (v, 4 coc/o,) the whistler wave propagates near the oblique resonance (cos 6 -- o/wc). Since the waveparticle resonance condition can be satisfied at different angles for any frequency between the lower hybrid and the electron cyclotron resonance the instability has a broadband character.
Experimentally, the instability is produced by injecting an energetic electron beam into a quiescent afterglow plasma [12]. The emission of broadband rf noise upon beam injection is observed. By analyzing the frequency and wave vector spectrum, i. e. the dis- persion o(k), the noise is identified as whistlers propagating near the oblique resonance with parallel phase velocity matched by the beam velocity, as predicted by theory. Coherent test waves are launched from a small antenna in the unstable plasma. In the direction opposing the beam the point source excites a familiar resonance cone [13, 141 but with the beam a single oblique whistler mode is excited, i. e. the most unstable mode, which grows oblique to the beam at an angle 9, 5 arc sin (ole,), propagates at nearly the complementary angle and is in resonance with the beam (elk,, 5 v,).
First, in section 2, the experimental arrangement is described. Then, in section 3, the observations on linear and nonlinear whistler wave propagation in a quiescent plasma are presented and discussed. In section 4 the results for the instability of oblique whistler waves are presented and the connections with auroral hiss [15] are shown. Finally, section 5 presents a conclusion on these space related laboratory experiments [16].
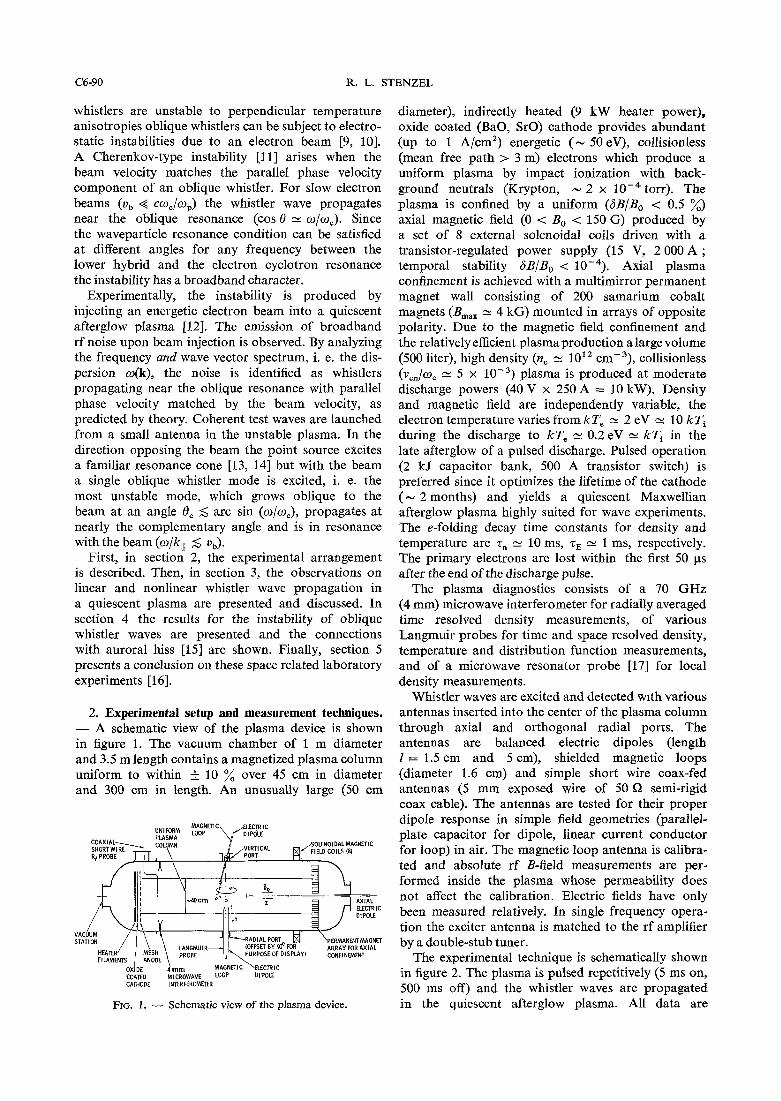
2. Experimental setup and measurement techniques. - A schematic view of the plasma device is shown in figure 1. The vacuum chamber of 1 m diameter and 3.5 m length contains a magnetized plasma column uniform to within + 10 % over 45 cm in diameter and 300 cm in length. An unusually large (50 cm
VAC STA PERMANEKl MAGNET
,),, 4 ,, MAGNETIC 'NCTRIC COATED MICROWAVE LOOP DIPOLE CATHODE INTERFEROMETER
FIG. 1. - Schematic view of the plasma device.
diameter), indirectly heated (9 kW heater power), oxide coated (BaO, SrO) cathode provides abundant (up to I A/cm2) energetic (- 50 eV), collisionless (mean free path > 3 m) electrons which produce a uniform plasma by impact ionization with back- ground neutrals (Krypton, - 2 x torr). The plasma is confined by a uniform (6B/Bo < 0.5 %) axial magnetic field (0 < B, < 150 G) produced by a set of 8 external solenoidal coils driven with a transistor-regulated power supply (15 V, 2 000 A ; temporal stability 6B/Bo < Axial plasma confinement is achieved with a multimirror permanent magnet wall consisting of 200 samarium cobalt magnets (B,,,,, 1. 4 kG) mounted in arrays of opposite polarity. Due to the magnetic field confinement and the relatively efficient plasma production a large volume (500 liter), high density (n, -- 1012 ~ m - ~ ) , collisionless (ve,/oc - 5 x plasma is produced at moderate discharge powers (40 V x 250 A = 10 kW). Density and magnetic field are independently variable, the electron temperature varies from kTe -- 2 eV 1. 10 kTi during the discharge to kTe -- 0.2 eV - kTi in the late afterglow of a pulsed discharge. Pulsed operation (2 kJ capacitor bank, 500 A transistor switch) is preferred since it optimizes the lifetime of the cathode (- 2 months) and yields a quiescent Maxwellian afterglow plasma highly suited for wave experiments. The e-folding decay time constants for density and temperature are z, - 10 ms, z, -- 1 ms, respectively. The primary electrons are lost within the first 50 ps after the end of the discharge pulse.
The plasma diagnostics consists of a 70 GHz (4 mm) microwave interferometer for radially averaged time resolved density measurements, of various Langmuir probes for time and space resolved density, temperature and distribution function measurements, and of a microwave resonator probe [17] for local density measurements.
Whistler waves are excited and detected wlth various antennas inserted into the center of the plasma column through axial and orthogonal radial ports. The antennas are balanced electric dipoles (length 1 = 1.5 cm and 5 cm), shielded magnetic loops (diameter 1.6 cm) and simple short wire coax-fed antennas (5 mm exposed wire of 50 Q semi-rigid coax cable). The antennas are tested for their proper dipole response in simple field geometries (parallel- plate capacitor for dipole, linear current conductor for loop) in air. The magnetic loop antenna is calibra- ted and absolute rf B-field measurements are per- formed inside the plasma whose permeability does not affect the calibration. Electric fields have only been measured relatively. In single frequency opera- tion the exciter antenna is matched to the rf amplifier by a double-stub tuner.
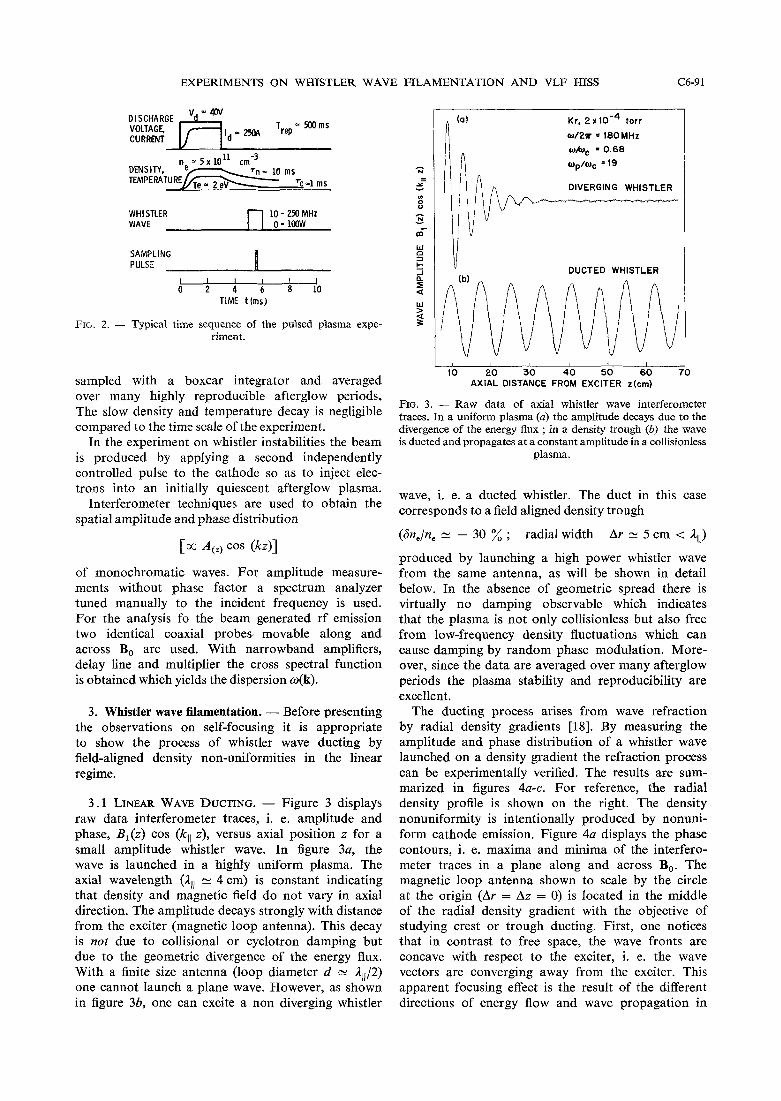
The experimental technique is schematically shown in figure 2. The plasma is pulsed repetitively (5 ms on, 500 ms off) and the whistler waves are propagated in the quiescent afterglow plasma. All data are
EXPERIMENTS ON WHISTLER WAVE FILAMENTATION AND VLF HISS C6-91
DISCHARGE VOLTAGL CURRENT
WHISTLER 10 - 2% MHz WAVE 0 - 100W
~ r , 2 x torr
o/2?r = 1 8 0 M H z ohc = 0.68
wp/w, = 19
DIVERGING WHISTLER
I
FIG. 2. - Typical time sequence of the pulsed plasma expe- riment.
sampled with a boxcar integrator and averaged over many highly reproducible afterglow periods. The slow density and temperature decay is negligible compared to the time scale of the experiment.
In the experiment on whistler instabilities the beam is produced by applying a second independently controlled pulse to the cathode so as to inject elec- trons into an initially quiescent afterglow plasma.
Interferometer techniques are used to obtain the spatial amplitude and phase distribution
of monochromatic waves. For amplitude measure- ments without phase factor a spectrum analyzer tuned manually to the incident frequency is used. For the analysis fo the beam generated rf emission two identical coaxial probes movable along and across B, are used. With narrowband amplifiers, delay line and multiplier the Gross spectral function is obtained which yields the dispersion o(k).
3. Whistler wave filamentation. - Before presenting the observations on self-focusing it is appropriate to show the process of whistler wave ducting by field-aligned density non-uniformities in the linear regime.
3.1 LINEAR WAVE DUCTING. - Figure 3 displays raw data interferometer traces, i. e. amplitude and phase, B,(z) cos (kll z), versus axial position z for a small amplitude whistler wave. In figure 3a, the wave is launched in a highly uniform plasma. The axial wavelength (Al1 = 4 cm) is constant indicating that density and magnetic field do not vary in axial direction. The amplitude decays strongly with distance from the exciter (magnetic loop antenna). This decay is not due to collisional or cyclotron damping but due to the geometric divergence of the energy flux. With a finite size antenna (loop diameter d - 4/2) one cannot launch a plane wave. However, as shown in figure 3b, one can excite a non diverging whistler
I I I I I 10 2 0 3 0 4 0 5 0 60 70
AXIAL DISTANCE FROM EXCITER z(cm)
FIG. 3. - Raw data of axial whistler wave interferometer traces. In a uniform plasma (a) the amplitude decays due to the divergence of the energy flux ; in a density trough (6) the wave is ducted and propagates at a constant amplitude in a collisionless
plasma.
wave, i. e. a ducted whistler. The duct in this case corresponds to a field aligned density trough
(6n,/n, - - 30 % ; radial width Ar - 5 cm < A,,)
produced by launching a high power whistler wave from the same antenna, as will be shown in detail below. In the absence of geometric spread there is virtually no damping observable which indicates that the plasma is not only collisionless but also free from low-frequency density fluctuations which can cause damping by random phase modulation. More- over, since the data are averaged over many afterglow periods the plasma stability and reproducibility are excellent.
The ducting process arises from wave refraction by radial density gradients [18]. By measuring the amplitude and phase distribution of a whistler wave launched on a density gradient the refraction process can be experimentally verified. The results are sum- marized in figures 4a-c. For reference, the radial density profile is shown on the right. The density nonuniformity is intentionally produced by nonuni- form cathode emission. Figure 4a displays the phase contours, i. e. maxima and minima of the interfero- meter traces in a plane along and across B,. The magnetic loop antenna shown to scale by the circle at the origin (Ar = Az = 0 ) is located in the middle of the radial density gradient with the objective of studying crest or trough ducting. First, one notices that in contrast to free space, the wave fronts are concave with respect to the exciter, i. e. the wave vectors are converging away from the exciter. This apparent focusing effect is the result of the different directions of energy flow and wave propagation in
C6-92 R. L, STENZEL
AXIAL POSITION az(sm1 DENSITY n,(emdl
. AXIAL W S l T l W dzlcm) DENSITY o, (om")
0 2 4 6 8x10¹¹
DENSITY n,lcrndl
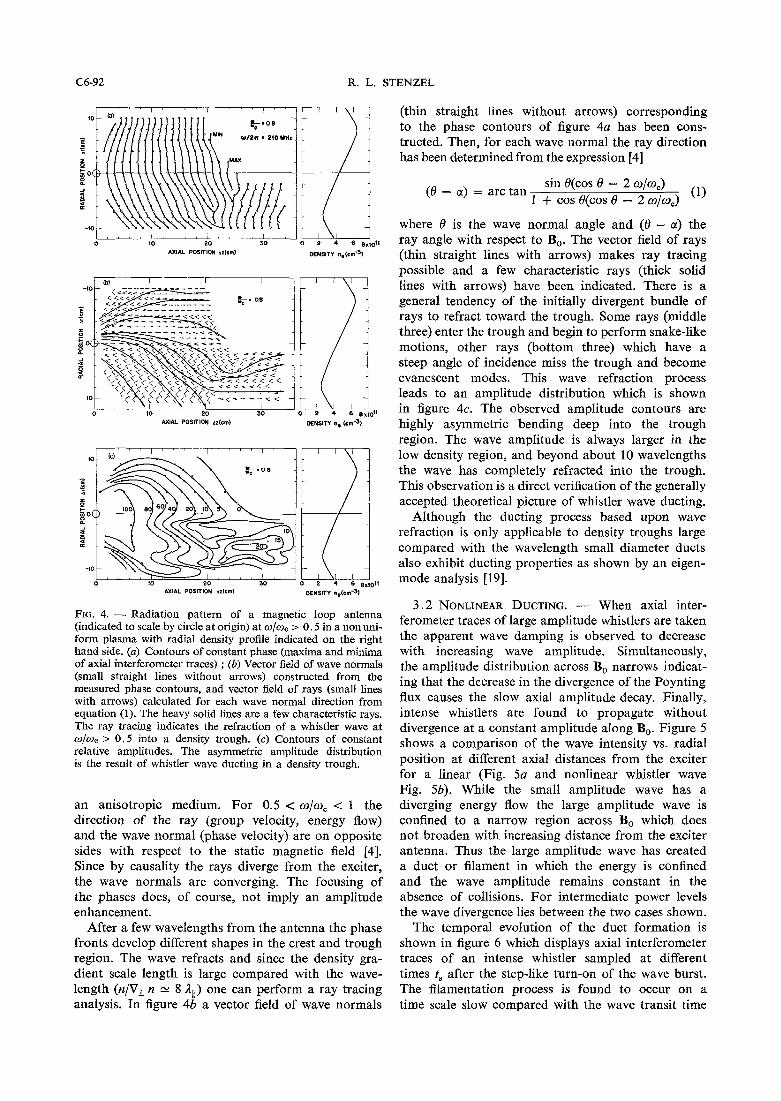
FIG. 4. - Radiation pattern of a magnetic loop antenna (indicated to scale by circle at origin) at w/oc > 0.5 in a non uni- form plasma with radial density profile indicated on the right hand side. (a) Contours of constant phase (maxima and minima of axial interferometer traces) ; (b) Vector field of wave normals (small straight lines without arrows) constructed from the measured phase contours, and vector field of rays (small lines with arrows) calculated for each wave normal direction from equation (1). The heavy solid lines are a few characteristic rays. The ray tracing indicates the refraction of a whistler wave at CO/CO~ > 0.5 into a density trough. (c) Contours of constant relative amplitudes. The asymmetric amplitude distribution is the result of whistler wave ducting in a density trough.
an anisotropic medium. For 0.5 < o/o, < 1 the direction of the ray (group velocity, energy flow) and the wave normal (phase velocity) are on opposite sides with respect to the static magnetic field [4]. Since by causality the rays diverge from the exciter, the wave normals are converging. The focusing of the phases does, of course, not imply an amplitude enhancement.
After a few wavelengths from the antenna the phase fronts develop different shapes in the crest and trough region. The wave refracts and since the density gra- dient scale length is large compared with the wave- length (n/V, n - 8 A,,) one can perform a ray tracing analysis. In figure 4b a vector field of wave normals
(thin straight lines without arrows) corresponding to the phase contours of figure 4a has been cons- tructed. Then, for each wave normal the ray direction has been determined from the expression [4]
sin 8(cos 8 - 2 0/03 (8 - a) = arc tan
1 + cos ~ (COS 8 - 2 w/o,) (1)
where 8 is the wave normal angle and (8 - a) the ray angle with respect to B,. The vector field of rays (thin straight lines with arrows) makes ray tracing possible and a few characteristic rays (thick solid lines with arrows) have been indicated. There is a general tendency of the initially divergent bundle of rays to refract toward the trough. Some rays (middle three) enter the trough and begin to perform snake-like motions, other rays (bottom three) which have a steep angle of incidence miss the trough and become evanescent modes. This wave refraction process leads to an amplitude distribution which is shown in figure 4c. The observed amplitude contours are highly asymmetric bending deep into the trough region. The wave amplitude is always larger in the low density region, and beyond about 10 wavelengths the wave has completely refracted into the trough. This observation is a direct verification of the generally accepted theoretical picture of whistler wave ducting.
Although the ducting process based upon wave refraction is only applicable to density troughs large compared with the wavelength small diameter ducts also exhibit ducting properties as shown by an eigen- mode analysis [19].
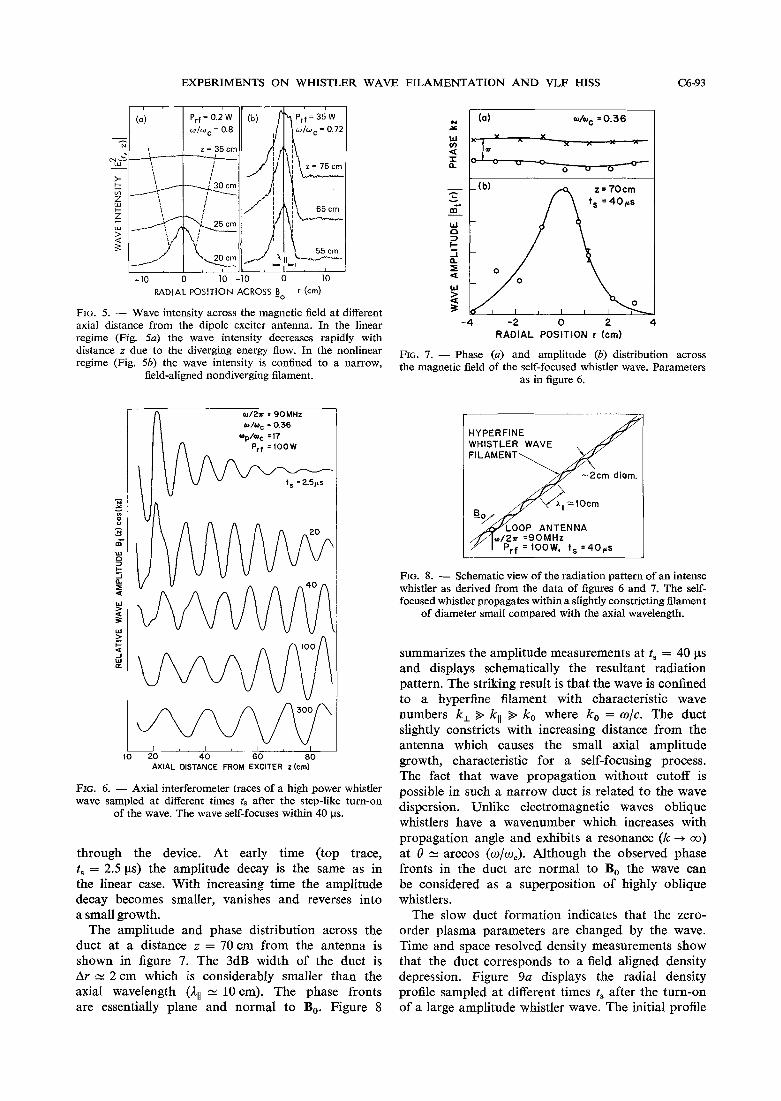
3.2 NONLINEAR DUCTING. - When axial inter- ferometer traces of large amplitude whistlers are taken the apparent wave damping is observed to decrease with increasing wave amplitude. Simultaneously, the amplitude distribution across B, narrows indicat- ing that the decrease in the divergznce of the Poynting flux causes the slow axial amplitude decay. Finally, intense whistlers are found to propagate without divergence at a constant amplitude along B,. Figure 5 shows a comparison of the wave intensity vs. radial position at different axial distances from the exciter for a linear (Fig. 5a and nonlinear whistler wave Fig. 5b). While the small amplitude wave has a diverging energy flow the large amplitude wave is confined to a narrow region across B, which does not broaden with increasing distance from the exciter antenna. Thus the large amplitude wave has created a duct or filament in which the energy is confined and the wave amplitude remains constant in the absence of collisions. For intermediate power levels the wave divergence lies between the two cases shown.
The temporal evolution of the duct formation is shown in figure 6 which displays axial interferometer traces of an intense whistler sampled at different times t , after the step-like turn-on of the wave burst. The filamentation process is found to occur on a time scale slow compared with the wave transit time
EXPERIMENTS ON WHISTLER WAVE FILAMENTATION AND VLF HISS C6-93
FIG. 5. - Wave intensity across the magnetic field at different axial distance from the dipole exciter antenna. In the linear regime (Fig. 5a) the wave intensity decreases rapidly with distance z due to the diverging energy flow. In the nonlinear regime (Fig. 5b) the wave intensity is confined to a narrow,
field-aligned nondiverging filament.
FIG. wave
@ / 2 x = 90MHz ~ 1 % = 0.36
op/oc "17 P,, = 1oow
AXIAL DISTANCE FROM EXCITER z (cm)
6. - Axial interferometer traces of a high power sampled at different times ts after the step-like
of the wave. The wave self-focuses within 40 ys.
whistler turn-on
through the device. At early time (top trace, t , = 2.5 ps) the amplitude decay is the same as in the linear case. With increasing time the amplitude decay becomes smaller, vanishes and reverses into a small growth.
The amplitude and phase distribution across the duct at a distance z = 70 cm from the antenna is shown in figure 7. The 3dB width of the duct is Ar 2: 2 cm which is considerably smaller than the axial wavelength (A,, 2: 10 cm). The phase fronts are essentially plane and normal to B,. Figure 8
- 4 -2 0 2 4 RADIAL POSITION r (cm)
FIG. 7. - Phase (a) and amplitude (b) distribution across the magnetic field of the self-focused whistler wave. Parameters
as in figure 6.
HYPERFINE WHISTLER WAVE
P ANTENNA
FIG. 8. - Schematic view of the radiation pattern of an intense whistler as derived from the data of figures 6 and 7. The self- focused whistler propagates within a slightly constricting filament
of diameter small compared with the axial wavelength.
summarizes the amplitude measurements at t , = 40 ps and displays schematically the resultant radiation pattern. The striking result is that the wave is confined to a hyperfine filament with characteristic wave numbers k, 9 k,, 9 k, where k, = olc . The duct slightly constricts with increasing distance from the antenna which causes the small axial amplitude growth, characteristic for a self-focusing process. The fact that wave propagation without cutoff is possible in such a narrow duct is related to the wave dispersion. Unlike electromagnetic waves oblique whistlers have a wavenumber which increases with propagation angle and exhibits a resonance (k -+ co) at 8 - arccos (o/oc). Although the observed phase fronts in the duct are normal to B, the wave can be considered as a superposition of highly oblique whistlers.
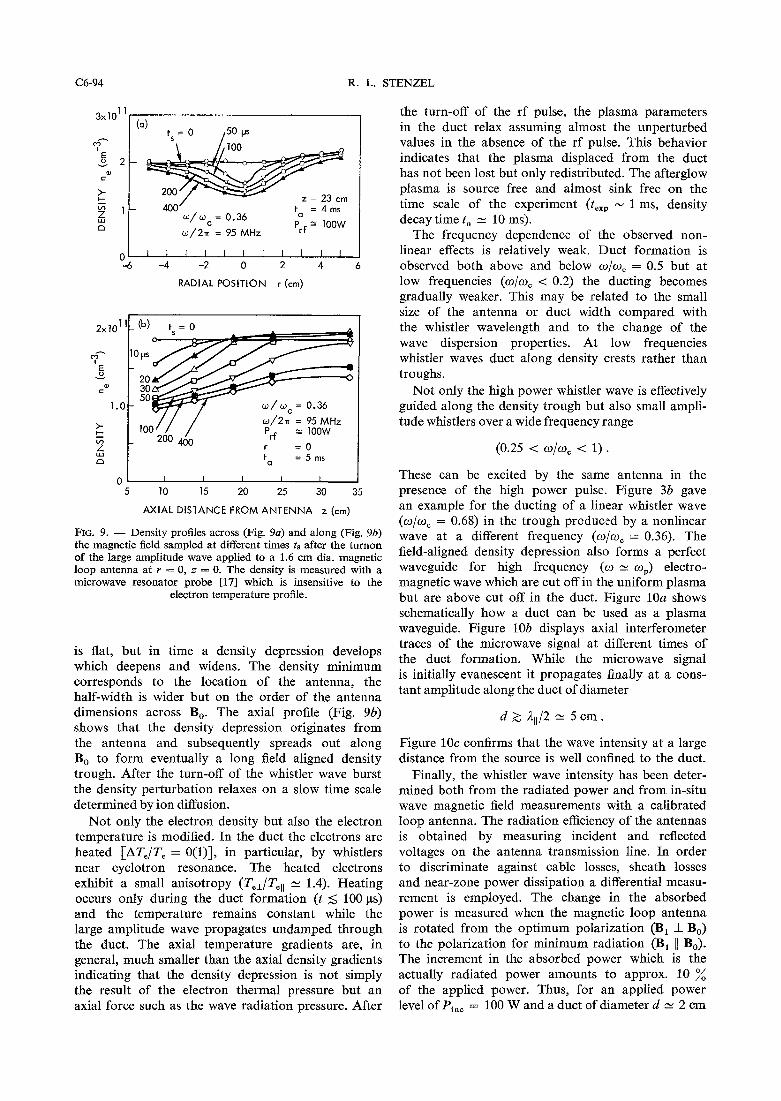
The slow duct formation indicates that the zero- order plasma parameters are changed by the wave. Time and space resolved density measurements show that the duct corresponds to a field aligned density depression. Figure 9a displays the radial density profile sampled at different times t , after the turn-on of a large amplitude whistler wave. The initial profile
C6-94 R. L. STENZEL
RADIAL POSITION r (crn)
AXIAL DISTANCE FROM ANTENNA z (cm)
FIG. 9. - Density profiles across (Fig. 9a) and along (Fig. 9b) the magnetic field sampled at different times ts after the turnon of the large amplitude wave applied to a 1.6 cm dia. magnetic loop antenna at r = 0, z = 0. The density is measured with a microwave resonator probe [17] which is insensitive to the
electron temperature profile.
is flat, but in time a density depression develops which deepens and widens. The density minimum corresponds to the location of the antenna, the half-width is wider but on the order of the antenna dimensions across B,. The axial profile (Fig. 9b) shows that the density depression originates from the antenna and subsequently spreads out along B, to form eventually a long field aligned density trough. After the turn-off of the whistler wave burst the density perturbation relaxes on a slow time scale determined by ion diffusion.
Not only the electron density but also the electron temperature is modified. In the duct the electrons are heated [AT,/T, = 0(1)], in particular, by whistlers near cyclotron resonance. The heated electrons exhibit a small anisotropy (Te,/TeII = 1.4). Heating occurs only during the duct formation (t 5 100 ps) and the temperature remains constant while the large amplitude wave propagates undamped through the duct. The axial temperature gradients are, in general, much smaller than the axial density gradients indicating that the density depression is not simply the result of the electron thermal pressure but an axial force such as the wave radiation pressure. After
the turn-off of the rf pulse, the plasma parameters in the duct relax assuming almost the unperturbed values in the absence of the rf pulse. This behavior indicates that the plasma displaced from the duct has not been lost but only redistributed. The afterglow plasma is source free and almost sink free on the time scale of the experiment (t,,, - 1 ms, density decay time tn = 10 ms).
The frequency dependence of the observed non- linear effects is relatively weak. Duct formation is observed both above and below w/w, = 0.5 but at low frequencies (co/o, < 0.2) the ducting becomes gradually weaker. This may be related to the small size of the antenna or duct width compared with the whistler wavelength and to the change of the wave dispersion properties. At low frequencies whistler waves duct along density crests rather than troughs.
Not only the high power whistler wave is effectively guided along the density trough but also small ampli- tude whistlers over a wide frequency range
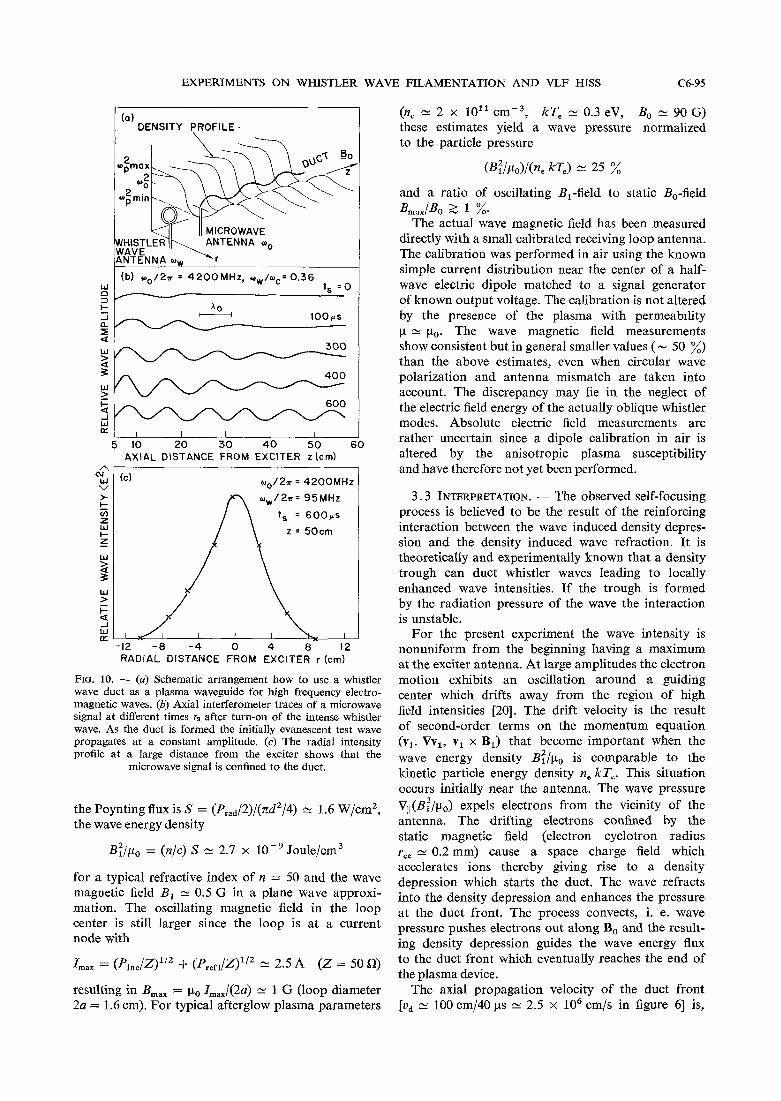
These can be excited by the same antenna in the presence of the high power pulse. Figure 3b gave an example for the ducting of a linear whistler wave (o/o, = 0.68) in the trough productd by a nonlinear wave at a different frequency (o/w, = 0.36). The field-aligned density depression also forms a perfect waveguide for high frequency ( o lc o,) electro- magnetic wave which are cut off in the uniform plasma but are above cut off in the duct. Figure 10a shows schematically how a duct can be used as a plasma waveguide. Figure lob displays axial interferometer traces of the microwave signal at different times of the duct formation. While the microwave signal is initially evanescent it propagates finally at a cons- tant amplitude along the duct of diameter
Figure 10c confirms that the wave intensity at a large distance from the source is well confined to the duct.
Finally, the whistler wave intensity has been deter- mined both from the radiated power and from in-situ wave magnetic field measurements with a calibrated loop antenna. The radiation efficiency of the antennas is obtained by measuring incident and reflected voltages on the antenna transmission line. In order to discriminate against cable losses, sheath losses and near-zone power dissipation a differential measu- rement is employed. The change in the absorbed power is measured when the magnetic loop antenna is rotated from the optimum polarization (B, I B,) to the polarization for minimum radiation (B, 11 B,). The increment in the absorbed power which is the actually radiated power amounts to approx. 10 % of the applied power. Thus, for an applied power level of Pin, = 100 W and a duct of diameter d - 2 cm
EXPERIMENTS ON WHISTLER WAVE FILAMENTATION AND VLF HISS C6-95
DENSITY PROFILE - I
AXIAL DISTANCE FROM EXClTER z (cm)
RADIAL DISTANCE FROM EXCITER r (cm)
FIG. 10. - (a) Schematic arrangement how to use a whistler wave duct as a plasma waveguide for high frequency electro- magnetic waves. (b) Axial interferometer traces of a microwave signal at different times ts after turn-on of the intense whistler wave. As the duct is formed the initially evanescent test wave propagates at a constant amplitude. (c) The radial intensity profile at a large distance from the exciter shows that the
microwave signal is confined to the duct.
the Poynting flux is S = (p,,,/2)/(nd2/4) - 1.6 W/cm2, the wave energy density
for a typical refractive index of n = 50 and the wave magnetic field B, - 0.5 G in a plane wave approxi- mation. The oscillating magnetic field in the loop center is still larger since the loop is at a current node with
I,,, = (Pi,,/~)1'2 + (P,,,,/z)~'~ N 2.5 A (2 = 50 a) resulting in B,,, = p0 Ima,/(2a) - 1 G (loop diameter 2a = 1.6 cm). For typical afterglow plasma parameters
(ne -- 2 x 10'' ~ m - ~ , kT, -- 0.3 eV, Bo -- 90 G) these estimates yield a wave pressure normalized to the particle pressure
and a ratio of oscillating B1-field to static Bo-field BrnaxIBo 2 1 %.
The actual wave magnetic field has been measured directly with a small calibrated receiving loop antenna. The calibration was performed in air using the known simple current distribution near the center of a half- wave electric dipole matched to a signal generator of known output voltage. The calibration is not altered by the presence of the plasma with permeability p N pO. The wave magnetic field measurements show consistent but in general smaller values (-- 50 %) than the above estimates, even when circular wave polarization and antenna mismatch are taken into account. The discrepancy may lie in the neglect of the electric field energy of the actually oblique whistler modes. Absolute electric field measurements are rather uncertain since a dipole calibration in air is altered by the anisotropic plasma susceptibility and have therefore not yet been performed.
3 . 3 INTERPRETATION. - The observed self-focusing process is believed to be the result of the reinforcing interaction between the wave induced density depres- sion and the density induced wave refraction. It is theoretically and experimentally known that a density trough can duct whistler waves leading to locally enhanced wave intensities. If the trough is formed by the radiation pressure of the wave the interaction is unstable.
For the present experiment the wave intensity is nonuniform from the beginning having a maximum at the exciter antenna. At large amplitudes the electron motion exhibits an oscillation around a guiding center which drifts away from the region of high field intensities [20]. The drift velocity is the result of second-order terms on the momentum equation (v,. Vv,, v, x B,) that become important when the wave energy density ~ : / p , is comparable to the kinetic particle energy density n, kT,. This situation occurs initially near the antenna. The wave pressure V , , ( B ~ / ~ ~ ) expels electrons from the vicinity of the antenna. The drifting electrons confined by the static magnetic field (electron cyclotron radius r,, r=. 0.2 mm) cause a space charge field which accelerates ions thereby giving rise to a density depression which starts the duct. The wave refracts into the density depression and enhances the pressure at the duct front. The process convects, i. e. wave pressure pushes electrons out along B, and the result- ing density depression guides the wave energy flux to the duct front which eventually reaches the end of the plasma device.
The axial propagation velocity of the duct front [v, N 100 cm/40 ps N 2.5 x lo6 cm/s in figure 61 is,
C6-96 R. L. STENZEL
because of the ion inertia, much smaller than the electron thermal velocity. However, the duct velocity is also much larger than sound speed,
Since the ion cyclotron radius (rci 1: 6 cm) is larger than the duct width ions can leave the duct across B,. Charge neutrality must be preserved by enhanced electron cross-field diffusion. The radial ion motion is consistent with the fast duct formation and the small particle losses observed after the recovery of the density profile.
The observed electron heating strongly correlates with the duct formation and may, therefore, not be simple collisional heating. The temperature rise also contributes to the formation of the density depression since at equilibrium p = n, kT, = const. In highly collisional plasmas where the mean free path is much smaller than the gradient scale length of the rf intensity thermal effects alone can lead to filamentation [21-231. However, this is not the case in the present weakly collisional plasma (mean free path - 20 cm) which, for example, becomes evident from the unrelated axial density and temperature profiles and the fast time scale of duct formation compared with equilibration. Collisional effects pro- bably cause the slow broadening of the duct in time.
The wave pressure nonlinearity arises from time averaging quadratic terms in the applied frequency, < cos2 0 t >. Second harmonic generation is a process of the same order of nonlinearity. The dis- tortions in the interferometer traces (Fig. 6) are direct evidence of this nonlinear process. For w/w, < 0.5 the second harmonic is a propagating mode which is also confined to the duct.
4. Cherenkov instability of oblique whistlers. - The present model for the generation of auroral hiss is that of a collective interaction between a stream of precipitating electrons and whistler waves in the ambient background plasma [lo]. A Cherenkov-type electrostatic instability arises when the electron beam velocity matches the parallel phase velocity of an oblique whistler whose velocity is small for propaga- tion angles near the resonance cone (cos 0 1: o/o,). Many observations from ground, rockets and satel- lites are consistent with the above model [4, 15, 241. The measurements usually consist of noise frequency spectra and electron pitch angle distribution functions. There are fundamental limitations of measuring wave normals or rays from a single observation point. These essential aspects of the instability are usually inferred so that a conclusive proof of the mechanism cannot be given. It will be shown that a carefully designed laboratory experiment can supply this and other complementary information and thereby con- tribute to the understanding of the VLF hiss pheno- menon.
In the present experiment an energetic electron beam is injected into a cold dense, nearly collisionless magnetoplasma. Beam and plasma dimensions are so large that oblique whistler wave propagation and growth are readily observable. In this aspect the pre- sent experiment fundamentally differs from most previous laboratory experiments with small diameter beam-plasma systems which are restricted to one- dimensional wave propagation [25-271. The present situation models in many aspects the conditions inside an auroral arc. It does not apply to the wave propagation and refraction effects outside the arc since beam and plasma diameters are identical.
First, the dynamics of the beam and background plasma are investigated. It is concluded that the simul- taneously occuring short-wavelength electrostatic ins- tability near the electron plasma frequency (o, > o,) is mainly responsible for the scattering of the beam and the saturation of the oblique whistler instability.
Then the observations on the beam-generated broadband of noise are presented. By analyzing the frequency and wavevector spectrum, i. e. the dispersion ~ ( k ) , the noise below w = w, is identified as whistler waves propagating near the oblique resonance cone with parallel phase velocity slightly less than beam velocity. This is a direct confirmation of the essential prediction from the instability theory.
Finally, wave propagation experiments are perfor- med by launching coherent test waves from a small antenna in the unstable region. These measu- rements yield the growth rate. The connection and relevance of the laboratory results on observations in space are discussed in the last section.
4.1 BEAM AND PLASMA PROPERTIES. - The beam- plasma system is produced repetitively by a double pulse technique. The first voltage pulse applied to the cathode generates a background afterglow plasma which is cold (kT, - kTi :, 114 eV), dense
weakly collisional (electron-neutral collisions
Coulomb collisions vei/oc 1: and free of low or high frequency instabilities. At a desired afterglow time a second voltage pulse is applied to the cathode whereby a beam of fast electrons is injected along B, into the afterglow plasma. Beam and background plasma parameters are determined from plane Lang- muir probes which can be positioned radially and axially. Independently, the density is determined from dispersion measurements of whistler waves, Langmuir waves and Bernstein waves, and from resonance cone measurements. The basic parameters are summarized in table I.
As soon as the beam is injected it strongly interacts with the background plasma and both beam and plasma properties change from their initial properties
EXPERIMENTS ON WHISTLER WAVE FILAMENTATION AND VLF HISS C6-97
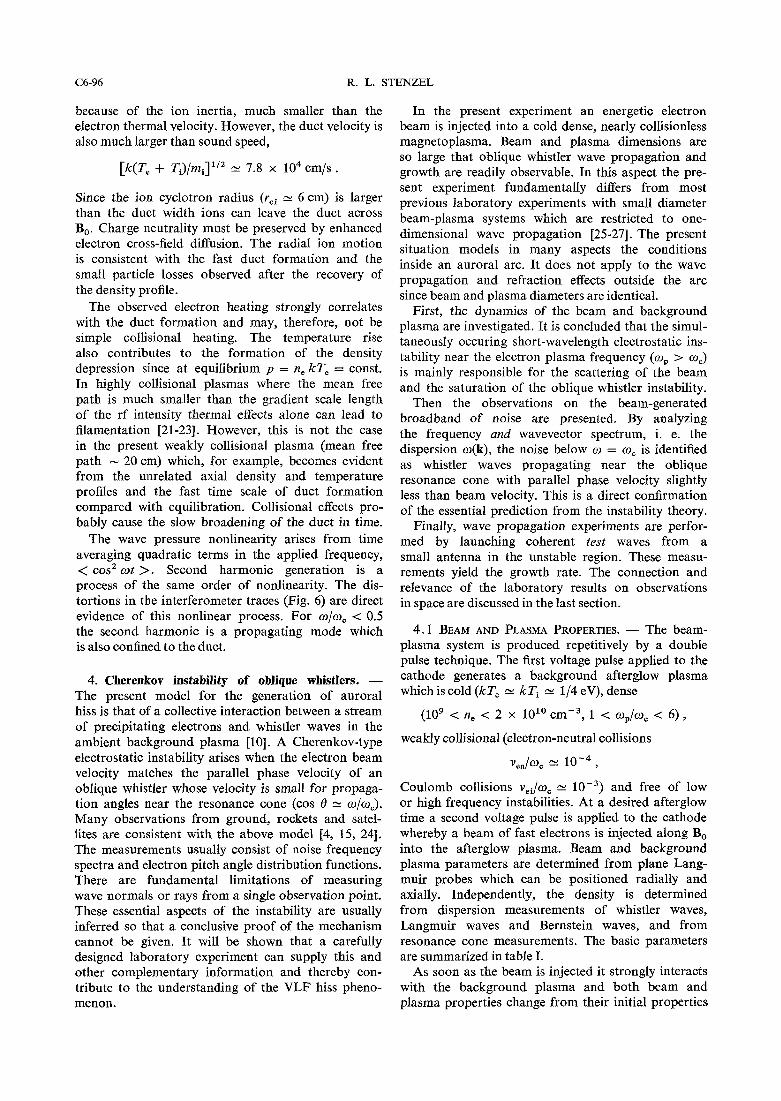
Basic parameters of beam and background plasma.
Gas, pressure Krypton, 2.5 x torr Background plasma den-
sity n, = lo9 to 2 x 10'' cmF3 Electron temperature kTe - 2 eV Magnetic Field Bo = 75 G Ratio of plasma to cyclo-
tron frequency 1 < o, /w, < 6 Electron-neutral collision
frequency
(i) Absolute 4 x lo5 S- l
(ii) Normalized v ~ , / o , = 3 x lo-4
Electron mean free path I , - 200 cm Electron beam energy eVb = 0 to 50eV Normalized beam density nb/ne 1 % Beam temperature kTb - 0.5 to > 8 eV Beam electron mean free
path for (i) elastic collisions 1, N 90 cm (ii) ionizing colIisions I; - 300 cm
-.
0 W
W
60 - - -60 -40 -20 0
RETARDING POTENTIAL Vp (VOLT)
FIG. 11. - Electron distribution function fe(V), where V = (m/2e)vz, sampled at different times t , after the turn-on of the beam pulse. The figure demonstrates the broadening of the beam and heating of the background plasma in time at a fixed
distance z from the anode. ne N 6 x 1 0 9 cm-3.
to new steady-state values. Figure 11 shows the elec- tron distribution function sampled at different times t , after the step-like turn-on of the beam voltage Vb at an afterglow time t , = 15 ms. The distribution function is obtained by differentiating the I-V cha- racteristics of a one-sided plane Langmuir probe located at z = 7 cm from the cathode. One can see that initially (0 < t, < 30 ps) a cold electron beam is injected into a cold background plasma
This system is highly unstable to electrostatic insta- bilities. With increasing time the beam broadens ( t , -- 40 ys), becomes the tail of a distribution with continuously decreasing slope, afe/avz < 0. On the same time scale, the background electrons are strongly heated such that both distributions finally merge. One also observes that beam electrons are accelerated to energies larger than their initial injection energy. This fact as well as the short penetration length of the beam compared with the electron mean free path indicate that the beam is scattered by electrostatic instabilities rather than by collisional processes.
On a longer time scale, however, the beam electrons undergo collisions with the low pressure background gas. When the beam energy exceeds the ionization potential (Ei - 14 eV in krypton), the plasma density increases. Ionization phenomena become noticeable for t , 2 50 ps. When a 40 eV beam pulse is applied for approx. 500 ys, which are the typical conditions of the discharge pulse, the density rises to the value at t , = 0 (n, N 2 x 10¹¹ ~ m - ~ ) . For the purpose of the present experiment, however, the initial period (0 < t, 5 50 ps) of the beam injection is of particular interest since unstable distribution functions are clearly observable and collective processes dominate. This period is long compared to the time scale of the rf instabilities.
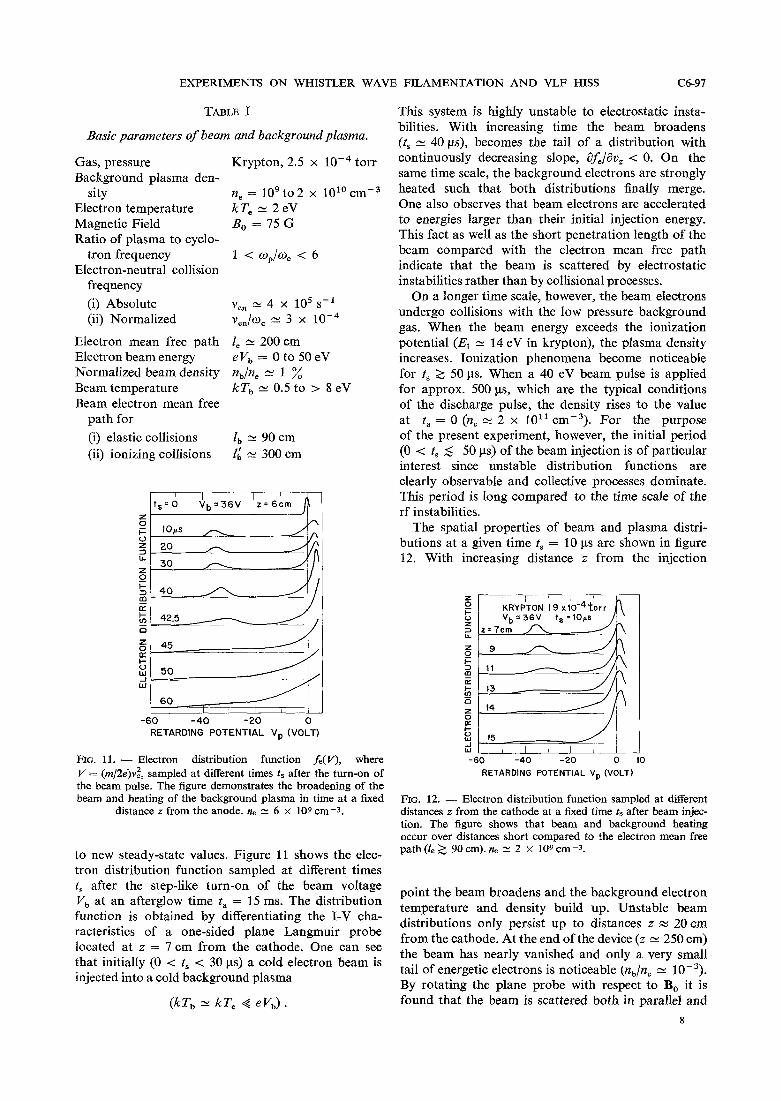
The spatial properties of beam and plasma distri- butions at a given time t, = 10 ys are shown in figure 12. With increasing distance z from the injection
W ~ , , ,
-60 -40 -20 0 10
RETARDING POTENTIAL Vp (VOLT)
FIG. 12. - Electron distribution function sampled at different distances z from the cathode at a fixed time ts after beam injec- tion. The figure shows that beam and background heating occur over distances short compared to the electron mean free path(le 2 90 cm). ne N 2 x 109cm-3.
point the beam broadens and the background electron temperature and density build up. Unstable beam distributions only persist up to distances z z 20 cm from the cathode. At the end of the device (z cz 250 cm) the beam has nearly vanished and only a very small tail of energetic electrons is noticeable (nb/ne cz By rotating the plane probe with respect to Bo it is found that the beam is scattered both in parallel and

C6-98 R. L. STENZEL
perpendicular velocity space. No back scattered fast electrons are observed.
The strong scattering of the injected beam has further consequences on the background plasma. The injected beam current cannot be returned through the end electrode or the chamber wall. Just like in an unbounded plasma the return current has to be pro- vided by the background plasma. The background electrons drift opposite to the beam electrons toward the gridded anode. The drift velocity is smaller than the beam velocity by the density ratio (n,/n, -- lo-') and Ires, in general, between the ion sound and elec- tron thermal velocities. Since the electrons have been heated by the injected beam the return current drives an ion acoustic instability. Strong three-dimensional ion sound turbulence is observed. However, these observations go beyond the scope of the present whistler instability and will be presented elsewhere [28].
4.2 INSTABILITY ANALYSIS. - The onset of an instability upon beam injection becomes apparent through the large rf noise level detected with electric or magnetic antennas inside the plasma. Figure 13a shows the coincidence between rf noise and electron beam. The top trace is the rf potential fluctuation which, for purpose of display, has been heterodyned witha local oscillator at f = 100 MHz (w/wc = 0.47).
LI az W > - z -I
0 .2 .4 .6 .8 1.0 FREQUENCY w / o C
(a
TIME t (50ps/ DIV)
(b)
FIG. 13. - (a) Rf noise at o/wc = 0.47 (top trace) and beam current pulse (bottom trace) vs. time, showing the cause-effect relationship between beam and rf emission. ne ? 6 x 109 cm-3. (b) Frequency spectrum of the spontaneous emission sampled at ts = loops after beam injection. qrn is the electrostatic signal detected in the instability region (ejprf(/kTe 5 x 10⁻³) and Brf is the wave magnetic field of whistlers detected 125 cm away from the excitation region. IBrm]/Bo e 10-5, Bo = 75 G,
w*/wc 21 5.
The bottom trace shows the beam current pulse applied at r, = 10 ms in the afterglow of the main discharge. After an initial transient, the current is constant during the first 50 ps and then rises as the density builds up. As outlined earlier, the beam current is balanced by the return current to the anode which is limited by the electron saturation current of the background plasma. The comparison between the two traces clearly shows that the rf is generated only in the presence of the electron beam. This coincidence holds for a wide range of frequencies extending from the regime of ion acoustic waves to that of electron plasma waves.
The high frequency signals are applied to a spectrum analyzer with fast output response (300 kHz band- width). Figure 13b shows the frequency spectrum in the whistler wave regime sampled at t, = 100 ps after turn-on of the beam pulse. The top trace is the rf potential from a short-wire antenna near the region of beam injection, the bottom trace is the magnetic loop signal detected in the middle of the device at z = 125cm from the cathode. The broadband character of the instability is apparent. The rf.magnetic field spectrum is cut off beyond o/w, - 0.85 which can be the result of refraction and damping of whistlers propagating from the beam injection region to the center of the device where the distribution is stable.
Although, in general, the shape of the whistler wave spectrum depends on beam and plasma para- meters there is no particular structure noticeable near the characteristic frequencies, the lower hybrid
and the electron cyclotron frequency
(0,,/2 n: = 210 MHz)
The noise spectrum extends beyond the cyclotron frequency up to the electron plasma frequency with potential fluctuations comparable to those in the whistler branch.
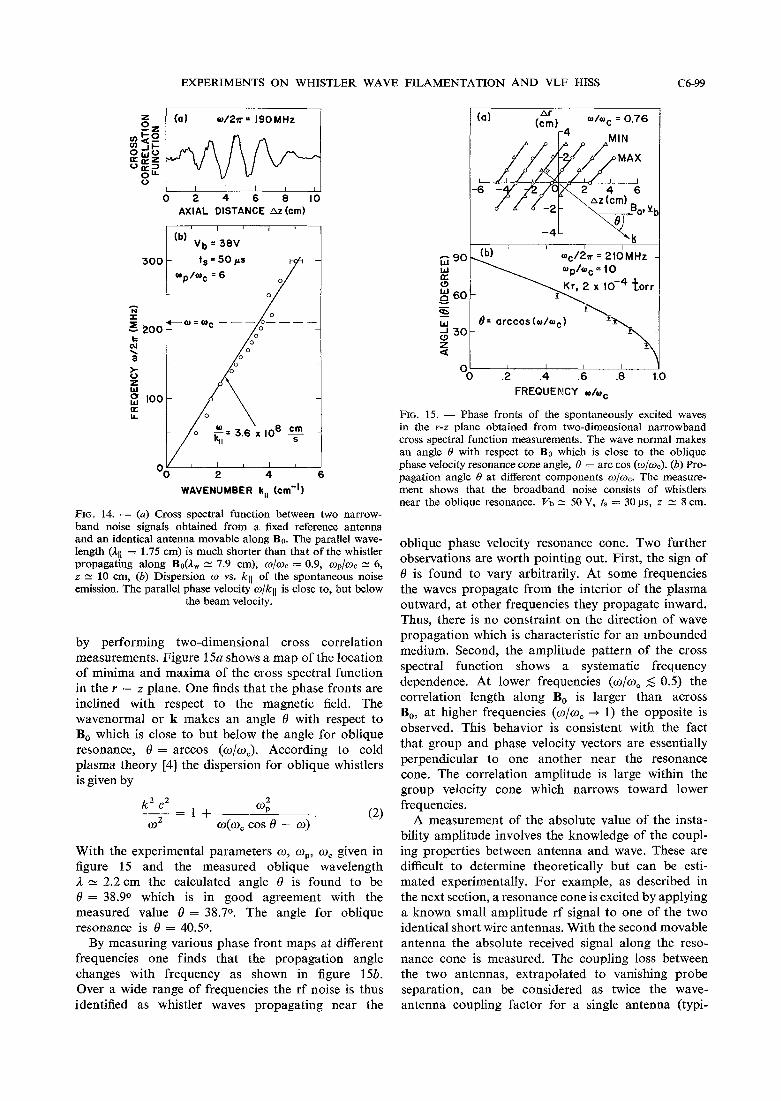
In order to identify the rf noise signals as waves, the spatial properties have been investigated with correlation techniques. Two identical movable anten- nas are used whose noise signals are passed through narrowband amplifiers, multiplied, time averaged on the high frequency time scale and then sampled and averaged on the longer time scale of the beam pulse. A typical cross spectral function is plotted vs. axial position in figure 14a. One can see that the noise correlates for a few wavelengths along the beam direction. By measuring the wavelengths of different frequency components, the dispersion o(kll) is found. Figure 14b shows that the parallel phase velocity is slightly below but close to the beam velocity. By inserting a delay line in one channel it is also verified that waves and beam travel in the same direction. These properties are characteristic for a Cherenkov type beam-plasma instability.
So far, one component, k,,, of the wave vector has been determined. The other component, k,, is found
EXPERIMENTS ON WHISTLER WAVE FILAMENTATION AND VLF HISS C6-99
AXIAL DISTANCE Az (cm)
WAVENUMBER k,, (cm'l)
FIG. 14. - (a) Cross spectral function between two narrow- band noise signals obtained from a fixed reference antenna and an identical antenna movable along Bo. The parallel wave- length (1111 = 1.75 cm) is much shorter than that of the whistler propagating along Bo(11w E 7.9 cm), w/wc = 0.9, mD/we - 6, z 11 10 cm, (b) Dispersion w vs. kll of the spontaneous noise emission. The parallel phase velocity w/kll is close to, but below
the beam velocity.
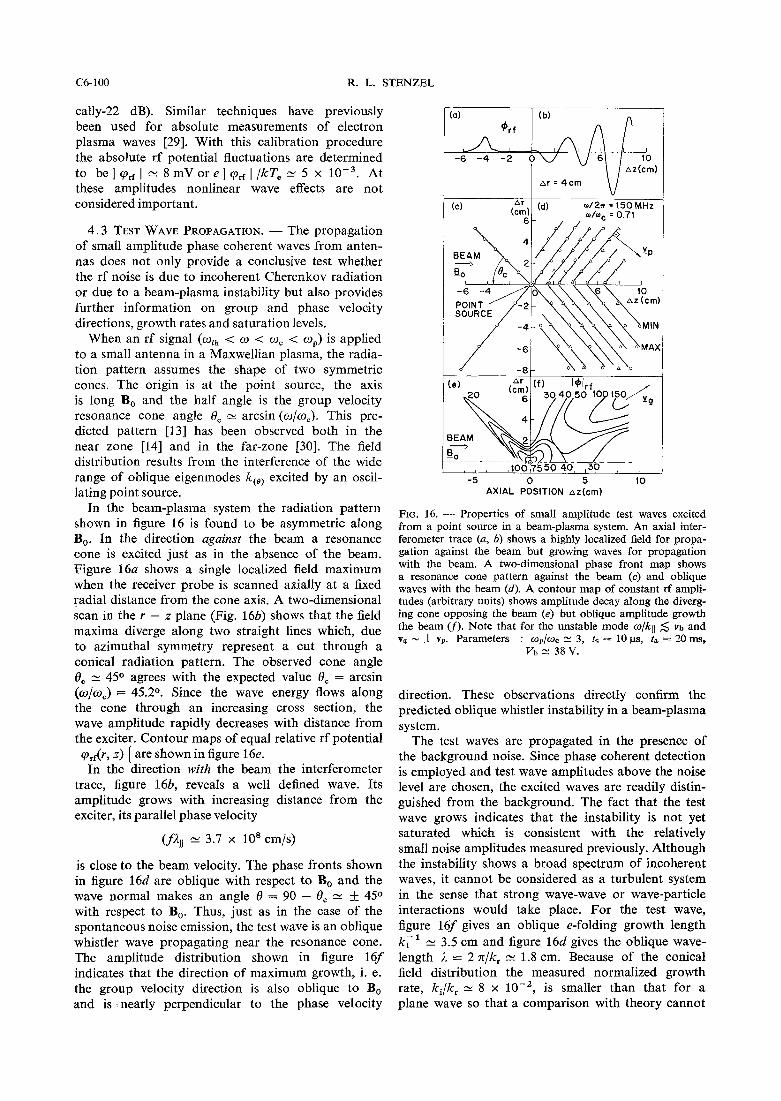
by performing two-dimensional cross correlation measurements. Figure 15a shows a map of the location of minima and maxima of the cross spectral function in the r - z plane. One finds that the phase fronts are inclined with respect to the magnetic field. The wavenormal or k makes an angle 6 with respect to Bo which is close to but below the angle for oblique resonance, 6 = arccos (ole,). According to cold plasma theory [4] the dispersion for oblique whistlers is given by
With the experimental parameters co, o,, w, given in figure 15 and the measured oblique wavelength 1 - 2.2 cm the calculated angle 8 is found to be 0 = 38.90 which is in good agreement with the measured value 6 = 38.70. The angle for oblique resonance is 6 = 40.50.
By measuring various phase front maps at different frequencies one finds that the propagation angle changes with frequency as shown in figure 15b. Over a wide range of frequencies the rf noise is thus identified as whistler waves propagating near the
( fa)
L h '0 .2 .4 .6 .8 1.0
FREQUENCY o/oc
FIG. 15. - Phase fronts of the spontaneously excited waves in the u-z plane obtained from two-dimensional narrowband cross spectral function measurements. The wave normal makes an angle 0 with respect to Bo which is close to the oblique phase velocity resonance cone angle, 6 = arc cos (w/w3. (b) Pro- pagation angle 0 at different components w/mc. The measure- ment shows that the broadband noise consists of whistlers near the oblique resonance. VD N 50 V, ts = 30 FS, z N 8 crn.
oblique phase velocity resonance cone. Two further observations are worth pointing out. First, the sign of 6 is found to vary arbitrarily. At some frequencies the waves propagate from the interior of the plasma outward, at other frequencies they propagate inward. Thus, there is no constraint on the direction of wave propagation which is characteristic for an unbounded medium. Second, the amplitude pattern of the cross spectral function shows a systematic frequency dependence. At lower frequencies (o/o, 5 0.5) the correlation length along B, is larger than across B,, at higher frequencies (o/wc + 1) the opposite is observed. This behavior is consistent with the fact that group and phase velocity vectors are essentially perpendicular to one another near the resonance cone. The correlation amplitude is large within the group velocity cone which narrows toward lower frequencies.
A measurement of the absolute value of the insta- bility amplitude involves the knowledge of the coupl- ing properties between antenna and wave. These are difficult to determine theoretically but can be esti- mated experimentally. For example, as described in the next section, a resonance cone is excited by applying a known small amplitude rf signal to one of the two identical short wire antennas. With the second movable antenna the absolute received signal along the reso- nance cone is measured. The coupling loss between the two antennas, extrapolated to vanishing probe separation, can be considered as twice the wave- antenna coupling factor for a single antenna (typi-
C6- 100 R. L. STENZEL
cally-22 dB). Similar techniques have previously been used for absolute measurements of electron plasma waves [29]. With this calibration procedure the absolute rf potential fluctuations are determined to be I q,, I - 8 mV or e I q,, I /kT, - 5 x At these amplitudes nonlinear wave effects are not considered important.
4.3 TEST WAVE PROPAGATION. - The propagation of small amplitude phase coherent waves from anten- nas does not only provide a conclusive test whether the rf noise is due to incoherent Cherenkov radiation or due to a beam-plasma instability but also provides further information on group and phase velocity directions, growth rates and saturation levels.
When an rf signal (o,, < w < o, < o,) is applied to a small antenna in a Maxwellian plasma, the radia- tion pattern assumes the shape of two symmetric cones. The origin is at the point source, the axis is long B, and the half angle is the group velocity resonance cone angle 8, N arcsin (w/o,). This pre- dicted pattern [13] has been observed both in the near zone [14] and in the far-zone [30]. The field distribution results from the interference of the wide range of oblique eigenmodes kc,, excited by an oscil- lating point source.
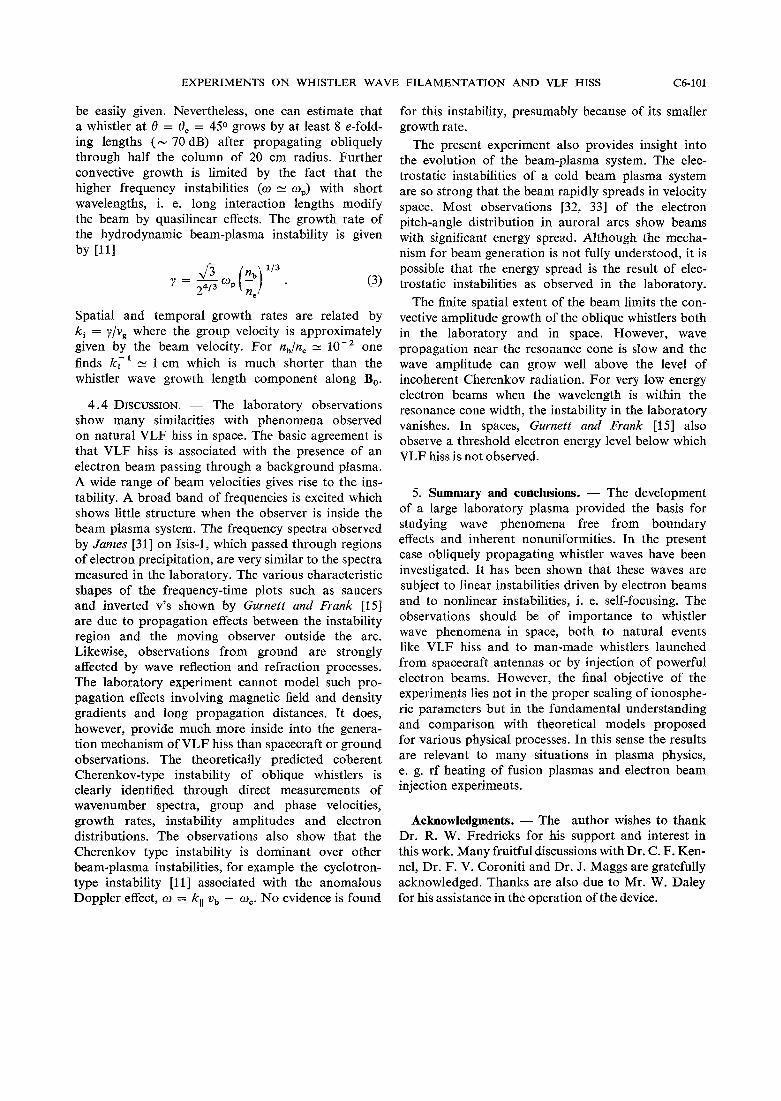
In the beam-plasma system the radiation pattern shown in figure 16 is found to be asymmetric along B,. In the direction against the beam a resonance cone is excited just as in the absence of the beam. Figure 16a shows a single localized field maximum when the receiver probe is scanned axially at a fixed radial distance from the cone axis. A two-dimensional scan in the r - z plane (Fig. 16b) shows that the field maxima diverge along two straight lines which, due to azimuthal symmetry represent a cut through a conical radiation pattern. The observed cone angle 8, 2: 45O agrees with the expected value 8, = arcsin (w/w,) = 45.20. Since the wave energy flows along the cone through an increasing cross section, the wave amplitude rapidly decreases with distance from the exciter. Contour maps of equal relative rf potential qrf(r, Z) [ are shown in figure 16e. In the direction with the beam the interferometer
trace, figure 16b, reveals a well defined wave. Its amplitude grows with increasing distance from the exciter, its parallel phase velocity
is close to the beam velocity. The phase fronts shown in figure 16d are oblique with respect to B, and the wave normal makes an angle 8 = 90 - 8, -- + 450 with respect to B,. Thus, just as in the case of the spontaneous noise emission, the test wave is an oblique whistler wave propagating near the resonance cone. The amplitude distribution shown in figure 16f indicates that the direction of maximum growth, i. e. the group velocity direction is also oblique to B, and is :nearly perpendicular to the phase velocity
(c) *' (dl d27r = 150 MHz (cm) o/wc = 0.71
-5 0 5 10 AXIAL POSITION a z ( c m )
FIG. 16. - Properties of small amplitude test waves excited from a point source in a beam-plasma system. An axial inter- ferometer trace (a, b) shows a highly localized field for propa- gation against the beam but growing waves for propagation with the beam. A two-dimensional phase front map shows a resonance cone pattern against the beam (c) and oblique waves with the beam (d). A contour map of constant rf ampli- tudes (arbitrary units) shows amplitude decay along the diverg- ing cone opposing the beam (e) but oblique amplitude growth the beam (f). Note that for the unstable mode w/kll 5 v b and v, - I v,. Parameters : w,/wc -- 3, ts = 10 ~ s , ta = 20 ms,
Vb N 38 V.
direction. These observations directly confirm the predicted oblique whistler instability in a beam-plasma system.
The test waves are propagated in the presence of the background noise. Since phase coherent detection is employed and test wave amplitudes above the noise level are chosen, the excited waves are readily distin- guished from the background. The fact that the test wave grows indicates that the instability is not yet saturated which is consistent with the relatively small noise amplitudes measured previously. Although the instability shows a broad spectrum of incoherent waves, it cannot be considered as a turbulent system in the sense that strong wave-wave or wave-particle interactions would take place. For the test wave, figure 16f gives an oblique e-folding growth length k; E 3.5 cm and figure 16d gives the oblique wave- length I = 2 nlk, N 1.8 cm. Because of the conical field distribution the measured normalized growth rate, ki/k, - 8 x lo-', is smaller than that for a plane wave so that a comparison with theory cannot
EXPERIMENTS ON WHISTLER WAVE FILAMENTATION AND VLF HISS C6-101
be easily given. Nevertheless, one can estimate that a whistler at 8 = 8, = 450 grows by at least 8 e-fold- ing lengths (- 70 dB) after propagating obliquely through half the column of 20 cm radius. Further convective growth is limited by the fact that the higher frequency instabilities ( o - o,) with short wavelengths, i. e. long interaction lengths modify the beam by quasilinear effects. The growth rate of the hydrodynamic beam-plasma instability is given by 1111
Spatial and temporal growth rates are related by k , = ylv, where the group velocity is approximately given by the beam velocity. For n,/n, = one finds k;' - 1 cm which is much shorter than the whistler wave growth length component along B,.
4.4 DISCUSSION. - The laboratory observations show many similarities with phenomena observed on natural VLF hiss in space. The basic agreement is that VLF hiss is associated with the presence of an electron beam passing through a background plasma. A wide range of beam velocities gives rise to the ins- tability. A broad band of frequencies is excited which shows little structure when the observer is inside the beam plasma system. The frequency spectra observed by James [31] on Isis-1, which passed through regions of electron precipitation, are very similar to the spectra measured in the laboratory. The various characteristic shapes of the frequency-time plots such as saucers and inverted v's shown by Gurnett and Frank [I51 are due to propagation effects between the instability region and the moving observer outside the arc. Likewise, observations from ground are strongly affected by wave reflection and refraction processes. The laboratory experiment cannot model such pro- pagation effects involving magnetic field and density gradients and long propagation distances. It does, however, provide much more inside into the genera- tion mechanism of VLF hiss than spacecraft or ground observations. The theoretically predicted coherent Cherenkov-type instability of oblique whistlers is clearly identified through direct measurements of wavenumber spectra, group and phase velocities, growth rates, instability amplitudes and electron distributions. The observations also show that the Cherenkov type instability is dominant over other beam-plasma instabilities, for example the cyclotron- type instability [ l l ] associated with the anomalous Doppler effect, o = kl l v, - o,. No evidence is found
for this instability, presumably because of its smaller growth rate.
The present experiment also provides insight into the evolution of the beam-plasma system. The elec- trostatic instabilities of a cold beam plasma system are so strong that the beam rapidly spreads in velocity space. Most observations [32, 331 of the electron pitch-angle distribution in auroral arcs show beams with significant energy spread. Although the mecha- nism for beam generation is not fully understood, it is possible that the energy spread is the result of elec- trostatic instabilities as observed in the laboratory.
The finite spatial extent of the beam limits the con- vective amplitude growth of the oblique whistlers both in the laboratory and in space. However, wave propagation near the resonance cone is slow and the wave amplitude can grow well above the level of incoherent Cherenkov radiation. For very low energy electron beams when the wavelength is within the resonance cone width, the instability in the laboratory vanishes. In spaces, Gurnett and Frank [IS] also observe a threshold electron energy level below which VLF hiss is not observed.
5. Summary and conclusions. - The development of a large laboratory plasma provided the basis for studying wave phenomena free from boundary effects and inherent nonuniformities. In the present case obliquely propagating whistler waves have been investigated. It has been shown that these waves are subject to linear instabilities driven by electron beams and to nonlinear instabilities, i. e. self-focusing. The observations should be of importance to whistler wave phenomena in space, both to natural events like VLF hiss and to man-made whistlers launched from spacecraft antennas or by injection of powerful electron beams. However, the final objective of the experiments lies not in the proper scaling of ionosphe- ric parameters but in the fundamental understanding and comparison with theoretical models proposed for various physical processes. In this sense the results are relevant to many situations in plasma physics, e. g. rf heating of fusion plasmas and electron beam injection experiments.
Acknowledgments. - The author wishes to thank Dr. R. W. Fredricks for his support and interest in this work. Many fruitful discussions with Dr. C. F. Ken- nel, Dr. F. V. Coroniti and Dr. J. Maggs are gratefully acknowledged. Thanks are also due to Mr. W. Daley for his assistance in the operation of the device.
R. L. STENZEL
References
[I] LUTOMIRSKI, R. F. and SUDAN, R. N., Phys. Rev. 147 (1966) 156.
[2] PALMADESSO, P. and SCHMIDT, G., Phys. Fluids 14 (1971) 141 1 ; ibid 15 (1972) 485.
[3] DAVIDSON, R. C., HAMMER, D. A., HABER, I. and WAGNER, C. E., Phys. Fluids 15 (1972) 317.
[4] HELLIWELL, R. A., Whistler and Related Ionospheric Phenomena (Stanford University Press, Stanford, California), 1965.
[5] AKHAMOV, S. A., SUKHORUKOV, A. P. and KHOKHLOV, R. V., Usp. Fiz. Nauk 93 (1967) 19 [Sov. Phys.-Usp 14 (1968) 6091.
[6] LITVAK, A. G., Zh. Eksp. Teor. Fiz. 57 (1968) 629 [Sov. Phys. JETP 30 (1970) 3441.
171 TANIUTI, T. and WASHIMI, H., Phys. Rev. Lett. 22 (1969) 454 ; 22 (1969) 752 ; WASHIMI, H., J. Phys. Soc. Japan 34 (1973) 1373.
[8] HASEGAWA, A., Phys. Fluids 15 (1972) 870. [9] BRINCA, A. L., J. Geophys. Res. 77 (1972) 3495.
[I01 MAGGS, J., J. Geophys. Res. 81 (1976) 1707. [ l l ] MIKHAILOVSKII, A. B., Theory of Plasma Instabilities
(Consultants Bureau, New York), 1974, vol. 1, p. 219- 223.
[12] STENZEL, R. L., Phys. Rev. Lett. 38 (1977) 394. 1131 KUEHL, H. H., Phys. Fluids 5 (1962) 1095. [I41 FISHER, R. K. and GOULD, R. W., Phys. Fluids 14 (1971)
857. [I51 GURNETT, D. A. and FRANK, L. A., J. Geophys. Res. 77
(1972) 172. [I61 STENZEL, R. L., Phys. Fluids 19 (1976) 857 ; Phys. Fluids,
19 (1976) 865 ; Radio Science 11 (1976) 1045 ; J. Geo- phys. Res. 82 (October 1977).
1171 STENZEL, R. L., Rev. Sci. Instrum. 47 (1976) 91. [IS] SMITH, R. L., HELLIWELL, R. A. and YABROPF, I. W., J.
Geophys. Res. 65 (1 960) 81 5. [I91 ADACHI, S., Radio Science 690 (1965) 493 ; ibid. 1 (1966)
671. [20] MOTZ H. and WATSON, C. J. H., in Advances in Electronics
and Electron Physics, edited by L. Marton (Academic, New York), 1967, Vol. 23, p. 153.
1211 GUREVICH, A. V., Zh. Eksp. Teor. Fiz. 48 (1965) 701 [Sov. Phys. JETP21(1965) 4621.
[22] EREMIN, B. G. and LITVAK, A. G., Zh. Eksp. Teor. Fiz. Pis. Red. 13 (1971) 693 [Sov. Phys. JETP Lett. 13 (1971) 430.
[23] PERKINS, k. W. and VALEO, E. J., Phys. Rev. Lett. 32 (1974) 1234.
[24] LAASPERE, T., JOHNSON, W. C. and SEMPREBON, L. C., J. Geophys. Res. 76 (1971) 4477.
[25] MALMBERG, J. H. and WHARTON, C. B., Phys. Fluids 12 (1969) 2600.
[26] GENTLE, K. W. and LOHR, J., Phys. Fluids 16 (1973) 1464. [27] BOLLINGER, L. D., CARR, W., LIU, H. and SEIDL, M.,
Phys. Fluids 17 (1974) 2142. [28] STENZEL, R., Phys. Fluids 21 (January 1978). [29] MALMBERG, J. H. and WHARTON, C. B., Phys. Rev. Lett.
19 (1967) 775. [30] BOSWELL, R. W. and GONFALONE, A., Phys. Lett. 51A
(1975) 485. [31] JAMES, H. G., J. Geophys. Res. 78 (1973) 4578. [32] REASONER, D. L. and CHAPPELL, C. R., J. Geophys. Res.
78 (1973) 2176. [33] FRANK, L. A. and ACKERSON, K. L., J. Geophys. Res. 76
(1971) 3612.