experimental evidence for homoclinic chaos in an ...chaos.utexas.edu/manuscripts/1071001456.pdf ·...
TRANSCRIPT

Physica D 62 (1993) 170-185 North-Holland
Experimental evidence for homoclinic chaos in an electrochemical growth process
F. Argoul a, j. Huth a ,1 p. Merzeau a, A. Arnrodo a and Harry L. Swinney b a Centre de Recherche Paul Pascal, Avenue Schweitzer, 33600 Pessac, France b .The Center for Nonlinear Dynamics and the Department of Physics, The University of Texas at Austin, Austin, TX
78712, USA
Experimental investigations of galvanostatic electrochemical growth processes in steady thin layer electrolytes are reported. For some control parameter values, the measurement of the cell potential versus time provides periodic and aperiodic oscillations. The deterministic character of these potential signals is demonstrated using standard dynamical systems theory tools such as time-delay phase portrait reconstructions, Poincar6 maps and one-dimensional maps. A transient period-doubling transition is described. The homoclinic nature of the chaotic behavior is emphasized. The origin of the spatio-temporal behavior is discussed in terms of the competition between the electrochemical process (reduction of metallic ions) and the transport processes (migration, diffusion and convection). Analysis of video images shows that the oscillations in growth rate are in phase across the entire cell width (up to 40 mm) and are in phase with the oscillations in the cell potential.
1. Introduction
Since the early eighties, much experimental work [ 1-4 ] has been initiated in physics, chem- istry and biology to examine the relevance of the diffusion-limited aggregation model (DLA) introduced by Witten and Sander [5] in 1981 to fractal growth processes. Because the concept of fractal [6] and more recently the statistical multifractal formalism [7-11 ] have just been introduced in physicist community, there has been an extensive effort by both experimental- ists and theoreticians to characterize the fractal properties of experimental clusters and numer- ical aggregates computed with the DLA model [1-4]. This was done in the spirit of gathering these diffusion-limited growth processes into a universal geometrical class [ 1-5,12 ]. The self- similarity of DLA aggregates and experimental
Permanent address: The Center for Nonlinear Dynamics and the Department of Physics, The University of Texas at Austin, Austin, TX 78712, USA.
clusters has been demonstrated using powerful tools such as the generalized fractal dimensions and the f(a) spectrum [13,14] and more re- cently the wavelet transform [ 15,16 ]. Moreover, it has been recently realized [17] that the ge- ometrical self-similarity of diffusion-controlled aggregates is intimately related to the inhomoge- neous distribution of the velocity field (growth probability) along the cluster boundary. Numer- ical and experimental evidence for the multifrac- tal nature of the growth probability distribution of diffusion-limited aggregates has been reported in refs [ 17-26 ]: the generalized fractal dimen- sions are not equal (as found for DLA cluster geometry [ 14 ] ) but decrease with increasing q, and the corresponding f (a) spectrum displays a characteristic single humped multifractal shape.
These approaches focus on invariants of the diffusion-limited growth processes, i.e., asymp- totic statistical quantities which do not change in time. Therefore, they fail to provide any di- rect insight into the dynamical properties of the growth process. Even though the geometrical
0167-2789/93/$ 06.00 (~) 1993-Elsevier Science Publishers B.V. All rights reserved

F. Argoul et al. / Homoclinic chaos in an electrochemical growth process 171
structure of these fractal aggregates is some- how a footprint of their past evolution, the in- tricate coupling [17] between space and time which governs these growth processes requires that geometrical analysis be complemented by a dynamical study [27,28].
The electrodeposition process [29-41 ] is well suited for experimental studies of fractal growth processes because the time evolution can be ac- curately monitored, either by measuring current (with fixed voltage) or by measuring voltage (with fixed current). Unfortunately, as in most other experimental systems which have been investigated so far, electrodeposition in a thin layer is not purely diffusion-limited in general; migration [42-45] and convection [46] can also play major roles in the selection of the mor- phology as well as in the dynamical behavior that leads to a specific pattern for the deposit.
Here we consider oscillations and chaos in the growth process. The only previous observations of oscillations were those of Suter and Wong [40] and Schlitter, Eickhorn and Fischer [39]. However, neither of those papers provided any dynamical systems analysis such as in our paper (e.g., phase space portraits and one-dimensional maps), nor did these papers make the connec- tion between the oscillating velocity ofthe cath- ode boundary and the oscillations in the volt- age. In contrast to our preceding studies [14- 16 ], we do not try to reach here the "DLA limit"; rather, working at higher electric fields, we fo- cus on dendritic morphologies [34-36,40,42,43 ] and their growth dynamics. We hope that the un- derstanding of these high field regimes will help us to bound quantitatively the parameter space values where diffusion alone contributes to the ionic transport (without migration and convec- tion) and to provide a physical interpretation of the specific morphologies which are observed in the DLA limit [47].
The paper is organized as follows. After a brief description in section 2 of the electrodeposition system, we report in section 3 on the dynamical behavior (periodic or chaotic oscillations in time
of the growth velocity of the cluster boundary) that is observed in high field electrodeposition of zinc dendrites. Comparing the oscillations in the voltage signal with the cluster interface pul- sations during the growth, we give a tentative phenomenological interpretation of the physical origin of these oscillations which involves re- action and migration mechanisms as destabiliz- ing effects and convection as a saturating mech- anism. The deterministic nature of the chaotic oscillations is clearly demonstrated in section 4 using dynamical system theory tools such as time-delay phase space portrait reconstruction, Poincar6 maps and one-dimensional maps [48- 50]. The origin of this chaos is understood in terms of chaotic orbits that exist in the neigh- borhood of Sil'nikov homoclinic orbits [ 51-56 ]. We conclude with some experimental prospects in section 5.
2. The electrodeposition system
2.1. T h e e x p e r i m e n t a l se t -up
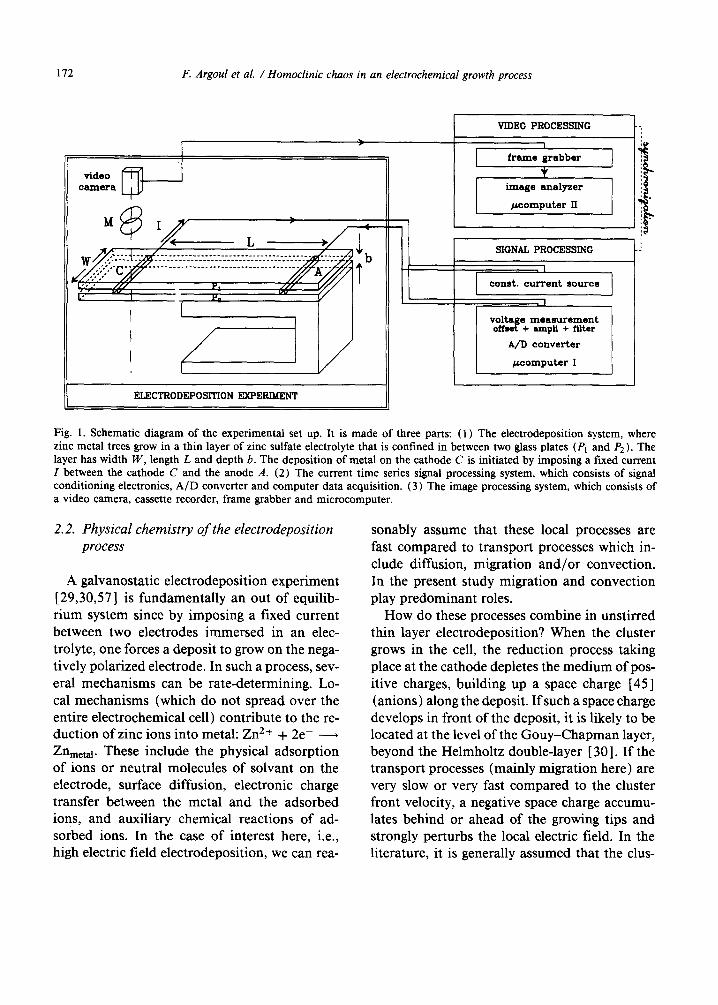
The experimental set-up is sketched in fig. 1. It consists of two parallel zinc electrodes of di- ameter b, separated by a distance L and con- fined between two rectangular glass plates of width W. The spacing between the electrodes is filled by capillarity with an aqueous solu- tion of zinc sulfate (ZnSO4). Pictures of the growing metallic clusters are obtained with a video camera through a microscope. During the growth, the current is maintained constant and the cell voltage signal is low-pass filtered with an op-amp based two-pole Butterworth filter (3 db at 100 Hz). The amplified signal is then digitized with 16 bit resolution and stored in a microcomputer. Since the voltage gives a global measure of the impedance of the cell, its fluctu- ations reflect not only the deformations of the metallic cluster as it grows but also the shape of the diffusion-migration layer [29,30] along the cluster boundary.
172 F. Argoul et al. /Homoclinic chaos in an electrochemical growth process
video camera
. . . . . . . . . . . . . . . . . . t _ . . . . . . . . . . . .
ELECTRODEPOSITION EXPERIMENT
VIDEO PROCESSING
I frame grabber
image analyzer
~,computer IT
I
SIGNAL PROCESSING
,I i
e o n s t , c u r r e n t s o u r c e [ J
. I
voltage measurement o f f s e t + a m p l i + f i l ter
A/D converter
~computer !
Fig. 1. Schematic diagram of the experimental set up. It is made of three parts: (1) The electrodeposition system, where zinc metal trees grow in a thin layer of zinc sulfate electrolyte that is confined in between two glass plates (/'1 and P2 ). The layer has width W, length L and depth b. The deposition of metal on the cathode C is initiated by imposing a fixed current I between the cathode C and the anode A. (2) The current time series signal processing system, which consists of signal conditioning electronics, A / D converter and computer data acquisition. (3) The image processing system, which consists of a video camera, cassette recorder, frame grabber and microcomputer.
2.2. Physical chemistry of the electrodeposition process
A galvanostatic electrodeposition experiment [29,30,57] is fundamentally an out of equilib- rium system since by imposing a fixed current between two electrodes immersed in an elec- trolyte, one forces a deposit to grow on the nega- tively polarized electrode. In such a process, sev- eral mechanisms can be rate-determining. Lo- cal mechanisms (which do not spread over the entire electrochemical cell) contribute to the re- duction of zinc ions into metal: Zn 2+ + 2e- , Znmeta 1. These include the physical adsorption of ions or neutral molecules of solvant on the electrode, surface diffusion, electronic charge transfer between the metal and the adsorbed ions, and auxiliary chemical reactions of ad- sorbed ions. In the case of interest here, i.e., high electric field electrodeposition, we can rea-
sonably assume that these local processes are fast compared to transport processes which in- clude diffusion, migration and/or convection. In the present study migration and convection play predominant roles.
How do these processes combine in unstirred thin layer electrodeposition? When the cluster grows in the cell, the reduction process taking place at the cathode depletes the medium of pos- itive charges, building up a space charge [45] (anions) along the deposit. If such a space charge develops in front of the deposit, it is likely to be located at the level of the Gouy-Chapman layer, beyond the Helmholtz double-layer [ 30 ]. If the transport processes (mainly migration here) are very slow or very fast compared to the cluster front velocity, a negative space charge accumu- lates behind or ahead of the growing tips and strongly perturbs the local electric field. In the literature, it is generally assumed that the clus-
F. Argoul et al. /Homocl in ic chaos in an electrochemical growth process 173
ter adjusts its growth speed (macroscopic veloc- ity of the front inside the cell) according to the velocity of the migration of anions: V¢luster = paEbulk [44,45 ], where #a is the mobility of the anions and Ebulk the electric field in the bulk. This assumption has been shown to work satis- factorily in the case of dense growth of copper in copper sulfate solutions [44,58]. In the fol- lowing experimental study of zinc electrodeposi- tion, we show that this assumption is question- able when the growth is dendritic.
3. Voltage oscillations
3.1. Qualitative description
We consider here the electrodeposition of zinc dendrites from zinc sulfate solutions without added electrolyte [27,28,40,42]. For high elec- tric field and high zinc sulfate concentration, the growth velocity of the zinc metal oscillates peri- odically or chaotically in time after some induc- tion regime, whose duration depends upon the zinc sulfate concentration, the current intensity and the zinc electrode initial surface itself. The bifurcation to the oscillatory regime is shown in fig. 2. The bifurcation to oscillations coincides with the emergence of dendritic fingersfrom the zinc electrode. Using a calomel reference elec- trode, mounted in the cell midway between the cathode and the anode, we have found that the oscillations occur in the potential between the cathode and the reference electrode, while the potential between the anode and the reference electrode only decreases very slowly during the experiment.
The dendritic character of the morphology in our zinc experiments seems to be intimately re- lated to the presence of oscillations. In electrode- position of copper from copper sulfate solutions, neither the dendritic morphology nor regular os- cillations in potential have been observed. More- over, note in fig. 2 that the voltage (anode mi- nus cathode potential) has to reach some thresh- old above which the deposition process starts
in this thin layer while the voltage oscillations are triggered. The oscillatory regime lasts from about t = 100 to t = 270 s. At later times, only very small amplitude (,-~ a few mV) oscillations mixed with noise survive, and only a few den- dritic trees remain. The oscillations are surpris- ingly periodic, as illustrated in fig. 3a for t be- tween 181 s and 194 s. The sharp peaks of the power spectrum in fig. 3b and their harmonics demonstrate the periodic and relaxational char- acter of the oscillations. The reconstructed phase portrait [59,60] of fig. 3c shows a limit cycle where the difference between the orbits arises not only from external noise but also from the transitory character of these oscillations: their amplitude and frequency is smoothly evolving in time.
The voltage oscillations correspond precisely to oscillations in the growth velocity of the metallic clusters, as figs. 4, 5 and 6 illustrate. The growth of the entire boundary profile (iso- contour) pulsates in phase with the voltage, as fig. 5 demonstrates: the velocities of two well separated tips in fig. 5b oscillate exactly in con- cert, and this oscillating motion is precisely in phase with the oscillations of the anode to cath- ode potential shown in fig.Sa. Even the parts of the boundary that are screened by large fingers clearly exhibit these oscillations. The simultane- ity of the oscillations and dendrite tip motion is found for the chaotic as well as the periodic regimes, as fig. 6 illustrates. A comparison of the video images with the voltage time series shows that an increase in voltage corresponds to an acceleration of the growth velocity.
3.2. Discussion
If, as is generally assumed in electrodeposi- tion in thin layers [44,45], the anions leave the tip region (essentially by migration at high field) at the same velocity as the dendritic front progresses in the cell, the electroneutrality of the electrolyte is preserved and the speed of the

174 F. Argoul et aL / Homoclinic chaos in an electrochemical growth process
, . . . . , . . . . , . . . . , . . . . , . . . . ~ . . .
8
24.4 i . . . . i . . . . i . . . . i . . . . i . . . . I ,
0 60 100 150 200 2150 t /me (S)
Fig. 2. Typical t ime series record of the anode voltage relative to the cathode for fixed current. Beyond t = 2 8 0 s, the large periodic oscillations are damped and only very small amplitude oscillations (a few mV) remain. Experimental conditions: [ZnSO4] = 0.2 M, I = 3 mA ( j = I / W b = 25 mA/cm2), W = 40 mm, L = 145 mm, b = 0.3 mm, q~t=0 = 24.4 V.
(',,)
t80 1B6 190 195
t tmo (.)
g
f o
0 1 2 3 4 frequency (Hz)
Fig. 3. Analysis of the periodic regime for the voltage time series ~ (t) shown in fig. 2. (a) Time series in the time interval [ 181 s, 195 s]. (b) Power spectral density S(co) (the amplitude squared of the Fourier transform) for the time interval [ 170 s, 220 s]. (c) Phase space portrait constructed from the time series by the time-delay method" (X 0 = • (t), X 1 -- d)(t + r) , X 2 ~- qb(t + 2z)) , where z=36 ms.
front is proportional to the electric field (Fleury et al. [45]):
V = ,u a Ebulk , ( 1 )
where/Za is the anionic mobility and Ebulk is the electric field of the bulk. Therefore, by express- ing Ebulk as a function of the cell voltage • and the distance L between the cathodic deposit and the anode: Ebulk = -~/L, one gets:
V ~ q>. (2)
In our experiment the velocity estimated from (1) using (2) is 14 #m/s, while the average measured velocity deduced from an analysis of the motion of isocontour lines in fig. 4b is only 2.5 /Lm/s. However, the velocity maxima in the oscillatory regime (figs. 5b and 6b) is com- parable to the theoretical anion velocity. The velocity oscillations likely arise because of the build-up of a space charge ahead of the growing dendritic tips.
Since the growth is externally forced with a constant current, the rate of reduction must be

F. Argoul et al. /Homocl in ic chaos in an electrochemical growth process 175
>
24.8
24.7
2 4 . 6
2 4 . 5 t i i t 125 130 135
Ume (B)
( a ) 24 .9
(b)
60 tala D
Fig. 4. Comparison of (a) a periodically oscillating voltage time series with (b) the corresponding video images of the boundary profiles (isocontours). The initiation of the os- cillations in the voltage is simultaneous with an abrupt in- crease in the electrodeposition growth velocity. The circu- lar points on the time series indicate the amplitude at equal time intervals (0.4 s), which is the mesh used in obtain- ing the 32 video images. The oscillations in the interface position are everywhere in phase.
constant in time. There must be some mecha- nism that maintains electroneutrality around the cluster. Three possibilities for this mechanism are the following: (i) The number of fingers might be reduced progressively during the growth process, so that those which survive grow faster and finally reach the speed of anionic migration. However, it is doubtful that this mechanism [17,27,28] could produce nice periodic oscillations, and the structure of the deposit does not exhibit any pe- riodicity. Moreover, in fig. 5b all fingers pulsate in concert. (ii)Observations through a microscope re- veal periodic particle streaming. This electro- hydrodynamic instability could mix the fluid, thereby reducing the space charge. This would lead to a decrease in the local field and hence in
24.8
24 .7
m
o
>
24.6
24.5
15
I0
5
0
15
10
5
0
160 170 180 190 t ~ (~)
(a)
(b)
~ (~)
100prn I I
Fig. 5. Comparison of (a) voltage time series data with (b) the velocities of the tips of two well separated metallic trees, which are shown in (c) in a composite video image of boundary profiles (isocontours) obtained every 1.2 s (the arrows indicate the two tips). The time-dependent velocities were deduced from an analysis of the video images. The upper (lower) trace is for the tip on the right (left) in (c).
the growth velocity. Moreover, the convective mixing of the front layer could feed the screened regions of the interface where the solution is completely depleted in anions and cations, thereby slowing down the selection process. This type of convective instability is more complex than thermal convective instability where the temperature gradients depend directly on the
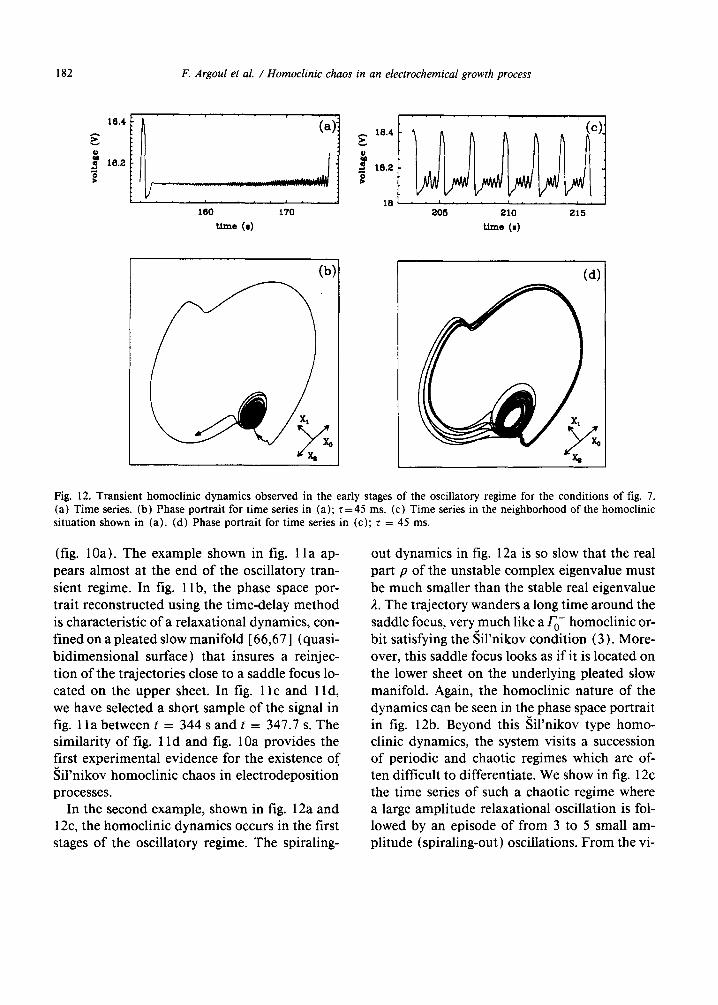
176 F. Argoul et al. / Homoclinic chaos in an electrochemical growth process
external forcing; since it is driven by potential gradients, it depends both on the electric field in the bulk and the local distribution of charges in the electrolyte. (iii) It is likely that besides convective motions, adsorption on the interface and reactivity of the chemical species that exist in the solution will be important in understanding the origin of the oscillations. In particular, H20 plays two crucial roles: as a solvant, it forms with zinc different hydrocomplexes such as Zn (OH) +, Zn (OH) 2, Zn(OH)~, Zn(OH) 2- which will be adsorbed
differently on the electrode, and as an oxidant it can be reduced to H2 and modify both the texture of the deposit and the local concentration field close to the cathode.
Whatever the relevant mechanism, one can propose a general interpretation of the increase of the period of oscillations when the growth pro- ceeds, as shown in fig. 2. The tips of the zinc trees screen the electric field in the fjords; therefore, these internal parts of the cluster boundary grow much slower than the tallest ones. Progressively,
E
o
15.3
15.2
15.1
15
30
20
tO
i ,
i , i i , . i .
50 55 time (s)
(a) 4
3
o 2
(e)
(b)
(d)
0 5 I0 15 20
frequency (Hz)
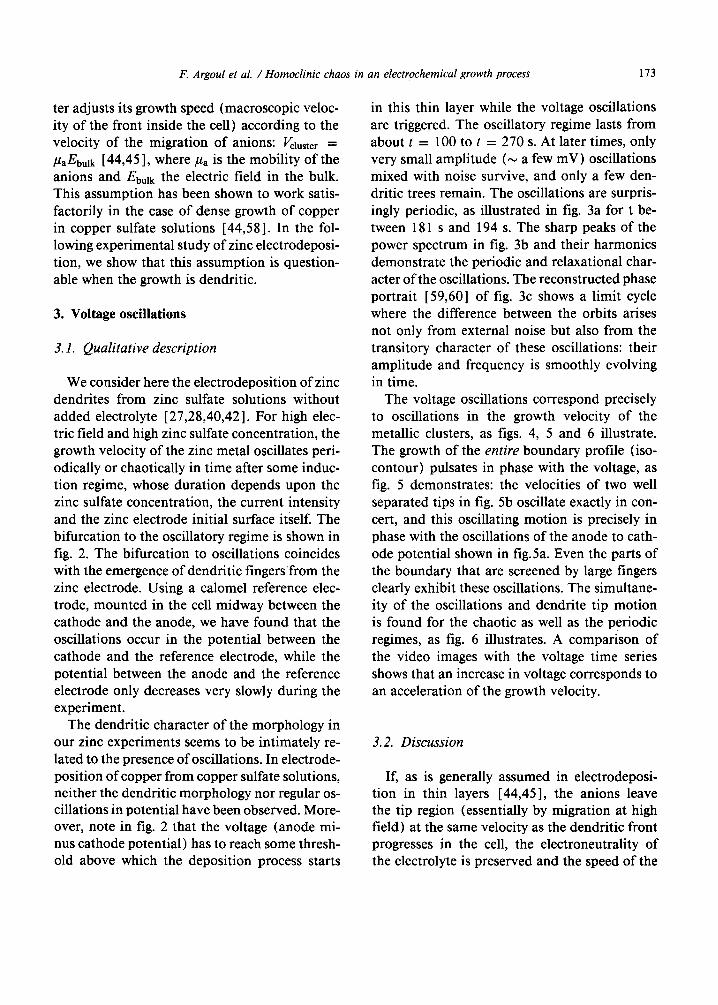
Fig. 6. Comparison of (a) a chaotic voltage time series with (b) the velocity of the dendrite tip which is shown in (c) in a composite video image of boundary profiles (isocontours) obtained every 0.32 s. (d) Power spectral density S(eo) for the same time interval as shown in (a). (e) Phase space portrait: (X0 = ~ ( t ) , X1 = ~ ( t + z), X2 = ~ ( t + 2z)) , where z = 3 0 ms. Experimental conditions: [ZnSO4] =0.2 M, I = 4 . 0 mA ( j = 3 3 . 3 mA/cm2), W = 4 0 mm, L = 6 2 mm, b=0 .3 ram,
• t=0 = 14.8 V.

F. Argoul et al. /Homoclinic chaos in an electrochemical growth process 177
fewer and fewer trees survive, and iheir velocity increases to get closer to the anionic migration speed: then more and more time is needed for the space charge to build up ahead of the tips.
To summarize this section, we have proposed that the oscillations in electrodeposition involve a global mechanism with two competing pro- cesses: a linear instability due to space charge forming ahead of the zinc tips, and a nonlin- ear mechanism (possibly electrohydrodynamic convection) which saturates this instability and gives rise to finite amplitude oscillations.
4. From periodic to chaotic oscillations
4.1. Qualitative description of chaos
Starting from the periodic regime of fig. 2, if we increase the current density, the electrodepo- sition system can make a transition to a chaotic regime, as shown in fig. 6a. These oscillations do not look as regular in amplitude or period as in fig. 2. The corresponding power spectrum in fig. 6d has lost the well-defined peaks of fig. 3b. The juxtaposition of successive video images at time intervals of 0.32 s in fig. 6c does not give equally spaced isocontours. The dendritic morphology is apparent in fig. 6c, but the side branches are notably atrophied, giving a rather flattened aspect to the dendrite. This is a general characteristic of the growth patterns when these macroscopic oscillations are occurring. Fig. 6e shows a three-dimensional phase portrait recon- structed from the time series of fig. 6a using the time-delay method [59,60]. The orbits are not randomly distributed in space; on the contrary, they all roll up around a common direction and they likely lie on a sheet-like quasi-two dimen- sional surface. We now analyze the chaotic be- havior using dynamical systems concepts such as Poincar6 sections and maps [48-50].
4.2. Evidence for deterministic chaos
According to dynamical system theory, there exist specific routes from regular to chaotic dy- namics that are common to various systems [48- 50]. Some of these universal routes to chaos have been observed experimentally during the past ten years, e.g., in studies of convection, semi- conductors, lasers and chemical systems [61 ]. The best known and most studied route to chaos is the cascade of period-doubling bifurcations [62-64]: the period of oscillation successively doubles in an infinite sequence of transitions as a control parameter is varied. The distance in control parameter between successive transi- tions decreases geometrically at a universal rate; hence the sequence converges. The accumulation point for the sequence marks the onset of chaos.
In an experiment on a growth process, the notion of scenario to chaos must be treated with caution since the internal control parameter evolves during the growth. Thus it is not possi- ble in principle to study asymptotic statistically stationary properties. However, in our system, the time scale for the evolution of the dynam- ical behavior is large with respect to the char- acteristic oscillation time so that it is possible to identify and characterize different dynamical regimes, even though the state of the system if slowly evolving.
The reverse period-doubling transition illus- trated by the data in fig. 7 was analyzed us- ing phase space portraits, Poincar~ sections, and one-dimensional maps [48-50,61]. The phase portrait in fig. 7b, constructed with the optimum time delay [65] (about one-tenth of an orbital period), looks rather similar to phase portraits of low dimensional attractors such as the Rrssler attractors [66]. The intersection of the orbits with a plane approximately normal to the orbits yields a set of points that, within the experimen- tal resolution, lie along a one-dimensional curve, as shown in fig. 7c. The fact that the Poincar6 section is not a scatter of points demonstrates the low-dimensional nature of this chaotic state:

178 F. Argoul et al. /Homoclinic chaos in an electrochemical growth process
I
2 3
2 2 . 8
14.0 , I
! i ii ¸ ~i ~
160 180
Urea (-)
v 0.1
- 0 . 1
. . . . . . . . . . . . . . . i c )
~ 1 ~ , , .rd,..~ ,o J
• , , . . . . t . . . . J . . . .
0 0 . ! 0 .2 U 0.3
0.1
0 0.1 X. t
Fig. 7. (a) A voltage time series exhibiting a transition from a chaotic regime [135 s, 160 s] to a periodic regime (above 190 s). The reverse period-doubling bifurcation to the periodic regime is bracketed by two vertical arrows. (b) Phase space portrait of the chaotic regime C: (X 0 = q~(t), X 1 = ~ ( t + r), X 2 = ~ ( t + 2z)), where z=36 ms. (c) Poincar6 section constructed from trajectories crossing the plane (in the positive direction) normal to the page through the dashed line in (b). (d) One-dimensional map obtained by plotting ordered pairs (Xi, Xi+l ) where Xi = Ui cos0 + V/sin0 and 0 = 70 °. Experimental conditions: [ZnS04]=0.2 M, I=0.41 mA ( j=27 .3 mA/cm2), W = 5 mm, L = l l 0 mm, b=0.3 mm, qbt=0 =22.6 V.
the orbits are attracted onto a two-dimensional sheet that is likely to be fractal, with a strong transverse packing of the sheets of the attractor.
Further insight into the dynamics can be achieved by constructing a one-dimensional map: after collecting successive intersections of the trajectory (~ (t), q~ (t + z), • (t + 2z) ) with a transverse plane, we define a 1D map from one of their coordinates by plotting Xi+s versus Xi. The points in fig. 7d fall on a well-defined one-dimensional map which has two arms that are symmetric with respect to the first diagonal. This symmetric splitting of the 1D map reflects the close vicinity of a period-doubling bifur- cation: the dynamics systematically alternates
between the horizontal and the vertical arms. Period-doubling is a generic property of sys-
tems described by a one-dimensional map with single quadratic extremum [62-64]. Moreover, the chaotic regime observed beyond the end of a period-doubling sequence often contains an in- finite number of periodic states (windows) that occur in a certain order. This sequence is known as the "universal sequence" [64]. In some situ- ations, the period-doubling cascade and the re- sulting chaotic regimes have been shown to be the precursor of alternating sequences of peri- odic and chaotic states that can be understood in terms of the periodic and chaotic orbits that ex- ist on the way to homoclinicity [53-56,67]. Ex-

F. Argoul et al. /Homoclinic chaos in an electrochemical growth process 179
5 9
E 6 8 . 8
, , - .
i i
17 18 tin° (,)
5 9 f ' " " ' " " " ' . . . . " "
- 6 8 . 8
o
34 36 38 40 42
ttme (e)
3
o
4
2
0
- 2
3
o
- 2 5 10 15 20
f r e q u e n c y (Hz) 5 10 15 20
frequency (l-lz)
• Xt
(o)
x,
(t)
,x,
%
Fig. 8. A period-two regime and a chaotic regime observed for condi t ions close to those in fig. 7, except for a higher current densi ty and a smaller cell width. Per iod-two regime: (a) t ime series, (b) power spectrum, and (c) phase portrait with r = 2 2 . 5 ms. Chaotic regime: (d) t ime series, (e) power spectrum, and (f) phase portrai t with r = 22.5 ms. Experimental conditions: [ZnSO4] = 0.2 M, I = 0.41 mA ( j = 45.6 m A / c m 2 ) , W = 3 mm, L = 145 mm, b = 0.3 mm, ~t=0 = 58.9 V
perimental runs at higher current density have provided evidence for such a wealth of dynam- ical regimes. In fig. 8a, we illustrate a period- two regime which precedes the chaotic regime of fig. 8d. The power spectra of the period-two regime and of the chaotic regime are shown in fig. 8b and 8e, respectively. The broad band spec- trum in fig. 8e and the corresponding phase por- traits in fig. 8c and 8f are suggestive of period- doubling leading to chaos. When using the same
method as in fig. 7, the Poincar6 section of the strange attractor in fig. 8fis again a collection of points that range along a smooth curve, as illus- trated in fig. 9a. This suggests that the dynam- ics lies approximately on a two-dimensional sur- face in the phase space. The corresponding one- dimensional map, shown in fig. 9b, fits a smooth curve with a single extremum [64]. This is evi- dence for the deterministic nature of the aperi- odic oscillations observed in our electrochemi-

180 F. Argoul et al. / Homoclinic chaos in an electrochemical growth process
0.02
Y ":2
o 0
0 qO •
o o
o
o
o
m
o
• , * - , , i . . . . i . . . . , . .
-0 .01 -0 .005 0 0.005
U
0.02
Xt÷t
o . , (b)
-0.02 " - ~ ~ o .
- 0 . 0 2 0 0.02
Fig. 9. (a) Poincar~ section and (b) one -d imens iona l map constructed for the chaotic t ime series in fig. 8d. The Poincar6 section was constructed for trajectories nor- mal to the page through the dashed line in fig. 8f. The one-dimensional map was obtained by plotting ordered pairs (Xi, X i+l ) where Xi = UicosO + V/sin0 and 0 = - 6 5 °. The curve, drawn to guide the eye, suggests a unimodal map.
cal system.
4. 3. Sil'nikov homoclinic chaos
We begin by stating the main content of the Sil'nikov theorem [ 51 ]: there exist uncountably many nonperiodic trajectories in systems which
display a homoclinic orbit biasymptotic to a sad- dle focus, providing the following condition is fulfilled:
2 > p > 0 , (3)
where +2 and qzp -4- io9 are the eigenvalues indi- cated in the diagrams in fig. 10.
In a three-dimensional space, two kinds of such homoclinic orbits can exist, depending on the dimension of the invariant manifolds of the saddle-focus. When the stable manifold Ws is unidimensional, the unstable manifold is bidi- mensional, and vice versa. Fig. 10 illustrates these two kinds of homoclinic orbits, where the eigenvalues of the saddle focus (located at the origin O for the sake of simplicity) are ( -2 , p + io9) for F 0- and (2, - p ± iw) for F0+. Much interest hasbeen devoted to the orbits F0+ [52- 55,68], but only recently has much attention been paid to the orbits F 0- [55,56]. The latter have provided a theoretical framework for the understanding of chemical chaos observed in the Belousov-Zhabotinsky reaction [69-71 ], in agreement with R6ssler's intuition [72]. In particular, two of us (A.A. and F.A.), in collab- oration with P. Richetti [73,74], have provided experimental evidence that the iteration scheme deduced from the time series of a "spiral-type" chemical strange attractor satisfies the symbolic dynamics predicted by Sil'nikov theory of ho- moclinic chaos for F 0- orbits [67,73 ].
The zinc dendrite electrodeposition time se- ries are strikingly similar to those observed for the alternating periodic-chaotic sequences [69- 71 ] in the Belousov-Zhabotinsky reaction when varying one control parameter, e.g., the flow rate in the continuously stirred tank reactor. It is thus tempting to look for a F 0- orbit as the mathe- matical origin of the chaos encountered in elec- trochemical deposition.
For experimental conditions close to those of fig. 7, we have discovered spiraling-out dynam- ics that are characteristic of the chaotic orbits that exist in the neighborhood of a F 0- orbit

F. Argoul et al. / Homoclinic chaos in an electrochemical growth process 181
Fig. 10. Homoclinic orbits biasymptotic to a saddle focus O in three-dimensional phase space (taken from ref. [73]): (a) F 0- "spiraling-out" homoclinic orbit; (b) F0+ "spiraling-in" homoclinic orbit (2 and p > 0). The Poincard plane H must be
transverse to the stable manifold Ws (resp. unstable manifold Wu) for the homoclinic orbit F 0- (resp. F0+ ).
7.6
o ?.5
7.4 330 340 360
t/me (.)
7 . 6 , . . . . , . . . . i . . . . , . . . .
7.4, 344 345 346 34? 346
tam. ( .)
(b)
xo
,,x,
(d)
"xt
Fig. 11. A chaotic regime with a homoclinic type orbit observed for conditions close to those in fig. 7, except for lower current density. (a) Time series. (b) Phase portrait for time series in (a); r = 2 4 ms. (c) Expanded view of the time series for the time interval [344 s, 347.7 s]. (d) Phase portrait for time series in (c); z=24 ms. Experimental conditions: [ZnS04]=0.2 M, •=0.35 mA ( j = 19.4 mA/cm2), I ¥ = 6 mm, L = 5 0 mm, b = 0.3 ram, ~t=0=7.44 V.
182 F. Argoul et aL / Homoclinic chaos in an electrochemical growth process
(b)
¸ . . . . . . . . . 18.2 ~ 10.2
160 170
urea (a) 205 210 215
tim-. O)
d
(d)
Xo
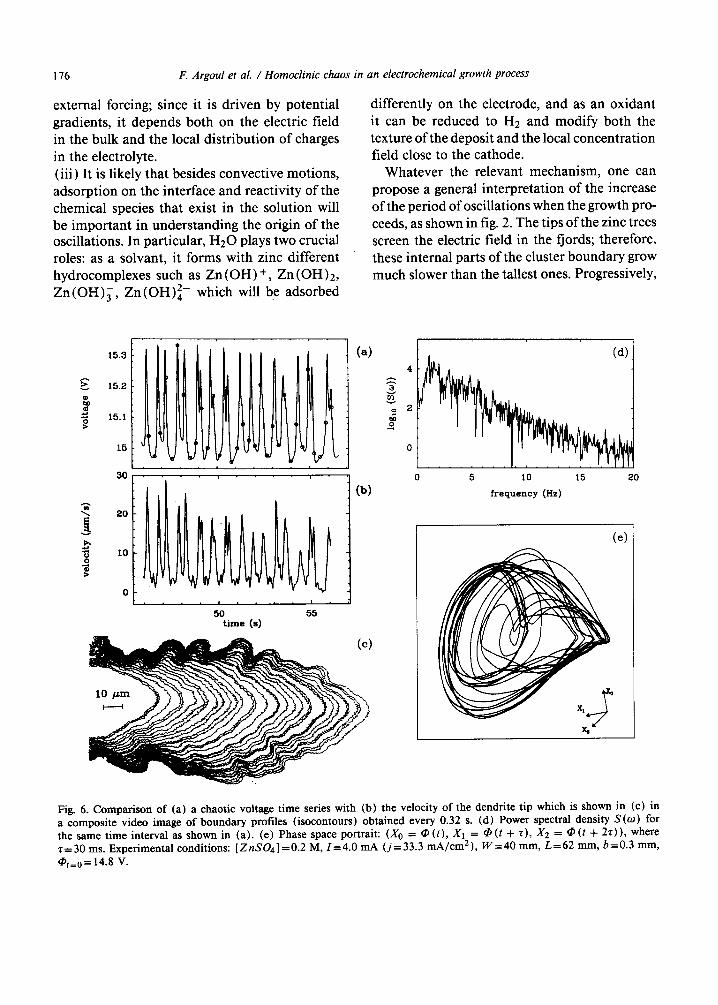
Fig. 12. Transient homoclinic dynamics observed in the early stages of the oscillatory regime for the conditions of fig. 7. (a) Time series. (b) Phase portrait for time series in (a); r=45 ms. (c) Time series in the neighborhood of the homoclinic situation shown in (a). (d) Phase portrait for time series in (c); r = 45 ms.
(fig. 10a). The example shown in fig. 1 la ap- pears almost at the end of the oscillatory tran- sient regime. In fig. 1 lb, the phase space por- trait reconstructed using the time-delay method is characteristic of a relaxational dynamics, con- fined on a pleated slow manifold [66,67] (quasi- bidimensional surface) that insures a reinjec- tion of the trajectories close to a saddle focus lo- cated on the upper sheet. In fig. 1 l c and l ld , we have selected a short sample of the signal in fig. I la between t = 344 s and t = 347.7 s. The similarity of fig. 1 l d and fig. 10a provides the first experimental evidence for the existence of Sirnikov homoclinic chaos in electrodeposition p r o c e s s e s .
In the second example, shown in fig. 12a and 12c, the homoclinic dynamics occurs in the first stages of the oscillatory regime. The spiraling-
out dynamics in fig. 12a is so slow that the real part p of the unstable complex eigenvalue must be much smaller than the stable real eigenvalue 2. The trajectory wanders a long time around the saddle focus, very much like a F 0- homoclinic or- bit satisfying the Sil'nikov condition (3). More- over, this saddle focus looks as if it is located on the lower sheet on the underlying pleated slow manifold. Again, the homoclinic nature of the dynamics can be seen in the phase space portrait in fig. 12b. Beyond this Sil'nikov type homo- clinic dynamics, the system visits a succession of periodic and chaotic regimes which are of- ten difficult to differentiate. We show in fig. 12c the time series of such a chaotic regime where a large amplitude relaxational oscillation is fol- lowed by an episode of from 3 to 5 small am- plitude (spiraling-out) oscillations. From the vi-
F. Argoul et al. / Homoclinic chaos in an electrochemical growth process 183
sual inspection of the corresponding phase por- trait in fig. 12d, one recovers the characteristic spiraling morphology [67,73] of the strange at- tractors encountered in nearly homoclinic situa- tions.
To conclude this section, we again stress the transient character of the behavior that has been analyzed here. Electrodeposition growth processes are markedly different from electro- oxidation experiments [75,76], which are re- ported elsewhere in this volume. The transitory character of the electrodeposition oscillations is intrinsic to a growth process and is related to the finite size of the reactor.
Our interpretation of the observed nonperi- odic dynamics in terms of Sil'nikov homoclinic orbits would be strengthened by a detailed com- parison with an amplitude equation model that retains the chemical and physical ingredients discussed in section 3. The development of such a model remains a challenge for the future.
5. Discussion
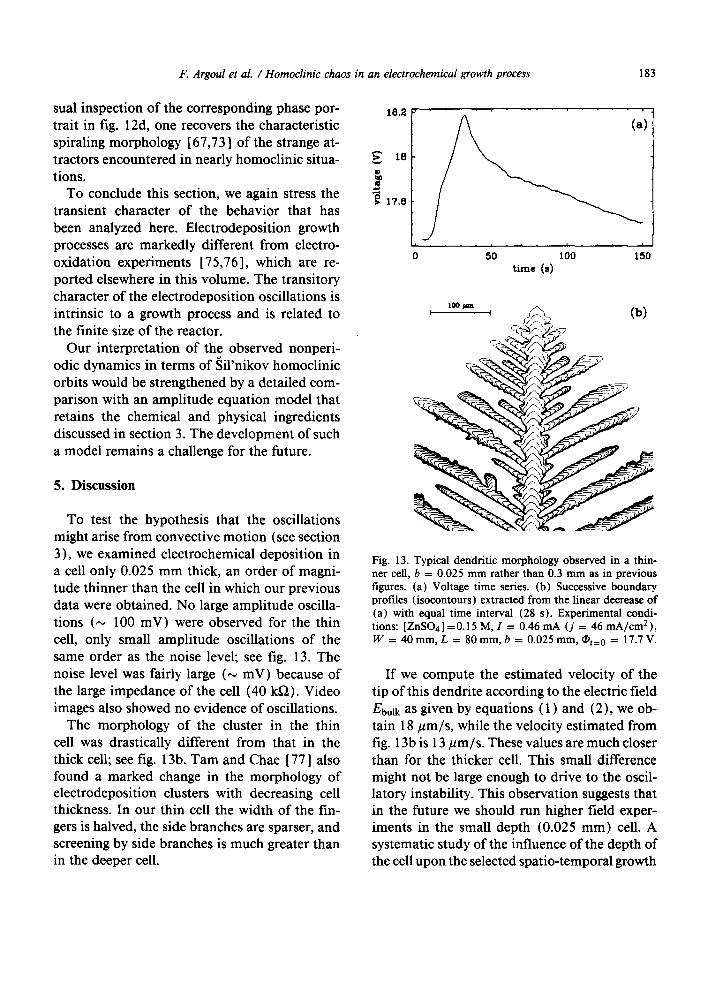
To test the hypothesis that the oscillations might arise from convective motion (see section 3), we examined electrochemical deposition in a cell only 0.025 mm thick, an order of magni- tude thinner than the cell in which our previous data were obtained. No large amplitude oscilla- tions (,~ 100 mV) were observed for the thin cell, only small amplitude oscillations of the same order as the noise level; see fig. 13. The noise level was fairly large (,-~ mV) because of the large impedance of the cell (40 kfl) . Video images also showed no evidence of oscillations.
The morphology of the cluster in the thin cell was drastically different from that in the thick cell; see fig. 13b. Tam and Chae [77] also found a marked change in the morphology of electrodeposition clusters with decreasing cell thickness. In our thin cell the width of the fin- gers is halved, the side branches are sparser, and screening by side branches is much greater than in the deeper cell.
18.2
18 @
u ~
,~ 17.8
. . . , . . . . . . . . . ,
(a)
. . . . . . . . . J . . . . .
0 50 100 150 time (s)
Fig. 13. Typical dendritic morphology observed in a thin- ner cell, b = 0.025 mm rather than 0.3 mm as in previous figures. (a) Voltage time series. (b) Successive boundary profiles (isocontours) extracted from the linear decrease of (a) with equal t ime interval (28 s). Experimental condi- tions: [ZnSO4] =0.15 M, I = 0.46 mA (j = 46 mA/cm2), W = 4 0 m m , L = 80mm, b -- 0.025 mm, @t=0 = 17.7 V.
If we compute the estimated velocity of the tip of this dendrite according to the electric field Ebutk as given by equations (1) and (2), we ob- tain 18/zm/s, while the velocity estimated from fig. 13b is 13/zm/s. These values are much closer than for the thicker cell. This small difference might not be large enough to drive to the oscil- latory instability. This observation suggests that in the future we should run higher field exper- iments in the small depth (0.025 mm) cell. A systematic study of the influence of the depth of the cell upon the selected spatio-temporal growth

184 F. Argoul et al. / Homoclinic chaos in an electrochemical growth process
regime seems to be a very promising strategy to get a better understanding of dendritic growth process in electrodeposition.
Another option to remove any convective mo- tion of the fluid consists in using gels. Whether physical or chemical, a gel must not perturb the reduction reaction by its adsorption on the electrodes. Before investigating the transport- limited (diffusion and migration) growth phe- nomena in gels, one would have to study the reduction kinetics on the electrodes when they are dipped in a gel to be certain that the reduc- tion process is not the rate-limiting process. The mobilities of anions and cations should also be determined. Such a study should provide signif- icant insights into oscillatory electrodeposition.
Acknowledgements
This work was supported by the Cen- tre des Etudes Spatiales under contrat (No. 91/CNES/0323), the Direction des Recherches Etudes et Techniques (DRET) under grant (No. 89/196) and NATO under grant (RG No. 900685). The work of H.L.S. and J.H. was sup- ported in part by the US Department of Energy Office of Basic Energy Sciences.
References
[ 1 ] W. Guttinger and D. Dangelmayr, eds., The Physics of Structure Formation (Springer, Berlin, 1987).
[2] H.E. Stanley and N. Ostrowsky, eds, Random Fluctuations and Pattern Growth (Kluwer, Dordrecht, 1988).
[3] J. Feder, Fractals (Pergamon, New York, 1988). [4] T. Vicsek, Fractal Growth Phenomena (World
Scientific, Singapore, 1989). [ 5 ] T. Witten and L.M. Sander, Phys. Rev. Lett. 47 ( 1981 )
1400; Phys. Rev. B 27 (1983) 5686. [6] B.B. Mandelbrot, The Fractal Geometry of Nature
(Freeman, New York, 1982). [7] P. Grassberger and I. Procaccia, Physica D 13 (1984)
34. [8] T.C. Halsey, M.H. Jensen, L.P. Kadanoff, I. Procaccia
and B.I. Shraiman, Phys. Rev. A 33 (1986) 1141. [9] P. Collet, J. Lebowitz and A. Porzio, J. Star. Phys. 47
(1987) 609.
[10] See for example T. Bohr and T. T~I, in: Directions in Chaos, vol. 2, ed. Hao Bai-Lin (World Scientific, Singapore, 1988); T. T61, Z. Naturforsch 43a (1988) 1154; R. Badii, Thesis, University of Zurich ( 1987).
[ 11 ] M.J. Feigenbaum, J. Stat. Phys. 46 ( 1987) 919 and 925. [ 12] L.M. Sander, in: Fractals in Physics, eds. L. Pietronero
and E. Tosati (North-Holland, Amsterdam, 1986). [ 13 ] P. Meakin and S. Havlin, Phys. Rev. A 36 ( 1987 ) 4428. [14] F. Argoul, A. Arneodo, G. Grasseau and H.L. Swinney,
Phys. Rev. Lett. 61 (1988) 2558. [15] F. Argoul, A. Arneodo, J. Elezgaray, G. Grasseau and
R. Murenzi, Phys. Lett. A 135 (1989) 327; Phys. Rev. A 41 (1990) 5537.
[16] A. Arneodo, F. Argoul, J. Elezgaray and G. Grasseau, in: Nonlinear Dynamics, ed. G. Turchetti (World Scientific, Singapore, 1989) p. 130.
[ 17 ] F. Argoul, A. Arneodo, J. Elezgaray and G. Grasseau, in: Measures of Complexity and Chaos, eds. N.B. Abraham, A.M. Albano, A. Passamante and P.E. Rapp (Plenum, New York, 1989) p. 433.
[18] P. Meakin, Phys. Rev. A 34 (1986) 710; 35 (1987) 2234.
[ 19 ] C. Amitrano, A. Coniglio and F. di Liberto, Phys. Rev. Lett. 57 (1986) 1016.
[20] P. Meakin, A. Coniglio, H. E. Stanley and T. A. Witten, Phys. Rev. A 34 (1986) 3325.
[21 ] Y. Hayakawa, S. Sato and M. Matsushita, Phys. Rev. A 36 (1987) 1963.
[22] J. Lee and H. E. Stanley, Phys. Rev. Lett. 61 (1988) 2945.
[23] J. Lee, P. Alstrom and H.E. Stanley, Phys. Rev. A 39 (1989) 6545.
[24] R.C. Ball and M. Blunt, Phys. Rev. A 39 (1989) 3591. [25] S. Ohta and H. Honjo, Phys. Rev. Lett. 60 (1988) 611. [26] M. Blunt and P. King, Phys. Rev. A 37 (1988) 3935. [27 ] F. Argoul and A. Arneodo, J. Phys. France 51 (1990)
2477. [28] F. Argoul, A. Arneodo, J. Elezgaray and H.L. Swinney,
in: Nonlinear Phenomena in Growth and Form, eds. M. Ben Amar, P. Pelc6 and P. Tabeling (Plenum, New York, 1990) p. 329.
[29] A.R. Despic and K. I. Popov, in: Modern Aspects of Electrochemistry, eds. B.E. Conway and J.O'M Bockris (Plenum, New York, 1972) p. 329.
[ 30] A.J. Bard and L. R. Faulkner, Electrochemical Methods, Fundamentals and Applications (Wiley, New York, 1980).
[31]R.M. Brady and R. C. Ball, Nature (London) 309 (1984) 225.
[32] M. Matsushita, M. Sano, Y. Hayakawa, H. Honjo and Y. Sawada, Phys. Rev. Lett. 53 (1984) 286.
[33] M. Matsushita, Y. Hayakawa and Y. Sawada, Phys. Rev. A 32 (1985) 3814.
[34] Y. Sawada, A. Doughterty and J. P. Gollub, Phys. Rev. Lett. 56 (1986) 1260.
[35] D.G. Grier, E. Ben-Jacob, R. Clarke and L. M. Sander, Phys. Rev. Lett. 56 (1986) 1264;
F. Argoul et al. /Homoclinic chaos in an electrochemical growth process 185
D.G. Grier, D.A. Kessler and L.M. Sander, Phys. Rev. Lett. 59 (1987) 2315.
[36] G.L.M.K.S. Kahanda and M. Tomkiewicz, J. Elec- trochem. Soc. 136 (1989) 1497.
[37] D.P. Barkey, R. H. Muller and C. W. Tobias, J. Electrochem. Soc. 136 (1989) 2199; 136 (1989) 2207.
[ 38 ] J.R. Melrose and D. B. Hibbert, Phys. Rev. A 40 ( 1989 ) 1727.
[39] F.W. Schlitter, G. Eichkorn and H. Fischer, Electro- chemical Acta 13 (1968) 2063.
[40 ] R.M. Suter and P. Wong, Phys. Rev. B 39 (1989) 4536. [41 ] D.G. Grier, K. Allen, R. S. Goldman, L. M. Sander and
R. Clarke, Phys. Rev. Lett. 64 (1990) 2152. [42] J.W. Diggle, A.R. Despic and J.O'M Bockris, J.
Electrochem. Soc. 116 (1969) 1503. [43 ] K.I. Popov, M.D. Maksimovi6, B.M. Ocokolji6 and B.J.
Lazarevi6, Surface Technology 11 (1980) 99. [44] J.-N. Chazalviel, Phys. Rev. A 42 (1990) 7355. [45] V. Fleury, J.-N. Chazalviel, M. Rosso and B. Sapoval,
J. Electroanal. Chem. 290 (1990) 249. [46] R. Bruinsma and S. Alexander, J. Chem. Phys. 92
(1990) 3074. [47] T.C. Halsey and M. Leibig, J. Chem. Phys. 92 (1990)
3756. [48] J. Guckenheimer and P. Holmes, Nonlinear Oscilla-
tions, Dynamical Systems and Bifurcations of Vector Fields (Springer, Berlin, 1984).
[49] P. Cvitanovic, ed., Universality in Chaos (Hilger, Bristol, 1984).
[50] P. Berg6, Y. Pomeau and C. Vidal, Order within Chaos (Wilej, New York, 1986).
[51] L.P. Sil'nikov, Soc. Math. Dokl. 6 (1965) 163; Math. USSR Sbornik 10 (1970) 91.
[52] A. Arneodo, P. Collet and C. Tresser, Comm. Math. Phys. 79 (1981) 573; J. Stat. Phys. 27 (1982) 171.
[53] A. Arneodo, P. Coullet, E.A. Spiegel and C. Tresser, Physica D 14 (1985) 327.
[54] P.A. Glendenning and C. Sparrow, J. Stat. Phys. 35 (1983) 645.
[ 55 ] P. Gaspard and G. Nicolis, J. Star. Phys. 31 ( 1983 ) 499. [56] P. Gaspard, R. Kapral and G. Nicolis, J. Stat. Phys. 35
(1984) 697. [57 ] V.G. Levich, Physiochemical Hydrodynamics (Pren-
tice Hall, London, 1962). [58] V. Fleury, M. Rosso, J.-N. Chazalviel and B. Sapoval,
Description of electrodeposition without supporting electrolyte in dense parallel regimes, Ann. Chim. ( 1991 ), to appear.
[59] N.H. Packard, J.P. Crutchfield, J.D. Farmer and R.S. Shaw, Phys. Rev. Lett. 45 (1980) 712.
[60] F. Takens, Leer. Notes Math. 898 (1981) 366. [61 ] H. Bai-Lin, ed., Chaos (World Scientific, Singapore,
1984); Chaos II (World Scientific, Singapore, 1990). [ 62 ] M.J. Feigenbaum, J. Stat. Phys. 19 ( 1978 ) 25; 21 ( 1979 )
669. [63] P. Coullet and C. Tresser, J. Phys. (Colloq. France) 39
(1978) C5; C. Tresser and P. Coullet, C.R. Acad. Sci. 287 (1978) 577.
[64] P. Coullet and J.P. Eckmann, Iterated Maps of an Interval as Dynamical Systems (Birkhauser, Boston, 1980).
[65 ] A.M. Fraser and H.L. Swinney, Phys. Rev. A 33 (1986) 1134.
[66] O.E. R6ssler, Ann. N.Y. Acad. Sci. 316 (1979) 376. [67] A. Arneodo, F. Argoul, J. Elezgaray and P. Richetti,
Homoclinic chaos in chemical systems, Physica D 62 (1992) 134, these Proceedings.
[68 ] C. Tresser, Thesis, University of Nice ( 1981 ); J. Phys. Paris 45 (1984) 837.
[69] J.C. Roux and H.L. Swinney, in: Nonequilibrium Dynamics in Chemical Systems, eds. C. Vidal and A. Pacault (Springer, Berlin, 1984) p. 124.
[70] A. Arneodo, F. Argoul, P. Richetti and J.C.Roux, in: Dynamical Systems and Environmental Models, eds. H.G. Bothe, W. Ebeling, A.M. Zurzhanski and M. Peschel (Akademie Verlag, Berlin, 1987) p. 122.
[71 ] F. Argoul, A. Arneodo, P. Richetti, J.C. Roux and H.L. Swinney, Acc. Chem. Res. 20 (1987) 436.
[72] O.E. R6ssler, Z. Naturforsch 31 a (1976) 259; Bull. Math. Biol. 39 (1977) 275.
[ 73 ] F. Argoul, A. Arneodo and P. Richetti, Phys. Lett. A 120 (1987) 269; in: Spatial Inhomogeneities and Transient Behavior in Chemical Kinetics, eds. P. Gray, G. Nicolis, F. Baras, P. Borckmans and S.K. Scott (Manchester University Press, 1990) p. 57.
[74] P. Richetti, Th~se d'Etat (Bordeaux, 1987). [75] K. Krischer, M. Liibke, M. Eiswirth, W. Wolf, J.L.
Hudson and G. Ertl, A hierarchy of transitions to mixed mode oscillations in an electrochemical system, Physica D 62 (1992) 123, these Proceedings. M. Schell, Sequences of mixed mode oscillations in electrochemical processes, Presented at this Workshop. W.Y. Tam and J.J. Chae, Phys. Rev. A 43 ( 1991 ) 4528.
[76]
[771