experimental design of fmri studies methods & models for fmri data analysis in neuroeconomics...
TRANSCRIPT
Experimental design of fMRI studies
Methods & models for fMRI data analysis in neuroeconomicsApril 2010
Klaas Enno Stephan
Laboratory for Social and Neural Systems ResearchInstitute for Empirical Research in EconomicsUniversity of Zurich
Functional Imaging Laboratory (FIL)Wellcome Trust Centre for NeuroimagingUniversity College London
With many thanks for slides & images to:
FIL Methods group, particularly Christian Ruff

Overview of SPM
Realignment Smoothing
Normalisation
General linear model
Statistical parametric map (SPM)Image time-series
Parameter estimates
Design matrix
Template
Kernel
Gaussian field theory
p <0.05
Statisticalinference
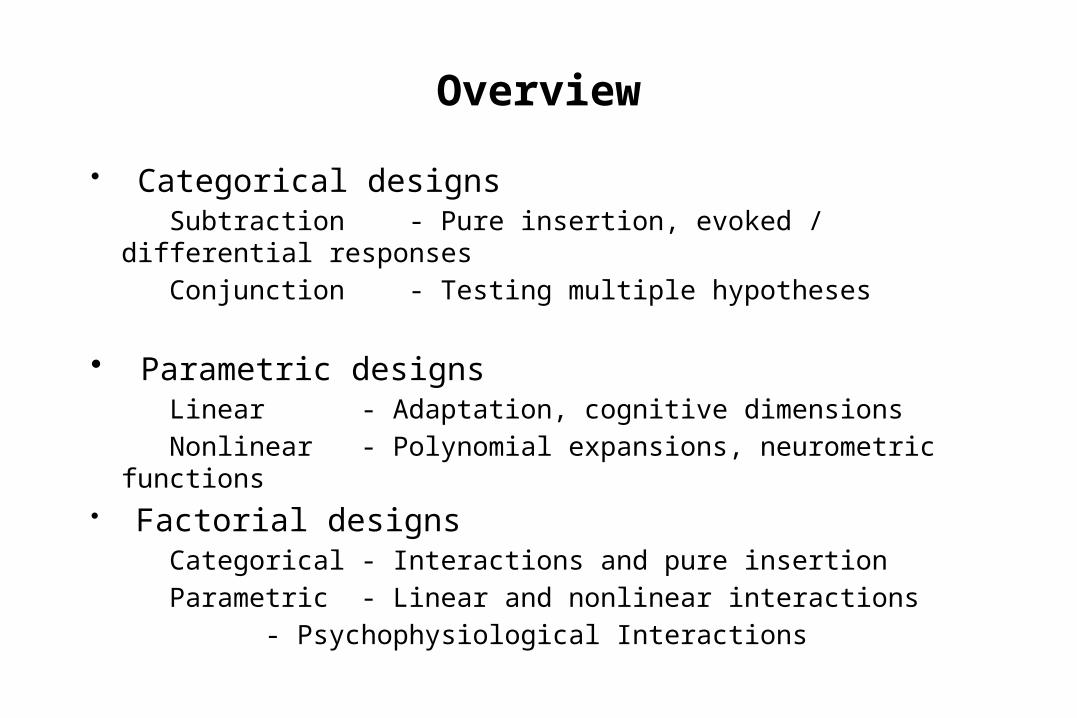
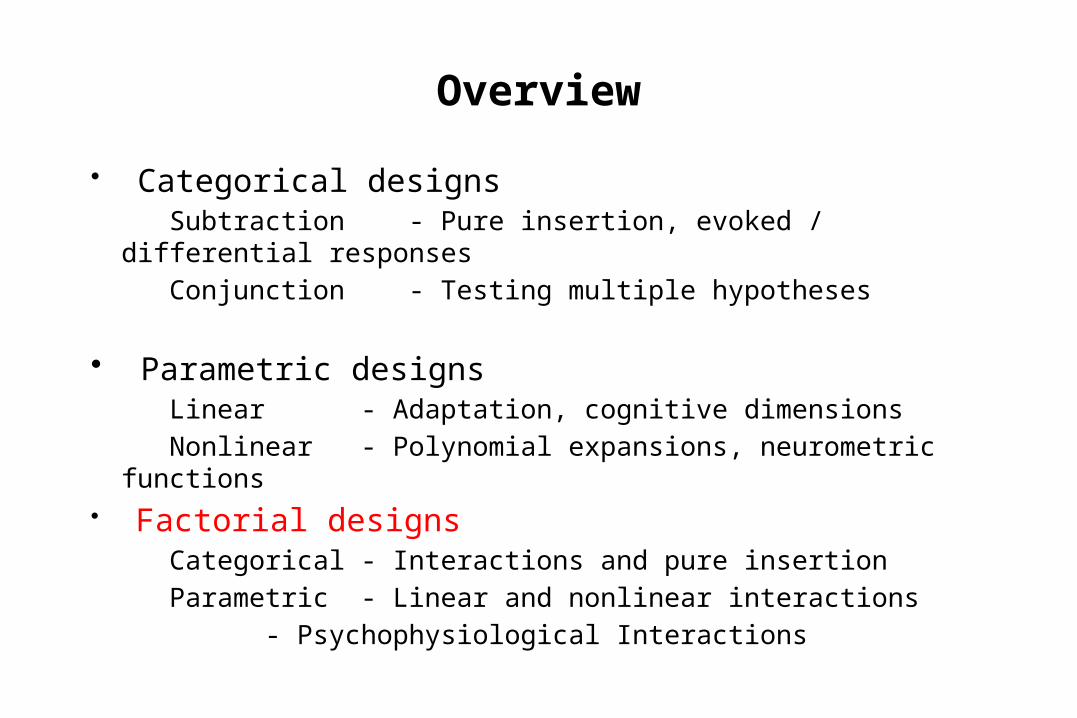
• Categorical designsSubtraction - Pure insertion, evoked / differential
responses
Conjunction - Testing multiple hypotheses
• Parametric designsLinear - Adaptation, cognitive dimensions
Nonlinear - Polynomial expansions, neurometric functions
• Factorial designsCategorical - Interactions and pure insertion
Parametric - Linear and nonlinear interactions
- Psychophysiological Interactions
Overview
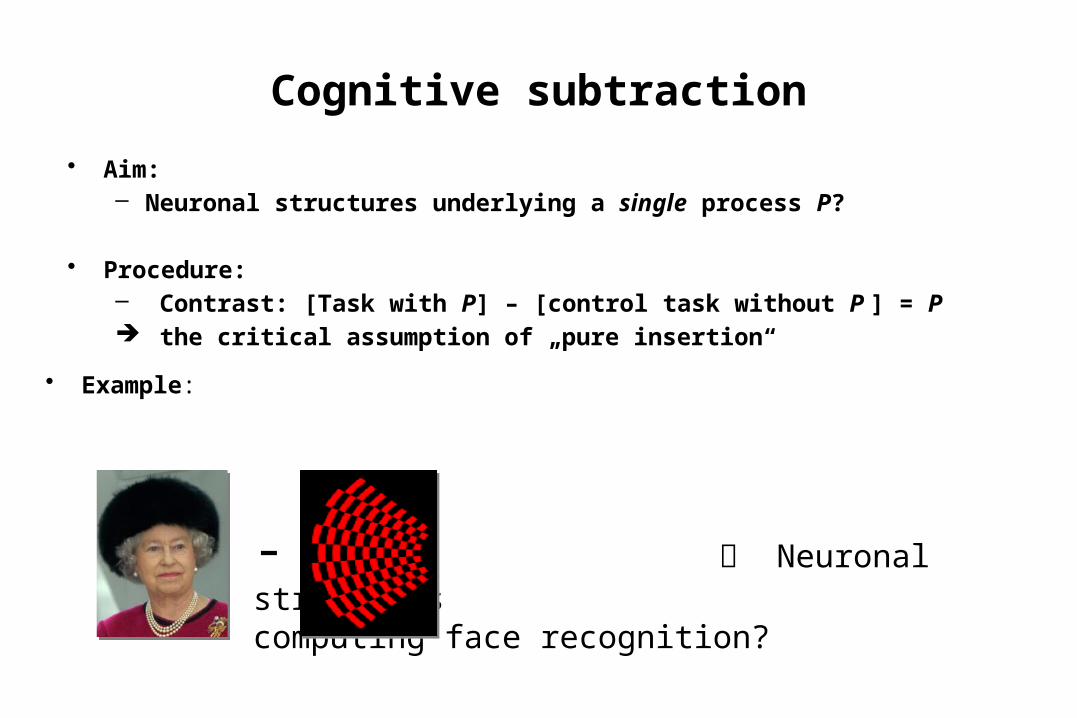
• Aim: – Neuronal structures underlying a single process P?
• Procedure: – Contrast: [Task with P] – [control task without P ] = P the critical assumption of „pure insertion“
- Neuronal structures computing face recognition?
• Example:
Cognitive subtraction
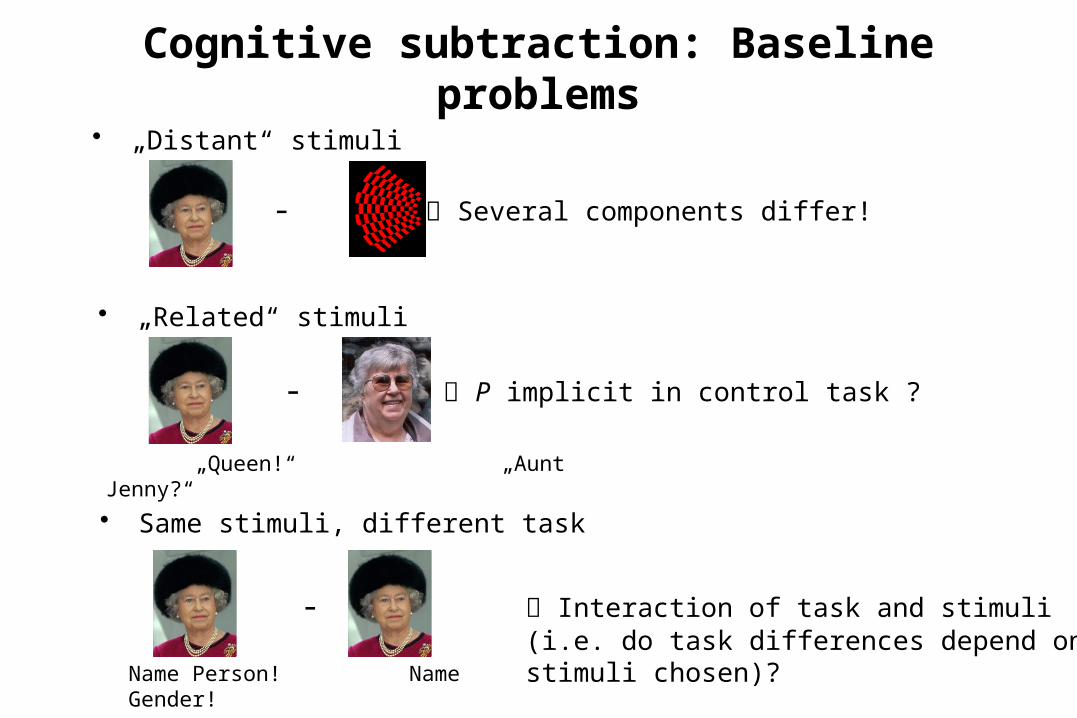
- P implicit in control task ?
„Queen!“ „Aunt Jenny?“
• „Related“ stimuli
- Several components differ!
• „Distant“ stimuli
Name Person! Name Gender!
- Interaction of task and stimuli (i.e. do task differences depend on stimuli chosen)?
• Same stimuli, different task
Cognitive subtraction: Baseline problems

Experimental design
Word generation GWord repetition R
R G R G R G R G R G R G
G - R = Intrinsic word generation
…under assumption of pure insertion
A categorical analysis

• Categorical designsSubtraction - Pure insertion, evoked / differential
responses
Conjunction - Testing multiple hypotheses
• Parametric designsLinear - Adaptation, cognitive dimensions
Nonlinear - Polynomial expansions, neurometric functions
• Factorial designsCategorical - Interactions and pure insertion
Parametric - Linear and nonlinear interactions
- Psychophysiological Interactions
Overview
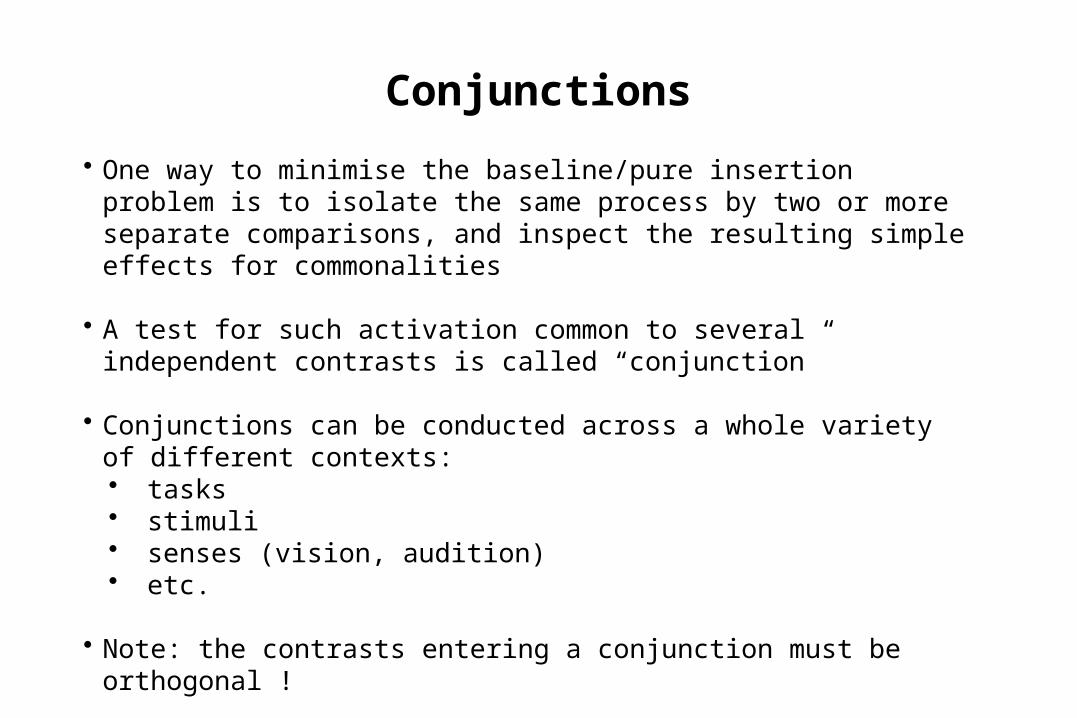
• One way to minimise the baseline/pure insertion problem is to isolate the same process by two or more separate comparisons, and inspect the resulting simple effects for commonalities
• A test for such activation common to several independent contrasts is called “conjunction”
• Conjunctions can be conducted across a whole variety of different contexts:• tasks• stimuli• senses (vision, audition)• etc.
• Note: the contrasts entering a conjunction must be orthogonal !
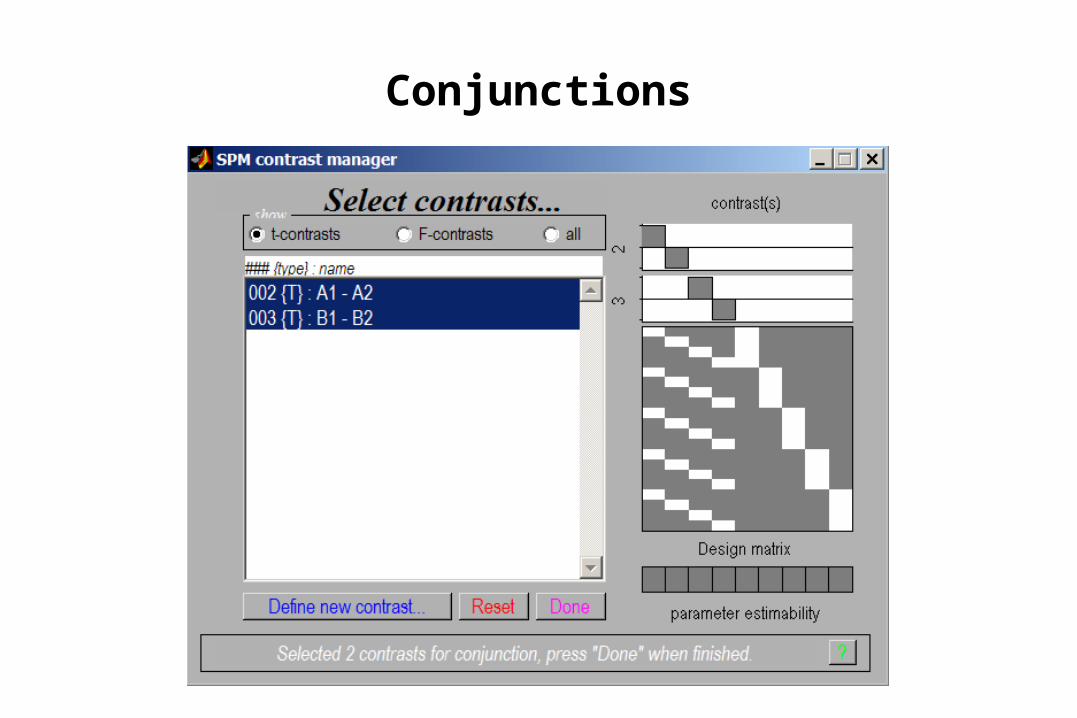
Conjunctions

Conjunctions
Example: Which neural structures support object recognition, independent of task (naming vs viewing)?
A1 A2
B2B1
Task (1/2)
Viewing Naming
Stim
uli (
A/B
)
Obj
ects
C
olou
rs
Visual Processing V Object Recognition RPhonological Retrieval P
Object viewing (B1) V,RColour viewing (A1) VObject naming (B2) P,V,RColour naming (A2) P,V
(Object - Colour viewing) [1 -1 0 0] &
(Object - Colour naming) [0 0 1 -1]
[ V,R - V ] & [ P,V,R - P,V ] = R & R = R
Price et al. 1997
Common object recognition response (R)
A1 B1 A2 B2
Conjunctions
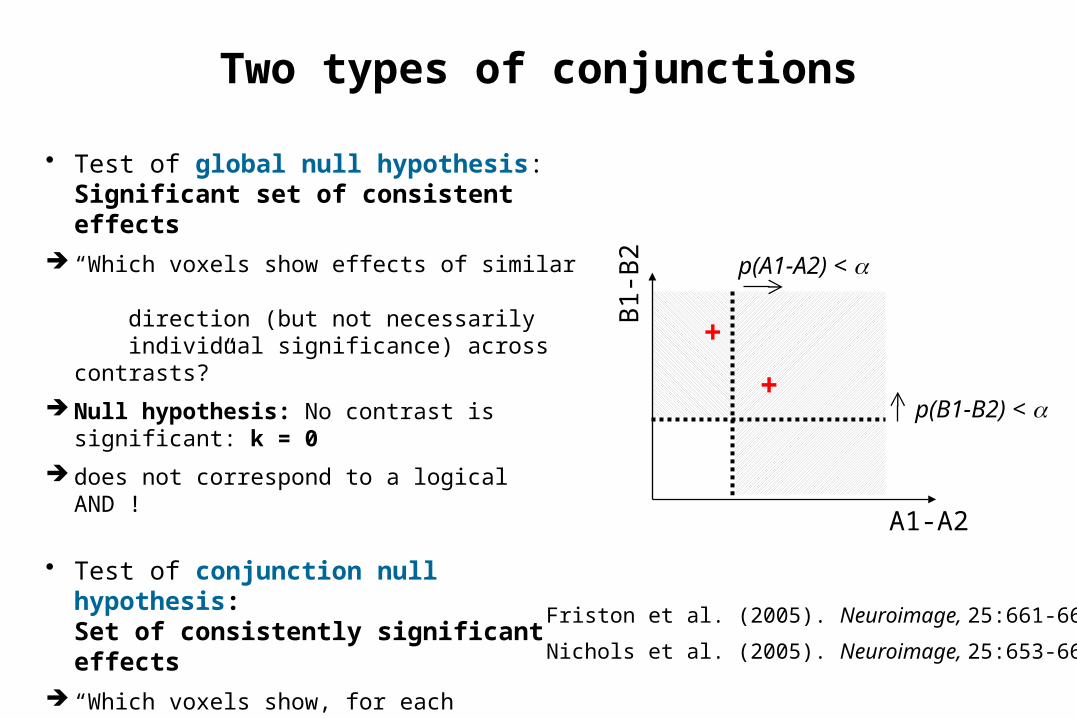
• Test of global null hypothesis: Significant set of consistent effects
“Which voxels show effects of similar direction (but not necessarily individual significance) across contrasts?”
Null hypothesis: No contrast is significant: k = 0
does not correspond to a logical AND !
• Test of conjunction null hypothesis: Set of consistently significant effects
“Which voxels show, for each specified contrast, significant effects?”
Null hypothesis: Not all contrasts are significant: k < n
corresponds to a logical AND
A1-A2
B
1-B
2 p(A1-A2) <
+p(B1-B2) <
+
Friston et al. (2005). Neuroimage, 25:661-667.
Nichols et al. (2005). Neuroimage, 25:653-660.
Two types of conjunctions

SPM offers both types of conjunctions
Friston et al. 2005, Neuroimage, 25:661-667.
specificity
sensitivity
Global null:k = 0
(or k<1)
Conjunction null:k < n
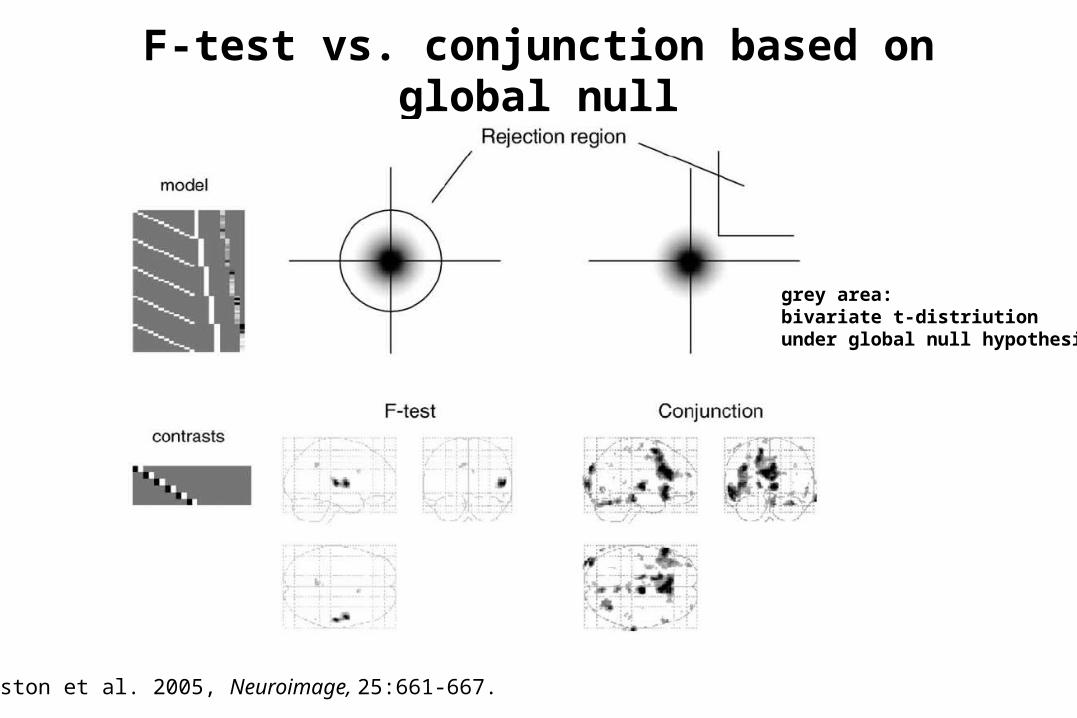
F-test vs. conjunction based on global null
Friston et al. 2005, Neuroimage, 25:661-667.
grey area:bivariate t-distriutionunder global null hypothesis

Using the conjunction null is easy to interpret, but can be very conservative
Friston et al. 2005, Neuroimage, 25:661-667.
• Categorical designsSubtraction - Pure insertion, evoked / differential
responses
Conjunction - Testing multiple hypotheses
• Parametric designsLinear - Adaptation, cognitive dimensions
Nonlinear - Polynomial expansions, neurometric functions
• Factorial designsCategorical - Interactions and pure insertion
Parametric - Linear and nonlinear interactions
- Psychophysiological Interactions
Overview
Parametric designs
• Parametric designs approach the baseline problem by:
– Varying the stimulus-parameter of interest on a continuum, in multiple (n>2) steps...
– ... and relating measured BOLD signal to this parameter
• Possible tests for such relations are manifold:• Linear• Nonlinear: Quadratic/cubic/etc. (polynomial expansion)• Model-based (e.g. predictions from learning models)
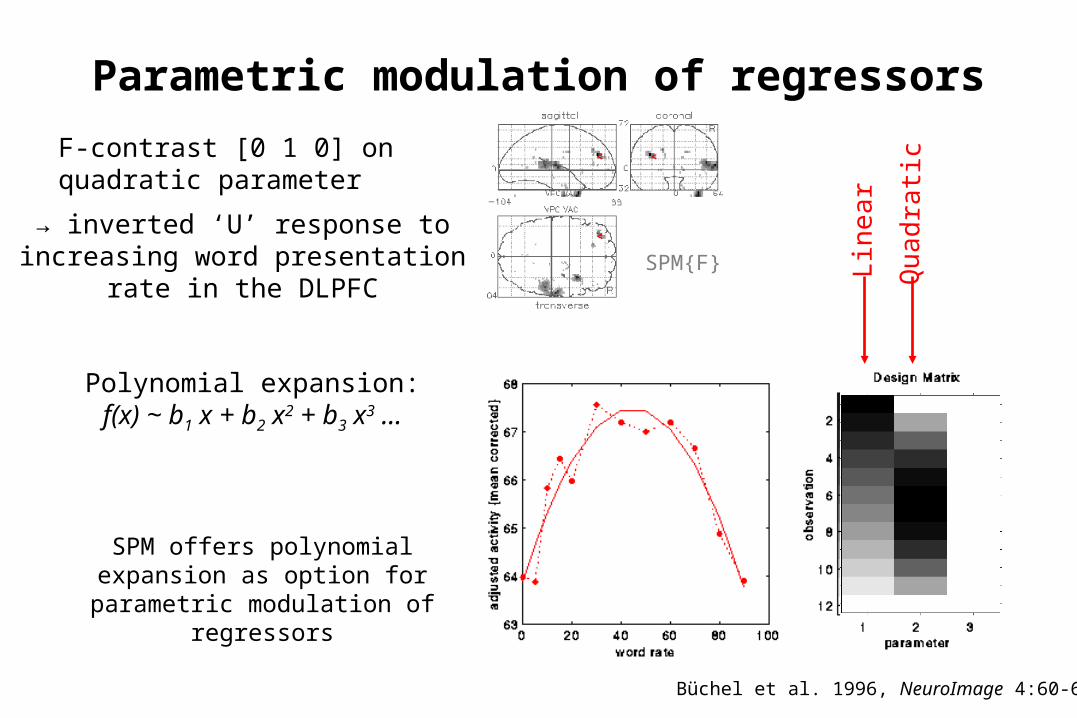
Parametric modulation of regressors
→ inverted ‘U’ response toincreasing word presentation
rate in the DLPFCSPM{F}
Polynomial expansion:f(x) ~ b1 x + b2 x2 + b3 x3 ...
Lin
ear
Qu
adr
atic
F-contrast [0 1 0] on quadratic parameter
SPM offers polynomial expansion as option for parametric modulation of
regressors
Büchel et al. 1996, NeuroImage 4:60-66

Parametric modulation of regressors by time
Büchel et al. 1998, NeuroImage 8:140-148
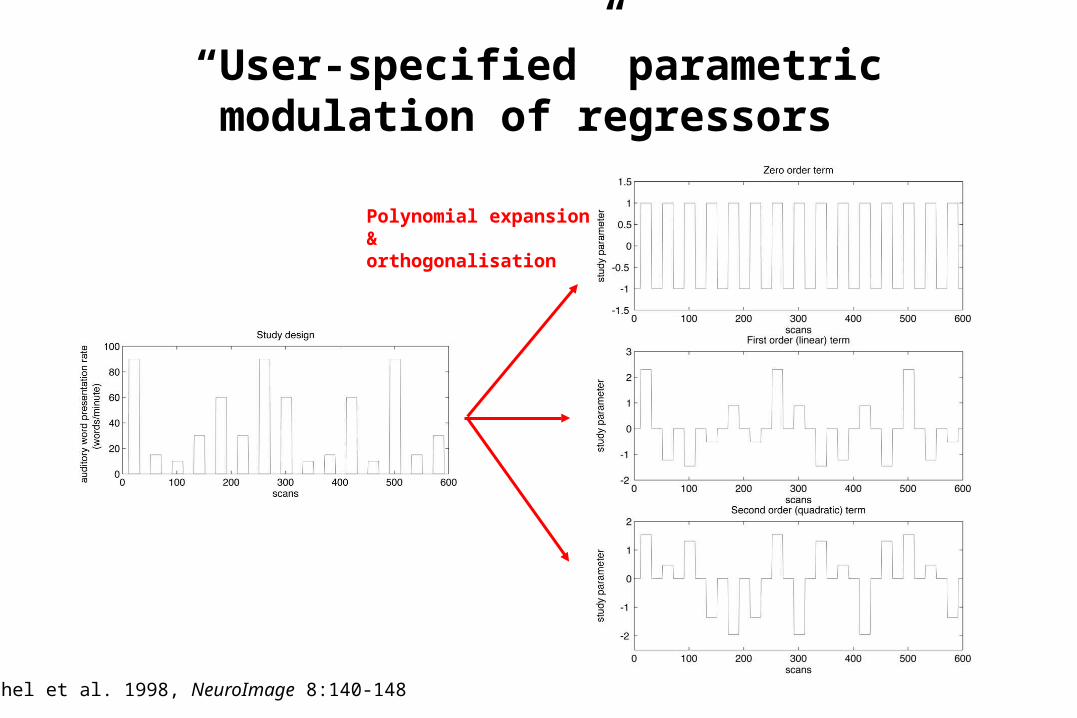
“User-specified” parametric modulation of regressors
Polynomial expansion&orthogonalisation
Büchel et al. 1998, NeuroImage 8:140-148
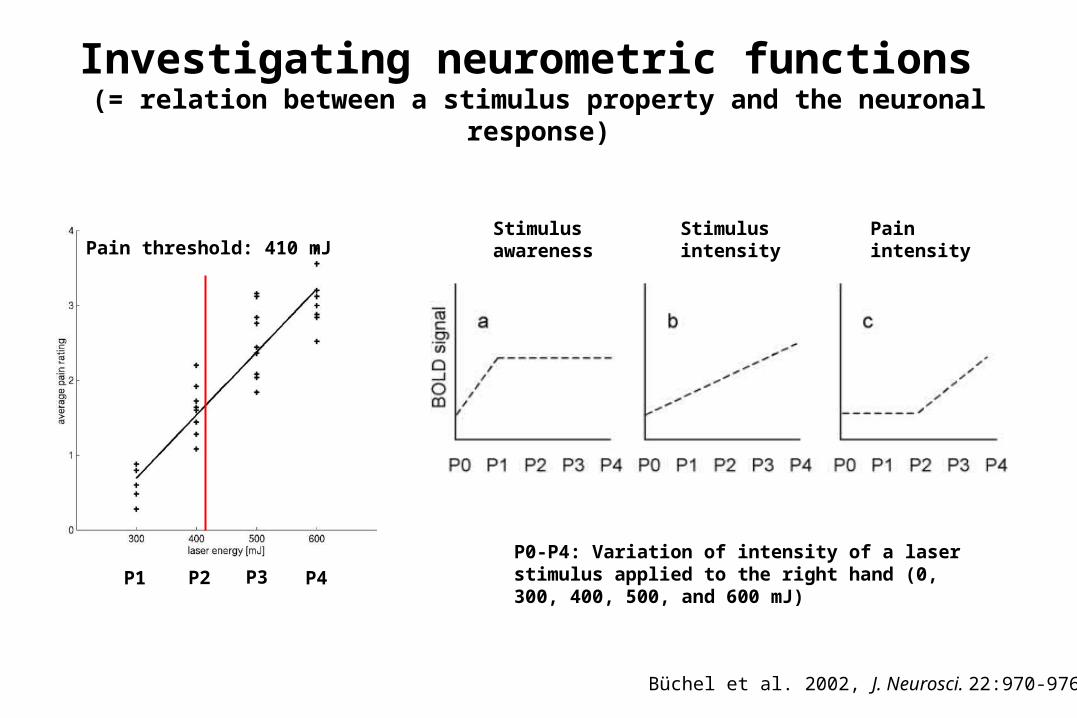
Investigating neurometric functions (= relation between a stimulus property and the neuronal
response)
Stimulusawareness
Stimulusintensity
PainintensityPain threshold: 410 mJ
P1 P2 P3 P4
P0-P4: Variation of intensity of a laser stimulus applied to the right hand (0, 300, 400, 500, and 600 mJ)
Büchel et al. 2002, J. Neurosci. 22:970-976

Neurometric functions
Stimulus presence
Pain intensity
Stimulus intensity
Büchel et al. 2002, J. Neurosci. 22:970-976

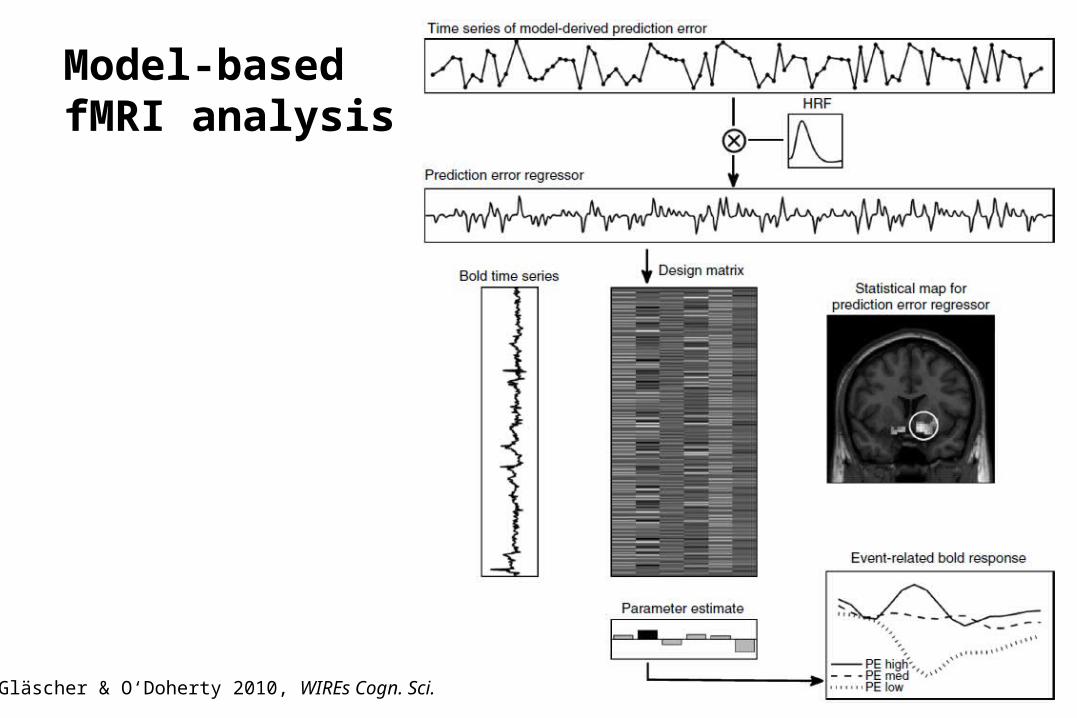
Model-based regressors
• general idea:generate predictions from a computational model, e.g. of learning or decision-making
• Commonly used models:– Rescorla-Wagner learning model– temporal difference (TD) learning model– Bayesian learners
• use these predictions to define regressors
• include these regressors in a GLM and test for significant correlations with voxel-wise BOLD responses

Model-based fMRI analysis
Gläscher & O‘Doherty 2010, WIREs Cogn. Sci.
Model-based fMRI analysis
Gläscher & O‘Doherty 2010, WIREs Cogn. Sci.
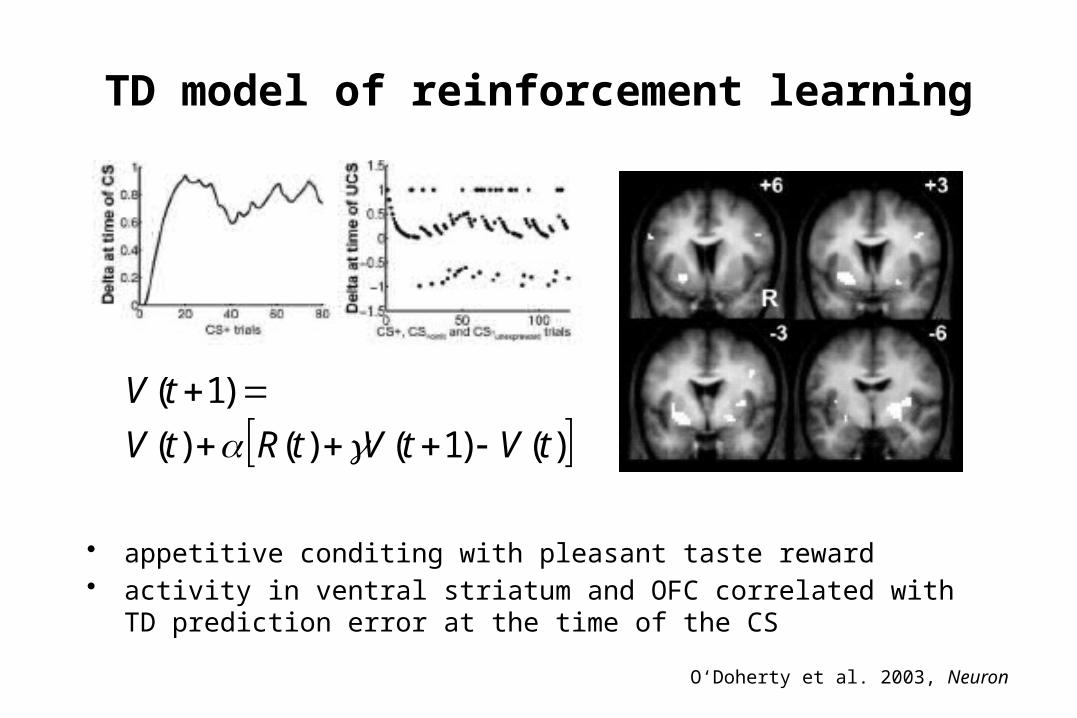
TD model of reinforcement learning
• appetitive conditing with pleasant taste reward• activity in ventral striatum and OFC correlated with TD prediction error at
the time of the CS
O‘Doherty et al. 2003, Neuron
)()1()()(
)1(
tVtVtRtV
tV
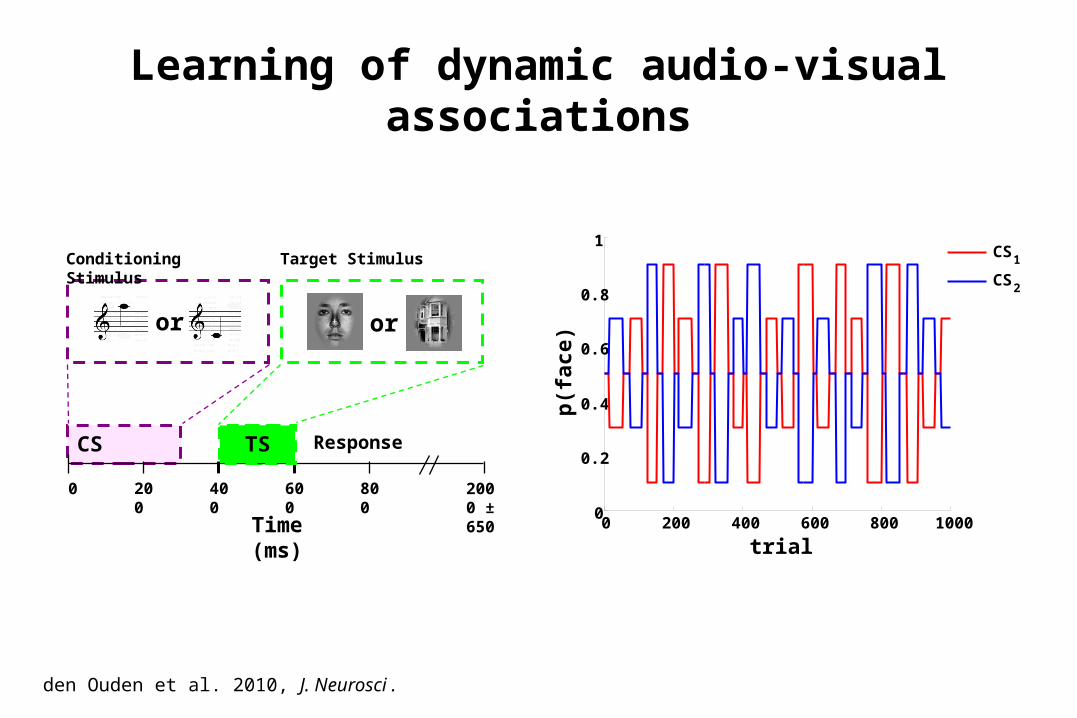
Learning of dynamic audio-visual associations
CS Response
Time (ms)
0 200 400 600 800 2000 ± 650
or
Target StimulusConditioning Stimulus
or
TS
0 200 400 600 800 10000
0.2
0.4
0.6
0.8
1
p(f
ace)
trial
CS1
CS2
den Ouden et al. 2010, J. Neurosci .
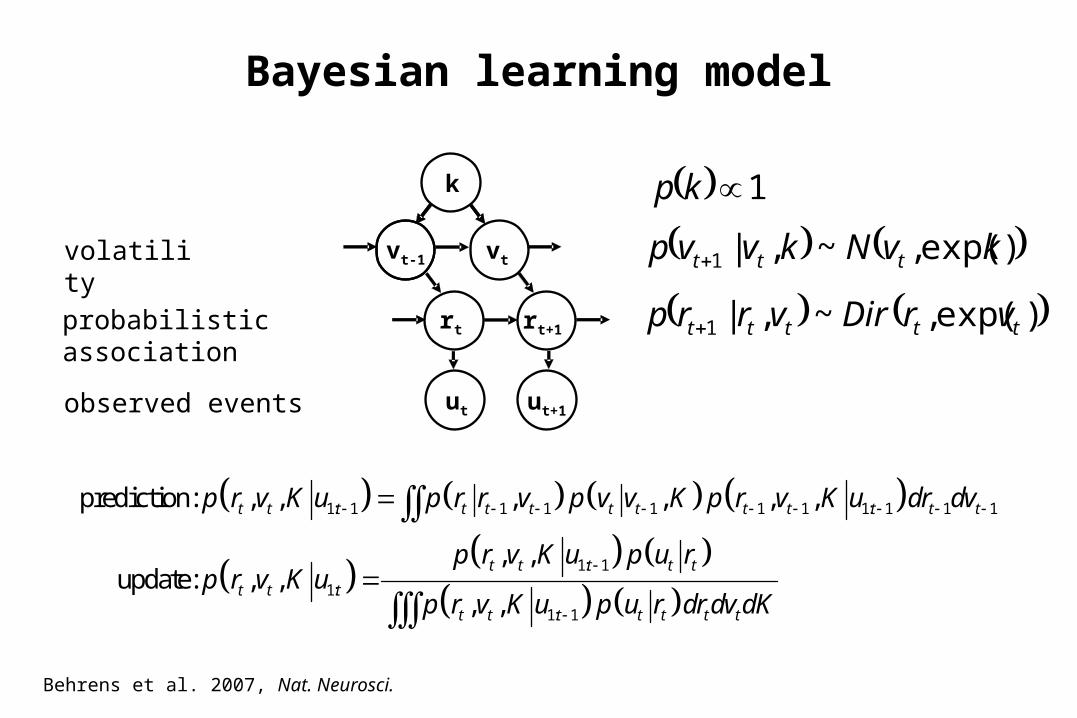
Bayesian learning model
observed events
probabilistic association
volatility
k
vt-1 vt
rt rt+1
ut ut+1
)exp(,~,|1 ttttt vrDirvrrp
)exp(,~,|1 kvNkvvp ttt
1kp
1: 1 1 1 1 1 1 1: 1 1 1
1: 1
1:
1: 1
prediction: , , , , , ,
, ,update: , ,
, ,
t t t t t t t t t t t t t
t t t t t
t t t
t t t t t t t
p r v K u p r r v p v v K p r v K u dr dv
p r v K u p u rp r v K u
p r v K u p u r dr dv dK
Behrens et al. 2007, Nat. Neurosci.

400 440 480 520 560 600
trial
CS1volatilitytarget
400 440 480 520 560 6000
0.2
0.4
0.6
0.8
1
p(F
|CS
)
trial
CS1CS2
100 200 300 400 500
10
20
30
40
50
60
70
80100 200 300 400 500
5
10
15
20
25
30
35
40
45
50
po
ster
ior
pd
f
Probability Volatility
po
ster
ior
pd
f

Putamen Premotor cortex
Stimulus-independent prediction error
p < 0.05 (SVC)
p < 0.05 (cluster-level whole- brain corrected)
p(F) p(H)-2
-1.5
-1
-0.5
0
BO
LD
re
sp.
(a.u
.)
p(F) p(H)-2
-1.5
-1
-0.5
0
BO
LD
re
sp.
(a.u
.)
den Ouden et al. 2010, J. Neurosci .
• Categorical designsSubtraction - Pure insertion, evoked / differential
responses
Conjunction - Testing multiple hypotheses
• Parametric designsLinear - Adaptation, cognitive dimensions
Nonlinear - Polynomial expansions, neurometric functions
• Factorial designsCategorical - Interactions and pure insertion
Parametric - Linear and nonlinear interactions
- Psychophysiological Interactions
Overview

Main effects and interactions
A1 A2
B2B1
Task (1/2)Viewing Naming
Stim
uli (
A/B
)
Obj
ects
Col
ours
Colours Objects Colours Objects
interaction effect (Stimuli x Task)
Viewing Naming
• Main effect of task: (A1 + B1) – (A2 + B2)
• Main effect of stimuli: (A1 + A2) – (B1 + B2)
• Interaction of task and stimuli: Can show a failure of pure insertion
(A1 – B1) – (A2 – B2)

Example: evidence for inequality-aversion
Tricomi et al. 2010, Nature
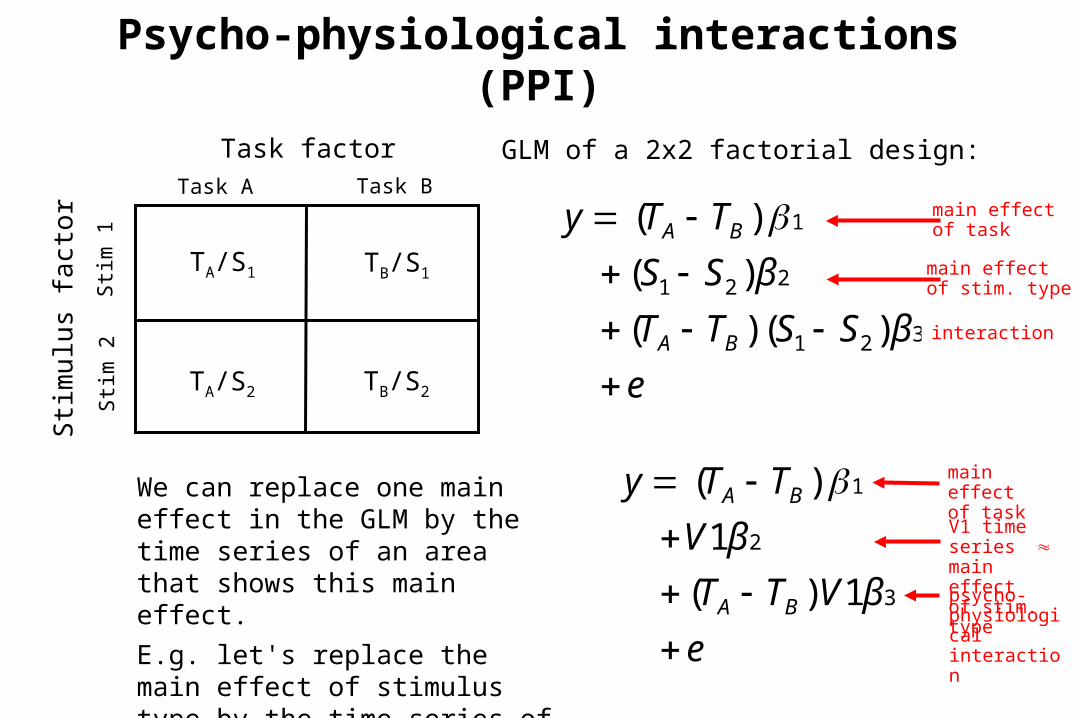
Psycho-physiological interactions (PPI)
We can replace one main effect in the GLM by the time series of an area that shows this main effect.
E.g. let's replace the main effect of stimulus type by the time series of area V1:
Task factorTask A Task B
Sti
m 1
Sti
m 2
Sti
mu
lus
fact
or
TA/S1 TB/S1
TA/S2 TB/S2
e
βVTT
βV
TT y
BA
BA
3
2
1
1 )(
1
)(
e
βSSTT
βSS
TT y
BA
BA
321
221
1
)( )(
)(
)(
GLM of a 2x2 factorial design:
main effectof task
main effectof stim. type
interaction
main effectof taskV1 time series main effectof stim. typepsycho-physiologicalinteraction

PPI example: attentional modulation of V1→V5
attention
no attention
V1 activity
V5 a
ctiv
ity
SPM{Z}
time
V5 a
ctiv
ity
Friston et al. 1997, NeuroImage 6:218-229Büchel & Friston 1997, Cereb. Cortex 7:768-778
V1
V1 x Att.
=
V5
V5
Attention
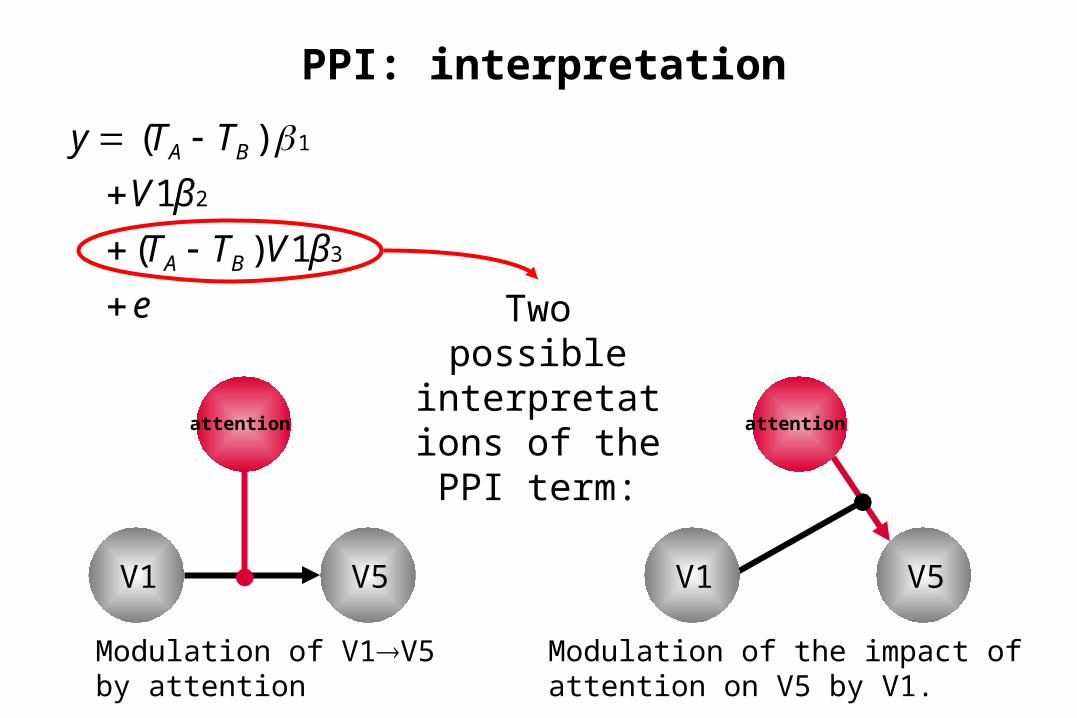
PPI: interpretation
Two possible interpretations of the PPI
term:
V1
Modulation of V1V5 by attention
Modulation of the impact of attention on V5 by V1.
V1 V5 V1
V5
attention
V1
attention
e
βVTT
βV
TT y
BA
BA
3
2
1
1 )(
1
)(

Thank you