expansionary fiscal contractions: re{evaluating the danish casehutch/expansionaryfiscal... · ·...
TRANSCRIPT
Expansionary Fiscal Contractions:
Re–evaluating the Danish Case
U. Michael Bergman∗ Michael M. Hutchison†
May 18, 2009
Abstract
The Expansionary Fiscal Contraction (EFC) hypothesis predicts that a majorfiscal consolidation leads to an economic expansion under certain circumstances. Wetest this hypothesis, and the implied non–linear responses of the economy to large andsmall changes in fiscal policy, using data from the 1983 Danish fiscal reform. We usea structural VAR/event study methodology following Blanchard and Perotti (2002)that explicitly allows us to distinguish between normally marginal changes in fiscalpolicy and comprehensive fiscal reforms. We find that “marginal changes” in fiscalpolicy (expenditure and tax changes) have the expected Keynesian effects on outputand consumption. However, we find no evidence that the large fiscal consolidationin Denmark slowed the economy after controlling for a host of exogenous shocksand business cycle effects: Rather, we find some support for the hypothesis that theexogenous fiscal contraction in Denmark was a credible regime shift and, togetherwith other reforms undertaken at the time, increased both private consumption andaggregate output.
Keywords: Expansionary fiscal contraction; structural VAR/event study; non–linearitiesJEL Classification Numbers: E21, E62, E65.
∗Department of Economics, University of Copenhagen, Studiestræde 6, DK–1455, Copenhagen K, Den-mark. Email: [email protected]
†Department of Economics, University of California, Santa Cruz, CA 95064. Email: [email protected] thank an anonymous referee and the editors of this journal for useful comments, Ninette PilegaardHansen and Dan Knudsen for data assistance, and Danmarks Nationalbank for generously providing thedata.
1
1 Introduction
The prospect of a fiscal contraction typically raises well–founded fears among policymakers
— based on conventional macroeconomic analysis — over the likely recessionary conse-
quences. This concern, for example, is widespread in France, Germany and elsewhere in
Europe as EMU members struggle to meet the budget deficit limits of the Stability and
Growth Pact. In theory, however, a major fiscal contraction which leads to the expec-
tation of permanently lower future paths of government consumption and taxation could
in some circumstances be expansionary. This non–Keynesian prediction has been termed
the ‘expansionary fiscal contraction hypothesis’ (EFC) (Giavazzi and Pagano (1990)) and
often characterized as the ‘German view’ in light of statements by the German Council of
Economic Experts in the early 1980s that fiscal retrenchment should set the foundation
for an economic expansion.1
Non–linearities in fiscal response functions or “trigger points” associated with large
stabilizations are discussed by Blanchard (1987), Bertola and Drazen (1993), Sutherland
(1997), Barry (1999), Perotti (1999), Giavazzi, Jappell and Pagano (2000) and others. The
basic argument is that large fiscal consolidations lead to a revision in expectations about
the future tax burden — future taxes are expected to be lower which in turn signals a rise
in the present discounted value of wealth — and may also induce a supply–side response
if taxes are distortionary. A key issue in this context is that the fiscal consolidation is
viewed as credible and the reform will be followed systematically. By contrast, if the fiscal
contraction does not lead to the expectation of significantly lower permanent government
consumption expenditure levels, then the conventional negative aggregate demand effect
1Recent ‘New Keynesian’ models with price stickiness also predict that increases in government con-sumption financed by lump–sum taxation have negative effects on private consumption (Canzoneri, Cumbyand Diba (2003) and Linnemann and Schabert (2003)). The argument is that government spending tendsto reduce private wealth and thereby reduce the demand for private consumption. Linnemann and Sch-abert (2004) show, however, that the standard Keynesian effect re–emerges within these models if theelasticity of substitution between government and private consumption is low.
2

may dominate. In this sense, there may be non–linearities in the response of the economy
to particularly large (signifying a regime shift) and persistence changes in fiscal policy as
contrasted with the effects of fiscal policy during normal circumstances.
In this context, the large Danish fiscal contraction that was announced in October 1982
with the formation of a new coalition government, and implemented in stages between
1983 and 1986, is a fascinating case study that has attracted considerable international
attention for several reasons (e.g. Alesina and Perotti (1996,1997), Barry and Devereux
(1994,1995,2003), Bergman and Hutchison (1999) and Bertola and Drazen (1993)). Firstly,
the Danish ‘consolidation’ was substantial and broad reaching in that it covered public
sector spending, public sector wages, taxes and other features (see appendix A). It was
also the most successful budget consolidation experienced in the OECD area to date.
The actual budget deficit improved by 12.5 percent of GDP and the structural (cyclically
adjusted) deficit improved by 9.5 percent of GDP over the three–year fiscal consolidation
period. The actual budget position (structural budget position) was −9.1 percent (−8.1
percent) of GDP in 1982 — the year prior to the fiscal consolidation — and 3.4 percent
(1.4 percent) during the last year of the consolidation in 1986.
Secondly, the economy experienced very strong output and consumption growth and a
substantial reduction in unemployment during this period that provides prima facie evi-
dence of a ‘expansionary fiscal contraction.’ Real GDP and consumption growth averaged
3.7 and 4.0 percent, respectively, during 1984–86 — the fastest growth period in Denmark
since the 1960s. Unemployment also declined by 2.2 percentage points during the period.
Thirdly, the economy’s strong performance was totally unexpected. It was widely an-
ticipated that the fiscal contraction measures would have a significant adverse short run
effect on the economy in line with standard Keynesian predictions. The Council of Eco-
nomic Advisors in Denmark revised sharply downward (upward) their forecasts of output
and consumption (unemployment) following the announcement of the economic package
3
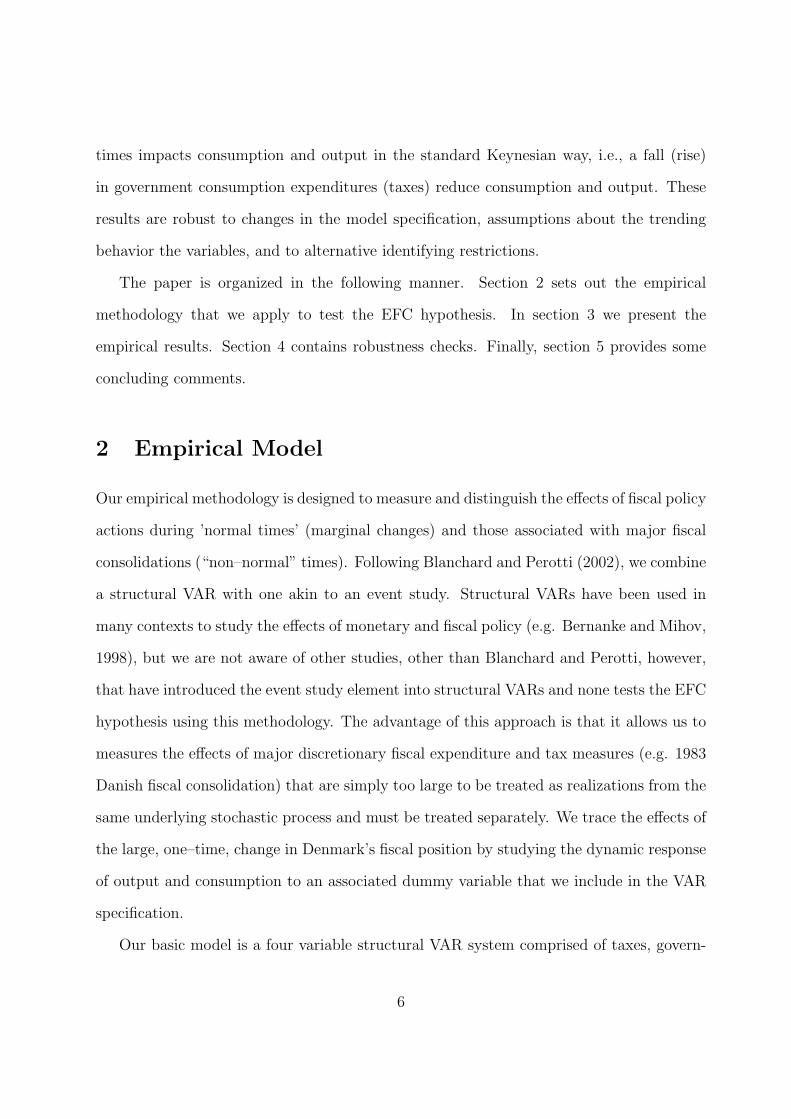
leading to fiscal austerity measures in late 1982. In particular, as shown in panel A of
Table 1, the forecast for 1984 real GDP and consumption growth were revised downward
by 1.7 percent and 0.6 percent respectively between October 1982 and May 1983. The un-
employment forecast was increased by 1.5 percentage points. What actually occurred was,
of course, quite different and the official forecasts greatly underestimated positive develop-
ments in the economy during 1984–86. Panel B, for example, shows that the year–ahead
official forecasts (published in May 1983, November 1984 and December 1985) cumula-
tively underestimated GDP growth by 3.4 percent and consumption growth by 4.3 percent
during 1984–86. Similarly, the official forecasts systematically overestimated the level of
unemployment during this period. The economy was very strong by historical standards
and moving in the opposite direct of what had been anticipated.
Empirical work supporting the EFC hypothesis and finding non–linearities include
Alesina and Perotti (1995) Perotti (1999), Giavazzi, Jappelli and Pagano (2000) and
Hoppner and Wesche (2000).2 This view has not gone unchallenged for the Danish case,
however. Andersen and Risager (1990,1991) and Andersen (1994), for example, postulate
another hypothesis for Denmark, based primarily on the idea that the decline in gov-
ernment spending was concentrated on non–tradable goods which in turn depressed real
wages and increased international competitiveness. Similarly, Bergman and Hutchison
(1999) find some support for the EFC hypothesis for Denmark, but attribute most of the
rise in consumption at the time to a favorable terms–of–trade development and other fac-
tors increasing permanent income. Other explanations such as lower real interest rates
associated with the adoption of a ‘hard currency regime’ have also been put forward as
2However, van Aarle and Garretsen (2003) focusing on EU countries and using the Giavazzi and Paganomethodology found no strong evidence in favor of EFC. Hjelm (2002), using panel data regressions, rejectsthe EFC hypothesis. A common result in the literature focusing on the general effects of fiscal policyis that government consumption tends to crowd in output (and private consumption), see e.g., Perotti(2004). For an excellent survey of the literature on the effectiveness of fiscal policy as well as on the EFChypothesis, see Hemming, Kell and Mahfouz (2002).
4

alternatives to the ‘German view’ of the unexpected expansions in Denmark and elsewhere
following fiscal contractions.
In this paper, we develop a precise test of the EFC explanation that emphasizes non–
linearities in the response to the 1983 Danish fiscal reform. The innovation of our paper is to
view the Danish fiscal reform as a particular historical event, contrasting the comprehensive
government expenditure and tax changes of the reform as analytically distinct from the
normally marginal changes in fiscal policy. This allows for a structural break and inherent
non–linearities in the response of the economy to the fiscal reform in Denmark. Our
“event study” approach, with the Danish fiscal reform as the centerpiece, is an extension
of the Blanchard and Perotti (2002) structural VAR time–series event study statistical
methodology.
Furthermore, as opposed to the earlier literature focusing on a cross–section of countries,
we focus intensively on one episode. In their survey of the EFC literature, Hemming,
Kell and Mahfouz (2002) write: “While these studies differ in terms of their samples and
methodology, the approach adopted is broadly the same. Each study subjects a cross
section of fiscal consolidation periods over a 10–35 year period to analysis with a view
to identifying those with expansionary effects on activity, isolating the channels through
which they occur, and describing some of their characteristics” (p. 22). By contrast, we
focus our attention intensively on the Danish experience using a structural VAR/event
study method.
Using this methodology, we are able to distinguish between a “normal” change in gov-
ernment consumption expenditures and taxes as opposed to a major policy action directed
towards a significant and long–lasting fiscal consolidation such as that assumed by the
EFC. We find that the 1983 Danish fiscal consolidation led to both a consumption and
output boom as well as a large swing in the budget from deficit to surplus. This supports
the EFC hypothesis. The model also suggests, however, that fiscal policy during “normal”
5
times impacts consumption and output in the standard Keynesian way, i.e., a fall (rise)
in government consumption expenditures (taxes) reduce consumption and output. These
results are robust to changes in the model specification, assumptions about the trending
behavior the variables, and to alternative identifying restrictions.
The paper is organized in the following manner. Section 2 sets out the empirical
methodology that we apply to test the EFC hypothesis. In section 3 we present the
empirical results. Section 4 contains robustness checks. Finally, section 5 provides some
concluding comments.
2 Empirical Model
Our empirical methodology is designed to measure and distinguish the effects of fiscal policy
actions during ’normal times’ (marginal changes) and those associated with major fiscal
consolidations (“non–normal” times). Following Blanchard and Perotti (2002), we combine
a structural VAR with one akin to an event study. Structural VARs have been used in
many contexts to study the effects of monetary and fiscal policy (e.g. Bernanke and Mihov,
1998), but we are not aware of other studies, other than Blanchard and Perotti, however,
that have introduced the event study element into structural VARs and none tests the EFC
hypothesis using this methodology. The advantage of this approach is that it allows us to
measures the effects of major discretionary fiscal expenditure and tax measures (e.g. 1983
Danish fiscal consolidation) that are simply too large to be treated as realizations from the
same underlying stochastic process and must be treated separately. We trace the effects of
the large, one–time, change in Denmark’s fiscal position by studying the dynamic response
of output and consumption to an associated dummy variable that we include in the VAR
specification.
Our basic model is a four variable structural VAR system comprised of taxes, govern-
6

ment consumption, output and private consumption. This system allows us to analyze the
dynamic responses of both output and private consumption — the key elements needed to
test the EFC hypothesis — to shocks in taxes and government consumption during normal
times. In a robustness test, we also extend the basic model by including the terms of trade
since external factors have been considered by many as an important explanation for the
boom in the Danish economy during the fiscal consolidation (e.g. Andersen and Risager,
1990).
We initially focus on taxes, government consumption, output and private consumption
during “normal” times (and later introduce the dummy variable capturing “non–normal”
times) and assume that these variables are generated by the following VMA system
∆xt = δ + R (L) υt (1)
where xt =
[Tt Gt Yt Ct
]′, where L is the lag operator. All variables are in logarithms
and are measured in real per capita terms. The structural shocks υt =
[ψT ψG ψY ψC
]′
satisfies E[υt] = 0, and E[υtυ′t] is diagonal, where ψi is tax, government spending, income,
and private consumption shocks respectively. The parameters in the lag polynomial R (L)
can be computed from estimates of the following VMA model
∆xt = δ + C(L)εt (2)
where C(L) = I4+∑∞
j=1 CjLj, and the four dimensional vector of innovations εt is assumed
to be a white noise sequence with E[εt] = 0 and a nonsingular covariance matrix E[εtε′t] = Σ.
The basic problem is to identify the structural innovations υt in (1) as linear combinations
of the reduced form disturbances εt in (2), i.e., to find a matrix F such that υt = F−1εt.
To identify our system, we follow the procedure suggested by Blanchard and Perotti
7
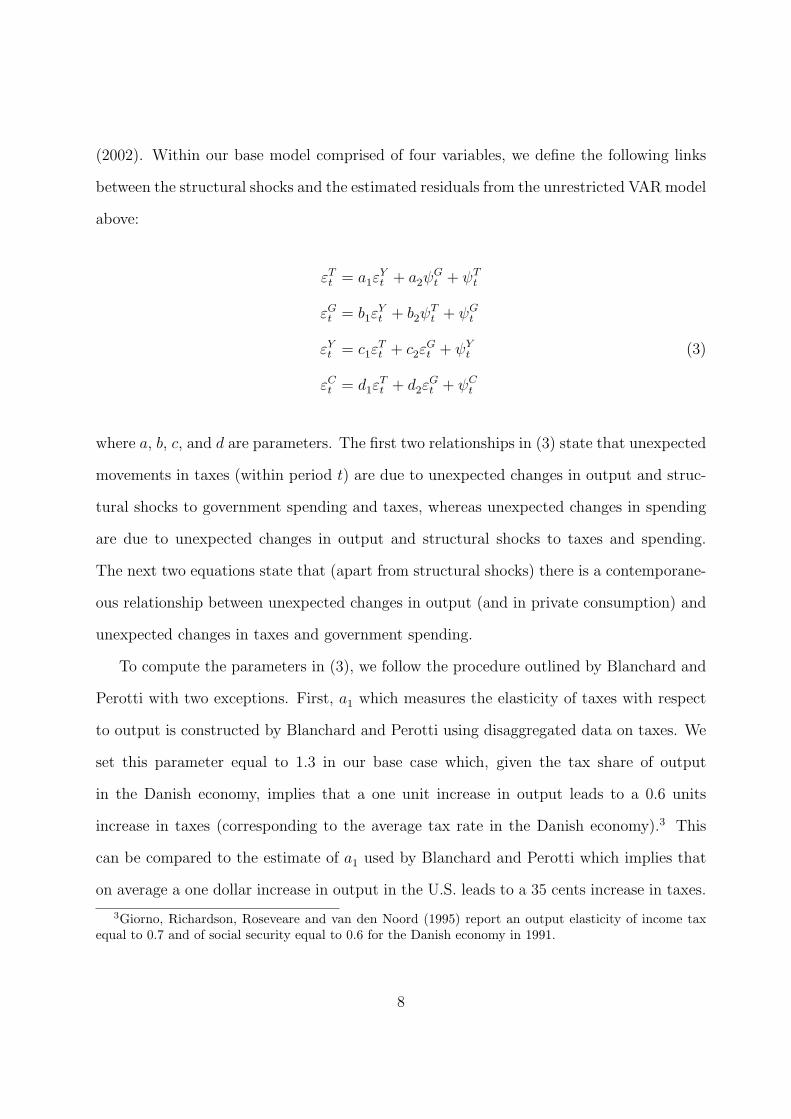
(2002). Within our base model comprised of four variables, we define the following links
between the structural shocks and the estimated residuals from the unrestricted VAR model
above:
εTt = a1ε
Yt + a2ψ
Gt + ψT
t
εGt = b1ε
Yt + b2ψ
Tt + ψG
t
εYt = c1ε
Tt + c2ε
Gt + ψY
t (3)
εCt = d1ε
Tt + d2ε
Gt + ψC
t
where a, b, c, and d are parameters. The first two relationships in (3) state that unexpected
movements in taxes (within period t) are due to unexpected changes in output and struc-
tural shocks to government spending and taxes, whereas unexpected changes in spending
are due to unexpected changes in output and structural shocks to taxes and spending.
The next two equations state that (apart from structural shocks) there is a contemporane-
ous relationship between unexpected changes in output (and in private consumption) and
unexpected changes in taxes and government spending.
To compute the parameters in (3), we follow the procedure outlined by Blanchard and
Perotti with two exceptions. First, a1 which measures the elasticity of taxes with respect
to output is constructed by Blanchard and Perotti using disaggregated data on taxes. We
set this parameter equal to 1.3 in our base case which, given the tax share of output
in the Danish economy, implies that a one unit increase in output leads to a 0.6 units
increase in taxes (corresponding to the average tax rate in the Danish economy).3 This
can be compared to the estimate of a1 used by Blanchard and Perotti which implies that
on average a one dollar increase in output in the U.S. leads to a 35 cents increase in taxes.
3Giorno, Richardson, Roseveare and van den Noord (1995) report an output elasticity of income taxequal to 0.7 and of social security equal to 0.6 for the Danish economy in 1991.
8
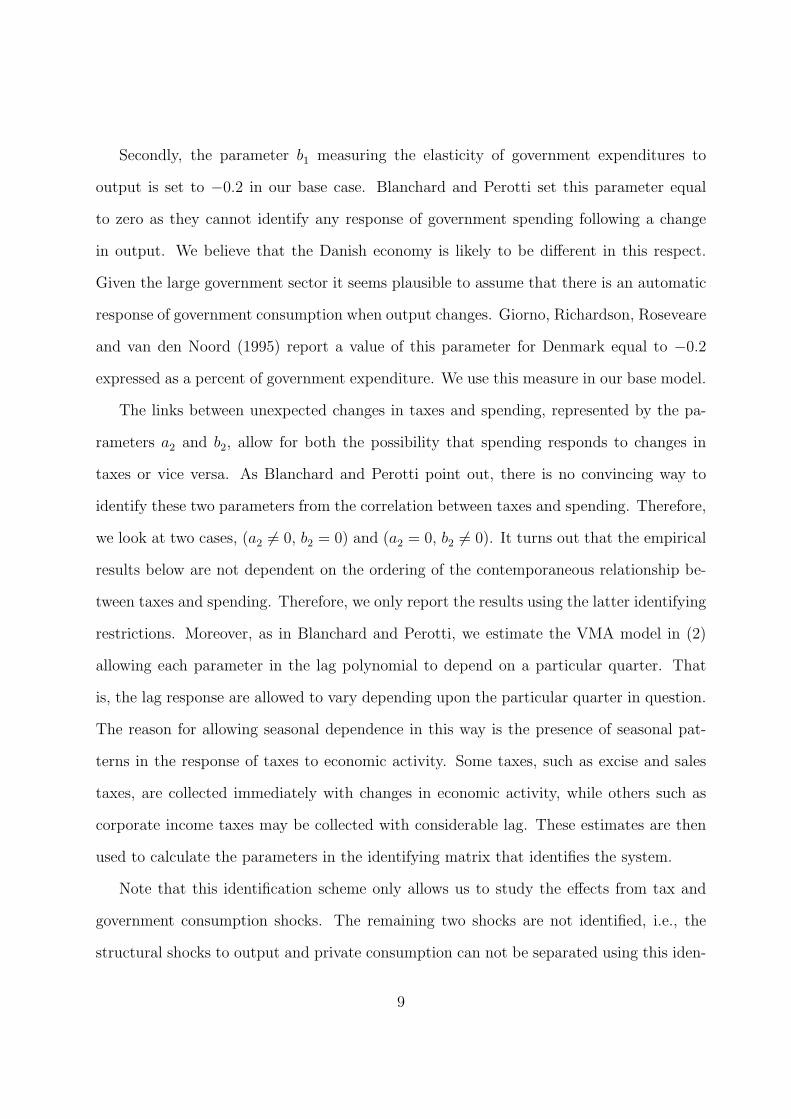
Secondly, the parameter b1 measuring the elasticity of government expenditures to
output is set to −0.2 in our base case. Blanchard and Perotti set this parameter equal
to zero as they cannot identify any response of government spending following a change
in output. We believe that the Danish economy is likely to be different in this respect.
Given the large government sector it seems plausible to assume that there is an automatic
response of government consumption when output changes. Giorno, Richardson, Roseveare
and van den Noord (1995) report a value of this parameter for Denmark equal to −0.2
expressed as a percent of government expenditure. We use this measure in our base model.
The links between unexpected changes in taxes and spending, represented by the pa-
rameters a2 and b2, allow for both the possibility that spending responds to changes in
taxes or vice versa. As Blanchard and Perotti point out, there is no convincing way to
identify these two parameters from the correlation between taxes and spending. Therefore,
we look at two cases, (a2 6= 0, b2 = 0) and (a2 = 0, b2 6= 0). It turns out that the empirical
results below are not dependent on the ordering of the contemporaneous relationship be-
tween taxes and spending. Therefore, we only report the results using the latter identifying
restrictions. Moreover, as in Blanchard and Perotti, we estimate the VMA model in (2)
allowing each parameter in the lag polynomial to depend on a particular quarter. That
is, the lag response are allowed to vary depending upon the particular quarter in question.
The reason for allowing seasonal dependence in this way is the presence of seasonal pat-
terns in the response of taxes to economic activity. Some taxes, such as excise and sales
taxes, are collected immediately with changes in economic activity, while others such as
corporate income taxes may be collected with considerable lag. These estimates are then
used to calculate the parameters in the identifying matrix that identifies the system.
Note that this identification scheme only allows us to study the effects from tax and
government consumption shocks. The remaining two shocks are not identified, i.e., the
structural shocks to output and private consumption can not be separated using this iden-
9

tification as these two shocks are correlated.4
The Danish fiscal consolidation, of course, may not be considered a “normal” period.
To capture this key event, we introduce a dummy variable and measure its effects on
output and private consumption separately from marginal changes in government spending
and taxes. The main tax and expenditure measures of the Danish fiscal contraction, as
shown in the appendix, were implemented in stages starting in early 1983 and concluding
with the “Potato Diet” in 1986 (see Appendix A giving the chronology of Danish fiscal
adjustments during this period). We therefore define a dummy variable that takes the value
of unity during the 1983:1–1986:4 fiscal consolidation and zero otherwise. We also test an
alternative model specification as a robustness check with a dummy variable reflecting the
beginning of the fiscal consolidation — a dummy variable taking the value of unity in 1983:1
and zero otherwise. The inclusion of these dummy variables allows us to explicitly test
whether the dynamics during the fiscal consolidation was indeed different from adjustment
during normal times. In particular, we are interested in the question whether the dynamics
are consistent with the expansionary fiscal contraction hypothesis as has been suggested
in the earlier literature.
3 Empirical results
The data consists of quarterly observations on real taxes per capita (direct and indirect
taxes plus social contribution minus subsidies), real government consumption per capita,
real GNP per capita, and real private consumption per capita provided by Danmarks
Nationalbank.5 The sample runs from 1971:1 to 2000:4. All variables are in logarithms
and are seasonally adjusted. All results below are based on VAR models with 4 lags.
First, we consider the properties of the data. We have applied a variety of standard
4See Blanchard and Perotti (2002) for further details on the limitations of this identification scheme.5We are indebted to Dan Knudsen who kindly made the data available to us.
10

ADF–tests to test whether our data series contain unit roots and if there are cointegration
relationships in the data. The results, see Table 2, suggest that all four series contain
unit roots with a possible exception of taxes regardless of how we specify the deterministic
components. In the table we report ADF–tests using 4 augmenting terms but the results
are insensitive to this choice. Similar results are obtained for other lag lengths as well.
Furthermore, see the lower part of Table 2, there is no strong evidence suggesting any
cointegration relationships between the four series. The ADF–test statistics suggest that
we cannot reject the null hypothesis that there is no cointegration using taxes as the inde-
pendent variable in the first stage of the Engle–Granger two step method. This conclusion
also holds when using the other three variables as the independent variable and for other
lag lengths in the augmenting term except when output is the independent variable and
assuming a quadratic trend. Only in this latter case, we can reject the null of no coin-
tegration at conventional significance levels. We have also applied Johansen’s maximum
likelihood based method but were unable to find any cointegration vector for models with
linear trend in the data and for a model with quadratic trends. For these reasons we focus
on a VAR model where we assume that all variables contain unit roots and where there is
no cointegration vector in the data.6 This formulation of the model implies that all struc-
tural shocks have permanent long–run effects on the variables in the system, i.e. there is
no constraint that brings the system back to an existing initial steady state level (or trend
growth) equilibrium. Short–term behavior is also not restricted and the responses of the
variables to various shocks are freely determined by the model estimates.
In the next three subsections we analyze the dynamic effects of the four structural
shocks by examining impulse response functions of GDP and private consumption to tax
and spending shocks. We also investigate if and how the Danish budget consolidation
6We have, however, also estimated models with a quadratic deterministic trend but the results were verysimilar as when assuming stochastic trends, i.e., when the variables are nonstationary but not cointegrated.These results are available from the authors upon request.
11

during the 1980:s affected the Danish economy by computing the impulse responses of
shocks to the dummy variable. Finally, we measure the importance of the consolidation
dummy variable by using historical decompositions constructing forecasts of output and
private consumption with and without the dummy variable in the VAR models. As a final
check of our results, we perform some robustness tests where we extend our four variable
model by including terms–of–trade and thereby conditioning the estimates of potential
important external effects.
3.1 Dynamic Behavior of Output and Consumption
In Table 3 we report estimates of the contemporaneous coefficients in equation (3) for the
VAR model with 4 lags and assuming stochastic trends but no cointegration. These param-
eters are estimated under the assumption that the elasticity of taxes with respect to output
a1 = 1.3 and assuming that the elasticity of government expenditures to output b1 = −0.2.
In the first two columns of Table 3 we report the point estimates of the contemporaneous
effects between taxes and government consumption (a2 and b2). These parameters are in
general quite small and not statistically significantly different from zero. This suggests
that the ordering of taxes and government consumption is of minor importance, a result
confirmed by the impulse response analysis.
The next two columns report the estimates of the elasticities of output with respect to
taxes (c1) and government spending (c2). The estimated parameters have their expected
(according to Keynesian theory) signs and they are precisely estimated (the t–statistics are
relatively large). The same applies to the elasticities of private consumption with respect
to taxes and government spending (d1 and d2). A one unit increase in government spending
leads to a 0.97 units increase in output whereas a unit increase in taxes leads to a reduction
of output with 0.72 units. These results are consistent with the estimates using US data
presented by Blanchard and Perotti. We also find that the contemporaneous effects from
12
government consumption and taxes on GDP (c1 and c2) are larger in absolute values than
the contemporaneous effects on private consumption (d1 and d2).
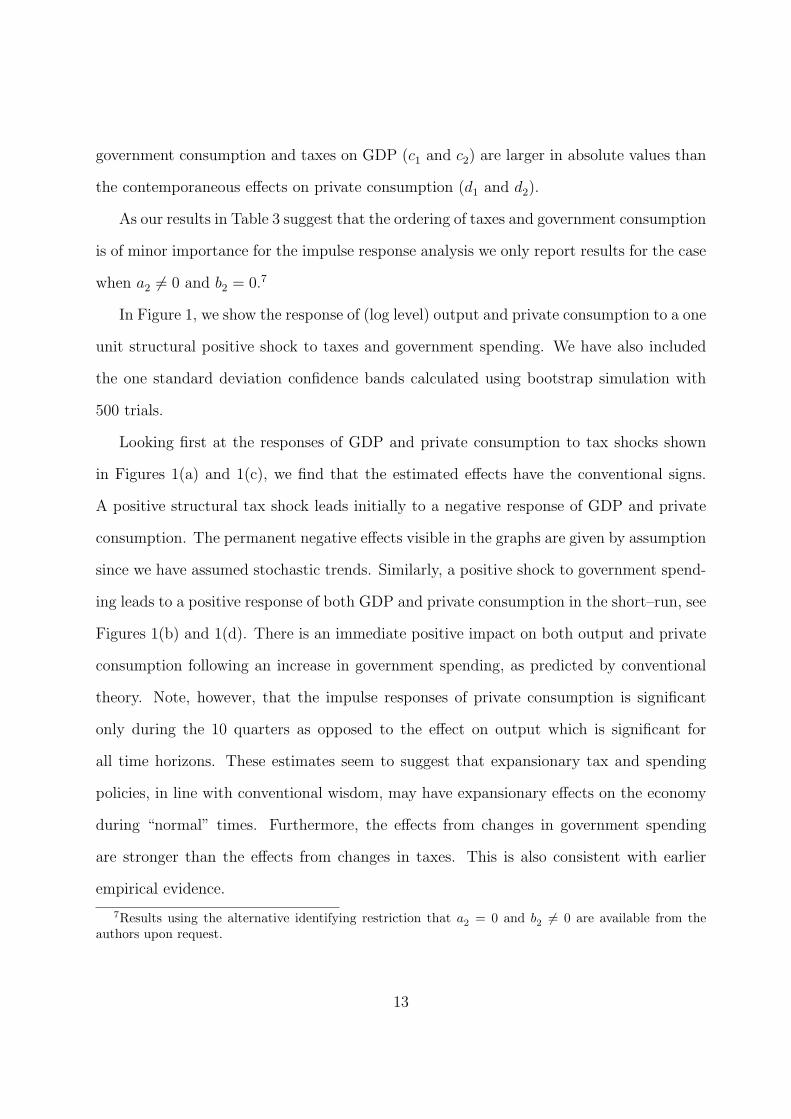
As our results in Table 3 suggest that the ordering of taxes and government consumption
is of minor importance for the impulse response analysis we only report results for the case
when a2 6= 0 and b2 = 0.7
In Figure 1, we show the response of (log level) output and private consumption to a one
unit structural positive shock to taxes and government spending. We have also included
the one standard deviation confidence bands calculated using bootstrap simulation with
500 trials.
Looking first at the responses of GDP and private consumption to tax shocks shown
in Figures 1(a) and 1(c), we find that the estimated effects have the conventional signs.
A positive structural tax shock leads initially to a negative response of GDP and private
consumption. The permanent negative effects visible in the graphs are given by assumption
since we have assumed stochastic trends. Similarly, a positive shock to government spend-
ing leads to a positive response of both GDP and private consumption in the short–run, see
Figures 1(b) and 1(d). There is an immediate positive impact on both output and private
consumption following an increase in government spending, as predicted by conventional
theory. Note, however, that the impulse responses of private consumption is significant
only during the 10 quarters as opposed to the effect on output which is significant for
all time horizons. These estimates seem to suggest that expansionary tax and spending
policies, in line with conventional wisdom, may have expansionary effects on the economy
during “normal” times. Furthermore, the effects from changes in government spending
are stronger than the effects from changes in taxes. This is also consistent with earlier
empirical evidence.
7Results using the alternative identifying restriction that a2 = 0 and b2 6= 0 are available from theauthors upon request.
13

Taken together, these results are consistent with the traditional view of fiscal policy
where a tax reduction and an increase in government consumption stimulates the economy
leading to higher aggregate demand, higher private consumption and ultimately higher
production.
3.2 Did Denmark experience an expansionary fiscal contraction?
We now turn to our tests of the EFC hypothesis during “non–normal” times. To test this
hypothesis we add a dummy variable equal to unity during the Danish fiscal consolidation
1983:1 to 1986:4 and zero otherwise as explained above.8 The dynamic responses of our
endogenous variables to this dummy variable represent the implied reaction to the fiscal
consolidation. In this respect, the impulse responses to the dummy allow us to distinguish
between “normal” and “non–normal” times and to examine whether the behavior of GDP
and private consumption was different during the Danish fiscal consolidation.
Figures 2(a) and 2(b) plot the responses of taxes and government consumption to the
fiscal consolidation. Taxes and government consumption gradually converge to their new
long–run levels, with taxes (government consumption) expected to be permanently higher
(lower). These expectations form an important part of the Danish fiscal consolidation.
In terms of our maintained hypotheses, the two lower boxes in Figure 2 plot the impulse
responses arising from a major fiscal consolidation. These results lend support to the EFC
hypothesis. Major fiscal consolidation has a substantial short– and long–run positive effect
on output and private consumption. There are initial consumption and output booms,
8An alternative approach is to allow all parameters in the VAR model to change during the fiscalconsolidation period. We have performed a number of tests of parameter constancy and cannot rejectthe null hypothesis that the parameters are constant at the 5 percent level. In particular, we have testedwhether the parameter during the fiscal consolidation period is equal to parameters before and after theconsolidation, whether parameters before the consolidation are equal to parameters during and after theconsolidation, whether the parameters before and during the consolidation are equal to parameters after theconsolidation, and whether parameters before consolidation are equal to parameters after the consolidationallowing parameters during the consolidation to differ.
14

followed by gradual convergence to more moderate increases in the longer–term steady
state levels. Both GDP and private consumption reach their new long–run levels after
about 12 quarters. This dynamic pattern and long–run response is consistent with the
EFC hypothesis.
In terms of historical accuracy, these results are consistent with the particulars of the
Danish fiscal consolidation (Bergman and Hutchison (1999)). The basic tenet of the Dan-
ish fiscal reform package was to encourage private sector activity and to lower public sector
expenditures and raise selected taxes. The sharp improvement in the government budget
position (12.6 percent of GDP) during 1983–86 was associated with both higher revenues
(7.1 percent of GDP) and lower expenditures (5.5 percent of GDP). Expenditures were
reduced by limiting public sector wages and social payments while the remaining improve-
ment came from permanent tax increases, hikes in social security contributions, taxation
of higher–yielding pensions and an increase in the maximum tax rates. These changes in
fiscal positions affect the expectations of future disposable income. Permanently lower gov-
ernment consumption normally lead to an upward revision of disposable income whereas
permanently higher taxes normally lead to an expectation of lower future disposable in-
come.9 The Danish budget position also improved much faster than expected, from a
deficit of 9.1 percent of GDP in 1982 to a surplus of 3.4 percent of GDP in 1986.
Average growth of real disposable income was 1.20% per year during the fiscal consoli-
dation period compared to 1.04% during the sample 1983 to 2000. This suggests that not
only future disposable income as forecasted to increase as a result of the fiscal consolida-
tion (and subsequent lower budget deficits), but current disposable income also increased.
However, during the fiscal consolidation period we cannot distinguish between (higher) tax
and (lower) government consumption effects on disposable income for two reasons. First,
9It may be the case that higher current taxes lead households to revise upward their expectations offuture disposable income if this tax increase generates expectations of less dramatic, less disruptive andless distortionary future tax increases.
15

there has only been one fiscal consolidation and one episode is only sufficient to tease out
the combined effects of tax and government consumption changes rather than individual
changes. Second, Statistics Denmark does not publish quarterly data on disposable income
for the sample we examine.
One should also keep in mind that in our specification of the VAR model (under the
assumption of unit roots but no cointegration), all shocks will have permanent effects
on the levels of all included variables by assumption. This also applies to the impulse
responses of the data to the fiscal consolidation. We can, thus, not draw conclusions on
the permanence of the effects of a fiscal consolidation. Likewise, if we assume that all
variables are stationary (around a linear or quadratic trend), there will by assumption be
no long run effects on any variable in the system during normal and non-normal times.
3.3 Importance of the fiscal consolidation
The impulse response analysis in the previous section cannot be used to evaluate the
importance of the consolidation dummy in comparison to the impulse responses of output
and private consumption with respect to the structural shocks during “normal” times.
However, the graphs in Figures 1 and 2 suggest that the responses of both output and
private consumption during the Danish fiscal consolidation are significant and that these
responses differ from the impulse responses during normal times. One way to test the
explanatory power of the fiscal consolidation dummy is to compare forecasts of output
(and private consumption) using the full estimated models with the forecasts excluding the
fiscal consolidation effect. The dashed line in Figure 3 shows the forecast value of output
and consumption from our model given all available information from 1982:1 (deterministic
terms and lagged values of the dependent variables in the system) until 1986:4. Note that
we plot the level of output and private consumption. The dotted lines show the forecasts
of these two variables excluding the fiscal consolidation dummy and finally the solid line is
16
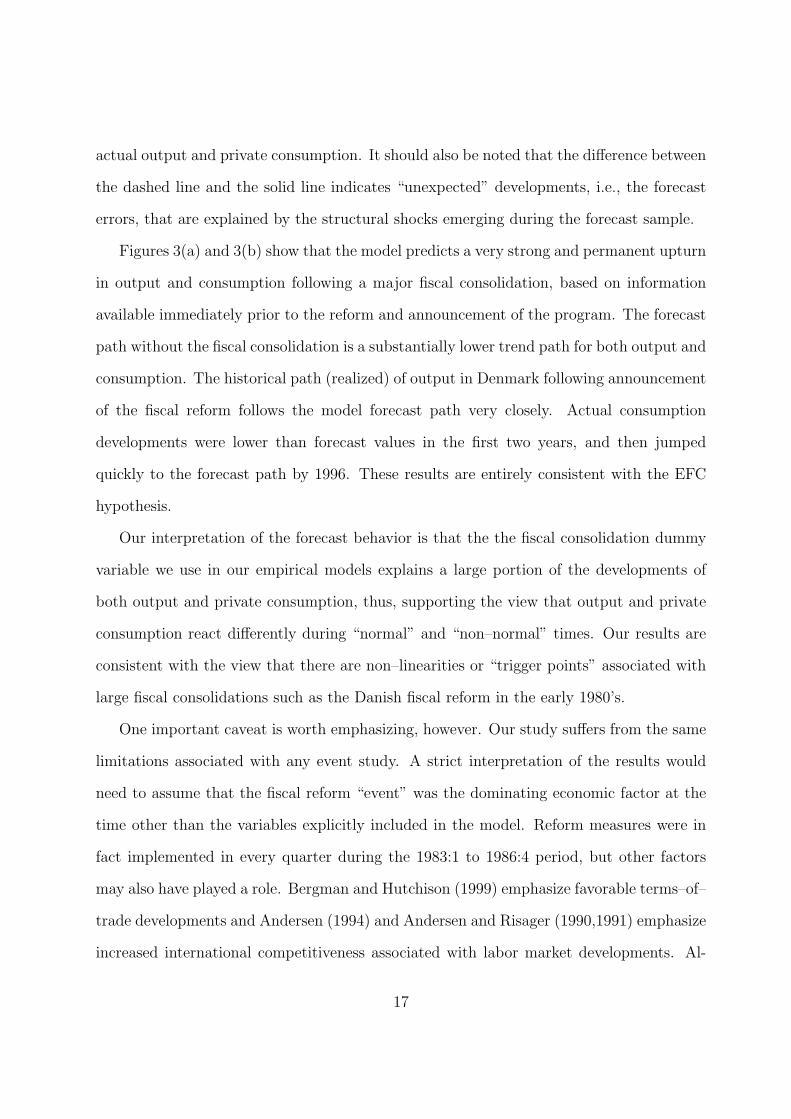
actual output and private consumption. It should also be noted that the difference between
the dashed line and the solid line indicates “unexpected” developments, i.e., the forecast
errors, that are explained by the structural shocks emerging during the forecast sample.
Figures 3(a) and 3(b) show that the model predicts a very strong and permanent upturn
in output and consumption following a major fiscal consolidation, based on information
available immediately prior to the reform and announcement of the program. The forecast
path without the fiscal consolidation is a substantially lower trend path for both output and
consumption. The historical path (realized) of output in Denmark following announcement
of the fiscal reform follows the model forecast path very closely. Actual consumption
developments were lower than forecast values in the first two years, and then jumped
quickly to the forecast path by 1996. These results are entirely consistent with the EFC
hypothesis.
Our interpretation of the forecast behavior is that the the fiscal consolidation dummy
variable we use in our empirical models explains a large portion of the developments of
both output and private consumption, thus, supporting the view that output and private
consumption react differently during “normal” and “non–normal” times. Our results are
consistent with the view that there are non–linearities or “trigger points” associated with
large fiscal consolidations such as the Danish fiscal reform in the early 1980’s.
One important caveat is worth emphasizing, however. Our study suffers from the same
limitations associated with any event study. A strict interpretation of the results would
need to assume that the fiscal reform “event” was the dominating economic factor at the
time other than the variables explicitly included in the model. Reform measures were in
fact implemented in every quarter during the 1983:1 to 1986:4 period, but other factors
may also have played a role. Bergman and Hutchison (1999) emphasize favorable terms–of–
trade developments and Andersen (1994) and Andersen and Risager (1990,1991) emphasize
increased international competitiveness associated with labor market developments. Al-
17

though we have attempted to control for a multitude of economic shocks in measuring the
“marginal” significance of the fiscal consolidation dummy variable, we can not rule out
that other structural reforms enacted during this period also played a role. Nonetheless,
as we see below, the results are robust to a number of modeling changes.
4 Robustness
We undertake two robustness checks in this section. Firstly, we assume that the dummy
variable takes on the value one only in 1983:1 and zero otherwise. Secondly, we extend
the basic 4–variable structural VAR model to include a terms–of–trade variable. The
extension allows us to evaluate the impact of external shocks on the performance of the
Danish economy during the period of fiscal consolidation as well as other times.
4.1 A single period dummy variable
The Danish fiscal stabilization was carried out in a series of steps over 1983–86, shown
in the appendix. The basic framework and estimates reported above modeled the fiscal
consolidation shock by a dummy variable equal to unity over the 1983:1–1986:4 period,
during which time a number of specific tax, spending, pension, social security and public
wage measures were implemented, and zero otherwise. An alternative representation of
the fiscal consolidation shock is to introduce a single period dummy variable reflecting the
point in time when the public recognized a credible and large fiscal consolidation package
was to be implemented. Our historical reading of the episode suggests that sometime in
early 1983 (1983:1) is probably a good staring point for this robustness check. We therefore
define the dummy variable to be equal to one in 1983:1 and zero otherwise. In our estimated
VAR model we allow for current value and three lags of the dummy for 1986:1.
It turns out that our results are robust to changes in the definition of the dummy
18
variable, i.e., all earlier results are confirmed. In particular, as above our results suggest
that shocks to changes in government spending and taxes have the standard dynamic effects
on output and private consumption during “normal” times while the EFC hypothesis is not
rejected during “non–normal” times. In Figure 5, we plot the impulse responses of output
and private consumption to a one unit shock to the dummy variable. Note, however, that
even though our point estimates are positive, the impulse responses of output and private
consumption are not statistically significant. These impulse responses become statistically
significant when allowing for more lags of the dummy variable in the VAR model.10
Our results are particularly noteworthy since the initial official forecasts predicted that
output and private consumption would fall in response to the fiscal consolidation plan, and
there was considerable uncertainty about the fiscal actions taken in the early 1983 which
depended on the outcome of the wage negotiations (see Bergman and Hutchison, 1999).
4.2 5–variable VAR model
In addition to the 4–variable baseline model, we also estimate an extended model that
incorporates the terms–of–trade allowing us to study the responses of the variables in
our system to terms–of–trade shocks and study the effects of fiscal policies on output
and private consumption given external influences. To identify this 5–variable model,
we assume that (1) there is no contemporaneous feedback between the terms–of–trade
and either taxes or government spending and (2) that private consumption shocks do not
affect the terms–of–trade contemporaneously. This implies the following links between the
10Note that the impulse response of a one unit shock to the dummy variable in our base model corre-sponds to the impulse response of a unit shock to the dummy variable in this latter case when we definethe dummy to be equal to one in 1986:1 and zero otherwise allowing for current value and 15 lags of thisdummy in the estimated VAR model.
19

structural shocks and estimated residuals from the unrestricted VAR model:
εTt = a1ε
Yt + a2ψ
Gt + ψT
t
εGt = b1ε
Yt + b2ψ
Tt + ψG
t
εYt = c1ε
Tt + c2ε
Gt + c3ε
pt + ψY
t (4)
εCt = d1ε
Tt + d2ε
Gt + d3ε
pt + ψC
t
εpt = e1ε
Yt + ψp
t
where εpt is the estimated residual from the equation with terms–of–trade, e1 is the con-
temporaneous effect from GDP to terms–of–trade and ψpt is the structural terms–of–trade
shock.11 This identification scheme implies that we allow for Danish GDP to affect terms–
of–trade contemporaneously and that terms–of–trade contemporaneously affect both GDP
and private consumption.
Estimates of the parameters in equation (4) are shown in Table 4. Similarly to the
estimates for the 4–variable model above, we find that there is no significant contempora-
neous effect from terms–of–trade on GDP, i.e., the coefficient c3 is close to zero and not
statistically significant at conventional levels. The contemporaneous effect from GDP on
terms–of–trade (e3) is significant and private consumption reacts contemporaneously to
changes in the terms–of–trade, the parameter d3 is positive and significantly different from
zero. Therefore, we may conjecture that the dynamic behavior of this extended model
could be significantly different.
Figure 4 plots the impulse responses within the 5–dimensional VAR models assuming
stochastic trends and no cointegration. According to the graphs, there are only minor
changes to the impulse response functions compared to the ones we obtained for the 4–
11Unit root and cointegration tests suggest that we cannot reject the null that terms–of–trade containsa unit root and that there is no cointegration vector present in the 5–dimensional system. These resultsare available from the authors upon request.
20

variable systems above. As in the 4–variable models, a positive tax shock and a negative
shock to government consumption lead to lower GDP and private consumption in the
short–term. This is quite surprising as the external influences on the Danish economy
during the fiscal consolidation were regarded important by several authors in the literature.
We find, even though these developments were potentially important, that they were not
important enough to alter our main conclusion, during “normal” times output and private
consumption behave and react in the standard way whereas during “non–normal” times
these indicators behave in a way consistent with the EFC hypothesis. As can be seen
from the forecasts in Figures 4(g) and 4(h), the fiscal consolidation variable is still a very
important factor explaining the booms in output and private consumption during the
fiscal consolidation. These results support our earlier finding that the fiscal consolidation
significantly influences the adjustment output and private consumption during the Danish
fiscal consolidation.
4.3 Other sensitivity tests
In addition to the sensitivity test performed above, we have also examined how the addition
of other macroeconomic shocks and business cycle effects affect our results and conclusions.
We focus on three different variables, the nominal long–term interest differential against
Germany, G–7 output gap and the first log difference of G–7 GDP.
It has been argued in the earlier literature (Andersen (1994)) that private consumption
in Denmark is very sensitive to changes in interest rates and that the fall in the Danish
interest rate contributed to the sharp rise in private consumption at the time of the reform.
The Danish long–term interest differential against Germany fell sharply during the fiscal
consolidation period, starting the first trading day following the approval of the fiscal
reforms in October 1982.
The fiscal reform undertaken in Denmark in 1983 coincided with a very sharp upturn
21
in the world economy. The world business cycle measured as the G–7 output gap was
in an expansion phase from March 1983 until it reached its peak in 1990. It may well
be the case that this upturn, together with the labor market reforms and the increased
competitiveness in the Danish economy, contributed significantly to the sharp increase in
both economic growth and private consumption.
In order to examine whether these three factors affect our results, we add one variable
at a time to our 4–variable and 5–variable systems as exogenous variables.12 The results
show that neither of these macroeconomic shocks or business cycle effects can explain the
boost in Danish output and private consumption during the fiscal consolidation. There
are only minor changes in the responses of output and private consumption to the fiscal
consolidation dummy. The effects are positive, as in our base case, with narrow confidence
bands. This holds for both 4– and 5–variable models. Our interpretation is that the
interest effect emphasized by Andersen (1994) can not fully explain the boom in Danish
output and private consumption during the fiscal consolidation. Furthermore, controlling
for business cycle effects, either by the inclusion of G–7 output gap or the change in G–7
GDP we find that the responses are still positive and significant. The upturn in the world
economy at the time of the fiscal consolidation did have a positive impact on the Danish
economy, but there is still a significant increase in Danish output and private consumption
accounted for by our fiscal consolidation dummy.
As a final sensitivity test we consider the effects of changes in the parameters a1 and
b1. The former parameter measures the elasticity of taxes with respect to output whereas
the latter is the elasticity of government expenditures to output. In our base case we set
a1 = 1.3 and b1 = −0.2. It may be the case that these elasticities may change as a result
of the fiscal consolidation and the question is how sensitive our results are to such changes.
First, a change in these two parameters can only affect the impulse responses during
12The results are not shown here for brevity, but are available upon request from the authors.
22
normal times, the impulse responses to the fiscal consolidation dummy are independent
on the particular identification scheme and therefore also these two parameters. Second,
we find that our results are relatively unchanged if a1 and b1 change. In particular, if we
increase the parameter a1 we find that the response of both output and consumption to tax
shocks become more negative as compared to the responses reported in Figure 1 whereas
the responses of these variables to government consumption shocks become less positive.
The only difference is a level shift, the patterns are identical to the impulse responses in
Figure 1. In case we decrease b1 (it becomes more negative) we find that the responses
of both output and consumption to both tax and government consumption shocks are
relatively unchanged, there are only very minor differences between these responses and
the ones shown in Figure 1.
5 Conclusions
Our results suggest that it is important to contrast normal changes in fiscal policy from
a major consolidation/reform that has implications for years to come and is viewed as a
critical policy shift both by governments, politicians and the private sector. The Danish fis-
cal reform starting in 1983 was remarkably successful in turning around the government’s
rapidly deteriorating budget position. Our empirical results also suggest that the fiscal
contraction in Denmark had strong stimulative effects on both consumption and output.
By contrast, marginal changes in government consumption expenditure and taxes — fiscal
policy in ‘normal’ times — had the conventional effect on consumption and output, e.g.,
small government tax (expenditure) increases generally led to a reduction (expansion) in
consumption and slowdown (rise) in economic activity. Non–linearities in fiscal response
functions or “trigger points” associated with large stabilizations appear to be very impor-
tant empirically. However, although we have controlled for a number of macroeconomic
23

shocks occurring during the period of fiscal consolidation, we can not rule out that other
structural reforms undertaken at the time also played a role. For this reason, we interpret
our results cautiously but emphasize that — at the least — there is no evidence that the
fiscal consolidation dampened the growth of either output or consumption.
Our work is the first to apply the structural VAR/event study methodology in testing
the EFC hypothesis. Previous work is largely based on international cross-section studies
and has led to mixed results. We believe that our methodology is particularly well suited to
the ‘natural experiment’ of the Danish fiscal consolidation. Moreover, our study provides
much stronger support for the EFC hypothesis in Denmark than the largely descriptive case
studies of the Danish experience. We emphasize, however, that our support for the EFC
hypothesis only applies to large and credible fiscal consolidations and it is not possible to
fully disentangle the effects of other reforms that may also have played an important role.
Fiscal contractions based on marginal changes in taxes and government expenditures are
more likely to have depressing effects on the economy in line with conventional Keynesian
predictions.
References
Alesina, A. and R. Perotti, (1995), “Fiscal Expansions and Fiscal Adjustments in OECD
Countries,” NBER Working Paper 5214.
Alesina, A. and R. Perotti, (1996), “Reducing Budget Deficits,” Swedish Economic Policy
Review, 3, 115–134.
Alesina, A. and R. Perotti, (1997), “Fiscal Adjustments in OECD Countries: Composition
and Macroeconomic Effects,” IMF Staff Papers, 44, 210–248.
Andersen, T. M., (1994), “Disinflationary Stabilization Policy — Denmark in the 1980s,”
in, Akerholm, J. and A. Giovannini, (eds.), Exchange Rate Policies in the Nordic
Countries, Centre for Economic Policy Research, London.
24

Andersen, T. M. and O. Risager, (1990), “Wage Formation in Denmark,” in, Calmfors, L.,
(ed.), Wage Formation and Macroeconomic Policies in the Nordic Countries, Oxford
University Press, Oxford.
Andersen, T. M. and O. Risager, (1991), “The Role of Credibility for the Effects of a
Change in the Exchange–Rate Policy,” Oxford Economic Papers, 43, 85–98.
Barry, F., (1999), “Comment,” in, Andersen, T. M., S. E. H. Jensen and O. Risager, (eds.),
Macroeconomic Perspectives on the Danish Economy, MacMillan, New York.
Barry, F. and M. B. Devereux, (1994), “The Macroeconomics of Government Budget Cuts:
Can Fiscal Contractions be Expansionary,” in, Robson, W. B. P. and W. M. Scarth,
(eds.), Deficit Reduction: What Pain, What Gain?, C. D. Howe Institute, Toronto.
Barry, F. and M. B. Devereux, (1995), “The “Expansionary Fiscal Contraction” Hypoth-
esis: A Neo–Keynesian Analysis,” Oxford Economic Papers, 47, 249–264.
Barry, F. and M. B. Devereux, (2003), “Expansionary Fiscal Contraction: A Theoretical
Exploration,” Journal of Macroeconomics, 25, 1–23.
Bergman, U. M. and M. M. Hutchison, (1999), “Economic Expansions and Fiscal Con-
tractions: International Evidence and the 1982 Danish Stabilization,” in, Andersen,
T., S. E. H. Jensen and O. Risager, (eds.), Macroeconomic Perspectives on the Danish
Economy, MacMillan, New York.
Bernanke, B. S. and I. Mihov, (1998), “Measuring Monetary Policy,” Quarterly Journal of
Economics, 113, 869–902.
Bertola, G. and A. Drazen, (1993), “Trigger Points and Budget Cuts: Explaining the
Effects of Fiscal Austerity,” American Economic Review, 83, 1170–1188.
Blanchard, O. J., (1987), “Germany and the World Economy: A US View,” Economic
Policy, 1, 195–200.
Blanchard, O. J. and R. Perotti, (2002), “An Empirical Characterization of the Dynamic
Effects of Changes in Government Spending and Taxes on Output,” Quarterly Journal
of Economics, 117, 1329–1368.
Canzoneri, M., R. Cumby and B. Diba, (2003), “New Views on the Transatlantic Trans-
mission of Fiscal Policy and Macroeconomic Policy Coordination,” in, Buti, M., (ed.),
Monetary and Fiscal Policies in EMU, Cambridge University Press, Cambridge.
25
Giavazzi, F., T. Jappelli and M. Pagano, (2000), “Searching For Non–Linear Effects Of Fis-
cal Policy: Evidence From Industrial and Developing Countries,” European Economic
Review, 44, 1259–1289.
Giavazzi, F. and M. Pagano, (1990), “Can Severe Fiscal Contractions Be Expansionary?
Tales of Two Small European Countries,” in, Blanchard, O. J. and S. Fischer, (eds.),
NBER Macroeconomics Annual, MIT Press, Cambridge.
Giorno, C., P. Richardson, D. Roseveare and P. van den Noord, (1995), “Estimating Po-
tential Output Gaps and Structural Budget Balances,” OECD Working Paper No.
152.
Hemming, R., M. S. Kell and S. Mahfouz, (2002), “The Effectiveness of Fiscal Policy in
Stimulating Economic Activity — A Review of the Literature,” IMF Working Paper
No. 02/208.
Hjelm, G., (2002), “Is Private Consumption Growth Higher (Lower) During Periods of
Fiscal Contractions (Expansions)?,” Journal of Macroeconomics, 24, 17–39.
Hoppner, F. and K. Wesche, (2000), “Non–Linear Effects of Fiscal Policy in Germany: A
Markov–Switching Approach,” Bonn Econ Discussion Paper 9/2000.
Linnemann, L. and A. Schabert, (2003), “Fiscal Policy in the New Neoclassical Synthesis,”
Journal of Money, Credit and Banking, 35, 911–929.
Linnemann, L. and A. Schabert, (2004), “Can Fiscal Spending Stimulate Private Con-
sumption?,” Economics Letters, 82, 173–179.
Perotti, R., (1999), “Fiscal Policy in Good Times and Bad,” Quarterly Journal of Eco-
nomics, 114, 1399–1436.
Perotti, R., (2004), “Estimating the Effects of Fiscal Policy in OECD Countries,” IGIER
(Innocenzo Gasparini Institute for Economic Research), Bocconi University, Working
Paper No. 276.
Sutherland, A., (1997), “Fiscal Crises and Aggregate Demand: Can High Public Debt
Reverse the Effects of Fiscal Policy?,” Journal of Public Economics, 65, 147–162.
van Aarle, B. and H. Garretsen, (2003), “Keynesian, Non–Keynesian or No Effects of Fiscal
Policy Changes? The EMU Case,” Journal of Macroeconomics, 25, 213–240.
26
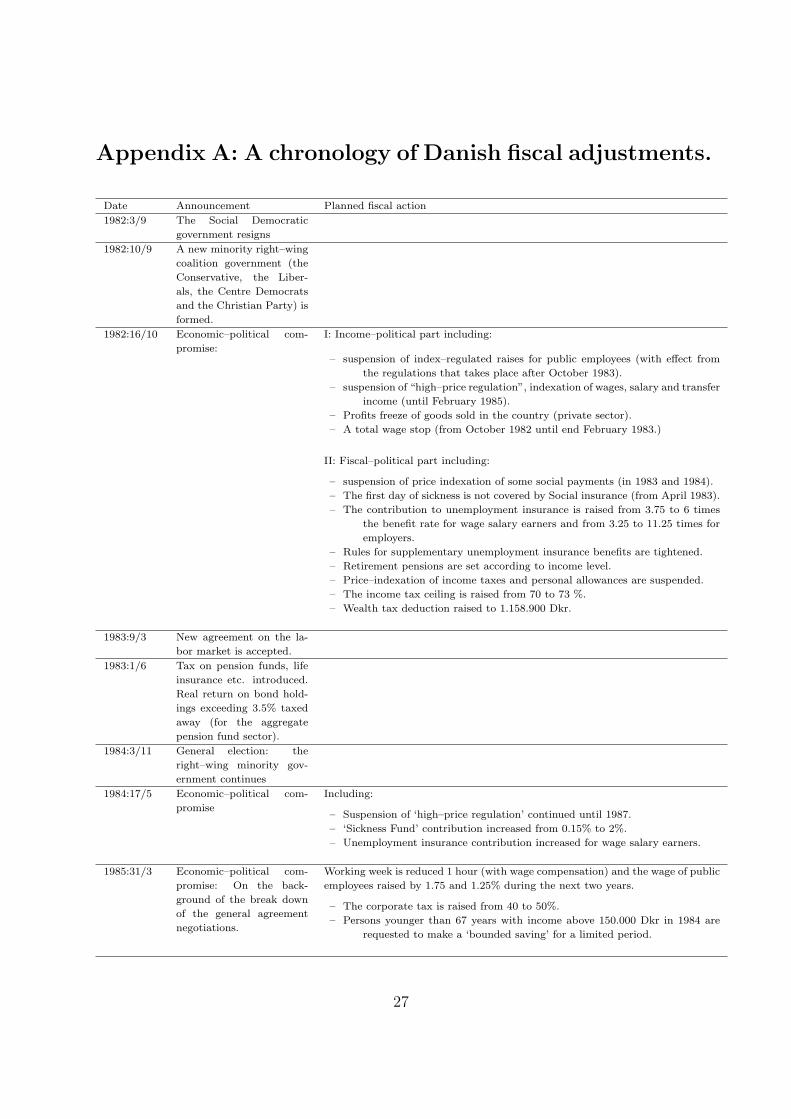
Appendix A: A chronology of Danish fiscal adjustments.
Date Announcement Planned fiscal action
1982:3/9 The Social Democratic
government resigns
1982:10/9 A new minority right–wing
coalition government (the
Conservative, the Liber-
als, the Centre Democrats
and the Christian Party) is
formed.
1982:16/10 Economic–political com-
promise:
I: Income–political part including:
– suspension of index–regulated raises for public employees (with effect from
the regulations that takes place after October 1983).
– suspension of “high–price regulation”, indexation of wages, salary and transfer
income (until February 1985).
– Profits freeze of goods sold in the country (private sector).
– A total wage stop (from October 1982 until end February 1983.)
II: Fiscal–political part including:
– suspension of price indexation of some social payments (in 1983 and 1984).
– The first day of sickness is not covered by Social insurance (from April 1983).
– The contribution to unemployment insurance is raised from 3.75 to 6 times
the benefit rate for wage salary earners and from 3.25 to 11.25 times for
employers.
– Rules for supplementary unemployment insurance benefits are tightened.
– Retirement pensions are set according to income level.
– Price–indexation of income taxes and personal allowances are suspended.
– The income tax ceiling is raised from 70 to 73 %.
– Wealth tax deduction raised to 1.158.900 Dkr.
1983:9/3 New agreement on the la-
bor market is accepted.
1983:1/6 Tax on pension funds, life
insurance etc. introduced.
Real return on bond hold-
ings exceeding 3.5% taxed
away (for the aggregate
pension fund sector).
1984:3/11 General election: the
right–wing minority gov-
ernment continues
1984:17/5 Economic–political com-
promise
Including:
– Suspension of ‘high–price regulation’ continued until 1987.
– ‘Sickness Fund’ contribution increased from 0.15% to 2%.
– Unemployment insurance contribution increased for wage salary earners.
1985:31/3 Economic–political com-
promise: On the back-
ground of the break down
of the general agreement
negotiations.
Working week is reduced 1 hour (with wage compensation) and the wage of public
employees raised by 1.75 and 1.25% during the next two years.
– The corporate tax is raised from 40 to 50%.
– Persons younger than 67 years with income above 150.000 Dkr in 1984 are
requested to make a ‘bounded saving’ for a limited period.
27
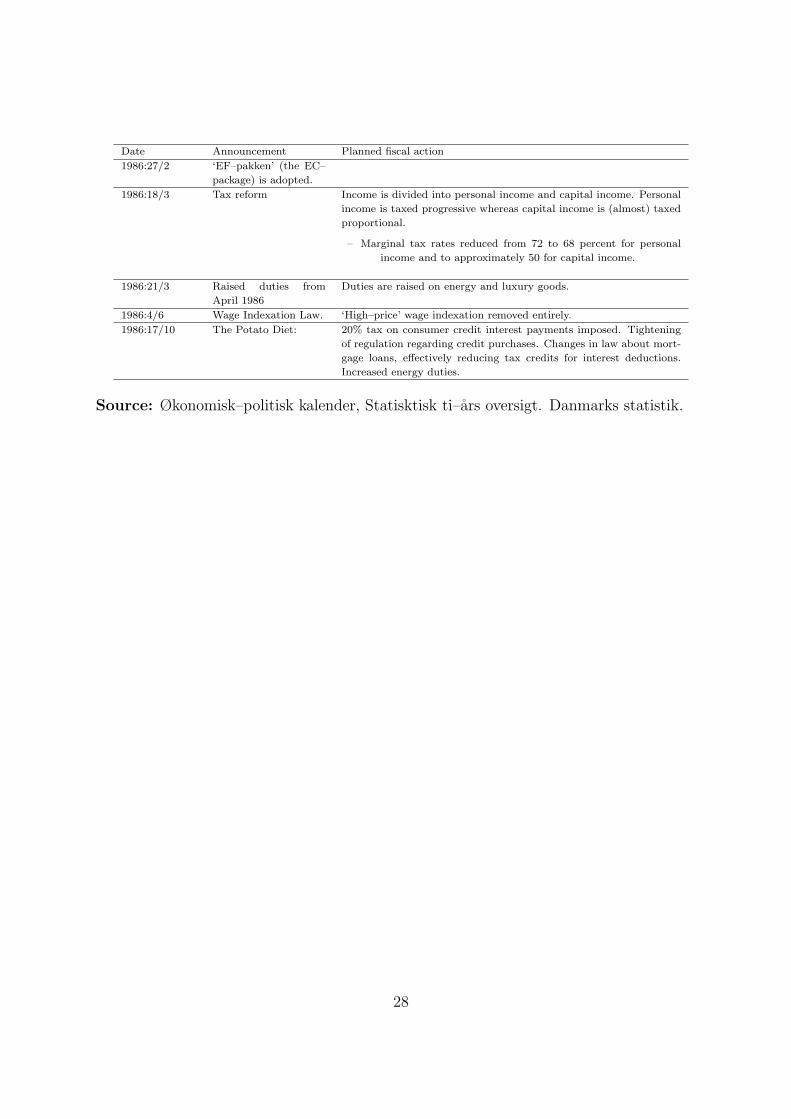
Date Announcement Planned fiscal action
1986:27/2 ‘EF–pakken’ (the EC–
package) is adopted.
1986:18/3 Tax reform Income is divided into personal income and capital income. Personal
income is taxed progressive whereas capital income is (almost) taxed
proportional.
– Marginal tax rates reduced from 72 to 68 percent for personal
income and to approximately 50 for capital income.
1986:21/3 Raised duties from
April 1986
Duties are raised on energy and luxury goods.
1986:4/6 Wage Indexation Law. ‘High–price’ wage indexation removed entirely.
1986:17/10 The Potato Diet: 20% tax on consumer credit interest payments imposed. Tightening
of regulation regarding credit purchases. Changes in law about mort-
gage loans, effectively reducing tax credits for interest deductions.
Increased energy duties.
Source: Økonomisk–politisk kalender, Statisktisk ti–ars oversigt. Danmarks statistik.
28

Table 1: Official forecasts published by the Economic Council 1982–85 and actual devel-opments in the Danish economy.
Panel A: Official forecast revisionsfor 1984 following fiscal contraction
∆Y ∆C UForecast 1982:10 3.0 2.4 10.4Forecast 1983:5 1.3 1.8 11.9Forecast Revision −1.7 −0.6 1.5
Panel B: Official forecast errorsfollowing fiscal contraction
∆Y ∆C U1984 Actual 3.5 2.1 10.2
1983:5 Forecast 1.3 1.8 11.9Forecast Error −2.2 −0.3 1.7
1985 Actual 3.6 4.0 9.21984:11 Forecast 3.0 2.4 10.3Forecast Error −0.6 −1.6 1.1
1986 Actual 4.0 5.9 8.01985:12 Forecast 3.4 3.5 8.7Forecast Error −0.6 −2.4 0.7
Source: Dansk Økonomi (Det Økonomiske Rad), various issues and Eurostat.
Table 2: Augmented Dickey–Fuller unit root and cointegration tests.
Variable τµ τ τ τ γ
Taxes −3.67 −0.75 −1.92Government consumption −2.11 −1.86 −1.57Output −0.13 −2.79 −3.05Private consumption −0.98 −3.11 −3.445% Critical value −2.92 −3.46 −3.88Cointegration test −1.00 −0.89 −4.055% Critical value −4.22 −4.57 −4.95
Note: τµ is the ADF–test with a constant, τ τ with a constant and a linear trend andτ γ with a constant and a second order polynomial trend. All ADF–tests are computedusing 4 lags in the augmented terms. When testing for cointegration we let taxes be theindependent variable in the cointegration regression.
Table 3: Estimated contemporaneous coefficients in equation (3). Stochastic trends model.
a2 b2 c1 c2 d1 d2
−0.205 −0.037 −0.717 0.971 −0.358 0.674(−0.942) (−0.942) (−5.781) (5.103) (−2.569) (3.160)
Note: T–ratios are reported in parentheses below each coefficient estimate.
29
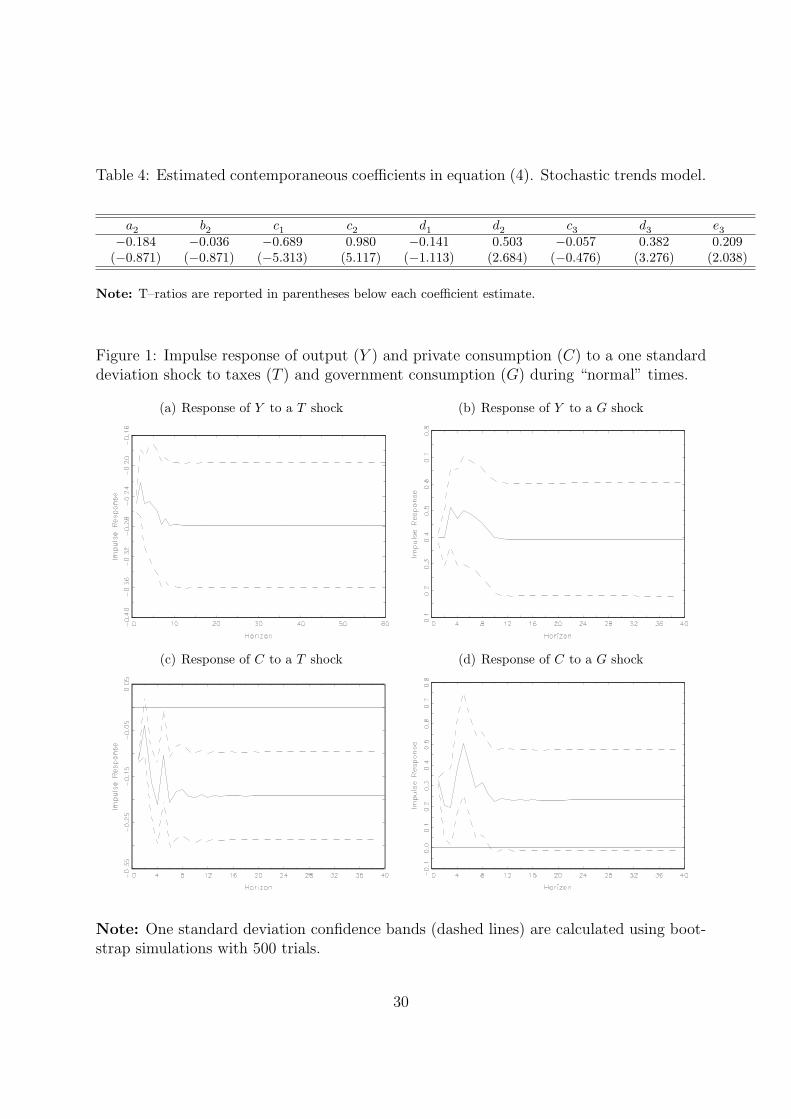
Table 4: Estimated contemporaneous coefficients in equation (4). Stochastic trends model.
a2 b2 c1 c2 d1 d2 c3 d3 e3
−0.184 −0.036 −0.689 0.980 −0.141 0.503 −0.057 0.382 0.209(−0.871) (−0.871) (−5.313) (5.117) (−1.113) (2.684) (−0.476) (3.276) (2.038)
Note: T–ratios are reported in parentheses below each coefficient estimate.
Figure 1: Impulse response of output (Y ) and private consumption (C) to a one standarddeviation shock to taxes (T ) and government consumption (G) during “normal” times.
(a) Response of Y to a T shock (b) Response of Y to a G shock
(c) Response of C to a T shock (d) Response of C to a G shock
Note: One standard deviation confidence bands (dashed lines) are calculated using boot-strap simulations with 500 trials.
30
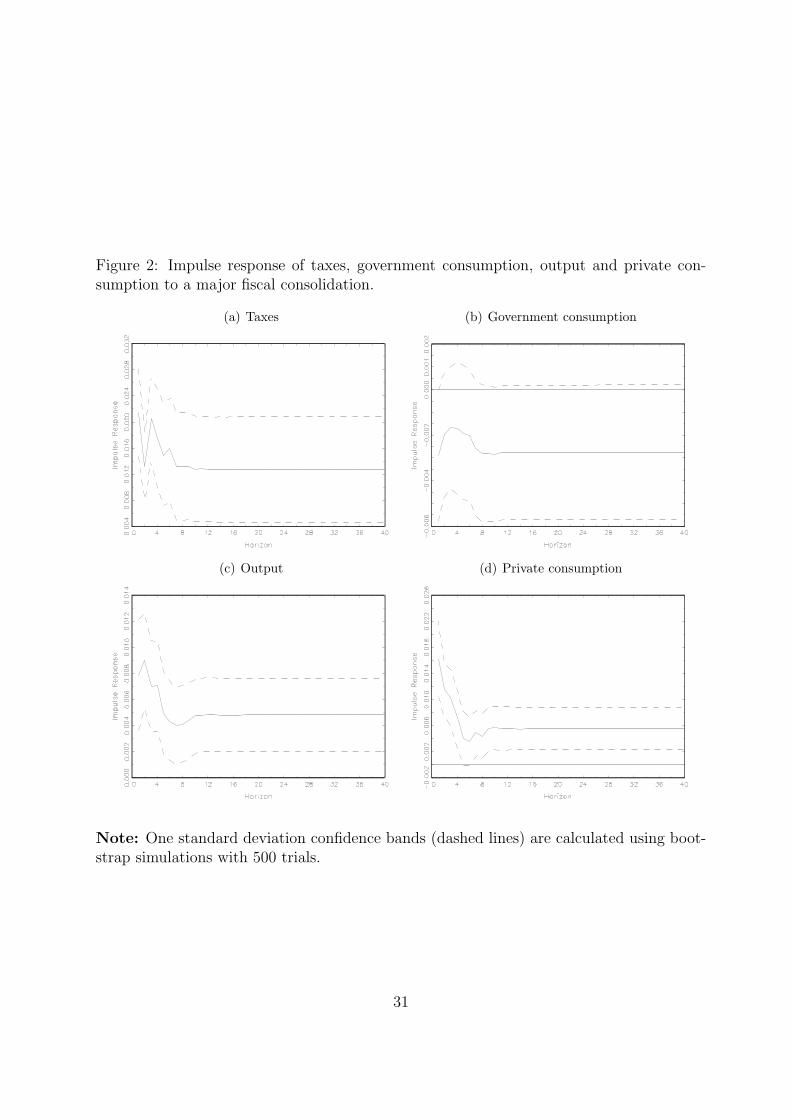
Figure 2: Impulse response of taxes, government consumption, output and private con-sumption to a major fiscal consolidation.
(a) Taxes (b) Government consumption
(c) Output (d) Private consumption
Note: One standard deviation confidence bands (dashed lines) are calculated using boot-strap simulations with 500 trials.
31
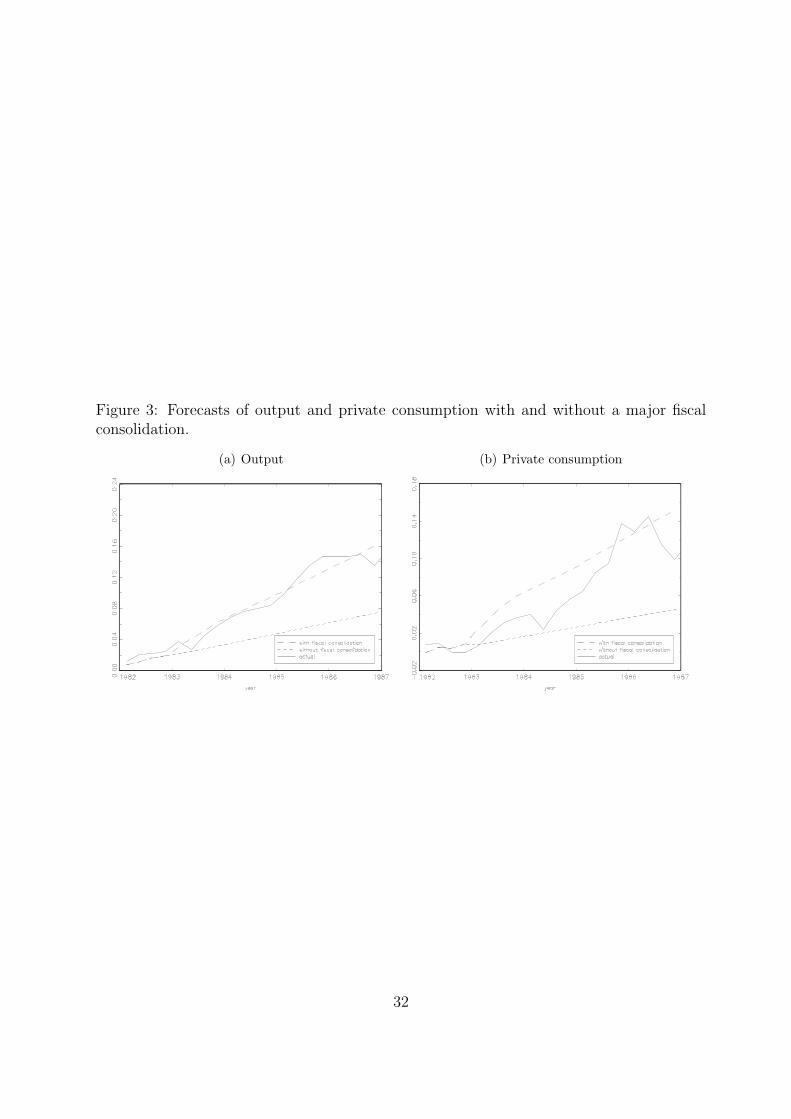
Figure 3: Forecasts of output and private consumption with and without a major fiscalconsolidation.
(a) Output (b) Private consumption
32

Fig
ure
4:Im
puls
ere
spon
seof
outp
ut
(Y)
and
pri
vate
consu
mpti
on(C
)to
aon
est
andar
ddev
iati
onsh
ock
tota
xes
(T),
gove
rnm
ent
consu
mpti
on(G
)an
dto
majo
rfisc
alco
nso
lidat
ion.
5–va
riab
leVA
Rm
odel
wit
hst
och
asti
ctr
ends.
(a)
Res
pons
eof
Yto
aT
shoc
k(b
)R
espo
nse
ofY
toa
Gsh
ock
(c)
Res
pons
eof
Cto
aT
shoc
k(d
)R
espo
nse
ofC
toa
Gsh
ock
(e)
Out
put
resp
onse
tofis
cal
con-
solid
atio
n(f
)P
riva
teco
nsum
ptio
nre
spon
seto
fisca
lco
nsol
idat
ion
(g)
Fore
cast
ofou
tput
(h)
Fore
cast
ofpr
ivat
eco
nsum
p-ti
on
Note
:O
ne
stan
dar
ddev
iati
onco
nfiden
ceban
ds
(das
hed
lines
)ar
eca
lcula
ted
usi
ng
boot
stra
psi
mula
tion
sw
ith
500
tria
ls.
33

Figure 5: Impulse response of output and private consumption to a one unit shock to the1983:1 dummy.
(a) Output (b) Private consumption
34