expanding opportunities through middle-skills … opportunities through middle-skills education ......
TRANSCRIPT
Expanding Opportunities Through Middle-Skills Education
Making it in today’s economy without some education beyond a high school diploma is becoming harder and harder. By 2020, almost two-thirds of all jobs will require some postsecondary training or education.1 Yet too many Americans are not maximizing their educational potential and are being left behind in today’s labor market.2 Closing these educational divides is critical to upholding the ideal that America is a land where anyone can succeed if they work hard enough. Increasing equitable access to four-year bachelor’s degrees, which are a proven pathway to economic mobility, must be a priority—bachelor’s degree recipients make nearly one million dollars more over their lifetimes than those that stop after high school, on average.3 Bachelor’s degrees are not the only road to success, though. Middle-skills pathways—which go beyond high school, but not as far as a four-year college degree—can help people achieve success in the labor market. In fact, many viable career paths do not require a bachelor’s degree: there are 44 million middle-skills jobs that pay more than the national median income.4 Expanding education opportunities and increasing quality are not only good for workers and their families, but are also good for communities and the economy as a whole. Investing in proven middle-skills pathways will enhance the skills of America’s workforce, boost U.S. competitiveness, and prepare a new generation of American workers for labor market success. By scaling up these programs, regional and local communities can effectively shape the workforce to meet the needs of employers while advancing opportunities for prosperity for workers.
Key Findings To ensure that middle-skills programs provide students with opportunities to succeed the economy of both today and tomorrow, they should embody a set of common principles:
• Expand career opportunities without limiting future options. • Teach skills that are in demand by local and regional employers. • Teach specific skill sets in addition to general skills. • Offer portable and stackable credentials that students can build upon. • Empower students to determine the best path for their future by improving access to
information. There are many proven middle-skills education and training models that have been shown to improve students’ labor market success.
• Career and technical education comprises career- and academic-oriented courses that lead to an industry-recognized credential, a certificate, or an associate degree.
• Apprenticeships combine on-the-job training and education with a paid work experience in a “learn while you earn” model.5
• Associate degrees are intermediate or terminal postsecondary degrees, generally completed after two years of classroom study.
• Early college high schools include postsecondary courses in a high school curriculum so that students gain experience and even graduate with an associate degree.
• Career academies combine both academic and career-technical courses into a curriculum for high school students.
2 | D e m o c r a t i c S t a f f o f t h e J o i n t E c o n o m i c C o m m i t t e e
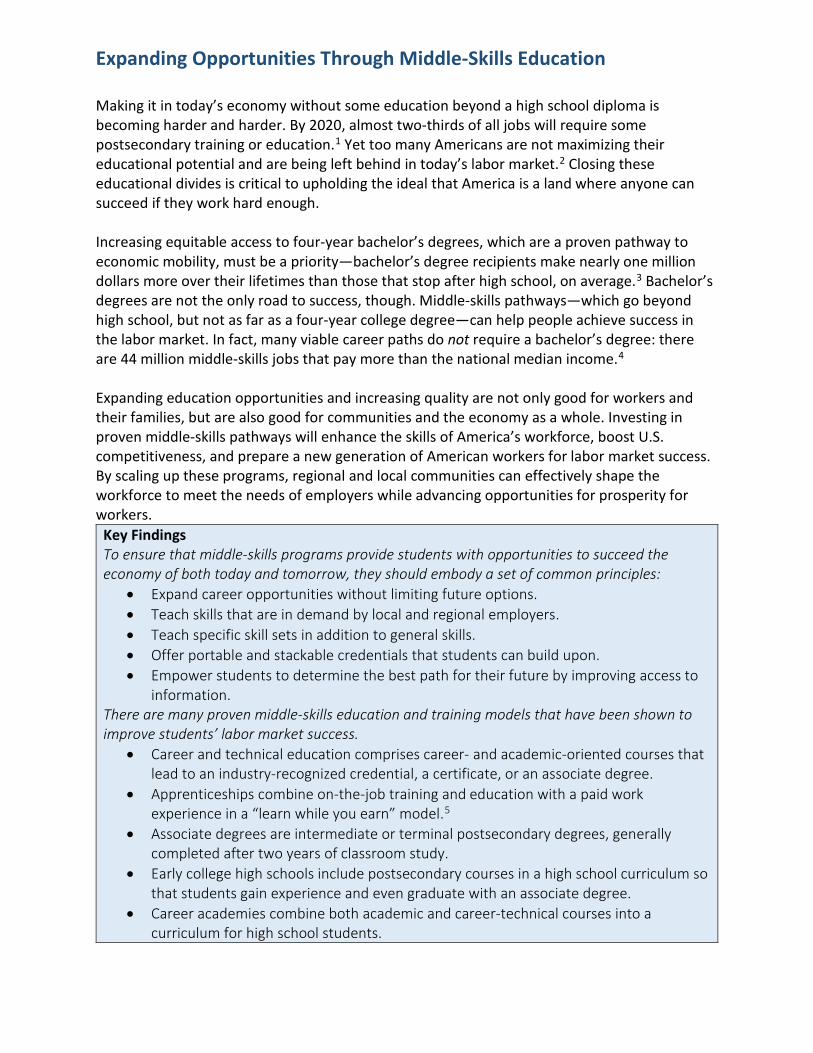
Middle-Skills Education Paves the Way to Economic Success Middle-skills education can yield highly valuable outcomes for students, ushering them into higher-paying careers often with substantially lower debt burdens than four-year alternatives.6 Middle-skills jobs make up one-third of all jobs in the United States, have an average annual salary of more than $45,000, and are projected to remain in demand in the future.7 More than a third of the top 30 fastest growing occupations are middle-skills occupations.8 Middle-skills training and education also increase earnings relative to a high school diploma.9 Moreover, middle-skills jobs comprise a diverse set of occupations, spanning all industries, including health care workers, legal assistants, police officers and engineering technicians.10 Many are in high-growth industries, such as health care and clean energy.
Middle-skills careers can be particularly important to specific communities and groups of students. For example, over half of rural workers have a middle-skills job.11 Given the projected growth in these occupations, middle-skills pathways will be critical sources of economic advancement for rural workers and communities. Women, who are more likely than men to work in middle-skills occupations—though they earn less on average—also stand to benefit from increased investment in middle-skills pathways. Additionally, as women are more likely to pursue post-secondary education, increased middle-skills opportunities will give them more options.12 These pathways are also promising options for students not prepared for a bachelor’s degree—only one in three high school seniors is prepared for college-level coursework in reading and math.13
Occupation Employment, 2016 Average Annual Wage Educational Requirements
Training Requirements
Projected employment growth, 2016-2026
Construction workers, eg Carpenter
1,025,600 $43,600High school diploma
or equivalentApprenticeship 9%
Electricians 666,900 $52,720High school diploma
or equivalentApprenticeship 9%
Computer support specialists, eg computer network support specialists
198,800 $62,670 Associate Degree None 8%
Radiation Therapists 19,100 $80,160 Associate Degree None 12%Legal Assistants and Paralegals 285,600 $49,500 Associate Degree None 15%
Police Officers and Sheriffs 684,200 $59,680High school diploma
or equivalentModerate-term on-
the-job training7%
Civil Engineering Technicians 74,500 $49,980 Associate Degree None 9%Licensed practical and licensed vocational nurses
724,500 $44,090Postsecondary
nondegree awardNone 12%
Examples of Prominent Middle-Skills Occupations
Source: BLS 2016-2026 Employment ProjectionsNote: Middle-skill occupations identified through JEC analysis of BLS Employment Projections. See endnote 4 for details.
3 | D e m o c r a t i c S t a f f o f t h e J o i n t E c o n o m i c C o m m i t t e e
Principles for High-Quality Pathways High-quality middle-skills pathways increase earnings and improve labor market prospects. However, there is a wide variation in the quality of programs.14 To ensure that these programs adequately equip students with the skills they need to succeed, they should embody the following set of principles. Expand Career Options without Limiting Future Paths In the past, some vocational education programs have been associated with “tracking” students. Students from disadvantaged backgrounds were put on career tracks while students from wealthier backgrounds are put on college-bound tracks. Instead, well-designed middle-skills programs should serve as a way for students to expand their postsecondary options rather than narrowing them.15 The majority of middle-skills careers require proficiency in high school-level math, reading, and writing skills in addition to soft skills—skills that help students become more employable, like communication and problem-solving. In many cases, the core competency skills for “middle-skill” careers overlap substantially with those needed for “high-skill” careers.16 Programs should ensure that students receive a high-quality secondary education that will support both a career and further education. Demand-Driven The middle-skills job market is dynamic, which means that the skill sets demanded by employers are ever-changing. If programs do not keep up with changing demand, students will struggle to find jobs when they finish their programs. Indeed, employers in many fields and areas of the country note that applicants don’t have the skills they are looking for.17 Curricula for middle-skills pathways should be aligned with the trends shaping our economy to meet the skill needs of workers and employers alike. Programs should be developed in conjunction with regional and local business needs so that students leave with skills that employers are looking for. This requires collaboration and relationships between education and training institutions and the business community.18 Structured Programs with Generalizable Skills Students who enter a middle-skills pathway with unclear or ill-defined goals tend to take longer to complete credentials and gain marketable skills.19 At the same time, if a program only teaches specific skills, students may find that demand for their expertise wanes over time as the economy requires new skills. Programs must provide a structured sequence of education and training, with clearly defined steps to achieving credentials or degrees. Within those courses, though, educators should focus on the nature of the work within the industry, and not just the technical aspects of a specific job.20 As the economy and the nature of work continue to change, it is necessary for workers to have the ability to adapt, which requires a broad understanding of skills related to the nature of the job.21
4 | D e m o c r a t i c S t a f f o f t h e J o i n t E c o n o m i c C o m m i t t e e
Portable, Stackable Credits Investing a substantial amount of time in a credential or degree is often not an option for students who don’t have the financial means to be a full-time student. Portable and stackable credentials can help students get to the job market faster and adapt to changing economic trends.22 For credits to be portable, they must be of a quality high enough so that other schools will readily accept them. This requires independent verification or accreditation, which signals program quality to both students and other institutions.23 Stackable credits promote career trajectories with on- and off-ramps that allow students to enter the workforce while keeping future education options open. Students can start a middle-skills program to acquire an in-demand credential, enter the workforce to take advantage of those newly acquired skills, and later pick back up with their education to advance their careers. Research shows that stackable credentials that are designed with clear labor market value in mind increase students’ future educational attainment.24 Empower Students to Make Decisions When making life-altering education and work choices, students often lack the information necessary to make informed decisions. As it stands, formal guidance at educational institutions is stretched thin. The average student-to-counselor ratio in middle and high schools is nearly 500 to 1, and one in five schools have no guidance counselors.25 In community colleges, that figure climbs to 1,000 students to 1 counselor.26 Moreover, while there is rich data on four-year degrees, there is far less information on middle-skills pathways for students to evaluate which choice is right for them. Improving access to information and providing guidance to students on available pathways, program requirements, and how a student can reach those goals are essential to helping students make the right decisions for their future. This requires that students not only have access to data on program quality and student outcomes—a critical need as program quality can vary widely—but also have someone to guide them through the process.27 When students have a clear understanding of the roadmap to completing a program of study, they are more likely to complete the program in a timely manner.28 Therefore, programs should incorporate career guidance into the curriculum, and should collect and make data available on student completion and graduate outcome measures. Existing Pathways There are many middle-skills pathways that help students get ahead, as outlined below. Middle-skills programs are often complementary, with various aspects of the different pathways intersecting in order to meet the needs of the communities and students that they serve.
5 | D e m o c r a t i c S t a f f o f t h e J o i n t E c o n o m i c C o m m i t t e e
Career and Technical Education Career and technical education (CTE) programs aim to prepare secondary and postsecondary students for the labor market, often in careers in growing sectors like health care or clean energy.29 The education and training that students receive generally lead to an industry-recognized credential, a certificate, or an associate degree.30 At the high school level, effective CTE provides career exploration to students, emphasizes the skills necessary to be college and career ready at graduation, and allows students to earn college credit.31 This includes equipping students with general employment skills such as basic technological requirements and soft skills such as communication, teamwork, and problem-solving that are necessary to ensure that the program expands career opportunities without limiting future paths. At the postsecondary level, CTE prepares students for specific careers and occupations through an associate degree, industry-recognized credit or certificate, or noncredit course or training. Many postsecondary CTE programs are offered through technical or community colleges. Research shows that high-quality CTE programs can increase a student’s future earnings. CTE programs in the California Community College system increased student earnings on average by 10 percent for short-term certificate programs and by over 25 percent for CTE associate degree programs.32 The level of coursework also matters, as CTE programs offer both introductory and specialized coursework within a vocational discipline. Evidence shows that the specialized courses in technical fields are most effective at increasing students’ future wages, suggesting that CTE programs should focus on depth rather than breadth.33
CTE in Action The Kentucky Community and Technical College System (KCTCS) is an example of a multi-faceted, statewide CTE approach that combines secondary, postsecondary, and adult and workplace education. Career pathway options range from business and information technology to natural resources and energy. Programs provide the opportunity to earn portable and stackable credits that lead to an associate degree, industry-recognized certificate, or baccalaureate degree. KCTCS’s programs are demand driven, ensuring that pathways meet the needs of regional, state, and local labor markets through collaboration between secondary and postsecondary institutions, the Kentucky Office of Employment and Training, and employers across the state. KCTCS prepares students for the labor market through rigorous academic courses and work-based learning opportunities.34 For example, the Elizabethtown campus’s Engineering and Electronics Technology department offers structured programs where students can earn certificates, diplomas, applied sciences degrees, or transfer into a four-year degree program. Graduates have gone on to a variety of careers, including chemical plant and system operators and electronic engineering technicians, who earn average annual salaries of $49,199 and $43,731 respectively.35
6 | D e m o c r a t i c S t a f f o f t h e J o i n t E c o n o m i c C o m m i t t e e
Apprenticeships and Work-Based Learning Registered apprenticeships combine academic instruction, skills training, and work through a Department of Labor-certified arrangement between a worker and a company, union, or nonprofit organization.36 These programs help break down the financial barriers that prevent workers from continuing their education by providing the opportunity to earn money while they learn skills. In addition to better financial security, workers gain tangible work experience and customized occupational skills and knowledge that are essential to future success, such as the ability to communicate, problem-solve, and navigate work relationships. Expanding registered apprenticeship programs is good for both workers and businesses. The placement rate for registered apprentices after program completion is 91 percent, and evidence shows that those who complete a registered program make roughly $240,000 more in lifetime earnings than their peers, on average.37 Businesses also benefit; in Canada, for example, for every $1 invested in apprenticeship programs, employers receive $1.47 in return.38 Since apprenticeships are driven by employer demand, there is no threat of a mismatch between skills that local employers need and those that workers learn, boosting productivity in the workplace.39
Apprenticeship in Action The New Mexico Information Technology Apprenticeship Program (NMITAP) is the first registered apprenticeship program in information and health technology in the state, offering both job training and technical instruction. The tech industry continues to grow in New Mexico: during the fourth quarter of 2016, there were over 2,000 tech job openings.40 NMITAP offers demand-driven apprenticeship programs by partnering with New Mexican businesses and organizations. Recently, NMITAP has announced partnerships with Presbyterian Medical—New Mexico’s largest health system—and Hewlett Packard. NMITAP addresses the needs of the community while preparing participants for today and tomorrow’s economy. NMITAP also provides apprentices with career and achievement coaching to empower students to make informed decisions about their careers.
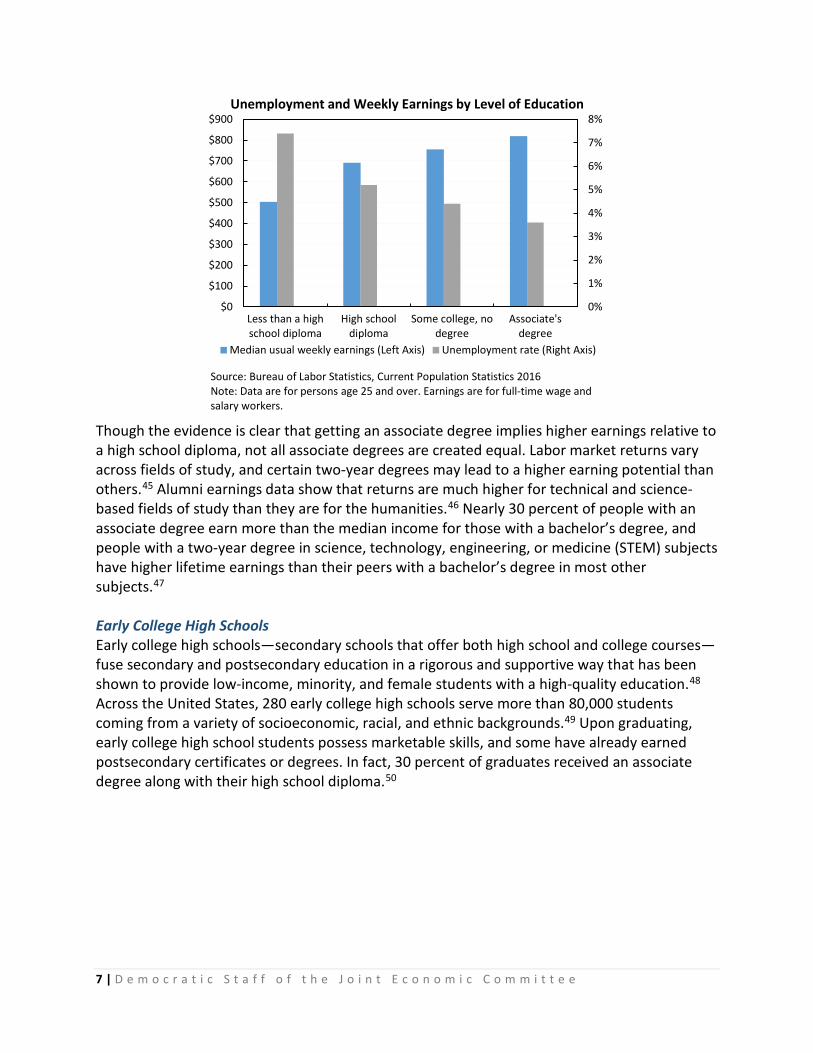
Associate Degrees Associate degrees encompass a broad umbrella of middle-skills options, and provide training in academic, professional, and career and technical programs.41 Well-designed associate degrees can set students up for success by increasing their potential for higher earnings and furthering their education.42 Associate degrees can also be portable and stackable, allowing recipients to continue on to bachelor’s degrees after graduation. Associate degree earners tend to experience better earnings and have a higher likelihood of being employed than those with high school diplomas or those who went to college but did not earn a degree. In 2016, the unemployment rate for people who earned an associate degree was 3.6 percent, 1.6 percentage points lower than the unemployment rate for those who only held a high school diploma.43 Not only are these individuals holding jobs, they earn higher incomes as well. Associate degree recipients earn 35 to 40 percent more than high school graduates.44
7 | D e m o c r a t i c S t a f f o f t h e J o i n t E c o n o m i c C o m m i t t e e
0%
1%
2%
3%
4%
5%
6%
7%
8%
$0
$100
$200
$300
$400
$500
$600
$700
$800
$900
Less than a highschool diploma
High schooldiploma
Some college, nodegree
Associate'sdegree
Median usual weekly earnings (Left Axis) Unemployment rate (Right Axis)
Unemployment and Weekly Earnings by Level of Education
Source: Bureau of Labor Statistics, Current Population Statistics 2016 Note: Data are for persons age 25 and over. Earnings are for full-time wage and salary workers.
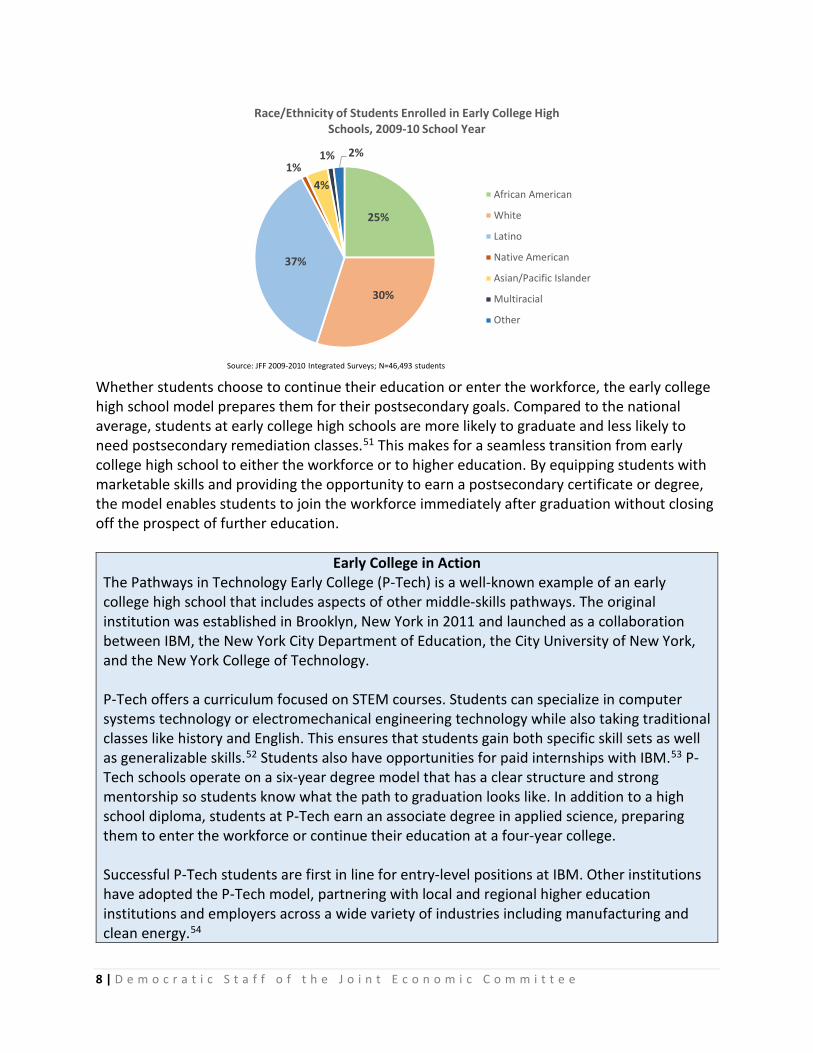
Though the evidence is clear that getting an associate degree implies higher earnings relative to a high school diploma, not all associate degrees are created equal. Labor market returns vary across fields of study, and certain two-year degrees may lead to a higher earning potential than others.45 Alumni earnings data show that returns are much higher for technical and science-based fields of study than they are for the humanities.46 Nearly 30 percent of people with an associate degree earn more than the median income for those with a bachelor’s degree, and people with a two-year degree in science, technology, engineering, or medicine (STEM) subjects have higher lifetime earnings than their peers with a bachelor’s degree in most other subjects.47 Early College High Schools Early college high schools—secondary schools that offer both high school and college courses—fuse secondary and postsecondary education in a rigorous and supportive way that has been shown to provide low-income, minority, and female students with a high-quality education.48 Across the United States, 280 early college high schools serve more than 80,000 students coming from a variety of socioeconomic, racial, and ethnic backgrounds.49 Upon graduating, early college high school students possess marketable skills, and some have already earned postsecondary certificates or degrees. In fact, 30 percent of graduates received an associate degree along with their high school diploma.50
8 | D e m o c r a t i c S t a f f o f t h e J o i n t E c o n o m i c C o m m i t t e e
Whether students choose to continue their education or enter the workforce, the early college high school model prepares them for their postsecondary goals. Compared to the national average, students at early college high schools are more likely to graduate and less likely to need postsecondary remediation classes.51 This makes for a seamless transition from early college high school to either the workforce or to higher education. By equipping students with marketable skills and providing the opportunity to earn a postsecondary certificate or degree, the model enables students to join the workforce immediately after graduation without closing off the prospect of further education.
Early College in Action The Pathways in Technology Early College (P-Tech) is a well-known example of an early college high school that includes aspects of other middle-skills pathways. The original institution was established in Brooklyn, New York in 2011 and launched as a collaboration between IBM, the New York City Department of Education, the City University of New York, and the New York College of Technology. P-Tech offers a curriculum focused on STEM courses. Students can specialize in computer systems technology or electromechanical engineering technology while also taking traditional classes like history and English. This ensures that students gain both specific skill sets as well as generalizable skills.52 Students also have opportunities for paid internships with IBM.53 P-Tech schools operate on a six-year degree model that has a clear structure and strong mentorship so students know what the path to graduation looks like. In addition to a high school diploma, students at P-Tech earn an associate degree in applied science, preparing them to enter the workforce or continue their education at a four-year college. Successful P-Tech students are first in line for entry-level positions at IBM. Other institutions have adopted the P-Tech model, partnering with local and regional higher education institutions and employers across a wide variety of industries including manufacturing and clean energy.54
25%
30%
37%
1%4%
1% 2%
Race/Ethnicity of Students Enrolled in Early College High Schools, 2009-10 School Year
African American
White
Latino
Native American
Asian/Pacific Islander
Multiracial
Other
Source: JFF 2009-2010 Integrated Surveys; N=46,493 students
9 | D e m o c r a t i c S t a f f o f t h e J o i n t E c o n o m i c C o m m i t t e e
Career Academies Operating within traditional high schools, career academies are small learning communities that offer career-related secondary education.55 Students apply to enroll in the academies, which typically serve about students 150 to 200 students and encourage a personalized learning environment.56 The curriculum features industry-specific training that ensures that students gain technical skills relevant to their chosen career path. Through collaboration with local employers and civic leaders, academies also offer work-based learning experiences such as internships, mentorships, and part-time jobs.57 There are over 7,000 career academies nationwide, which have been shown increase students’ earnings.58 Students earn about $216 more per month post-graduation compared to non-career academy students.59
Career Academies in Action Since 1982, the National Academy Foundation (NAF) has partnered with high schools to bring businesses and community leaders together to create career academies in high-need communities. During the 2016-17 school year, there were 675 NAF career academies serving nearly 100,000 students in 36 states. Among these academies, the graduation rate was 96 percent, compared to a national average of 83 percent.60 NAF builds upon the traditional high school curriculum to offer STEM and industry-specific courses complemented by work-based learning experiences. The combination ensures that career academies expand opportunities for students without limiting future pathways. Its original academy, NAF Academy of Finance in New York City, prepares students for careers in business, with an emphasis on instruction in accounting, insurance, banking and credit, financial computing, international investments, financial planning, and securities. Local financial service employers offer students part-time jobs and paid internships during the school year and summers.61
Other Promising Pathways In addition to the well-established pathways mentioned above, there are many promising models that have the potential to meet 21st century education and training needs. Dual-enrollment programs allow students enrolled in a traditional high school to take free college-level courses while earning credit toward both a high school diploma and a college degree.62 Research shows that dual-enrollment programs increase students’ academic performance and educational attainment.63 Dual-enrollment programs also provide benefits to states and local communities by promoting the integration of secondary and postsecondary institutions and the business community in order to shape the workforce with relevant skills and training. Accelerated credentials and boot camps provide specific, industry-relevant skills that typically take place over a short but intensive time period. While they are sometimes offered without credit, accelerated credential programs give students quick access to an industry-relevant skill set. Because these programs are often taught by noninstitutional providers, they often can quickly adapt to changing market forces to teach the skills that employers are seeking. Coding
10 | D e m o c r a t i c S t a f f o f t h e J o i n t E c o n o m i c C o m m i t t e e
boot camps are the best-known example of this type of promising pathway, but there are similar opportunities in sales, automotive technology, and health care.64 Overall, this model aims to increase worker marketability by providing up-to-date, industry-relevant knowledge and skills training. Centers of excellence at community and technical colleges aim to integrate business, industry, and labor needs with workforce education and training initiatives across all industry sectors, such as health care, advanced manufacturing, and clean technology. Centers seek to balance workforce supply and demand in each industry by supporting rigorous, innovative, and relevant workforce education and training. Additionally, centers act as a resource hub for the collection and dissemination of information related to industry trends, best practices, innovative curricula, and professional development.65 Conclusion As Congress looks to invest in education for all, it has an opportunity to help Americans succeed in the workforce and bolster U.S. competitiveness by strengthening middle-skills pathways. Existing programs, including associate degrees, apprenticeships, and career and technical education, equip workers with skills they need in the economy of both today and tomorrow. These programs are important today and they can be stronger tomorrow. By promoting additional collaboration between employers and postsecondary institutions, building on best practices, and working to scale proven programs, policymakers can ensure that middle-skills pathways meet the needs of employers and prepare workers to compete in the increasingly competitive global economy. As discussed in this report, successful middle-skills programs expand career opportunities, teach skills that are in demand and generalizable, provide clear guidelines to completion, offer portable and stackable credentials, and equip students with information that enables them to determine the best path for them. Ensuring that these core principles undergird federal middle-skills initiatives will go a long way toward preparing U.S. workers to succeed in the economy of tomorrow.
Appendix
StatePercent of Jobs
that are Middle-Skill
Middle-Skill Average Annual
Wage
Middle-Skill Projected Job
Growth
Registered Apprenticeship
Programs
Active Registered Apprentices
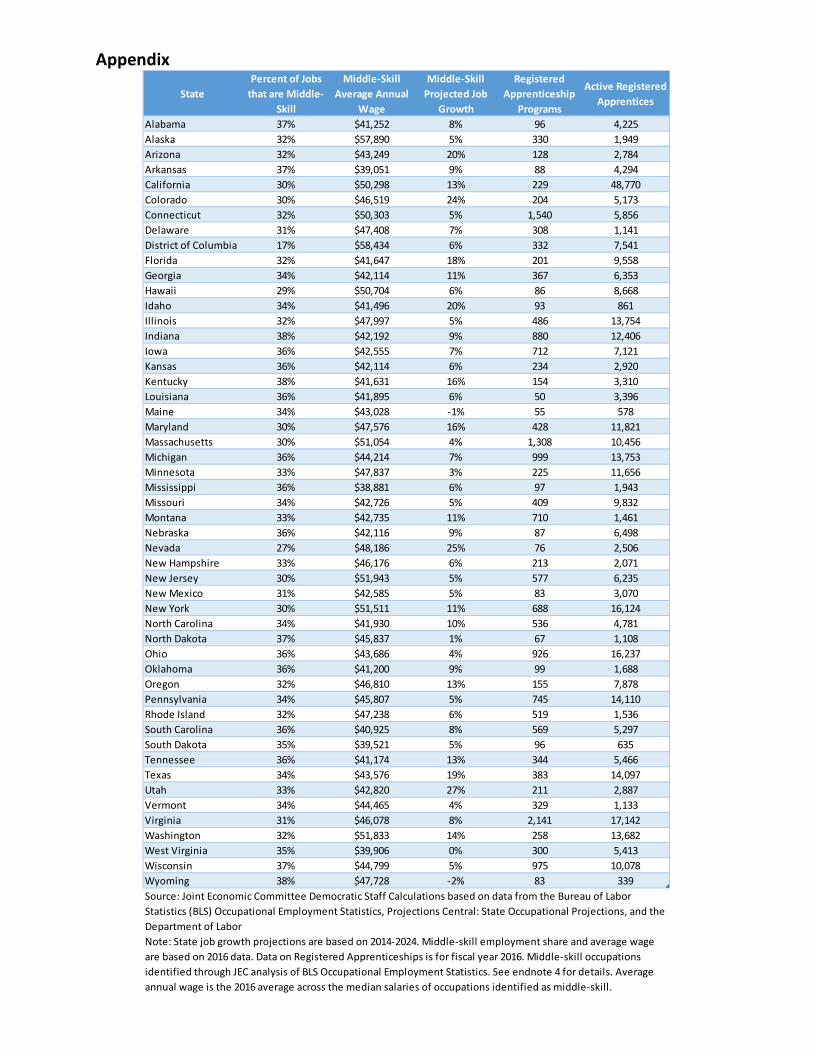
Alabama 37% $41,252 8% 96 4,225Alaska 32% $57,890 5% 330 1,949Arizona 32% $43,249 20% 128 2,784Arkansas 37% $39,051 9% 88 4,294California 30% $50,298 13% 229 48,770Colorado 30% $46,519 24% 204 5,173Connecticut 32% $50,303 5% 1,540 5,856Delaware 31% $47,408 7% 308 1,141District of Columbia 17% $58,434 6% 332 7,541Florida 32% $41,647 18% 201 9,558Georgia 34% $42,114 11% 367 6,353Hawaii 29% $50,704 6% 86 8,668Idaho 34% $41,496 20% 93 861Illinois 32% $47,997 5% 486 13,754Indiana 38% $42,192 9% 880 12,406Iowa 36% $42,555 7% 712 7,121Kansas 36% $42,114 6% 234 2,920Kentucky 38% $41,631 16% 154 3,310Louisiana 36% $41,895 6% 50 3,396Maine 34% $43,028 -1% 55 578Maryland 30% $47,576 16% 428 11,821Massachusetts 30% $51,054 4% 1,308 10,456Michigan 36% $44,214 7% 999 13,753Minnesota 33% $47,837 3% 225 11,656Mississippi 36% $38,881 6% 97 1,943Missouri 34% $42,726 5% 409 9,832Montana 33% $42,735 11% 710 1,461Nebraska 36% $42,116 9% 87 6,498Nevada 27% $48,186 25% 76 2,506New Hampshire 33% $46,176 6% 213 2,071New Jersey 30% $51,943 5% 577 6,235New Mexico 31% $42,585 5% 83 3,070New York 30% $51,511 11% 688 16,124North Carolina 34% $41,930 10% 536 4,781North Dakota 37% $45,837 1% 67 1,108Ohio 36% $43,686 4% 926 16,237Oklahoma 36% $41,200 9% 99 1,688Oregon 32% $46,810 13% 155 7,878Pennsylvania 34% $45,807 5% 745 14,110Rhode Island 32% $47,238 6% 519 1,536South Carolina 36% $40,925 8% 569 5,297South Dakota 35% $39,521 5% 96 635Tennessee 36% $41,174 13% 344 5,466Texas 34% $43,576 19% 383 14,097Utah 33% $42,820 27% 211 2,887Vermont 34% $44,465 4% 329 1,133Virginia 31% $46,078 8% 2,141 17,142Washington 32% $51,833 14% 258 13,682West Virginia 35% $39,906 0% 300 5,413Wisconsin 37% $44,799 5% 975 10,078Wyoming 38% $47,728 -2% 83 339Source: Joint Economic Committee Democratic Staff Calculations based on data from the Bureau of Labor Statistics (BLS) Occupational Employment Statistics, Projections Central: State Occupational Projections, and the Department of LaborNote: State job growth projections are based on 2014-2024. Middle-skill employment share and average wage are based on 2016 data. Data on Registered Apprenticeships is for fiscal year 2016. Middle-skill occupations identified through JEC analysis of BLS Occupational Employment Statistics. See endnote 4 for details. Average annual wage is the 2016 average across the median salaries of occupations identified as middle-skill.
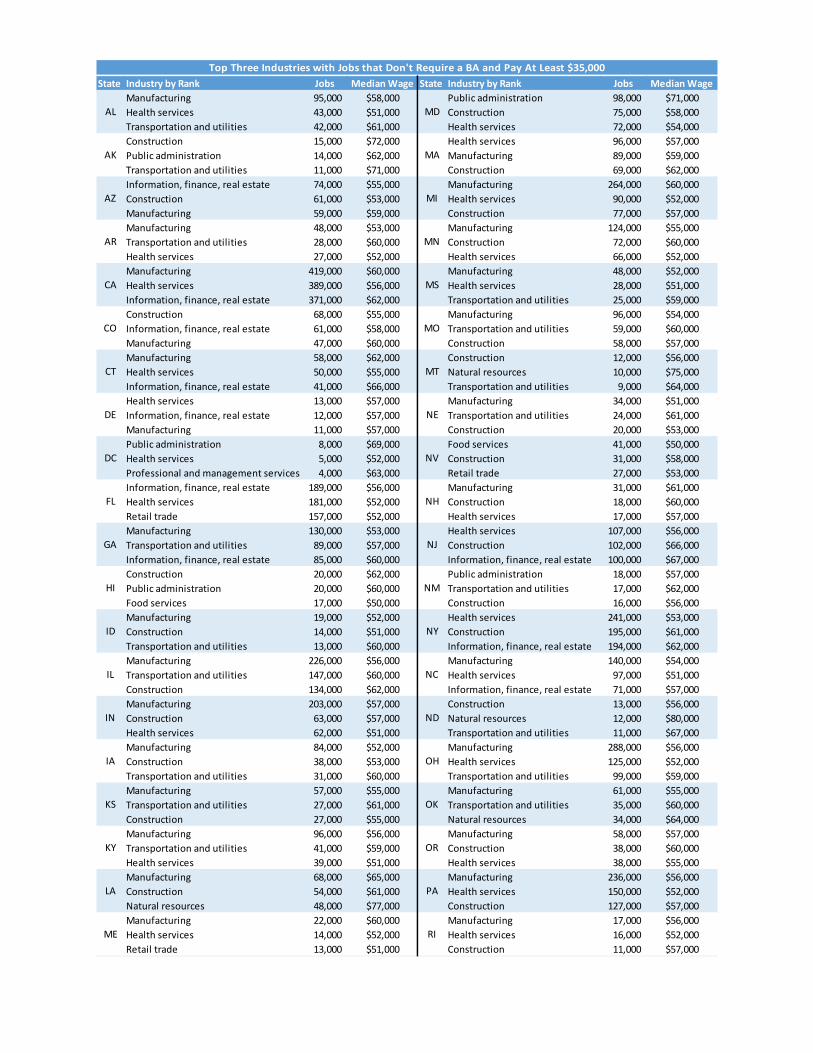
State Industry by Rank Jobs Median Wage State Industry by Rank Jobs Median WageManufacturing 95,000 $58,000 Public administration 98,000 $71,000Health services 43,000 $51,000 Construction 75,000 $58,000Transportation and utilities 42,000 $61,000 Health services 72,000 $54,000Construction 15,000 $72,000 Health services 96,000 $57,000Public administration 14,000 $62,000 Manufacturing 89,000 $59,000Transportation and utilities 11,000 $71,000 Construction 69,000 $62,000Information, finance, real estate 74,000 $55,000 Manufacturing 264,000 $60,000Construction 61,000 $53,000 Health services 90,000 $52,000Manufacturing 59,000 $59,000 Construction 77,000 $57,000Manufacturing 48,000 $53,000 Manufacturing 124,000 $55,000Transportation and utilities 28,000 $60,000 Construction 72,000 $60,000Health services 27,000 $52,000 Health services 66,000 $52,000Manufacturing 419,000 $60,000 Manufacturing 48,000 $52,000Health services 389,000 $56,000 Health services 28,000 $51,000Information, finance, real estate 371,000 $62,000 Transportation and utilities 25,000 $59,000Construction 68,000 $55,000 Manufacturing 96,000 $54,000Information, finance, real estate 61,000 $58,000 Transportation and utilities 59,000 $60,000Manufacturing 47,000 $60,000 Construction 58,000 $57,000Manufacturing 58,000 $62,000 Construction 12,000 $56,000Health services 50,000 $55,000 Natural resources 10,000 $75,000Information, finance, real estate 41,000 $66,000 Transportation and utilities 9,000 $64,000Health services 13,000 $57,000 Manufacturing 34,000 $51,000Information, finance, real estate 12,000 $57,000 Transportation and utilities 24,000 $61,000Manufacturing 11,000 $57,000 Construction 20,000 $53,000Public administration 8,000 $69,000 Food services 41,000 $50,000Health services 5,000 $52,000 Construction 31,000 $58,000Professional and management services 4,000 $63,000 Retail trade 27,000 $53,000Information, finance, real estate 189,000 $56,000 Manufacturing 31,000 $61,000Health services 181,000 $52,000 Construction 18,000 $60,000Retail trade 157,000 $52,000 Health services 17,000 $57,000Manufacturing 130,000 $53,000 Health services 107,000 $56,000Transportation and utilities 89,000 $57,000 Construction 102,000 $66,000Information, finance, real estate 85,000 $60,000 Information, finance, real estate 100,000 $67,000Construction 20,000 $62,000 Public administration 18,000 $57,000Public administration 20,000 $60,000 Transportation and utilities 17,000 $62,000Food services 17,000 $50,000 Construction 16,000 $56,000Manufacturing 19,000 $52,000 Health services 241,000 $53,000Construction 14,000 $51,000 Construction 195,000 $61,000Transportation and utilities 13,000 $60,000 Information, finance, real estate 194,000 $62,000Manufacturing 226,000 $56,000 Manufacturing 140,000 $54,000Transportation and utilities 147,000 $60,000 Health services 97,000 $51,000Construction 134,000 $62,000 Information, finance, real estate 71,000 $57,000Manufacturing 203,000 $57,000 Construction 13,000 $56,000Construction 63,000 $57,000 Natural resources 12,000 $80,000Health services 62,000 $51,000 Transportation and utilities 11,000 $67,000Manufacturing 84,000 $52,000 Manufacturing 288,000 $56,000Construction 38,000 $53,000 Health services 125,000 $52,000Transportation and utilities 31,000 $60,000 Transportation and utilities 99,000 $59,000Manufacturing 57,000 $55,000 Manufacturing 61,000 $55,000Transportation and utilities 27,000 $61,000 Transportation and utilities 35,000 $60,000Construction 27,000 $55,000 Natural resources 34,000 $64,000Manufacturing 96,000 $56,000 Manufacturing 58,000 $57,000Transportation and utilities 41,000 $59,000 Construction 38,000 $60,000Health services 39,000 $51,000 Health services 38,000 $55,000Manufacturing 68,000 $65,000 Manufacturing 236,000 $56,000Construction 54,000 $61,000 Health services 150,000 $52,000Natural resources 48,000 $77,000 Construction 127,000 $57,000Manufacturing 22,000 $60,000 Manufacturing 17,000 $56,000Health services 14,000 $52,000 Health services 16,000 $52,000Retail trade 13,000 $51,000 Construction 11,000 $57,000
AZ
NV
AR
NH
AL
MT
AK
NE
MA
CT
DE
NC
CA
NJ
CO
NM
GA
HI
DC
ND
FL
OH
NY
IA
ID
PA
IL
RI
OK
ME
OR
MD
LA
KS
KY
IN
MI
MN
MS
MO
Top Three Industries with Jobs that Don't Require a BA and Pay At Least $35,000
13 | D e m o c r a t i c S t a f f o f t h e J o i n t E c o n o m i c C o m m i t t e e
1 Carnevale, Anthony P., Tamara Jayasundera, and Andrew R. Hanson. 2012. “Five Ways that Pay Along the Way to the B.A.” Georgetown Center on Education and the Workforce. 2 JEC. 2017. “Education: The Foundation for Economic Success.” 3 Ibid. 4 JEC democratic staff calculations based on data from the BLS 2016-2026 Employment Projections and Education and Training Requirements. Middle skills occupations are defined as occupations that require an associate degree; postsecondary non-degree award; some college, no degree; or a high school degree and one of the following: apprenticeship, long-term on-the-job training, moderate on-the-job training, or work experience. Real median personal income was $31,099 in 2016. 5 United States Department of Labor. ApprenticeshipUSA Toolkit. 6 Cellini, Stephanie Riegg and Rajeev Darolia. 2016. “Different degrees of debt: Student borrowing in the for-profit, nonprofit, and public sectors.” Brown Center on Education Policy at Brookings; and Schneider, Mark and Rooney Columbus. 2017. “Degrees of Opportunity: Lessons Learned from State-Level Data on Postsecondary Earnings Outcomes.” American Enterprise Institute. 7 JEC democratic staff calculations based on data from the BLS 2016-2026 Employment Projections and Education and Training Requirements. Middle skills occupations are defined as occupations that require an associate degree; postsecondary non-degree award; some college, no degree; or a high school degree and one of the following: apprenticeship, long-term on-the-job training, moderate on-the-job training, or work experience. 8 JEC democratic staff calculations based on data from the BLS 2016-2026 Employment Projections and Education and Training Requirements, Tables 1.3, 1.4 and 1.12. Middle skills occupations are defined as occupations that require an associate degree; postsecondary non-degree award; some college, no degree; or a high school degree and one of the following: apprenticeship, long-term on-the-job training, moderate on-the-job training, or work experience. 9 Rothwell, Jonathan. 2015. “Defining Skilled Technical Work.” Paper prepared for National Academies Board on Science, Technology, and Economic Policy, Project on “The Supply Chain for Middle-Skilled Jobs: Education. Training and Certification Pathways.” 10 Achieve. 2012. “The Future of the U.S. Workforce: Middle Skills Jobs and the Growing Importance of Postsecondary Education.” 11 Young, Justin R. “Middle-Skill Jobs Remain More Common Among Rural Workers.” University of New Hampshire Carsey Institute Issue Brief No. 63. 12 Hegewisch, Ariane, et al. 2016 “Pathways to Equity: Narrowing the Wage Gap by Improving Women’s Access to Good Middle-Skill Jobs.” Institute for Women’s Policy Research. 13 https://www.usnews.com/news/articles/2016-04-27/high-school-seniors-arent-college-ready-naep-data-show
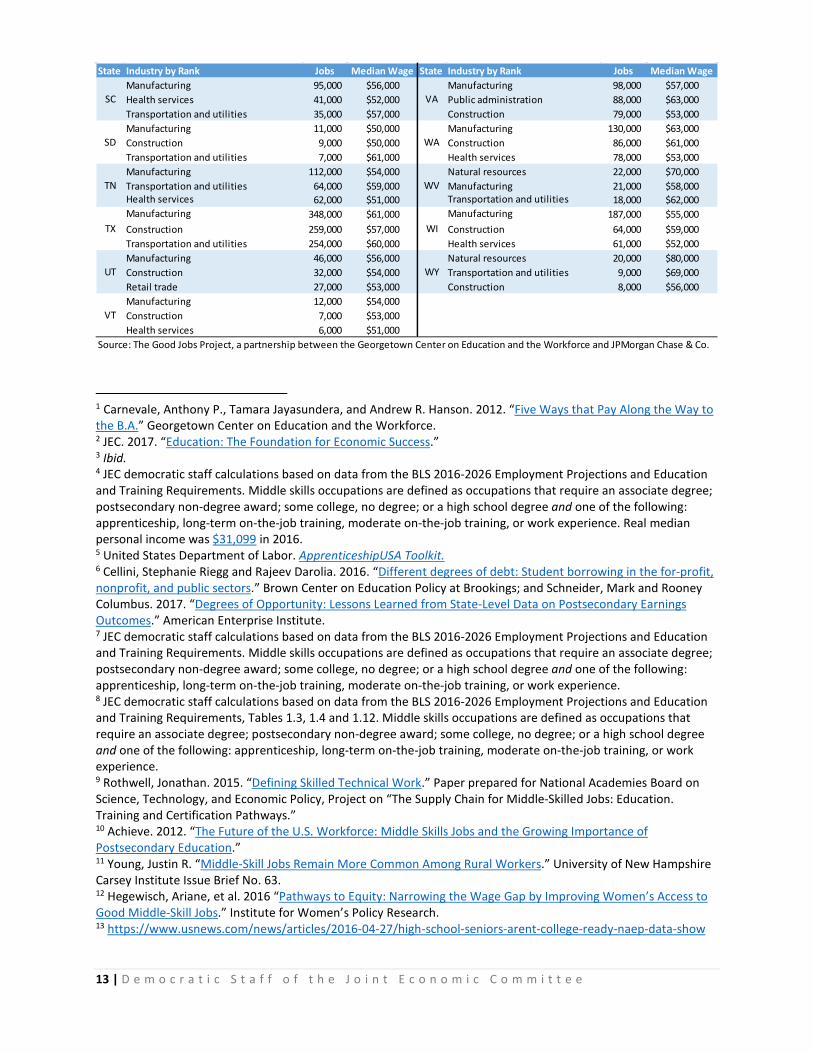
State Industry by Rank Jobs Median Wage State Industry by Rank Jobs Median WageManufacturing 95,000 $56,000 Manufacturing 98,000 $57,000Health services 41,000 $52,000 Public administration 88,000 $63,000Transportation and utilities 35,000 $57,000 Construction 79,000 $53,000Manufacturing 11,000 $50,000 Manufacturing 130,000 $63,000Construction 9,000 $50,000 Construction 86,000 $61,000Transportation and utilities 7,000 $61,000 Health services 78,000 $53,000Manufacturing 112,000 $54,000 Natural resources 22,000 $70,000Transportation and utilities 64,000 $59,000 Manufacturing 21,000 $58,000Health services 62,000 $51,000 Transportation and utilities 18,000 $62,000Manufacturing 348,000 $61,000 Manufacturing 187,000 $55,000Construction 259,000 $57,000 Construction 64,000 $59,000Transportation and utilities 254,000 $60,000 Health services 61,000 $52,000Manufacturing 46,000 $56,000 Natural resources 20,000 $80,000Construction 32,000 $54,000 Transportation and utilities 9,000 $69,000Retail trade 27,000 $53,000 Construction 8,000 $56,000Manufacturing 12,000 $54,000Construction 7,000 $53,000Health services 6,000 $51,000
WY
VA
TX
WV
UT
WI
WA
SC
SD
Source: The Good Jobs Project, a partnership between the Georgetown Center on Education and the Workforce and JPMorgan Chase & Co.
TN
VT
14 | D e m o c r a t i c S t a f f o f t h e J o i n t E c o n o m i c C o m m i t t e e
14 Backes, Benjamin, Harry J. Holzer, and Erin Dunlop Velez. 2015. “Is It Worth It? Postsecondary Education and Labor Market Outcomes for the Disadvantaged.” IZA Journal of Labor Policy (2015) 4:1; de Alva, Jorge Klor and Mark Schneider. 2013. “What’s the Value of an Associate’s Degree? The Return on Investment for Graduates and Taxpayers.” Nexus Research and Policy center and American Institutes for Research; and Schneider, Mark. 2016. “Majors Matter: Differences in Wages Over Time in Texas.” College Measures’ Economic Success Metrics. 15 Symonds, William C., Robert Schwartz, and Ronald F. Ferguson. 2011. “Pathways to prosperity: Meeting the challenge of preparing young Americans for the 21st century.” Pathways to Prosperity Project, Harvard University Graduate School of Education. 16 Based on a comparison of the necessary competencies for careers in highway & civil construction and those in financial services. Careeronestop Competency Model Clearinghouse. Industry models. 17 Dunkelberg, William C. and Holly Wade. 2015. “NFIB Small Business Economic Trends.” National Federation of Independent Businesses. 18 Holzer, Harry J. 2015. “Sector-Based Training Strategies: The Challenges of Matching Workers and Their Skills to Well-Paying Jobs.” Paper prepared for the Symposium on the Changing Structure of Work at the U.S. Department of Labor, December 10, 2015. 19 Jobs for the Future. 2017. “Building Pathways to Credentials, Careers, and Economic Mobility.” 20 Loiero, Michael, Will Markow, and Gabriel Ellsworth. 2013. “Bridge the Gap: Rebuilding America’s Middle Skills.” Accenture, Burning Glass, and Harvard Business School. 21 Ibid. 22 Austin, James T. et al. 2012. “Portable, Stackable Credentials: A New Education Model for Industry-Specific Career Pathways.” McGraw-Hill Research Foundation. 23 Ibid. 24 Giana, Matthew and Heather Lee Fox. 2016. “Do stackable credentials reinforce stratification or promote upward mobility? An analysis of health professions pathways reform in a community college consortium.” Journal of Vocational Education and Training, 69(1), 100-122. 25 American School Counselor Association. “Student-to-School-Counselor Ratio 2014-2015.”; and Department of Education. 2014. “Data Snapshot: Teacher Equity.” Civil Rights Data Collection Issue Brief no. 4. 26 Symonds, William C., Robert Schwartz, and Ronald F. Ferguson. 2011. “Pathways to prosperity: Meeting the challenge of preparing young Americans for the 21st century.” Pathways to Prosperity Project, Harvard University Graduate School of Education. 27 Backes, Benjamin, Harry J. Holzer, and Erin Dunlop Velez. 2015. “Is It Worth It? Postsecondary Education and Labor Market Outcomes for the Disadvantaged.” IZA Journal of Labor Policy (2015) 4:1; de Alva, Jorge Klor and Mark Schneider. 2013. “What’s the Value of an Associate’s Degree? The Return on Investment for Graduates and Taxpayers.” Nexus Research and Policy center and American Institutes for Research; and Schneider, Mark. 2016. “Majors Matter: Differences in Wages Over Time in Texas.” College Measures’ Economic Success Metrics. 28 Jobs for the Future. 2017. “Building Pathways to Credentials, Careers, and Economic Mobility.” 29 Granocskiy, Boris… 2016. “Carl D. Perkins Career and Technical Education Act of 2006: An Overview.” Congressional Research Service. 30 Ibid. 31 Carnevale, Anthony P., Tamara Jayasundera, and Andrew R. Hanson. 2012. “Five Ways that Pay Along the Way to the B.A.” Georgetown Center on Education and the Workforce; Washington Workforce Training and Education Coordinating Board. “CTE: An Investment in Success.”; and see also Kreisman, Daniel and Kevin Strange. 2017. “Vocational and Career Tech Education in American High Schools: The Value of Depth Over Breadth.” NBER Working Paper No. 23851. 32 Stevens, Ann Huff, Michal Kurlaender, and Michel Grosz. 2015. “Career Technical Education and Labor Market Outcomes: Evidence from California Community Colleges.” NBER Working Paper No. 21137. 33 Kreisman, Daniel and Kevin Strange. 2017. “Vocational and Career Tech Education in American High Schools: The Value of Depth Over Breadth.” NBER Working Paper No. 23851. 34 Austin, James T. et al. 2012. “Portable, Stackable Credentials: A New Education Model for Industry-Specific Career Pathways.” McGraw-Hill Research Foundation. See also, Kentucky Community and Technical College System website for Degrees Training and Career Pathways. 35 Elizabethtown Community & Technical College. Programs of Study: Engineering and Electronics Technology. 36 To ensure high-quality apprenticeship programs, the Department of Labor provides a registration process for employers. Through this registration process, a company signals to workers that its program provides a clear path to a stable career with the opportunity to obtain industry-recognized credentials. Currently, there are more than
15 | D e m o c r a t i c S t a f f o f t h e J o i n t E c o n o m i c C o m m i t t e e
21,000 registered apprenticeship programs across the country, with more than 505,000 apprentices. For more information, see https://www.doleta.gov/oa/data_statistics.cfm 37 Department of Labor. ApprenticeshipUSA Toolkit FAQ.; Reed, Debbie et al. 2012. “An Effectiveness Assessment and Cost-Benefit Analysis of Registered Apprenticeship in 10 States.” Mathematica Policy Research. 38 Steinberg, Sarah Ayres and Ben Schwartz. 2014. “The Bottom Line: Apprenticeships are Good for Business.” Center for American Progress. 39 Ibid; and Lerman, Robert I. 2009. “Training Tomorrow’s Workforce: Community College and Apprenticeship as Collaborative Routes to Rewarding Careers.” Center for American Progress. 40 Senator Martin Heinrich. 2017. “Heinrich, Gardner Introduce Bipartisan Legislation to Address Workforce Shortage in Tech Industry.” Press Release. 41 Department of Education. Structure of the U.S. Education: Associate Degrees. U.S. Network for Education Information. 42 Backes, Benjamin, Harry J. Holzer, and Erin Dunlop Velez. 2015. “Is It Worth It? Postsecondary Education and Labor Market Outcomes for the Disadvantaged.” IZA Journal of Labor Policy (2015) 4:1. 43 Bureau of Labor Statistics. Employment Projections: Unemployment rates and earnings by educational attainment, 2016. Department of Labor. 44 Backes, Benjamin, Harry J. Holzer, and Erin Dunlop Velez. 2015. “Is It Worth It? Postsecondary Education and Labor Market Outcomes for the Disadvantaged.” IZA Journal of Labor Policy (2015) 4:1. 45 Ibid. 46 Ibid as cited in Rothwell, Jonathan. 2015. “Defining Skilled Technical Work.” Paper prepared for National Academies Board on Science, Technology, and Economic Policy, Project on “The Supply Chain for Middle-Skilled Jobs: Education. Training and Certification Pathways.” 47 Carnevale, Anthony P., Stephen J. Rose, and Ban Cheah. 2011. “The College Payoff: Education, Occupations, Lifetime Earnings.” Georgetown Center on Education and the Workforce. 48 Jobs for the Future. “Reinventing High Schools for Postsecondary Success: Research.” 49 Jobs for the Future. “Reinventing High Schools for Postsecondary Success: Our Progress.” 50 National Academies of Sciences, Engineering, and Medicine. 2017. Building America’s Skilled Technical Workforce. Washington, DC: The National Academies Press. 51 Ibid; and Berger, Andrea et al. 2014. “Early College, Continued Success: Early College High School Initiative Impact Study.” American Institutes of Research.; and Webb, Michael and Carol Gerwin. 2014. “Early College Expansion.” Jobs for the Future. 52 Pathways in Technology Early College High School (P-Tech). Frequently Asked Questions. 53 National Academies of Sciences, Engineering, and Medicine. 2017. Building America’s Skilled Technical Workforce. Washington, DC: The National Academies Press. 54 Pathways in Technology Early College High School (P-Tech). Schools. 55 National Academies of Sciences, Engineering, and Medicine. 2017. Building America’s Skilled Technical Workforce. Washington, DC: The National Academies Press. 56 Kemple, J. and C. Willner. 2008. “Career Academies: Long-term impacts on labor market outcomes, educational attainment, and transitions to adulthood.” Clearinghouse for Labor Evaluation and Research. 57 Ibid; and National Academies of Sciences, Engineering, and Medicine. 2017. Building America’s Skilled Technical Workforce. Washington, DC: The National Academies Press.. 58 National Academies of Sciences, Engineering, and Medicine. 2017. Building America’s Skilled Technical Workforce. Washington, DC: The National Academies Press. 59 Kemple, J. and C. Willner. 2008. “Career Academies: Long-term impacts on labor market outcomes, educational attainment, and transitions to adulthood.” Clearinghouse for Labor Evaluation and Research. 60 National Academy Foundation. About Us; and National Center for Education Statistics. “Public High School Graduation Rates.” Department of Education. 61 National Academies of Sciences, Engineering, and Medicine. 2017. Building America’s Skilled Technical Workforce. Washington, DC: The National Academies Press. 62 Ibid. 63 Adelman, Clifford. 2004. “Principal Indicators of Student Academic Histories in Postsecondary Education, 1972-2000.” Department of Education, Institute of Education Sciences. 64 See for example, Always Hired, Ford Accelerated Credential Training (FACT), and the Health Care Delivery Boot Camp. 65 National Academies of Sciences, Engineering, and Medicine. 2017. Building America’s Skilled Technical Workforce. Washington, DC: The National Academies Press.