exergy and thermoeconomics evaluation of msf desalination ...iwtc.info/2005_pdf/03-2.pdf · ninth...
TRANSCRIPT
Ninth International Water Technology Conference, IWTC9 2005, Sharm El-Sheikh, Egypt
157
EXERGY AND THERMOECONOMICS EVALUATION OF MSF DESALINATION PLANTS USING A NEW VISUAL PACKAGE
A. S. Nafey*, H. E. S. Fath����, A. A. Mabrouk*, M. A. El-Zeky∇∇∇∇
Faculty of Petroleum & Mining Engineering, Suez, Suez Canal University Egypt, E mail: [email protected], [email protected].
� Mech. Dept., Faculty of Engineering, Alexandria University, Egypt. E mail: [email protected]
∇ Faculty of Petroleum & Mining Engineering, Suez Canal University, Suez, Egypt. ABSTRACT This paper presents a methodology of exergy and thermoeconomics analysis for performance of the Multi-Stage Flash (MSF) plants using a newly developed visual package, by the authors, for Visual Design and Simulation (VDS) of thermal desalination plants. This methodology gets insight the details that can not be obtained by the first law analysis. The main target of these analyses is pursuing provision of insight improvements of MSF process as well as to determine the product water unit cost. Thermo-economics results showed that, the cost of the overall MSF desalination plant can be improved by reducing the exergy destruction in the desuperheater, the flash stages, and the brine recirculation pump. Thermo-economics evaluation showed also that the total cost rate of the rejected and blow down streams is greater than the cost of the exergy destruction in the overall process. This result indicates that more investigations in the process configuration are important. Based on the recent tender of 5000 m3/dar MSF plant of Eoun Mousa (Egypt), the thermoeconomics results showed that the unit cost of the produced fresh water is 1.14 $/m3. The analysis of the plant under partial loads showed that the unit product cost increased by 45 % when the load decreased to 53 % of its design value. Keywords: Visual Package, Design & Simulation MSF, Exergy, Thermo-economics. Nomenclature
.
C : cost flow rate, $/hr c : cost per unit exergy, $/GJ
pC : Molar specific heat, J/kmol.k .
E : Exergy flow rate, MW e : Specific exergy, kJ/kg f : Exergo-economic factor h : Specific enthalpy , kJ/kg P : Pressure, kPa
.
M : Mass flow rate, kg/s .
mN : Molar flow rate of saline water s : Specific entropy , kJ/kg T : Temperature, K
uR : Universal gas constant, J/kmol.k r : Relative cost difference
x : Mole fractions .
W : Power, MW .
Z : Rate of the capital cost ρ : Density, kg/m3
Ninth International Water Technology Conference, IWTC9 2005, Sharm El-Sheikh, Egypt 158
ρ : Molar density, kmol/m3 IIη : Exergetic second law efficiency
Superscripts: CI : Capital investment OM : Operating & Maintenance Subscripts: 0 : Dead state b : Brine water cw: cooling water D : Destruction d : Distillate F : Fuel L : Loss m : Mixer of pure and salt water p : Product s : salt water v : Vapor w : Pure water
INTRODUCTION Multi-stage flash desalination (MSF) is currently the leading workhorse of the desalination industry with market share close to 60 % of the total world production capacity, IDA [1]. In the Gulf countries, the conservative nature of the MSF desalination plant owner, their large number of operation and maintenance (O&M) experience, as well as the strategic characteristics of the product, makes the MSF process favored over the other competitive thermal desalination methods Al Shuaib et. al. [2]. Competing desalination processes such as reverse osmosis (RO) or vapor compression (VC) which get their exergy from electricity are nowadays having some market successes based on better economics and thermodynamic performance, but some doubts arise from the lack of operating experience, Frederick [3]. Accordingly, recent quotes for the unit production cost include $ 0.8/m3 for 6 migd MSF, $ 0.72/m3 to $ 0.93/m3 for RO (depending on pretreatment cost), and $ 0.45/m3 for the low temperature MEE, [2]. Exergy analysis is a method that uses the conservation of mass and energy principles together with the second law of thermodynamics for the analysis, design and improvement of any energy systems. Many investigators employ the second law analysis to identify and quantify the plant location of the greatest loses. The operation data from several desalination plants revealed that the second-law efficiency of typical MSF plants is about 10 to 20 %, Yunus [4]. Exergy analysis of major recirculation multi-stage flash desalting plants in Saudi Arabia is conducted via a simple scheme, Al-Sulaimman and Ismail [5].The obtained results show that the MSF desalting plant are highly irreversible with exergetic efficiencies ranging from 1.12 – 10.38 %. Frederick [3] outlined an exergy analysis for the MSF desalination plant (947 m3/hr) of 1970s design which showed that the second law efficiency of the MSF desalination is calculated as 4 %. More development and innovations by better exergy utilization are, therefore, required in the MSF plants. Since exergy destruction measures the true thermodynamic value of irreversibility effect on the system, it is meaningful to use exergy as a basis for assigning costs in thermal systems, Bejan et al. [6].
Ninth International Water Technology Conference, IWTC9 2005, Sharm El-Sheikh, Egypt
159
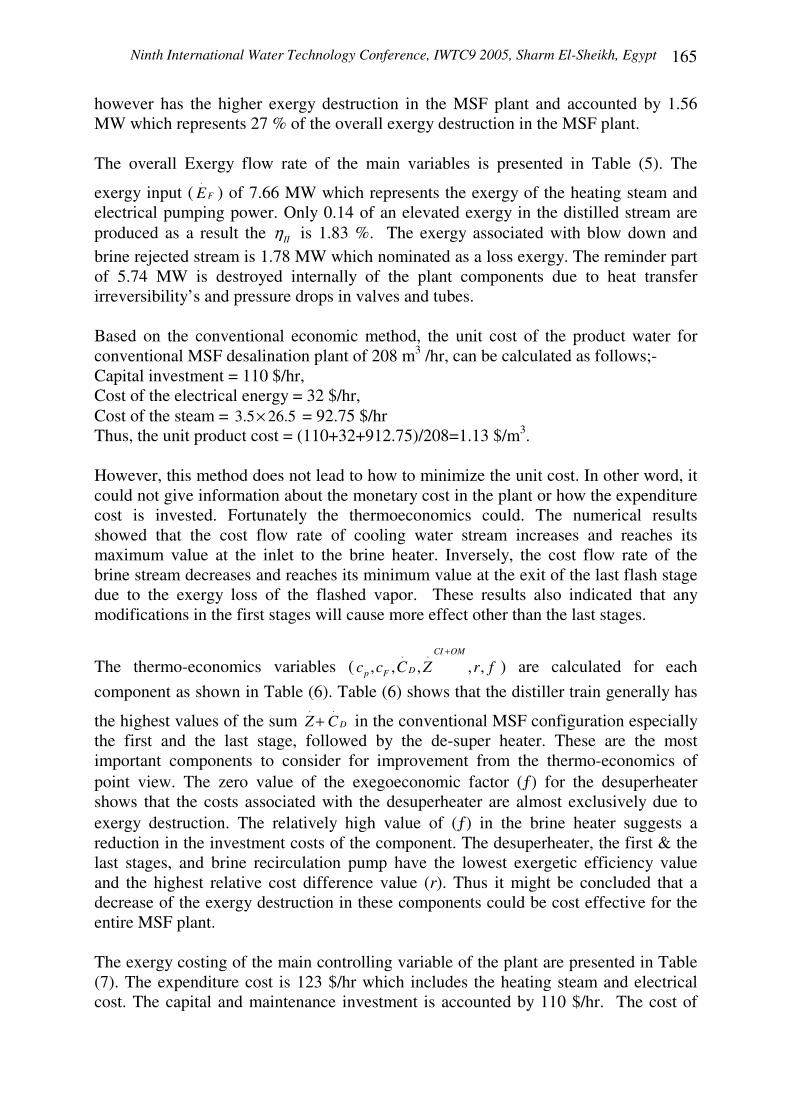
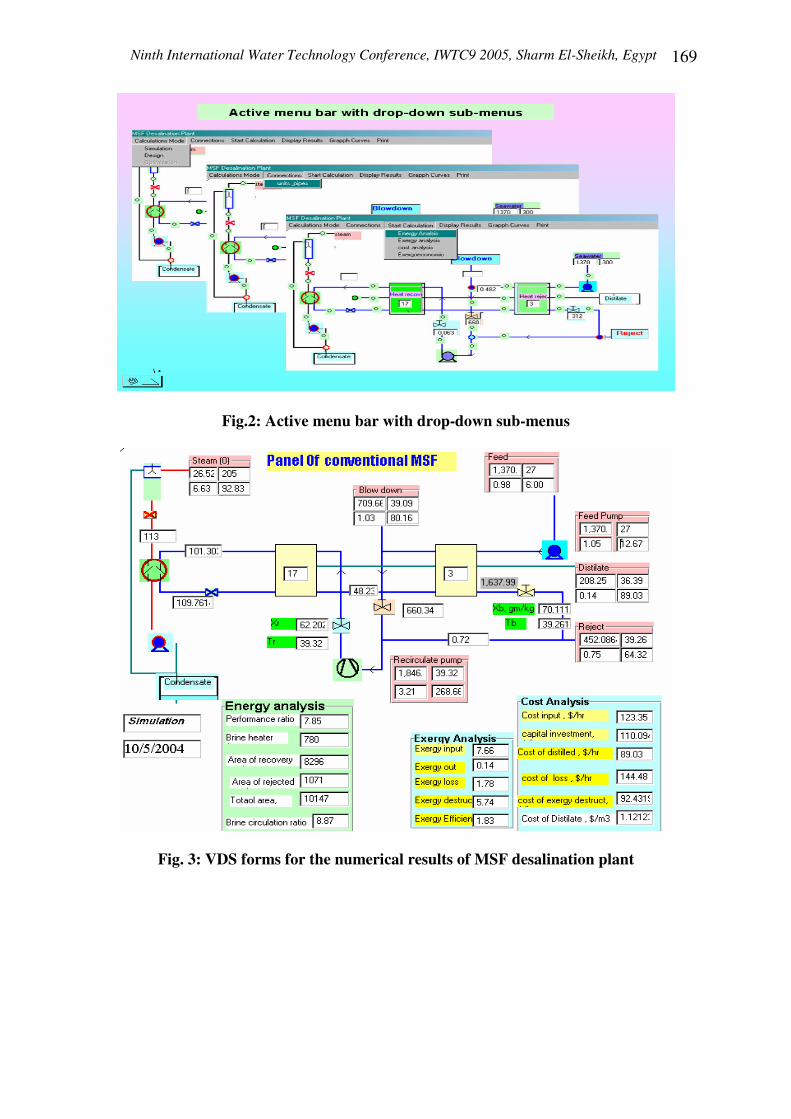
Thermoeconomics developed is an effective tool to reveal opportunities for higher efficiency and lower cost of a system of energy conversion devices [6,7]. Thermoeconomics analysis provides information about the cost formation process and the flow of costs in the system. Costing analysis of a combined power (60 MW of electricity) and MSF desalination plant (18,000 m3/day) was performed based on the exergy concept by Gaggioli et al. [7]. The mathematical model considers the money balance for each hardware component (boiler, turbine, pump etc.) and several different set of auxiliary equations. However, the thermoeconomic model did not consider the distillation plant. The interaction between cost and efficiency still needs to be investigated for MSF process. So, this paper presents energy, exergy and thermoeconomics analysis for MSF desalination process at different operating loads. The paper presents a methodology of exergy and thermo-economics analysis that focus on the performance of the MSF and the parameters affecting the product water unit cost. These methodologies get insight the details that can not be obtained by the first law analysis. The main target of these analyses is pursuing provision of MSF process improvements. OVERVIEW OF THE VDS PACKAGE A newly developed Visual Design & Simulation (VDS) package, by the authors, different types and configurations of thermal desalination plants can be manipulated. In this package, the Object oriented programming technique is used to build a friendly user-interface. Different types of calculations such as energy, exergy, and thermoeconomics can be performed by the developed VDS package. In addition, modifications in the existing plants can be evaluated. In the developed package, desalination plant components (units), such as heat exchangers, flash chambers, evaporators, pumps, pipes, etc. are stored as icons in a visual library. Using this visual library, different configurations can be constructed by just clicking the mouse over the required units (icons). Figure (1) shows a typical brine circulation MSF plant. To construct such configuration, the designer needs to drag the required units from visual library. Then these icons (units) are visually arranged similar to the real plant. A menu bar is created and located at the top of a panel which associated with drop-down sub-menus. The developed menu bar contains the following submenus, see Figure (2): (1) Calculations Mode menu, is linked with a drop-down sub-menu of (simulation,
design, and optimization). (2) Connections menu: this menu is associated with buttons that enable the user to
connect all units, and plant pipes. (3) Start Calculations menu, enables the user to select the required type of calculations
such as energy, exergy, cost, and thermoeconomics analysis. (4) Display Results menu: allows the user to display the results in the same panel or
another window in both table and chart forms. (5) Print menu: prints the oriented form.
Ninth International Water Technology Conference, IWTC9 2005, Sharm El-Sheikh, Egypt 160
After all units and pipes are connected with each others the scenario between the user and the computer is stopped to start the numerical calculations phase which occurs at the behind of the panel. The user can change the operating conditions of the desalination plant during run-time. The desalination process configuration composes of collective icons (units and pipes) which should be seen mathematically as a large matrix that assembled from sub matrices. The composing of different configurations means that the icon (real unit) position or type can change. Mathematically, this means that the sub matrix elements position will sequentially change. The details of the package construction and verification are reported and illustrated in [8], and package has the following features: (i) It is a robust code modulates upon the unit position and type changes. (ii) It has a powerful graphic interface to build up different configurations for different
types easily. (iii) It has a reliable code based on the sparse matrices for technique. EXERGY ANALYSIS The specific exergy of a fluid stream with negligible kinetic and potential energies is given by e = h-h0-T0(s-s0). Since the saline water is a mixture of pure water and salt, the properties of salt must be taken into account along with pure water properties. So the exergy point of certain saline stream is calculated as follows, Yunus [4]:
. . .
0, 0 0 , 0
0 0
[ ( ) [ (ln ) ] ( ln ln )]b mb p m p m u w w s sm
p pTE M C T T T C N R T x x x x
T T ρ−= − − − − + (1)
where; _ _.
, ,, ( )m p w p sp m w sC N x C x C= + is mean specific heat of saline water and
.
( )w sm
w s
Nρ ρρρ ρ
− −
− −
+=×
is the density of saline water.
The exergy of the distilled water stream is also calculated from the above equation by substitute xs = 0 and xw =1; then
. .0
, 0 0 ,0 0
( ( ) ( (ln ) ))d d p d p dd
P PTE M C T T T C
T T ρ−= − − − (2)
The exergy rate of the heating steam is determined from the following equation:-
. .
0 0 0( ( ))v vE M h h T s s= − − − (3) The thermophysical properties are calculated based on the relation illustrated in [11]. Based on equations (1), (2) and(3), the exergy rate of all the process streams are calculated. Exergy balance analysis of each unit in the considered process is performed based on the following equation:-
. . . .
F P D LE E E E= + + (4)
Ninth International Water Technology Conference, IWTC9 2005, Sharm El-Sheikh, Egypt
161
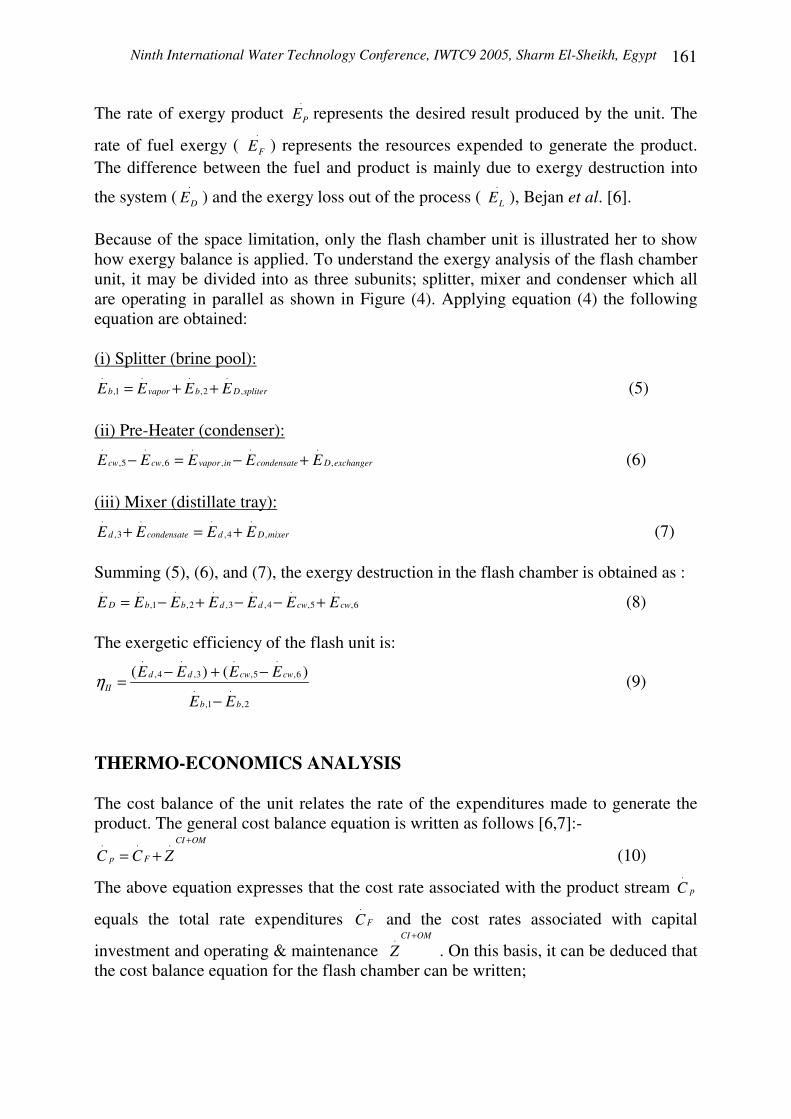
The rate of exergy product .
PE represents the desired result produced by the unit. The
rate of fuel exergy ( .
FE ) represents the resources expended to generate the product. The difference between the fuel and product is mainly due to exergy destruction into
the system (.
DE ) and the exergy loss out of the process ( .
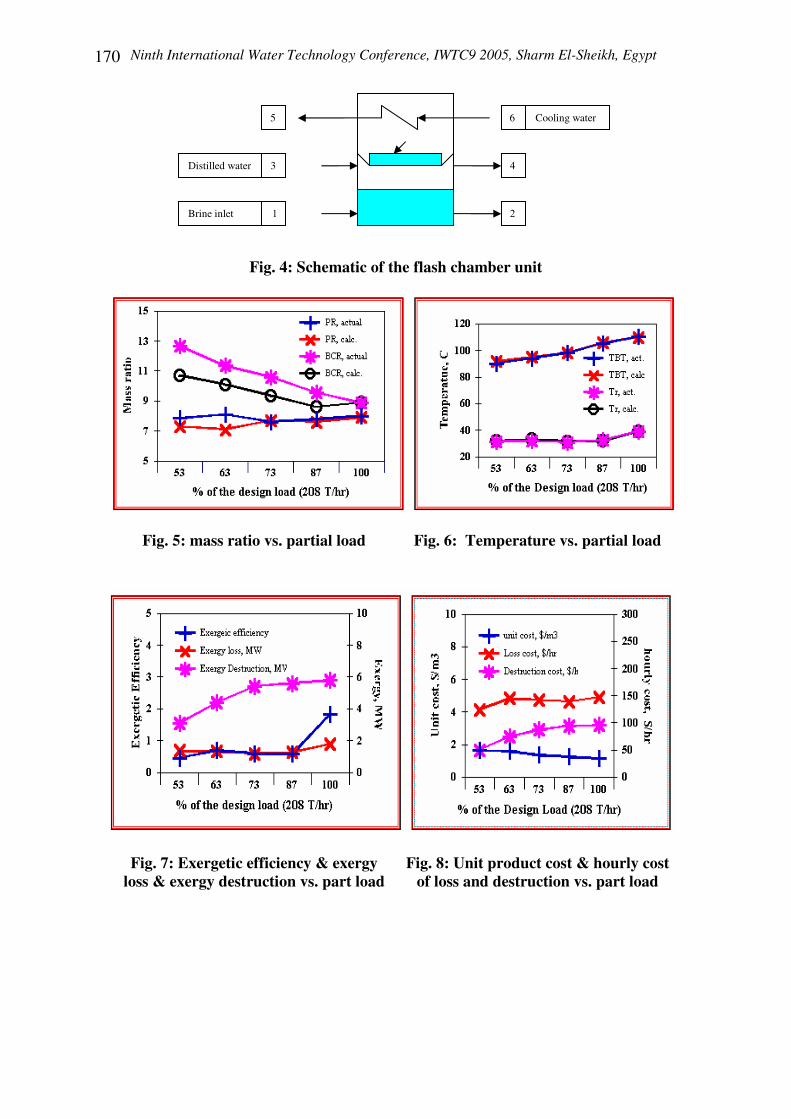
LE ), Bejan et al. [6].������������� Because of the space limitation, only the flash chamber unit is illustrated her to show how exergy balance is applied. To understand the exergy analysis of the flash chamber unit, it may be divided into as three subunits; splitter, mixer and condenser which all are operating in parallel as shown in Figure (4). Applying equation (4) the following equation are obtained: (i) Splitter (brine pool):
. . . .
,1 ,2 ,b vapor b D spliterE E E E= + + (5) (ii) Pre-Heater (condenser):
. . . . .
,5 ,6 , ,cw cw vapor in condensate D exchangerE E E E E− = − + (6) (iii) Mixer (distillate tray):
. . . .
,3 ,4 ,d condensate d D mixerE E E E+ = + (7) Summing (5), (6), and (7), the exergy destruction in the flash chamber is obtained as :
. . . . . . .
,1 ,2 ,3 ,4 ,5 ,6D b b d d cw cwE E E E E E E= − + − − + (8) The exergetic efficiency of the flash unit is:
. . . .
,4 ,3 ,5 ,6
. .
,1 ,2
( ) ( )d d cw cwII
b b
E E E E
E Eη − + −=
− (9)
THERMO-ECONOMICS ANALYSIS The cost balance of the unit relates the rate of the expenditures made to generate the product. The general cost balance equation is written as follows [6,7]:-
. . . CI OM
p FC C Z+
= + (10)
The above equation expresses that the cost rate associated with the product stream .
pC
equals the total rate expenditures .
FC and the cost rates associated with capital
investment and operating & maintenance . CI OM
Z+
. On this basis, it can be deduced that the cost balance equation for the flash chamber can be written;
Ninth International Water Technology Conference, IWTC9 2005, Sharm El-Sheikh, Egypt 162
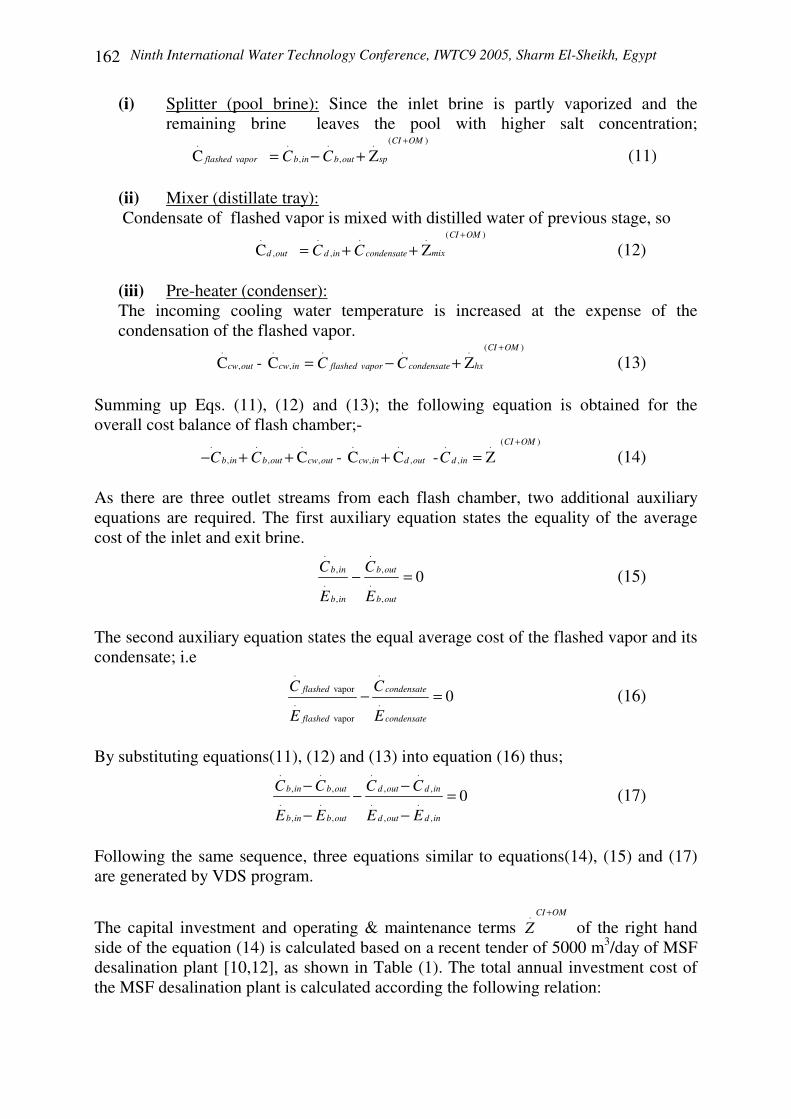
(i) Splitter (pool brine): Since the inlet brine is partly vaporized and the remaining brine leaves the pool with higher salt concentration;
( ). . . .
, ,C ZCI OM
spflashed vapor b in b outC C+
= − + (11) (ii) Mixer (distillate tray): Condensate of flashed vapor is mixed with distilled water of previous stage, so
( ). . . .
, ,C ZCI OM
mixd out d in condensateC C+
= + + (12)
(iii) Pre-heater (condenser): The incoming cooling water temperature is increased at the expense of the condensation of the flashed vapor.
( ). . . . .
, , C - C ZCI OM
hxcw out cw in flashed vapor condensateC C+
= − + (13) Summing up Eqs. (11), (12) and (13); the following equation is obtained for the overall cost balance of flash chamber;-
( ). . . . . . .
, , , , , ,C - C C - ZCI OM
b in b out cw out cw in d out d inC C C+
− + + + = (14) As there are three outlet streams from each flash chamber, two additional auxiliary equations are required. The first auxiliary equation states the equality of the average cost of the inlet and exit brine.
. .
, ,
. .
, ,
0b in b out
b in b out
C C
E E− = (15)
The second auxiliary equation states the equal average cost of the flashed vapor and its condensate; i.e
. .
vapor
. .
vapor
0flashed condensate
flashed condensate
C C
E E− = (16)
By substituting equations(11), (12) and (13) into equation (16) thus;
. . . .
, , , ,
. . . .
, , , ,
0b in b out d out d in
b in b out d out d in
C C C C
E E E E
− −− =− −
(17)
Following the same sequence, three equations similar to equations(14), (15) and (17) are generated by VDS program.
The capital investment and operating & maintenance terms . CI OM
Z+
of the right hand side of the equation (14) is calculated based on a recent tender of 5000 m3/day of MSF desalination plant [10,12], as shown in Table (1). The total annual investment cost of the MSF desalination plant is calculated according the following relation:
Ninth International Water Technology Conference, IWTC9 2005, Sharm El-Sheikh, Egypt
163
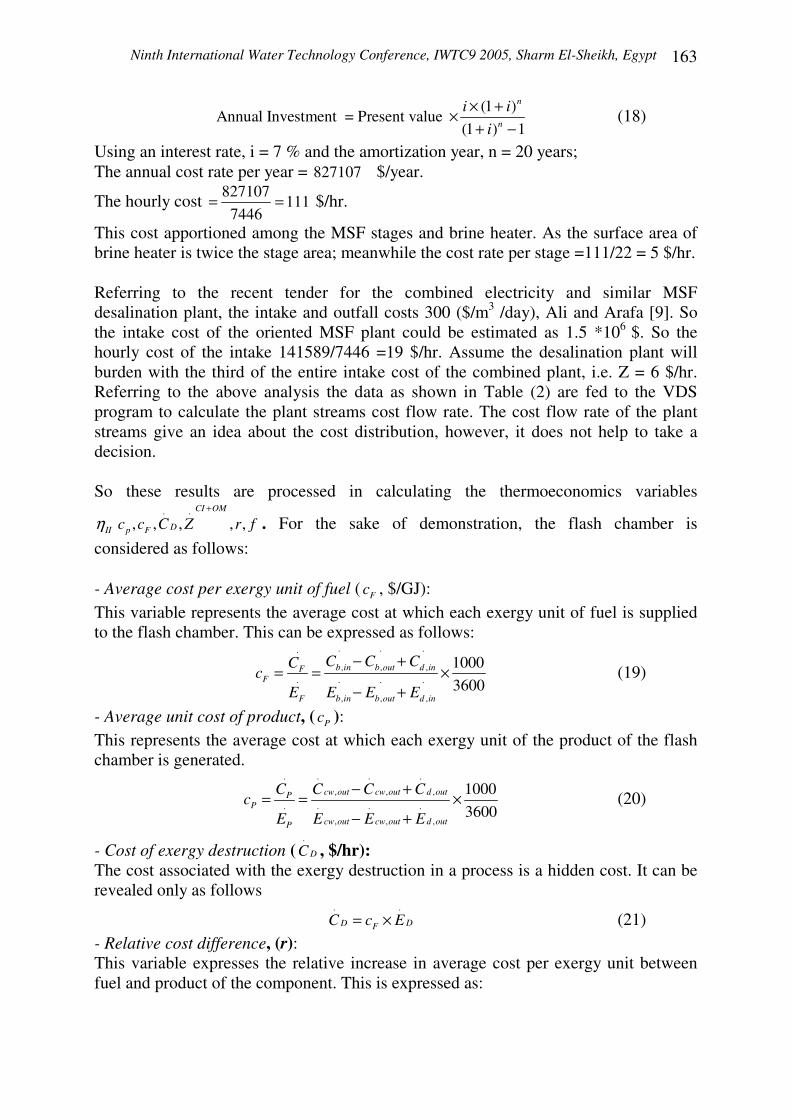
(1 )Annual Investment = Present value
(1 ) 1
n
n
i ii
× +×+ −
(18)
Using an interest rate, i = 7 % and the amortization year, n = 20 years; The annual cost rate per year = 827107 $/year.
The hourly cost 827107111
7446= = $/hr.
This cost apportioned among the MSF stages and brine heater. As the surface area of brine heater is twice the stage area; meanwhile the cost rate per stage =111/22 = 5 $/hr. Referring to the recent tender for the combined electricity and similar MSF desalination plant, the intake and outfall costs 300 ($/m3 /day), Ali and Arafa [9]. So the intake cost of the oriented MSF plant could be estimated as 1.5 *106 $. So the hourly cost of the intake 141589/7446 =19 $/hr. Assume the desalination plant will burden with the third of the entire intake cost of the combined plant, i.e. Z = 6 $/hr. Referring to the above analysis the data as shown in Table (2) are fed to the VDS program to calculate the plant streams cost flow rate. The cost flow rate of the plant streams give an idea about the cost distribution, however, it does not help to take a decision. So these results are processed in calculating the thermoeconomics variables
IIη. .
, , , , ,CI OM
Dp Fc c C Z r f+
. For the sake of demonstration, the flash chamber is considered as follows: - Average cost per exergy unit of fuel ( Fc , $/GJ): This variable represents the average cost at which each exergy unit of fuel is supplied to the flash chamber. This can be expressed as follows:
. . ..
, , ,. . . .
, , ,
10003600
b in b out d inFF
F b in b out d in
C C CCc
E E E E
− += = ×
− + (19)
- Average unit cost of product, ( Pc ): This represents the average cost at which each exergy unit of the product of the flash chamber is generated.
. . . .
, , ,
. . . .
, , ,
10003600
cw out cw out d outPP
cw out cw out d outP
C C C Cc
E E E E
− += = ×− +
(20)
- Cost of exergy destruction (.
DC , $/hr): The cost associated with the exergy destruction in a process is a hidden cost. It can be revealed only as follows
. .
DD FC c E= × (21) - Relative cost difference, (r): This variable expresses the relative increase in average cost per exergy unit between fuel and product of the component. This is expressed as:
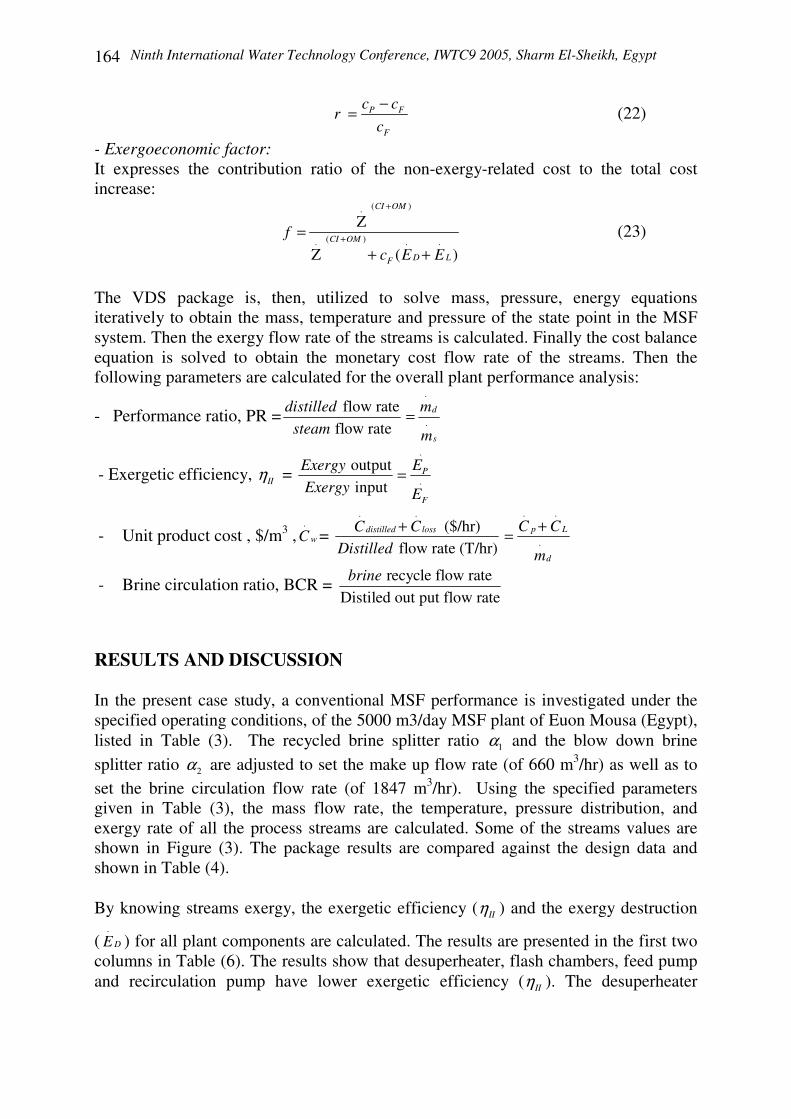
Ninth International Water Technology Conference, IWTC9 2005, Sharm El-Sheikh, Egypt 164
P F
F
c cr
c−= (22)
- Exergoeconomic factor: It expresses the contribution ratio of the non-exergy-related cost to the total cost increase:
( ).
( ). . .
Z
Z ( )
CI OM
CI OM
D LF
fc E E
+
+=+ +
(23)
The VDS package is, then, utilized to solve mass, pressure, energy equations iteratively to obtain the mass, temperature and pressure of the state point in the MSF system. Then the exergy flow rate of the streams is calculated. Finally the cost balance equation is solved to obtain the monetary cost flow rate of the streams. Then the following parameters are calculated for the overall plant performance analysis:
- Performance ratio, PR = flow rate flow rate
distilledsteam
.
.d
s
m
m=
- Exergetic efficiency, IIη = .
.
output input
P
F
Exergy EExergy E
=
- Unit product cost , $/m3 ,.
wC = . .
($/hr) flow rate (T/hr)
distilled lossC CDistilled
+. .
.p L
d
C C
m
+=
- Brine circulation ratio, BCR = recycle flow rateDistiled out put flow ratebrine
RESULTS AND DISCUSSION In the present case study, a conventional MSF performance is investigated under the specified operating conditions, of the 5000 m3/day MSF plant of Euon Mousa (Egypt), listed in Table (3). The recycled brine splitter ratio 1α and the blow down brine splitter ratio 2α are adjusted to set the make up flow rate (of 660 m3/hr) as well as to set the brine circulation flow rate (of 1847 m3/hr). Using the specified parameters given in Table (3), the mass flow rate, the temperature, pressure distribution, and exergy rate of all the process streams are calculated. Some of the streams values are shown in Figure (3). The package results are compared against the design data and shown in Table (4). By knowing streams exergy, the exergetic efficiency ( IIη ) and the exergy destruction
(.
DE ) for all plant components are calculated. The results are presented in the first two columns in Table (6). The results show that desuperheater, flash chambers, feed pump and recirculation pump have lower exergetic efficiency ( IIη ). The desuperheater
Ninth International Water Technology Conference, IWTC9 2005, Sharm El-Sheikh, Egypt
165
however has the higher exergy destruction in the MSF plant and accounted by 1.56 MW which represents 27 % of the overall exergy destruction in the MSF plant. The overall Exergy flow rate of the main variables is presented in Table (5). The
exergy input (.
FE ) of 7.66 MW which represents the exergy of the heating steam and electrical pumping power. Only 0.14 of an elevated exergy in the distilled stream are produced as a result the IIη is 1.83 %. The exergy associated with blow down and brine rejected stream is 1.78 MW which nominated as a loss exergy. The reminder part of 5.74 MW is destroyed internally of the plant components due to heat transfer irreversibility’s and pressure drops in valves and tubes. Based on the conventional economic method, the unit cost of the product water for conventional MSF desalination plant of 208 m3 /hr, can be calculated as follows;- Capital investment = 110 $/hr, Cost of the electrical energy = 32 $/hr, Cost of the steam = 3.5 26.5× = 92.75 $/hr Thus, the unit product cost = (110+32+912.75)/208=1.13 $/m3. However, this method does not lead to how to minimize the unit cost. In other word, it could not give information about the monetary cost in the plant or how the expenditure cost is invested. Fortunately the thermoeconomics could. The numerical results showed that the cost flow rate of cooling water stream increases and reaches its maximum value at the inlet to the brine heater. Inversely, the cost flow rate of the brine stream decreases and reaches its minimum value at the exit of the last flash stage due to the exergy loss of the flashed vapor. These results also indicated that any modifications in the first stages will cause more effect other than the last stages.
The thermo-economics variables (. .
, , , , ,CI OM
Dp Fc c C Z r f+
) are calculated for each component as shown in Table (6). Table (6) shows that the distiller train generally has
the highest values of the sum . .
DZ C+ in the conventional MSF configuration especially the first and the last stage, followed by the de-super heater. These are the most important components to consider for improvement from the thermo-economics of point view. The zero value of the exegoeconomic factor (ƒ) for the desuperheater shows that the costs associated with the desuperheater are almost exclusively due to exergy destruction. The relatively high value of (ƒ) in the brine heater suggests a reduction in the investment costs of the component. The desuperheater, the first & the last stages, and brine recirculation pump have the lowest exergetic efficiency value and the highest relative cost difference value (r). Thus it might be concluded that a decrease of the exergy destruction in these components could be cost effective for the entire MSF plant. The exergy costing of the main controlling variable of the plant are presented in Table (7). The expenditure cost is 123 $/hr which includes the heating steam and electrical cost. The capital and maintenance investment is accounted by 110 $/hr. The cost of
Ninth International Water Technology Conference, IWTC9 2005, Sharm El-Sheikh, Egypt 166
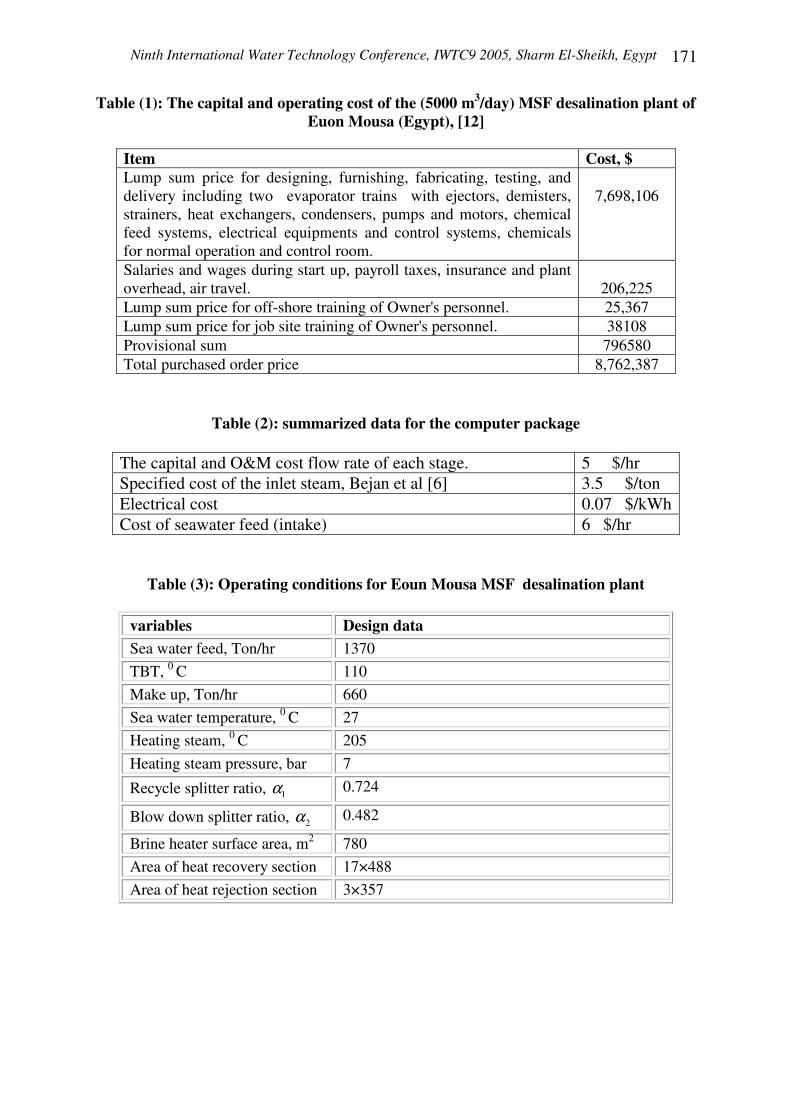
the blow down stream is burden on the distilled water stream cost ,which make the final desalinated water costs to be 1.12 $/m3 for the conventional MSF which agree with Fath [10]. The results in Table (7) show also that the cost flow rate of the blow down stream is greater than the cost of exergy destruction in the same desalination plant. This result indicates that more investigations are required to recover the cost flow rate associated with the rejected stream. In other words, the performance of MSF desalination plant will be cost effective by some modification of the flow sheeting or use the rejected stream in heating other distillation process or used for solar still systems for example. All these modifications should be considered in future plants design. PARTIAL LOAD ANALYSIS MSF plant is adjusted in the partial load operation mode by controlling the rate of the heating steam source to count the distillate tank capacity limitation. Different part load conditions for the real data of Eoun Mousa MSF plant are depicted by Data Control System (DCS). These data are compared against the obtained results of the developed VDS package. The distillate product varies from 110 m3/hr (52.8 %) to 208 m3/hr (100 %) as well as the top brine temperature varies from 90 to 110 0C. The heating steam consumption varies from 14 to 26 m3 /hr. Fig. 5 shows the performance ratio (PR) and the brine circulation ratio (BCR) variation against the part load for both the field data and calculated results. Figure (5) shows that the PR slightly increases with load increase, mainly due to decrease in the BCR. The deviation between the calculated and field data results increases by decreasing the partial load as shown in Fig. 5. For the same feed and make up flow rate, the maximum deviation in the brine circulation ratio (BCR) is estimated 15.5 % at 53 % partial load. Fig.6 shows the top brine temperature (TBT) and the recycle brine temperature (Tr) for both field and calculated results. Fig. 6 indicates that the TBT and Tr increase with increasing load due to increase of the heating steam temperature. This figure shows the agreement between field data and the calculated temperature. Fig.7 shows the exergy analysis at different loads of MSF desalination plant based on the VDS results. Fig.7 showed that the second law efficiency ( IIη ) of the MSF increases with increase in the load despite the increase in both the exergy loss and exergy destruction. This is owing to the decrease in the exergy input (steam & pumping power) to the system. Thermo-economics analysis at MSF partial loads shows that the rate of the expenditure
cost (.
FC ) decreases with decreasing of the load due to the decrease in steam and
electrical power requirements. The capital investment (.
Z ) is fixed with the load variation as there is no change in MSF configuration. The thermoeconomic results
showed that the sum of expenditure (.
FC ) and capital investment (.
Z ) equal to the sum
of costing of exergy loss (.
LC ) and cost of the distillate stream (.
PC ) which satisfactory justifies the developed mathematical model of the cost balance. Figure (8) shows that
the unit product (.
wC ) decrease with the increasing of the load, despite the increase in
Ninth International Water Technology Conference, IWTC9 2005, Sharm El-Sheikh, Egypt
167
the exergy destruction cost and exergy loss cost this is because the decrease in the distillate flow rate. The unit product cost increases by 45 % when the load decrease to 52.8 % of its design value. This result indicated that the operation at partial load is not recommended from cost point view. Figure (8) showed also the rate of the cost associated with the losses streams is greater than the rate of the exergy cost. This notice showed the importance of recoverable of bleeding loss cost. Figures (7) and (8) indicate the unit product cost increases even with the exergetic efficiency ( IIη ) decreases. This result is in consistence with philosophy of the existing MSF improvement which ascertains that the operation at part load is not preferable. The last result assures that the exergy analysis has unified sense with system analysis. CONCLUSION Using the developed VDS package, the exergy and thermoeconomics evaluation of the MSF desalination plant reveals the following conclusions:- 1. A cost effective overall the desalination plant is obtained if the exergy destruction
rate of the desuperheater, the distiller train is reduced. 2. The unit desalinated water costs is estimated as 1.14 $/m3 for the conventional MSF
desalination (without including the chemical cost). 3. The cost flow rate of the rejected (blow down) stream is greater than the exergy
destruction cost flow rate of the entire desalination plant. This leads to the importance of recovering the bleeding cost.
4. The field operation data and VDS package results are compared at different operating loads. The obtained results showed that the unit product cost increased by 45 % when the load decreased to 53 % of its design value.
REFERENCES [1] International Desalination Association (IDA) World Wide desalting plants
inventory, report No. 16 (2000). [2] A. Al-Shuaib, M. Al-Bahu, H. El-Dessouky, and H. Ettouney. “Progress of the
Desalination Industry in Kuwait”, IDA congress, San Diego (USA), (1999). [3] B. Frederick, “Combined Power and process: An Exergy Approach”, Mechanical
Engineering Publications Limited, London, (1995). [4] C. Yunus, “The minimum Work Required for Distillation Process”, Exergy,
International Journal 2, pp 15- 23, (2002). [5] F. A. Al-Sulaimman, and B. Ismail, “Exergy analysis of major recirculating multi-
stage flash desalting plants in Saudi Arbia”, Desalination, vol. 103, pp 265-270 (1995).
[6] Bejan A., G. Tsatsaronis, M. Moran, “Thermal Design & Optimization”, JOHN WILY & SONS, INC., (1996).
[7] Gaggioli R. A., Y. M. Elsayed, A. M. ELnashar, B. Kamaluddin, “Second Law Efficiency and Costing Analysis of a combined Power and Desalination Plant”, Journal of Energy resources Technology, (1988).
Ninth International Water Technology Conference, IWTC9 2005, Sharm El-Sheikh, Egypt 168
[8] Nafey A. S., H. S. Fath, A. A. Mabrouk, M. A. Elzzeky, “A New Visual Computer Package for Design & Simulation of Thermal Desalination Processes: Code Development”, Eight International Water Technology Conference, Alexandria, Egypt, March (2004).
[9] Ali H. N. and H. A. Arafa, “Effect of Desalination Plant Performance on Water Cost in Dual-Purpose Plant for Production of Water and Electricity”, Fifth International Water Technology Conference, Alexandria, Egypt, March (2000).
[10] Fath H. E. S. “Desalination Technology”, El dar Elgameia, Alexandia, (2001). [11] Nafey A. S. Design and Simulation of Seawater Thermal Desalination Plants.
Leeds University Ph. D., (1988). [12] Babcock - Hitachi. Operation and Maintenance Manual of Eoun Moussa
Desalination Plant. Egypt, (1998).
Fig.1: Flow sheeting of the MSF desalination plant
Ninth International Water Technology Conference, IWTC9 2005, Sharm El-Sheikh, Egypt
169
Fig.2: Active menu bar with drop-down sub-menus
Fig. 3: VDS forms for the numerical results of MSF desalination plant
Ninth International Water Technology Conference, IWTC9 2005, Sharm El-Sheikh, Egypt 170
Fig. 4: Schematic of the flash chamber unit
Fig. 5: mass ratio vs. partial load Fig. 6: Temperature vs. partial load
Fig. 7: Exergetic efficiency & exergy loss & exergy destruction vs. part load
Fig. 8: Unit product cost & hourly cost of loss and destruction vs. part load
6
3 ���
� ���
5 Cooling water
Distilled water
Brine inlet
Ninth International Water Technology Conference, IWTC9 2005, Sharm El-Sheikh, Egypt
171
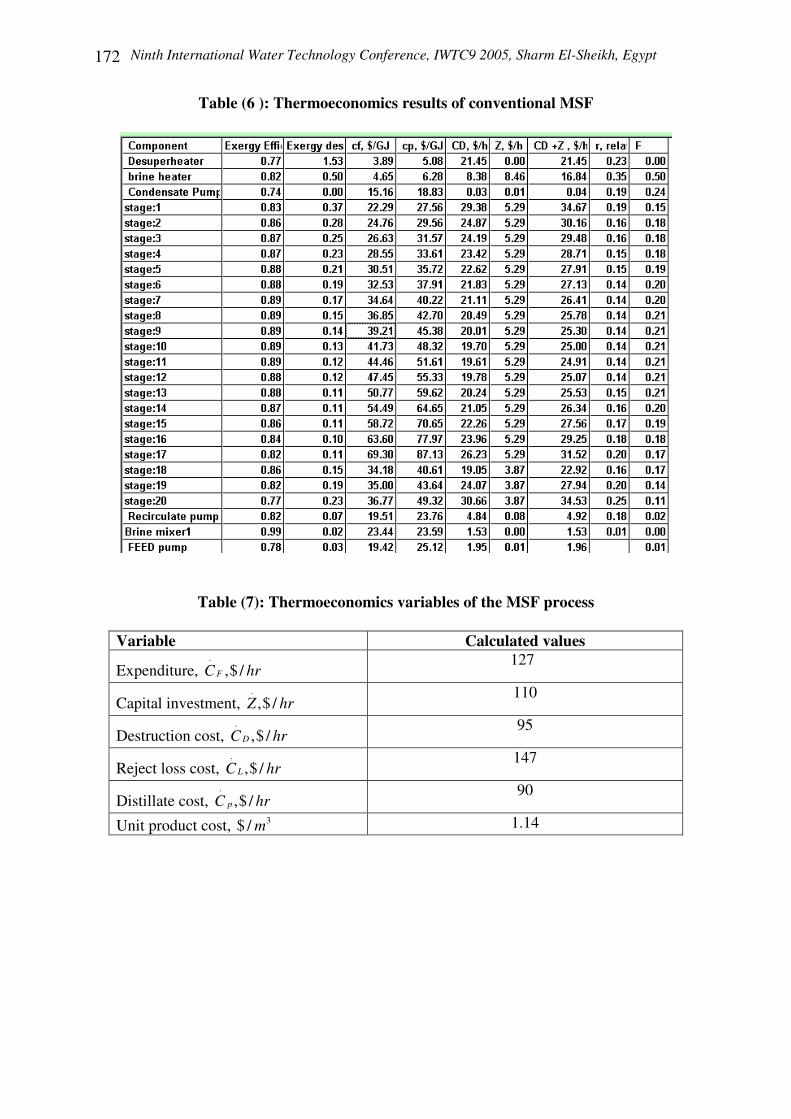
Table (1): The capital and operating cost of the (5000 m3/day) MSF desalination plant of Euon Mousa (Egypt), [12]
Item Cost, $ Lump sum price for designing, furnishing, fabricating, testing, and delivery including two evaporator trains with ejectors, demisters, strainers, heat exchangers, condensers, pumps and motors, chemical feed systems, electrical equipments and control systems, chemicals for normal operation and control room.
7,698,106
Salaries and wages during start up, payroll taxes, insurance and plant overhead, air travel.
206,225
Lump sum price for off-shore training of Owner's personnel. 25,367 Lump sum price for job site training of Owner's personnel. 38108 Provisional sum 796580 Total purchased order price 8,762,387
Table (2): summarized data for the computer package
The capital and O&M cost flow rate of each stage. 5 $/hr Specified cost of the inlet steam, Bejan et al [6] 3.5 $/ton Electrical cost 0.07 $/kWh Cost of seawater feed (intake) 6 $/hr
Table (3): Operating conditions for Eoun Mousa MSF desalination plant
variables Design data Sea water feed, Ton/hr 1370 TBT, 0 C 110 Make up, Ton/hr 660 Sea water temperature, 0 C 27 Heating steam, 0 C 205 Heating steam pressure, bar 7
Recycle splitter ratio, 1α 0.724
Blow down splitter ratio, 2α 0.482
Brine heater surface area, m2 780 Area of heat recovery section 17×488 Area of heat rejection section 3×357
Ninth International Water Technology Conference, IWTC9 2005, Sharm El-Sheikh, Egypt 172
Table (6 ): Thermoeconomics results of conventional MSF
Table (7): Thermoeconomics variables of the MSF process
Variable Calculated values
Expenditure, .
,$ /FC hr 127
Capital investment, .
,$ /Z hr 110
Destruction cost, .
,$ /DC hr 95
Reject loss cost, .
,$ /LC hr 147
Distillate cost, .
,$ /pC hr 90
Unit product cost, 3$ / m 1.14