exercise: creating a mobile demographic viewing application · geolocation api, and jquery mobile...
TRANSCRIPT
Exercise: Creating a Mobile Demographic Viewing Application
In this exercise you will combine what you have learned about the ArcGIS Server API for JavaScript, the
Geolocation API, and jQuery Mobile to build a mobile demographic viewing application. The end result
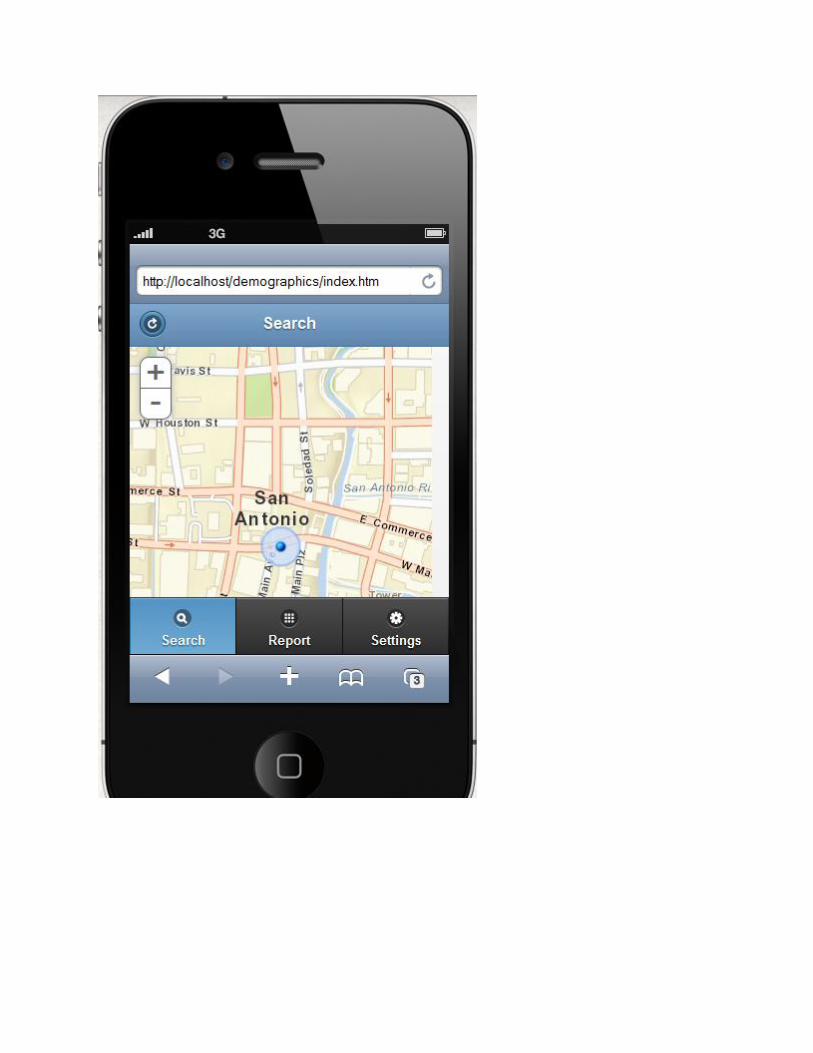
should look similar to the images you see below. The application will use the Geolocation API to
determine the current location of the mobile device. Using this point coordinate you will use the ArcGIS
Server API for JavaScript to query a demographic service and pull various pieces of demographic
information including population per square mile, median age, average household size, and average
family size. This information will be written to a ‘Report’ page within the application.
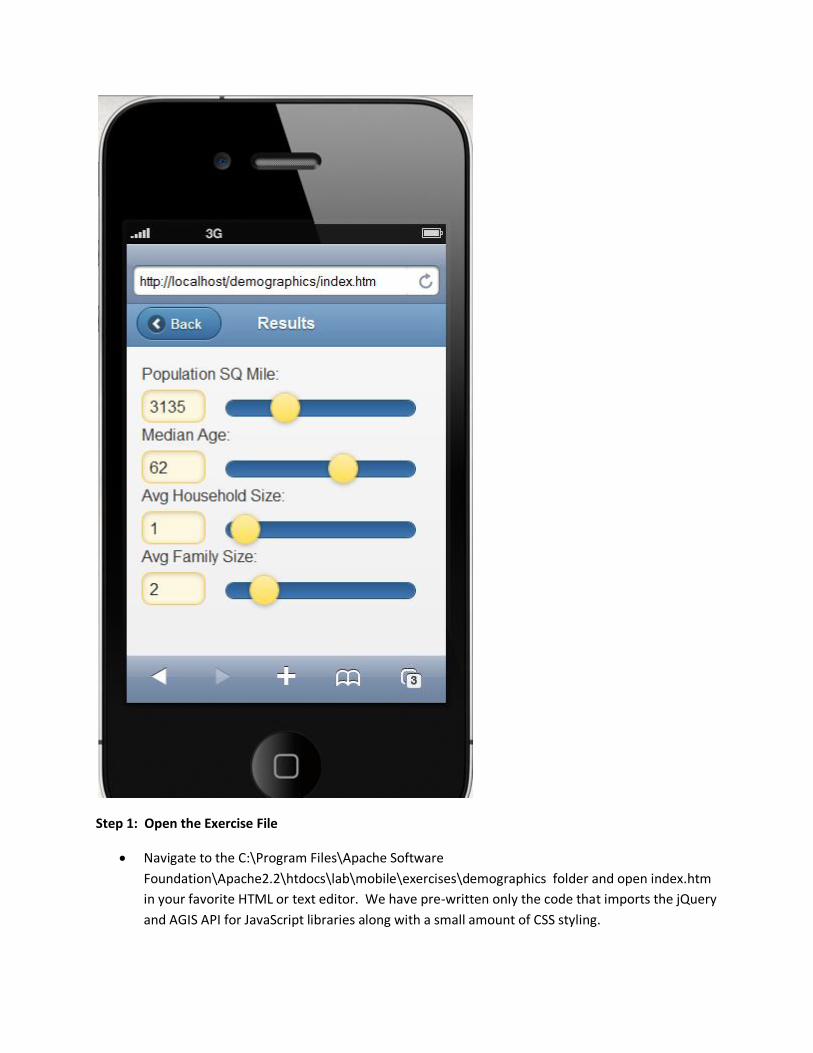
Step 1: Open the Exercise File
Navigate to the C:\Program Files\Apache Software
Foundation\Apache2.2\htdocs\lab\mobile\exercises\demographics folder and open index.htm
in your favorite HTML or text editor. We have pre-written only the code that imports the jQuery
and AGIS API for JavaScript libraries along with a small amount of CSS styling.
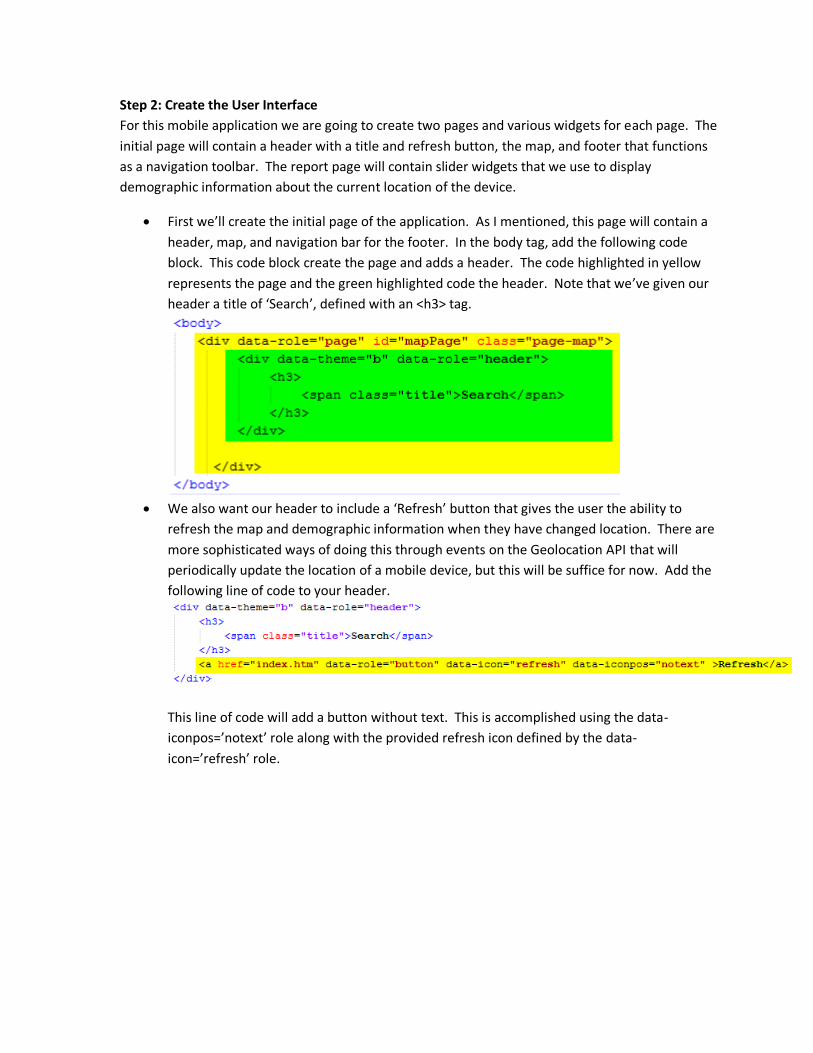
Step 2: Create the User Interface
For this mobile application we are going to create two pages and various widgets for each page. The
initial page will contain a header with a title and refresh button, the map, and footer that functions
as a navigation toolbar. The report page will contain slider widgets that we use to display
demographic information about the current location of the device.
First we’ll create the initial page of the application. As I mentioned, this page will contain a
header, map, and navigation bar for the footer. In the body tag, add the following code
block. This code block create the page and adds a header. The code highlighted in yellow
represents the page and the green highlighted code the header. Note that we’ve given our
header a title of ‘Search’, defined with an <h3> tag.
We also want our header to include a ‘Refresh’ button that gives the user the ability to
refresh the map and demographic information when they have changed location. There are
more sophisticated ways of doing this through events on the Geolocation API that will
periodically update the location of a mobile device, but this will be suffice for now. Add the
following line of code to your header.
This line of code will add a button without text. This is accomplished using the data-
iconpos=’notext’ role along with the provided refresh icon defined by the data-
icon=’refresh’ role.
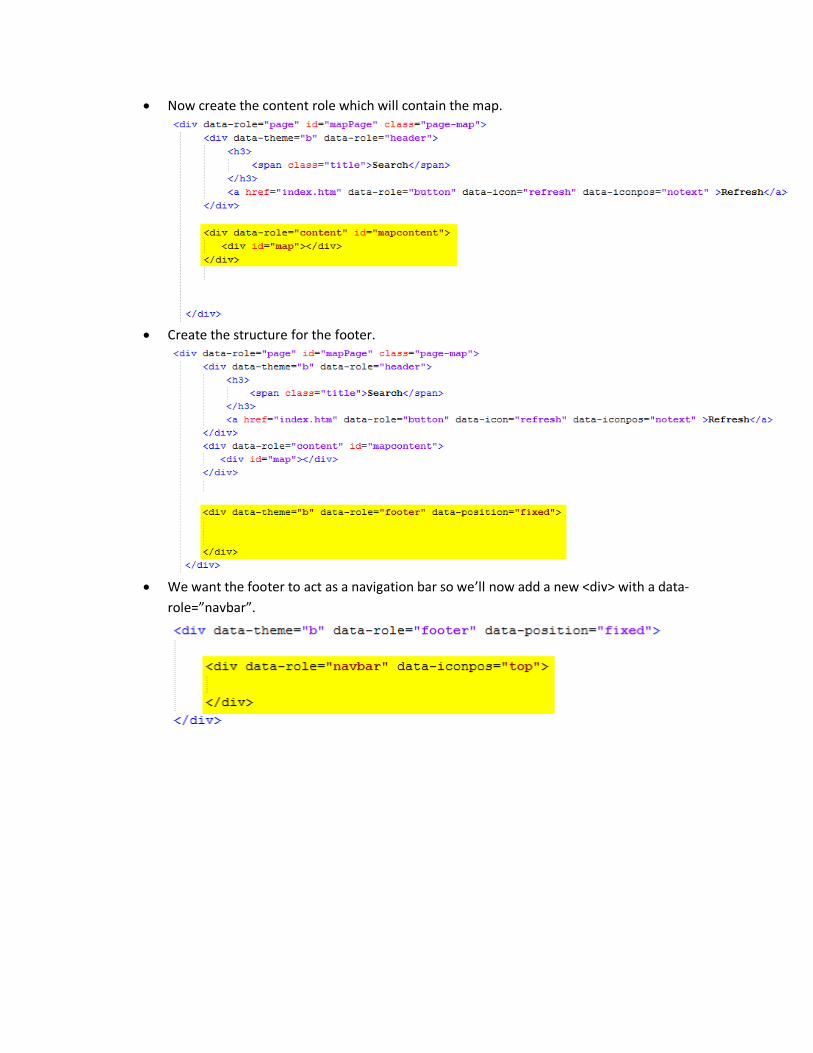
Now create the content role which will contain the map.
Create the structure for the footer.
We want the footer to act as a navigation bar so we’ll now add a new <div> with a data-
role=”navbar”.
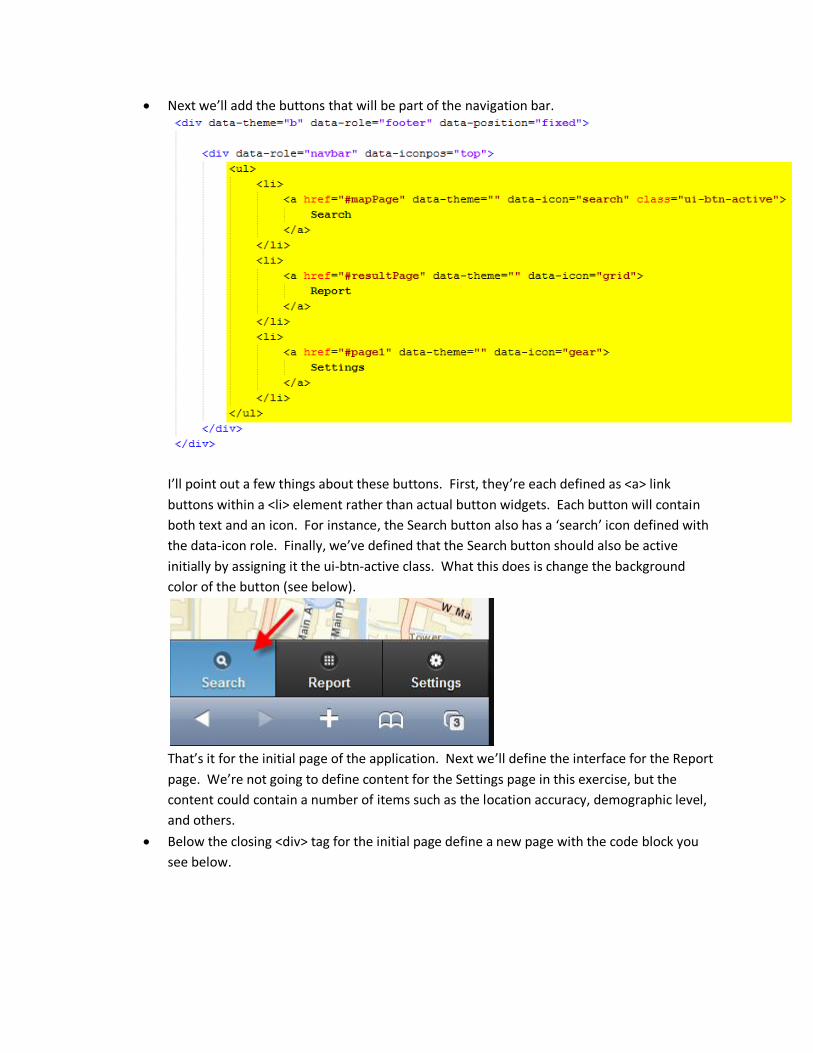
Next we’ll add the buttons that will be part of the navigation bar.
I’ll point out a few things about these buttons. First, they’re each defined as <a> link
buttons within a <li> element rather than actual button widgets. Each button will contain
both text and an icon. For instance, the Search button also has a ‘search’ icon defined with
the data-icon role. Finally, we’ve defined that the Search button should also be active
initially by assigning it the ui-btn-active class. What this does is change the background
color of the button (see below).
That’s it for the initial page of the application. Next we’ll define the interface for the Report
page. We’re not going to define content for the Settings page in this exercise, but the
content could contain a number of items such as the location accuracy, demographic level,
and others.
Below the closing <div> tag for the initial page define a new page with the code block you
see below.
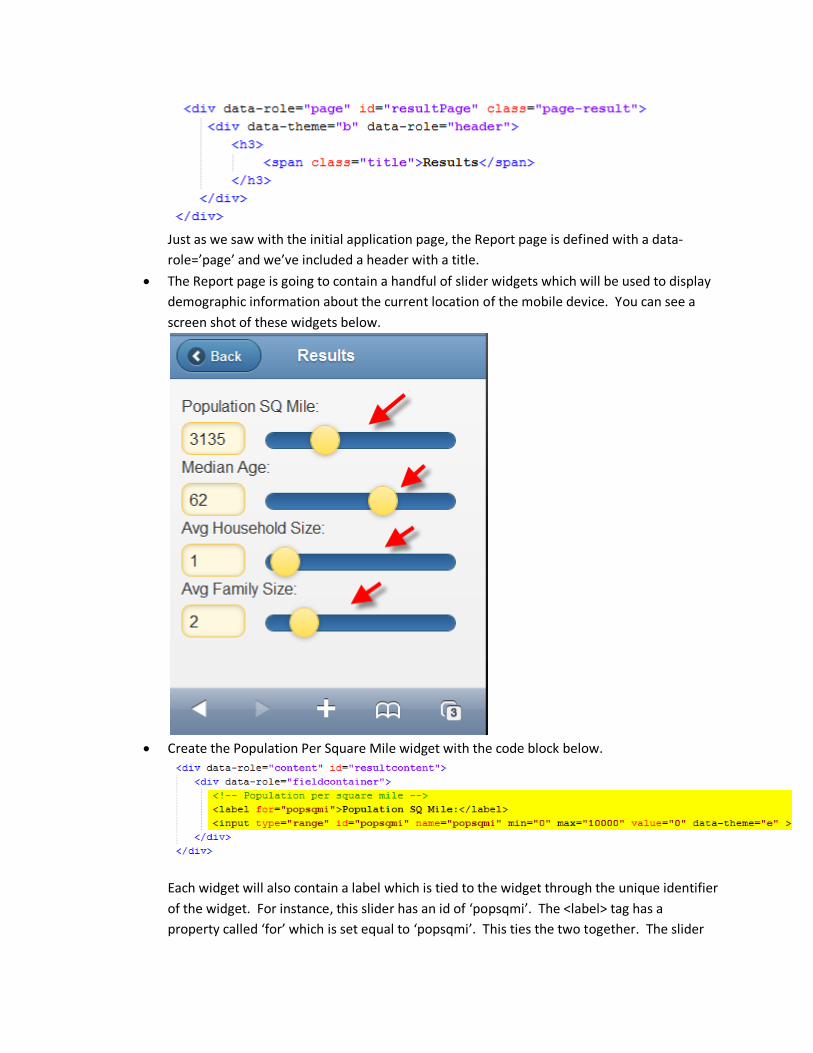
Just as we saw with the initial application page, the Report page is defined with a data-
role=’page’ and we’ve included a header with a title.
The Report page is going to contain a handful of slider widgets which will be used to display
demographic information about the current location of the mobile device. You can see a
screen shot of these widgets below.
Create the Population Per Square Mile widget with the code block below.
Each widget will also contain a label which is tied to the widget through the unique identifier
of the widget. For instance, this slider has an id of ‘popsqmi’. The <label> tag has a
property called ‘for’ which is set equal to ‘popsqmi’. This ties the two together. The slider
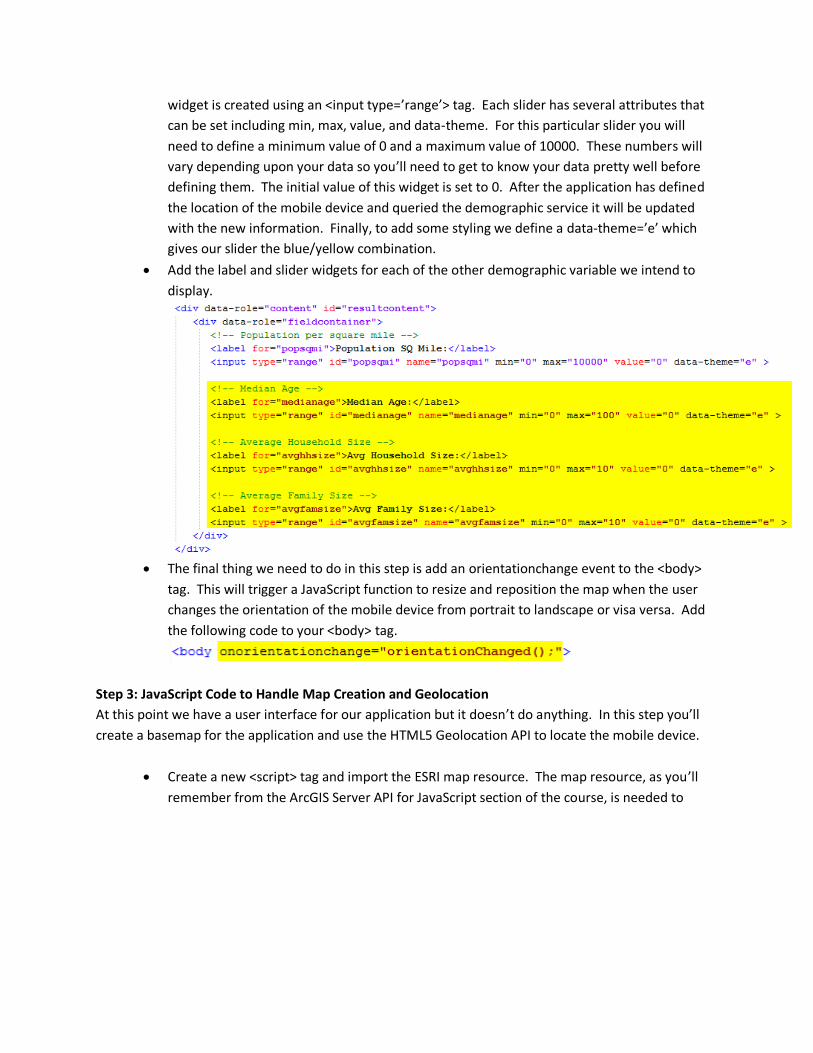
widget is created using an <input type=’range’> tag. Each slider has several attributes that
can be set including min, max, value, and data-theme. For this particular slider you will
need to define a minimum value of 0 and a maximum value of 10000. These numbers will
vary depending upon your data so you’ll need to get to know your data pretty well before
defining them. The initial value of this widget is set to 0. After the application has defined
the location of the mobile device and queried the demographic service it will be updated
with the new information. Finally, to add some styling we define a data-theme=’e’ which
gives our slider the blue/yellow combination.
Add the label and slider widgets for each of the other demographic variable we intend to
display.
The final thing we need to do in this step is add an orientationchange event to the <body>
tag. This will trigger a JavaScript function to resize and reposition the map when the user
changes the orientation of the mobile device from portrait to landscape or visa versa. Add
the following code to your <body> tag.
Step 3: JavaScript Code to Handle Map Creation and Geolocation
At this point we have a user interface for our application but it doesn’t do anything. In this step you’ll
create a basemap for the application and use the HTML5 Geolocation API to locate the mobile device.
Create a new <script> tag and import the ESRI map resource. The map resource, as you’ll
remember from the ArcGIS Server API for JavaScript section of the course, is needed to
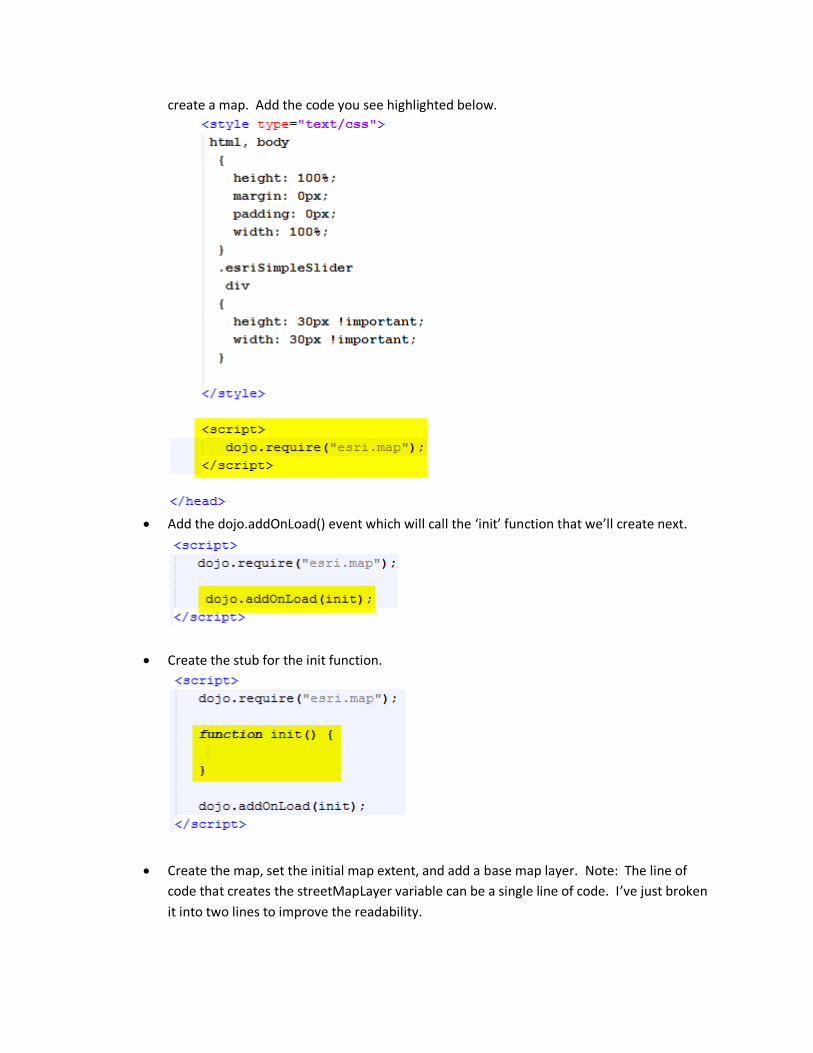
create a map. Add the code you see highlighted below.
Add the dojo.addOnLoad() event which will call the ‘init’ function that we’ll create next.
Create the stub for the init function.
Create the map, set the initial map extent, and add a base map layer. Note: The line of
code that creates the streetMapLayer variable can be a single line of code. I’ve just broken
it into two lines to improve the readability.
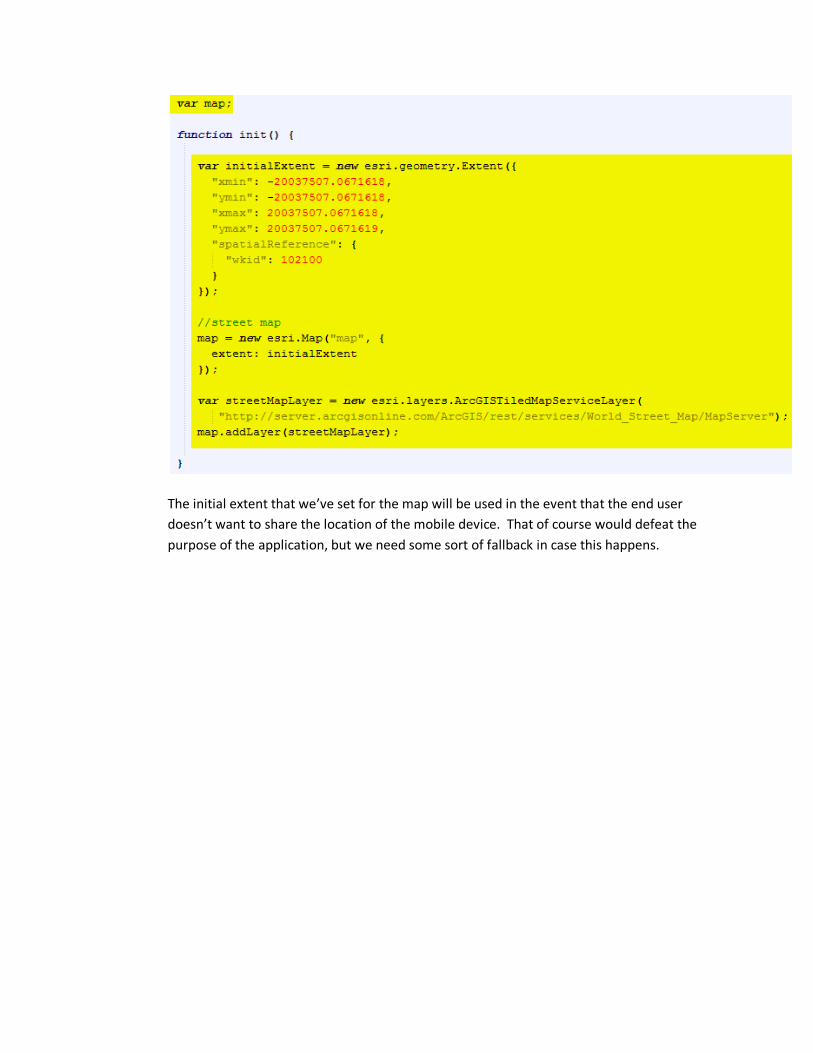
The initial extent that we’ve set for the map will be used in the event that the end user
doesn’t want to share the location of the mobile device. That of course would defeat the
purpose of the application, but we need some sort of fallback in case this happens.
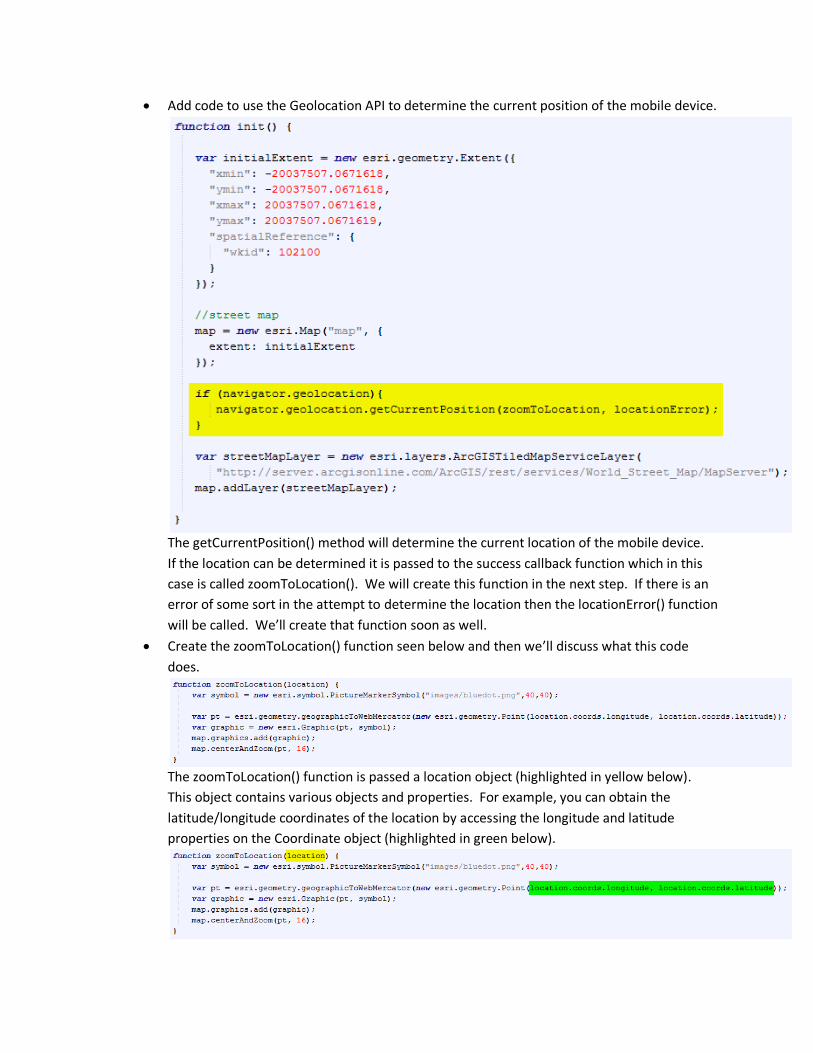
Add code to use the Geolocation API to determine the current position of the mobile device.
The getCurrentPosition() method will determine the current location of the mobile device.
If the location can be determined it is passed to the success callback function which in this
case is called zoomToLocation(). We will create this function in the next step. If there is an
error of some sort in the attempt to determine the location then the locationError() function
will be called. We’ll create that function soon as well.
Create the zoomToLocation() function seen below and then we’ll discuss what this code
does.
The zoomToLocation() function is passed a location object (highlighted in yellow below).
This object contains various objects and properties. For example, you can obtain the
latitude/longitude coordinates of the location by accessing the longitude and latitude
properties on the Coordinate object (highlighted in green below).
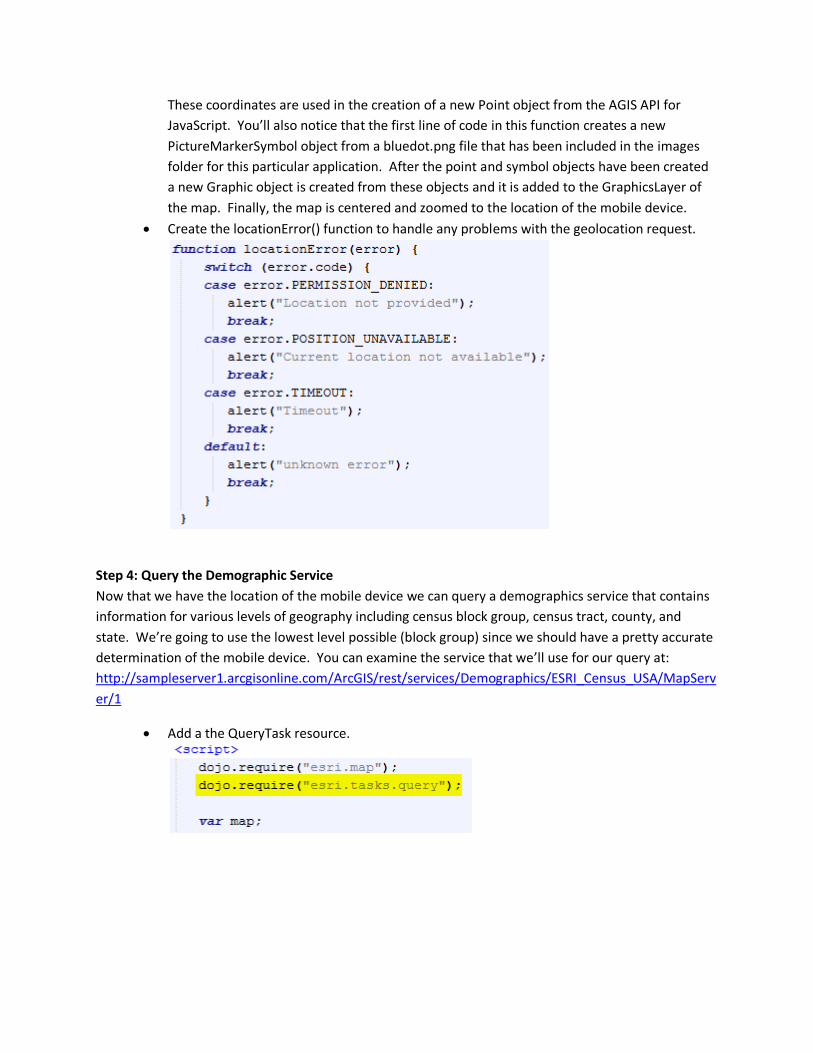
These coordinates are used in the creation of a new Point object from the AGIS API for
JavaScript. You’ll also notice that the first line of code in this function creates a new
PictureMarkerSymbol object from a bluedot.png file that has been included in the images
folder for this particular application. After the point and symbol objects have been created
a new Graphic object is created from these objects and it is added to the GraphicsLayer of
the map. Finally, the map is centered and zoomed to the location of the mobile device.
Create the locationError() function to handle any problems with the geolocation request.
Step 4: Query the Demographic Service
Now that we have the location of the mobile device we can query a demographics service that contains
information for various levels of geography including census block group, census tract, county, and
state. We’re going to use the lowest level possible (block group) since we should have a pretty accurate
determination of the mobile device. You can examine the service that we’ll use for our query at:
http://sampleserver1.arcgisonline.com/ArcGIS/rest/services/Demographics/ESRI_Census_USA/MapServ
er/1
Add a the QueryTask resource.
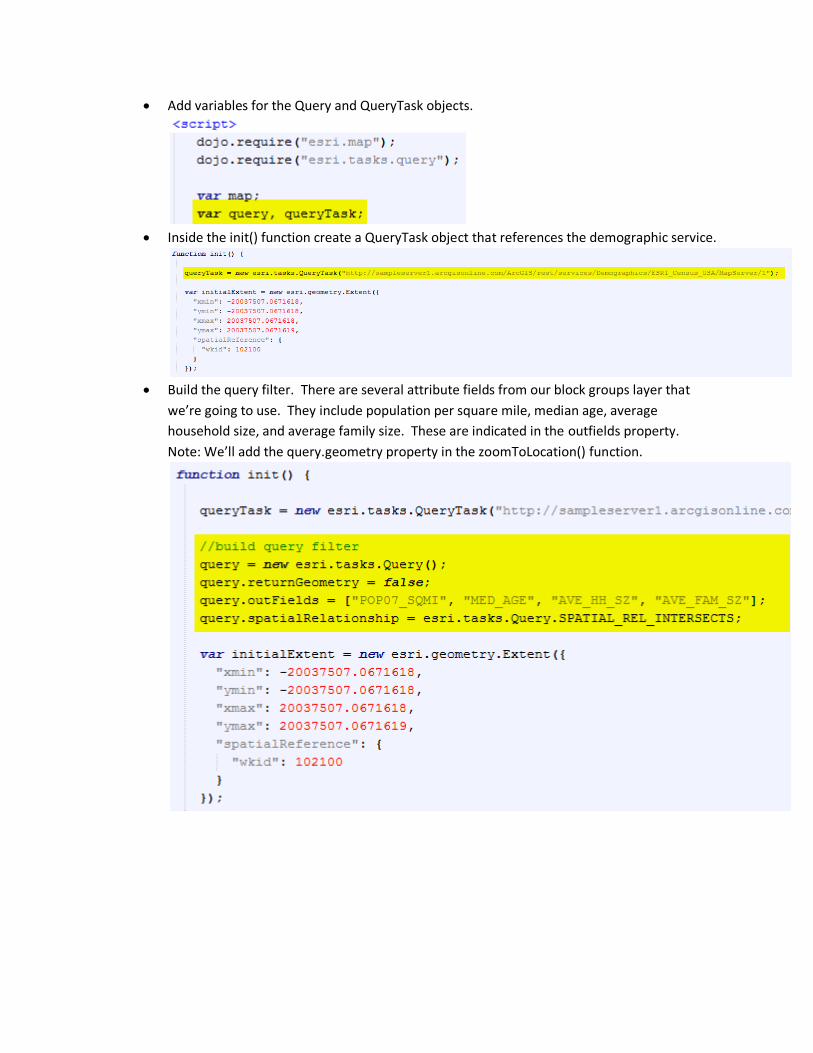
Add variables for the Query and QueryTask objects.
Inside the init() function create a QueryTask object that references the demographic service.
Build the query filter. There are several attribute fields from our block groups layer that
we’re going to use. They include population per square mile, median age, average
household size, and average family size. These are indicated in the outfields property.
Note: We’ll add the query.geometry property in the zoomToLocation() function.
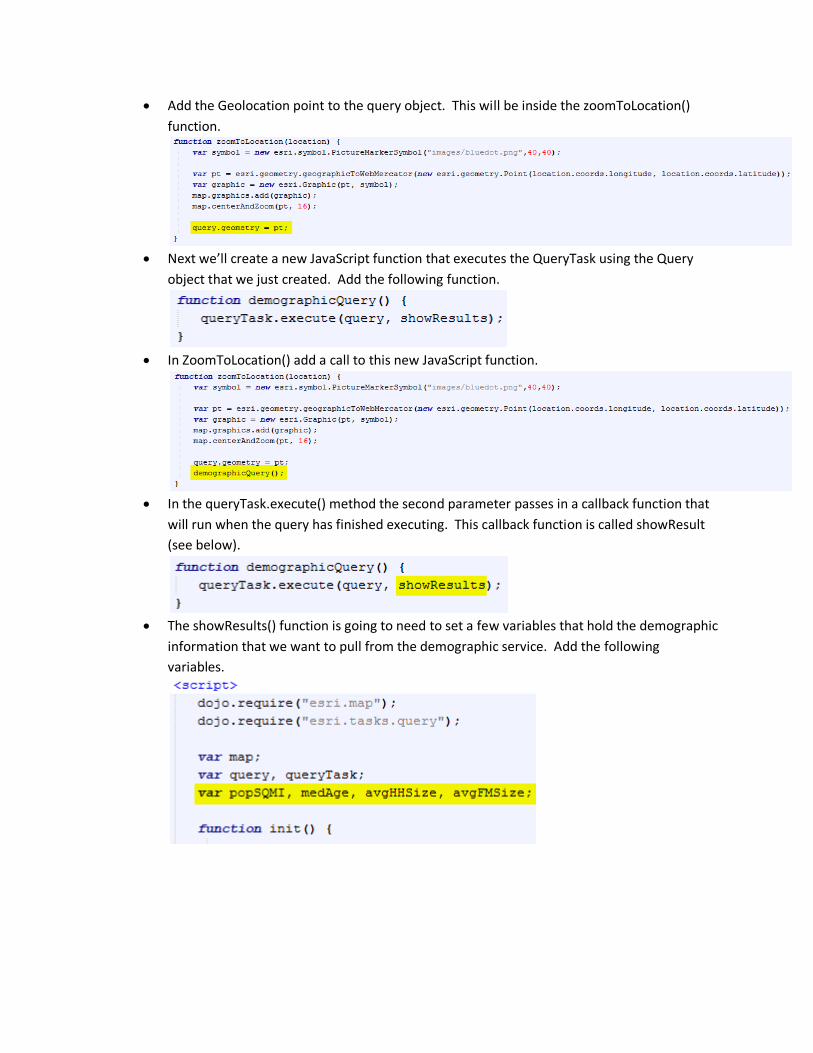
Add the Geolocation point to the query object. This will be inside the zoomToLocation()
function.
Next we’ll create a new JavaScript function that executes the QueryTask using the Query
object that we just created. Add the following function.
In ZoomToLocation() add a call to this new JavaScript function.
In the queryTask.execute() method the second parameter passes in a callback function that
will run when the query has finished executing. This callback function is called showResult
(see below).
The showResults() function is going to need to set a few variables that hold the demographic
information that we want to pull from the demographic service. Add the following
variables.
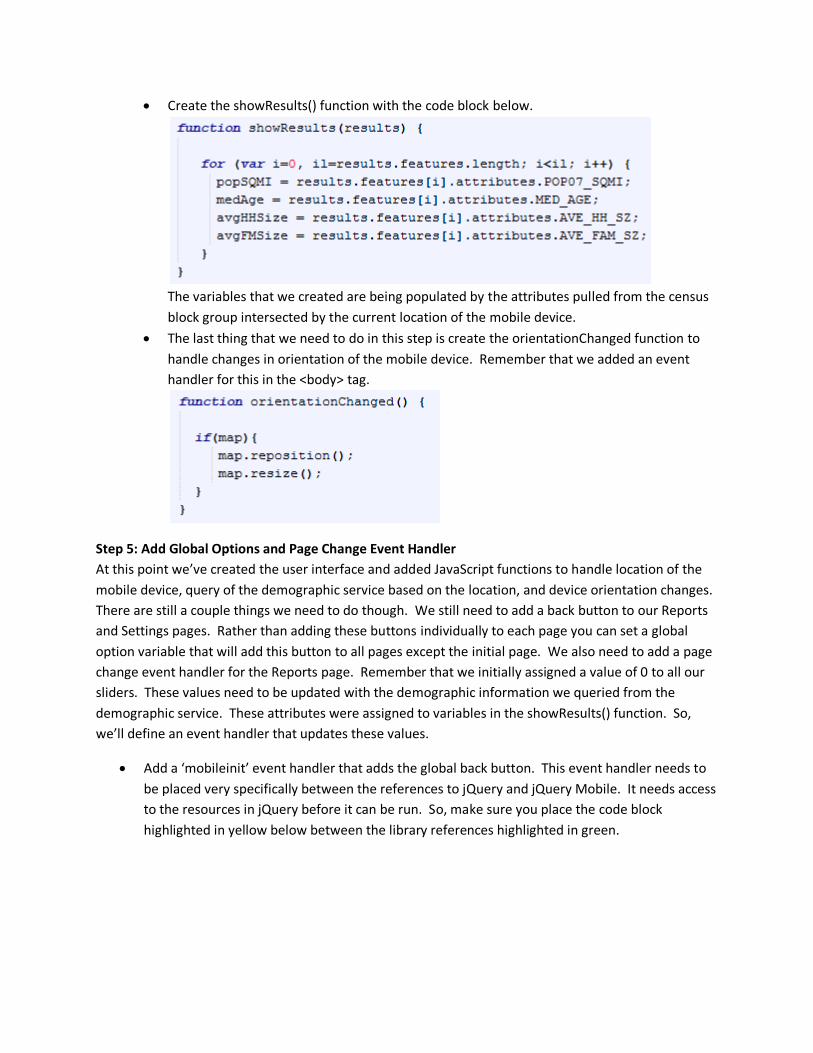
Create the showResults() function with the code block below.
The variables that we created are being populated by the attributes pulled from the census
block group intersected by the current location of the mobile device.
The last thing that we need to do in this step is create the orientationChanged function to
handle changes in orientation of the mobile device. Remember that we added an event
handler for this in the <body> tag.
Step 5: Add Global Options and Page Change Event Handler
At this point we’ve created the user interface and added JavaScript functions to handle location of the
mobile device, query of the demographic service based on the location, and device orientation changes.
There are still a couple things we need to do though. We still need to add a back button to our Reports
and Settings pages. Rather than adding these buttons individually to each page you can set a global
option variable that will add this button to all pages except the initial page. We also need to add a page
change event handler for the Reports page. Remember that we initially assigned a value of 0 to all our
sliders. These values need to be updated with the demographic information we queried from the
demographic service. These attributes were assigned to variables in the showResults() function. So,
we’ll define an event handler that updates these values.
Add a ‘mobileinit’ event handler that adds the global back button. This event handler needs to
be placed very specifically between the references to jQuery and jQuery Mobile. It needs access
to the resources in jQuery before it can be run. So, make sure you place the code block
highlighted in yellow below between the library references highlighted in green.
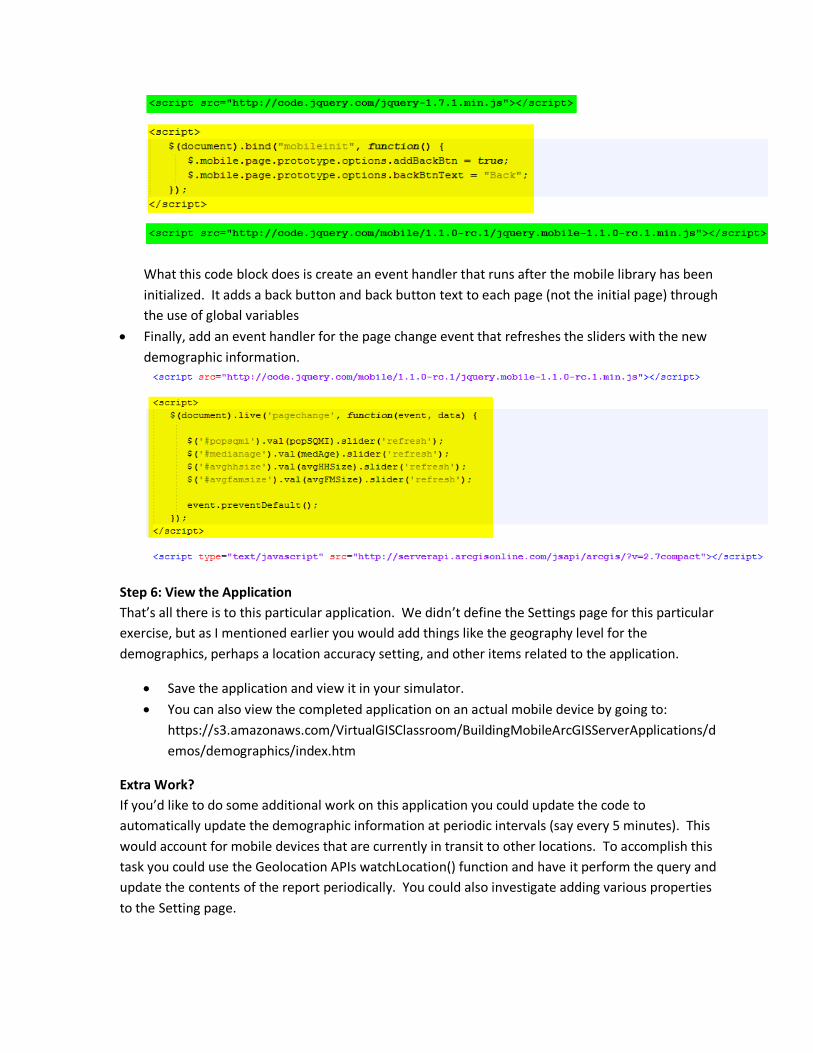
What this code block does is create an event handler that runs after the mobile library has been
initialized. It adds a back button and back button text to each page (not the initial page) through
the use of global variables
Finally, add an event handler for the page change event that refreshes the sliders with the new
demographic information.
Step 6: View the Application
That’s all there is to this particular application. We didn’t define the Settings page for this particular
exercise, but as I mentioned earlier you would add things like the geography level for the
demographics, perhaps a location accuracy setting, and other items related to the application.
Save the application and view it in your simulator.
You can also view the completed application on an actual mobile device by going to:
https://s3.amazonaws.com/VirtualGISClassroom/BuildingMobileArcGISServerApplications/d
emos/demographics/index.htm
Extra Work?
If you’d like to do some additional work on this application you could update the code to
automatically update the demographic information at periodic intervals (say every 5 minutes). This
would account for mobile devices that are currently in transit to other locations. To accomplish this
task you could use the Geolocation APIs watchLocation() function and have it perform the query and
update the contents of the report periodically. You could also investigate adding various properties
to the Setting page.
