excess heat and unexpected elements …lenr-canr.org/acrobat/dashjexcessheat.pdf · palladium...
TRANSCRIPT
Published in Proceedings of the 32nd Intersociety Energy Conversion Engineering Conference, vol. 2, pp. 1350-1355 (1997).
EXCESS HEAT AND UNEXPECTED ELEMENTS FROM AQUEOUS ELECTROLYSIS WITH TITANIUM AND
PALLADIUM CATHODES
J. Dash, R. Kopecek, and S. Miguet, Physics Department, Portland State University,
P.O. Box 751, Portland, OR 97207
Telephone: 503-725-4222 Fax: 503-725-3888
ABSTRACT Presented here are results of research performed at Portland State University during the period 1994 to
1996.
Excess heat was produced at the rate of about 1.2 watts during electrolysis of heavy water with a titanium cathode weighing 0.0625g. Analysis of the electrodes before and after electrolysis with a scanning electron microscopy (SEM) and an energy dispersive spectrometer (EDS) revealed that new surface topographical features with concentrations of unexpected elements (V, Cr, Fe, Ni, and Zn) formed during electrolysis.
The morphology and microcomposition of palladium after electrolysis in heavy water were studied. Fibers which appeared on the surface were observed to change with time. Evidence which supports the possibility of transmutation is presented.
INTRODUCTION Investigations have been underway at Portland State University since April 1989 to achieve understanding
of the interaction of hydrogen isotopes with metals, following the results reported by Fleischmann and Pons (F-P) (1989). Our experiments differed from those of F-P in two fundamental aspects: 1. They used a basic electrolyte and we used an acidic electrolyte which had a lower pH, thus enhancing the discharge of hydrogen isotopes at the cathode due to the much higher concentration of these species in the acidic electrolyte; 2- They used 2 mm diameter palladium cathode and we used palladium and titanium foils less than 1 mm thick, thus reducing the time required to saturate the palladium with hydrogen isotopes.
These two differences in our experiments seem to have enhanced the reproducibility of results. We have not had difficulty in achieving reproducible excess heat (Dash, et al, 1993, 1994) (Dash and Kopecek, 1996)). However, we have not detected radiation of any kind emanating from our cells, but another scientist who used our system did detect anomalous radiation (Miles et al, 1996). We have evidence which supports the hypothesis of a nuclear process occurring during electrolysis with a palladium cathode. This evidence includes shifts in the isotopic abundance of palladium isotopes on the surface of a palladium cathode after electrolysis (Dash, 1996), and the occurrence of localized concentrations of unexpected elements which may have resulted from transmutation (Dash, et al, 1994) (Kopecek, 1995).
Here, we will describe the results of electrolysis experiments with titanium cathodes and of observations on palladium cathodes after electrolysis.
EXPERIMENTAL METHODS AND RESULTS Preliminary experiments have been performed on titanium which is an attractive low-cost alternative to
palladium. The electrolyte contained the ratio 0.01 mol H2SO4 to 0.99 mol D2O. A control cell with Pt cathode was connected in series with an experimental cell which was identical except for a Ti cathode. Using constant current (currently density about 2A/cm2) electrolysis was performed for 54 hours. An automated data acquisition system continuously monitored six thermocouples attached to each cell, the ambient temperature, and the cell voltages. From the beginning of the experiment, each thermocouple on the Ti-cathode (D) cell gave a higher temperature than the corresponding thermocouple on the Pt-cathode © control cell. This was true almost without exception for the whole experiment. Fig. 1 gives the difference in power input and temperature for the two cells.
The steady-state temperature difference was reached in about 45 min. At steady state the Ti-cathode D cell was about 4°C higher in temperature than the control C cell, even though the power input to the D cell was about 0.25 watt lower. This temperature difference continued for 23 hours, when the C cell was removed from the circuit due to excessive loss of electrolyte. Excess heat may have been produced by the D cell. This can be calculated by considering the power input, the heat produced by the combination of titanium with hydrogen isotopes, losses due to escape of gases through the tops of the cells, and the heat loss to the surroundings due to the thermal gradient between the ceils and the surroundings.
The following equations give the rate of enthalpy change in each cell:
C(control) cell: dH(C)/dt – IV(C)-dH(Cesc)/dt-R∆T(C)
D cell: dH(D)/dt = IV(D)+dH(TiD)/dt+dH(XS)/dt-dH(Desc)/dt-R∆T{D),
where H(C) and H(D) are each the enthalpy of the C and D cells, respectively, H(TiD) is the enthalpy released by formation of TiD, H(Cesc) and H(Desc) are each the enthalpy which escapes from its respective cell due to incomplete recombination, H(XS) is the excess enthalpy produced in the D cell, I is the constant current which passes through both cells, V(C) and V(D) are the cell voltages, R is the rate of heat loss by each cell to the surroundings, and ∆T(C) and ∆T(D) are the temperature differences between each cell and ambient.
At steady state, which was reached in about 45 minutes, the enthalpy gain equals the enthalpy loss for each cell, so each equation can be set equal to zero. The enthalpy lost due to escape of gases is determined from the weight lost by each cell. For the C cell, this was 285 calories for the whole experiment (23 hours for the C cell), which gives dH(Cesc)/dt equal to 0.0034 calories per second. The average power input to the C cell during one hour at steady state IV©, was 0.644 calories per second. Then the first equation is solved for R, using ∆T(C) of 16.5 C. This gives R equal to 0.0388 calories per degree C. This is used in the second equation.
About 40 calories is produced by conversion of the entire titanium cathode to TiD, so dH(TiD)/dt is about 0.0003 calories per second. IV(D) is 0.525 calories per second, dH(Desc)/dt is 0.0012 calories per second, and ∆T(D) is 20.6 degrees C. solving for dH(XS)dt gives 0.28 calories per second, or 1.15 watts.
Geiger-Mueller counters were used to monitor radiation from the C and D cells throughout the experiment, and LiF chips sealed in plastic were in each cell during the experiment. The counters showed slightly higher amounts of radiation coming from the D cell, but the standard deviation was too high to have confidence in this data. The LiF chips showed no significant difference from background.

Fig. 1. Difference in temperature and power input for a cell with Pt cathode (C) and a cell with Ti cathode (D).
The titanium cathode was examined before and after electrolysis with SEM and EDS. Before each examination, the electrode was cleaned ultrasonically several times, each time, for five minutes with deionized water. New surface topographical features with concentrations of unexpected elements (S, K, Ca, V, Cr, Fe, Ni, and Zn) formed during electrolysis (Kopecek, 1995).
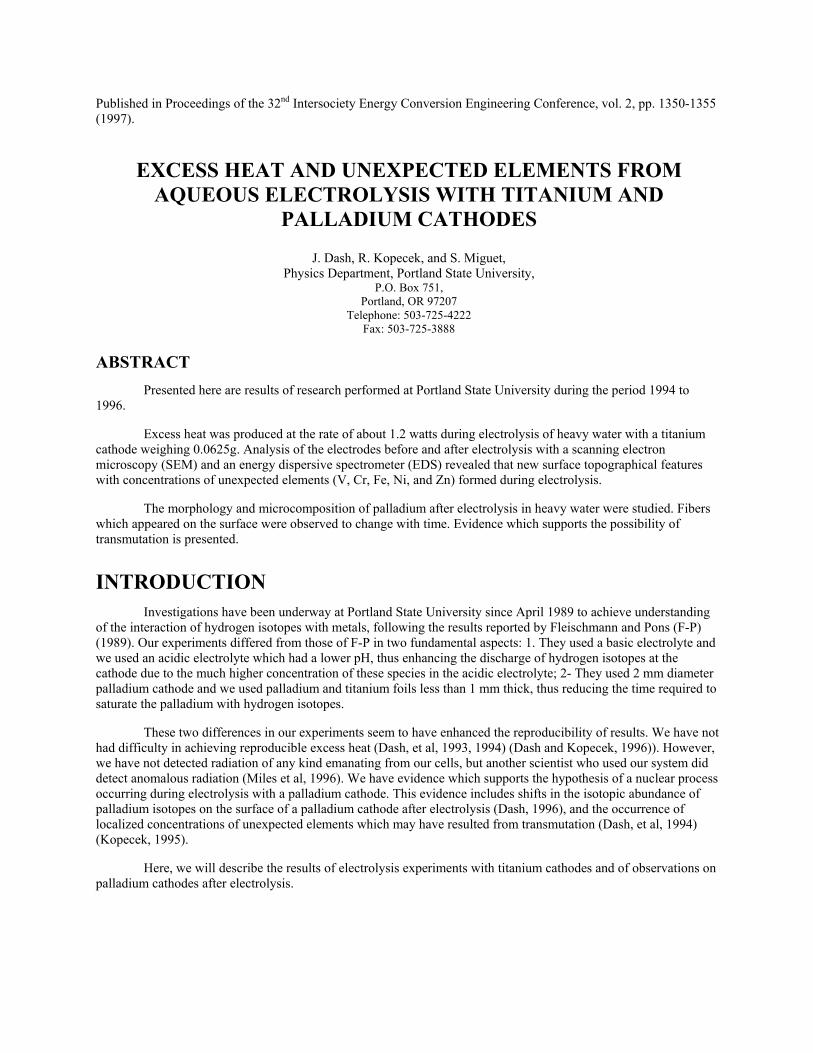
In another similar experiment, the current density during electrolysis was about 0.5A.cm2. The excess heat was about 0.5 watt for a titanium electrode from the same lot, of about the same mass. This electrode was also examined before and after electrolysis with SEM and EDS. The comparison of images is given in Fig. 2.
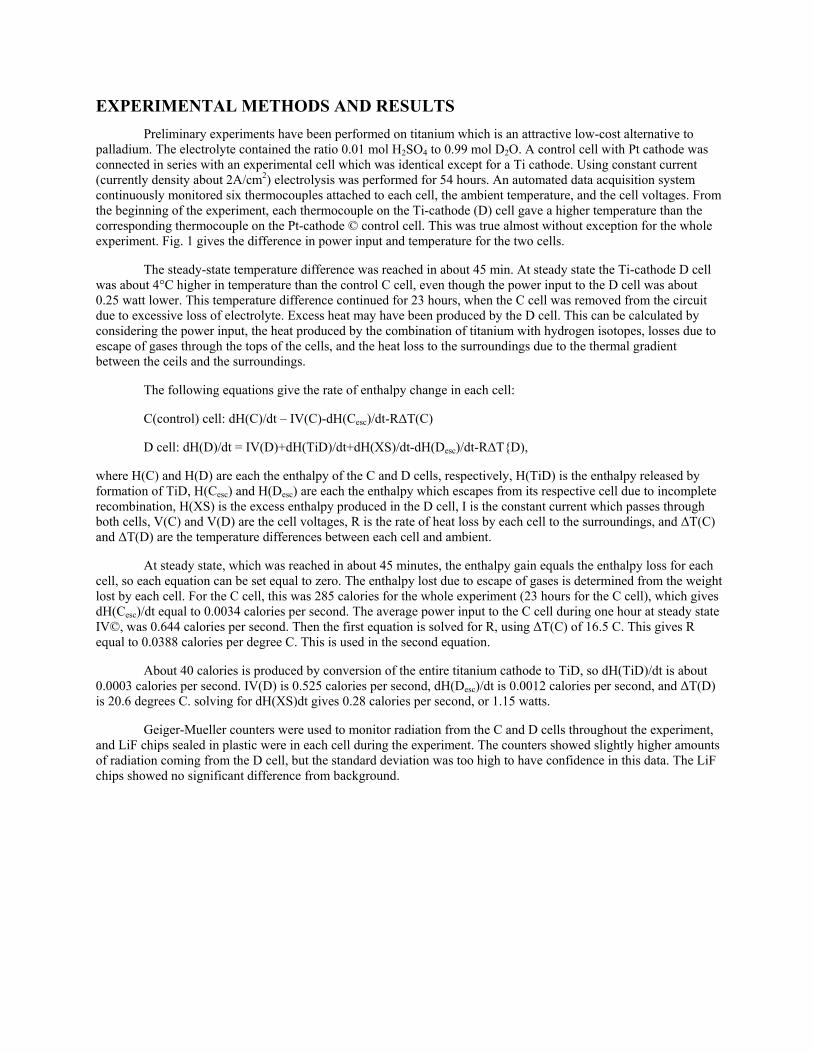
The double-headed arrow in Fig. 2b shows a feature which was not present on the titanium cathode before electrolysis. A portion of this feature is shown enlarged in Fig. 3. The bright spots (a) and (b) were used for the EDS spectra in Fig. 4.
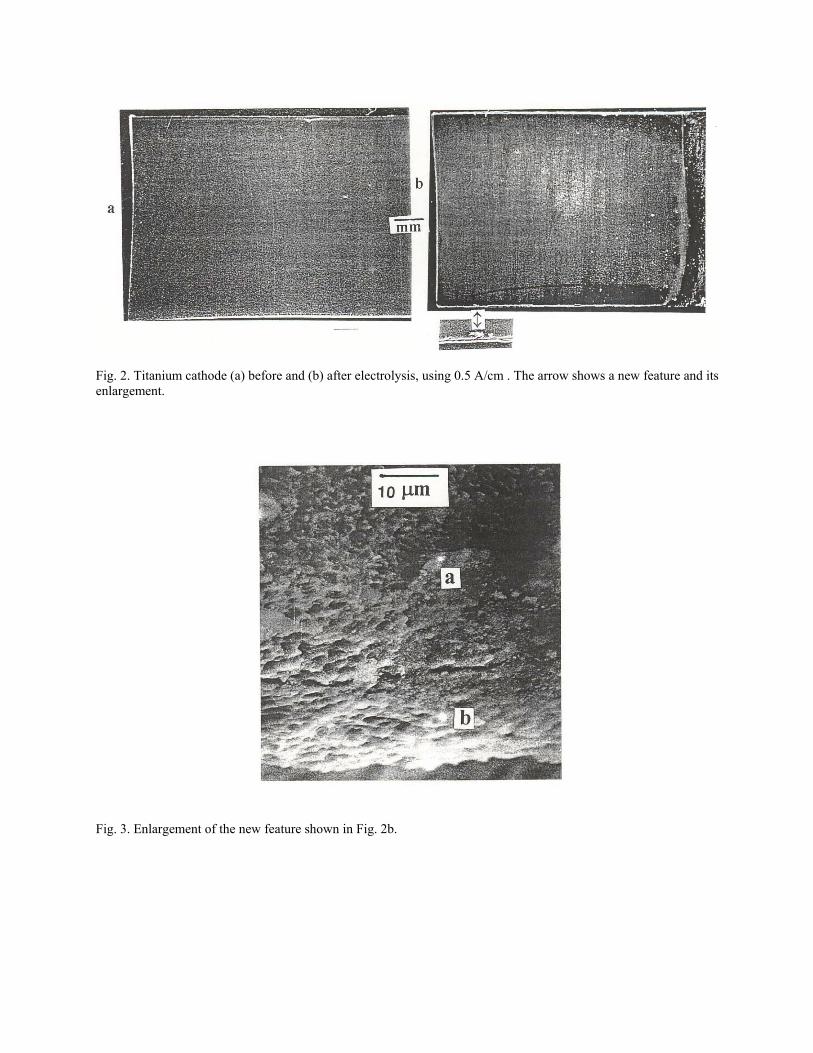
Fig. 2. Titanium cathode (a) before and (b) after electrolysis, using 0.5 A/cm . The arrow shows a new feature and its enlargement.
Fig. 3. Enlargement of the new feature shown in Fig. 2b.
Fig. 4. EDS spectra (a) and (b) from points (a) and (b), respectively, in Fig. 3.
Similar experiments with palladium cathodes also produced excess heat and unexpected elements (Dash, et al, 1994; Dash, 1996). Another feature which was often observed was fibers which appeared to grow on the cathode during electrolysis. An example of these is shown on particle 4 in Fig. 8 of (Dash, et al, 1994). Fibers were also observed to have formed on a Pd cathode which was examined immediately after an experiment in June 1994. After storage in air for about six months, the fibers appeared as shown by the SEM photograph in Fig. 5a. The fibers are composed of Pd, S, O, and C. Apparently, these fibers grew during electrolysis due to reaction between the electrolyte and the Pd cathode. It should be noted that the electrolyte contains sulfate and that the graphite cloth used to suspend the recombination catalyst in the electrolysis cells is a possible source of carbon. Fig. 5b shows that two days later the morphology of the fibers had changed. The spot labeled E1 was analyzed and found to contain silver with a ratio of AgLβ to AgLα of 0.57. Fig 5c shows the same fibers after about one month additional storage in air. It is obvious that additional changes in morphology have occurred. The EDS spectrum from point E2 shows that silver is still present, but the ratio of AgLβ to AgLα has increased to 0.82. it should be noted that CdLα overlaps AgLβ. So it is possible that silver is slowly changing to cadmium. The spectra are shown in Fig. 5d and e.
DISCUSSION OF RESULTS The results obtained with thin foil titanium cathodes are similar to those we obtained with thin foil palladium
cathodes, using H2SO4-D2O electrolyte (Dash, et al, 1994), in that excess heat and unexpected elements are obtained reproducibly in both cases. A significant difference is that excess heat is observed from the very beginning of electrolysis when a titanium cathode is used, whereas there is an incubation time when a palladium cathode is used. The duration of the incubation period depends on the thickness of the Pd foil. At 0.025 mm it is about one hour, and at 0.1 mm it is about one day. The magnitude of the excess heat seems greater for titanium than for palladium under equivalent conditions.

Fig. 5(a-c). Changes in morphology of fibers which formed on a Pd cathode during electrolysis. These changes occurred during storage at room temperature.
Fig. 5 (d, e). EDS spectra showing changes in composition which were detected at spot E1 on Jan. 19, 1995 and at spot E2 on Feb. 17, 1995.

For both Pd and Ti, the unexpected elements observed after electrolysis are found only on very small fractions of the cathode surfaces. If these elements were impurities which were electroplated, it seems likely that their occurrence would be more general, over a much larger fraction of the cathode surface. For example, the most prevalent impurity is Pt, which slowly dissolves from the anode and most likely deposits over the entire Pd cathode. This expectation is confirmed by Fig. 4 of Dash, et al (1994), which shows Pt peaks in all five spectra. But Pt is not found in either of the spectra of Fig. 4, which were taken from a Ti cathode, because the Ti cathode dissolves into the electrolyte, carrying with it electroplated impurities. Based on the weight loss of the Ti cathode, the average rate of decrease of the cathode thickness was about 4A/sec. This is a remarkable result because the electrolyte is a very dilute acid which is not expected to dissolve Ti.
The presence of vanadium at a concentration of about four percent at point (a) on Fig. 3 is totally unexpected, since the certificate of analysis of the Ti gave a 0.910 ppm V. Concentrating V in Ti by solid-state diffusion at the temperature of the electrolysis experiment (about 50°C) is expected to be negligible. The sulfur peak in Fig. 4a may be the result of interaction of electrolyte sulfate with a “hot spot” on the Ti, similarly to our suggested explanation for the sulfur peaks in Figs. 4b and c, (Dash, et al 1994). Neither sulfur nor vanadium occur in the spectrum from spot b.
The bulges which formed on the fibers in Fig. 5a involved localized changes in diameter of more than 10 jim. Two days later, a particle about 10 )im diameter appeared at E1 in Fig. 5b. These changes occurred with the electrode lying on the lab shelf at room temperature. It is not likely that these changes could have been produced by solid-state diffusion. For example, by using the self-diffusion coefficient of silver, it is estimated that 1016 years would be required for diffusion of silver a distance of 1 urn at amibent. It is more likely that the interaction of the hydrogen isotopes absorbed into the palladium during electrolysis continued long after electrolysis ended, resulting in the observed topographical and elemental changes. The mechanism which produced these changes is not known. Fibers were also observed on the surface of a titanium cathode after electrolysis, but these were not monitored to determine if changes occurred.
Other workers have also found excess heat and possible transmutation products resulting from aqueous electrolysis (Miley, et al, 1996).
CONCLUSIONS 1. Excess heat is produced by electrolysis of acidified heavy water with either thin Pd or Ti cathodes. Reproducibility is very good.
2. Unexpected elements form on these cathodes during electrolysis
3. Pd cathodes continued to change during storage at room temperature, long after electrolysis was stopped.
4. Evidence for transmutation of Pd to Ag was observed on a Pd cathode about seven months after electrolysis was completed.
REFERENCES Fleischmann, M. and Pons, S. 1989, “Electrolytically Induced Nuclear Fusion of Deuterium,” J.
Electroanalytical Chem. 267, 301; errata: 1990, 263, 187.
Dash, J., Keefe, P.S., Nicholas, E., and Silver, D.S. 1993, “Comparison of Light and Heavy Water Electrolysis with Palladium Cathodes,” Proc. AESF Annual Tech. Conf. 80, 755.
Dash, J., Noble, G., and Diman, D. 1994, “Surface Morphology and Microcomposition of Palladium Cathodes After Electrolysis in Acidified Light and Heavy Water: Correlation with Excess Heat,” Trans. Fusion Tech,; 26, #4T, Part 2, 229.
Dash, J. 1996, “Chemical Changes and Excess Heat Caused by Electrolysis with H2SO4-D2O Electrolyte,” Proc. lCCF-6, 2, 477.
Kopecek R., and Dash, J. 1996, “Excess Heat and Unexpected Elements from Electrolysis of Heavy Water with Titanium Cathodes,” J. New Energy, 1_, No. 3, 46.
Miles, M.H., Bush, B.F., and Johnson, K.B. 1996, “Anomalous Effects in Deuterated Systems,” NAWCWPNS Technical Publication 8302, p. 27.
Kopecek, R. 1995, “Electrolysis of Titanium in Heavy Water,” M.S. Thesis, Portland State University, Portland, OR.
Miley, G.H., Name, G., Williams, M.J., Patterson, J.A., Nix, J., Cravens, D., and Hora, H. 1996, “Quantitative Observation of Transmutation Products Occurring in Thin-Film Coated Microspheres During Electrolysis,” Proc. ICCF-6, 2, 629.
ACKNOWLEDGMENT Prof. R.J. O’Brien made important suggestions concerning thermal analysis. Financial support provided by
the Drexler Foundation and by Mr. and Mrs. Jerome Drexler made possible the presentation of this paper.