excess colloid retention in porous media as a function of colloid size, fluid velocity, and grain...
TRANSCRIPT
Excess Colloid Retention in PorousMedia as a Function of Colloid Size,Fluid Velocity, and Grain AngularityM E I P I N G T O N G A N DW I L L I A M P . J O H N S O N *
Department of Geology and Geophysics, The University ofUtah, Salt Lake City, Utah 84112
The deposition and re-entrainment behaviors of five sizesof carboxylate-modified microspheres (ranging from 0.1to 2.0 µm) were examined both in porous media and impingingjet systems under a variety of environmentally relevantpore fluid velocities (2-8 m day-1), and in both the absenceand the presence of an energy barrier to deposition. Themagnitudes of the deposition efficiencies were comparedamong the porous media and impinging jet systemsunder equivalent fluid velocities, solution chemistries, andsurface chemistries. The observed deposition efficiencieswere factors of about 5 to 50 greater in the porous mediarelative to the impinging jet across the entire size rangeof microspheres examined, demonstrating that this excessdeposition in porous media is relevant to a wide rangeof colloid sizes. The magnitude of excess deposition increasedwith increasing fluid velocity, and was greatest for thesmallest colloids (0.1 µm). A range between 15% and 40%of the excess retained colloids were released uponintroduction of low ionic strength solution, indicating thatthey were retained via secondary energy minima withoutdirect contact with the grain surfaces. The observationsindicate that pore geometry is a critical governor of colloiddeposition in the presence of an energy barrier, even inporous media composed of spherical collectors. A portionof this excess deposition results from retention in flowstagnation zones.
IntroductionSurfaces of environmental colloids (biological and nonbio-logical) and porous media typically display bulk negativecharge, yielding overall repulsive electric double layerenergies between them. Despite the presence of this energybarrier, colloid deposition onto overall like-charged grainsurfaces is well demonstrated. A number of mechanisms havebeen proposed to explain colloid deposition in porous mediain the presence of an energy barrier, such as localizednanoscale patches of attractive surface charge (1-4), grainsurface roughness (5, 6), straining (7-11), and deposition inthe weakly attractive energy minimum (secondary energyminimum) outboard (at greater separation distances) fromthe interaction energy barrier (12-17).
Colloid deposition flux in the presence of an energy barrieris normalized to that in the absence of an energy barrier toyield the deposition efficiency (R). Recent experimentsdemonstrate that R is greater in porous media relative to flatsurfaces (e.g., impinging jet systems) under equivalent
conditions. Values of R observed for a bacterial strain (1.7µm effective diameter) in quartz sand were factors of 10-100 greater than those observed on quartz substrata in animpinging jet system under equivalent conditions (15, 16).Likewise, values of R observed for carboxylate-modifiedpolystyrene latex microspheres (1.1 and 5.7 µm diameter)were factors of 2-3 greater than those observed on quartzsubstrata in an impinging jet under equivalent conditions(17).
In the above studies, the observed excess depositionefficiency in the porous media was attributed to colloidassociation with the grain surface via secondary energyminima and retention in rear flow stagnation zones (15-17).The rationale for retention involving secondary energyminima was the observed release of the majority of depositedcolloids upon introduction of low ionic strength solution,indicating association with grain surfaces via attractivecolloidal forces that were eliminated in response to decreasedionic strength, i.e., the secondary energy minimum. Sincesecondary energy minimum-associated colloids would besubject to fluid drag and transport along the grain surface,their retention requires the presence of flow stagnation zones,e.g., rear flow stagnation zones. In contrast, retention in animpinging jet system (flat, smooth surface) requires associa-tion with the surface via the primary energy minimum, sincethe absence of flow stagnation zones would allow secondaryminimum-associated colloids to be swept from system (15-18).
Since fluid drag increases with increasing colloid size,one might expect the discrepancy between porous mediaand impinging jet deposition efficiencies to increase withincreasing colloid size. The previous few investigationsregarding excess R concerned colloid sizes in the range of 1.0µm diameter and larger (15-17). The relevance of excess Rto colloids smaller than 1.0 µm in diameter is uncertain,since colloid size may dictate not only the fluid drag force,but also may govern the number of colloids retained in flowstagnation zones. Hence, the relationship between colloidsize and excess R is not clear, and requires investigation.Furthermore, since fluid drag increases with increasing fluidvelocity, excess R would be expected to increase withincreasing fluid velocity. However, the capacities of flowstagnation zones are an uncertain function of fluid velocity.Hence, the relationship between fluid velocity and excessdeposition efficiency also requires examination.
Previous studies of excess deposition primarily concernedporous media composed of angular collectors (quartz sand).Recent experiments suggest that colloid deposition in thepresence of an energy barrier occurs dominantly in associa-tion with grain-to-grain contacts (19, 20), which are moreprevalent in angular relative to spherical porous media (19,20). Hence, another issue requiring investigation is thesignificance of excess R in porous media composed ofspherical grains.
The objective of this paper is to demonstrate that themagnitude of excess R in porous media composed of sphericalcollectors (grains) is large (ranging from 5 to 50) across thecolloid size ranged examined here (0.1-2.0 µm diameter),demonstrating that this excess deposition is relevant to awide range of colloid sizes, as well as to angular and sphericalporous media. We discuss the trends in excess R versus colloidsize and fluid velocity. These observations demonstrate thatthe geometry of the pore domain is paramount to colloiddeposition in the presence of an energy barrier for a widespectrum of colloid sizes and for both spherical and angularporous media collectors.
* Corresponding author phone: (801) 581-5033; fax: (801) 581-7065; e-mail: [email protected].
Environ. Sci. Technol. 2006, 40, 7725-7731
10.1021/es061201r CCC: $33.50 2006 American Chemical Society VOL. 40, NO. 24, 2006 / ENVIRONMENTAL SCIENCE & TECHNOLOGY 9 7725Published on Web 11/10/2006
Materials and MethodsMicrospheres. Spherical fluorescent carboxylate-modifiedpolystyrene latex microspheres (Molecular Probes, Inc.,Eugene, OR) of five sizes (diameters of 0.1, 0.2, 0.5, 1.0, and2.0 µm, with negative surface charge densities of 0.3207, 0.282,0.1419, 0.0175, and 0.1076 meq g-1, respectively) were usedin all experiments except as noted. The 0.1, 0.2, 0.5, 1.0, and2.0 µm microsphere stock suspensions had particle con-centrations of 3.6 × 10¹³, 4.5 × 10¹², 2.9 × 10¹¹, 2.7 × 10¹⁰,and 4.5 × 10⁹ microspheres mL-1, respectively. The stocksolutions contained NaN3 (2 mM); whereas the 2.0 µmmicrosphere stock suspension also included 0.01% Tween-20.
Prior to injection, stock solutions for the 0.1, 0.2, 0.5, and1.0 µm microspheres were diluted in NaCl solution to achievea nominal influent concentration (Co) of 1.0 × 10⁷ particlesmL-1 at the desired ionic strength (NaCl), plus MOPS buffer(2.2 mM), yielding a solution pH of 6.72. The stock solutionfor the 2.0 µm microspheres was first diluted 10 times inpure (Milli-Q) water (Millipore Corp. Bedford, MA), and waswashed three times to remove Tween-20. Washing involvedcentrifugation (10 000g for 10 min at 4 °C), followed bydecanting, and addition of pure water. Following washing,the 2.0 µm microsphere solution was diluted in NaCl solutionto achieve a nominal influent concentration (Co) of 1.0 × 10⁶
at the desired ionic strength (NaCl) plus MOPS buffer (2.2mM), yielding a solution pH of 6.72.
Deposition in the packed porous media column and theimpinging jet systems was examined both in the absenceand presence of an energy barrier. Experiments in thepresence of an energy barrier to deposition were conductedat an ionic strength of 0.02 M for 0.1, 0.2, 0.5, and 1.0 µmmicrosphere sizes, and at an ionic strength of 0.05 M for 2.0µm microspheres. The corresponding ú-potentials for the0.1, 0.2, 0.5, 1.0, and 2.0 µm microspheres were about -23,-27, -41, -59, and -43 mV, respectively. Measurements todetermine ú-potentials are described in detail in the Sup-porting Information.
Experiments performed in the absence of an energy barrierwere conducted at various ionic strengths depending on thestrategy used to eliminate the energy barrier. For the 1.0 µmmicrospheres, conditions absent an energy barrier weregenerated by use of amine-functionalized polystyrene latexmicrospheres (Molecular Probes, Inc., Eugene, OR) at an ionicstrength of 0.001 M. The amine-functionalized microsphereshad a stock concentration of 4.5 × 10¹⁰ microspheres mL-1,a diameter of 0.93 µm, and a positive surface charge of 0.9176meq g-1. Since amine-modified microspheres were notcommercially available in the 0.1, 0.2, 0.5, and 2.0 µm sizes,elimination of the energy barrier for the 0.1, 0.2, 0.5, and 2.0µm microspheres was achieved by lowering solution pH to2 (HCl addition) and increasing the solution ionic strengthto 0.05 M (NaCl). The corresponding ú-potentials for the 0.1,0.2, 0.5, 0.93, and 2.0 µm microspheres were about -13.8,-2.3, -5.2, +9.2, and -5.4 mV, respectively (SupportingInformation).
Porous Media Experiments. Porous Media. Spherical sodalime glass beads (Cataphote Inc. Jackson, MS) and quartzsand (Unimin Corp., New Canaan, CT) with sizes rangingfrom 417 to 600 µm were used for microsphere depositionexperiments in porous media. The procedure used forcleaning the glass beads and quartz sand is provided inprevious publications (21-23), as well as in the SupportingInformation. The ú-potentials of the glass beads were -51and -56 mV at ionic strengths of 0.02 and 0.05 M, respectively(pH 6.72); whereas the ú-potential of the glass beads at pH2 and an ionic strength of 0.05 M was -10 mV (SupportingInformation).
Porous Media Experimental Conditions. Cylindrical Plexi-glass columns (20 cm long, 3.81 cm i.d.) were dry-packed
with glass beads or quartz sand, flushed with CO2, andequilibrated with microsphere-free solution. The procedureof packing and pre-equilibration is described in previouspublications (21-24), and in the Supporting Information.
After pre-equilibration, a solution with microspheres wasinjected (3 pore volumes). This was followed by elution withmicrosphere-free solution (7 pore volumes). Selected experi-ments included a subsequent phase to examine the releaseof retained microspheres in response to further elution withthe following solutions: (1) microsphere-free solution at thepH and ionic strength of the injection and elution solutions(2 pore volumes); (2) low ionic strength solution (0.0002 M)(without microspheres) (2 pore volumes); pH 11 solution(adjusted by NaOH) (without microspheres) (3 pore volumes).The low ionic strength solution was introduced to eliminatethe secondary energy minimum, whereas the pH 11 solutionwas introduced to reverse any positively charged domains(e.g., metal oxide impurities) on the grain surfaces.
During injection, the microsphere suspension reservoirswere sonicated for 1 min per hour to minimize aggregation,as verified by flow cytometric analyses (Supporting Informa-tion). The flow rate was varied between experiments toproduce pore water velocities at 2, 4, and 8 m day-1.Experiments performed in the absence of an energy barrierinvolved all three fluid velocities, whereas experimentsperformed in the presence of an energy barrier involved onlythe higher two fluid velocities (4 and 8 m day-1) due to theoccurrence of ripening at the lower fluid velocity. Thesuspensions and solutions were injected in up-flow modeusing a syringe pump (Harvard Apparatus, Inc, Holliston,MA).
Sample Collection and Analysis. Column effluent sampleswere collected in 5 mL polystyrene tubes using a fractioncollector (CF-1, Spectrum Chromatography, Houston, TX).Following the experiment, the porous media was dissectedinto ten 2-cm-long segments, as the porous media wasreleased from the column under gravity. Retained colloidswere recovered by placing porous media segments (2 cm)into specified volumes of Milli-Q water and sonicating for 1min, followed by manual vigorous shaking for 0.5 min.Aqueous effluent samples, and supernatant samples fromrecovery of retained microspheres, were analyzed using flowcytometry (BD FACScan, Becton Dickinson & Co., FranklinLakes, NJ); details are provided in Li et al. (21). The areaunder the breakthrough-elution curve was integrated to yieldthe number of microspheres that exited the column. Thecolloids recovered from all segments of the sediment weresummed to determine the total number of retained colloids.The overall recovery (mass balance) of colloids was deter-mined by summing the numbers of retained colloids andcolloids that exited the column. The overall recovered numberof colloids was divided by the number of injected colloidsto express the mass balance as a percentage.
The transport and deposition of microspheres in porousmedia was modeled using an advection-dispersion equationthat includes removal from, and re-entrainment to, theaqueous phase:
where C is the concentration of microspheres in the aqueousphase (spheres per unit volume of fluid), t is the travel time,x is the travel distance, v is the fluid velocity, D is thedispersion coefficient of the colloid particles, θ is the porosity,Fb is the bulk density of sediment, and kf and kr are ratecoefficients for microsphere deposition to and re-entrain-ment from the solid phase, respectively. Sr is the reversiblyretained microspheres concentration on the solid phase(spheres per unit mass of sediment) and can be further
∂C∂t
) -v∂C∂x
+ D∂
2C
∂x2- kfC +
Fb
θkrSr (1)
7726 9 ENVIRONMENTAL SCIENCE & TECHNOLOGY / VOL. 40, NO. 24, 2006
expressed as
where S is the total deposited sphere concentration and fr
is the fraction of reversibly retained spheres. The totaldeposited microsphere concentration (S) is related to C asfollows:
A one-dimensional discrete random-walk particle-track-ing model was used to solve eqs 1 and 2 under the conditionsof the porous media experiments, and details of implemen-tation of the governing equation can be found in otherpublications (21, 25, 26). It is important to note that theprobabilistic approach used in the particle tracking modeldecouples the parameters kr and fr, whereas this decouplingis not apparent in the equations as written in continuumform (eqs 1 and 2).
The deposition rate coefficient in porous media (kf) wasalso calculated from the collector efficiency (η) as follows:
where θ is the sediment porosity, dc is the collector (sedimentgrain) diameter, v is the fluid velocity, and R is the collisionefficiency, which is the number of colloid attachments per
number of collisions. Different correlation equations areavailable to estimate η, e.g., the correlation equationsdeveloped by Rajagopalan and Tien (27, 28) and Tufenkjiand Elimelech (29), which are abbreviated below as the R-Tand T-E equations, respectively.
Impinging Jet Experiments. Substrata Preparation. Glassmicroscope slides (Fisher Scientific, Inc.) of dimension 25 ×75 × 1 mm were used in the impinging jet flow cell. The SC-1cleaning procedure (30) was used for cleaning the glasssubstrata, as described in a previous publication (18) and inthe Supporting Information. The ú-potentials of glass sub-strata were similar to those of glass beads under equivalentexperimental conditions (-51 and -56 mV at ionic strengthsof 0.02 and 0.05 M at pH of 6.72, respectively; and -10 mVat pH 2 and an ionic strength of 0.05 M) (SupportingInformation).
Impinging Jet Experimental Conditions. Colloid depositionexperiments were performed in an impinging jet system(radial stagnation point flow) for the range of microspheresizes, fluid velocities, and solution chemistry conditionsutilized in porous media experiments. To increase theaccuracy of flux determination, the experiments werecontinued until a minimum of 60 microspheres was depositedin the observation area. The duration of the experimentsranged from 10 to 60 min in the absence of an energy barrierto deposition, whereas the duration of experiments rangedfrom 3 to 9 h in the presence of an energy barrier to deposition.The corresponding numbers of deposited colloids rangedfrom 60 to 400. An example net deposition curve is given inthe Supporting Information.
Sr ) Sfr (2)
Fb
θ∂S∂t
) kfC -Fb
θkrSr (3)
kf ) 32
(1 - θ)dc
Rηv (4)
TABLE 1. Porous Media Experimental Conditions, Mass Balances, Observed Transport Parameters (via the Particle-TrackingModel), and Simulated Deposition Rate Coefficient (kf) (Using the R-T Correlation Equation)a
diameter(µm)
ionicstrength
(M) pH
averagepore water
velocity(m day-1)
massrecoveryb
%retainedc
%kf
(h-1)kr
(h-1) fr
RT kf(h-1) r
0.1 0.02 6.72 4 86.0 35.2 0.72 0.10 0.07 0.0728 101.1 2.2 0.06 0.45 0.40 0.003
0.05 2 4 101.3 101.1 10.0 0 0 26.18 91.8 91.8 20.0 0 0 32.9
0.2 0.02 6.72 4 93.1 22.2 0.26 0.15 0.3 0.03258 105.2 14.6 0.25 0.5 0.03 0.0172
0.05 2 4 105.3 105.3 8.0 0 0 16.58 88.3 88.3 14.5 0 0 20.7
0.5 0.02 6.72 4 99.9 3.6 0.063 0.2 0.4 0.00974d 105.2 34.6 0.45 0.28 0.35 0.0458 100.0 2.2 0.06 0.48 0.38 0.0086
0.05 2 2 100.02 100.01 3.7 0 0 7.214 81.5 81.5 6.5 0.1 0 9.048 98.9 97.3 7.0 0 0 11.4
2d 100.03 100.03 6.0 0 04d 80.4 80.4 10.0 0 08d 100.0 100.0 14.0 0 0
1.0 0.02 6.72 4 87.7 17.0 0.25 0.3 0.42 0.06258 100.1 7.9 0.17 0.5 0.21 0.034
0.93 0.001 6.72 2 101.1 99.6 1.9 0.03 0.05 4.934 101.8 100.7 4.0 0.1 0.01 6.038 97.6 92.9 5.0 0.1 0.01 7.55
2.0 0.05 6.72 4 93.3 59.2 0.92 0.1 0.02 0.22448 92.7 26.3 0.56 0.11 0.1 0.0862
0.05 2 2 91.7 91.5 2.5 0 0 4.654 102.4 101.2 4.1 0 0 5.278 88.0 85.9 6.5 0.05 0.01 6.21
a Conditions absent an energy barrier correspond to ionic strength 0.05 M and pH 2 for the 0.1, 0.2, 0.5, and 2.0 µm microspheres. For the 1.0µm microspheres, amine-functionalized microspheres (0.93 µm) were used to represent conditions absent an energy barrier. Deposition efficiency(R) does not apply to conditions absent an energy barrier. b Mass recovery % refers to percent recovery of injected microspheres via effluent andviadesorption followingdissection. c Retained%refers topercent recoveryof injectedmicrospheresviadesorption followingdissection. d Experimentswere conducted in quartz sand. All other porous media experiments were conducted in glass beads.
VOL. 40, NO. 24, 2006 / ENVIRONMENTAL SCIENCE & TECHNOLOGY 9 7727
Porous media and impinging jet experiments wereperformed under comparable near-surface fluid velocities.Since the porous media and impinging jet systems yielddifferent fluid velocity distributions, the fluid velocities inthe two systems were chosen to favor (slightly) colloiddeposition in the impinging jet, as described in the SupportingInformation. The fluid velocities used in the impinging jetwere 1.06 × 10⁻³, 1.70 × 10⁻³, and 2.97 × 10⁻³ m s-1. Detailedfluid velocity histograms of the impinging jet and porousmedia systems are provided in the Supporting Information.
Sample Collection and Analyses. Details on the impingingjet system and the corresponding image analysis are providedin a previous publication (18) and in the SupportingInformation. The deposition flux was determined from theslope of the initial (linear) portion of the curve representingthe number of deposited microspheres versus time. This slopewas divided by the observation area (450 µm × 336 µm) andthe influent microsphere concentration to obtain a normal-ized deposition flux (m s-1).
The transport and deposition of microspheres in theimpinging jet was simulated using a numerical model(P2DJET) (18). The numerical simulations accounted for thevarious forces acting on the colloid: Brownian diffusion, fluiddrag, gravity, virtual mass, van der Waals, and electric doublelayer forces. The details of the model are given in a previouspublication (18) and the parameters used in the simulationsexactly reflected experimental conditions.
For both porous media and impinging jet experiments,the deposition flux in the presence of an energy barrier ispresented in terms of the deposition efficiency (R), which isthe ratio of the deposition flux in the presence relative to theabsence of an energy barrier. The deposition flux is quantifiedin the porous media using the deposition rate coefficient(h-1), and in the impinging jet using the normalized deposi-tion flux (m s-1). The experimental conditions for porousmedia and impinging jet experiments are summarized inTables 1 and 2.
Results and DiscussionDeposition Flux in the Absence of an Energy Barrier toDeposition. In the absence of an energy barrier, observedand simulated deposition rate coefficients (porous media)and deposition fluxes (impinging jet) increased with increas-ing fluid velocity for all microsphere sizes (Tables 1 and 2and Figures 1 and 2). Observation and simulation agreedclosely, with the largest discrepancy being about a factor of2 for the 0.1 µm diameter microspheres.
For all fluid velocities examined, the observed minimumdeposition rate coefficient (porous media) and depositionflux (impinging jet) corresponded to the 1.0 µm diametercolloids. The simulated minimum corresponded to the 2.0µm diameter colloids in the porous media, whereas thesimulated minimum corresponded to the 1.0 µm diametercolloids in the impinging jet. However, this discrepancy isminor since the observed and simulated values were similarfor the 1.0 and 2.0 µm diameter colloids in both systems.These results show that in the absence of an energy barrier,
TABLE 2. Impinging Jet Experimental Conditions, ObservedDeposition Fluxes, and Simulated Deposition Fluxesa
diam.(µm)
ionicstrength
(M) pH
jetvelocity(m s-1)
experimentaldeposition
flux(m s-1)
simulateddeposition
flux(m s-1) r
0.1 0.02 6.72 1.70 × 10⁻³ 1.81 × 10⁻⁹ 0 0.001622.97 × 10-3 0 0 0
0.05 2 1.70 × 10⁻³ 1.12 × 10⁻⁶ 4.50 × 10⁻⁷
2.97 × 10⁻³ 1.34 × 10⁻⁶ 5.19 × 10⁻⁷
0.2 0.02 6.72 1.70 × 10⁻³ 2.14 × 10⁻⁹ 0 0.003722.97 × 10-3 0 0 0
0.05 2 1.06×10⁻³ 4.08 × 10⁻⁷ 1.20 × 10⁻⁷
1.70 × 10⁻³ 5.75 × 10⁻⁷ 2.26 × 10⁻⁷
2.97 × 10⁻³ 7.05 × 10⁻⁷ 3.33 × 10⁻⁷
0.5 0.02 6.72 1.70 × 10⁻³ 7.65 × 10⁻¹⁰ 0 0.002272.97 × 10-3 0 0 0
0.05 2 1.06 × 10⁻³ 1.86 × 10⁻⁷ 9.83 × 10⁻⁸
1.70 × 10⁻³ 3.37 × 10⁻⁷ 1.54 × 10⁻⁷
2.97 × 10⁻³ 4.96 × 10⁻⁷ 1.63 × 10⁻⁷
1.0 0.02 6.72 1.70 × 10⁻³ 3.08 × 10⁻⁹ 0 0.01382.97 × 10-3 0 0 0
0.93 0.001 6.72 1.06 × 10⁻³ 1.41 × 10⁻⁷ 8.59 × 10⁻⁸
1.70 × 10⁻³ 2.23 × 10⁻⁷ 9.38 × 10⁻⁸
2.97 × 10⁻³ 2.68 × 10⁻⁷ 9.60 × 10⁻⁸
2.0 0.05 6.72 1.70 × 10⁻³ 3.15 × 10⁻⁹ 0 0.01372.97 × 10-3 0 0 0
0.05 2 1.06 × 10⁻³ 1.63 × 10⁻⁷ 7.85 × 10⁻⁸
1.70 × 10⁻³ 2.29 × 10⁻⁷ 1.08 × 10⁻⁷
2.97 × 10⁻³ 2.69 × 10⁻⁷ 1.32 × 10⁻⁷
a All impinging jet experiments were conducted on glass substrata.Conditions absent an energy barrier correspond to ionic strength 0.05M and pH 2 for the 0.1, 0.2, 0.5, and 2.0 µm microspheres. For the 1.0µm microspheres, amine-functionalized microspheres (0.93 µm) wereused to represent conditions absent an energy barrier. Depositionefficiency (R) does not apply to conditions absent an energy barrier.
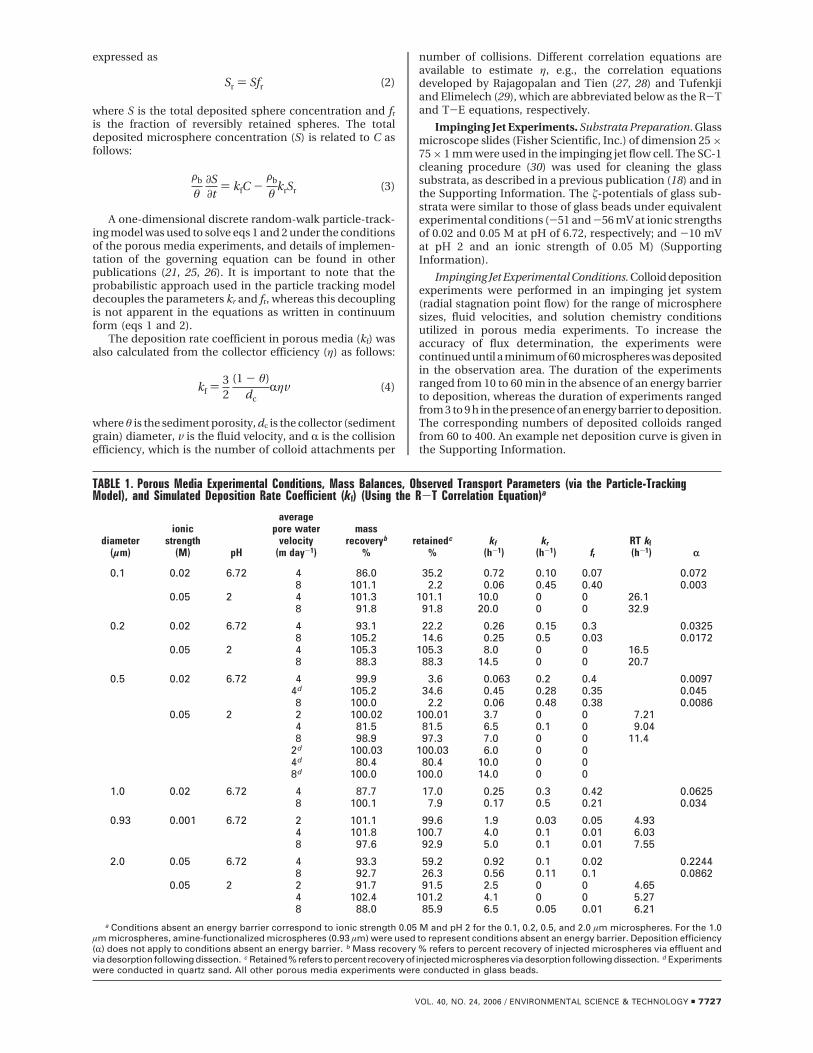
FIGURE 1. Simulated (open symbols) and observed (closed symbols)deposition rate coefficients (kf) in the absence of an energy barrierto deposition for all five microspheres sizes as a function of fluidvelocity in glass beads. Simulated deposition rate coefficients werecalculated using the R-T correlation equation. Observed depositionrate coefficients (connected by dashed lines) were slightly lowerthan corresponding simulated deposition rate coefficients.
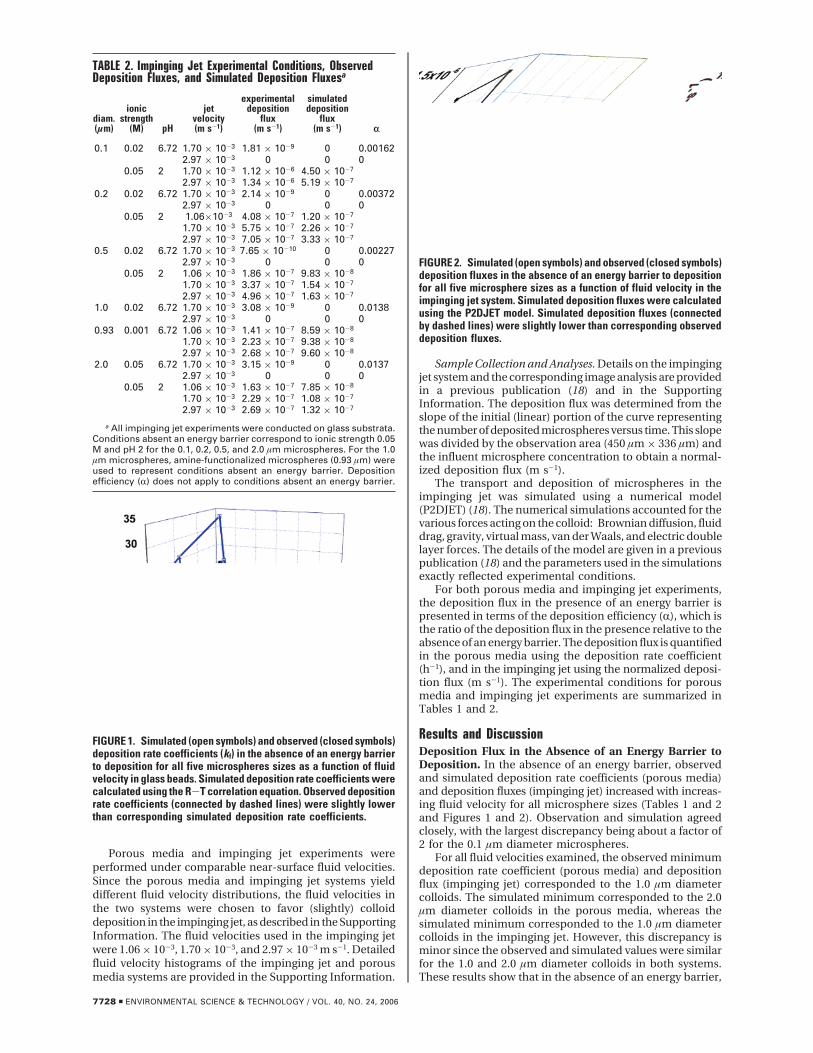
FIGURE 2. Simulated (open symbols) and observed (closed symbols)deposition fluxes in the absence of an energy barrier to depositionfor all five microsphere sizes as a function of fluid velocity in theimpinging jet system. Simulated deposition fluxes were calculatedusing the P2DJET model. Simulated deposition fluxes (connectedby dashed lines) were slightly lower than corresponding observeddeposition fluxes.
7728 9 ENVIRONMENTAL SCIENCE & TECHNOLOGY / VOL. 40, NO. 24, 2006
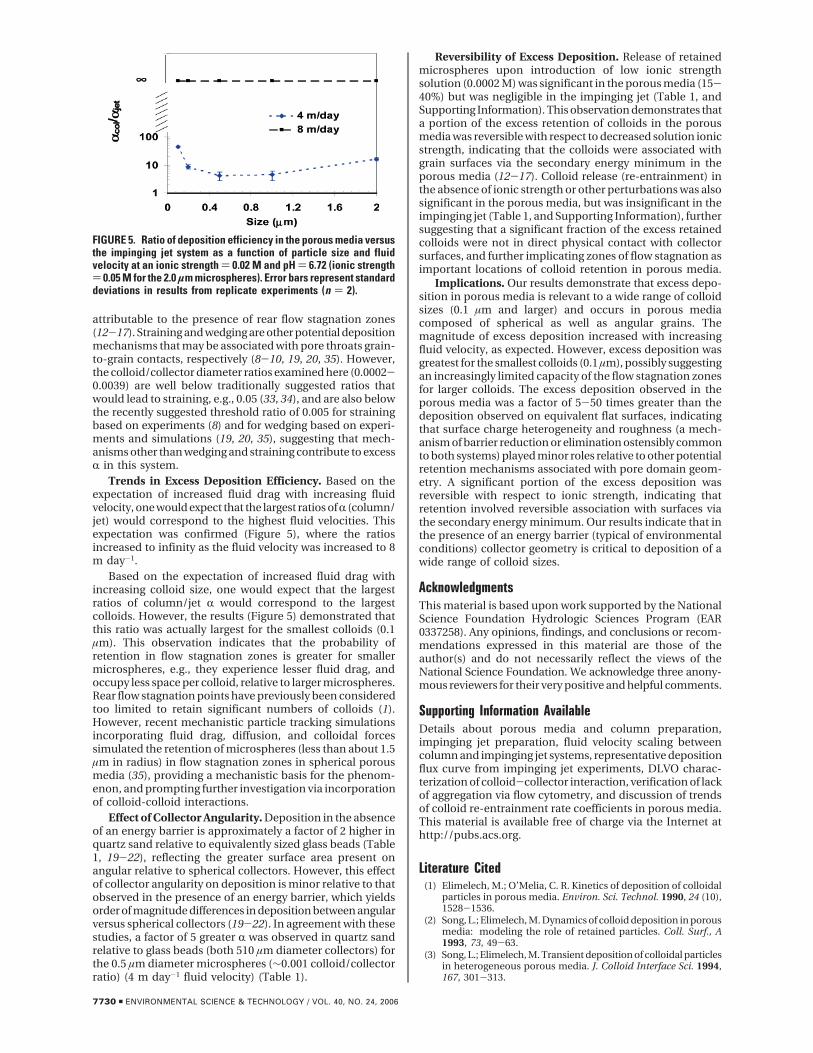
deposition fluxes increase with increasing fluid velocity aspredicted by theory, and minimum deposition fluxes cor-respond to colloid sizes in the range between 1.0 and 2.0 µm.
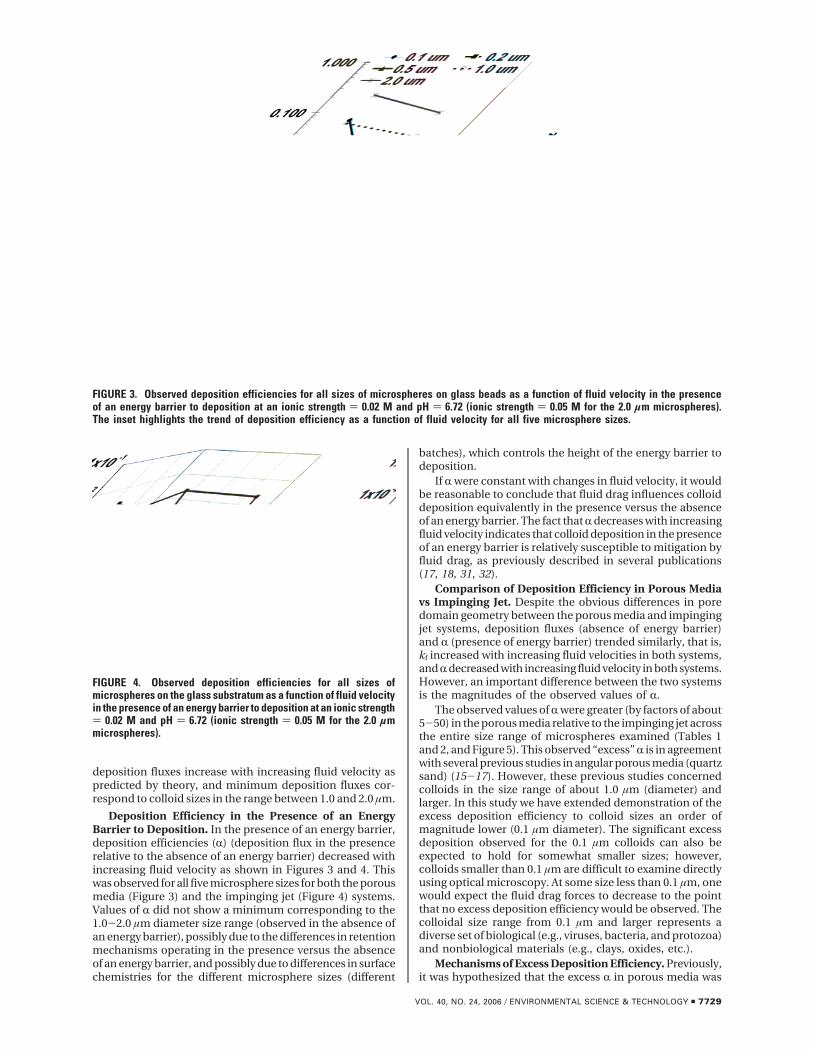
Deposition Efficiency in the Presence of an EnergyBarrier to Deposition. In the presence of an energy barrier,deposition efficiencies (R) (deposition flux in the presencerelative to the absence of an energy barrier) decreased withincreasing fluid velocity as shown in Figures 3 and 4. Thiswas observed for all five microsphere sizes for both the porousmedia (Figure 3) and the impinging jet (Figure 4) systems.Values of R did not show a minimum corresponding to the1.0-2.0 µm diameter size range (observed in the absence ofan energy barrier), possibly due to the differences in retentionmechanisms operating in the presence versus the absenceof an energy barrier, and possibly due to differences in surfacechemistries for the different microsphere sizes (different
batches), which controls the height of the energy barrier todeposition.
If R were constant with changes in fluid velocity, it wouldbe reasonable to conclude that fluid drag influences colloiddeposition equivalently in the presence versus the absenceof an energy barrier. The fact that R decreases with increasingfluid velocity indicates that colloid deposition in the presenceof an energy barrier is relatively susceptible to mitigation byfluid drag, as previously described in several publications(17, 18, 31, 32).
Comparison of Deposition Efficiency in Porous Mediavs Impinging Jet. Despite the obvious differences in poredomain geometry between the porous media and impingingjet systems, deposition fluxes (absence of energy barrier)and R (presence of energy barrier) trended similarly, that is,kf increased with increasing fluid velocities in both systems,and R decreased with increasing fluid velocity in both systems.However, an important difference between the two systemsis the magnitudes of the observed values of R.
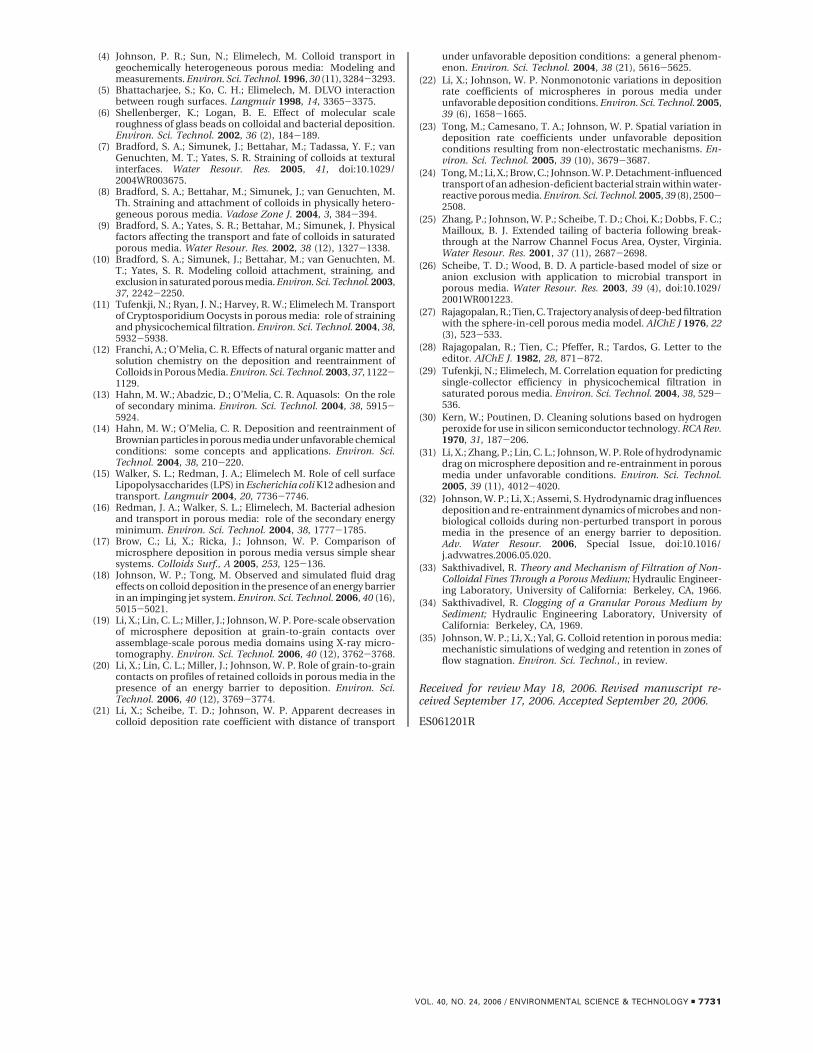
The observed values of R were greater (by factors of about5-50) in the porous media relative to the impinging jet acrossthe entire size range of microspheres examined (Tables 1and 2, and Figure 5). This observed “excess” R is in agreementwith several previous studies in angular porous media (quartzsand) (15-17). However, these previous studies concernedcolloids in the size range of about 1.0 µm (diameter) andlarger. In this study we have extended demonstration of theexcess deposition efficiency to colloid sizes an order ofmagnitude lower (0.1 µm diameter). The significant excessdeposition observed for the 0.1 µm colloids can also beexpected to hold for somewhat smaller sizes; however,colloids smaller than 0.1 µm are difficult to examine directlyusing optical microscopy. At some size less than 0.1 µm, onewould expect the fluid drag forces to decrease to the pointthat no excess deposition efficiency would be observed. Thecolloidal size range from 0.1 µm and larger represents adiverse set of biological (e.g., viruses, bacteria, and protozoa)and nonbiological materials (e.g., clays, oxides, etc.).
Mechanisms of Excess Deposition Efficiency. Previously,it was hypothesized that the excess R in porous media was
FIGURE 3. Observed deposition efficiencies for all sizes of microspheres on glass beads as a function of fluid velocity in the presenceof an energy barrier to deposition at an ionic strength ) 0.02 M and pH ) 6.72 (ionic strength ) 0.05 M for the 2.0 µm microspheres).The inset highlights the trend of deposition efficiency as a function of fluid velocity for all five microsphere sizes.
FIGURE 4. Observed deposition efficiencies for all sizes ofmicrospheres on the glass substratum as a function of fluid velocityin the presence of an energy barrier to deposition at an ionic strength) 0.02 M and pH ) 6.72 (ionic strength ) 0.05 M for the 2.0 µmmicrospheres).
VOL. 40, NO. 24, 2006 / ENVIRONMENTAL SCIENCE & TECHNOLOGY 9 7729
attributable to the presence of rear flow stagnation zones(12-17). Straining and wedging are other potential depositionmechanisms that may be associated with pore throats grain-to-grain contacts, respectively (8-10, 19, 20, 35). However,the colloid/collector diameter ratios examined here (0.0002-0.0039) are well below traditionally suggested ratios thatwould lead to straining, e.g., 0.05 (33, 34), and are also belowthe recently suggested threshold ratio of 0.005 for strainingbased on experiments (8) and for wedging based on experi-ments and simulations (19, 20, 35), suggesting that mech-anisms other than wedging and straining contribute to excessR in this system.
Trends in Excess Deposition Efficiency. Based on theexpectation of increased fluid drag with increasing fluidvelocity, one would expect that the largest ratios of R (column/jet) would correspond to the highest fluid velocities. Thisexpectation was confirmed (Figure 5), where the ratiosincreased to infinity as the fluid velocity was increased to 8m day-1.
Based on the expectation of increased fluid drag withincreasing colloid size, one would expect that the largestratios of column/jet R would correspond to the largestcolloids. However, the results (Figure 5) demonstrated thatthis ratio was actually largest for the smallest colloids (0.1µm). This observation indicates that the probability ofretention in flow stagnation zones is greater for smallermicrospheres, e.g., they experience lesser fluid drag, andoccupy less space per colloid, relative to larger microspheres.Rear flow stagnation points have previously been consideredtoo limited to retain significant numbers of colloids (1).However, recent mechanistic particle tracking simulationsincorporating fluid drag, diffusion, and colloidal forcessimulated the retention of microspheres (less than about 1.5µm in radius) in flow stagnation zones in spherical porousmedia (35), providing a mechanistic basis for the phenom-enon, and prompting further investigation via incorporationof colloid-colloid interactions.
Effect of Collector Angularity. Deposition in the absenceof an energy barrier is approximately a factor of 2 higher inquartz sand relative to equivalently sized glass beads (Table1, 19-22), reflecting the greater surface area present onangular relative to spherical collectors. However, this effectof collector angularity on deposition is minor relative to thatobserved in the presence of an energy barrier, which yieldsorder of magnitude differences in deposition between angularversus spherical collectors (19-22). In agreement with thesestudies, a factor of 5 greater R was observed in quartz sandrelative to glass beads (both 510 µm diameter collectors) forthe 0.5 µm diameter microspheres (∼0.001 colloid/collectorratio) (4 m day-1 fluid velocity) (Table 1).
Reversibility of Excess Deposition. Release of retainedmicrospheres upon introduction of low ionic strengthsolution (0.0002 M) was significant in the porous media (15-40%) but was negligible in the impinging jet (Table 1, andSupporting Information). This observation demonstrates thata portion of the excess retention of colloids in the porousmedia was reversible with respect to decreased solution ionicstrength, indicating that the colloids were associated withgrain surfaces via the secondary energy minimum in theporous media (12-17). Colloid release (re-entrainment) inthe absence of ionic strength or other perturbations was alsosignificant in the porous media, but was insignificant in theimpinging jet (Table 1, and Supporting Information), furthersuggesting that a significant fraction of the excess retainedcolloids were not in direct physical contact with collectorsurfaces, and further implicating zones of flow stagnation asimportant locations of colloid retention in porous media.
Implications. Our results demonstrate that excess depo-sition in porous media is relevant to a wide range of colloidsizes (0.1 µm and larger) and occurs in porous mediacomposed of spherical as well as angular grains. Themagnitude of excess deposition increased with increasingfluid velocity, as expected. However, excess deposition wasgreatest for the smallest colloids (0.1 µm), possibly suggestingan increasingly limited capacity of the flow stagnation zonesfor larger colloids. The excess deposition observed in theporous media was a factor of 5-50 times greater than thedeposition observed on equivalent flat surfaces, indicatingthat surface charge heterogeneity and roughness (a mech-anism of barrier reduction or elimination ostensibly commonto both systems) played minor roles relative to other potentialretention mechanisms associated with pore domain geom-etry. A significant portion of the excess deposition wasreversible with respect to ionic strength, indicating thatretention involved reversible association with surfaces viathe secondary energy minimum. Our results indicate that inthe presence of an energy barrier (typical of environmentalconditions) collector geometry is critical to deposition of awide range of colloid sizes.
AcknowledgmentsThis material is based upon work supported by the NationalScience Foundation Hydrologic Sciences Program (EAR0337258). Any opinions, findings, and conclusions or recom-mendations expressed in this material are those of theauthor(s) and do not necessarily reflect the views of theNational Science Foundation. We acknowledge three anony-mous reviewers for their very positive and helpful comments.
Supporting Information AvailableDetails about porous media and column preparation,impinging jet preparation, fluid velocity scaling betweencolumn and impinging jet systems, representative depositionflux curve from impinging jet experiments, DLVO charac-terization of colloid-collector interaction, verification of lackof aggregation via flow cytometry, and discussion of trendsof colloid re-entrainment rate coefficients in porous media.This material is available free of charge via the Internet athttp://pubs.acs.org.
Literature Cited(1) Elimelech, M.; O’Melia, C. R. Kinetics of deposition of colloidal
particles in porous media. Environ. Sci. Technol. 1990, 24 (10),1528-1536.
(2) Song, L.; Elimelech, M. Dynamics of colloid deposition in porousmedia: modeling the role of retained particles. Coll. Surf., A1993, 73, 49-63.
(3) Song, L.; Elimelech, M. Transient deposition of colloidal particlesin heterogeneous porous media. J. Colloid Interface Sci. 1994,167, 301-313.
FIGURE 5. Ratio of deposition efficiency in the porous media versusthe impinging jet system as a function of particle size and fluidvelocity at an ionic strength ) 0.02 M and pH ) 6.72 (ionic strength) 0.05 M for the 2.0 µm microspheres). Error bars represent standarddeviations in results from replicate experiments (n ) 2).
7730 9 ENVIRONMENTAL SCIENCE & TECHNOLOGY / VOL. 40, NO. 24, 2006
(4) Johnson, P. R.; Sun, N.; Elimelech, M. Colloid transport ingeochemically heterogeneous porous media: Modeling andmeasurements. Environ. Sci. Technol. 1996, 30 (11), 3284-3293.
(5) Bhattacharjee, S.; Ko, C. H.; Elimelech, M. DLVO interactionbetween rough surfaces. Langmuir 1998, 14, 3365-3375.
(6) Shellenberger, K.; Logan, B. E. Effect of molecular scaleroughness of glass beads on colloidal and bacterial deposition.Environ. Sci. Technol. 2002, 36 (2), 184-189.
(7) Bradford, S. A.; Simunek, J.; Bettahar, M.; Tadassa, Y. F.; vanGenuchten, M. T.; Yates, S. R. Straining of colloids at texturalinterfaces. Water Resour. Res. 2005, 41, doi:10.1029/2004WR003675.
(8) Bradford, S. A.; Bettahar, M.; Simunek, J.; van Genuchten, M.Th. Straining and attachment of colloids in physically hetero-geneous porous media. Vadose Zone J. 2004, 3, 384-394.
(9) Bradford, S. A.; Yates, S. R.; Bettahar, M.; Simunek, J. Physicalfactors affecting the transport and fate of colloids in saturatedporous media. Water Resour. Res. 2002, 38 (12), 1327-1338.
(10) Bradford, S. A.; Simunek, J.; Bettahar, M.; van Genuchten, M.T.; Yates, S. R. Modeling colloid attachment, straining, andexclusion in saturated porous media. Environ. Sci. Technol. 2003,37, 2242-2250.
(11) Tufenkji, N.; Ryan, J. N.; Harvey, R. W.; Elimelech M. Transportof Cryptosporidium Oocysts in porous media: role of strainingand physicochemical filtration. Environ. Sci. Technol. 2004, 38,5932-5938.
(12) Franchi, A.; O’Melia, C. R. Effects of natural organic matter andsolution chemistry on the deposition and reentrainment ofColloids in Porous Media. Environ. Sci. Technol. 2003, 37, 1122-1129.
(13) Hahn, M. W.; Abadzic, D.; O’Melia, C. R. Aquasols: On the roleof secondary minima. Environ. Sci. Technol. 2004, 38, 5915-5924.
(14) Hahn, M. W.; O’Melia, C. R. Deposition and reentrainment ofBrownian particles in porous media under unfavorable chemicalconditions: some concepts and applications. Environ. Sci.Technol. 2004, 38, 210-220.
(15) Walker, S. L.; Redman, J. A.; Elimelech M. Role of cell surfaceLipopolysaccharides (LPS) in Escherichia coli K12 adhesion andtransport. Langmuir 2004, 20, 7736-7746.
(16) Redman, J. A.; Walker, S. L.; Elimelech, M. Bacterial adhesionand transport in porous media: role of the secondary energyminimum. Environ. Sci. Technol. 2004, 38, 1777-1785.
(17) Brow, C.; Li, X.; Ricka, J.; Johnson, W. P. Comparison ofmicrosphere deposition in porous media versus simple shearsystems. Colloids Surf., A 2005, 253, 125-136.
(18) Johnson, W. P.; Tong, M. Observed and simulated fluid drageffects on colloid deposition in the presence of an energy barrierin an impinging jet system. Environ. Sci. Technol. 2006, 40 (16),5015-5021.
(19) Li, X.; Lin, C. L.; Miller, J.; Johnson, W. P. Pore-scale observationof microsphere deposition at grain-to-grain contacts overassemblage-scale porous media domains using X-ray micro-tomography. Environ. Sci. Technol. 2006, 40 (12), 3762-3768.
(20) Li, X.; Lin, C. L.; Miller, J.; Johnson, W. P. Role of grain-to-graincontacts on profiles of retained colloids in porous media in thepresence of an energy barrier to deposition. Environ. Sci.Technol. 2006, 40 (12), 3769-3774.
(21) Li, X.; Scheibe, T. D.; Johnson, W. P. Apparent decreases incolloid deposition rate coefficient with distance of transport
under unfavorable deposition conditions: a general phenom-enon. Environ. Sci. Technol. 2004, 38 (21), 5616-5625.
(22) Li, X.; Johnson, W. P. Nonmonotonic variations in depositionrate coefficients of microspheres in porous media underunfavorable deposition conditions. Environ. Sci. Technol. 2005,39 (6), 1658-1665.
(23) Tong, M.; Camesano, T. A.; Johnson, W. P. Spatial variation indeposition rate coefficients under unfavorable depositionconditions resulting from non-electrostatic mechanisms. En-viron. Sci. Technol. 2005, 39 (10), 3679-3687.
(24) Tong, M.; Li, X.; Brow, C.; Johnson. W. P. Detachment-influencedtransport of an adhesion-deficient bacterial strain within water-reactive porous media. Environ. Sci. Technol. 2005, 39 (8), 2500-2508.
(25) Zhang, P.; Johnson, W. P.; Scheibe, T. D.; Choi, K.; Dobbs, F. C.;Mailloux, B. J. Extended tailing of bacteria following break-through at the Narrow Channel Focus Area, Oyster, Virginia.Water Resour. Res. 2001, 37 (11), 2687-2698.
(26) Scheibe, T. D.; Wood, B. D. A particle-based model of size oranion exclusion with application to microbial transport inporous media. Water Resour. Res. 2003, 39 (4), doi:10.1029/2001WR001223.
(27) Rajagopalan, R.; Tien, C. Trajectory analysis of deep-bed filtrationwith the sphere-in-cell porous media model. AIChE J 1976, 22(3), 523-533.
(28) Rajagopalan, R.; Tien, C.; Pfeffer, R.; Tardos, G. Letter to theeditor. AIChE J. 1982, 28, 871-872.
(29) Tufenkji, N.; Elimelech, M. Correlation equation for predictingsingle-collector efficiency in physicochemical filtration insaturated porous media. Environ. Sci. Technol. 2004, 38, 529-536.
(30) Kern, W.; Poutinen, D. Cleaning solutions based on hydrogenperoxide for use in silicon semiconductor technology. RCA Rev.1970, 31, 187-206.
(31) Li, X.; Zhang, P.; Lin, C. L.; Johnson, W. P. Role of hydrodynamicdrag on microsphere deposition and re-entrainment in porousmedia under unfavorable conditions. Environ. Sci. Technol.2005, 39 (11), 4012-4020.
(32) Johnson, W. P.; Li, X.; Assemi, S. Hydrodynamic drag influencesdeposition and re-entrainment dynamics of microbes and non-biological colloids during non-perturbed transport in porousmedia in the presence of an energy barrier to deposition.Adv. Water Resour. 2006, Special Issue, doi:10.1016/j.advwatres.2006.05.020.
(33) Sakthivadivel, R. Theory and Mechanism of Filtration of Non-Colloidal Fines Through a Porous Medium; Hydraulic Engineer-ing Laboratory, University of California: Berkeley, CA, 1966.
(34) Sakthivadivel, R. Clogging of a Granular Porous Medium bySediment; Hydraulic Engineering Laboratory, University ofCalifornia: Berkeley, CA, 1969.
(35) Johnson, W. P.; Li, X.; Yal, G. Colloid retention in porous media:mechanistic simulations of wedging and retention in zones offlow stagnation. Environ. Sci. Technol., in review.
Received for review May 18, 2006. Revised manuscript re-ceived September 17, 2006. Accepted September 20, 2006.
ES061201R
VOL. 40, NO. 24, 2006 / ENVIRONMENTAL SCIENCE & TECHNOLOGY 9 7731