excel 2003 vba programming with xml and asp -...
TRANSCRIPT

Excel 2003 VBA Programming with XML and ASPby Julitta Korol
Wordware Publishing, Inc.. (c) 2006. Copying Prohibited.
Reprinted for Jagadish Kolanu, Capgemini US [email protected]
Reprinted with permission as a subscription benefit of Books24x7,http://www.books24x7.com/
All rights reserved. Reproduction and/or distribution in whole or in part inelectronic,paper or other forms without written permission is prohibited.

Table of Contents Chapter 18: Programming PivotTables and PivotCharts.............................................................1
Overview................................................................................................................................1Creating a PivotTable Report.................................................................................................1Removing PivotTable Detail Worksheets with VBA...............................................................7Creating a PivotTable Report Programmatically....................................................................9Creating a PivotTable Report from an Access Database....................................................12
Using the CreatePivotTable Method of the PivotCache Object.....................................14Formatting, Grouping, and Sorting a PivotTable Report......................................................17Hiding Items in a PivotTable................................................................................................19Adding Calculated Fields and Items to a PivotTable...........................................................20Creating a PivotChart Report Using VBA............................................................................26Saving a PivotTable Report or PivotChart Report as a Web Page......................................29Chapter Summary................................................................................................................33
i

Chapter 18: Programming PivotTables andPivotCharts
Overview
Introduced in Excel 5, the PivotTable Wizard continues to serve millions of Microsoft Officeapplications users as a powerful tool for organizing and presenting information from varioussources. If you are not familiar with this feature, now is the time to get your feet wet. UsingPivotTables and PivotCharts, you can analyze your data from multiple perspectives. PivotTablesmake it possible to drag headings around a table to rearrange them so that your data is displayeddynamically any way you (or your users) want it. Similar to PivotReports, PivotCharts are interactiveand allow you to view data in different ways by changing the position or detail of the PivotChartfields. Both PivotReports and PivotCharts allow you to focus on understanding your data rather thanon organizing it.
Creating a PivotTable ReportBefore you can create a PivotTable, you need to prepare the data. You can get the data from oneof the following sources:
A range on an Excel worksheet (you can type in your data or paste it from other sources)•
External data source (you can connect to a Microsoft Access file or an SQL Server databaseand get data directly)
•
Multiple consolidation ranges•
Another PivotTable or PivotChart report•
Figure 18−1 displays the data that was dumped into a Microsoft Excel worksheet from an SQLServer database. The downloadable workbook file is named EquipmentList.xls. This file containsapproximately 1,500 rows of data that would be difficult to summarize if it weren't for the built−inExcel PivotTable feature.
Reprinted for Q4OGY152857, Capgemini US LLC Wordware Publishing Inc., Wordware Publishing, Inc. (c) 2006, Copying Prohibited

Figure 18−1: Source data for the PivotTable.Let's start our encounter with PivotTables by using the built−in PivotTable Wizard.
Try It Out
Open the EquipmentList.xls file shown in Figure 18−1.1.
Select any cell anywhere in the data range. For example, select cell A2 in the Source Dataworksheet.
2.
Choose Data | PivotTable and PivotChart Report.
The Pivot Table Wizard – Step 1 of 3 dialog box appears as shown in Figure 18−2.
Figure 18−2: PivotTable and PivotChart Wizard – Step 1 of 3.
3.
Excel 2003 VBA Programming with XML and ASP 2
Reprinted for Q4OGY152857, Capgemini US LLC Wordware Publishing Inc., Wordware Publishing, Inc. (c) 2006, Copying Prohibited

Choose Microsoft Office Excel list or database as the source of your data and click theNext button.
The PivotTable Wizard – Step 2 of 3 dialog box appears as shown in Figure 18−3.
Figure 18−3: PivotTable and PivotChart Wizard – Step 2 of 3.
Ensure that the range displayed in the Range field incorporates all the data on which youwant to report. The range will appear automatically if the active cell is within the data range.If the currently selected cell is outside of the data range, you will need to make your ownselection.
4.
Click the Next button to proceed to Step 3 of 3 in the PivotTable and PivotChart Wizard.
Figure 18−4: PivotTable and PivotChart Wizard – Step 3 of 3.
Here you can indicate where you would like to place your PivotTable report. If you press theFinish button at this time, you will see a new worksheet with an empty PivotTable and a listof fields (columns in your source data), which you can drag to the indicated PivotReportlayout. If, however, you press the Layout button, you will see a PivotTable Layout dialog, asshown in Figure 18−5, that explains how to place required fields in the pivot diagram.
5.
Excel 2003 VBA Programming with XML and ASP 3
Reprinted for Q4OGY152857, Capgemini US LLC Wordware Publishing Inc., Wordware Publishing, Inc. (c) 2006, Copying Prohibited

Figure 18−5: PivotTable and PivotChart Wizard – Layout dialog box.
In the PivotTable and PivotChart Wizard – Step 3 of 3 dialog, box select the New worksheetoption button and click the Layout button.
Excel will present you with the dialog box shown in Figure 18−5.
A PivotTable report has four areas where you can place fields listed on the right−hand sideof the dialog box:
The Row area should contain the fields that you want to display your data "by." Forexample, if you want to produce the report by vendor, drag the Vendor field onto theRow area. The Row area can contain more than one field. In this example report, asshown in Figure 18−6, we also want to see the report by equipment type, so theEquipment Type field is placed in the Row area as well. If you position the EquipmentType field below the Vendor field in the Row area, the data will be grouped first byvendor and then by equipment type within those vendors.
♦
6.
Excel 2003 VBA Programming with XML and ASP 4
Reprinted for Q4OGY152857, Capgemini US LLC Wordware Publishing Inc., Wordware Publishing, Inc. (c) 2006, Copying Prohibited

Figure 18−6: Organizing data in the PivotTable and PivotChart Wizard – Layoutdialog box.
The Column area should contain fields that answer the question "what." Forexample, What type of information do you want to display for each of the fields in theRow area? Our example PivotTable will report on the warranty type. Because wewant to see all types of warranties for each vendor and equipment type, we will placethe Warranty Type field in the Column area. However, if you want to view your datafrom a different perspective, you can place the fields from the Row area in theColumn area and vice versa. It is up to you.
♦
The Data area displays the data that you want to analyze. In our example, we wantto find out the total number of units (equipment type) covered by each of the warrantytypes. The Data area must contain a field that has numeric data. Once we place thefield containing numeric data in the Data area, we can choose what calculation (sum,count, average, and so on) we want to perform on the data.
♦
The Page area is optional. Page fields add a third dimension to your data analysis.For example, if you want to look at the total units under each warranty type for aparticular equipment ID, you would place EquipmentId in the Page area. This wouldallow you to drill down your PivotTable by the equipment ID or show the data for allthe equipment.
Later on in this chapter, when you generate a PivotTable programmatically, you willadd a field to the Page area and be able to experiment with the data.
♦
Note that you do not have to place all the fields from your data source in the PivotTable.Place only those fields that you need; you can easily add other fields at any time viaPivotTable toolbar buttons or a shortcut menu.
Position the fields as shown in Figure 18−6 and click OK.
Excel returns you to the PivotTable and PivotChart Wizard – Step 3 of 3 dialog.
7.
Excel 2003 VBA Programming with XML and ASP 5
Reprinted for Q4OGY152857, Capgemini US LLC Wordware Publishing Inc., Wordware Publishing, Inc. (c) 2006, Copying Prohibited

Press the Finish button in the PivotTable and PivotChart Wizard – Step 3 of 3 dialog box.
Excel adds a new worksheet to the current workbook and draws a PivotTable report asshown in Figure 18−7. While the PivotTable is selected, the PivotTable Field List box andthe PivotTable toolbar are visible, so that you can easily modify the PivotTable by adding orremoving fields. You can temporarily remove the PivotTable Field List box by clickingoutside the PivotTable selection. For example, click any cell in row 1 or 2 to see the FieldList disappear. Click again anywhere in the area containing the pivot data and the Field Listreappears.
Figure 18−7: PivotTable report.
PivotTables are for data analysis and presentation only. This means that you are notpermitted to enter data directly into a PivotTable. To make any changes or additions to thedata, you must do this in the underlying source data and then use the Refresh button on thePivotTable toolbar or the Refresh Data option on the Data menu to update the PivotTable.
8.
To see new versions of the same information, drag PivotTable headings to new positions.Figure 18−8 presents a different view of the same data.
Figure 18−8: PivotTable report – another view of the source data.
You can examine the contributing data by double−clicking a cell containing a total.
9.
Excel 2003 VBA Programming with XML and ASP 6
Reprinted for Q4OGY152857, Capgemini US LLC Wordware Publishing Inc., Wordware Publishing, Inc. (c) 2006, Copying Prohibited

Double−click any cell that displays total units. For example, double−click J8 or E12 (seeFigure 18−8).
Excel will add a new worksheet to the active workbook showing all the records thatcontributed to the selected total value (Figure 18−9).
Figure 18−9: You can obtain details of any summary figure by double−clicking on a datafield in the PivotTable.
10.
Drilling down on the data is a nice feature except for the fact that if you do a lot of double−clickingyou will end up with many additional and most likely unwanted worksheets in your workbook. Youmay want to delete the drill− down worksheet after examining the detail data. You can do thismanually, or you can perform the cleanup programmatically by writing VBA event procedures asdescribed in the next section.
Removing PivotTable Detail Worksheets with VBAIn the previous try it out, Excel added to the Equipmentlist.xls workbook a new worksheet displayingthe detailed data that contributed to the selected total (see step 10). The following exampledemonstrates two event procedures that allow you to determine whether you want to keep thedetailed worksheet or you'd rather delete it automatically after you've examined the data. Thisexercise requires completion of the previous steps.
Try It Out
In the EquipmentList.xls workbook, rename Sheet4 to PivotTable.1.
Press Alt+F11 to switch to the Visual Basic Editor screen.2.
In the Project Explorer window, double−click the ThisWorkbook object in the MicrosoftExcel object folder under VBAProject (EquipmentList.xls).
3.
In the EquipmentList.xls – ThisWorkbook (Code) window, enter the global variabledeclaration and two event procedures as shown below:' Global variablesDim flag As Boolean ' Boolean variable to indicate whether ' to delete a drill−down worksheet
4.
Excel 2003 VBA Programming with XML and ASP 7
Reprinted for Q4OGY152857, Capgemini US LLC Wordware Publishing Inc., Wordware Publishing, Inc. (c) 2006, Copying Prohibited

Dim strPivSheet As String ' String to hold the name of the sheet ' containing the PivotTableDim strDrillSheet As String ' String to hold the name of the drill−down ' sheetDim strPivSource As String ' String to hold the name of the worksheet ' with the PivotTable source data
Private Sub Workbook_SheetActivate(ByVal Sh As Object) If strPivSheet = "" Then Exit Sub If Sh.Name <> strPivSheet Then If InStr(1, strPivSource, Sh.Name) = 0 Then If MsgBox("Do you want to Delete " & Sh.Name & _ " from the workbook" & vbCrLf _ & "upon returning to PivotTable?", _ vbYesNo + vbQuestion, _ "Sheet: Delete or Keep") = vbYes Then flag = True strDrillSheet = Sh.Name Else flag = False Exit Sub End If End If End If If ActiveSheet.Name = strPivSheet And flag = True Then Application.DisplayAlerts = False Worksheets(strDrillSheet).Delete Application.DisplayAlerts = True flag = False End IfEnd Sub
Private Sub Workbook_SheetBeforeDoubleClick(ByVal Sh As Object, _ ByVal Target As Range, Cancel As Boolean) With ActiveSheet If .PivotTables.Count > 0 Then strPivSource = ActiveSheet.PivotTables(1).SourceData If ActiveCell.PivotField.Name <> "" And IsEmpty(Target) Then MsgBox "There is no data in the selected cell − cannot _ drill down" Cancel = True Exit Sub End If strPivSheet = ActiveSheet.Name End If End WithEnd Sub
The first event procedure above (Workbook_SheetActivate) will ask the user whether thedrill−down worksheet should be deleted when the user returns to the worksheet containingthe PivotTable. If the user answers "Yes" in the message box, the Boolean variable flag willbe set to True. Because by default Excel displays a confirmation message whenever theworksheet is about to be deleted, the procedure code turns off the application messages sothat deletion can be performed without further user intervention. After the deletion, don'tforget to turn the alerts back on.
The second event procedure (Workbook_SheetBeforeDoubleClick) will disable thedrill−down if the user clicks on a PivotTable cell that is empty. If the double−clicked cell isnot empty, the name of the worksheet containing the PivotTable will be written to the globalvariable strPivSheet. Also, because we do not want to delete the worksheet containing thePivotTable source data, we will use the SourceData property of the PivotTables collection tostore the name of the Source data worksheet and the underlying data range in the globalvariable strPivSource.
To find out exactly how these two event procedures work together, use some of thedebugging skills that you acquired in Chapter 16.
Excel 2003 VBA Programming with XML and ASP 8
Reprinted for Q4OGY152857, Capgemini US LLC Wordware Publishing Inc., Wordware Publishing, Inc. (c) 2006, Copying Prohibited

Double−click cell C8 on the PivotTable worksheet.
Excel will execute the code inside the Workbook_SheetBeforeDouble− Click eventprocedure and proceed to execute the code inside the Workbook_SheetActivate procedure.Because cell C8 is not empty, Excel will ask you whether you want to delete the drill−downworksheet upon returning to the PivotTable worksheet.
5.
Click the Yes button in the message box.
Nothing happens at this point. Excel simply has set the flag to delete this drill−downworksheet when you are done viewing it.
6.
Click the PivotTable worksheet tab.
At this point, Excel deletes the drill−down worksheet and activates the PivotTable worksheet.
7.
Click cell C7 in the PivotTable worksheet.
Excel displays the message that the drill−down is not allowed because there is no data inthis cell. Recall that this message was coded inside the Workbook_SheetBeforeDoubleClickevent procedure.
8.
Save the EquipmentList.xls workbook and close it.9.
Creating a PivotTable Report ProgrammaticallyAlthough the PivotWizard utility has undergone many improvements to make it easy to use, someusers still find the process of creating PivotTable reports confusing. For those users, you may wantto generate PivotTables via VBA code. Also with VBA, you can make many formatting changes tothe existing PivotTables. This section demonstrates how you can work with PivotTablesprogrammatically. We will start by creating the PiviotTable report shown earlier in Figure 18−7 usingthe data source presented in Figure 18−1.
Try It Out
Make sure that the EquipmentList.xls workbook file is open.1.
Right−click the Source Data sheet tab in the EquipmentList.xls file and choose the Move orCopy option from the pop−up menu.
2.
In the Move or Copy dialog box, choose the (new book) entry from the To book drop−downlist. Indicate that you want to make a copy of the selected sheet by clicking the check boxnext to Create a copy label. Click OK to proceed with the copy operation.
Excel creates a new workbook with one sheet named Source Data. This sheet has beencopied from the EquipmentList.xls file.
3.
Excel 2003 VBA Programming with XML and ASP 9
Reprinted for Q4OGY152857, Capgemini US LLC Wordware Publishing Inc., Wordware Publishing, Inc. (c) 2006, Copying Prohibited

Save this new workbook as Practice_ProgramPivots.xls.4.
Insert three new sheets into the Practice_ProgramPivots.xls file and save the changes madeto the workbook.
5.
Press Alt+F11 to switch to the Visual Basic Editor screen.6.
In the Project Explorer window, highlight the VBAProject (Practice_ ProgramPivots.xls) andchoose Insert | Module.
7.
In the Practice_ProgramPivots.xls — Module1 Code window, enter the CreateNewPivotprocedure as shown below:Sub CreateNewPivot() Dim wksData As Worksheet Dim rngData As Range Dim wksDest As Worksheet Dim pvtTable As PivotTable
' Set up object variables Set wksData = ThisWorkbook.Worksheets("Source Data") Set rngData = wksData.UsedRange Set wksDest = ThisWorkbook.Worksheets("Sheet1")
' Create a skeleton of a PivotTable Set pvtTable = wksData.PivotTableWizard(SourceType:=xlDatabase, _ SourceData:=rngData, TableDestination:=wksDest.Range("B5"))
' Close the PivotTable Field List that appears automatically ActiveWorkbook.ShowPivotTableFieldList = False
' Add fields to the PivotTable With pvtTable .PivotFields("Vendor").Orientation = xlRowField .PivotFields("Equipment Type").Orientation = xlRowField .PivotFields("Warranty Type").Orientation = xlColumnField With .PivotFields("Total Units") .Orientation = xlDataField .Function = xlSum End With .PivotFields("Equipment Id").Orientation = xlPageField End With
' Autofit columns so all headings are visible wksDest.UsedRange.Columns.AutoFitEnd Sub
The CreateNewPivot procedure shown above creates a new PivotTable report using thePivotTableWizard method of a Worksheet object. This method takes a few arguments thatspecify the type of the data source, its location, and the location where the PivotTablereports should be placed. All of these arguments are optional; however, it is a good idea touse them as we did in our example code. Because you can create a PivotTable from varioussources of data by using the xlDatabase constant in the SourceType argument, the codespecifically says that the data comes from an Excel range. If you want to create a PivotTablereport from another PivotTable, use xlPivotTable for this argument. If your data is to bepulled from an external database (as shown in a later example), specify xlExternal as theSourceType. The SourceData argument in the above example procedure is a reference tothe used range on the worksheet containing the source data. The TableDestinationargument has a reference to cell B5 on Sheet1 in the current work− sheet. This is where theupper left−hand corner of the PivotReport will be placed.
The code assumes that Sheet1 exists in the workbook. If you don't have Sheet1, it's easy
8.
Excel 2003 VBA Programming with XML and ASP 10
Reprinted for Q4OGY152857, Capgemini US LLC Wordware Publishing Inc., Wordware Publishing, Inc. (c) 2006, Copying Prohibited

enough to add one via the VBA code prior to setting the reference. It is important tounderstand that when you call the PivotTableWizard method, you create a blank PivotTablereport. All the fields from the data source are hidden. To make the fields visible, you need toadd them to appropriate areas of the PivotTable report. As you recall, there are four suchareas: Row, Column, Data, and Page areas. The PivotTable Wizard automatically displaysthe list of fields that you can add. However, because you are creating a PivotTableprogrammatically, there is no need to display that list on the screen. By setting theShowPivotTableFieldList property to False, the list will go off the screen and you canconcentrate on specifying the position of the fields in the PivotTable report areas.
For each field that you want to display in the PivotTable report, set the Orientation propertyof the PivotField object. Use the following constants for the Orientation property: xlRowField,xlColumnField, xlDataField, and xlPageField. Note that for the Total Units field placed in theData area, the procedure sets the Function property of the PivotField object to xlSum.
When you are creating a PivotTable report via code, you may need to check whether aPivotTable already exists in the destination worksheet. You can place the following code justbelow the code that sets up object variables (see the CreateNewPivot procedure above):
' Check if PivotTable already existsIf wksDest.PivotTables.Count > 0 Then MsgBox "Worksheet " & wksDest.Name & _ " already contains a pivot table." Exit SubEnd If
Run the CreateNewPivot procedure.
When you switch to the Microsoft Excel application window, Sheet1 should contain thePivotTable report shown in Figure 18−10.
Figure 18−10: PivotTable report created with VBA code.
9.
Excel 2003 VBA Programming with XML and ASP 11
Reprinted for Q4OGY152857, Capgemini US LLC Wordware Publishing Inc., Wordware Publishing, Inc. (c) 2006, Copying Prohibited

Creating a PivotTable Report from an Access DatabaseYou can use the same PivotTableWizard method of the Worksheet object (demonstrated in theprevious example procedure) to create a PivotTable report from an external data source. Let's startby creating a PivotTable report from a Microsoft Access sample database. We will use a MicrosoftAccess driver to connect to the Northwind database and then call the PivotTableWizard method ofthe Worksheet object to create an empty PivotTable. We will populate the PivotTable report with thedata by setting the Orientation property of the PivotField objects.
Try It Out
Add a new module to the VBAProject (Practice_ProgramPivots.xls) and enter thePivotTable_External1 procedure as shown below:Sub PivotTable_External1() Dim strConn As String Dim strQuery_1 As String Dim strQuery_2 As String Dim myArray As Variant Dim destRange As Range Dim strPivot As String
strConn = "Driver={Microsoft Access Driver (*.mdb)};" & _ "DBQ=" & "C:\Program Files\Microsoft Office\Office11\" & _ "Samples\Northwind.mdb;"
strQuery_1 = "SELECT Customers.CustomerID, Customers.CompanyName," & _ "Orders.OrderDate, Products.ProductName, Sum([Order " & _ "Details].[UnitPrice]*[QUantity]*(1−[Discount])) AS Total " & _ "FROM Products INNER JOIN ((Customers INNER JOIN Orders " & _ "ON Customers.CustomerID = "
strQuery_2 = "Orders.CustomerID) INNER JOIN [Order Details] " & _ "ON Orders.OrderID = [Order Details].OrderID) ON " & _ "Products.ProductID = [Order Details].ProductID " & _ "GROUP BY Customers.CustomerID, Customers.CompanyName, " & _ "Orders.OrderDate, Products.ProductName;"
myArray = Array(strConn, strQuery_1, strQuery_2) Worksheets.Add
Set destRange = ActiveSheet.Range("B5") strPivot = "PivotFromAccess"
ActiveSheet.PivotTableWizard _ SourceType:=xlExternal, _ SourceData:=myArray, _ TableDestination:=destRange, _ TableName:=strPivot, _ SaveData:=False, _ BackgroundQuery:=False
' Close the PivotTable Field List that appears automatically ActiveWorkbook.ShowPivotTableFieldList = False
' Add fields to the PivotTable With ActiveSheet.PivotTables(strPivot) .PivotFields("ProductName").Orientation = xlRowField .PivotFields("CompanyName").Orientation = xlRowField With .PivotFields("Total") .Orientation = xlDataField .Function = xlSum .NumberFormat = "$#,##0.00" End With .PivotFields("CustomerID").Orientation = xlPageField .PivotFields("OrderDate").Orientation = xlPageField End With
' Autofit columns so all headings are visible
1.
Excel 2003 VBA Programming with XML and ASP 12
Reprinted for Q4OGY152857, Capgemini US LLC Wordware Publishing Inc., Wordware Publishing, Inc. (c) 2006, Copying Prohibited

ActiveSheet.UsedRange.Columns.AutoFitEnd Sub
When using the PivotTableWizard method of the Worksheet object to create a PivotTablereport from an external data source, you need to specify at a minimum the followingarguments:
SourceType Use the xlExternal constant to indicate that the data for thePivotTable comes from an external data source.
SourceData Specify an array containing two or more elements. The firstelement of the array must be a connection string to the database.The second argument is the SQL statement for querying anexternal database. If the SQL statement is longer than 255characters, break up the statement into several strings and passeach string as a separate element of the array. In the exampleprocedure above, the SQL statement necessary for obtaining therequired data from an external database is longer than 255characters; therefore, the SQL string is broken into two strings:strQuery_1 and strQuery_2. Next, the connection string and theSQL statement are placed in an array like this:
myArray = Array(strConn, strQuery_1, strQuery_2)
The myArray is then used as the SourceData argument of thePivotTableWizard method.
TableDestination Specify a worksheet range where the PivotTable should be placed.TableName Specify the name of the PivotTable that you want to create.
In addition to the above arguments, the example procedure shown above uses the optionalSaveData and BackgroundQuery arguments.SaveData This argument tells Visual Basic whether to save the PivotTable
when the workbook file is saved. By setting the SaveDataargument to False, the PivotTable will not be saved. This settingallows you to save space on disk.
BackgroundQuery When set to False, this argument tells Visual Basic to refrainfrom executing other operations in Excel in the background untilthe query is complete.
After creating a PivotTable, the procedure specifies where the fields returned by the SQLstatement should be placed in the PivotTable layout.
Run the PivotTable_External1 procedure to generate the PivotTable.
The resulting PivotTable report is illustrated in Figure 18−11.
2.
Excel 2003 VBA Programming with XML and ASP 13
Reprinted for Q4OGY152857, Capgemini US LLC Wordware Publishing Inc., Wordware Publishing, Inc. (c) 2006, Copying Prohibited

Figure 18−11: A PivotTable report can be created programmatically from an external datasource such as a Microsoft Access database.
Using the CreatePivotTable Method of the PivotCache Object
When you use the macro recorder to generate the code for creating a PivotTable programmatically,Excel uses the Add method of the PivotCaches collection to create a new PivotCache. APivotCache object represents the data behind a PivotTable. It is an area in memory where data isstored and accessed as required from a data source. Use the PivotCache when you need togenerate multiple PivotTables from the same data source. By using a PivotCache, you can gain ahigh level of control over your external data source. The PivotCache object can also be used tochange and refresh data stored in the cache.
The following example procedure connects to the Microsoft Access Northwind database using theMicrosoft.Jet.OLEDB.4.0 provider. To use this type of connection, you must set up a reference tothe Microsoft ActiveX Data Objects (ADO) in the References dialog box located in the MicrosoftExcel Visual Basic Editor screen.
Try It Out
In the Visual Basic Editor screen, choose Tools | References. In the Available Referenceslist box, select Microsoft ActiveX Data Objects 2.7 library and click OK.
1.
Add a new module to the VBAProject (Practice_ProgramPivots.xls) and enter in the Codewindow the Pivot_External2 procedure as shown below:Sub Pivot_External2() Dim objPivotCache As PivotCache Dim cmd As New ADODB.Command Dim rst As New ADODB.Recordset Dim dbPath As String
2.
Excel 2003 VBA Programming with XML and ASP 14
Reprinted for Q4OGY152857, Capgemini US LLC Wordware Publishing Inc., Wordware Publishing, Inc. (c) 2006, Copying Prohibited

dbPath = "C:\Program Files\Microsoft Office\Office11\" & _ "Samples\Northwind.mdb" With cmd .ActiveConnection = "Provider=Microsoft.Jet.OLEDB.4.0;" & _ "Data Source =" & dbPath .CommandText = "Select Country, ProductName, " & _ "ExtendedPrice from Invoices" End With Set rst = cmd.Execute
' Create a PivotTable cache and report Set objPivotCache = ActiveWorkbook.PivotCaches.Add( _ SourceType:=xlExternal) Set objPivotCache.Recordset = rst
Worksheets.Add With objPivotCache .CreatePivotTable TableDestination:=Range("B6"), _ TableName:="Invoices" End With
' Add fields to the PivotTable With ActiveSheet.PivotTables("Invoices") .SmallGrid = False With .PivotFields("Country") .Orientation = xlRowField .Position = 1 End With With .PivotFields("ProductName") .Orientation = xlRowField .Position = 2 .Name = "Product Name" End With With .PivotFields("ExtendedPrice") .Orientation = xlDataField .Position = 1 .NumberFormat = "$#,##0.00" End With End With
' Autofit columns so all headings are visible ActiveSheet.UsedRange.Columns.AutoFit
' Clean up Set cmd = Nothing Set rst = Nothing
' Obtain information about PivotCache With ActiveSheet.PivotTables("Invoices").PivotCache Debug.Print "Information about the PivotCache" Debug.Print "Number of Records: " & .RecordCount Debug.Print "Data was last refreshed on: " & .RefreshDate Debug.Print "Data was last refreshed by: " & .RefreshName Debug.Print "Memory used by PivotCache: " & .MemoryUsed & _ " (bytes)" End WithEnd Sub
After establishing a connection with a database and executing the SQL statement to obtainthe data, the procedure creates a PivotCache using the following line of code:
Set objPivotCache = ActiveWorkbook.PivotCaches.Add( _ SourceType:=xlExternal)
The code then places the data from the external data source in the PivotCache by assigninga Recordset object to the PivotCache object, like this:
Excel 2003 VBA Programming with XML and ASP 15
Reprinted for Q4OGY152857, Capgemini US LLC Wordware Publishing Inc., Wordware Publishing, Inc. (c) 2006, Copying Prohibited

Set objPivotCache.Recordset = rst
Next, the code uses the CreatePivotTable method of the PivotCache object to create anempty PivotTable:
With objPivotCache .CreatePivotTable TableDestination:=Range("B6"), _ TableName:="Invoices"End With
Once the skeleton of the PivotTable is created, the code adds appropriate fields to thePivotTable. The last several lines of the example procedure demonstrate how to find outinformation about the PivotCache.
To force the PivotCache to refresh automatically when a workbook containing the PivotTableis opened, set the RefreshOnFileOpen property to True. To do this, you may want to add thefollowing statement at the end of the Pivot_External2 procedure:
ActiveSheet.PivotTables("Invoices").PivotCache.RefreshOnFileOpen = True
Run the Pivot_External2 procedure to generate the PivotTable.
The resulting PivotTable report is illustrated in Figure 18−12.
Figure 18−12: A PivotTable report created programmatically using the CreatePivotTablemethod of the PivotCache object.
3.
Excel 2003 VBA Programming with XML and ASP 16
Reprinted for Q4OGY152857, Capgemini US LLC Wordware Publishing Inc., Wordware Publishing, Inc. (c) 2006, Copying Prohibited

Formatting, Grouping, and Sorting a PivotTable ReportYou can modify the display and format of a PivotTable programmatically by using a number ofdifferent properties of the PivotTable object. For example, you may want to reposition the fieldswithin the PivotTable layout, sort the data by a specific field, or group your data by years, quarters,months, and so on. The example procedure below reformats the PivotTable report shown in Figure18−11 to look like the one shown in Figure 18−13.
Figure 18−13: A PivotTable report can be reformatted to view data from a different perspective.Try It Out
Add a new module to the VBAProject (Practice_ProgramPivots.xls) and enter theFormatPivotTable procedure as shown below:Sub FormatPivotTable() Dim pvtTable As PivotTable Dim strPiv As String
If ActiveSheet.PivotTables.Count > 0 Then strPiv = ActiveSheet.PivotTables(1).Name Set pvtTable = ActiveSheet.PivotTables(strPiv) Else Exit Sub End If
With pvtTable .PivotFields("OrderDate").Orientation = xlRows .PivotFields("CompanyName").Orientation = xlHidden
' use this statement to group OrderDate by year .PivotFields("OrderDate").DataRange.Cells(1).Group _ Start:=True, End:=True, _ periods:=Array(False, False, False, False, False, False, _ True)
1.
Excel 2003 VBA Programming with XML and ASP 17
Reprinted for Q4OGY152857, Capgemini US LLC Wordware Publishing Inc., Wordware Publishing, Inc. (c) 2006, Copying Prohibited

' use this statement to group OrderDate both by quarter and year ' .PivotFields("OrderDate").DataRange.Cells(1).Group _ Start:=True, End:=True, _ periods:=Array(False, False, False, False, False, True, True)
.PivotFields("OrderDate").Orientation = xlColumns .TableRange1.AutoFormat Format:=xlRangeAutoFormatColor2 .PivotFields("ProductName").DataRange.Select
' sort the Product Name field in descending order based on the ' Sum of Total .PivotFields("ProductName").AutoSort xlDescending, "Sum of Total" Selection.IndentLevel = 2 With Selection.Font .Name = "Times New Roman" .FontStyle = "Bold" .Size = 10 End With With Selection.Borders(xlInsideHorizontal) .LineStyle = xlContinuous .Weight = xlThin .ColorIndex = xlAutomatic End With End WithEnd Sub
By studying the code of the procedure presented above, you can easily conclude that:
To change the layout of a PivotTable, you should set the Orientation property of therequired field to a different constant. The example code above moves the OrderDatefield from the Page area to the Row area of the PivotTable layout.
♦
To display a PivotTable without a particular field, you need to set the Orientationproperty of the required field to xlHidden.
♦
To group the OrderDate field by year, you should use the Group method of theRange object. For example, the code uses the following statement to group the datain the OrderDate field by year:.PivotFields("OrderDate").DataRange.Cells(1).Group Start:=True, _ End:=True, periods:=Array(False, False, False, False, False, _ False, True)
♦
The Start and End arguments specify the start and end date to be included in thegrouping. By setting these arguments to True, all dates are included. The Periodsargument is an array of Boolean values that specifies the period for the group, asshown in the following table:Array Element Period1 Seconds2 Minutes3 Hours4 Days5 Months6 Quarters7 Years
♦
Excel 2003 VBA Programming with XML and ASP 18
Reprinted for Q4OGY152857, Capgemini US LLC Wordware Publishing Inc., Wordware Publishing, Inc. (c) 2006, Copying Prohibited

Note The following statement will ungroup the dates:
ActiveSheet.PivotTables(1).PivotFields("OrderDate").LabelRange.Ungroup
You can apply automatic formatting to the entire PivotTable report by using theAutoFormat property of the Range object. The TableRange1 property returns aRange object that represents the range containing the entire PivotTable reportwithout the page fields:
.TableRange1.AutoFormat Format:=xlRangeAutoFormatColor2
♦
You can select the data items in a particular field by using the DataRange propertyand the Select method, like this:
.PivotFields("ProductName").DataRange.Select
♦
You can sort a particular field in descending or ascending order. The exampleprocedure uses the following statement to sort the ProductName field in descendingorder based on the Sum of Total:.PivotFields("ProductName").AutoSort xlDescending, "Sum of Total"
♦
You can change the text indentation, font name, size, and style, as well as theborders of the selected range, as demonstrated in the last statements of the exampleprocedure shown above.
♦
Switch to the Microsoft Excel application window and activate Sheet4 containing thePivotTable report as shown in Figure 18−11 earlier in this chapter.
2.
Press Alt+F8 to open the Macro dialog box. Highlight the Format− PivotTable procedure andclick Run.
3.
The resulting reformatted PivotTable report is illustrated in Figure 18−13.
Hiding Items in a PivotTableIn the previous example procedure, you grouped the data in the PivotReport by year based on theOrderDate field. To hide some of the grouped data, you can set the Visible property of the PivotItemobject to False. For instance, the following procedure demonstrates how to hide the 1996 column ofdata in the PivotTable report presented in Figure 18−13:
Sub Hide1996Data() Dim myPivot As PivotTable Dim myItem As PivotItem Dim strFieldLabel As String
strTitle = "1996"
Set myPivot = ActiveSheet.PivotTables(1) For Each myItem In myPivot.PivotFields("OrderDate").PivotItems
Excel 2003 VBA Programming with XML and ASP 19
Reprinted for Q4OGY152857, Capgemini US LLC Wordware Publishing Inc., Wordware Publishing, Inc. (c) 2006, Copying Prohibited

If myItem.Name <> strTitle Then myItem.Visible = True Else myItem.Visible = False End If NextEnd Sub
Adding Calculated Fields and Items to a PivotTableYou can customize a PivotTable report by defining calculated fields and items. Using the contentsof other numeric fields in a PivotTable, you can create a calculated field that performs the requiredcalculation. For example, let's create a procedure with two calculated fields named Change:
2001/2000 and Change: 2000/1999 to calculate the difference in number of products sold from yearto year.
Try It Out
Open a new workbook and save it as Practice_PivotFields.xls.1.
Enter the data shown in Figure 18−14 in Practice_PivotFields.xls.
Figure 18−14: Sample data for the PivotTable report.
2.
Switch to the Visual Basic Editor screen and highlight the VBAProject(Practice_PivotFields.xls) in the Project Explorer.
3.
Choose Insert | Module to add a new module and enter the PivotWithCalcFields procedureas shown below:Sub PivotWithCalcFields() ActiveWorkbook.PivotCaches.Add( _ SourceType:=xlDatabase, _ SourceData:="Sheet1!R1C1:R4C4").CreatePivotTable _ TableDestination:="'[PivotFields.xls]Sheet1'!R4C7", _ TableName:="Piv1", _ DefaultVersion:=xlPivotTableVersion10
With ActiveSheet.PivotTables("Piv1").PivotFields("Product") .Orientation = xlRowField .Position = 1 End With
ActiveSheet.PivotTables("Piv1").AddDataField _ ActiveSheet.PivotTables("Piv1").PivotFields("2001"), _ "Sum of 2001", xlSum ActiveSheet.PivotTables("Piv1").AddDataField _ ActiveSheet.PivotTables("Piv1").PivotFields("2000"), _ "Sum of 2000", xlSum ActiveSheet.PivotTables("Piv1").AddDataField _ ActiveSheet.PivotTables("Piv1").PivotFields("1999"), _
4.
Excel 2003 VBA Programming with XML and ASP 20
Reprinted for Q4OGY152857, Capgemini US LLC Wordware Publishing Inc., Wordware Publishing, Inc. (c) 2006, Copying Prohibited

"Sum of 1999", xlSum ActiveSheet.PivotTables("Piv1").CalculatedFields.Add _ "Change: 2001/2000", "='2001' −'2000'", True ActiveSheet.PivotTables("Piv1").CalculatedFields.Add _ "Change: 2000/1999", "='2000' −'1999'", True ActiveSheet.PivotTables("Piv1"). _ PivotFields("Change: 2001/2000"). _ Orientation = xlDataField ActiveSheet.PivotTables("Piv1"). _ PivotFields("Change: 2000/1999"). _ Orientation = xlDataField ActiveSheet.PivotTables("Piv1"). _ PivotFields("Data").Orientation = xlColumnFieldEnd Sub
Notice that calculated fields are defined by using the Add method of the CalculatedFieldsobject and supplying the name for the new field and a formula:
ActiveSheet.PivotTables("Piv1").CalculatedFields.Add _ "Change: 2001/2000", "='2001' −'2000'", TrueActiveSheet.PivotTables("Piv1").CalculatedFields.Add _ "Change: 2000/1999", "='2000' −'1999'", True
The third (optional) argument set to True indicates that the strings in field names will beinterpreted as having been formatted in standard U.S. English instead of using local settings.The default setting is False.
A calculated field uses a formula that refers to other pivot fields that contain numeric data.This can be a simple formula, such as addition (+), subtraction (–), multiplication (*), ordivision (/), or an Excel function. In the procedure example above, we created the twocalculated fields shown below:
Calculated Field Name Formula UsedChange: 2001/2000 ='2001' −'2000'Change: 2000/1999 ='2000' −'1999'
"2001," "2000," and "1999" are the names of the fields placed in the Data area of thePivotTable. When you use multiple pivot fields in the Data area, Excel creates a new pivotfield named Data (see Figure 18−15). The labels for the multiple pivot fields in the Data areacan be displayed going down the rows or across columns. You can specify the orientation ofthe labels by setting the Orientation property of the Data field to xlRowField orxlColumnField.
Excel 2003 VBA Programming with XML and ASP 21
Reprinted for Q4OGY152857, Capgemini US LLC Wordware Publishing Inc., Wordware Publishing, Inc. (c) 2006, Copying Prohibited

Figure 18−15: You can add additional calculations to a PivotTable by defining additionalfields, such as Change: 2001/2000 and Change: 2000/1999 depicted here.
Once you define a calculated field, the field is added to the PivotTable field list andmaintained in the PivotTable cache.Note You can add a calculated field manually by using the PivotTable toolbar. Click
PivotTable, point to Formulas, and click Calculated Field.
Run the PivotWithCalcFields procedure.
The resulting PivotTable report is shown in Figure 18−15.
By adding the following statement at the end of the PivotWithCalc− Fields procedure, thePivotTable depicted in Figure 18−15 will look like the one shown in Figure 18−16:
Figure 18−16: Changing the orientation of the PivotTable data.
ActiveSheet.PivotTables("Piv1"). _ PivotFields("Data").Orientation = xlColumnField
5.
You must not confuse a calculated item with a calculated field. A calculated item is a custom itemyou define in a PivotTable field to perform calculations using the contents of other fields and itemsin the PivotTable.
Excel 2003 VBA Programming with XML and ASP 22
Reprinted for Q4OGY152857, Capgemini US LLC Wordware Publishing Inc., Wordware Publishing, Inc. (c) 2006, Copying Prohibited
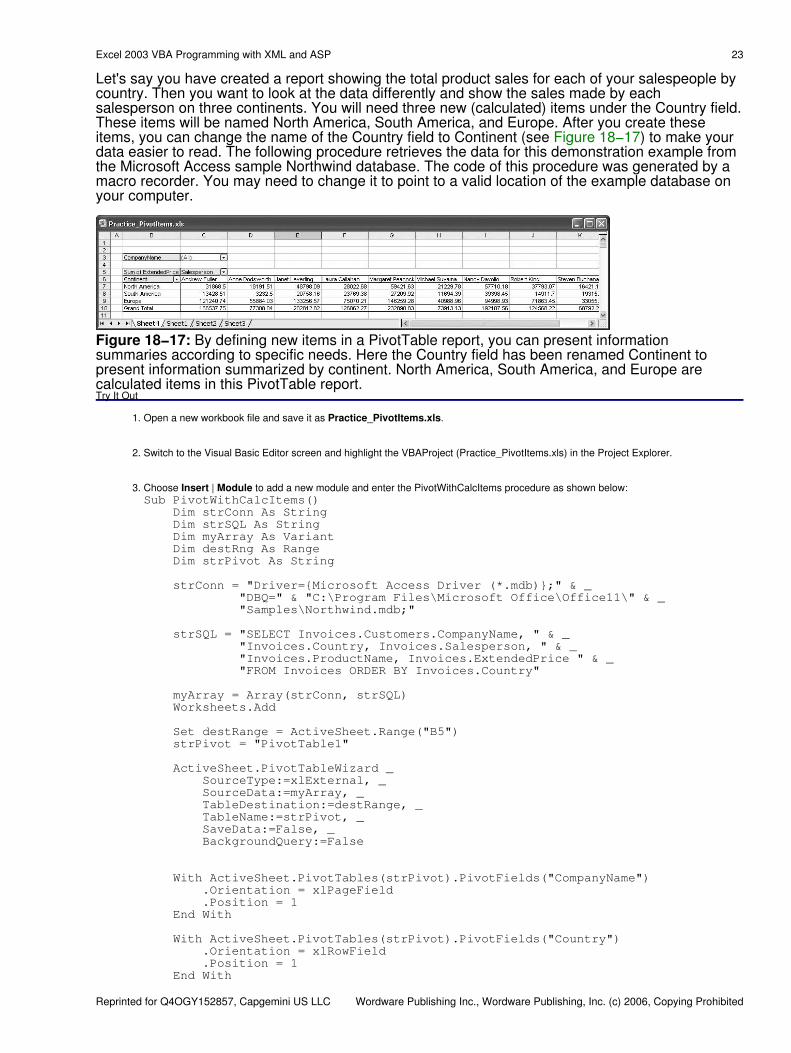
Let's say you have created a report showing the total product sales for each of your salespeople bycountry. Then you want to look at the data differently and show the sales made by eachsalesperson on three continents. You will need three new (calculated) items under the Country field.These items will be named North America, South America, and Europe. After you create theseitems, you can change the name of the Country field to Continent (see Figure 18−17) to make yourdata easier to read. The following procedure retrieves the data for this demonstration example fromthe Microsoft Access sample Northwind database. The code of this procedure was generated by amacro recorder. You may need to change it to point to a valid location of the example database onyour computer.
Figure 18−17: By defining new items in a PivotTable report, you can present informationsummaries according to specific needs. Here the Country field has been renamed Continent topresent information summarized by continent. North America, South America, and Europe arecalculated items in this PivotTable report.Try It Out
Open a new workbook file and save it as Practice_PivotItems.xls.1.
Switch to the Visual Basic Editor screen and highlight the VBAProject (Practice_PivotItems.xls) in the Project Explorer.2.
Choose Insert | Module to add a new module and enter the PivotWithCalcItems procedure as shown below:Sub PivotWithCalcItems() Dim strConn As String Dim strSQL As String Dim myArray As Variant Dim destRng As Range Dim strPivot As String
strConn = "Driver={Microsoft Access Driver (*.mdb)};" & _ "DBQ=" & "C:\Program Files\Microsoft Office\Office11\" & _ "Samples\Northwind.mdb;"
strSQL = "SELECT Invoices.Customers.CompanyName, " & _ "Invoices.Country, Invoices.Salesperson, " & _ "Invoices.ProductName, Invoices.ExtendedPrice " & _ "FROM Invoices ORDER BY Invoices.Country"
myArray = Array(strConn, strSQL) Worksheets.Add
Set destRange = ActiveSheet.Range("B5") strPivot = "PivotTable1"
ActiveSheet.PivotTableWizard _ SourceType:=xlExternal, _ SourceData:=myArray, _ TableDestination:=destRange, _ TableName:=strPivot, _ SaveData:=False, _ BackgroundQuery:=False
With ActiveSheet.PivotTables(strPivot).PivotFields("CompanyName") .Orientation = xlPageField .Position = 1 End With
With ActiveSheet.PivotTables(strPivot).PivotFields("Country") .Orientation = xlRowField .Position = 1 End With
3.
Excel 2003 VBA Programming with XML and ASP 23
Reprinted for Q4OGY152857, Capgemini US LLC Wordware Publishing Inc., Wordware Publishing, Inc. (c) 2006, Copying Prohibited

ActiveSheet.PivotTables(strPivot).AddDataField _ ActiveSheet.PivotTables(strPivot).PivotFields("ExtendedPrice"), _ "Sum of ExtendedPrice", xlSum
With ActiveSheet.PivotTables(strPivot).PivotFields("Salesperson") .Orientation = xlRowField .Position = 1 End With
With ActiveSheet.PivotTables(strPivot).PivotFields("Salesperson") .Orientation = xlPageField .Position = 1 End With
With ActiveSheet.PivotTables(strPivot).PivotFields("Salesperson") .Orientation = xlColumnField .Position = 1 End With
ActiveSheet.PivotTables(strPivot).PivotFields("Country"). _ CalculatedItems.Add "North America", "=USA+Canada", True ActiveSheet.PivotTables(strPivot).PivotFields("Country"). _ CalculatedItems.Add "South America", "=Argentina+Brazil+ _ Venezuela", True ActiveSheet.PivotTables(strPivot).PivotFields("Country"). _ CalculatedItems("North America").StandardFormula = _ "=USA+Canada+Mexico" ActiveSheet.PivotTables(strPivot).PivotFields("Country"). _ CalculatedItems.Add "Europe", "=Austria+Belgium+Denmark+" & _ "Finland+France+Germany+Ireland+Italy+Norway+Poland+" & _ "Portugal+Spain+Sweden+Switzerland+UK", True
With ActiveSheet.PivotTables(strPivot).PivotFields("Country") .PivotItems("Argentina").Visible = False .PivotItems("Austria").Visible = False .PivotItems("Belgium").Visible = False .PivotItems("Brazil").Visible = False .PivotItems("Canada").Visible = False .PivotItems("Denmark").Visible = False .PivotItems("Finland").Visible = False .PivotItems("France").Visible = False .PivotItems("Germany").Visible = False .PivotItems("Ireland").Visible = False .PivotItems("Italy").Visible = False .PivotItems("Mexico").Visible = False .PivotItems("Norway").Visible = False .PivotItems("Poland").Visible = False .PivotItems("Portugal").Visible = False .PivotItems("Spain").Visible = False .PivotItems("Sweden").Visible = False .PivotItems("Switzerland").Visible = False .PivotItems("UK").Visible = False .PivotItems("USA").Visible = False .PivotItems("Venezuela").Visible = False End With
ActiveSheet.PivotTables(strPivot).PivotFields("Country").Caption = _ "Continent"
With ActiveSheet.PivotTables(strPivot). _ PivotFields("Sum of ExtendedPrice").NumberFormat = "$#,##0.00" End With
With ActiveSheet.PivotTables(strPivot).PivotFields("ProductName") .Orientation = xlRowField .Position = 2 End With
ActiveSheet.PivotTables(strPivot). _ PivotFields("ProductName").Orientation = xlHiddenEnd Sub
Excel 2003 VBA Programming with XML and ASP 24
Reprinted for Q4OGY152857, Capgemini US LLC Wordware Publishing Inc., Wordware Publishing, Inc. (c) 2006, Copying Prohibited

A calculated item uses a formula that refers to other items in the specified PivotTable field. For example, a PivotTable that contains aCountry field listing a number of different country items (Austria, UK, Brazil, Argentina, etc.) could have a calculated item named"South America" defined as the sum of countries located on the South American continent:
Calculated Item FormulaSouth America =Argentina+Brazil+Venezuela
All of the calculated items in the specified PivotTable are members of the CalculatedItems collection. Calculated items are defined byusing the Add method of the CalculatedItems object and supplying two arguments — the name for the new item and a formula asshown below:ActiveSheet.PivotTables(strPivot).PivotFields("Country"). _ CalculatedItems.Add "South America", "=Argentina+Brazil+Venezuela", _ True
The third (optional) argument set to True indicates that the strings in field names will be interpreted as having been formatted instandard U.S. English instead of using local settings. The default setting is False.
Run the PivotWithCalcItems procedure.4.
The resulting PivotTable report is shown in Figure 18−17.
You can modify the PivotWithCalcItems procedure by defining new calculated items in theSalesperson PivotTable field to generate the output shown in Figure 18−18.
Figure 18−18: By defining new calculated items in a PivotTable report, you can present informationsummaries according to specific needs. Here the Northwind employees were grouped into teamsnamed Male and Female.ActiveSheet.PivotTables(strPivot).PivotFields("Salesperson"). _ CalculatedItems.Add "Male", _ "=Michael Suyama+Andrew Fuller+Robert King+Steven Buchanan", True
ActiveSheet.PivotTables(strPivot).PivotFields("Salesperson"). _ CalculatedItems.Add "Female", _ "=Anne Dodsworth+Laura Callahan+Janet Leverling+Margaret _ Peacock+Nancy Davolio", True
You can find out if the PivotField or PivotItem is calculated by using the IsCalculated property of thePivotField or PivotItem object. The procedure shown below prints a list of fields and items in thePivotTable to the Immediate window, indicating whether the field or item is calculated. In addition,this procedure prints the names of all calculated items and their formulas to an Excel worksheet.
Excel 2003 VBA Programming with XML and ASP 25
Reprinted for Q4OGY152857, Capgemini US LLC Wordware Publishing Inc., Wordware Publishing, Inc. (c) 2006, Copying Prohibited
Sub ListCalcFieldsItems() Dim fld As PivotField ' field enumerator Dim itm As PivotItem ' item enumerator Dim r As Integer ' row number
Set pivTable = Worksheets(1).PivotTables(1) On Error Resume Next
' print to the Immediate window the names of fields ' and calculated items For Each fld In pivTable.PivotFields If fld.IsCalculated Then Debug.Print fld.Name & ":" & _ fld.Name & vbTab & "−−>Calculated field" Else Debug.Print fld.Name End If For Each itm In pivTable. _ PivotFields(fld.Name).CalculatedItems Debug.Print fld.Name & ":" & _ itm.Name & vbTab & "−−>Calculated item" ' enter information about Calculated items ' in a worksheet r = r + 1 With Worksheets(2) .Cells(r, 1).Value = itm.Name .Cells(r, 2).Value = Chr(39) & itm.Formula End With Next NextEnd Sub
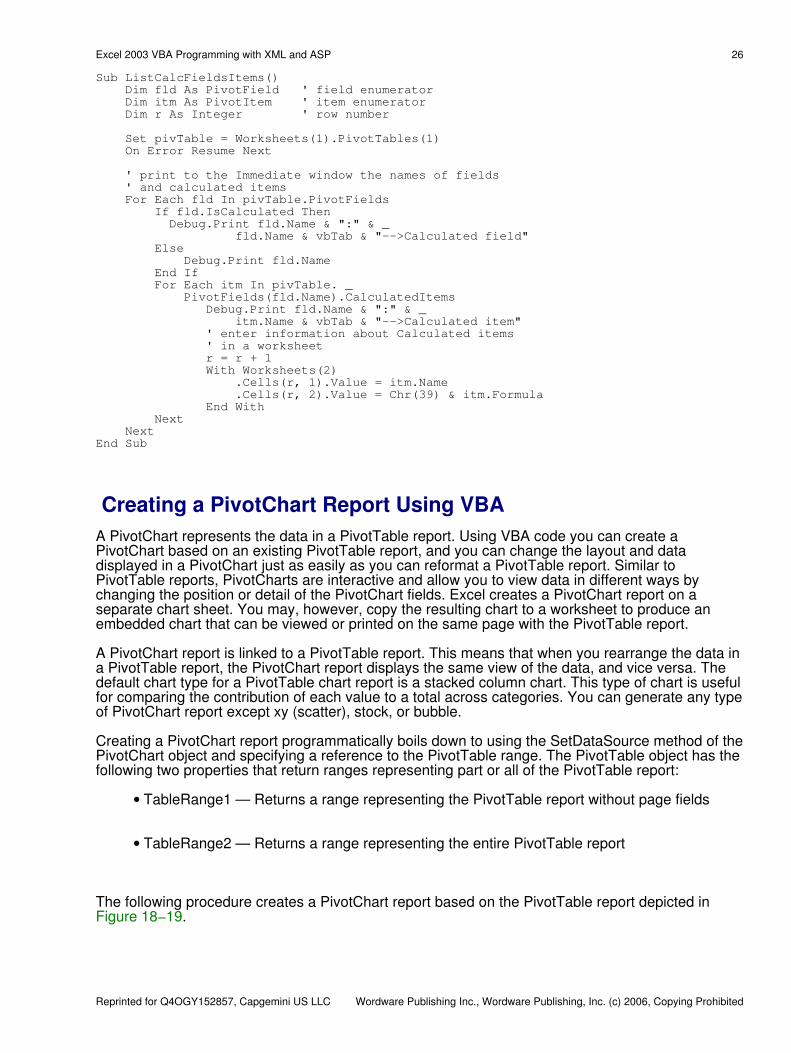
Creating a PivotChart Report Using VBAA PivotChart represents the data in a PivotTable report. Using VBA code you can create aPivotChart based on an existing PivotTable report, and you can change the layout and datadisplayed in a PivotChart just as easily as you can reformat a PivotTable report. Similar toPivotTable reports, PivotCharts are interactive and allow you to view data in different ways bychanging the position or detail of the PivotChart fields. Excel creates a PivotChart report on aseparate chart sheet. You may, however, copy the resulting chart to a worksheet to produce anembedded chart that can be viewed or printed on the same page with the PivotTable report.
A PivotChart report is linked to a PivotTable report. This means that when you rearrange the data ina PivotTable report, the PivotChart report displays the same view of the data, and vice versa. Thedefault chart type for a PivotTable chart report is a stacked column chart. This type of chart is usefulfor comparing the contribution of each value to a total across categories. You can generate any typeof PivotChart report except xy (scatter), stock, or bubble.
Creating a PivotChart report programmatically boils down to using the SetDataSource method of thePivotChart object and specifying a reference to the PivotTable range. The PivotTable object has thefollowing two properties that return ranges representing part or all of the PivotTable report:
TableRange1 — Returns a range representing the PivotTable report without page fields•
TableRange2 — Returns a range representing the entire PivotTable report•
The following procedure creates a PivotChart report based on the PivotTable report depicted inFigure 18−19.
Excel 2003 VBA Programming with XML and ASP 26
Reprinted for Q4OGY152857, Capgemini US LLC Wordware Publishing Inc., Wordware Publishing, Inc. (c) 2006, Copying Prohibited

Figure 18−19: This PivotTable report is used to graph data in the PivotChart report.Try It Out
Open a new workbook file and save it as Practice_PivotCharts.xls.1.
Switch to the Visual Basic Editor screen and highlight the VBAProject(Practice_PivotCharts.xls) in the Project Explorer.
2.
Choose Insert | Module to add a new module and enter the Generate− PivotReportprocedure as shown below:Sub GeneratePivotReport() Dim strConn As String Dim strSQL As String Dim myArray As Variant Dim destRng As Range Dim strPivot As String
strConn = "Driver={Microsoft Access Driver (*.mdb)};" & _ "DBQ=" & "C:\Program Files\Microsoft Office\Office11\" & _ "Samples\Northwind.mdb;"
strSQL = "SELECT Invoices.Customers.CompanyName, " & _ "Invoices.Country, Invoices.Salesperson, " & _ "Invoices.ProductName, Invoices.ExtendedPrice " & _ "FROM Invoices ORDER BY Invoices.Country"
myArray = Array(strConn, strSQL) Worksheets.Add
Set destRange = ActiveSheet.Range("B5") strPivot = "PivotTable1"
ActiveSheet.PivotTableWizard _ SourceType:=xlExternal, _ SourceData:=myArray, _ TableDestination:=destRange, _ TableName:=strPivot, _ SaveData:=False, _ BackgroundQuery:=False
With ActiveSheet.PivotTables(strPivot).PivotFields("ProductName") .Orientation = xlPageField .Position = 1 End With With ActiveSheet.PivotTables(strPivot).PivotFields("Country") .Orientation = xlRowField .Position = 1 End With
3.
Excel 2003 VBA Programming with XML and ASP 27
Reprinted for Q4OGY152857, Capgemini US LLC Wordware Publishing Inc., Wordware Publishing, Inc. (c) 2006, Copying Prohibited

With ActiveSheet.PivotTables(strPivot).PivotFields("Salesperson") .Orientation = xlColumnField .Position = 1 End With
ActiveSheet.PivotTables(strPivot).AddDataField _ ActiveSheet.PivotTables(strPivot).PivotFields("ExtendedPrice"), _ "Sum of ExtendedPrice", xlSum
With ActiveSheet.PivotTables(strPivot). _ PivotFields("Sum of ExtendedPrice").NumberFormat = "$#,##0.00" End WithEnd Sub
Run the GeneratePivotReport procedure.
Excel adds a new worksheet with a PivotTable to the current workbook as shown in Figure18−19.
4.
In the same code module where you entered the GeneratePivotReport procedure, enter thecode of the CreatePivotChart procedure as shown below:
Sub CreatePivotChart() Dim myChart As Chart Dim strChartName As String Dim rngSource As Range Dim pvtTable As PivotTable
Set pvtTable = Worksheets("Sheet4").PivotTables(1) Set rngSource = pvtTable.TableRange2 strChartName = "Sales Comparison" Set myChart = ActiveWorkbook.Charts.Add With myChart .Name = strChartName .SetSourceData Source:=rngSource .ChartType = xlColumnClustered End With
' set the current page for the PivotTable report to the ' page named "Tofu" pvtTable.PivotFields("ProductName").CurrentPage = "Tofu"End Sub
After creating a PivotChart report based on the PivotTable report shown on Sheet4 in Figure18−19, the procedure changes the current page for the PivotTable report to displayinformation about the product named Tofu.
5.
Run the CreatePivotChart procedure.
The resulting PivotChart report is shown in Figure 18−20. Notice that the fields in aPivotChart report are shown as drop−down lists to allow you to play with the data on thechart.
6.
Excel 2003 VBA Programming with XML and ASP 28
Reprinted for Q4OGY152857, Capgemini US LLC Wordware Publishing Inc., Wordware Publishing, Inc. (c) 2006, Copying Prohibited

Figure 18−20: The PivotChart report is generated from the PivotTable report data on aseparate chart sheet.
To find out the names of the PivotChart report fields, enter the following GetChartInfoprocedure in the module where you entered the previous procedures.
Sub GetChartInfo() ' list of all the PivotTable field names used ' in the first PivotChart report
Dim sht As Worksheet Dim r As Integer Dim fld As PivotField Set sht = Worksheets.Add sht.Activate r = 1 For Each fld In _ Charts("Sales Comparison").PivotLayout.PivotFields sht.Cells(r, 1).Value = fld.Caption r = r + 1 Next fldEnd Sub
7.
Run the GetChartInfo procedure.
Excel enters the names of the PivotChart fields in a new worksheet.
8.
Saving a PivotTable Report or PivotChart Report as a WebPage
Excel 2003 VBA Programming with XML and ASP 29
Reprinted for Q4OGY152857, Capgemini US LLC Wordware Publishing Inc., Wordware Publishing, Inc. (c) 2006, Copying Prohibited

By publishing a PivotTable report or PivotTable chart as a web page, you can work with yourPivotTable or PivotChart interactively inside Microsoft Internet Explorer. When you select thePivotTable report, Excel uses the Microsoft PivotTable web component to publish your data. Webcomponents are the subject of Chapter 24. When you save your PivotChart report as a web page,the publishing job is handled by the Microsoft Chart web component. To manually save yourPivotTable report and PivotChart report as a web page, perform the tasks as outlined below (forprogramming examples, see Chapter 24).
Try It Out
Select Sheet4 containing the PivotTable report (see Figure 18−19 in the previous section).1.
Choose File | Save As.2.
In the Save As dialog box, choose Web Page (*.htm; *.html) from the Save as file typedrop−down list. Make sure the Selection: Sheet option button is selected in this dialog box'sSave area. Click the Add interactivity check box. At this point, the name of the file changesto Practice_PivotCharts.htm.
3.
Click the Publish button.4.
In the Publish as Web Page dialog box, select PivotTable from Items on Sheet4 and clickthe Open published web page in browser check box (see Figure 18−21). Do not changeany other options.
Figure 18−21: Publishing a PivotTable report as a web page.
5.
Click the Publish button.
The page should now open in your browser (see Figure 18−22).
6.
Excel 2003 VBA Programming with XML and ASP 30
Reprinted for Q4OGY152857, Capgemini US LLC Wordware Publishing Inc., Wordware Publishing, Inc. (c) 2006, Copying Prohibited

Figure 18−22: A PivotTable report published from Excel as a web page is displayed inInternet Explorer using the PivotTable web component. Office Web Components arecovered in Chapter 24.
A PivotTable report and a PivotChart report can be published together by saving the chart sheet asa web page.
Try It Out
Select the Sales Comparison chart sheet containing the PivotChart report (see Figure18−20).
1.
Choose File | Save As.2.
In the Save As dialog box, choose Web Page (*.htm; *.html) from the Save as file typedrop−down list. Make sure the Selection: Chart option button is selected. Click the Addinteractivity check box. At this point, the name of the file changes toPractice_PivotCharts.htm. Change the filename to Practice_PivotCharts2.htm.
3.
Click the Publish button.4.
In the Publish as Web Page dialog box, the Chart item is automatically selected (see Figure18−23).
5.
Excel 2003 VBA Programming with XML and ASP 31
Reprinted for Q4OGY152857, Capgemini US LLC Wordware Publishing Inc., Wordware Publishing, Inc. (c) 2006, Copying Prohibited
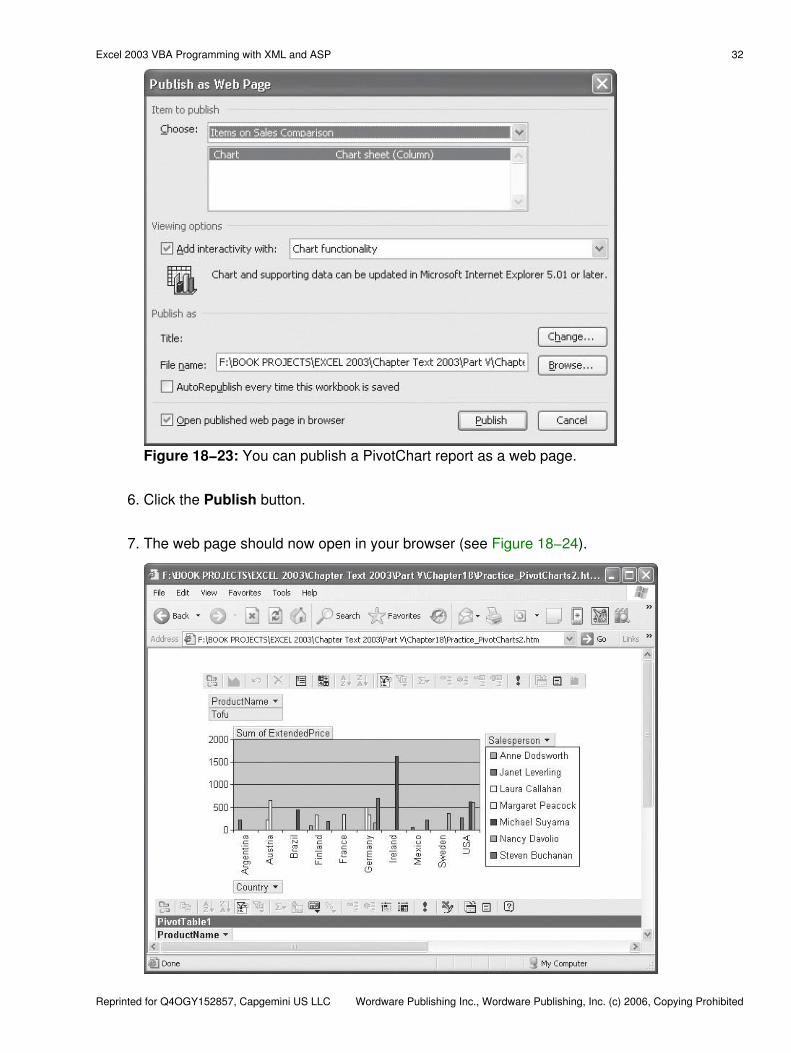
Figure 18−23: You can publish a PivotChart report as a web page.
Click the Publish button.6.
The web page should now open in your browser (see Figure 18−24).7.
Excel 2003 VBA Programming with XML and ASP 32
Reprinted for Q4OGY152857, Capgemini US LLC Wordware Publishing Inc., Wordware Publishing, Inc. (c) 2006, Copying Prohibited

Figure 18−24: When you publish a PivotChart report from Excel as a web page, the browseruses the Microsoft Office Chart component to graph the data and allow you to interact withthe chart. Also presented on the same page (inside the Microsoft Office PivotReportcomponent) is the source data for the chart report.Note To browse a web page interactively with the Office Web Components, you must have
a Microsoft Office 2003 license.
Chapter SummaryIn this chapter you have worked with two powerful Microsoft Excel objects that are used for dataanalysis: PivotTable and PivotChart. You have learned how to use VBA to manipulate these twoobjects to quickly produce reports that allow you or your users to easily examine large amounts ofdata pulled from an external data source such as a Microsoft Access database. You also learnedhow to manually save your PivotTable reports and PivotTable charts as interactive web pages.
In the next chapter, you will learn how to add some frills to your spreadsheets by programming withnumerous objects included in the Microsoft Excel 2003 and Microsoft Office 11.0 object libraries.
Excel 2003 VBA Programming with XML and ASP 33
Reprinted for Q4OGY152857, Capgemini US LLC Wordware Publishing Inc., Wordware Publishing, Inc. (c) 2006, Copying Prohibited